1. Introduction
While problems related to formation of hydrate in pipelines and process equipment dominated funding of hydrate research for at least four decades since around 1940, the focus is now much more varied. The need for new unconventional energy sources is a strong driver for massive investments in the development of technologies for making use of the huge resources of natural gas trapped in the form of hydrate. Japan and China are two examples of countries that are conducting full-scale production tests for the evaluation of different production technologies. There is a need for accurate models that are not only able to model stability limits of hydrate but also able to predict the kinetics of hydrate formation and dissociation. Injection of carbon dioxide in natural gas hydrate reservoirs for combined storage of carbon dioxide in the form of hydrate, and simultaneous release of methane gas for energy, is a novel and interesting concept that will also briefly be discussed later in this paper as an illustration of the theory.
The globally increasing interest for storage of carbon dioxide in aquifers will in some cases also involve conditions favorable for the formation of carbon dioxide hydrate. Even if this hydrate may not be unconditionally stable (see discussion under
Section 3) it may slow down vertical transport and as such be positive for storage integrety. Hydrate formation in a horizontal direction from the injection pipe, on the other hand, will be negative for the spreading of the carbon dioxide plume in the aquifer reservoir.
Depleted hydrocarbon reservoirs have proven sealing structures (cap rock, shale) and are also interesting as candidates for carbon dioxide storage, Worldwide there are quite a number of these reservoirs that are in cold regions and have favorable conditions for carbon dioxide hydrate.
Historically, much of hydrate stability modeling has been focused around simplified thermodynamic models in which the differences in chemical potentials between liquid water and water in an empty hydrate structure have been treated as empirical fitting functions. Stability of guest molecules in hydrate and separate phases (gas, liquid, fluid) has typically been treated by fugacity formulations rather than classical thermodynamic formulations (chemical potentials).
The primary objective of this work is to present what we see as some important aspects in the development of hydrate phase transition kinetic models. We do not claim that the models that we propose and discuss here are the only ways forward. However, if this work can contribute to stimulating a modern debate on the complexity of hydrate phases in multiphase systems, then much is achieved. Hopefully, this can lead to more collaboration on solving important challenges in the modern understanding of hydrates in nature and industry.
Frequently, only temperature and pressure projections of hydrate stability limits are used in analysis of hydrate risk analysis in industry, or in analysis of natural gas hydrates in nature. A second objective of this work is to illustrate some other hydrate stability limits of importance for industrial systems and hydrates in nature.
A third motivation for this work is related to the balance between all independent thermodynamic variables in a multiphase system and the associated constraints. In addition to temperature and pressure, these independent thermodynamic variables also involve concentrations of all components in all phases. A multiphase system can only establish thermodynamic equilibrium if the number of independent variables can be solved using conservation laws and conditions of equilibrium. Whether we list all independent variables, and constraining equations, discretely and find how many variables we must specify for equilibrium to be possible, or we use the Gibbs phase rule is not the most critical. The important aspect is that we have to be aware if the system can reach equilibrium or not and what the possible consequences are. For the simplest of all systems with one hydrate former in a separate phase, liquid water and one hydrate phase, it is well known that we can at maximum define, or fix, one independent thermodynamic variable. Practically all systems of methane and liquid inside hydrate formation conditions in nature or industry are therefore non-equilibrium systems. The question is therefore what the consequences are of only using temperature and pressure to define hydrate stability.
The fourth motivation is to stimulate a development towards more proper use of classical thermodynamics in hydrate stability analysis rather than projection of hydrate stability limits in independent variables such as temperature and pressure. Super saturation is a commonly used term in hydrate phase transition kinetics. A typical example is sub-cooling temperature, defined by a temperature lower than a hydrate stability temperature for a given pressure. The problem is that temperature and pressure are both independent thermodynamic variables and not phase transition related properties such as chemical potentials and free energy.
Finally, we also hope that the kinetic models presented in this work, which are simple to use and numerically fast, can be useful to other researchers as model platforms for various applications.
A brief overview of the relationship between fugacity and classical thermodynamics is provided in
Section 2 along with modeling of some important hydrate stability limits in
Section 3. The classical thermodynamics is needed for
Section 5.
In
Section 4 we give a brief overview of the historical development of kinetic models for hydrate growth and dissociation. Many of these models are based on semi-empirical concepts and phenomenological models. One of the reasons might be that models and concepts from physics contain properties that were not easily available five decades ago. In
Section 5 we give a brief overview of one of the simplest models, the classical nucleation theory (CNT), along with some possible modifications that make it possible to also utilize these types of approaches. This section is one of the most important sections of this paper, since one of the intentions is to illustrate that classical thermodynamics combined with molecular modeling opens up for kinetic modeling of any route to hydrate phase transition. This section is therefore the largest section.
Some possible directions in future research on hydrate phase transition dynamics are discussed in
Section 6. Our conclusions are presented in
Section 7.
2. Classical Thermodynamics, Statistical Mechanics and Fugacity
In classical thermodynamics, phase stability is related to Gibbs free energy in systems controlled by pressure and temperature, and Helmholtz free energy for systems controlled by volume and temperature. Chemical potentials involved determine distributions of components in various co-existing phases. Industrial use of cubic equations of state has motivated the use of fugacity rather than chemical potentials. Rigorously, the equilibrium conditions between two phases (gas and liquid as example) are derived from the combined first and second laws under constraints of conservation laws:
T is temperature, and
P is pressure and superscripts denote phase. The chemical potential
is the chemical potential for component
i in phase
p.
x denotes mole-fractions in liquid and y denotes mole-fractions in gas. The arrow on these denotes vector of mole-fractions. The fugacity of a component is defined as:
Integration of right hand side under the assumption of thermal equilibrium (Equation (1)) and same integration limit for gas and liquid leads to the following replacement of (3) in a fugacity formulation:
It might be useful at this stage to shed some light on the information that was lost in replacing Equation (3) with the fugacity expression. If we now return to the first law for an open system we can consider one of the phases. The liquid will be open towards gas and vice versa, and for simplicity we might consider the two phases as isolated. This is not needed, but is easier for illustration purposes.
U is internal energy and the line beneath denotes extensive energy with the unit Joule. The line under the volume V denotes extensive volume in m3. N is number of moles and index i is a counter on components. The two first two terms are easy to understand and visualize. The first term is the added heat and the second term is delivered mechanical work. The last term is frequently denoted as the chemical work. In short, the work is needed to release (negative dNi) molecules from the actual phase, and the opposite for positive dNi. The chemical potential is the driving force for this release; this driving force consists of a necessary energy to release the molecules from attractions to surrounding molecules, and an entropy contribution related to rearrangements of the remaining molecules. The use of Equation (6) rather than Equation (7) removes this information from the calculation of phase distributions and phase equilibrium.
Classical thermodynamics is generally defined by differences in energy states and requires reference states. One specific reference state has a convenient connection to classical statistical mechanics. In the classical limit the momentum space (ideal gas) and configurational spaces (molecular interactions) are orthonormal. The associated canonical partition function is then:
For each of the phases p the relationship between Helmholtz free energy A (line under denote extensive) and the canonical partition function Q is then given by Equation (8) below. Subscript M denotes canonical partition function in momentum space and subscript C denotes canonical partition function in configurational space. N is the number of moles. The orthonormal formulation in the last term on the right hand side is the classical limit. In terms of temperatures and pressures for hydrate formation, almost all conditions of hydrates in nature and industry fall into this category. Even hydrates formed at low temperatures down to −30 °C are in the classical regime.
Equation (8) can either be reformulated to Gibbs free energy, or the temperature, and volume dependence can be reformulated into a temperature/density dependency. In the latter case the density is calculated from an appropriate equation of state for the given condition of temperature and pressure (and Equations (1) and (2)). For rigid molecules, there are analytical solutions for molecular translation and rotation and integrals that can be easily solved for intramolecular movements. Interatomic vibrations are frequently small enough to be neglected while intramolecular rotations need to be accounted for. The second term in the final formulation is the effect of molecular interactions and is denoted as residual, as in residual thermodynamics.
We can now be more specific in the integrations of Equation (4) under the constraints of Equations (1) and (2). The ideal gas limit is reached when the partial pressure goes to the limit of zero. Since free energy-related properties depend on the entropy of mixing we need to integrate Equation (4) in two steps. Starting with pure components as ideal gas we then first integrate to a mixture of ideal gases and then integrate from ideal gas mixture to real phase (gas, liquid, fluid). In
Table 1 we list the various steps towards the final result for fugacity as used in Equations (3) and (6) respectively.
is the fugacity coefficient for component i in phase
p, which is defined as the fugacity of component I divided by the partial pressure of component
i in the mixture. This is trivially given by any equation of state.
The same reference state is utilized for chemical potential as for fugacity, but the ideal gas difference between components is lost in the fugacity formulation.
Ideal gas as reference state is of course convenient and the closest reference for gas phase. From the first publication of the original van der Waal equation of state, numerous cubic equations of state have been published. In the oil and gas industry, the Soave-Redlich-Kwong [
1] and Peng-Robinson [
2] are among the most popular since these models have proven accurate enough also for liquid hydrocarbons in term of mole-fraction ratios (mole-fraction of i in gas divided by mole-fraction of i in liquid). Two other integration limits for (4) will be useful for the rest of this work. For complex liquids, such as, for instance, water containing additives and/or impurities, pure liquid water may be more appropriate. In
Table 2 we list a similar comparison.
is the activity coefficient for component
i in the liquid mixture. Asymptotic value of the activity coefficient is 1.0 for component
i when mole-fraction of
i approaches 1.0. In this scheme the saturation pressure for the actual temperature is used as a reference point in the fugacity formulation. This is not generally needed in the chemical potential formulation since pure component chemical potentials for liquids can be calculated from molecular simulations using verified models for interactions. One example for this can be found from Kvamme and Tanaka [
3]. Kvamme and Tanaka [
3] utilized the TIP4P [
4] interaction potential for water to calculate chemical potentials for water as ice and water in empty hydrates of structure I and II. Experimental data for enthalpy of water dissociation at zero °C, and specific heat capacity for liquid water were utilized to calculate also chemical potentials for liquid water. These chemical potentials are for 1 bar pressure, but are trivially corrected to higher pressures by a simple Poynting correction, since the density of water is almost constant. The fugacity scheme utilizes saturation pressure for the actual temperature as a “helping point”. The fugacity coefficient for the gas phase for a pure component is equal to the fugacity coefficient for pure liquid at the saturation curve, and the recalculation of fugacity back to the real pressure, from the “helping point”, is frequently a factor close to unity except for high pressures. Examples of the use of this scheme can be found elsewhere for water containing various amounts of methanol [
5]. In principle also the fugacity scheme can be used without utilization of the “helping point” at saturation curve if an accurate equation of state is available for pure water.
Yet another scheme is useful in this work. Many hydrate formers have very limited solubility in water. In
Table 3 we list chemical potential formulation and fugacity formulation for a component
i in a solvent
p (such as, for instance, water). A more appropriate reference state may therefore be infinite dilution in liquid water. The symbol ∞ in the superscript denotes infinite dilution in the solvent. For the activity coefficient, the asymptotic limit is 1.0 for infinite dilution of I in the solvent. Infinite symbol in superscript on volume denotes molar volume at infinite dilution in solvent. Chemical potential for
i at infinite dilution in solvent can be estimated from model systems in molecular simulations but has to be verified towards experimental solubility data in a similar way as a fugacity formulation has to be verified towards experimental data.
Since the compressibility of liquid water is small, the fugacity formulation may be reformulated as:
The latest approximation reflects the activity coefficient for the solute in an almost incompressible liquid, such as water.
3. Hydrate Stability Limits and Sub-Cooling
Stability limits are always the maximum possible limits that can be achieved, and there are many such stability limits since hydrate can form in many ways in a real system in nature, or in an industrial situation related to multiphase flow with a separate water phase or water dissolved in a hydrate forming gas (or liquid). The most typical stability limits are related to heterogeneous hydrate formation on water/gas interface.
The first step in any stability limit analysis is to find out how many degrees of freedom there are in the system. This can be trivially counted by listing all the independent thermodynamic variables and then subtracting both conservation laws and conditions of equilibrium. For water and methane, as a simple example, we end up with 12 independent thermodynamic variables and 11 constraints (conservation laws and conditions of equilibrium). This means that only one independent variable can be defined. When this variable is defined the equations for conservation and thermodynamic equilibrium can be solved for all other independent variables. The Gibbs phase rule expresses the same net summation in a more compressed form but the advantage of doing the summation in more generally is the analysis of relevant phases that can lead to hydrate formation, and also of components that do not participate in phase transitions. An example of the latter is ions in water. Within reasonable accuracy they stay in water permanently and affect the thermodynamics of water involved in the hydrate formation (or dissociation). Ions can upconcentrate, but unless they form solid salts they do not participate in any hydrate phase transitions and cannot enter hydrate cavities. In real natural hydrate systems, and in experiments using saline water, pockets of water with high concentrations of ions can be encapulated by hydrate.
In the classical thermodynamic formulation we the use chemical potentials directly. The chemical potential of water in hydrate can be expressed according to Kvamme and Tanaka [
3] as:
denotes water chemical potential in an empty clathrate. Number of cavities is
ν. Subscript
k denotes large and small cavities respectively. Structure I is the main focus in this overview on thermodynamics and for this structure ν
øarge = 3/24 and ν
small = 1/24. Within the scope of this work it is assumed that only one guest molecule can enter a cavity. The harmonic oscillator approach model can be expressed as:
is the chemical potential for molecule type
i in cavity type
k. It is assumed that small and large cavities are at equilibrium, such that:
i.e., for a system at equilibrium the chemical potential for a guest molecule in a cavity is equal to the chemical potential for the same molecule in the other cavities in the hydrate. Δ
gk1 is the free energy change for inclusion for guest molecule
i in a cavity of type
k.
The most typical example is a hydrate former phase (gas, liquid, supercritical) in contact with liquid (or ice) water. Under favorable conditions hydrate will form heterogeneously on the interface. For these three phases there are 12 independent thermodynamic variables, 3 conservation laws and 8 conditions of equilibrium. We can then fix only one independent thermodynamic variable. The most common choices are
T or
P. For this particular case equation of equilibrium we have:
for the equilibrium between the gas and the hydrate, the chemical potential for the guest that enters hydrate is the same as in the original phase. The expression can be found in the last column of
Table 1 for chemical potential as well as for fugacity needed in the more common formulations.
The formulation due to van der Waal and Platteeuw [
6] ends up with the same result as (10) but only for a rigid water lattice in the hydrate. The approach by Kvamme and Tanaka [
3] have results based on rigid hydrate water lattice as well as dynamic water lattice, in which distortions for large guest molecules movements can be accounted for in an appropriate way by sampling frequecies of molecular movements that interferes with librational frequencies for water in the lattice. See Kvamme and Tanaka [
3] and Kvamme et al. [
7] for a more detailed discussion. The fugacity formulation for the cavity partition function can be written as:
The Langmuir constant
for a molecule
i in cavity
k is given below as Equation (15). In the simplest case of monoatomic spherical guest molecules, the Langmuir constant is a simple integral over the Boltzmann factors of interaction energies between the guest molecule and surrounding waters:
For non-linear, multi-atomic representations of guest molecules, the integration will involve rotational degrees of freedom. Guest-guest interactions, between guests in different cavities, are also significant [
8]. Polar guest molecules, such as, for instance, H
2S, will also obtain extra stabilization from coulumbic interactions between the partial charges in H
2S and water molecules in the cavity lattice [
9]. For CO
2, on the other hand, the quadropole moment will result in a destabilization effect [
10]. However, for now Equation (13) serves as sufficient illustration. Various simplifications of (13) can be found in [
11].
As mentioned above, we use the classical thermodynamic approach to illustrate the stability limit in temperature and pressure for methane hydrate. This is accomplished by setting the chemical potential of water in hydrate, according to Equation (10), equal to chemical potential for pure water according to the last column in
Table 2. For pure water, the activity coefficient is 1 and mole-fraction water is 1. The actual values of empty hydrate in Equation (10) are calculated based on Kvamme and Tanaka [
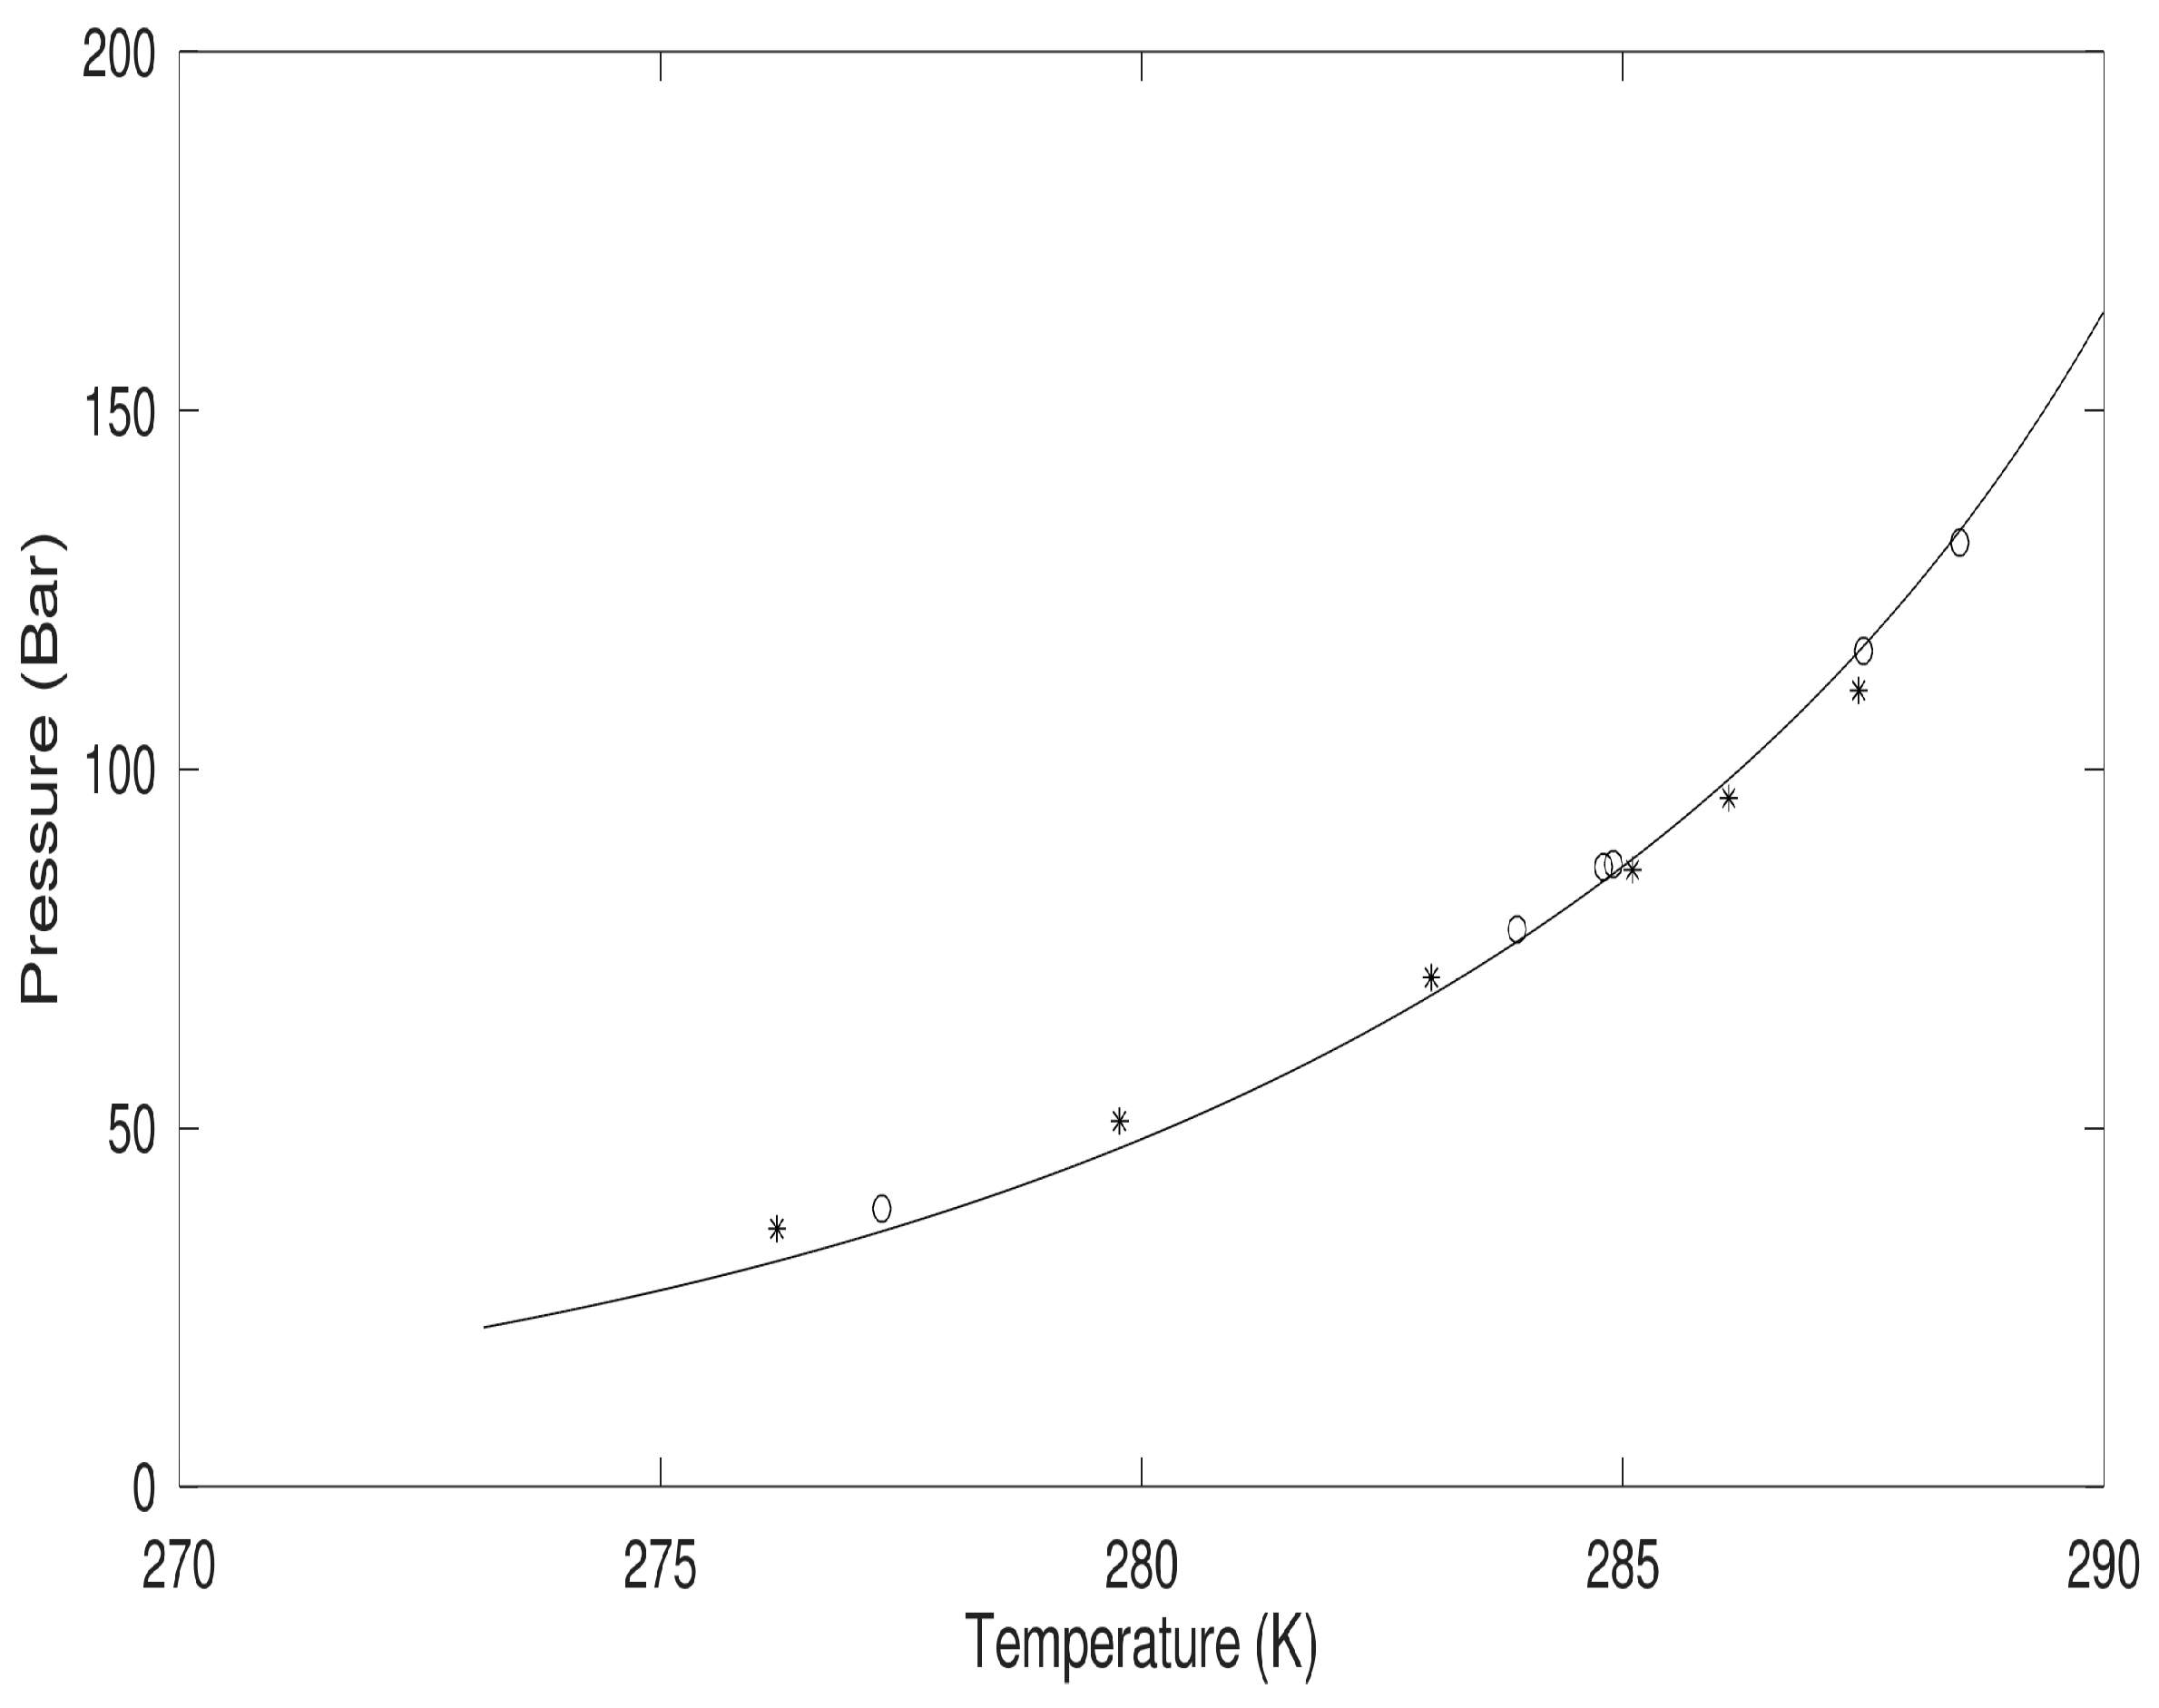
3] and so also for liquid water chemical potential. With gas chemical potential equal to chemical potential in large and small cavities of the hydrate it ends up with one equation in the unknown pressure for defined temperatures. The solution is given in
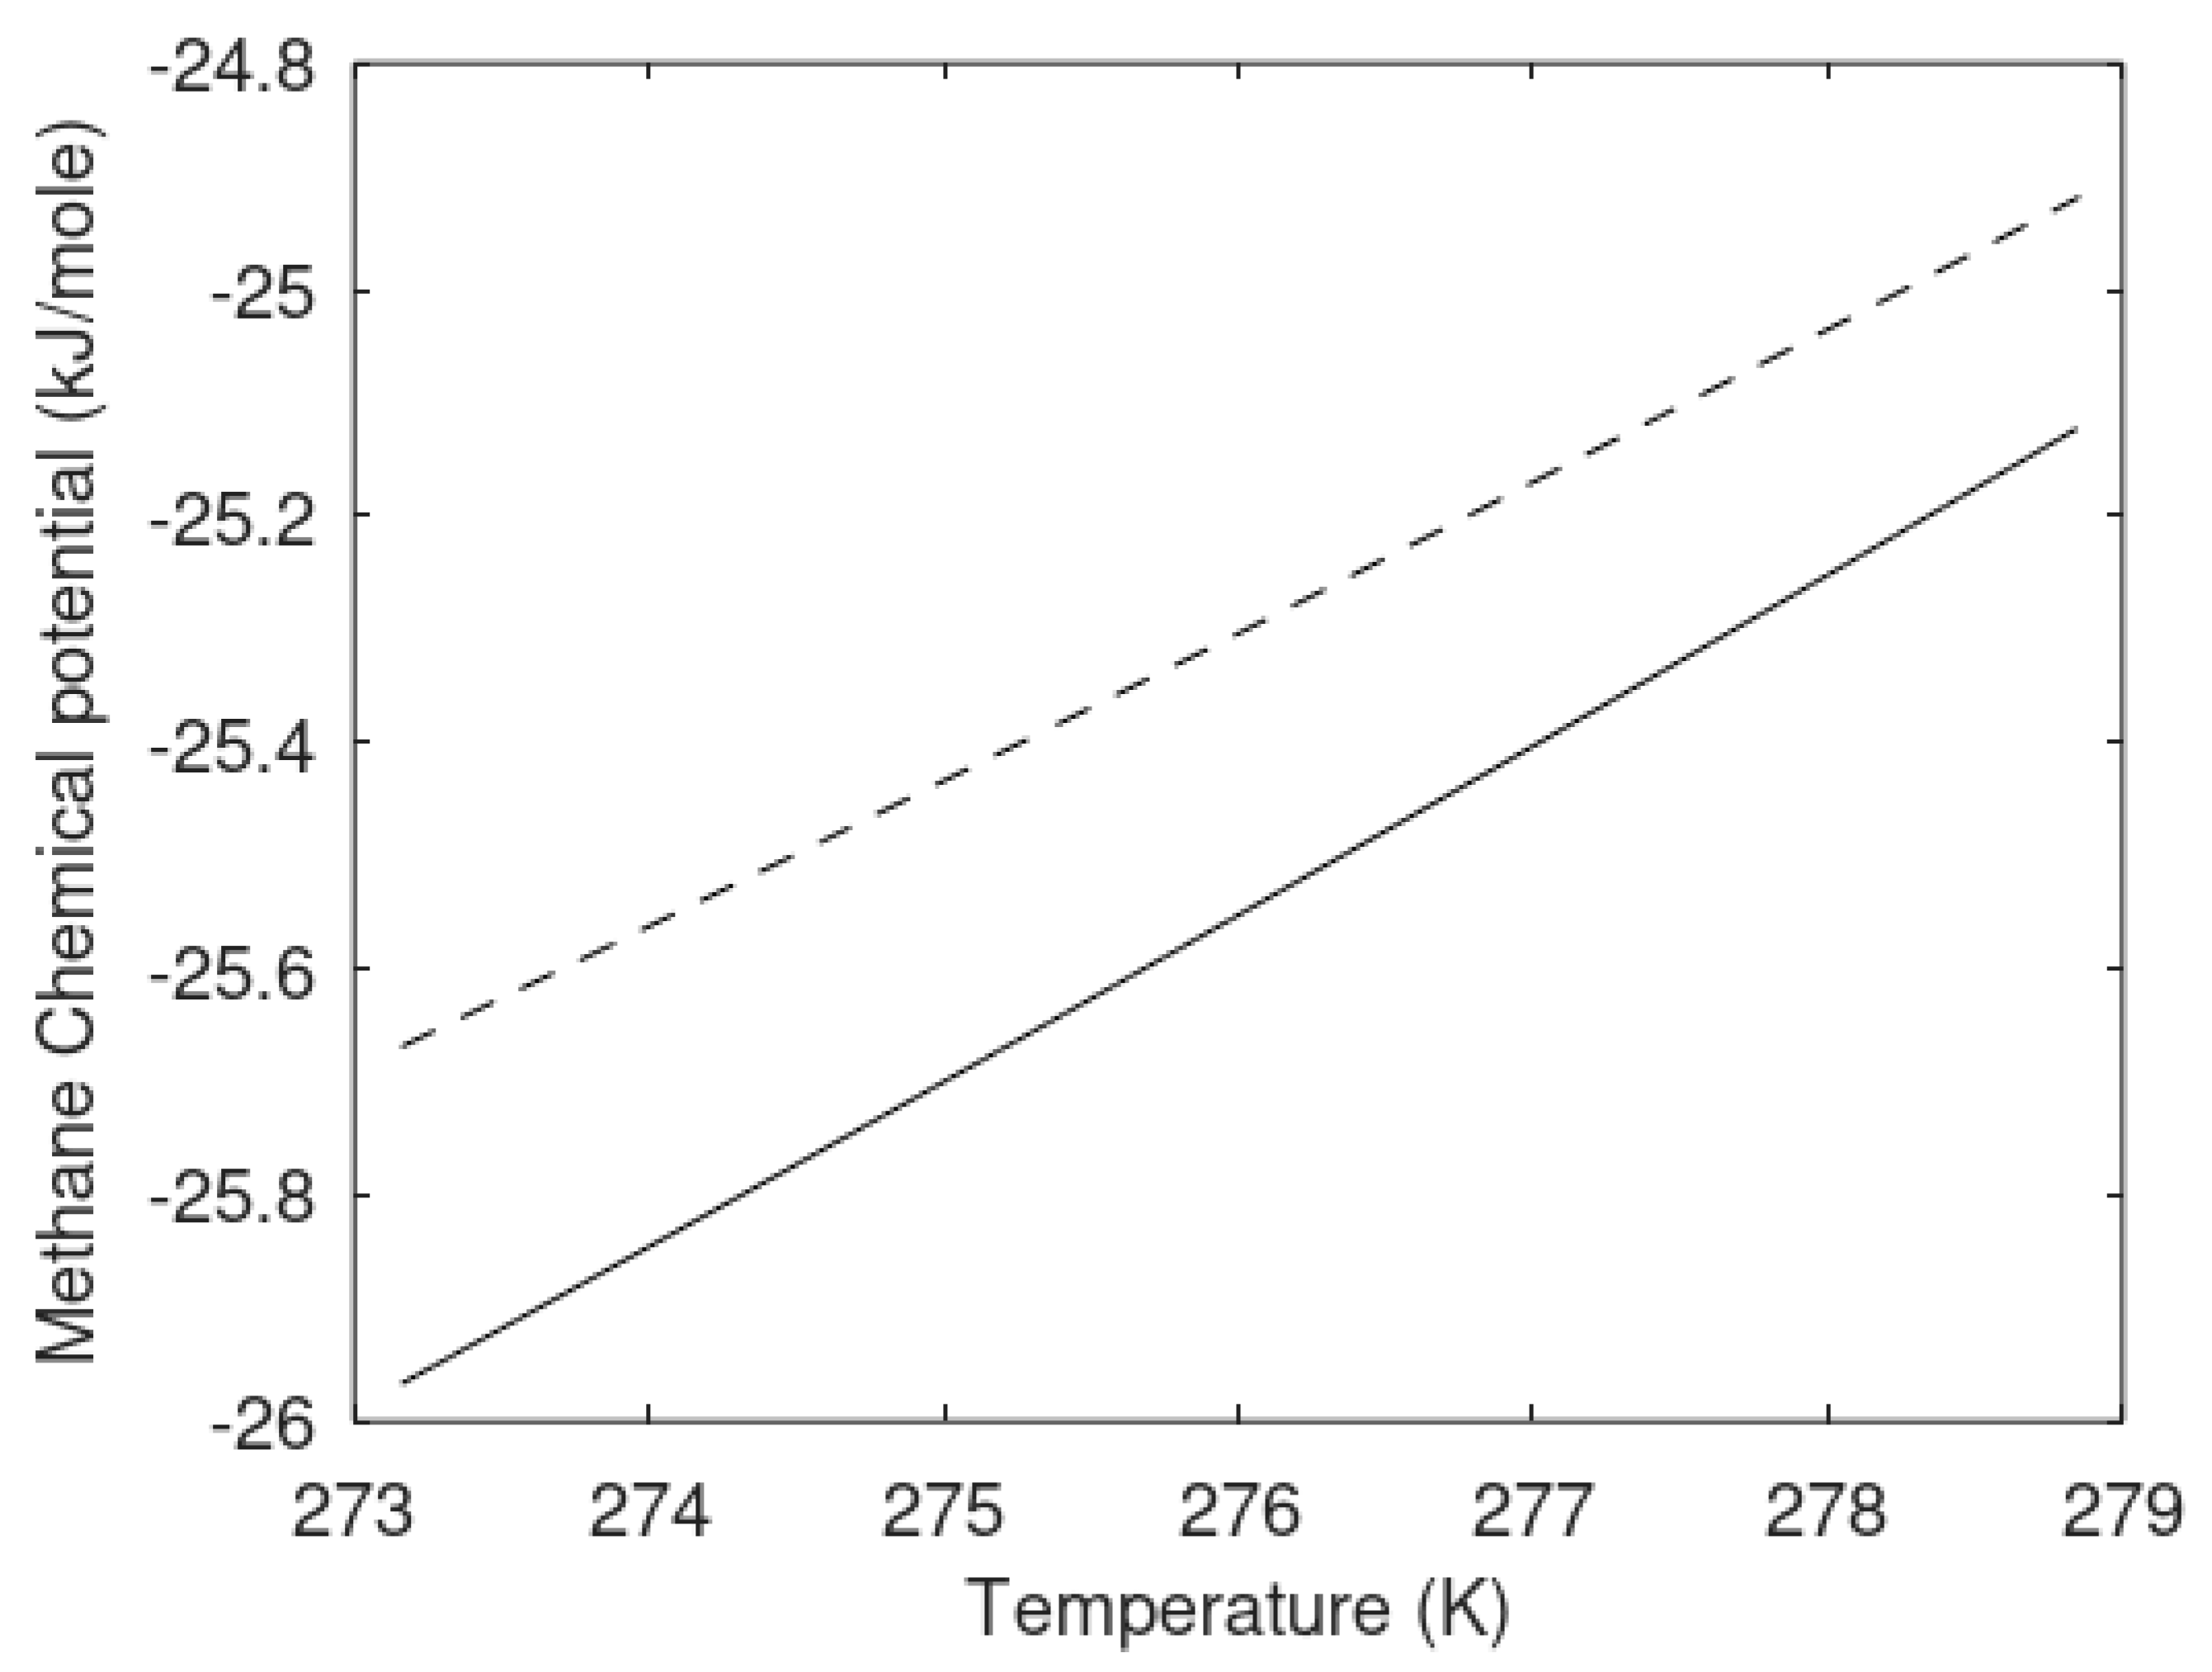
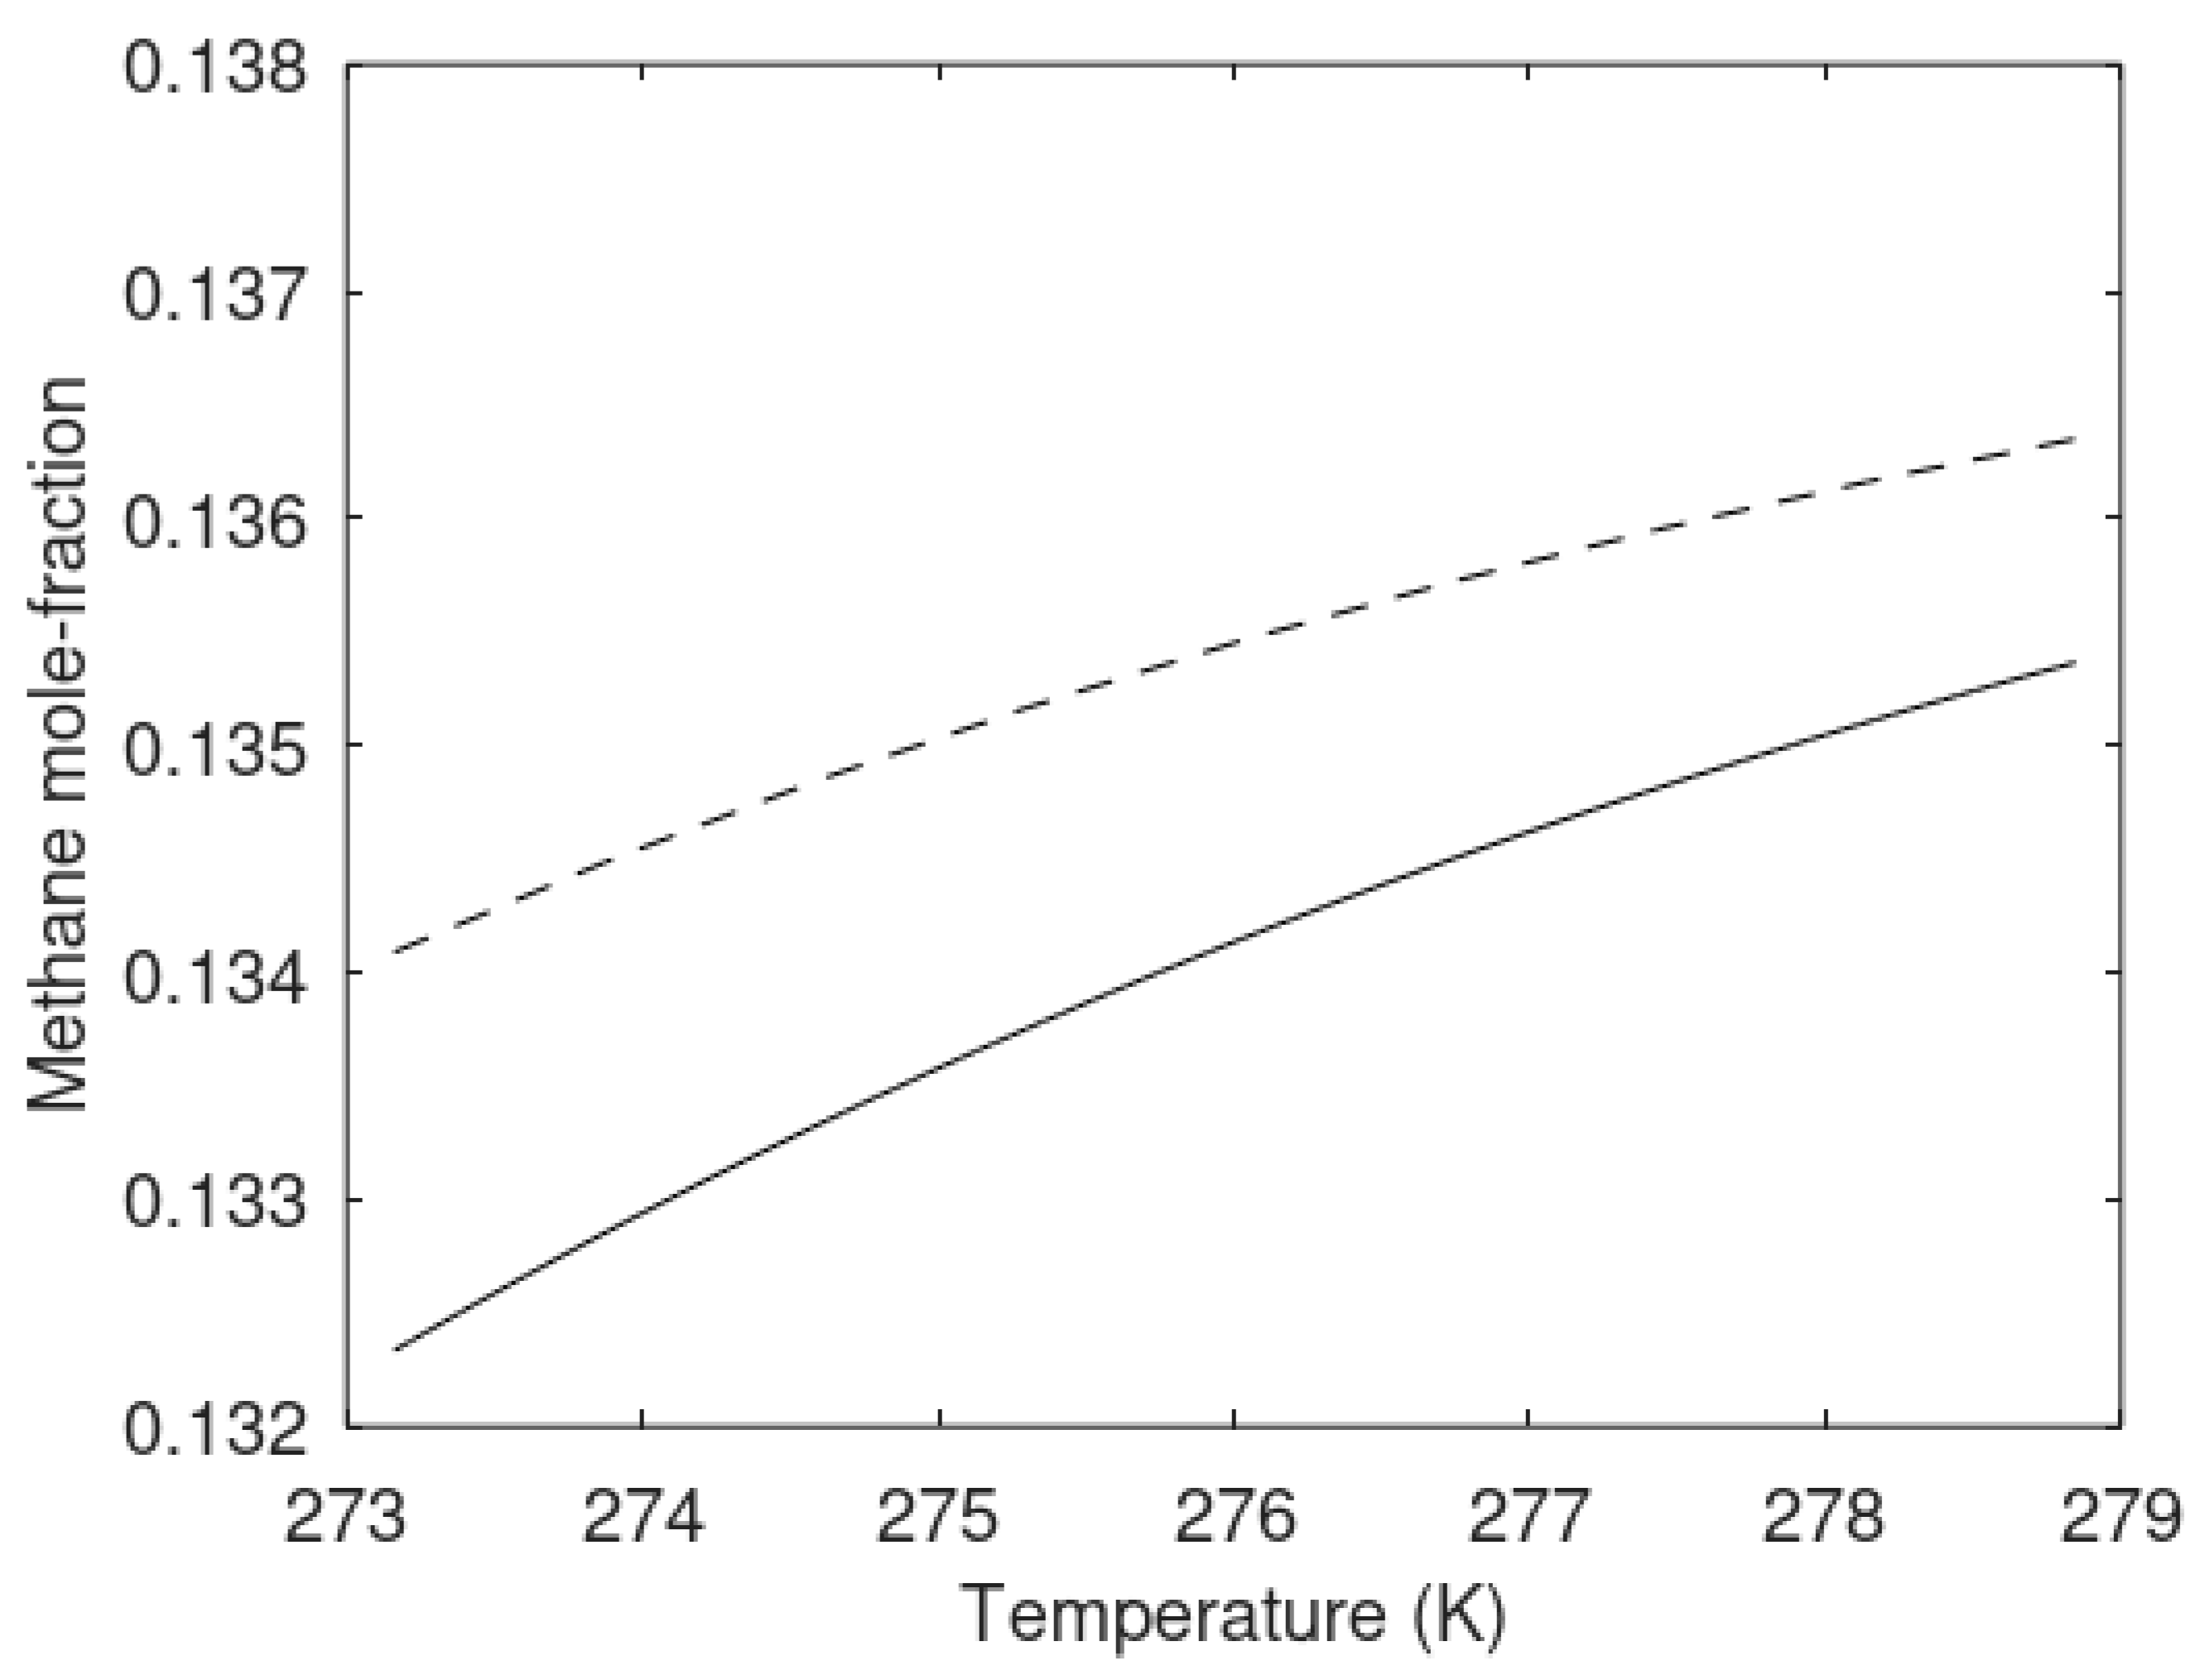
Figure 1 below. This figure is actually a verification of the free energy model since chemical potentials for water and guests are used in the solutions that resulted in
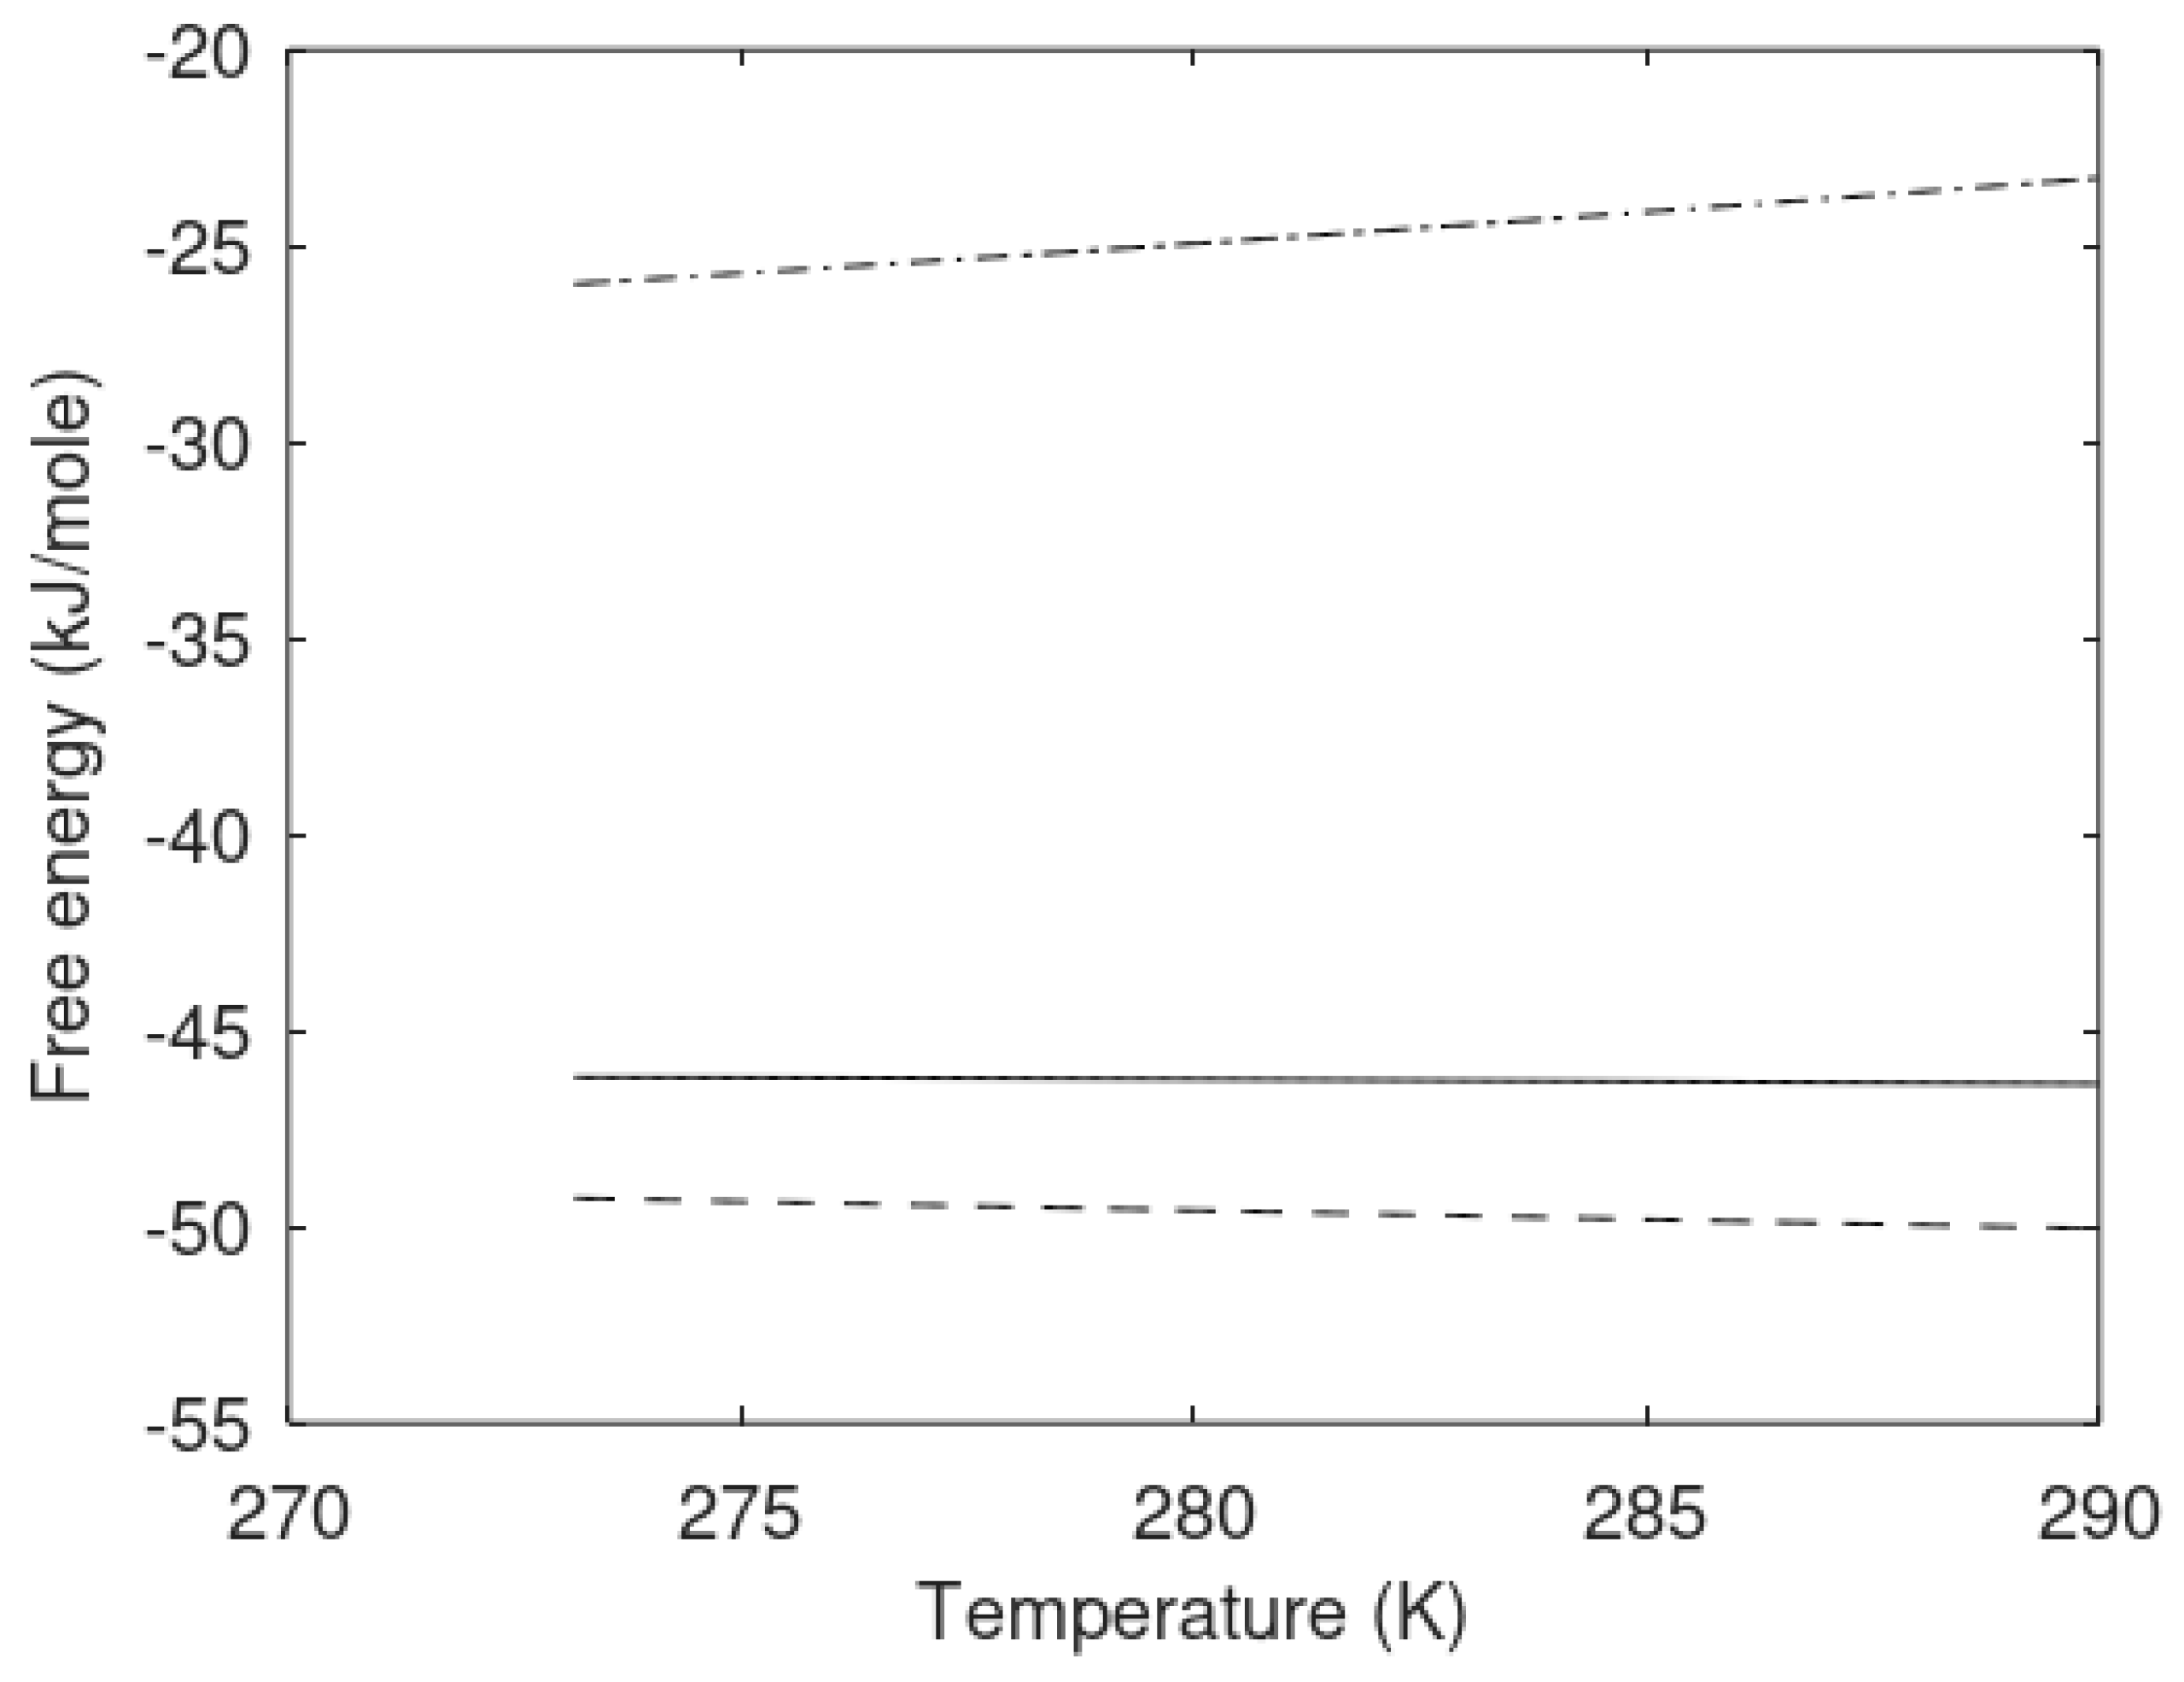
Figure 1. The chemical potentials and hydrate free energy are plotted in
Figure 2.
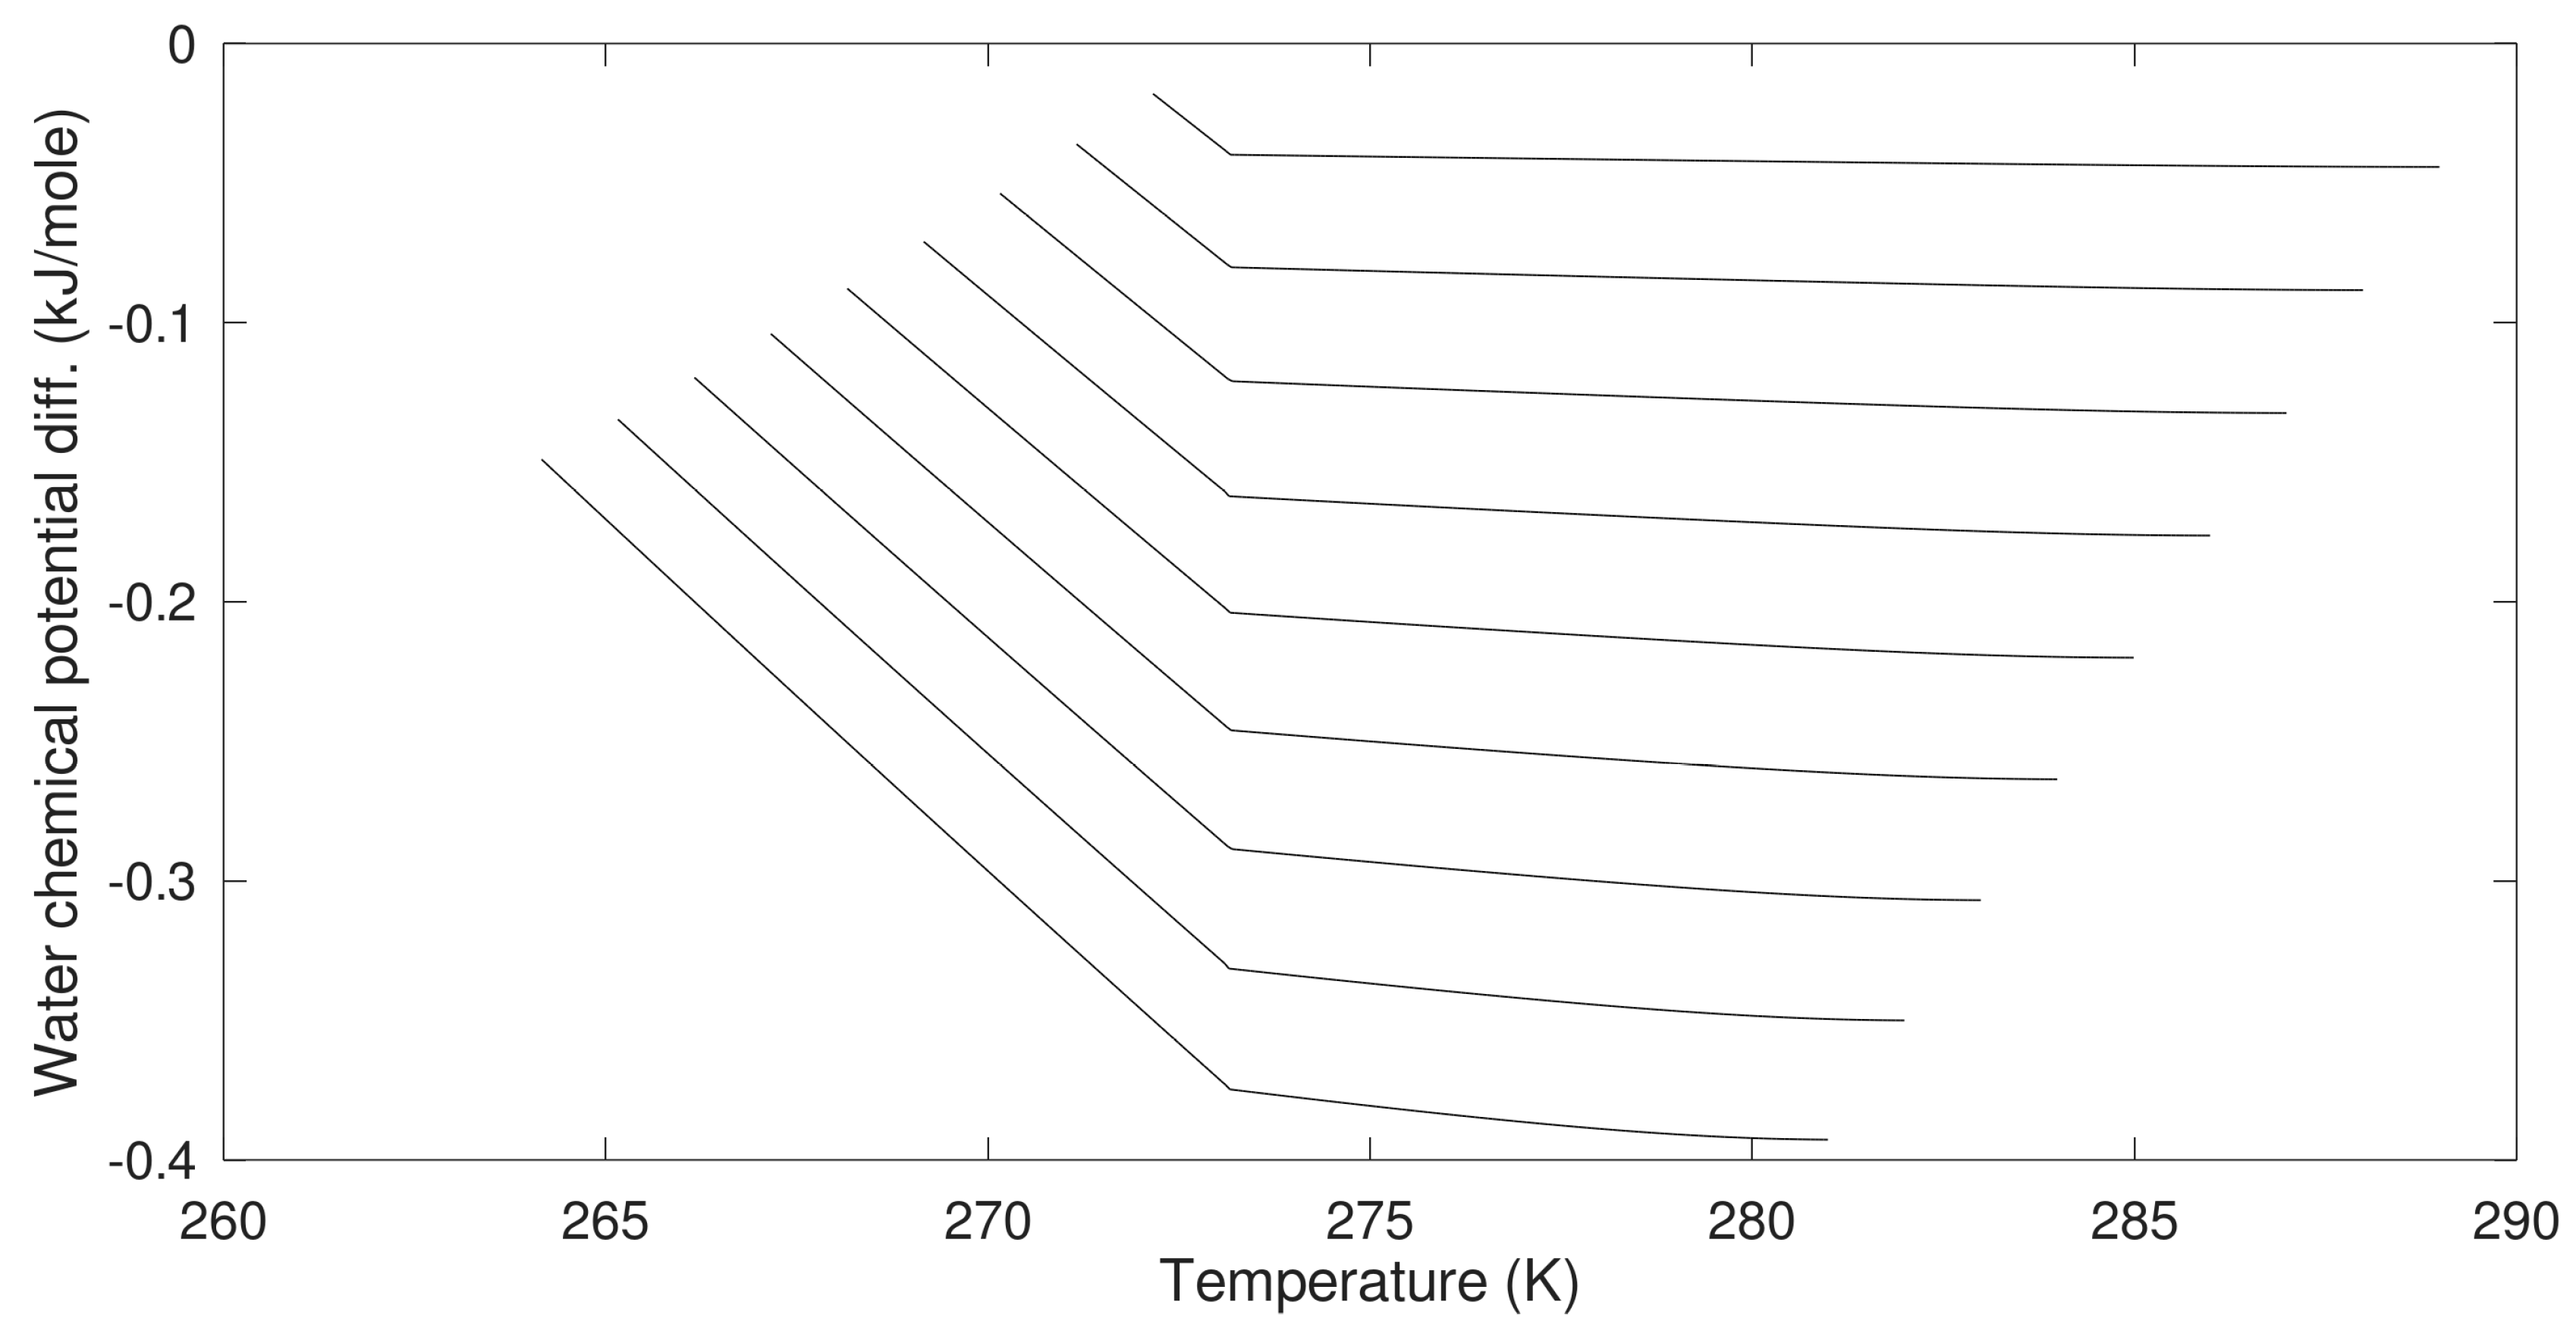
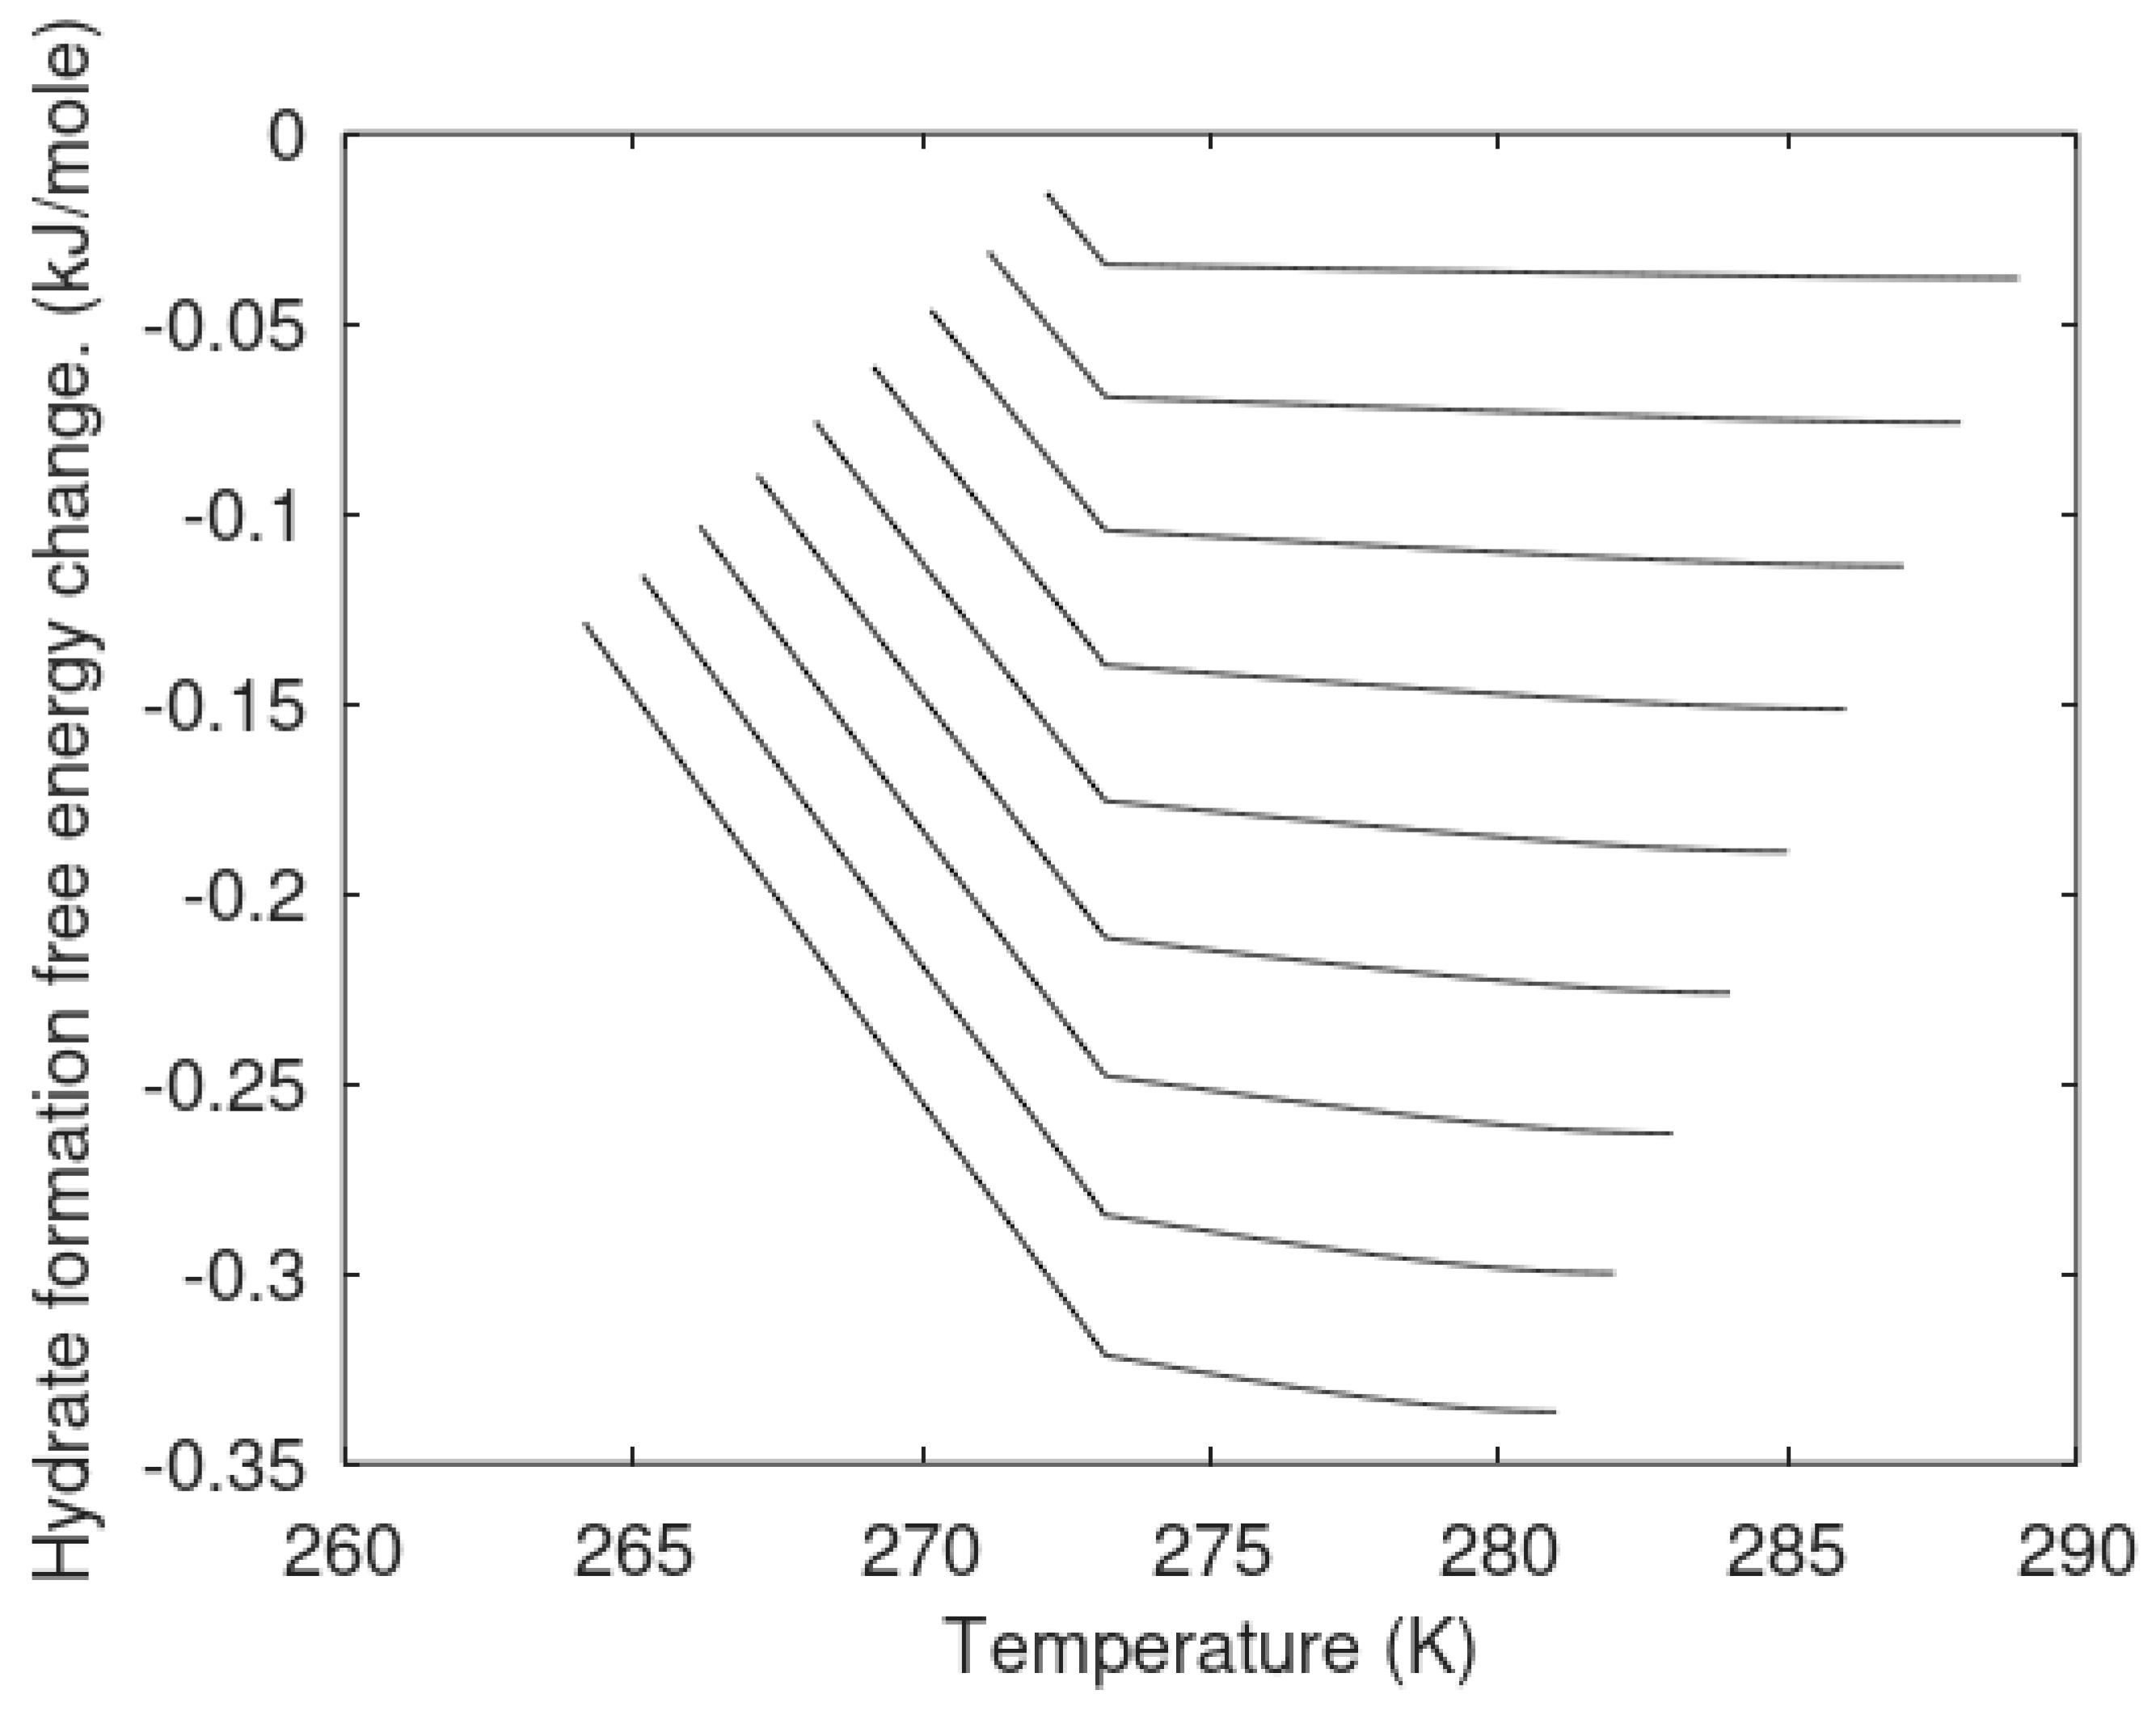
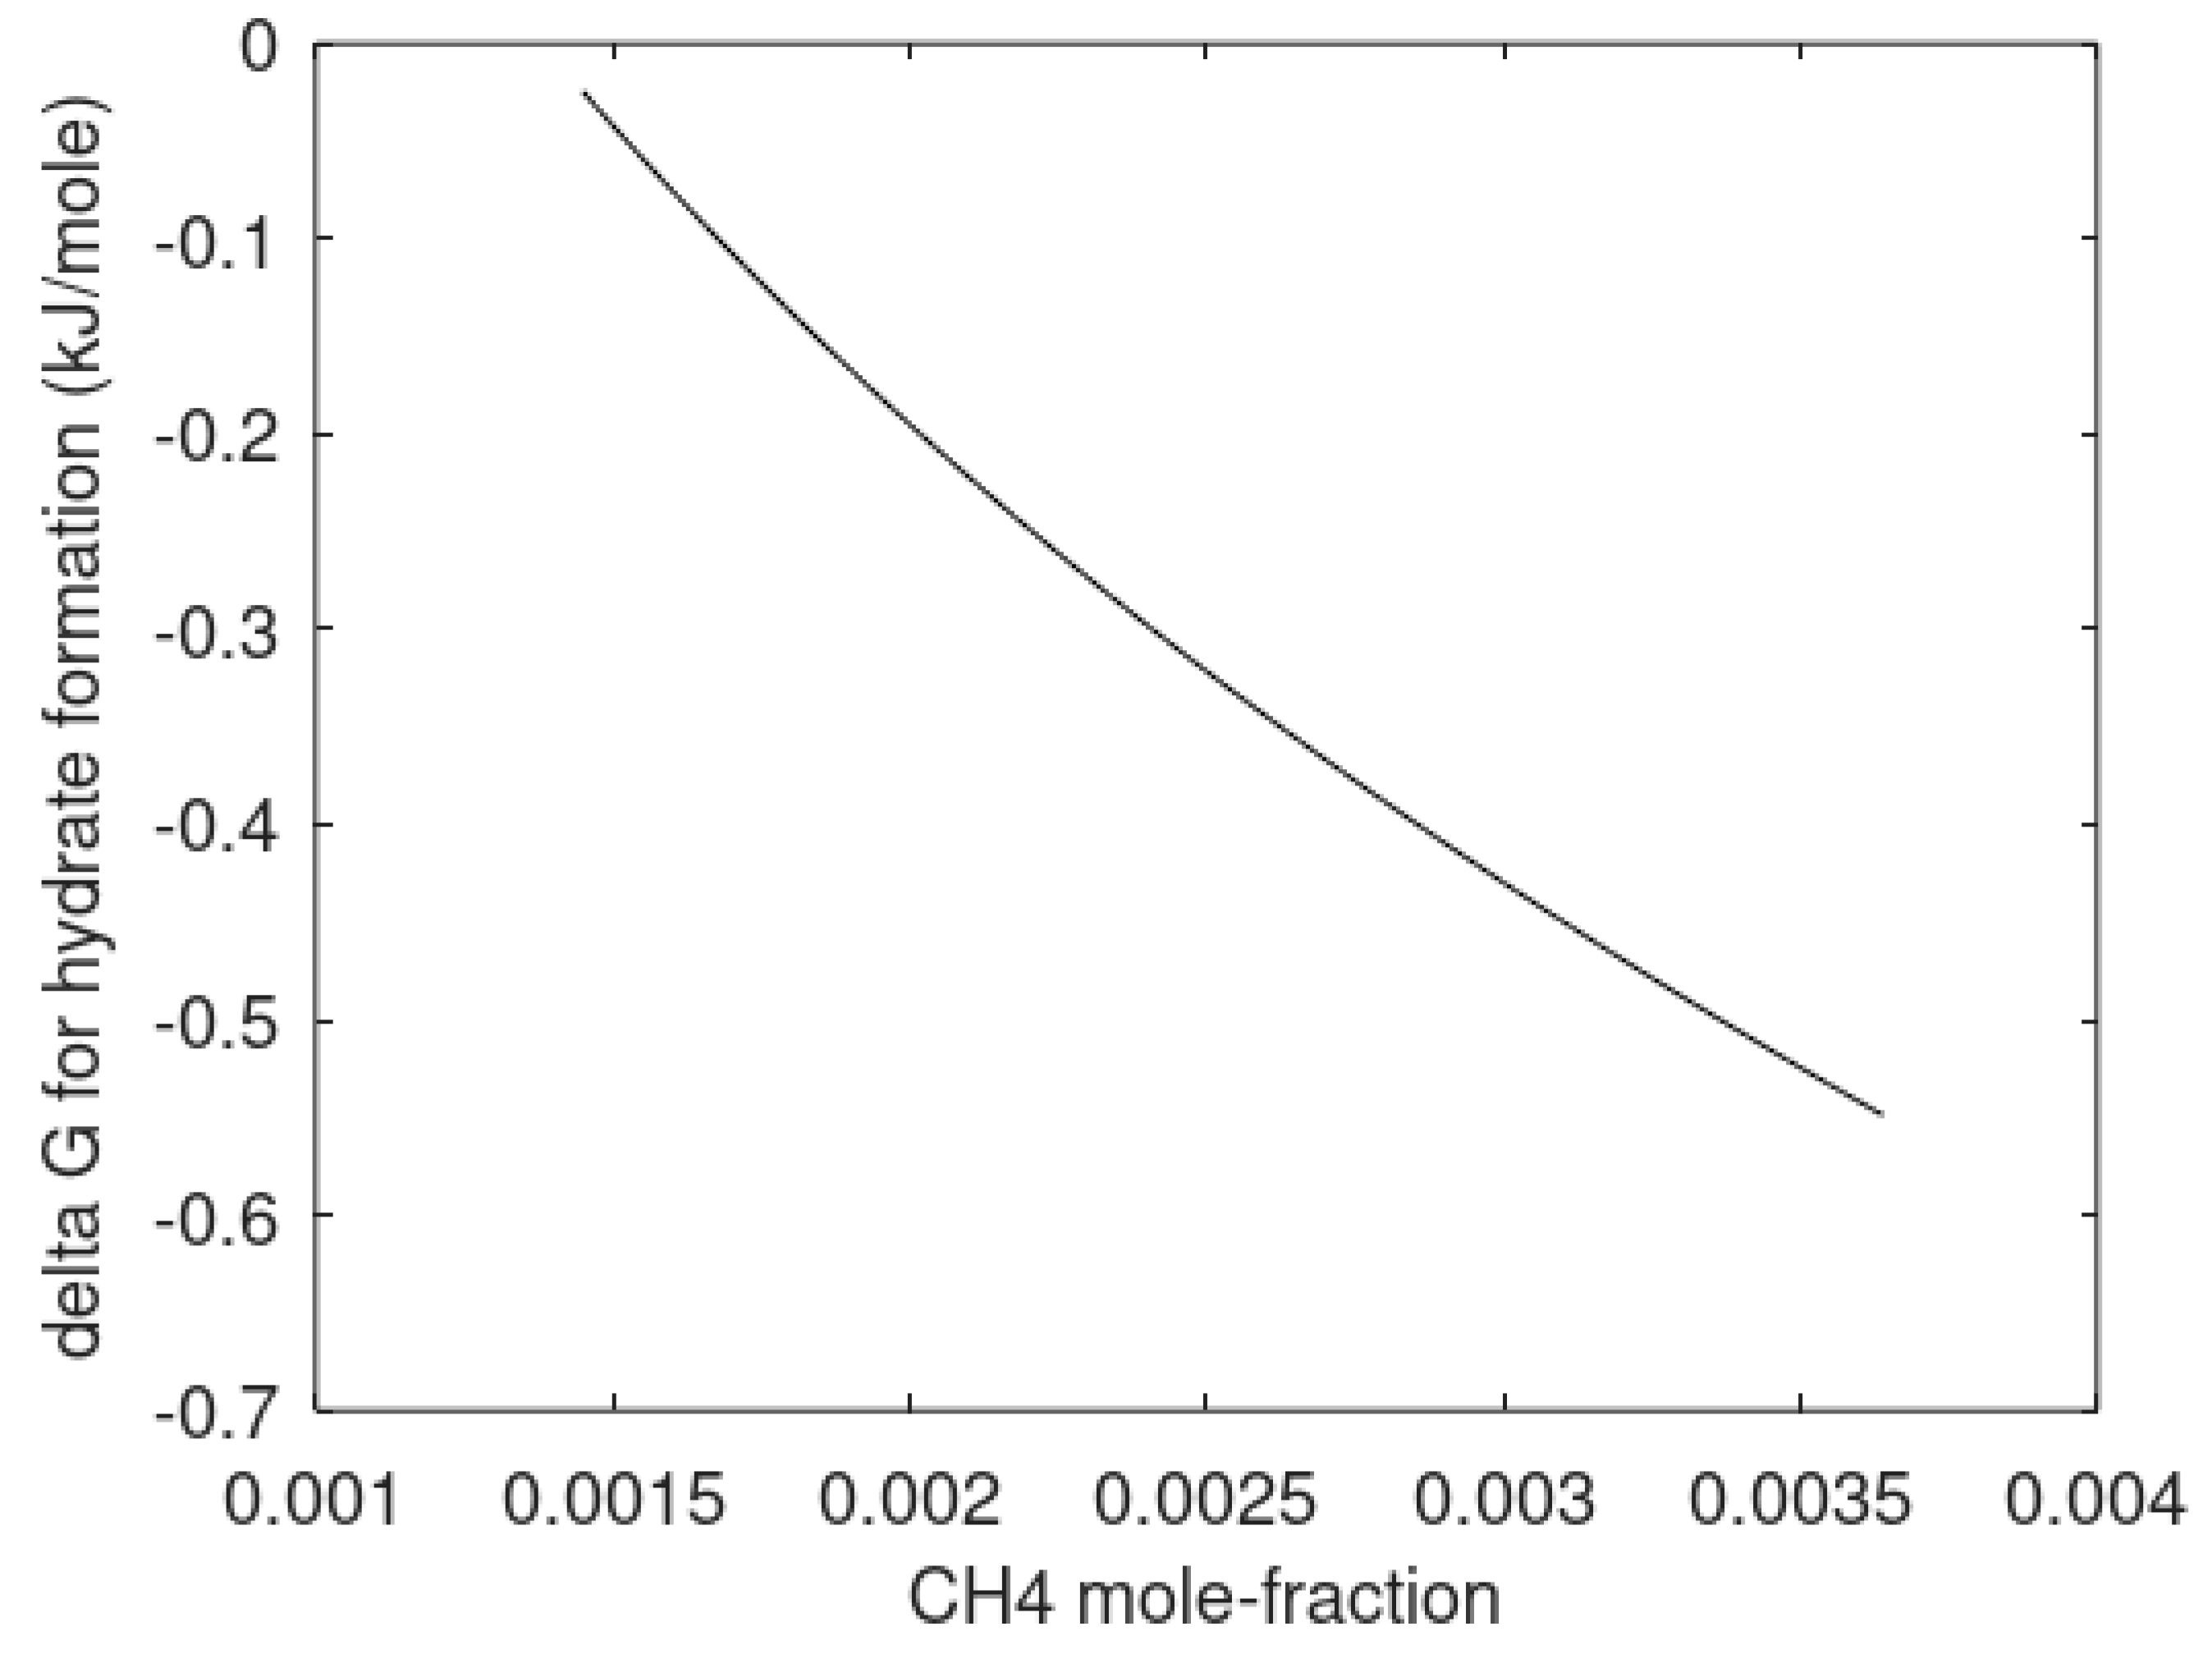
The primary focus of this work is modeling of the kinetics of hydrate formation and dissociation and choice of thermodynamic platform. Driving forces for hydrate formation are typically plotted in terms of sub-cooling temperature. However, temperature and pressure are independent thermodynamic variables and it is therefore relevant to also illustrate what specific sub-cooling temperatures actually mean in terms of thermodynamic driving force. In
Figure 3 we therefore plot free energy differences for hydrate minus liquid water (or ice) for specific sets of sub-cooling temperatures for the pressures from
Figure 1.
There are several other hydrate stability limits. As discussed elsewhere [
10], mineral surfaces can stimulate hydrate nucleation by direct and indirect adsorption of hydrate formers. However, hydrate cannot remain close to mineral surfaces. There are two ways to argue for this. The partial charges of mineral atoms in the surface will never be compatible with average charge distribution of water molecules on the hydrate. From a thermodynamic point of view the chemical potential of adsorbed water in the range of the first two-to-three density maximums from the mineral surface are substantially lower than what is possible for hydrate water. In this respect a mineral surface is a thermodynamic hydrate inhibitor. Mineral surfaces will therefore be separated from hydrate with minimum distances in the range of 3 to 4 nm as minimum. However, due to molecular transport (diffusion) and other transport processes (hydrodynamics) the separation between hydrate and minerals will normally be substantially larger. Even in permafrost hydrates it is rare to find concentrations of hydrates higher than 85 per cent of pore volume.
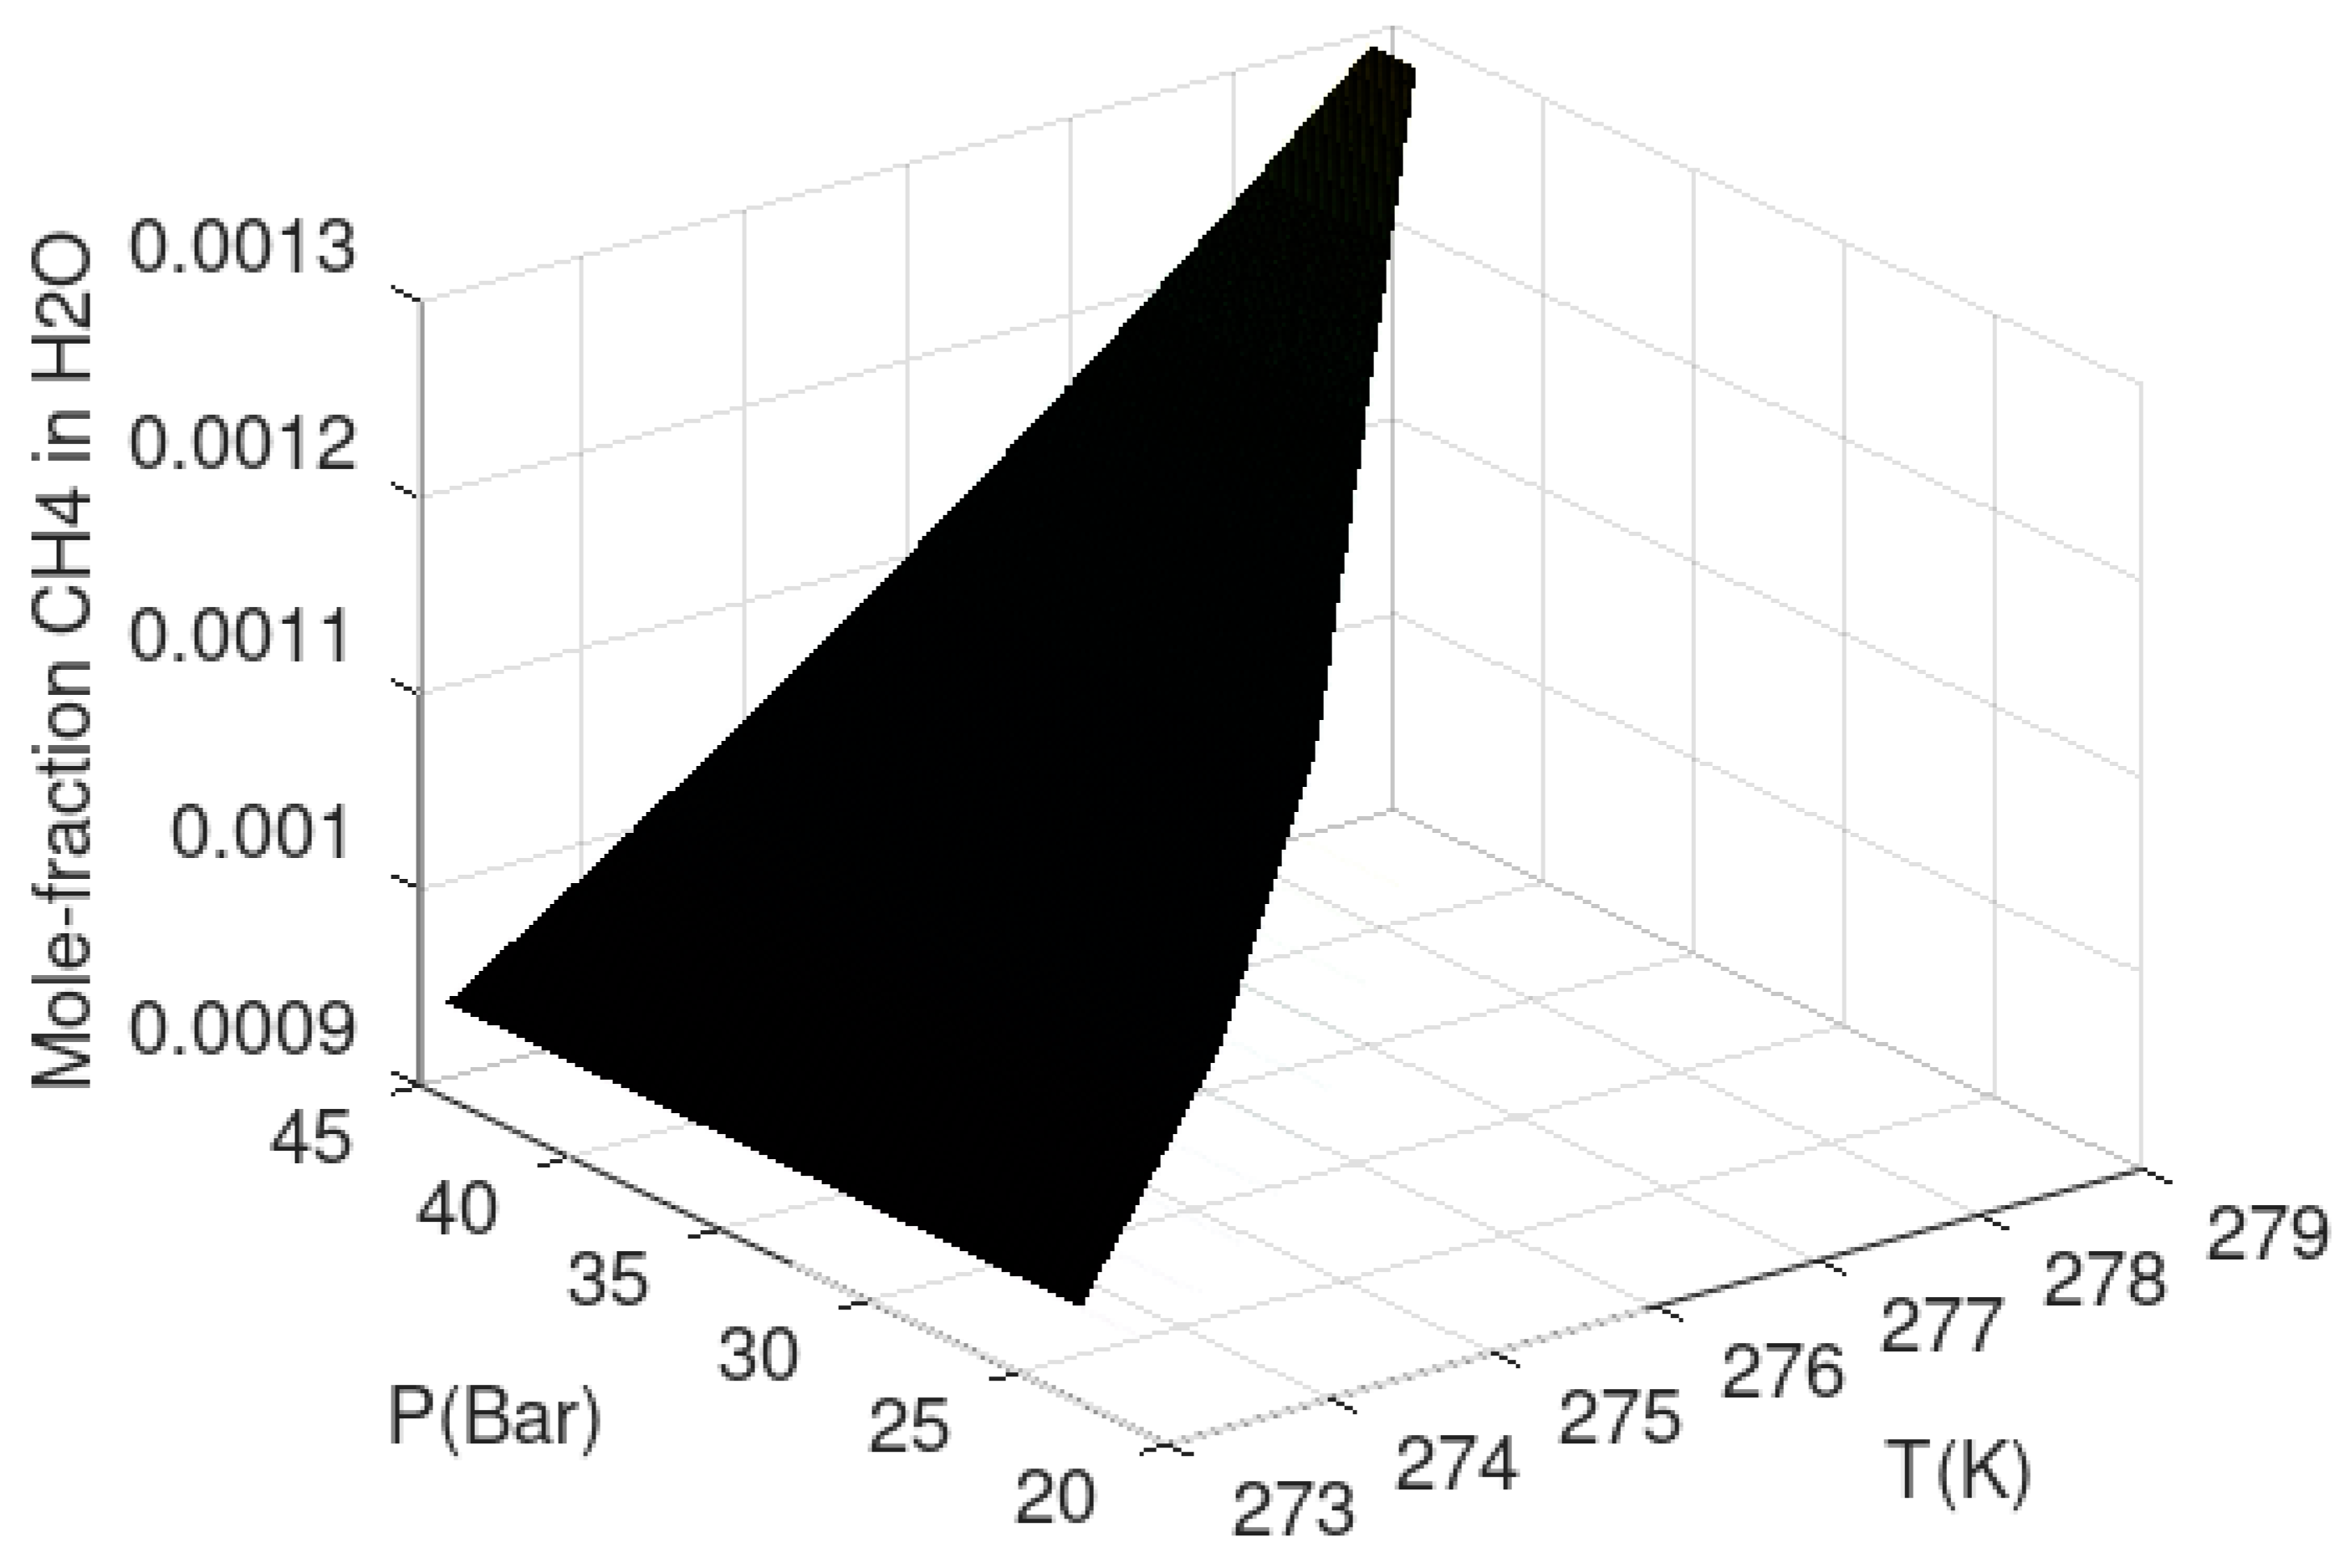
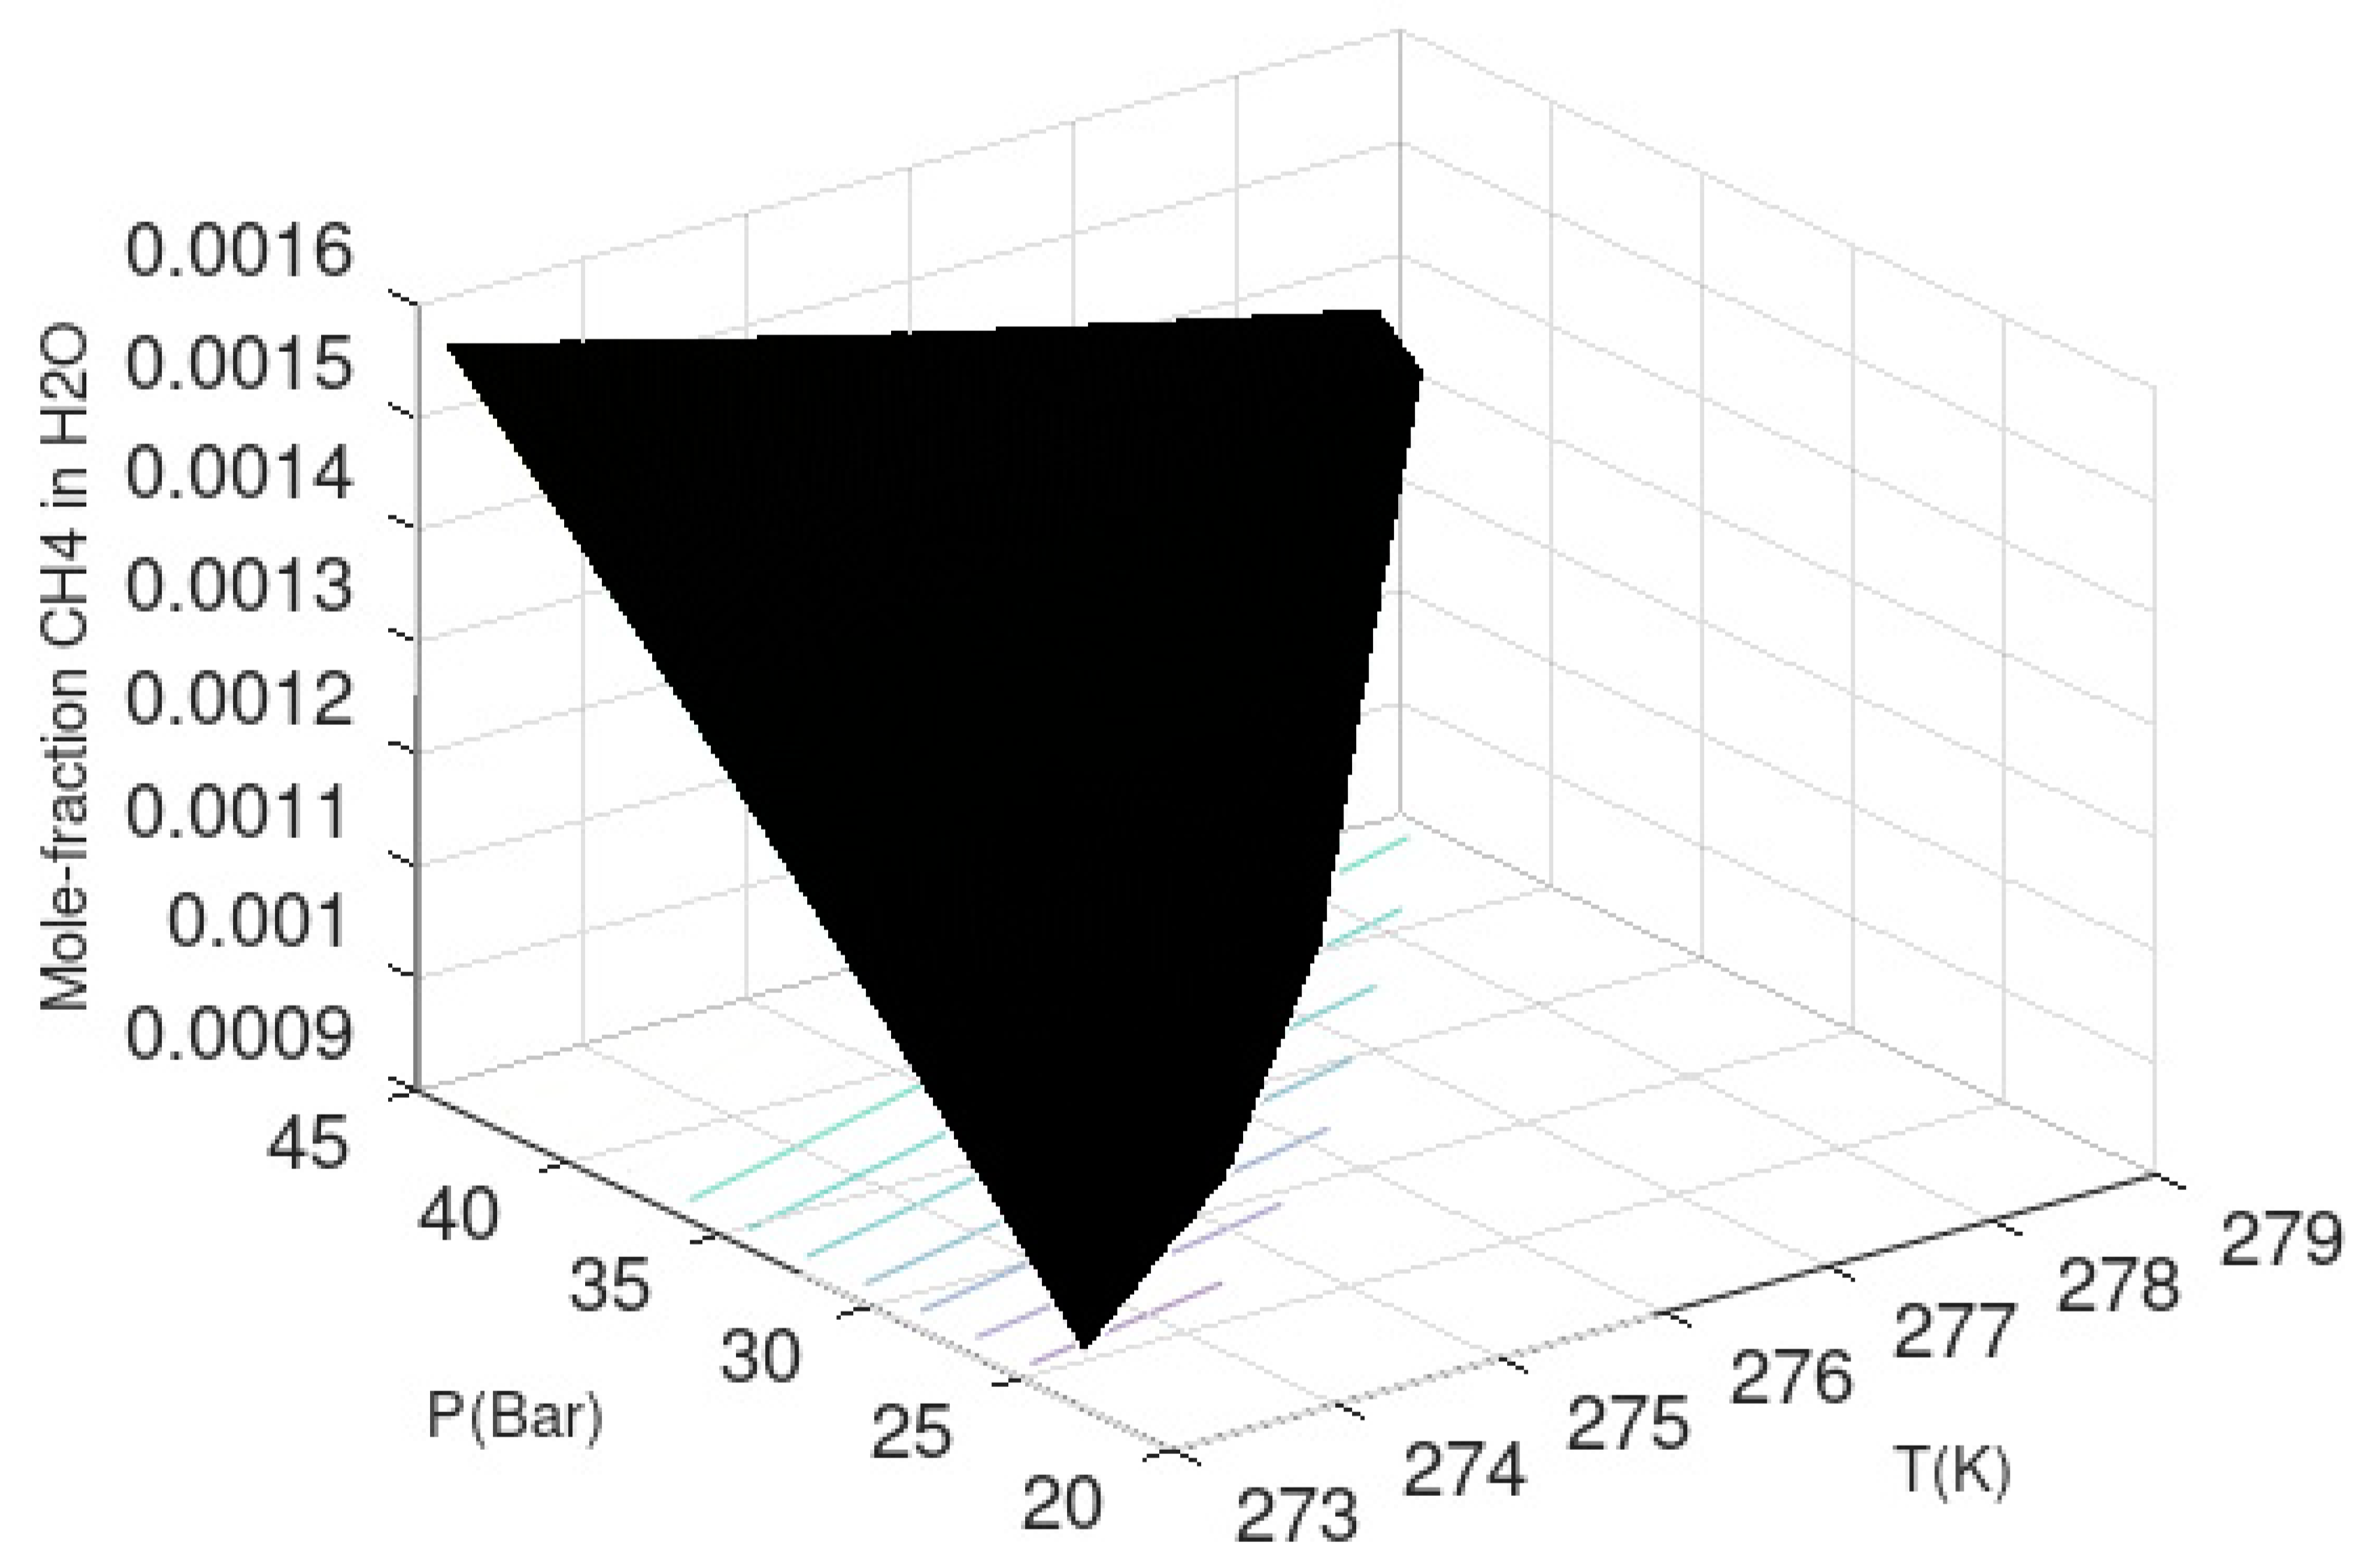
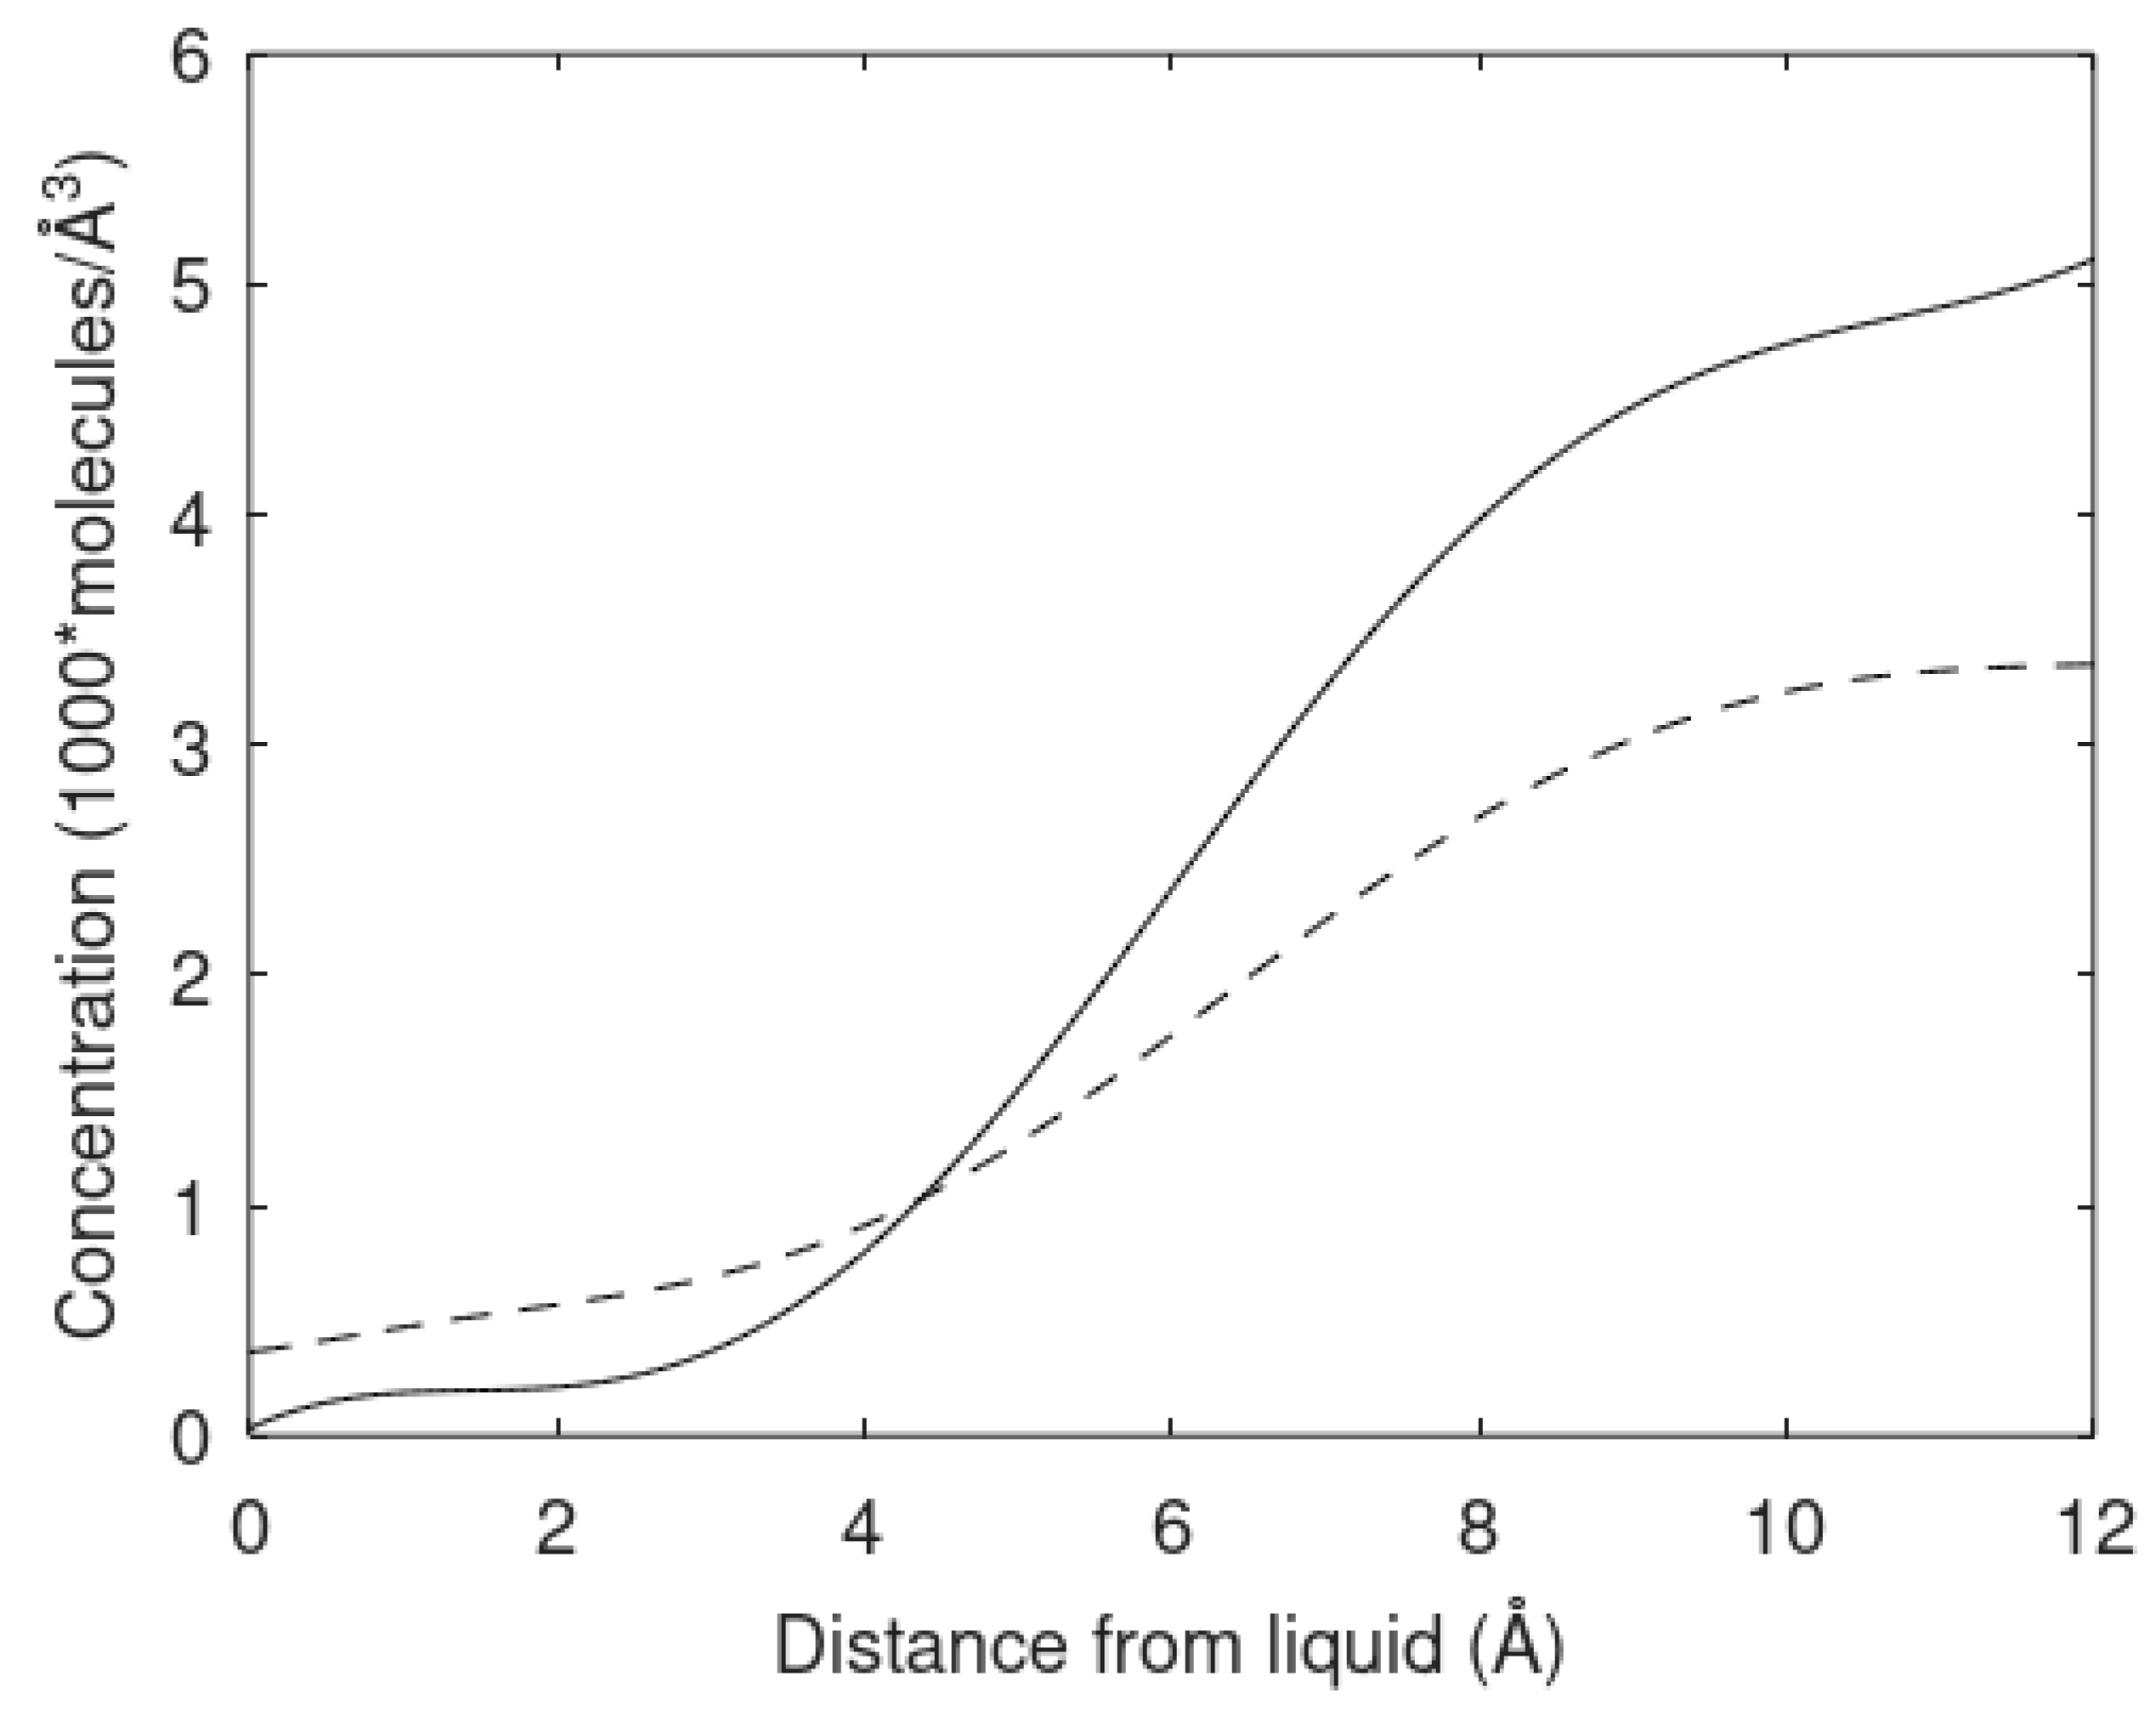
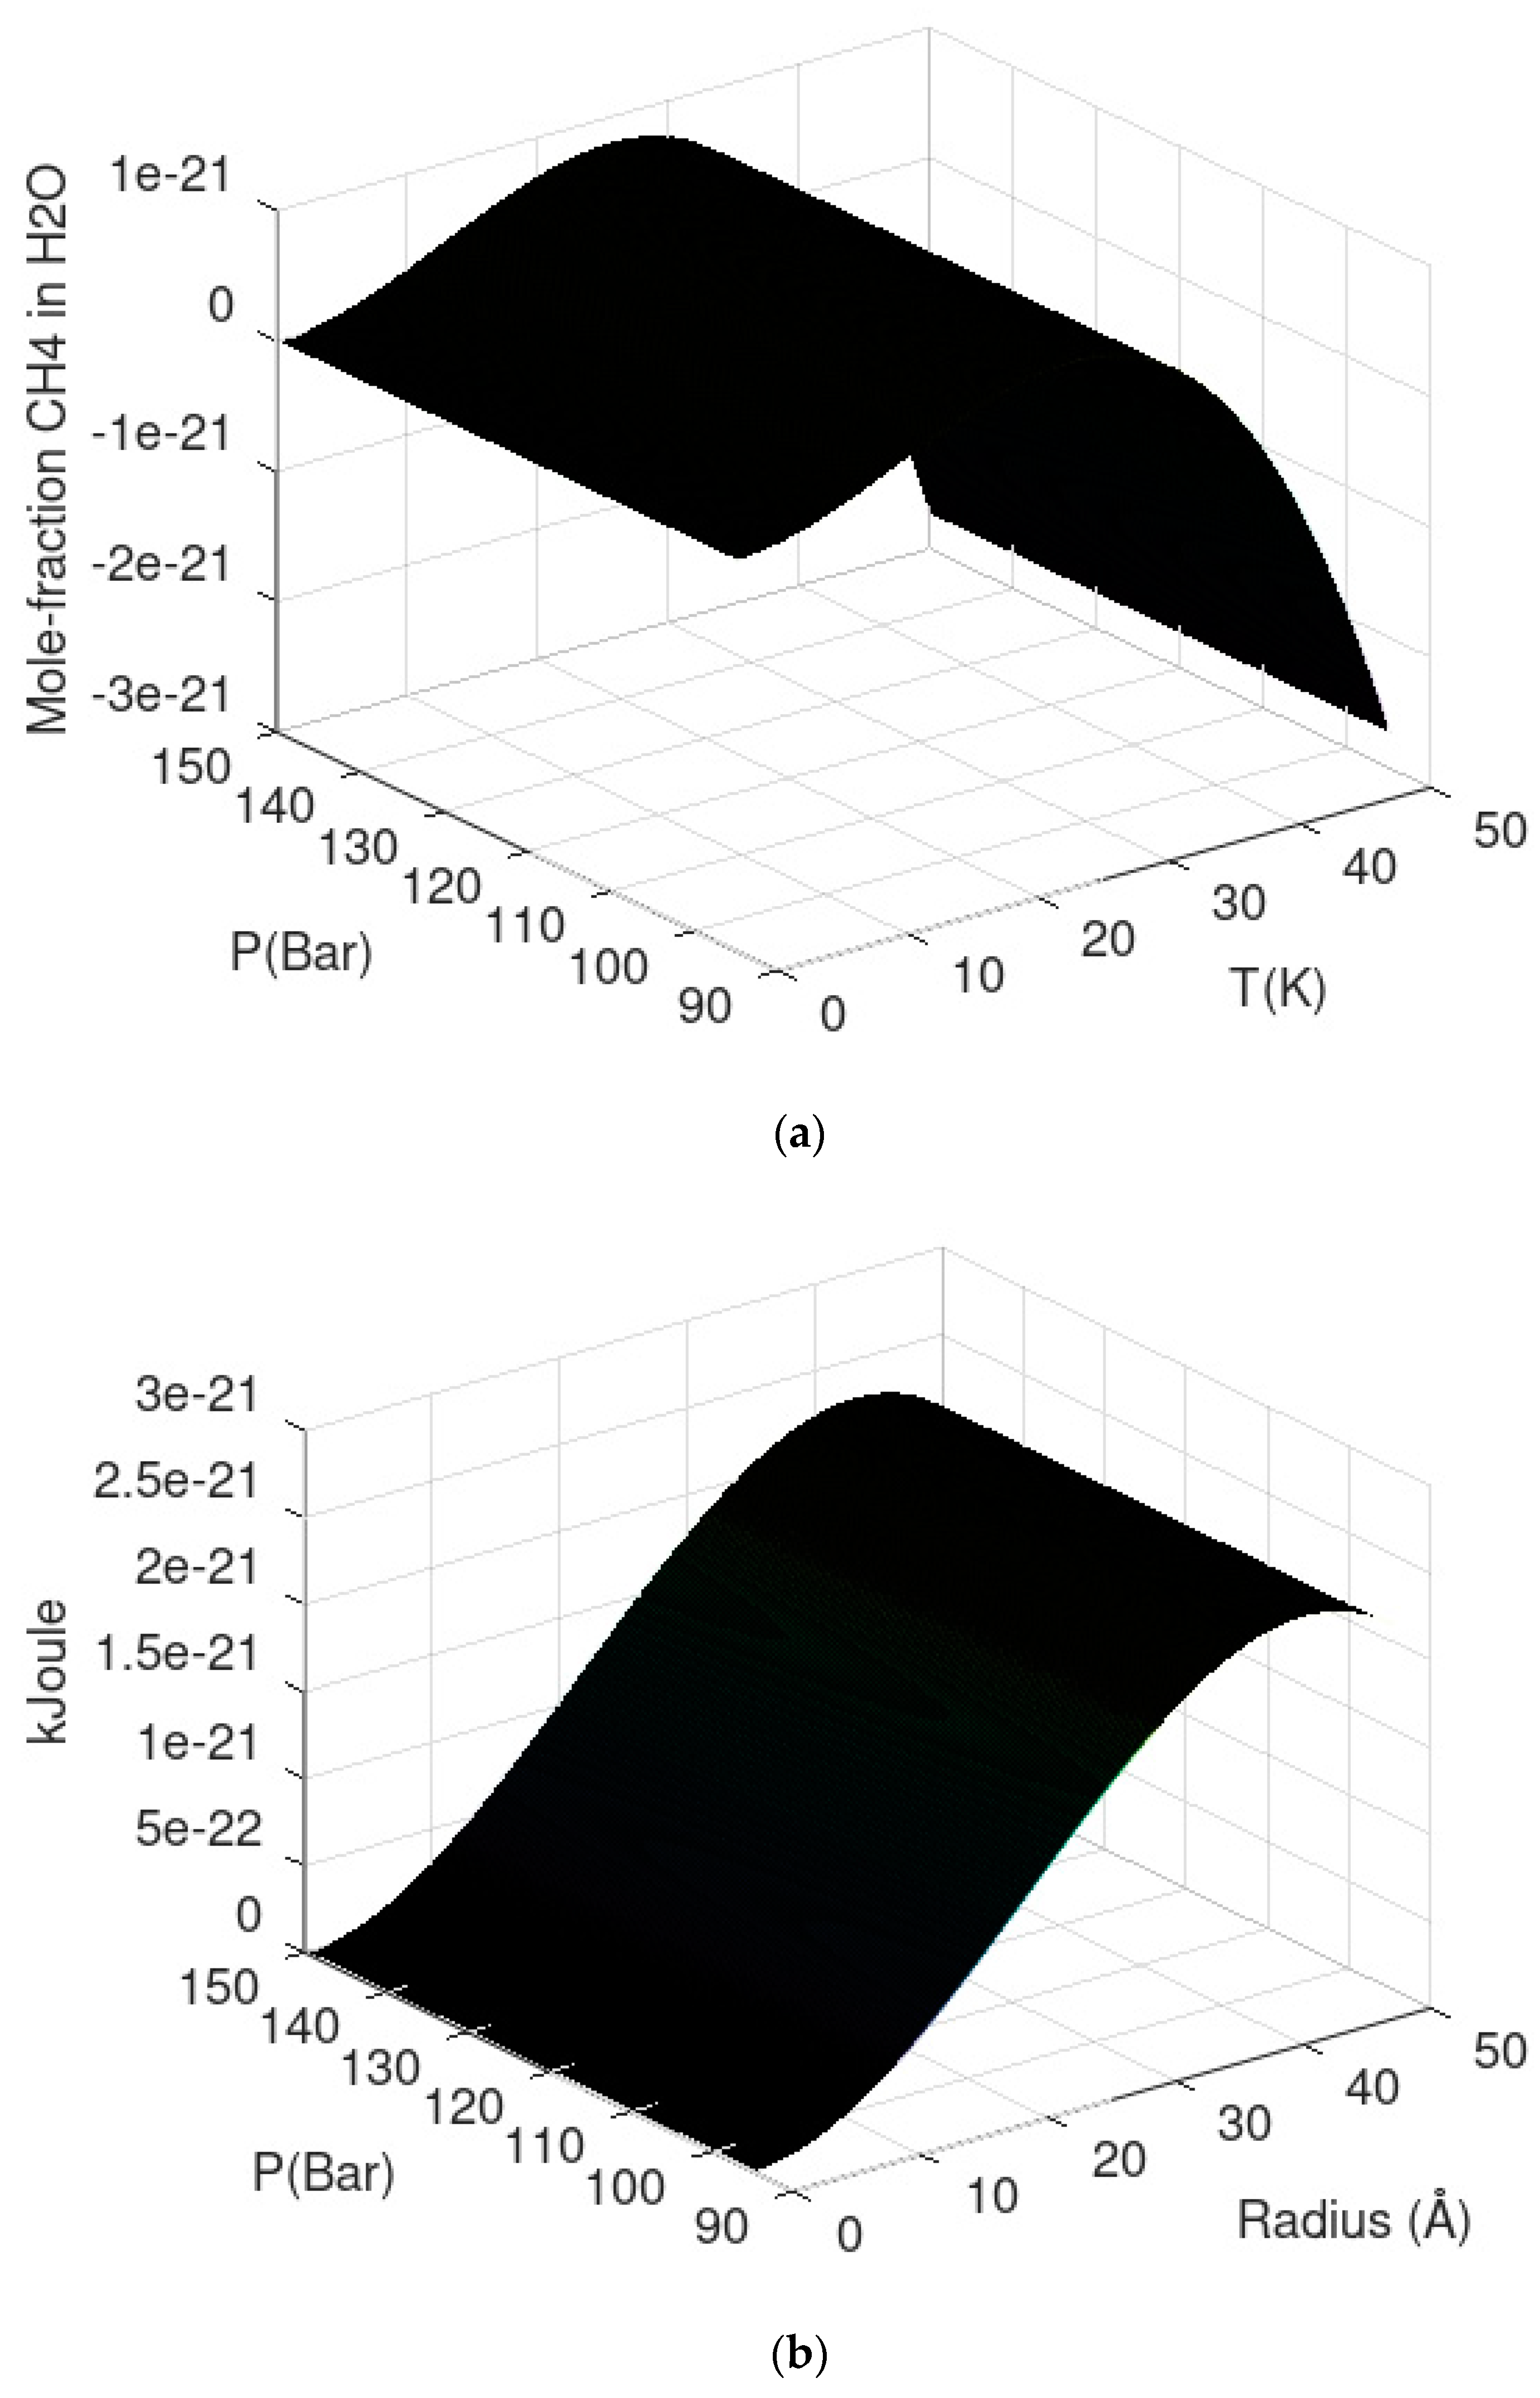
Yet another hydrate stability limit is related to the concentration of hydrate former in the contacting liquid water phase. This limit is often related to solubility in the hydrate region since it can be experimentally observed as a lower liquid water concentration in the hydrate formation region than in the regions outside hydrate formation. In thermodynamic terms these lower concentrations inside hydrate formation condition of temperature and pressure are hydrate stability limit concentration. The fact that hydrates form is because it is a more stable phase for water than liquid water. Hydrate will therefore dominate the concentration of hydrate former in the connecting liquid water phase. There are two practical consequences of this. Hydrate can form homogeneously from dissolved hydrate former if the concentration is higher than the hydrate stability concentration and lower than the liquid solubility concentrations. For offshore natural gas hydrate, fracture systems can lead to inflow of seawater from above. The incoming seawater has normally limited hydrocarbon content–typically almost infinite dilution. The chemical potential for methane at infinite dilution is lower than the chemical potential for methane in the hydrate and the hydrate dissociated. Visible evidences of this type of stability limit can be found all over the world in the form of methane fluxes from hydrate reservoirs. Most offshore hydrates are in a dynamic balance between formation of new hydrate from upcoming hydrocarbons and dissociation of hydrate towards incoming seawater. A more representative hydrate stability limit graph for natural gas hydrates in porous media is plotted in
Figure 4 below. A 3D graph is not easy to read quantitatively. The plot is, however, intended as an illustration in the context of this work. This curve is constructed using chemical potential for methane in water according to the asymmetric convention (last column in
Table 3) instead of the chemical potential for methane gas. For each set of temperature and pressure the mole-fraction methane in water is solved iteratively to satisfy equal chemical potential for water in hydrate and liquid water.
See Kvamme et al. [
7] and Kvamme [
14] for model parameters and further details.
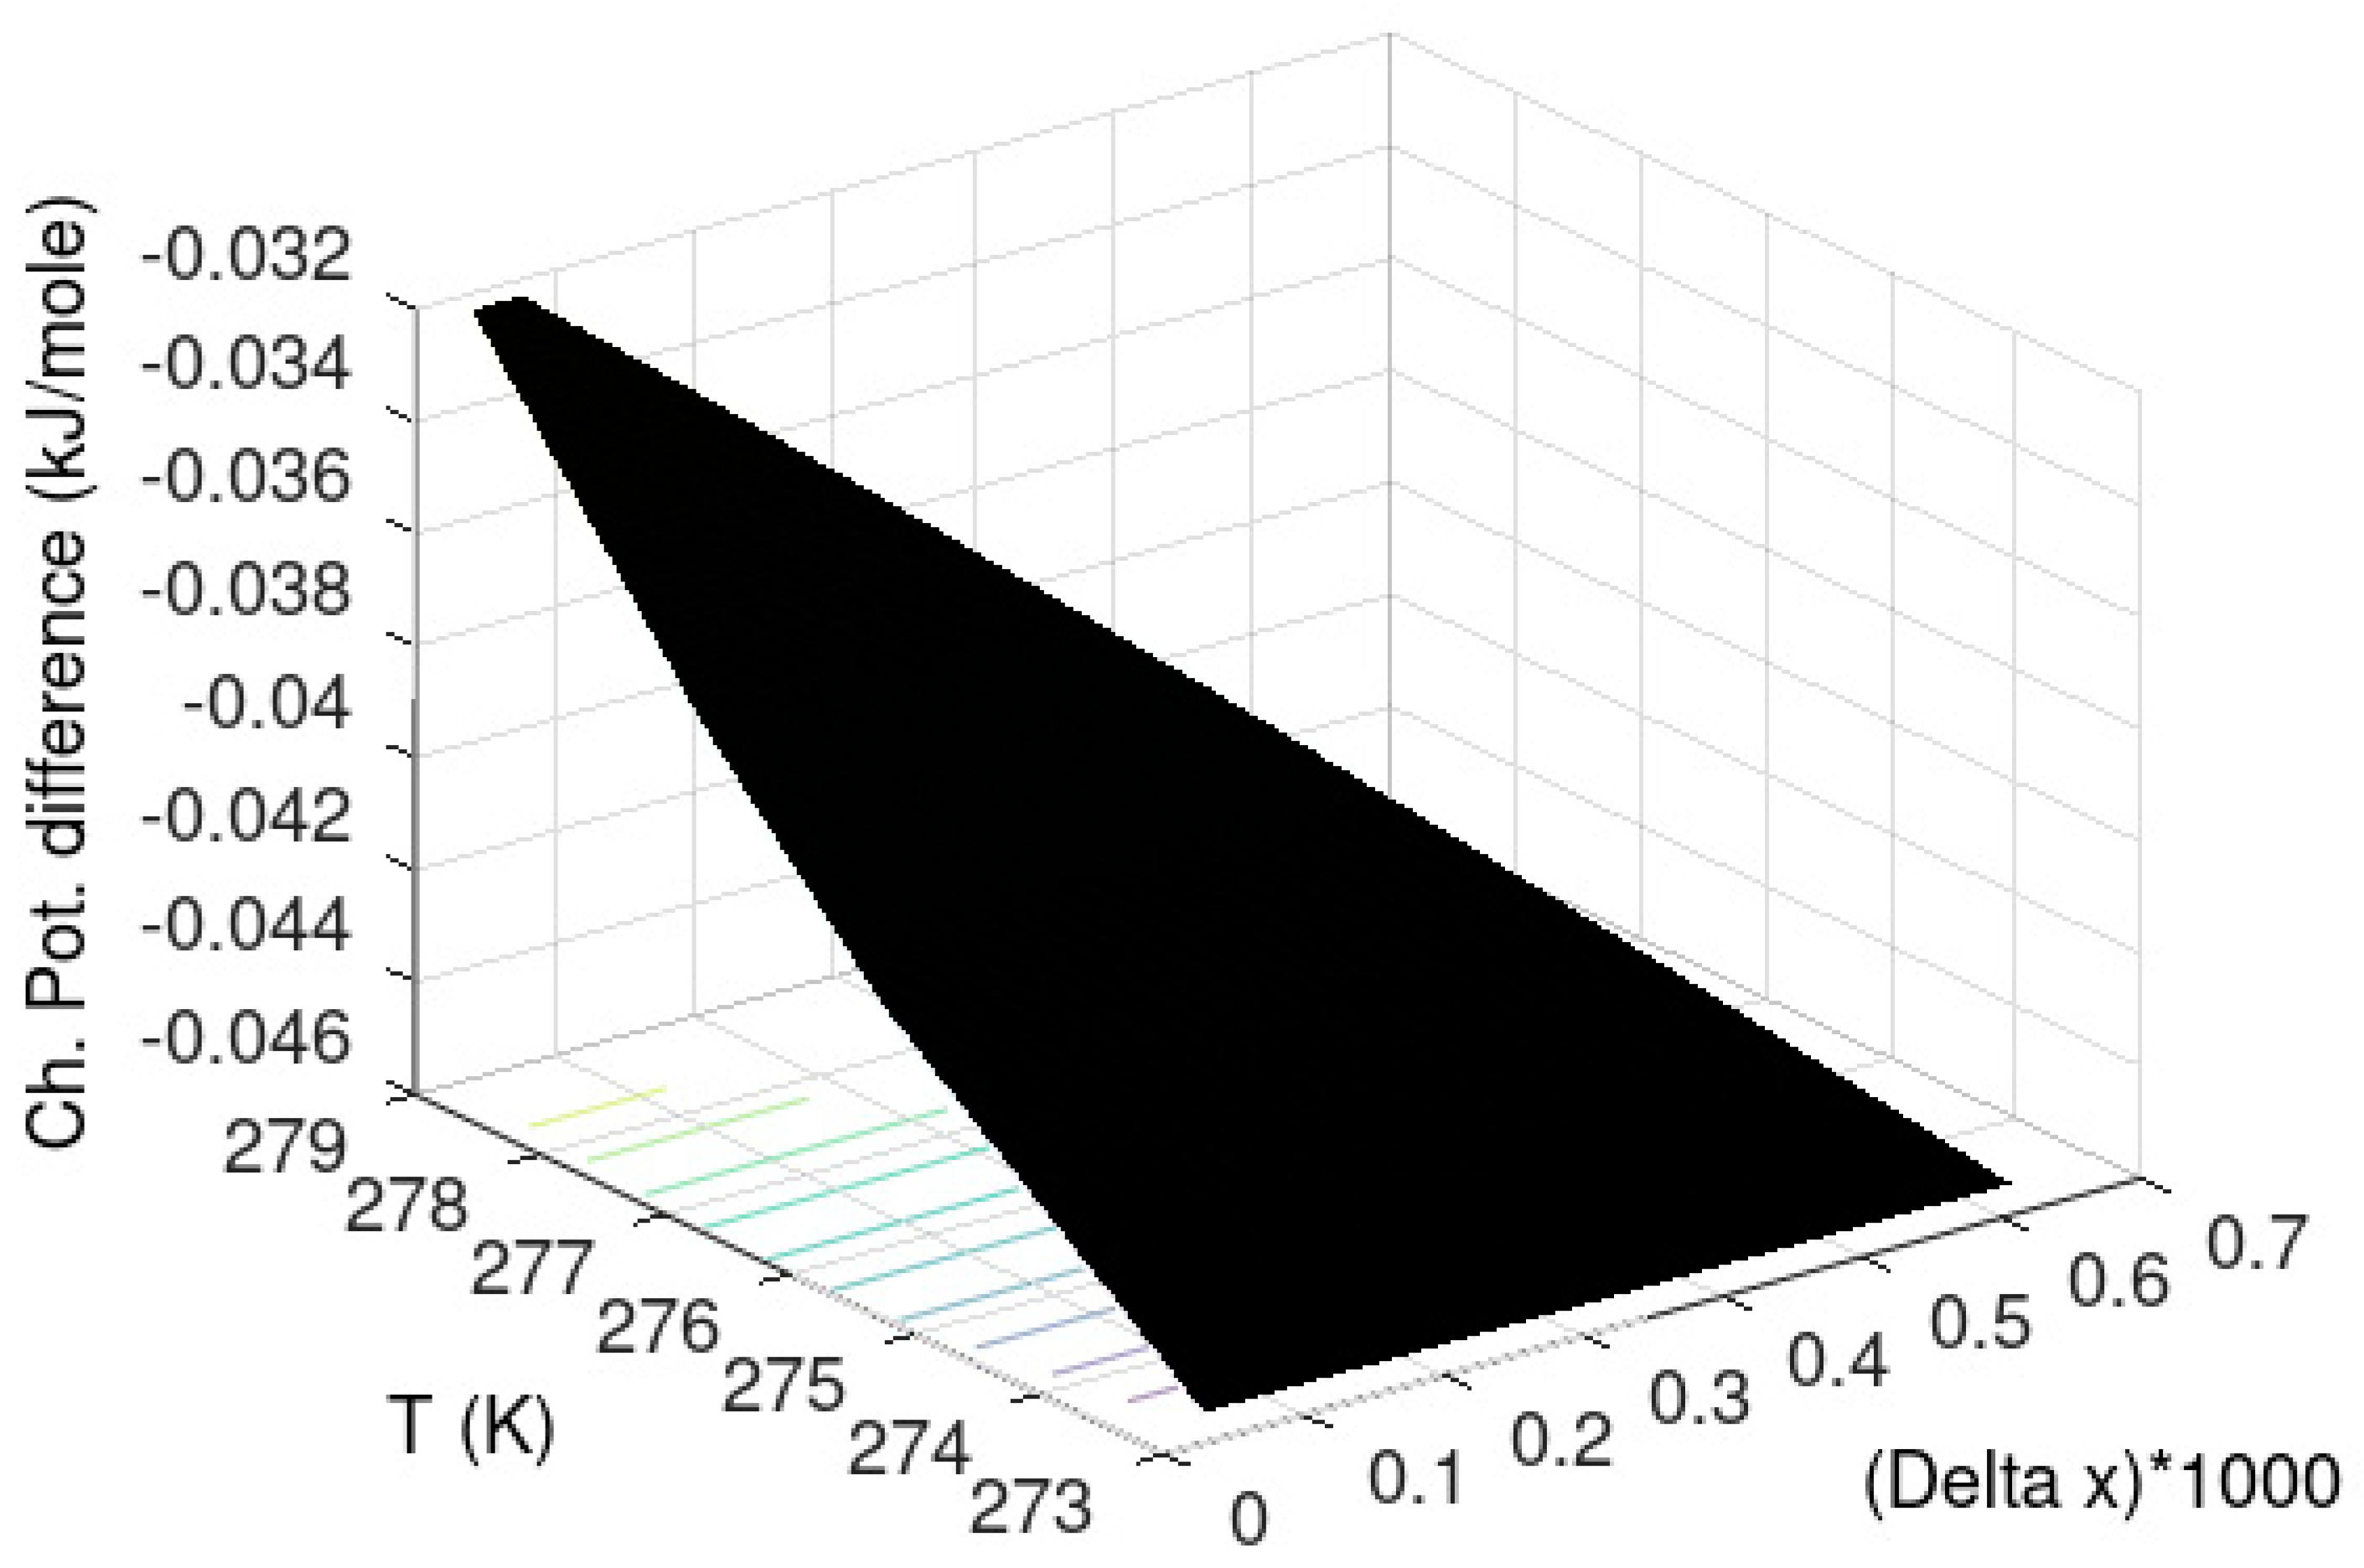
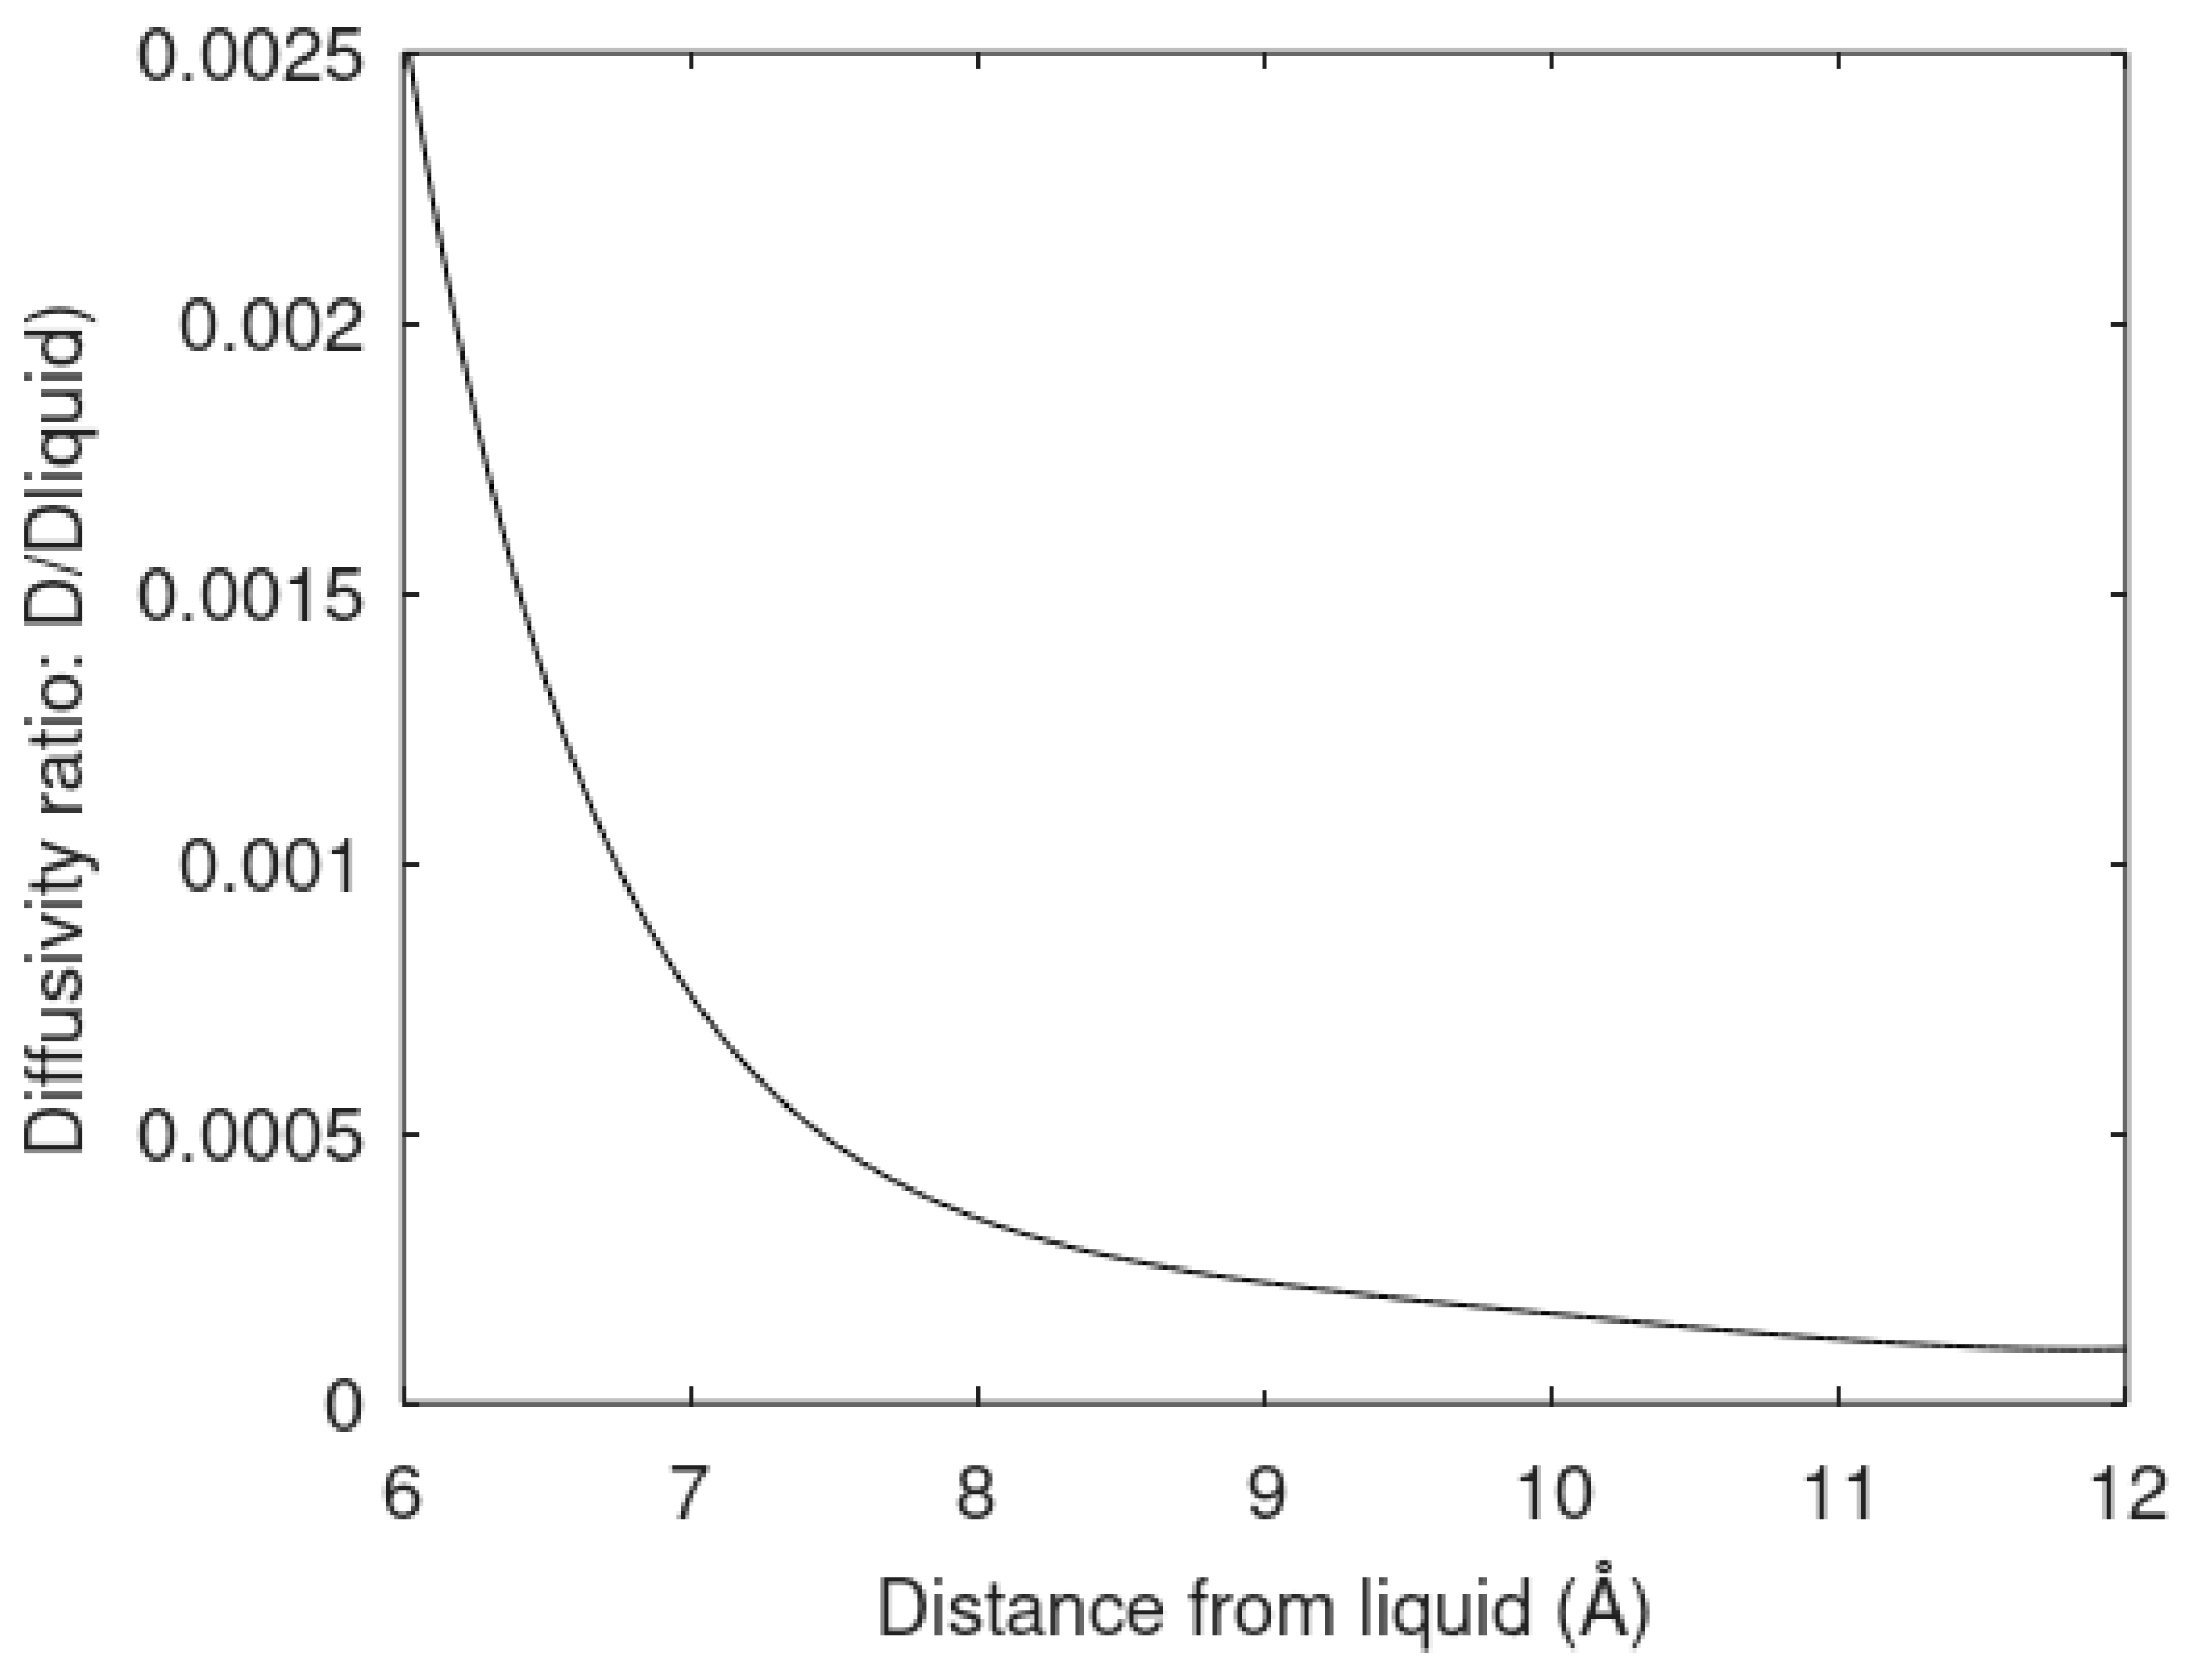
The maximum supersaturation possible for homogeneous hydrate formation is the difference between the liquid solubility of methane and the hydrate stability limit concentration. This is calculated for any defined P and T by solving iteratively for same chemical potential of methane in gas (last column in
Table 1) as chemical potential of methane in water (last column in
Table 3). This is plotted in
Figure 5 for the same conditions of P and T as
Figure 4. Hydrate can form for all mole-fraction of methane solubility which are higher that hydrate stability limits in
Figure 4 but here we only plot results for maximum supersaturation. These are plotted in the form of chemical potential difference between water in hydrate and water in liquid and plotted for all the same temperatures and pressures as in
Figure 4 and
Figure 5.
The calculated results plotted in
Figure 4 and
Figure 5 have been verified towards experimental data elsewhere [
7,
14,
15,
16].
In
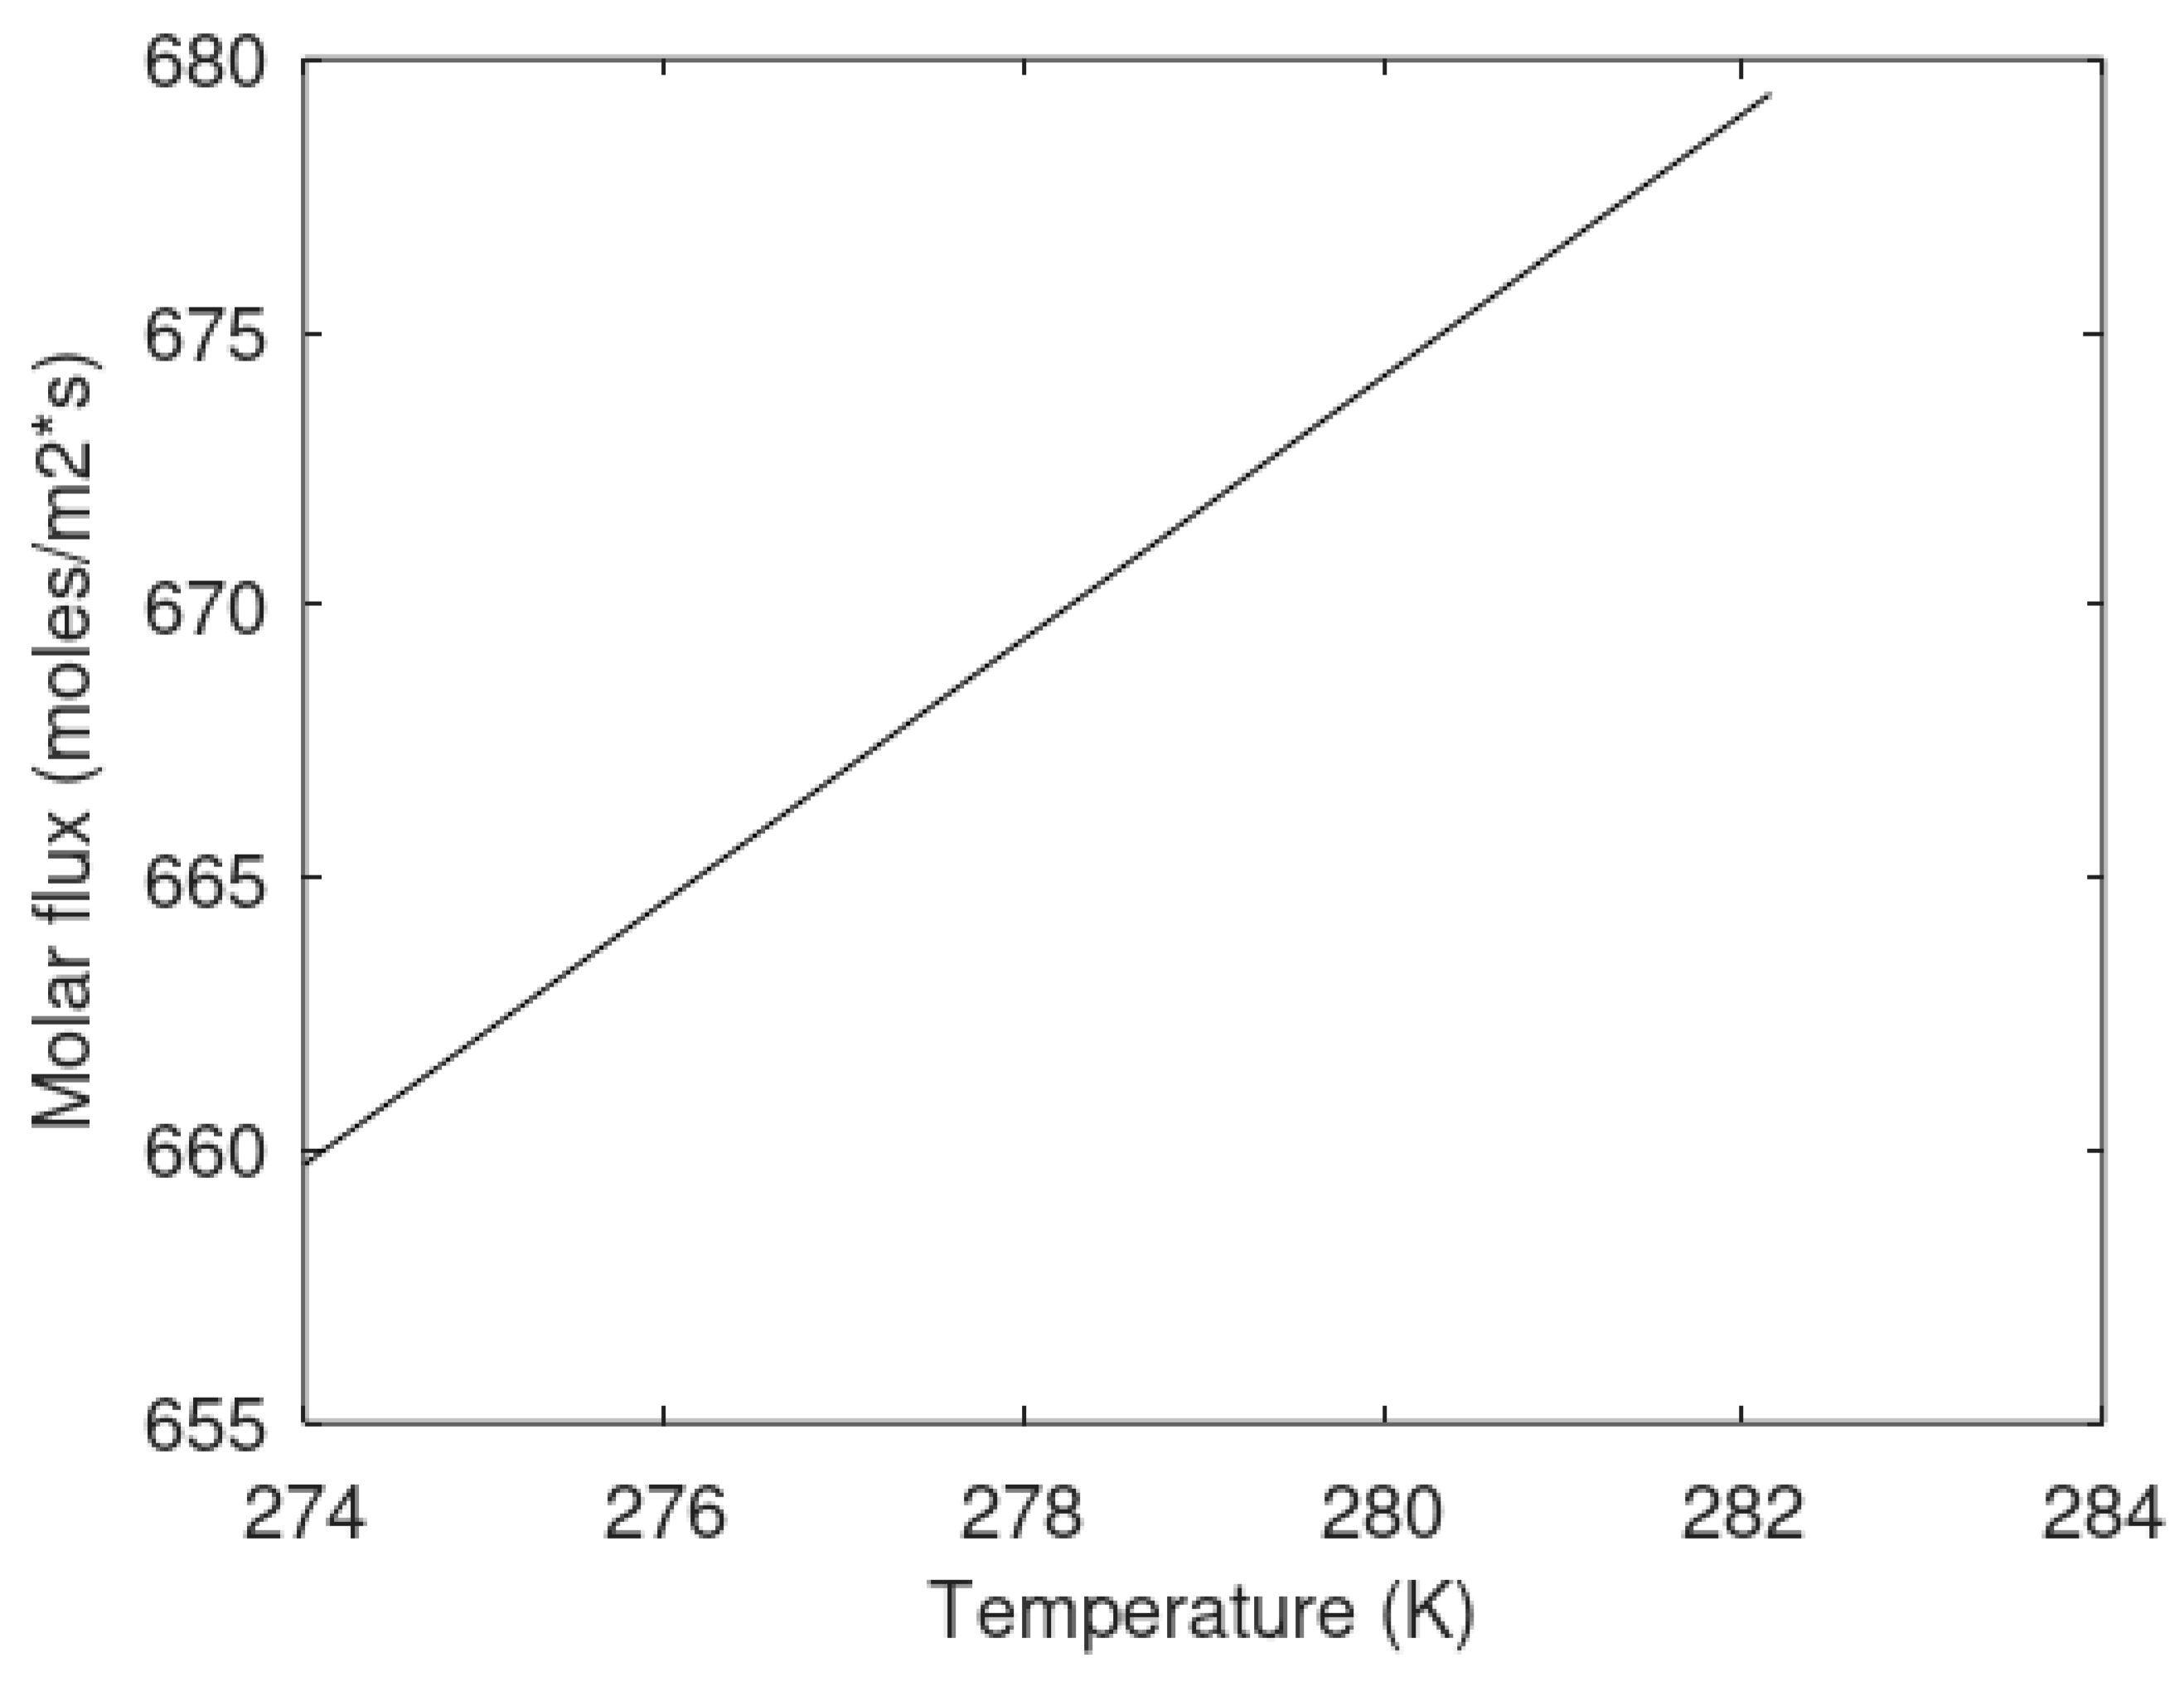
Figure 6 we plot the difference in chemical potential for water in hydrate and liquid water as the supersaturation in thermodynamic formulation.
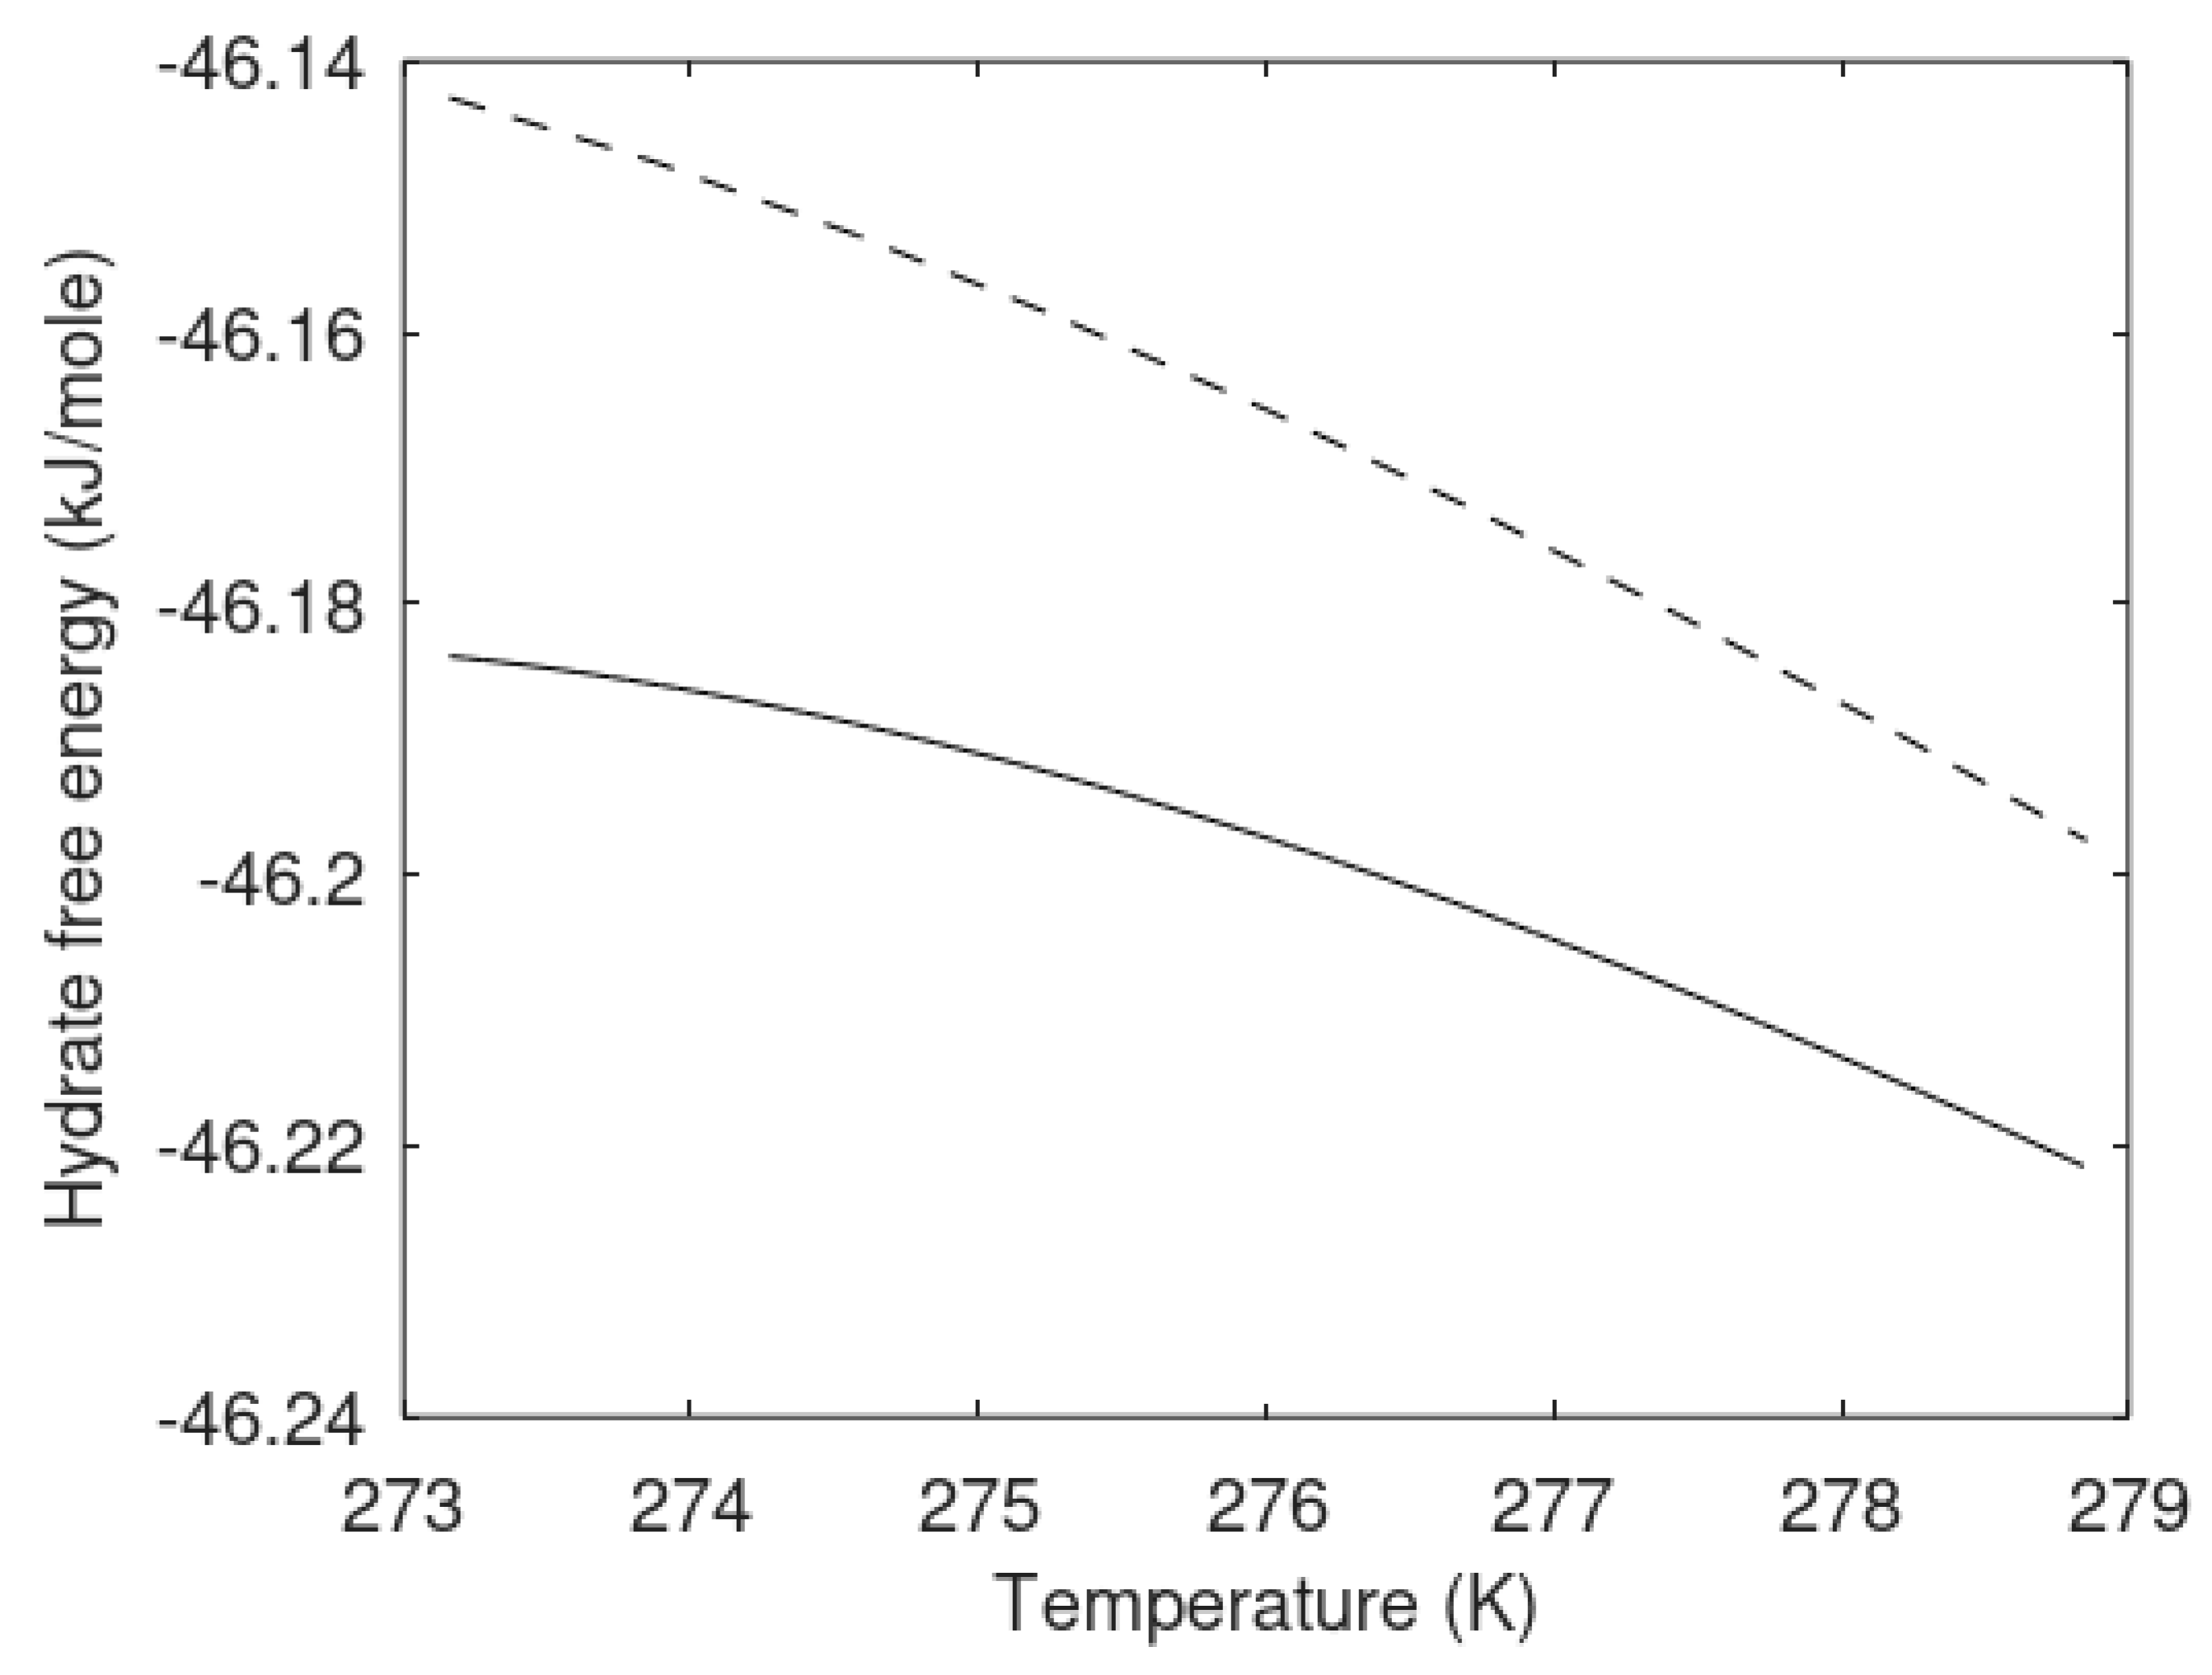
Another important issue is that the free energy of the hydrates formed heterogeneously and homogeneously are different. In a non-equilibrium situation there are no general constraints that dictate the chemical potentials to be the same in all phases. There are simply too many constraints compared to the number of independent variables. Additionally, if we assume thermal and mechanical equilibrium then it is not possible to also fulfill equal chemical potentials. See, for instance, Kvamme et al. [
10] for more details. Instead, the combined first and second laws of thermodynamics direct the system towards minimum free energy, in a balance between mole-fraction distributions and phase distributions.
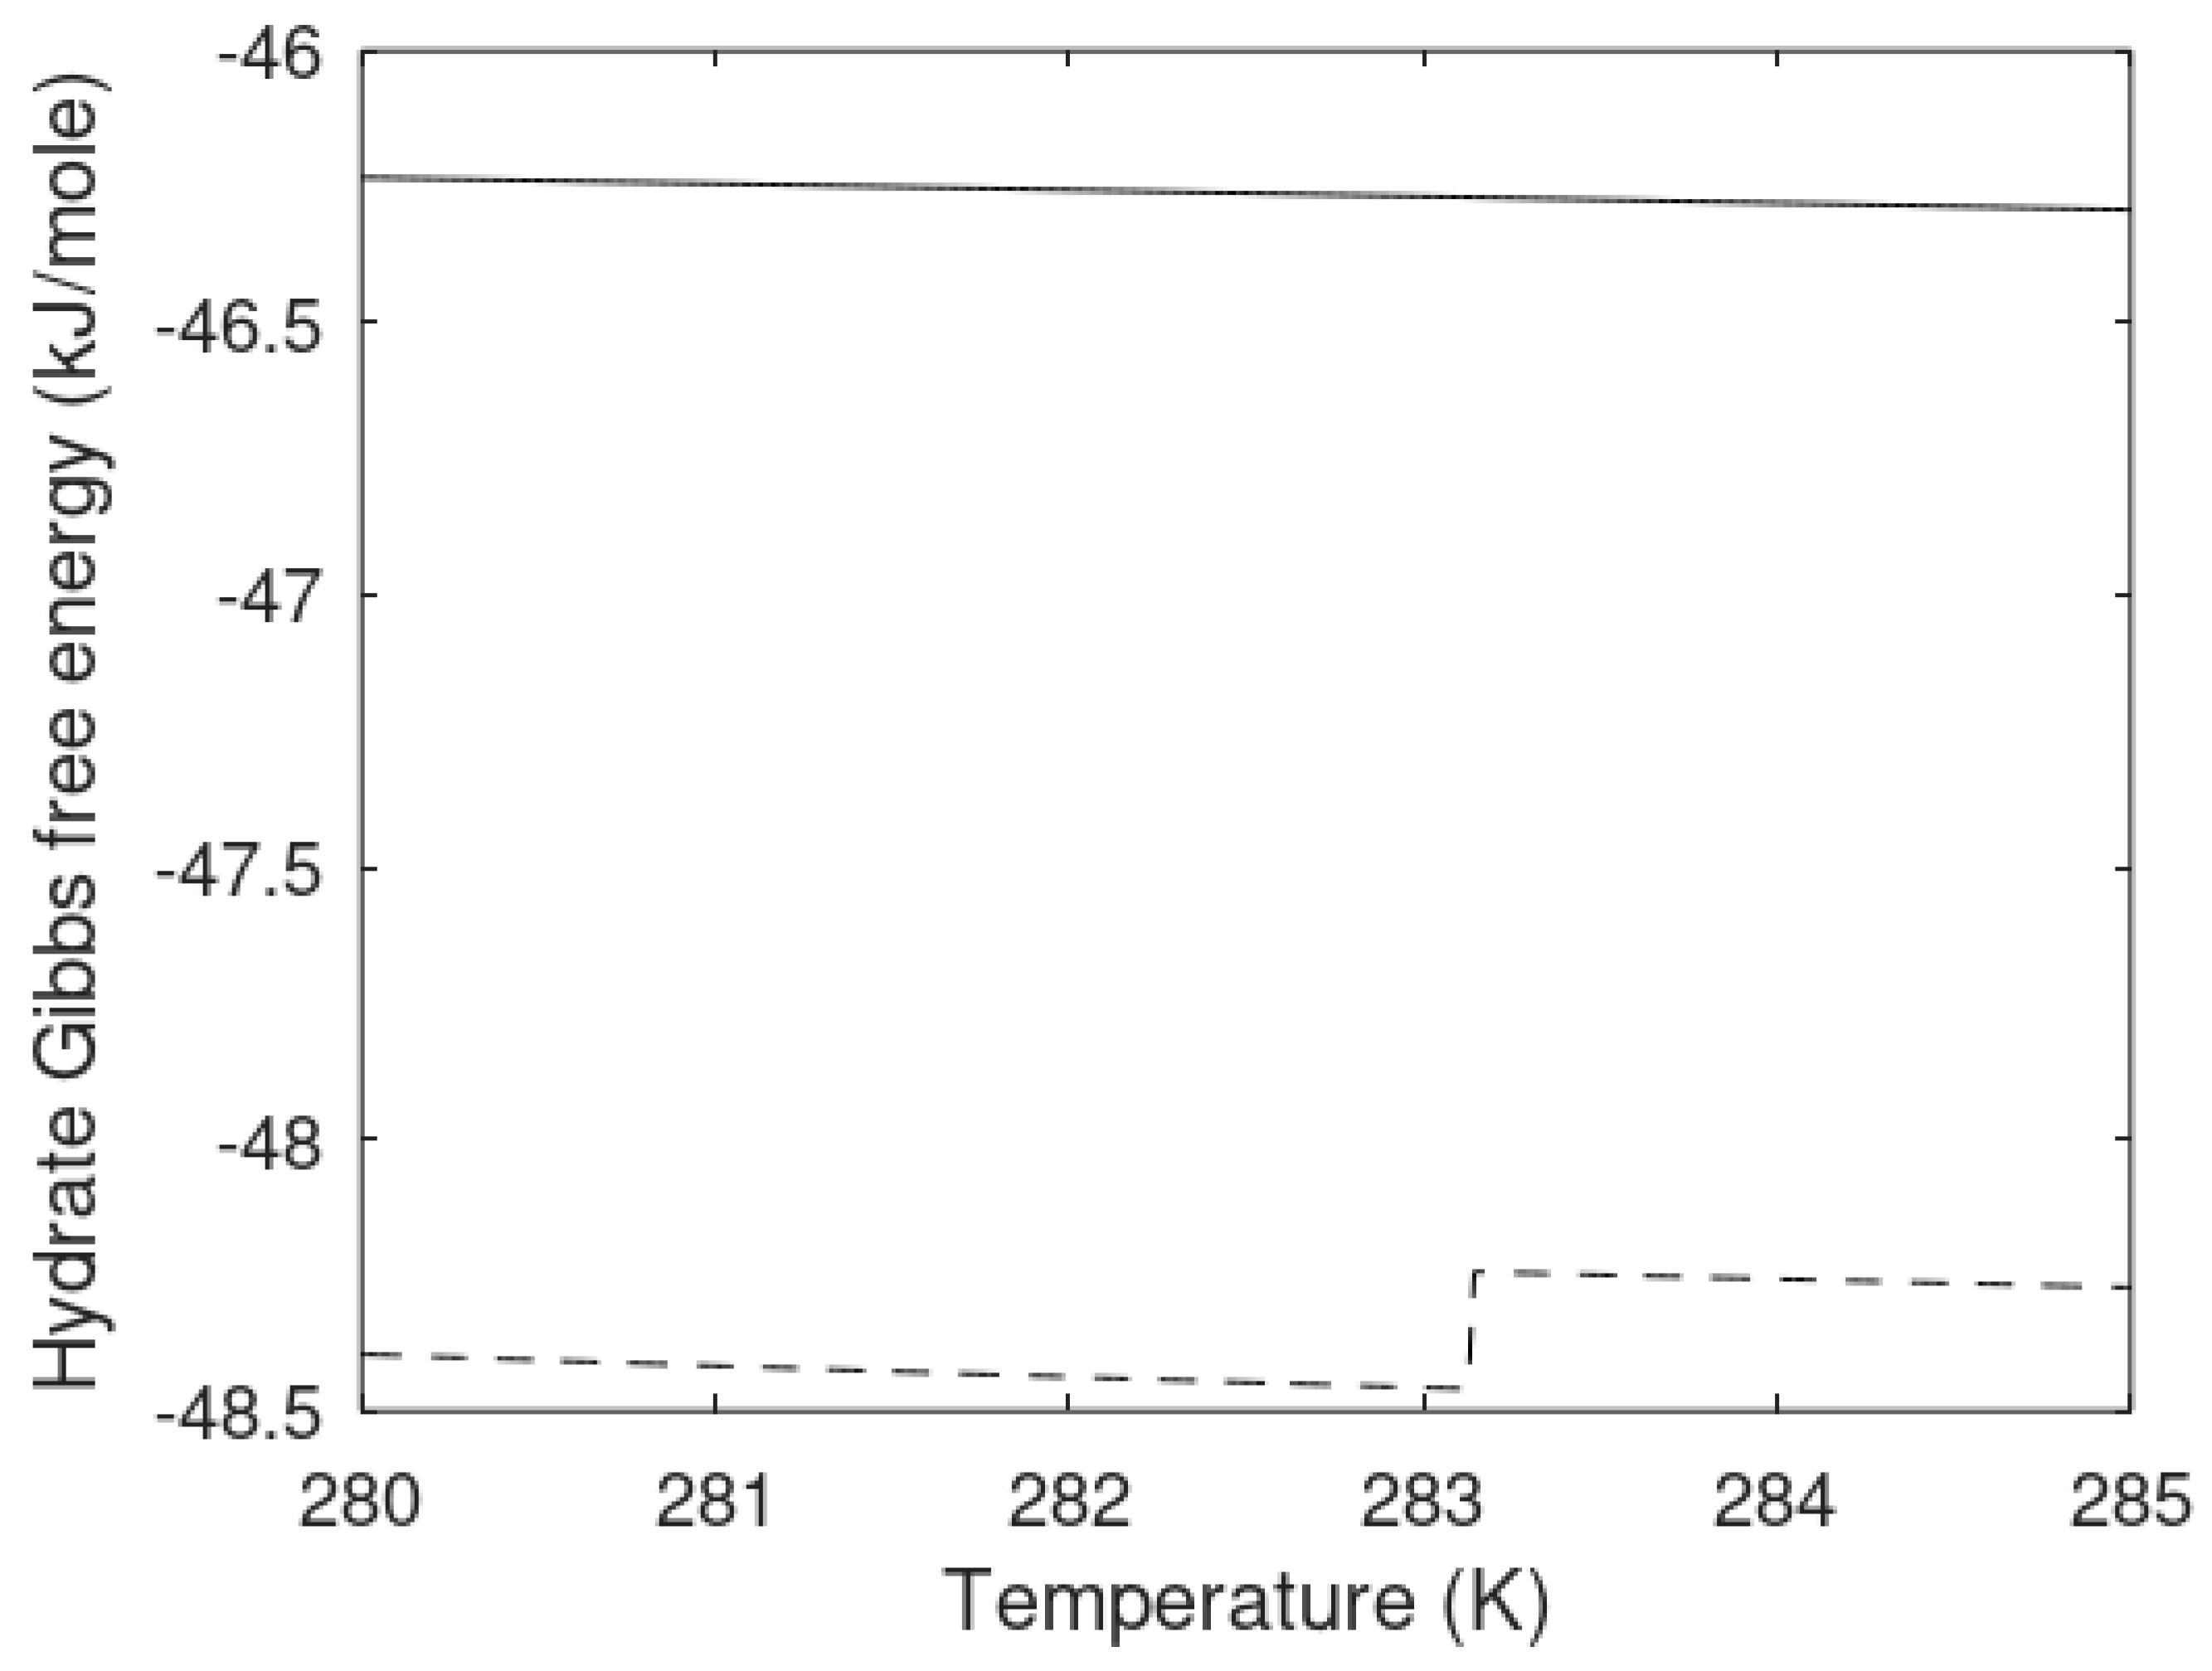
Figure 7 illustrates that the homogeneously formed hydrate and the heterogeneously formed hydrates are different phases. Temperatures and pressures are the same but hydrate compositions, densities and free energies are different. They are by thermodynamic definition different phases. Heterogeneously formed hydrate is slightly more stable than the homogeneously formed hydrate.
As mentioned before, the heterogeneous hydrate is trapping gas molecules in cavities. The corresponding cavity partition function is then directly given by Equation (13). The system is not an equilibrium system when two independent thermodynamic variables are defined but only one is permitted mathematically by counting numbers of independent thermodynamic variables minus constraints (conservation laws and equilibrium conditions). Chemical potential for methane in gas is not equal to the chemical potential for methane dissolved in water. For the homogeneous case the chemical potential for dissolved methane in water results in different cavity partition functions when the chemical potential from
Table 3 is inserted into Equation (13). Practically, this means that degree of freedom in Gibbs phase rule is 0 rather than 1 with one when counting only one hydrate. The iteration for stability limit concentration is the same as for the heterogeneous hydrate with cavity partition functions containing dissolved methane chemical potential in (13) and then inserted in (10). Equal water chemical potentials for hydrate and liquid water (
Table 1) for defined temperature and pressure results in the solutions plotted in
Figure 6.
The differences in hydrate compositions between heterogeneous hydrate (
Figure 1) and homogeneous hydrate (
Figure 6) are available from:
is the filling fraction of component
i in cavity type
k. In addition:
where
ν is the fraction of cavity per water for the actual cavity type, as indicated by subscripts. The corresponding mole-fraction water is then given by:
and the associated hydrate free energy (
Figure 7 for the two types of hydrate) is then:
The chemical potential differences for the guest molecules in the two types of hydrate are plotted in
Figure 8 below, and the hydrate compositions are plotted in
Figure 9 in terms of methane mole-fractions in hydrate.
The calculated methane mole-fractions in hydrate illustrate that the filling of methane in the two types of hydrate is different. The net result is, however that the heterogeneous hydrate is more stable as illustrated by
Figure 7. There are also differences in the small and large cavity fillings between the two hydrates that give further details on the differences, but this is not needed in the context of this work.
4. Hydrate Kinetic Modeling Review
Gas hydrates have been known to man since the nineteenth century; however, experimental and numerical attempts at studying the intrinsic kinetics of gas hydrate growth and dissociation have their roots in the late twentieth century. During this time period the number of publications with the keywords “gas hydrates” and “kinetics” has increased dramatically from 1, or fewer, publications per year between 1965 and 1983 to 232 in both 2019 and 2020. Of these works, the earliest attempt at quantifying the rate of hydrate growth came in 1965 when Pinder [
17] formed hydrates from THF. While these early experiments were performed at atmospheric pressure and with very simple equipment (a beaker, a thermometer and a refractometer), Pinder [
17] was able to conclude the observed rate of hydrate growth was diffusion limited. Pinder [
17] did not present any attempts to extract a rate constant but he did make indirect reference to the temperature difference being the driving force for the growth of hydrate particles. Following Pinder’s work [
17] with THF hydrates, Miller and Smythe [
18] and Falabella [
19] formed hydrates in the presence of CO
2 and CH
4, but at temperatures between 152 to 183 K. At these extremely low temperatures, hydrates can form at pressures only slightly above atmospheric conditions. It is worth noting that in modelling their results, both Miller and Smythe [
18] and Falabella [
19] used a pressure difference as the driving force.
In the early 1980s, the laboratory of P.R.Bishnoi, at the Uninversity of Calgary, became the first group to study hydrate growth kinetics at significantly elevated pressures and in the presence of a synthetic natural gas. The group’s initial foray into gas hydrate growth kinetics was the study of Maini and Bishnoi [
20] which examined the formation of synthetic natural gas hydrates on gas bubbles suspended in flowing salt water. In this study, which was motivated by the desire to track gas plumes in underwater well blowouts, a high pressure water tunnel was built to allow for direct observation of a hydrate layer on a stabilized bubble of gas. By means of direct observation, Maini and Bishnoi [
20] were able to observe that the formation of gas hydrates requires a supersaturated solution and that, at a constant temperature, the rate of reaction was a strong function of pressure.
Parallel to the work of Maini and Bishnoi [
20], Vysniauskus and Bishnoi [
21] formed gas hydrates with pure methane, pure ethane and a synthetic natural gas mixture in a semi-batch stirred reactor. From measurements of temperature and pressure, it was possible to track the number of moles of gas that had been consumed in the formation of hydrates and then subsequently to regress a rate constant. The data for the reaction rate was then fit to the following equation:
where
r is the reaction rate,
A is the pre-exponential constant, Δ
Ea is the activation energy,
γ is the overall rate of reaction with pressure and a and b are constants. In formulating Equation (21), Vysniauskus and Bishnoi [
21] assumed that the formation of gas hydrates was a homogeneous reaction that consisted of three steps: (i) clustering of sub-critical nuclei, (ii) formation of a nucleus of critical radius and (iii) hydrate crystal growth around a stable nucleus.
In addition to the significance of the experimental results, the two aforementioned studies from Professor Bishnoi’s group made equally significant contributions to the design of gas hydrate kinetics apparatus. Being the first studies of their kind, it was not possible to purchase equipment and thus, the equipment had to be designed and manufactured in-house. However, as will be seen, many of the basic elements of Vysniauskus and Bishnoi’s [
21] reactor have become standard features in present day hydrate formation apparatus.
Following the seminal work of Vysniauskus and Bishnoi [
21], the next significant step towards understanding gas hydrate formation came in 1987 from Englezos et al. [
22]. Following Vysniauskus, it became apparent that viewing hydrate formation as a homogeneous reaction precludes a full understanding of the process. In particular, Englezos et al. [
22] regarded hydrate formation as a heterogeneous reaction in which the observed reaction rate depends on the surface area available for reaction. In 1987, Englezos et al. [
22] did not have access to a particle size analyser that could operate at high pressure, and thus the transient particle size distribution was estimated solely from the population balance equation. The other significant insight of Englezos et al. [
22] was the use of the fugacity difference as the driving force, as seen in Equation (22). As will be seen, many subsequent studies of gas hydrate growth kinetics interpret their data using versions of the model of Englezos et al. [
22] in which the estimation of surface area and/or the definition of the driving force has been changed.
where
ƒ is the fugacity,
AP is the surface area of a hydrate particle and
K* is the reaction rate constant. The second of Englezos’ works from 1987 [
23] extended Equation (22) to describing the rate of formation of multi-component gas hydrate formation. In their formulation, the rate of growth of hydrates is simply the sum of the rate of growth for each individual component, and thus there was no need to regress additional parameters. When applied to the formation of methane-ethane mixed hydrates, the model of Englezos et al. [
23] performed well. However, Englezos only considered gas mixtures of two very similar molecules. Subsequent studies [
24,
25] have shown that this approach needs to be modified in the case of gas mixtures of dissimilar molecules.
Just as the work of Englezos et al. [
22] became a standard for studying gas hydrate growth kinetics, the work of Kim et al. [
26] has become a standard for studying gas hydrate dissociation kinetics. Both works used the same apparatus and, as seen in Equation (3), both models write the rate of reaction as being proportional to the product of the surface area times a fugacity difference. However, the model of Kim et al. [
26] computes fugacity in the gas phase whereas Englezos’ model [
22] requires a value for the fugacity in the liquid solution. Kim et al. [
26] also incorporated the hydrate particle surface area into the kinetic model. However, in order to estimate the surface area at the onset of dissociation, Kim et al. [
26] measured the settling time of hydrate particles. Note that in both Equation (22) and Equation (23) the rate constants,
K* and
Kd, are global rate constants, which are affected by both the intrinsic rate of hydrate growth, or dissociation, as well as the rate of mass transfer.
In looking back at the evolution of the understanding of gas hydrate kinetics up to the end of the 1980s, one can see a shrinking of scale; initially hydrate growth kinetics were deduced solely from temperature and pressure measurements, whereas by the end of the 1980s it was becoming accepted that a full understanding of gas hydrate growth kinetics also required a knowledge of the size distribution of micron-sized particles. However, it would be another ten years before it would become possible to make measurements of hydrate particle size distributions. During the 1990s, population balance-based modelling was used in several studies [
27,
28,
29,
30], however, there were also several prominent works that disputed the model of Englezos et al. [
22] or the notion that hydrate formation was a heterogeneous process.
In particular, the work of Skovborg and Rasmussen [
31] disagreed that the values of
K* obtained by Englezoes et al. [
22] were the true intrinsic rate constant. Skovborg and Rasmussen [
31] examined the Englezos’ data and concluded that mass transfer from the gas phase to the bulk water phase was the rate limiting step. Specifically, Skovborg and Rasmussen [
31] noted that the model of Englezos et al. [
22] is extremely sensitive to the number of moles of hydrate former absorbed in the liquid, prior to hydrate formation. Under these assumptions, the fugacity difference is replaced with a mole fraction difference and the population balance is removed completely, as seen in Equation (24):
where
x is the liquid phase mole fraction,
A(g-L) is the gas-liquid surface area and
kL is the reaction rate constant. At roughly the same time as Skovborg and Rasmussen [
31], a handful of groups [
32,
33,
34,
35] modelled gas hydrate growth kinetics as a multi-step reaction-diffusion process. Of these four works, three of them [
33,
34,
35] were specific to the hydrate formation kinetics in the presence of liquid CO
2. In the reaction-diffusion approach, the rates of the reaction and the diffusion steps depend on either concentrations or concentration gradients, which results in a set of equations with multiple parameters. As an example of this class of models, the model of Lund et al. [
34] is presented in Equation (25). In addition to two adjustable parameters,
kf and
kd, application of Equation (25) also requires knowledge of the concentration of water in liquid CO
2, in the clathrate phase and in sea water. As a result of having multiple adjustable parameters and requiring values of concentrations that are not easily measured, this class of models has never seen wide-scale application in the gas hydrates community.
where
C is the concentration,
r is the net rate of reaction and
kf and
kd are formation and dissociation reaction rate constants. By the start of the new millennium, experimental instrumentation had developed to the point where it was now possible to measure hydrate particle size distributions during growth or dissociation. The first such formation experiments were those of Herri et al. [
36], whereas the first such dissociation experiments were those performed by Clarke and Bishnoi [
37,
38,
39]. The apparatus of Herri et al. [
36] used a turbidimetric sensor to monitor the attenuation of a beam of light after it had passed through gas hydrates suspended in water. From knowledge of the attenuation, Herri et al. [
36] were able to estimate the population density of particles with diameters from (10 to 150) μm. This was conceptually similar to what had been done by Parent and Bishnoi [
40]; however, they did not attempt to extract a population density function from their light scattering data. For their analysis, Herri et al. [
36] stated that they agreed with Skovborg and Rasmussen’s conclusion that the hydrate formation process was mass transfer limited; however, they also added that it was necessary to add a term to Skovborg and Rasmussen’s model [
31], to account for the particulate nature of the problem.
For their dissociation experiments, Clarke and Bishoi [
37,
38] modified the apparatus of Kim et al. [
26] by adding a continuously circulating sample stream that was connected to a high-pressure optical cell, which was housed inside of an external particle size analyser. The particle size analyser that was used by Clarke and Bishnoi [
37,
38] could only measure particle sizes down to 1 μm in diameter and could not distinguish gas bubbles from gas hydrates. Thus, reliable hydrate particle size distributions could only be measured immediately prior to the onset of dissociation. Once measured, the particle size distribution information was subsequently incorporated into the model of Kim et al. [
26] by use of the population balance.
Clarke and Bishnoi [
39] also addressed the dissociation of hydrates formed from gas mixtures of methane and ethane. Similar to the work of Englezos et al. [
22], Clarke and Bishnoi [
39] assumed that the rate of dissociation of a mixed hydrates is the sum of the dissociation rates of the individual components. This proved sufficient for mixtures of methane and ethane but was will later be shown, by Girlado and Clarke [
41], that it is insufficient for gas mixtures consisting of dissimilar molecules.
Shortly after Clarke and Bishnoi’s studies on dissociation kinetics, Kashchiev and Firoozabadi [
42], addressed the definition of the driving force for gas hydrate formation. In their formulation a chemical potential difference, also known as the supersaturation, was postulated as the driving force for hydrate crystal growth. The supersaturation, which is shown in Equation (7), is the difference in the chemical potential,
μ of the new phases (hydrate) minus the old phases dissolved gas + water). Kashchiev and Firoozabadi [
42] noted that the evaluation of Equation (26) will depend upon whether or not a state of chemical equilibrium has been achieved.
Following their earlier work, Clarke and Bishnoi [
37,
38,
39] gained the capability to make in situ measurements of gas hydrate particle sizes during formation [
43] and at the onset of dissociation [
44]. For both of the studies of Clarke and Bishnoi [
43,
44], the consumption, or production, of gas was correlated with the model of Englzos et al. [
22], or Kim et al. [
22], modified in a manner so as to incorporate the data from the in situ particle size analyser. The in situ particle size analyser was a Lasentec D600L and it allowed Clarke and Bishnoi to measure particle chord lengths as small as 0.5 μm. While this was still not sufficient to allow for direct observation of critical-sized nuclei, it did allow Clarke and Bishnoi [
43] to directly observe the presence of a large number of micron-sized bubbles. In later experiments with the same apparatus [
25,
41,
45,
46] the mixer was modified so as to significantly reduce the number of bubbles measured by the particle size analyzer.
The presence of background noise in the data of Clarke and Bishnoi [
43] was noted by Hashemi et al. [
47] who independently examined the data of Clarke and Bishnoi [
43]. Hashemi et al. [
47] suggested that the background noise was caused by foreign particles, which may be acting as nucleation sites. Thus, Hashemi et al. [
47] claimed that it is not possible to extract an intrinsic rate constant value from the data of Clarke and Bishnoi [
43]. Additionally, Hashemi et al. [
47] argued that because hydrate formation is an exothermic process there has to be a temperature gradient across the liquid-hydrate interface and thus, the driving force for hydrate formation should be in terms of two-phase equilibrium conditions, instead of three-phase equilibrium conditions (Equation (27)). The resulting system of equations, which can be found elsewhere [
46], resembled the model of Englezos et al. [
22] except with concentrations in place of fugacities.
A year later, another study from Servio’s group at McGill University [
48] measured propane hydrate formation kinetics with the aid of an externally connected zeta-sizer. The zeta-sizer was capable of measuring particle diameters from 0.6 nm to 6.0 μm and a mean diameter of 118 nm was observed at the onset of growth. The data was subsequently analyzed using a modified form of the model of Hashemi et al. [
47], which is seen in Equation (27). In Equation (26), the mole fractions are that of the hydrate former at two-phase liquid-vapour (
L-V) equilibrium conditions and at two-phase hydrate-vapour (
H-V) equilibrium conditions.
In 2012, Herri and Kwaterski [
24] adopted a non-equilibrium approach for modelling the formation kinetics of gas hydrates formed from gas mixtures. During the process of hydrate growth, it was assumed that hydrate particles were surrounded by a transition layer, in which solid changes to liquid, and a diffusion layer. In the resulting model, the mole fraction gradient across the transition layer is the driving force for hydrate growth. As a result of the postulated mechanism, the linear growth rate and the hydrate composition are both strong functions of the intrinsic rate constant, except in cases where hydrate growth is known to be diffusion limited. This contrasts with the approach taken by Englezos et al. [
23] in which the overall rate of each is the direct sum of the constituent rates.
Giraldo et al. [
25] also questioned Englezos’ [
23] assumption that the rate of formation of a mixed hydrate is the direct sum of the constituent rates; however, their approach was quite different to that adopted by Herri and Kwaterski [
24]. Rather than postulating a completely new mechanism, Giraldo et al. [
25] proposed that the overall rate of formation is equal to the weighted sum of constituent rates and that the weights could be given as the ratio of the stoichiometric coefficient of component
j to that of a reference component. Due to the stoichiometry, the resulting model had the advantage that it only required knowledge of the rate constant of the reference component and it also reduced the number of ordinary differential equations that would have had to be solved with Englezos’ model [
23]. When applied to systems of CH
4 + CO
2, the model was seen to be in fair agreement with the experimental data.
Following the early studies on hydrate kinetics in the presence of ice [
18,
19], ice-gas-hydrate systems were not studied again until 2020. Zhao et al. [
49] used XCT to monitor the formation of xenon gas hydrates on the surface of a sphere of ice. It was observed that the hyrate layer that was formed on the outside of the ice sphere was porous, as well as that the diffusivity of xenon in the hydrate layer was observed to change with time. Unlike previous kinetic studies of ice-hydrate-gas systems [
18,
19], Zhao et al. [
49] also proposed a kinetic model. The kinetic model was based on a shrinking core model in which the concentration difference is the driving force. This model can be explicitly arranged to for the rate constant of hydrate formation,
kr, as seen in Equation (28):
Over the course of approximately the last 50 years, experimental capabilities and theoretical understandings of the kinetics of gas hydrates formation and dissociation have evolved tremendously. The scale at which the phenomena can be observed has shrunk from the visual range, in the 1980s, to the micron range, in the early 2000s, to the nano-meter range, in the 2010s. Along with this change of scale of observations, the idea of the driving force has also changed. As can be seen in
Table 4, there have been more than a half-dozen different driving forces proposed for gas hydrate growth kinetics. On the other hand, there have been relatively few attempts at quantifying the kinetics of hydrate dissociation, all of which are at least 15 years in the past. The relatively small amount of attention that has been paid to dissociation kinetics should not be taken as a sign that it is less important than the formation kinetics. Nor should it be taken as a sign that the phenomenon is perfectly understood. Rather, it is most likely that dissociation has not been extensively studied because it requires additional equipment beyond that which is required for formation kinetics.
While there have been many different interpretations of the driving force for gas hydrate formation, all of the intrinsic kinetic models, except for [
47,
48], define the driving force relative to a three-phase equilibrium condition. However, as noted in the previous sections, it is unlikely that the chemical potential of water on the surface of the hydrate is exactly equal to the chemical potential at the three-phase equilibrium conditions. Thus, the actual driving hydrate growth and for hydrate dissociation is expected to be smaller than that predicted by the models that were reviewed in this section, although it is not clear at the present moment if the difference between the actual driving force and the driving force based on the three-phase conditions is significant.
In addition to the aforementioned uncertainties in the driving force for formation and dissociation, the reviewed intrinsic kinetic models present nucleation in a very simplified form and they also neglect particle agglomeration and breakage. Since the time of Englezos’ pioneering works the understanding of crystallization has, however, increased significantly. Wohlgemuth and Schembecker [
50] noted that in a crystallizing system, the change in the total particle is the sum of simultaneous changes in particle counts due to nucleation, growth, agglomeration and breakage. Thus, it is not possible to de-couple the four processes, as has been done in the intrinsic hydrate kinetic models. Additionally, each of the four processes consists of several sub-mechanisms.
In particular, Wohlgemuth and Schembecker [
50] noted that the change in particle numbers due to nucleation consists of contributions from primary, secondary and induced nucleation. Primary and secondary nucleation are well known and they will be discussed further in a later section. Induced nucleation, on the other hand, can be due to bubbles acting as nucleation sites [
51]. This is especially relevant in the context of gas hydrate formation, given the presence of dissolved gases. Clarke and Bishnoi [
43] even noted that the non-zero base-line reading, for particle size analysis, was likely due to the presence of gas bubbles, although they [
43] did not speculate that the bubbles could be inducing nucleation.
7. Discussion
Huge experimental and theoretical efforts have been put into development of understanding the kinetics of hydrate formation and dissociation during the last five decades. Many models have been developed and are in current use in industrial flow simulators and pipeline flow models, as well as in reservoir modeling of hydrate phase transitions. We have made a review of some of these to indicate a trend. We do not claim to have captured all significant contributions.
During the same five decades, there has been a huge development in computational resources and the way modern software can even use the powers of graphical cards for molecular dynamics simulations and other types of numerical modeling. Parallel to this, the development of models for molecular interactions has moved rapidly forward. Numerical algorithms have improved, and many properties that seemed impossible to calculate five decades ago are now a reality through combinations of quantum mechanics, classical statistical mechanics and simulations.
In this work we have illustrated some possible directions forward in moving from fugacity-dominated models over to models based on classical thermodynamics and the use of results from Molecular Dynamics (MD) simulations to arrive at a model scheme with a uniform reference state for all components in all phases. Residual thermodynamics is the natural choice for hydrocarbon systems, but MD modeling has also made this into a feasible choice for water phases (ice, liquid water, water in empty clathrate). Unlike the reference method that treats the difference in chemical potential for water in liquid (or ice) state and empty clathrate, the use of residual thermodynamics results in calculated phases that can be directly compared for stability, and new routes to hydrate formation can be explored. As a consequence, we are now able to compare stabilities of various hydrates that form in real situations. Deliberately we have used a single hydrate former as example so as to make it simple to follow, and CH4 hydrate is likely the hydrate former that has been most extensively studies in modern times. The same approach has been used on numerous mixtures that covers both structure I and structure II, as can be found in the references.
For systems that can reach thermodynamic equilibrium it is trivial to solve for same temperatures and pressures in all phases and then solve for equal chemical potentials of all components in all phases in combination with mass balances, such as what would be called a multiphase “Flash” calculation.
However, as we have discussed here, there are too many phases in natural gas hydrate systems. These include also mineral surfaces and adsorption. According to the first and second laws of thermodynamics, the equilibrium equations are replaced by:
Under the constraints of mass and heat transport. A constrained version of the first law also follows from the combined law as:
Minimization of (48) under constraints of (49) gives the most likely distribution of phases and associated compositions. It does not imply that the resulting phases are unconditionally stable. For this to be the case then the additional constraints must be also be fulfilled:
for any possible range of changes of an independent variable
L. One of many examples here is that hydrate may form due to
T and
P being inside a hydrate formation region but it may also dissociate again because another independent variable, such as concentration of methane in surrounding water, is too low for hydrate to remain stable. This example is seen all over the world in the form of hydrate mounds on top of leaking hydrocarbon sources.
A reworked version of Classical Nucleation theory actually predicts induction times without any empirical parameters at all. This opens up for a simple modeling tool which is numerically fast enough for implementation in flow modeling. There are many possible directions for this, as briefly mentioned in the previous section. Toru Sato and his group have used Computational Fluid Dynamics [
99,
100] for various applications related to hydrate dissociation and leakage from reservoirs. The same group also utilized Boltzmann flow combined with simplified models for hydrate phase transition kinetics to simulate sediment blocks containing hydrate in model pore structures constructed from fundamental measurements [
101,
102]. The list of examples on the use of flow modeling and hydrate phase transition models is very long and far too extensive to include here. However, the message is that the CNT model with classical thermodynamics is very feasible and can address more hydrate phase transitions, and corresponding kinetics, than what has been common up to now.
A recent interesting work on experimental measurements of nucleation rates by Maeda [
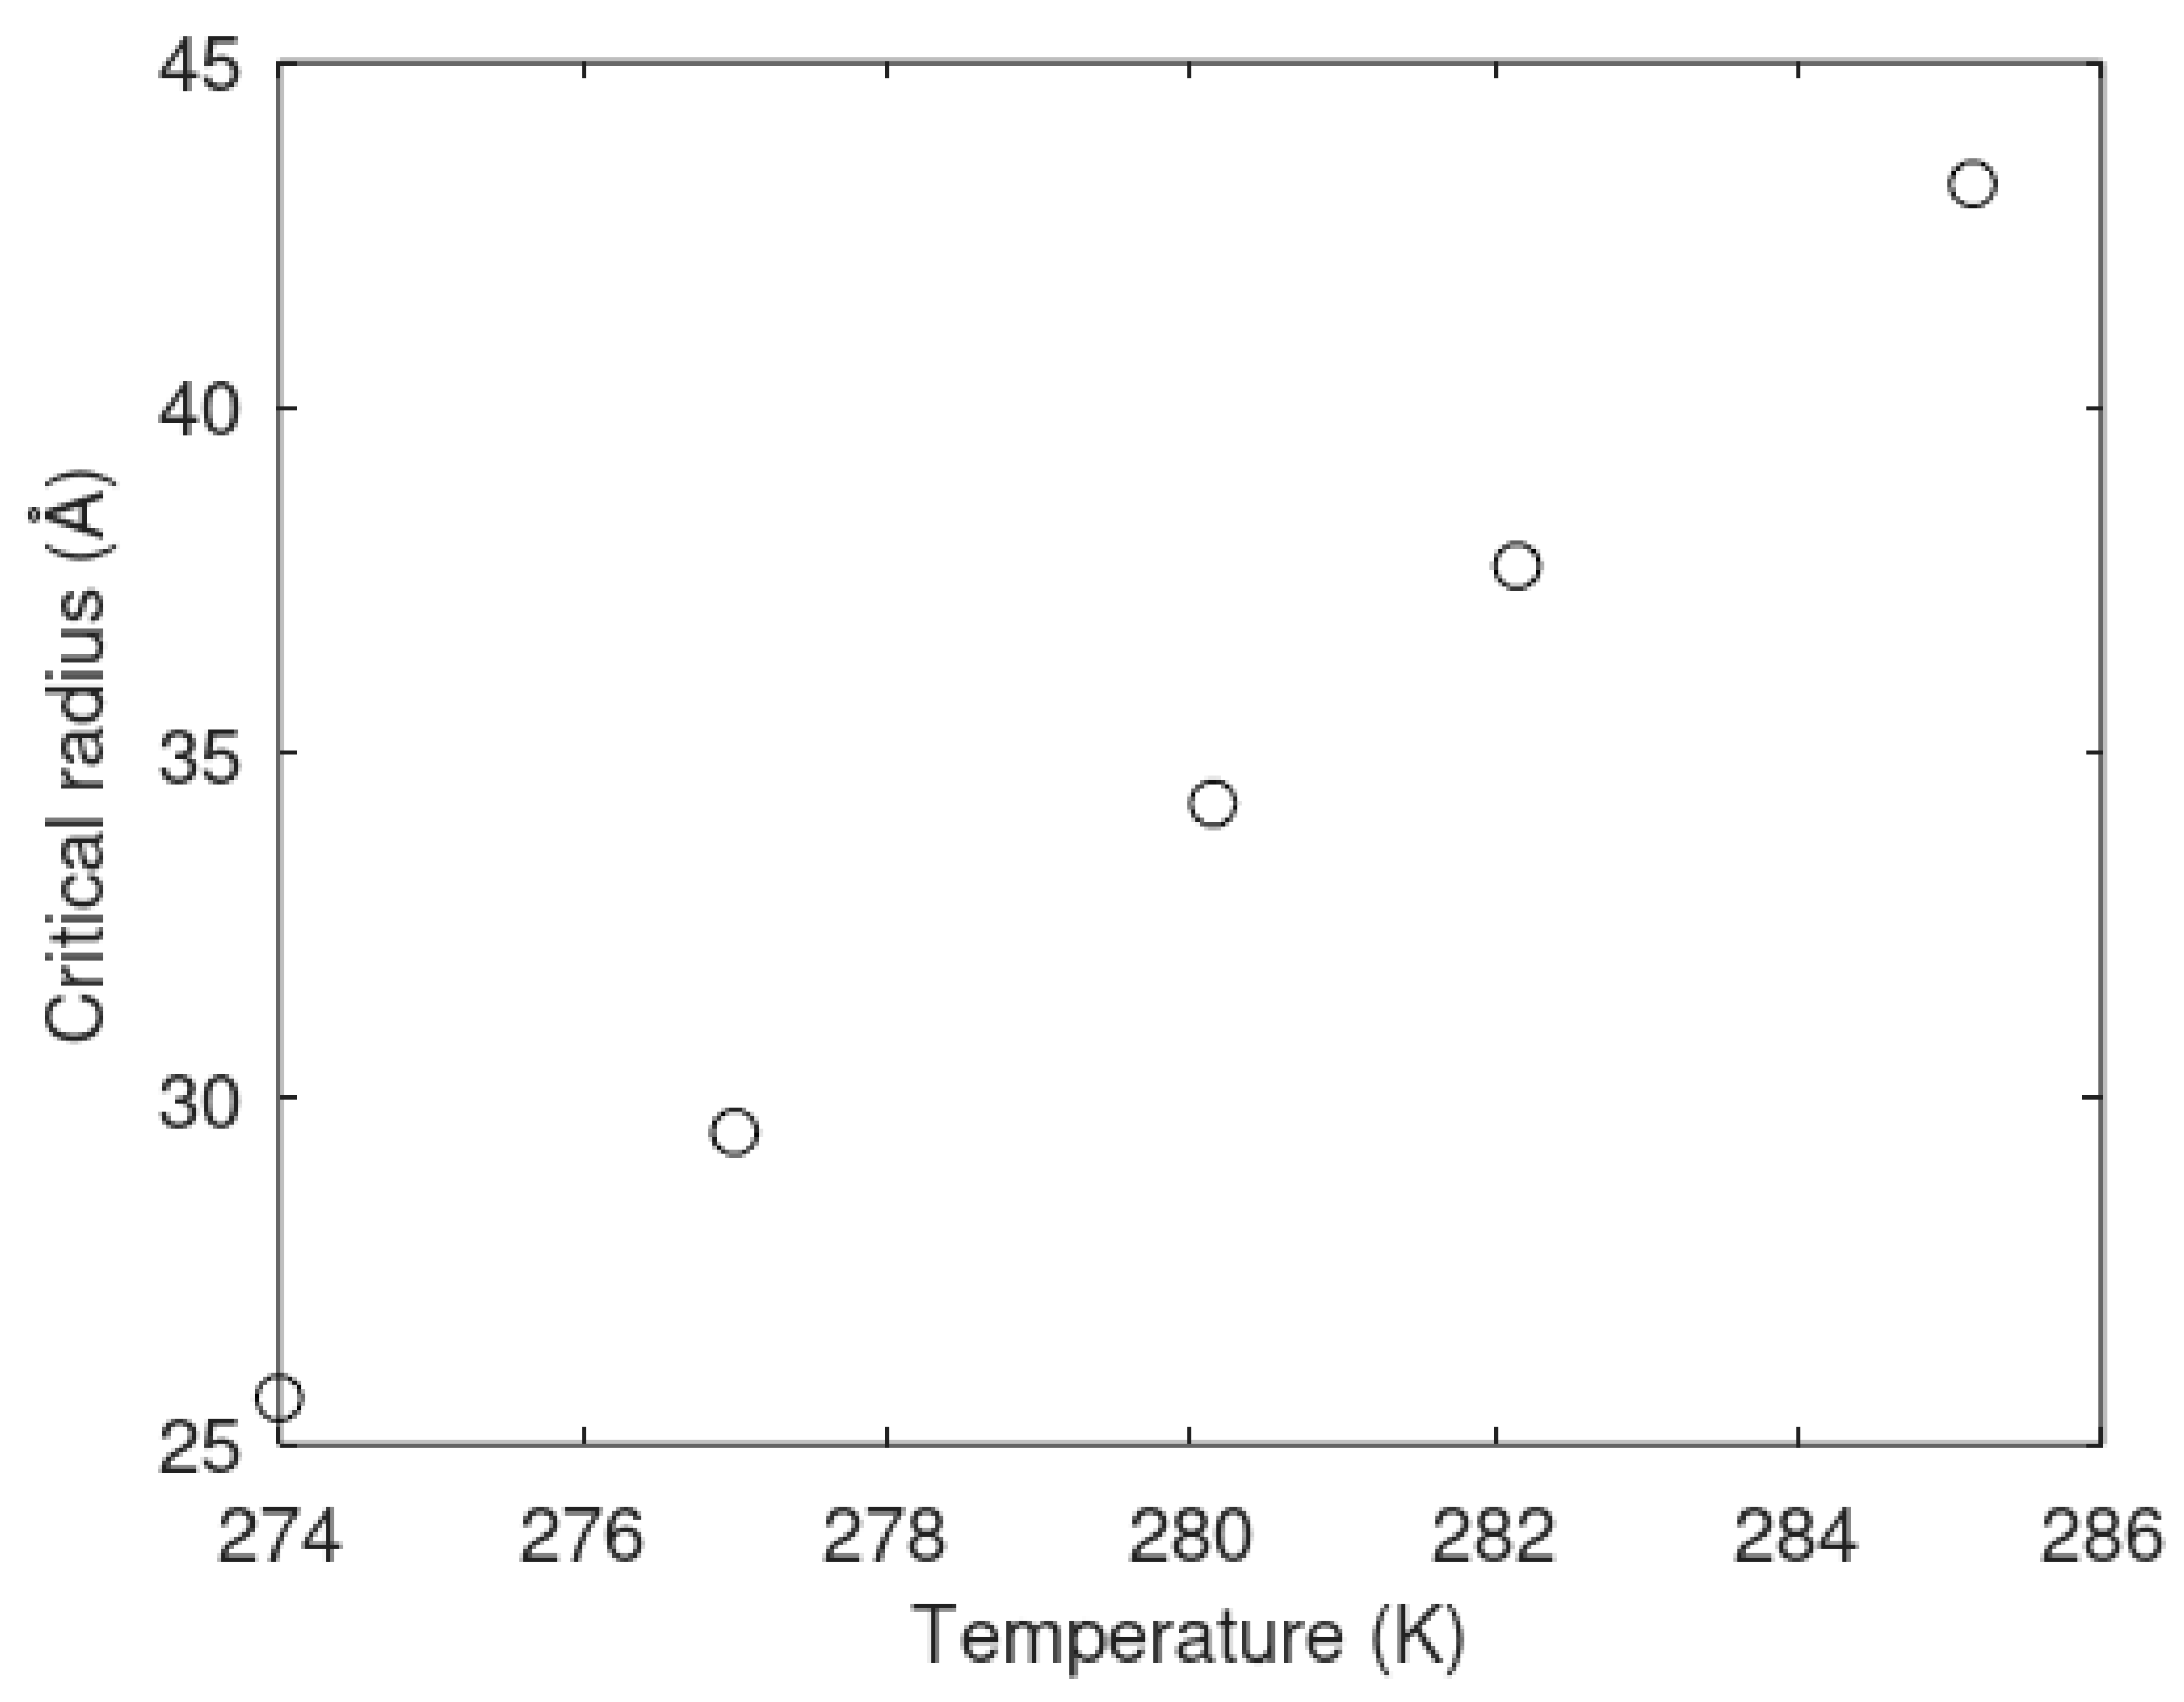
103] is definitely a very valuable contribution to the progress in understanding hydrate nucleation better. A challenge in the interpretation of the results is that the critical radius of the hydrate cannot be measured. As such it is not clear how much of the observations are related to particles in a stable growth phase. As mentioned in
Section 5, we have also undertaken efforts in modeling heterogeneous hydrate nucleation using a 2D adsorption model for selective surface adsorption, and kinetic gas theory for associated flux for gas supply to the water surface. Kinetic rates of gas supply, and average adsorption appeared to be very fast compared to the limitations of mass transport across liquid water/hydrate interface. Another challenge in interpretation of the experimental data from Maeda is the selective adsorption of propane and methane on the water. Propane will dominate the initial adsorption and also dominate first hydrates. It is therefore expected that there will be a high degree of non-uniform hydrate formation. In a more recent paper, Maeda and Shen [
104] discuss various scaling laws for hydrate induction times. One of the challenges with these experiments relative to real pipelines is the impact of solid surfaces on hydrate nucleation. Rusty pipelines act in one way as providing hydrate nucleation sites dues to the structuring effect on water [
6,
52,
53,
54,
56,
57,
58,
76,
87,
88,
89,
90,
91]. However, hydrate can never stick to the mineral surfaces and hydrate will either be bridged to the mineral surfaces by structured water, or release and grow elsewhere. Stainless steel is neutral to water.
There is also a very interesting modeling paper on hydrate nucleation from Kashiev and Firoozobadi [
105]. There are three important differences from the nucleation calculation conducted in this work. The first difference is in the thermodynamic description of the phase transition. The use of classical thermodynamics rather than fugacity based thermodynamics is that also the ideal gas term reflects component differences, and the total free energy change due to hydrate formation will include changes in both water and hydrate formers. This is in contrast to the formulation of Kashiev and Firoozobadi [
105] in their equation numbers (2) and (8). The use of residual thermodynamics for all phases makes it transparent to compare free energies of different hydrate phasesIn a non-equilibrium system, chemical potentials for hydrate formers from different phases (gas, water solution, adsorbed on mineral surfaces) are different. This has also been experimentally verified, as discussed by Sloan [
106] during a hydrate workshop in New Zealand. He presented experimental measurements of two methane hydrates in the same system of water and methane. The first hydrate was measured from the gas side and down while the other hydrate was measured from water side and up. The two hydrates had different compositions. Examples of the same here can be found in
Figure 7,
Figure 8 and
Figure 9. Different compositions arise from different guest chemical potentials in the different phases that results in different cavity canonical partition functions. As also discussed in this work, there is a significant difference between interface free energy and interfacial tension. It is also unclear what they [
105] mean by specific surface energy. There are many other differences as well, such as the use of the geometrical shapes of the different hydrate particles on the water/gas interface. Our experiences during three decades of hydrate modeling using nano-scale methods (mainly Molecular Dynamics simulations) and meso-scale methods (Phase Field Theory) shows that water will cover surface particles (
Figure 1c) in [
105]) on all sides due to capillary forces and strong water hydrogen bonds. A follow-up paper on induction times [
107] contains several assumptions and model approximations that make it hard to relate it to physics. We do not know if their [
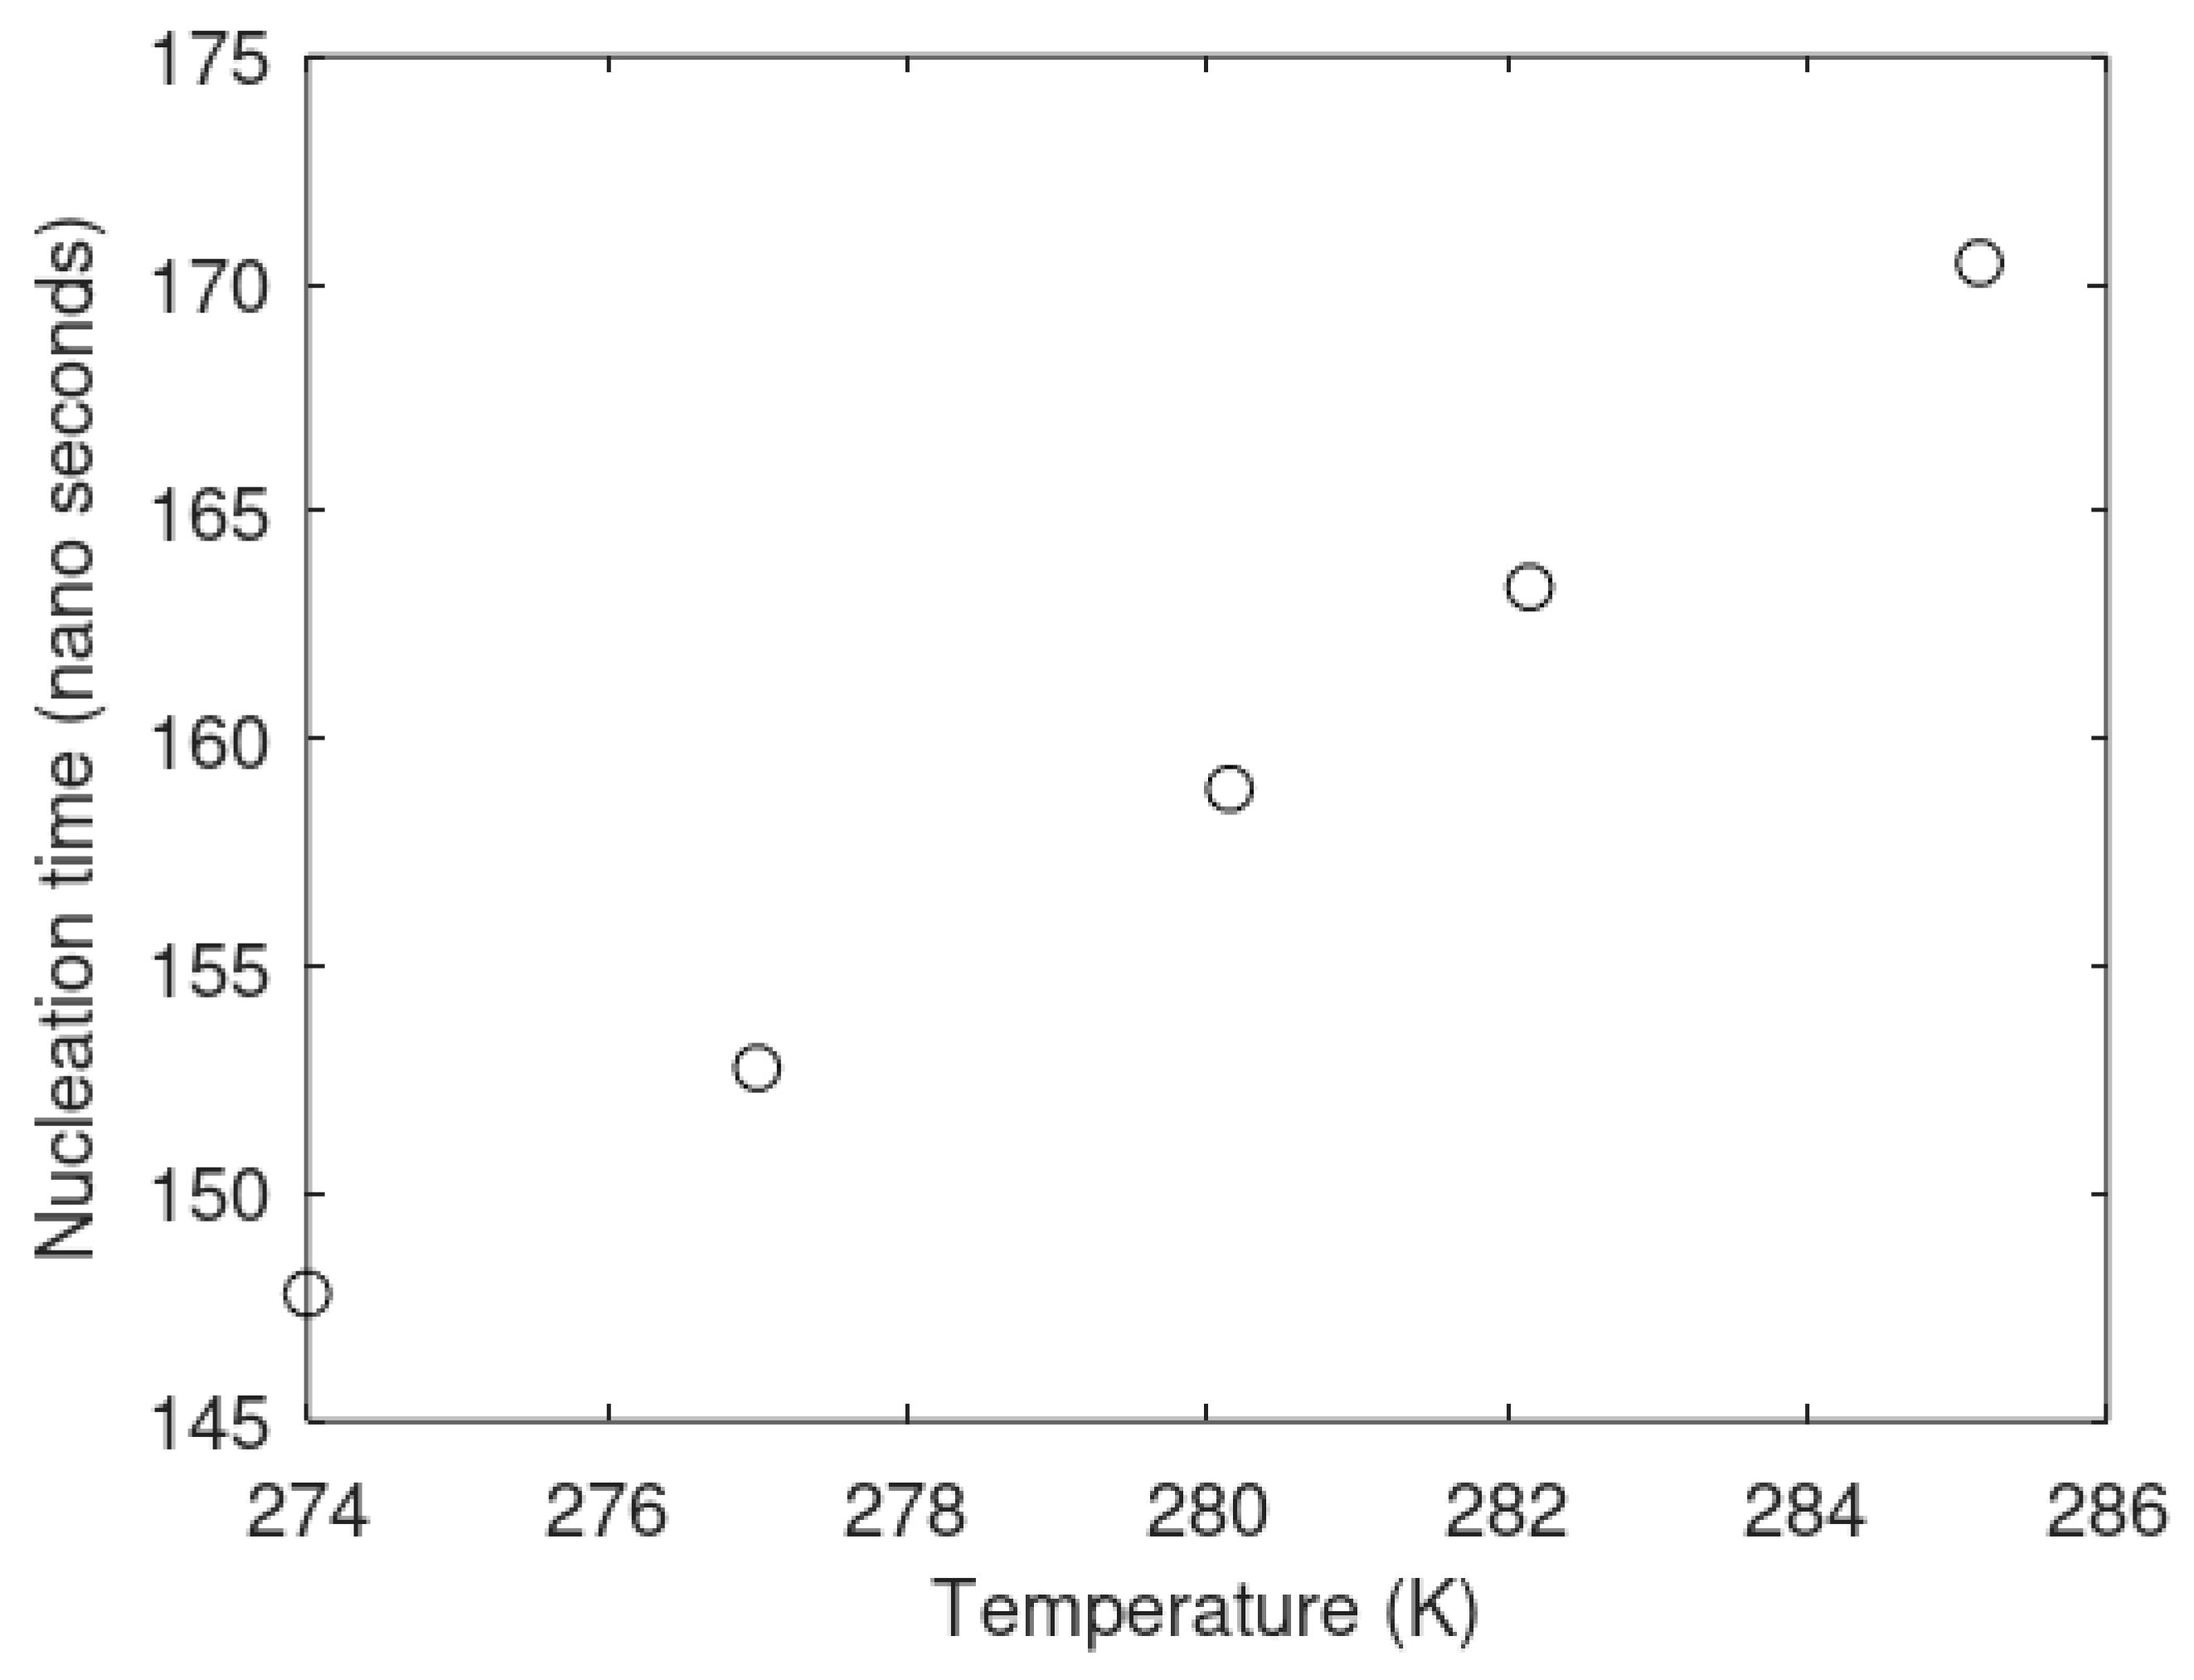
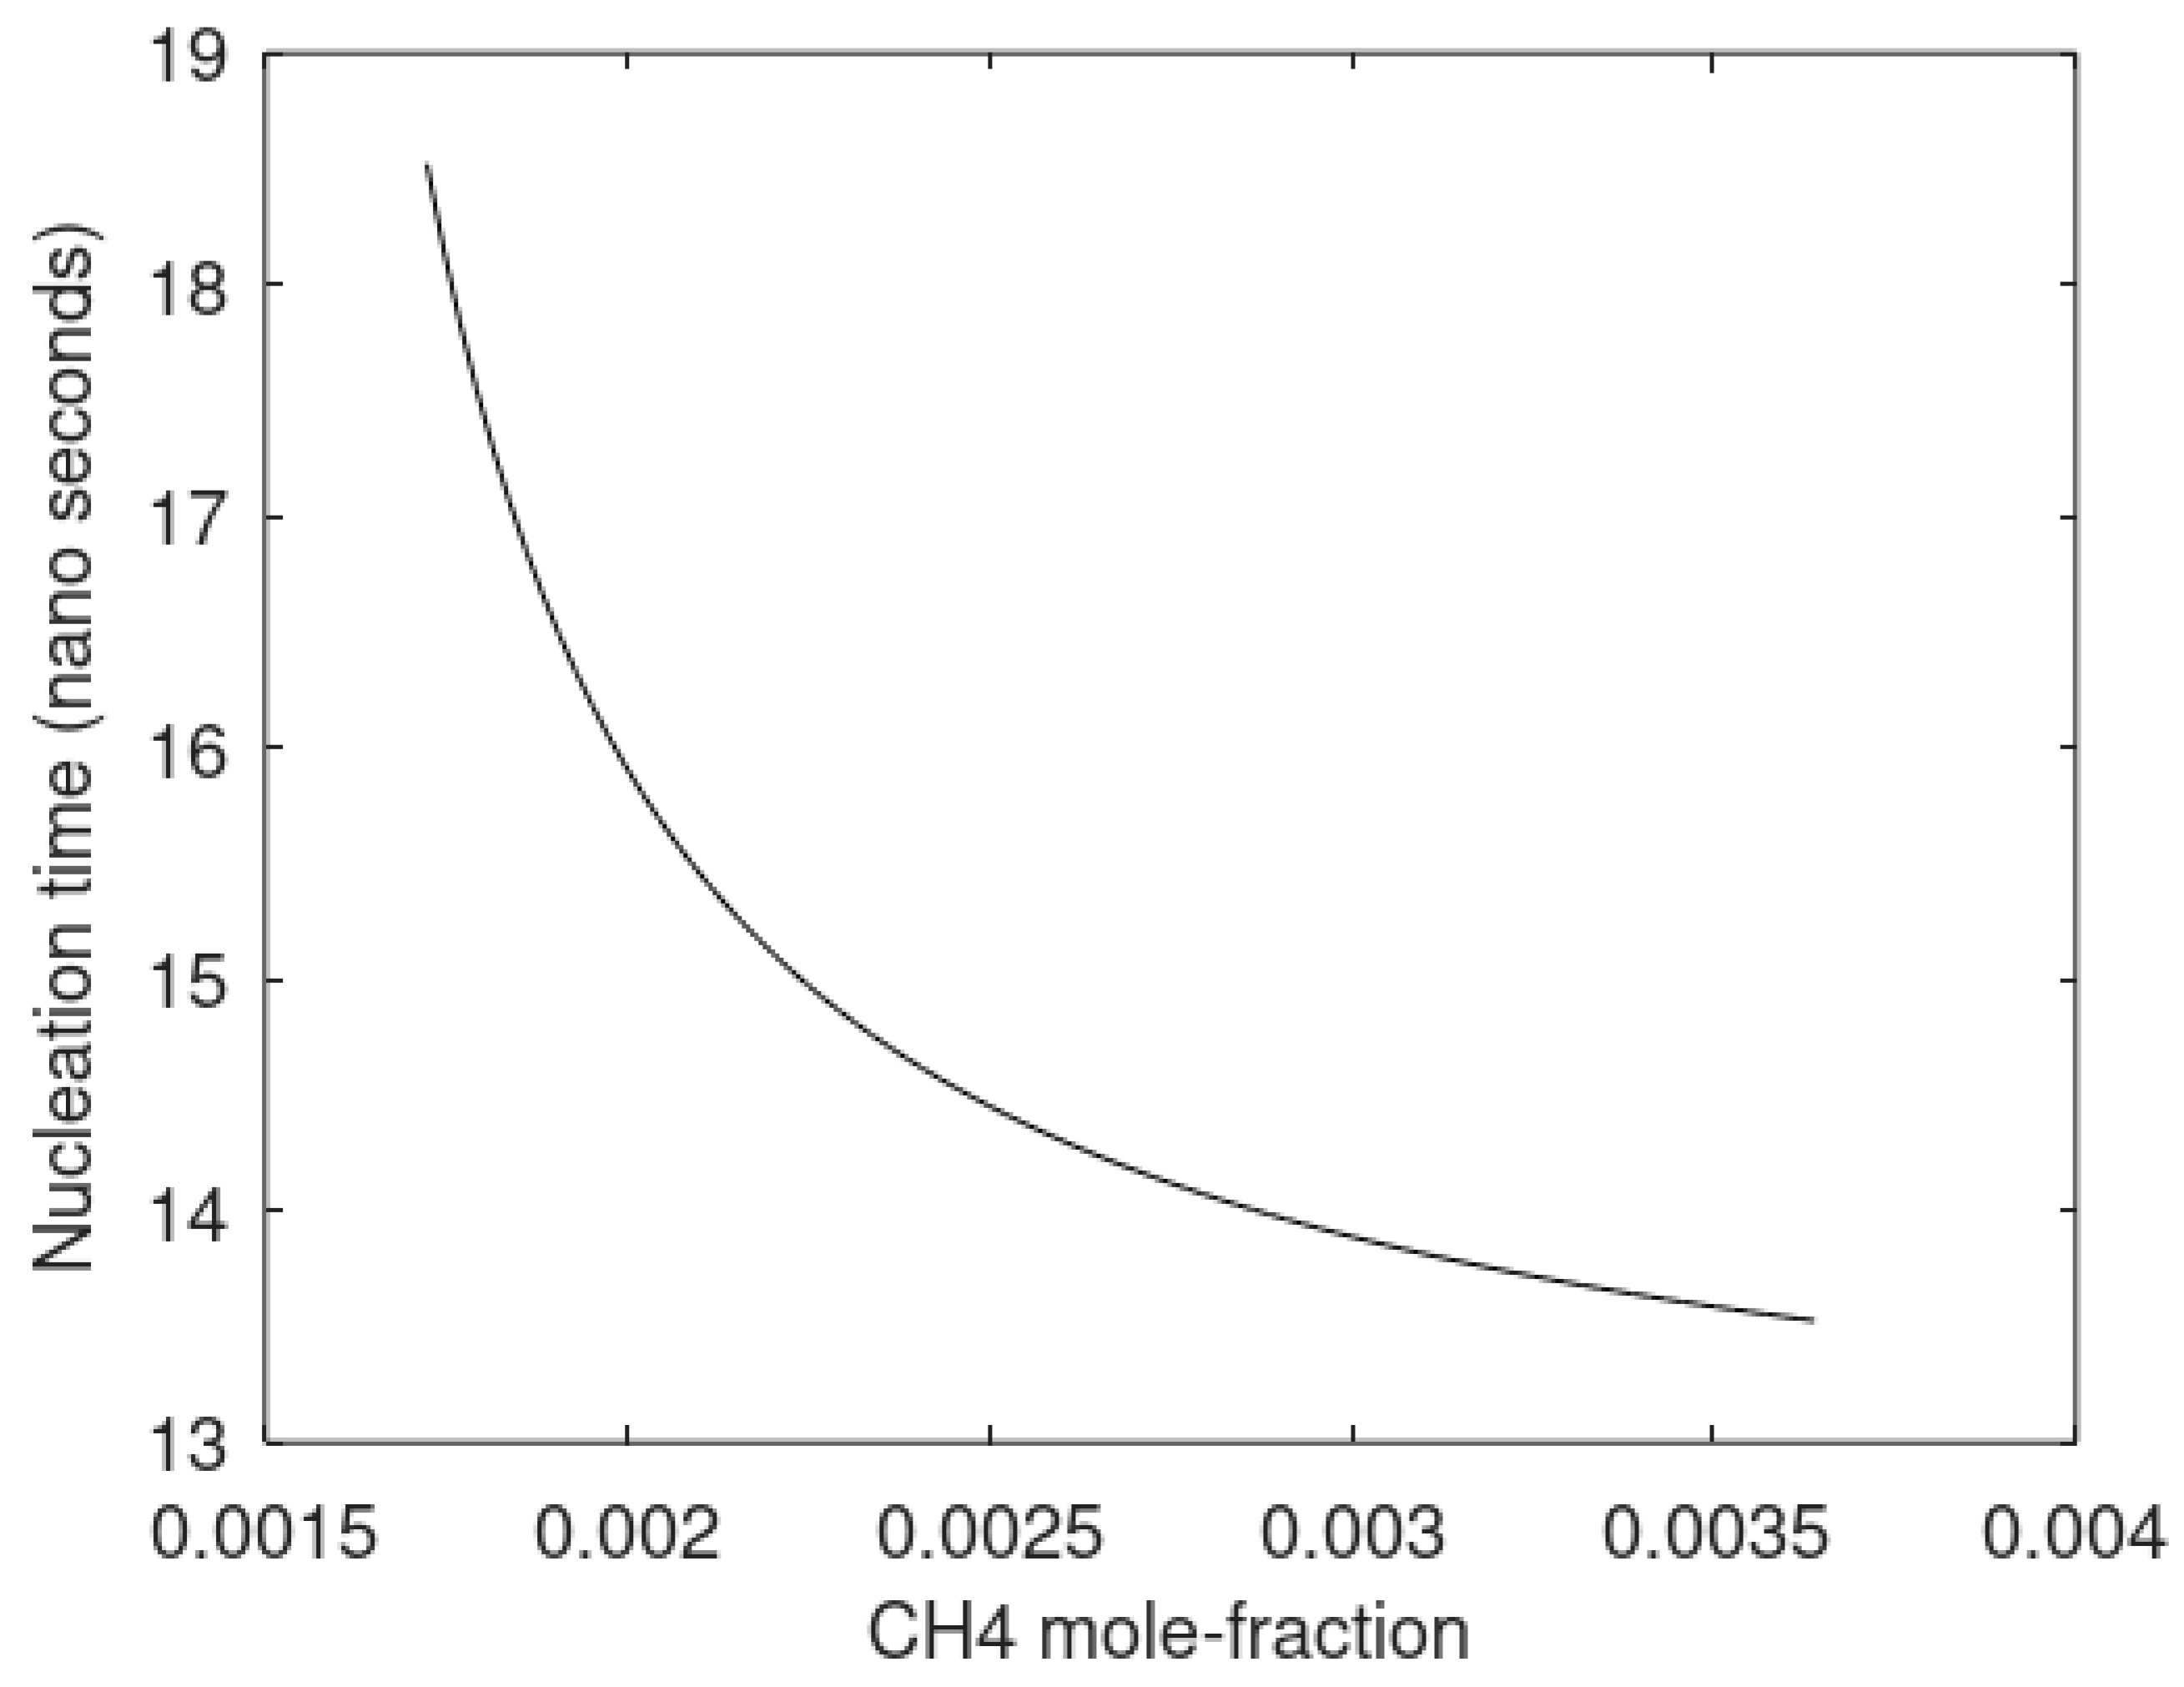
107] results can be extrapolated. Nucleation times are extremely rapid (nano-seconds) and rapidly build up mass transport barriers between liquid water and hydrate former phases. The predictions that we have presented here are reasonable. Hydrodynamic shear forces will break hydrate films and create new hydrate films which, in summary, increases hydrate in the system with time as function of hydrodynamics. Added surfactants reduce interface hydrate blocking films but also increase interface thickness and can increase hydrate formation rates due to faster transport of hydrate formers into liquid side of liquid water interface [
5,
108,
109,
110]. In summary, these are just two examples in which it is possible to work on the physics of the hydrate system and extend the models presented here also over to hydrodynamic systems.
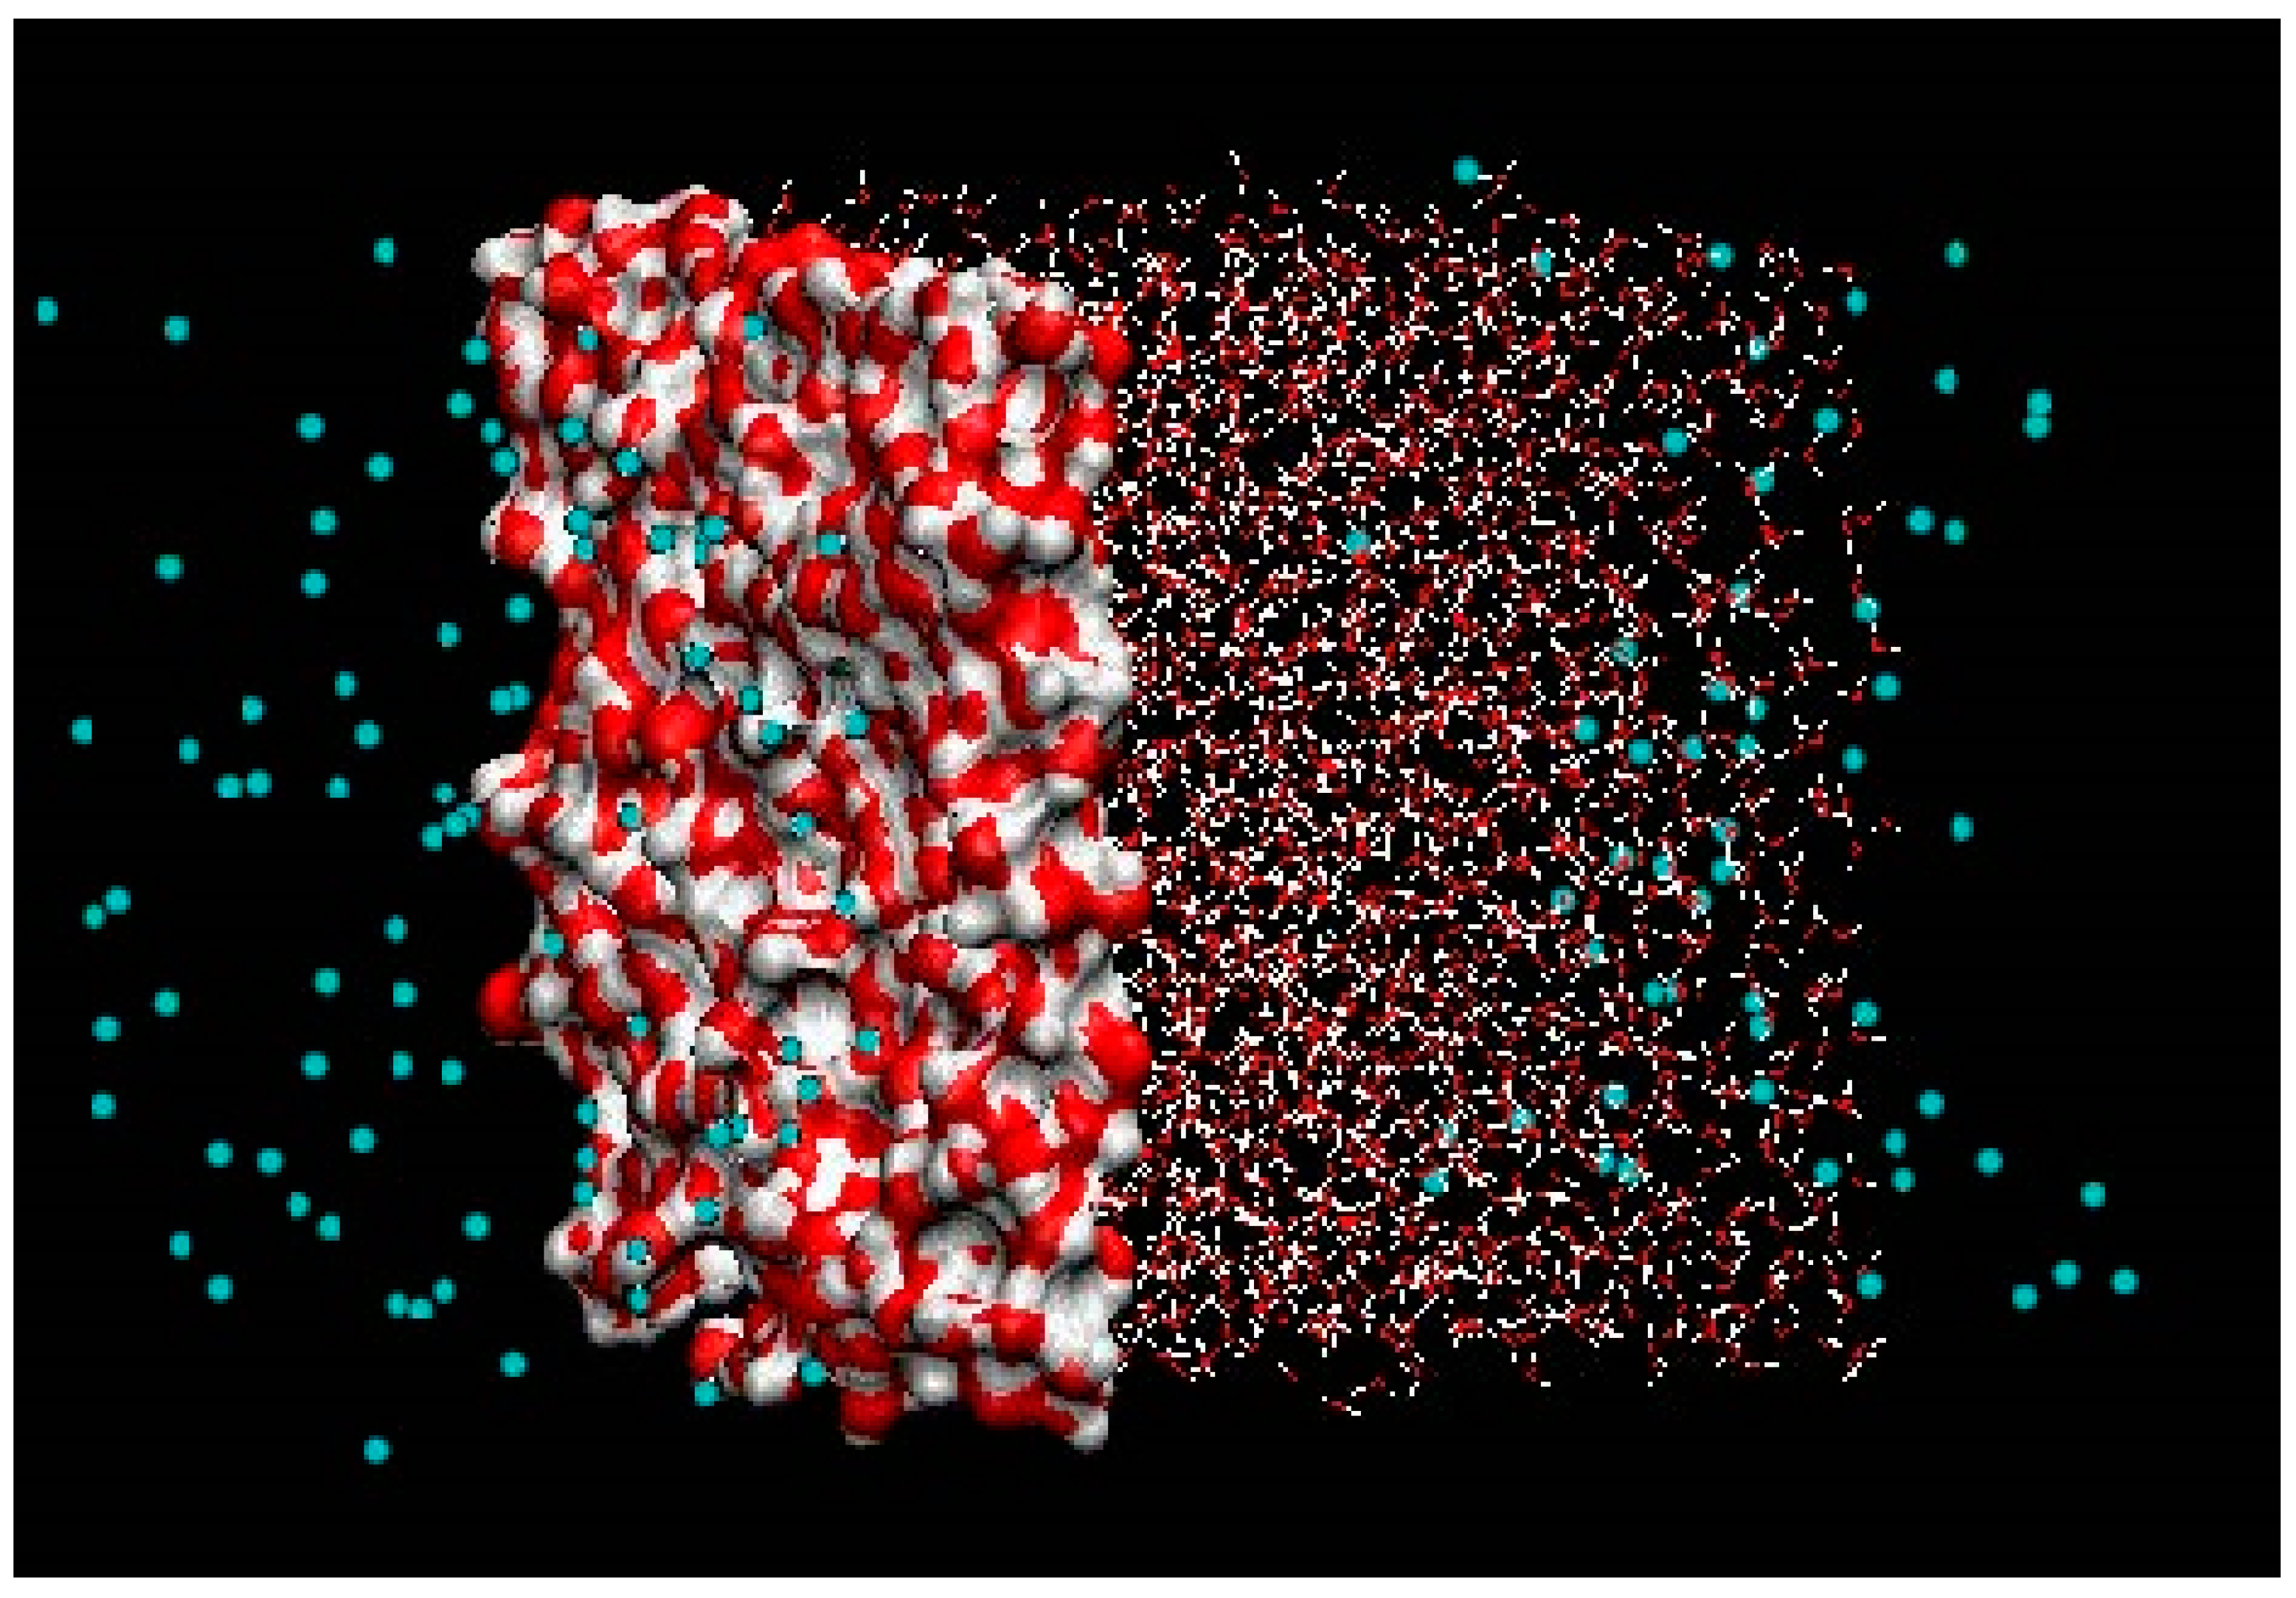
Even if we have made approximate calculations of adsorption and associated and found that it was not at all kinetically limiting relative to mass transport limitations at water/hydrate interface we also need to discuss the dynamics of liquid water interfaces. There are no stationary flat surfaces with well-defined nucleation sites. Liquid water is highly dynamic and the capillary waves detach clusters of water, which subsequently reside back to the liquid water, and the resulting average capillary waves are just one of the aspects that make it hard to define nucleation sites. It is more a dynamic situation that supplies the liquid water side of the interface with supersaturation of hydrate formers that distribute dynamically in time and space. In
Figure 27 below we show a snapshot from a Molecular Dynamics (MD) study of methane and water at 275 K and 65 bar pressure using TIP4P [
4] for water and the same methane model [
111] that we have utilized in our thermodynamic calculations [
112]. The white atoms are oxygen and the red are hydrogen. The simulation system is a rectangular box with a liquid water slab embedded inside methane on all sides with periodic boundary conditions in all dimensions. The surface water contours are drawn in actual molecular scale while the rest are “pin and ball” representations. Both sides of the water slab illustrate some of the dynamics. The left one illustrates an average surface shape for a snapshot, while the right one illustrates the liquid water gas dynamics and distribution of water and methane across the dynamic interface. This is just a snapshot of a whole movie that illustrates even more how irregular and dynamic the system is. Removing all the dynamics and creating artificial flat surfaces with adsorption sites does not give any justice to the real system. The computational details of this example are of no interest in the context of this paper and would enhance the size of this paper far beyond what is reasonable. There are 2500 TIP4P water and 144 methane molecules with a system size 42Å x42Å x82Å. NPT-dynamics with Nosé-Hoover thermostat and thermostat masses according to Kuznetsova and Kvamme [
112,
113,
114]. What is important, on the other hand, is how these simulations are used in our modeling. Equation (31) provides the relationship between interface free energy and interfacial tension. Interface free energy is the relevant and correct quantity involved in phase transition penalty terms. Interfacial tension is related to interface stress in hydrodynamics. It is unclear what interface energy means in the context of references [
105,
107]. It seems at best unprecise in thermodynamic terms but if it is only an interface energy then it is even less optimal than using interfacial tensions, since the entropy contribution to the interface dynamics is absolutely critical. It is quite clear from the snapshot in
Figure 27 that there is no well-defined adsorprion or nucleation area, and it is most likely that the nucleation happens inside the liquid side of the interface [
62,
63,
64,
65,
66,
67,
68], which makes the definition of nucleation sites even more diffuse.
Capillary wave theory can be expressed [
116,
117] by:
is in this context interface free energy (and not to be confused with activity coefficients that are also using the same symbol).
is related to fluctuations in capillary height (see Equation (54).
lu and
ll are the upper and lower wavelengths. G is the gravity constant and
is density. Subscripts I and II. denote the two phases.
kB is Boltzmann’s constant. A first order approximation to Equations (51) and (52) can be written as:
Equations (53) and (54) can be solved for the interface free energy. The capillary wave was included here to indicate that Molecular Dynamics simulations are also needed for this part of nucleation modelling.
