Article

Evaluating the Effect of Demand Response Programs (DRPs) on Robust Optimal Sizing of Islanded Microgrids

by
Mahdi Karami Darabi
1,
Hamed Ganjeh Ganjehlou
1,
Amirreza Jafari
2,
Morteza Nazari-Heris
3,*,
Gevork B. Gharehpetian
1 and
Mehrdad Abedi
1
1
Department of Electical Engineering, Amirkabir University of Technology, Tehran 15914, Iran
2
Faculty of Electrical and Computer Engineering, University of Tabriz, Tabriz 51666, Iran
3
Department of Architectural Engineering, Pennsylvania State University, University Park, PA 16802, USA
*
Author to whom correspondence should be addressed.
Energies 2021, 14(18), 5750; https://doi.org/10.3390/en14185750
Submission received: 14 July 2021 / Revised: 30 August 2021 / Accepted: 6 September 2021 / Published: 13 September 2021
(This article belongs to the Special Issue Frontier (2021): Process Engineering and Control Systems)

Abstract

:
A microgrid is a small-scale energy system with its own generation and storage facilities and energy management system, which includes shiftable and traditional loads. The purpose of this research is to determine the size of the microgrid through (i) investigating the effect of a shiftable demand response program (DRP) on sizing of an islanded microgrid and (ii) studying the uncertainty of power output of renewable energy sources by applying the robust optimization (RO) method. Since the RO method solves the problem for lower power outputs of renewable energy sources (RES) than the predicted values, the results obtained are pessimistic and will increase the project cost. To deal with the increment of project cost, the application of a load shifting DRP is proposed to reduce the cost. In addition, DRPs are suitable means to reduce the effects of uncertain power sources. Therefore, it is shown that a shiftable DRP is effective in reducing the overall project cost and the dependency on energy storage systems by defining different scenarios and simulating them with General Algebraic Modeling System (GAMS) software. Moreover, it is indicated that the shiftable DRP and battery state of charge have correlations with solar irradiance and wind speed, respectively.

1. Introduction

Microgrid refers to a small-scale power system with independent energy management process consisting of shiftable and conventional loads, energy sources, and energy storage devices [1,2]. Since microgrids include shiftable loads, they have the potential to implement demand response programs (DRPs) to balance the load of the system [3,4]. Diverse types of DRPs are implemented on microgrids with the aim of peak shaving, load balancing, matching load level with generation capacity, and cost optimization [5]. DRPs are defined by the US Department of Energy as “a tariff or program established to motivate changes in electric use by end-user consumers, in response to changes in the electricity price over time, or to give incentive payments designed to induce lower electricity use at times of high market prices or when grid reliability is jeopardized” [6]. Due to the flexibility of microgrids to implement DRPs and variety of energy sources, the optimal allocation and sizing problems are considered as the crucial challenges. In addition, the presence of renewable energy sources (RESs) and following operational uncertainties have posed sophisticated planning and sizing difficulties [7,8], which must be taken into account at the design level; otherwise, the system will not operate properly. As a result, the optimal sizing problem requires effective methods with the capability of administrating the system’s uncertainty.
This issue has been investigated in the literature, and different strategies have been presented to determine the various aspects of the problem. First, several studies that have presented new heuristic sizing methods are mentioned. In [9], a heuristic optimization method called discrete harmony search algorithm was implemented to manage a hybrid energy system consisting of photovoltaic panels (PV), wind turbines, batteries, and diesel generators. Reference [10] utilized metaheuristic algorithms (simulated annealing (SA) and Tabu search (TS)) for solving the optimal configuration problem. Another heuristic algorithm named modified particle swarm optimization (MPSO) was implemented for optimal sizing of the hybrid energy system [11]. In [12], the optimal allocation of a grid-connected hybrid microgrid was considered and a new two stage constraint-based iterative search algorithm implemented. In the first stage, the RESs optimization was performed, and in the second stage the optimal battery capacity was obtained. Reference [13] implemented the social network optimization (SNO) algorithm for the optimal training of rule-based management strategies, to be implemented in the controller of hybrid off-grid microgrids. A two-loop bi-level hybrid algorithm consisting of a combination of several heuristic methods was implemented in [14], for optimal allocation of switch capacitors and reactive power management of distribution networks and microgrids. In [15], a hybrid PV/wind/diesel microgrid with the energy storage devices was optimally allocated by using the multiobjective self-adaptive differential evolutionary algorithm. In addition, a novel hybrid method with a combination of the wild goat algorithm (WGA) and exchange market algorithm (EMA) for dynamic reconfiguration of networks and microgrids with parallel processing capability was proposed in [16]. Reference [17] proposes a novel technoeconomic multilevel optimization method and modern time varying price model for sizing and planning of home microgrids in a coalition system, with the aim of minimizing energy cost.
There are several software systems related to microgrids optimization and energy management. HOMER (UL, Boulder, Colorado, USA) software is one of the main toolboxes utilized to manage and optimize energy systems such as microgrids. This software was used in [18] for optimal allocation and sizing of the microgrid equipment. In addition, in [19] the technoeconomic optimal sizing of a standalone microgrid was performed by the HOMER and GAMS software. Some studies implemented deterministic and mathematical approaches instead of heuristic methods. In [20], a novel direct deterministic optimization algorithm was utilized for optimal sizing a standalone hybrid wind/PV/diesel energy system. The authors in [21] introduced an optimization approach for microgrid planning, based on mixed-integer programming (MIP) to optimize the benefit of the microgrids while minimizing the risk in profit. In [22], the optimal sizing of an autonomous hybrid PV/wind system was determined by using a new deterministic approach based on the definition of a levelized cost of energy and loss of power supply probability concept. A two-layer predictive management strategy based on mixed integer linear programming (MILP) for an off-grid hybrid microgrid was presented in [23]. In this study, the upper layer manages the unit commitment, while the second layer regulates real-time operation.
Selecting the effective and appropriate objective function for the optimal sizing and allocation of the microgrids is the other significant challenge that must be carefully considered. In [10], the objective function for the sizing problem is to minimize the total energy costs of the microgrid. Minimization of the cost of energy and loss of power supply probability and maximization of the RESs penetration are the objective functions of the optimal allocation of hybrid microgrid [15]. In [22], the aim of microgrid sizing is to achieve a minimum investment cost and to enumerate the reliability indices. A novel smart strategy for energy trading and optimal sizing of islanded multi-microgrids was proposed in [24]. Fair profit allocation of microgrids owners and reliability enhancement of the whole system are the objectives of this paper.
Micro-grid’s (MG’s) optimal sizing and allocation problem is sensible to several factors such as DRP, energy storage systems, potential uncertainties, and environmental factors. Some papers have investigated the effect of such factors on the microgrids optimal sizing problem. In [10], RESs uncertainty was assumed and the sensitivity analysis carried out on various case studies. Reference [25] optimized a single objective function to determine the size of components of the microgrid. In this study, the uncertain nature of RESs using probability density functions was considered. In [26], the optimal placement and sizing of the microgrid were performed by defining a deterministic set of uncertainties, instead of probability distribution functions. A hybrid energy system was designed using a new technoeconomic strategy [27]. In this study, a load shifting method was implemented by classifying the demand to low and high priority loads, and its effect on the sizing problem analyzed. In [19], the effect of DRPs was investigated in the sizing problem, and the results showed that the implementation of DRPs could reduce the system’s costs and improves the performance of sizing strategy. Reference [28] considered the effect of DRP and environmental factors on the optimal size of microgrid conventional and renewable sources. The main drawback of this paper is that the uncertainty of the RESs and load was not considered, and only a 24-hour time interval was used as an annual sample for RESs and load. The microgrids’ DGs combinations were analyzed by HOMER software with and without considering energy storages in [18]. In addition, the environmental impacts of the proposed plans such as greenhouse gas emissions were studied. Similarly, in [20], the effect of energy storage systems on the sizing problem was addressed. It was shown that the installation of a battery bank to an independent hybrid system would reduce the investment costs.
This paper investigates the optimal sizing of an islanded microgrid (IMG) with PV/wind/battery by considering the simultaneous implementation of shiftable DRP. The uncertainties of RESs are applied with the robust optimal method. Most of the existing literature has optimized the sizing problem without considering the uncertain nature of RESs, and in the case of considering these uncertainties, the RO was not applied concurrent with DRPs. Therefore, considering potential uncertainties along with implementing the RO method is one of the main contributions of this research. In addition, applying shiftable DRP and analyzing its effect on sizing problem makes this study more comprehensive than previous works. The RO method increases the cost function, which is not desirable for investors. Hence, an effective shiftable DRP is implemented for investor persuasion. In this strategy, a fraction of demand on the defined hours of a day can be shifted to the other hours of the same day. Furthermore, it is assumed that the IMG participants are IMG investors. Therefore, the DRP implementation can reduce the cost function because of investors’ participation, which can be considered as participants’ incentive. As a result, by changing the robust budget of uncertainty and DRP participation factors, suitable tradeoff scenarios can be generated in the IMG sizing problem. Thus, as another significant contribution of paper, the potential uncertainties are considered by an accurate method without decreasing cost function via shiftable DRP. A mathematical strategy is used to solve the optimal sizing problem by utilizing the BARON solver in GAMS (GAMS Development Corp., GAMS Software GmbH, Washington, DC, USA). The major contributions of this study can be summarized as follows:
  • Robust optimal sizing along with a novel shiftable DRP;
  • Most of the existing literature optimized the sizing problem without considering the uncertain nature of RESs, and the ones which have considered the uncertainties, have not used the RO along with DRPs; in this research, the uncertainties are considered using RO along with a shiftable DRP;
  • Generating tradeoff scenarios by the robust optimal sizing method for simultaneous investor persuasion and covering the RESs uncertainty, as the main purpose of DRP application;
  • In addition to considering uncertainty along with a shiftable DRP, a novelty of this work is investigating correlations between different sources.
The remainder of this paper is organized as follows. The model of MG is presented in Section 2. Problem formulation includes objective function, model of load, DRP, and equipment, which are explained in Section 3. Proposed sizing strategy is explained in Section 4. Case studies are described in Section 5. Simulations result and sensitivity analysis are presented in Section 6. Finally, Section 7 explains the conclusions of the research.

2. Model of Studied IMG

Here, the proposed IMG is a renewable-based microgrid that includes photovoltaic (PV) and wind energy generation sources; therefore, the energy storage system is used to provide demand in the event of energy shortages. All the system components must be in harmony to manage fluctuations and uncertainties. Therefore, an independent IMG control center is suggested in the proposed model. One hypothesis for this IMG is that all the infrastructures of smart grids are obligatory for installation, so IMG consumers and control center operators can interact with each other. The scheme of IMG is shown in Figure 1, which consists of a set of PV arrays, wind turbines, battery energy storage system (BESS), loads, and a microgrid control center (MGCC). The responsibilities of the MGCC are proper planning for supplying demand and sending control signals to the IMG components [29]. The IMG demand consists of dump load and consumer demand. The dump load, similar to [19], is suggested for balancing the consumption and generation. If the extra power is available and the BESS charging is not an optimal choice, this power should supply to the dump load. Since IMG demand consists of shiftable and conventional loads, DRPs implementation is feasible for IMG. Here, a load shifting DRP is implemented to bring the generation and consumption profiles close together [19,27,30]. According to the definition of the US Department of Energy, each DRP requires a financial incentive for implementation. Since in this research, the customers are supposed to be investors of the microgrid, the financial incentives can reduce the project cost by implementing a load shifting DRP.

3. Sizing Problem Formulation

The desired microgrid consists of components including PV, wind turbines, and battery energy storage system (BESS). In addition, DRP is used to decrease the total value of objective function. Therefore, in this section, the general model of PV, wind turbines, BESS, and DRP are first explained, and then the participation value of each component in objective function is clarified.

3.1. Wind Turbine Model

The output power of the wind turbine is related to wind speed. In addition, depending on the mounting height, wind speed is different compared to measuring point speed [31]. In this study, the height effect on the wind turbine installation site is ignored for simplicity. Thus, given Equation (1), the output power can be obtained for wind turbines [27].
P w ( h ) = { 0 ,   v v c u t   i n   O R   v v c u t   o u t P r × ( v 2 v c u t   i n 2 v r 2 v c u t   i n 2 ) ,   v c u t   i n <   v v r P r ,     v r <   v v c u t   o u t    
In the Equation (1), P r is the rated wind turbine power; v and v r stand for wind speed and rated wind turbine speed, respectively.

3.2. Solar Panel Model

The output of the solar PV panel is directly related to the solar radiation, absorption capacity, and panel area. The cell temperature also affects the output power of PV panels as follows [19,32]:
P P V ( h ) =   G t ( h ) 1000   × P n o m × η p v × [ 1 β T ( T C T C , S T C ) ]
T C = T a m b + ( N O C T 20 ) × G t ( t ) 800
where G t ( t ) is sun radiation in w/m2; η p v , β T , and T C , S T C are power reduction factor, temperature coefficient, and cell STC temperature, respectively. Cell temperature ( T C ) is also calculated by Equation (3). N O C T and T a m b are normal operation cell temperature and ambient temperature.

3.3. BESS Model

In the IMG studied, due to the stochastic behavior of the RESs, there may be some situations in which the solution is infeasible. In practice, there may also be times when the generation is higher or lower than the consumption. In these instances, saving or lending energy is the alternative solution. Therefore, BESS is used for these various conditions. Equation (4) presents the BESS state of charge. In this equation, δ is the BESS self-discharge coefficient [19].
S O C ( h ) = S O C ( h 1 ) × ( 1 δ ) + P c h ( h ) × η B A T P d i s ( h ) η B A T
Equations (5) and (6) are used to limit the BESS charge and discharge rate, and Equation (7) is used to handle charging and discharge simultaneously [19].
P c h ( h ) I c h ( h ) × R B A T × N B A T  
P d i s ( h ) I d i s ( h ) × R B A T × N B A T  
I d i s ( h ) + I c h ( h )   1  
In these equations, I c h ( h ) and I d i s ( h )   are charge and discharge binary variables, respectively, and R B A T is the maximum charge or discharge rate of BESS.
The BESS state of charge is also between certain minimum and maximum values, which is formulated as follows [19]:
E m a x = ( 1 D O D ) × E r a t e d  
N B A T × E m i n S O C ( h ) N B A T × E m a x
where E r a t e d and E m a x are the rated and maximum capacity of BESS, which are equal in this case. E m i n and D O D are also the BESS minimum permitted remaining charge and the BESS depth of discharge.

3.4. Demand Model

The supposed annual demand curve is composed of three types of demands: residential, commercial, and industrial. Considering Equation (10), this demand curve consists of a fixed and a random part. The indicators C S e a s o n ,   t y p e ( h ) , D c , and P t y p e   are the seasonal effect, the demand, and peak demand coefficients, respectively. In this equation, the R F parameter is also the constant fraction of demand in every hour. Furthermore, ( 1 R F ) is multiplied by the r a n d function and presents the randomness of demand as Equation (10) in line with coefficients of Table 1.
D ( h ) = t y p e   C S e a s o n ,   t y p e ( h ) × P t y p e × ( R F + ( 1 R F ) × r a n d ) × D c ( h ) ;   h

3.5. The Proposed DRP Model

Here, the DRP is incentive-based because consumers are considered as microgrid investors. Therefore, any saving in project costs is attractive to consumers. In this study, the DRP leads to the optimal shift in consumption from low generation and high consumption periods to other periods. The proposed DRP for this problem follows:
P s h i f t i n ( h )   P P × D ( h )
P s h i f t o u t ( h )   P P × D ( h )
D D R ( h ) ( 1 + P P ) × D ( h )
D D R ( h ) = D ( h ) + P s h i f t i n ( h ) P s h i f t o u t ( h )  
h   T o u t P s h i f t o u t ( h ) = h   T i n P s h i f t i n ( h )  
where D and D D R are respective indicators of the IMG demand before and after implementation of DRP. In addition, P P is a fraction of demand that is expected to participate in the proposed shiftable DRP.
In addition, Equations (11)–(13) are used to limit the amount of shifted-in and shifted-out demand for a specific percentage of DRP participation (PP). Equation (14) presents the modified demand profile after DRP implementation, and Equation (15) indicates that the total demand transferred from T o u t to T i n should be equal in every 24 h interval.

3.6. Power Balance

The imbalance between generation and consumption leads to the infeasibility of the problem and in practice causes the system to be unstable. Equation (16) presents the balancing constraint for the sizing problem. Equations (17) and (18) are related to PVs and wind turbines which limit the output power of these components.
P p v ( h ) + P w ( h ) + P d i s c h a r g e ( h ) = D D R ( h ) + P c h a r g e ( h )
P p v ( h ) N p v × p p v ( h )  
P w ( h ) N w × p w ( h )
In these equations, p v and w are indices that stand for PV panels and wind turbines.

3.7. Objective Function

The Mixed integer nonlinear programming (MINLP) form of optimal sizing problem is introduced. Minimizing project cost is the main goal of this problem. To compare the project cost of different scenarios, the net present cost (NPC) concept is used, which is calculated by converting the future value of all input and output capitals to the present time [33]. For the system components, there are costs and values over the lifetime of the project. The operation and maintenance ( O & M ) cost, which presented by Equation (19), is annually for all the components [33]. In addition, Equations (20) and (21) present replacement cost and the residual value of components considered when their lifetime is finished [33]. In other words, the authors of the paper have considered all aspects, including operation and maintenance cost, replacement cost, and residual cost, which are the capital costs and profits in the microgrid structure. Equations (19)–(21) are the famous formulas in economics that are used to convert the different costs and profits to the first year for complementary investigations, which follow:
O & M t = n = 1 N O & M n 1 ( 1 + i ) n  
R e p t =   n = 2 ( N M 0 ) / M 0 R e p n 1 ( 1 + i ) n × M 0  
R e s t =   n = 2 N / M 0 R e s n 1 ( 1 + i ) n × M 0  
where M 0 and N are the lifetime of each component and total project lifetime, respectively, and i is the discount rate in these formulas.
The next step is the construction of the cost function for each component. Equation (22) gives the total N P C for each system component [33]. In this equation, I C is the investment cost considered once and for the first year of the project.
N P C = I C + O & M t + R e p t R e s t    
The final step is aggregating all components in the uniform function as an objective function. Equation (23) is the objective function of the sizing problem [33]. In the present study, the lifetime of each component is constant, and the problem is optimized for the project lifetime with a fixed electric demand pattern considering equality and inequality constraints.
M i n i m i z e   O F = k = { P V , W T , B A T } N k × N P C k
In this equation, N k is an integer number for the optimal installation number of each component.

4. RO Method

Information and real-world data are often uncertain. These existing uncertainties may be inherent or due to measurement errors and predictions. In [33], it was shown that ignoring uncertainties in the process of solving optimization problems with uncertain data, could lead to a non-optimal or infeasible solution. Therefore, the uncertainties must be taken into account. There are several methods to handle the uncertainties, such as sensitivity analysis [34], fuzzy programming [35], random programming [36], and the RO method [37]. Among them, the RO method can solve the optimization problem for the worst-case scenario considering all possible scenarios. The term worst-case means that, when the IMG is sized for the worst case, the results will be robust against the appearance of other probable causes. In other words, the sizing of this method guarantees its results to work well in all other probable cases [38]. In the RO method, there is no need for probability density functions of uncertain variables, and it uses uncertainty sets of data [39,40]. Due to the worst-case approach of the RO method, its simplicity, and needless use of probability density functions to consider uncertainties, this method is selected as the problem-solving method.

4.1. General Form of RO

The RO method was first introduced in 1973. Soyster suggested a linear optimization model that is robust against uncertainty, but he did not succeed because of excessive conservatism [37,41]. In recent years, modifications have been made to this method to remove the problem of excess conservatism by defining uncertain data sets [42].
To obtain the general form of the RO method, the general form of the MILP problem must first be introduced [42]:
min m c m x m + k d k y k s u b j e c t   t o   ( s . t ) : m a ˜ i m x m + k b ˜ i k y k p ˜ i   i
In this optimization problem, x and y are the integer and continuous variables multiplied by c , d coefficients. In addition, a ˜ i m , b ˜ i k , and p ˜ i are the matrices for uncertain parameters.
In Equations (25) and (26), uncertain set models for uncertain parameters are presented. By applying these models to the MILP general form and considering the worst-case concept, the general form of the RO method is derived and presented in Equation (28) [42].
a ˜ i m = a i m + ε i m a ^ i m
b ˜ i k = b i k + ε i k b ^ i k  
p ˜ i = p i + ε i 0 p ^ i
min m c m x m + k d k y k s . t :   m a i m x m + k b i k y k + max ε U   { ε i 0 p ^ i + m ϵ M i ε i m a ^ i m x i m + k ϵ K i ε i k b ^ i k y i k } p i   i

4.2. Robust Form of IMG Sizing Problem

In the RO method, every uncertain parameter must be defined by an uncertain set. Similar to [43,44,45], the uncertain parameters are the output power of the PV panels and wind turbines, which their uncertain sets are modeled as follows:
P ˜ p v ( h ) = P p v ( h ) + Δ P _ p v ( h ) × z _ p v ( h ) + Δ P ¯ p v ( h ) × z ¯ p v ( h ) ;     h
P ˜ w ( h ) = P w ( h ) + Δ P _ w ( h ) × z _ w ( h ) + Δ P ¯ w ( h ) × z ¯ w ( h ) ;   h  
In these equations, Δ P ¯ p v ( h ) , Δ P ¯ w ( h ) are for upper bounds of RESs (PVs and wind turbines) and Δ P _ p v ( h ) , Δ P _ w ( h ) are for lower bounds of RESs. In addition, z _ p v ( h ) , z _ w ( h ) are uncertainty decision variables for lower bounds of RESs, and z ¯ p v ( h ) , z ¯ w ( h ) are uncertainty decision variables for upper bounds of RESs.
By replacing Equations (29) and (30) in the balance constraint of the problem instead of the deterministic form of the RESs, an optimization subproblem will appear in the balance constraint, which is a part of balance constraint as follows [43,44,45]:
m a x   P W C ( h ) = [ Δ P _ p v ( h ) Δ P ¯ p v ( h ) Δ P _ w ( h ) Δ P ¯ w ( h ) ] [ z _ p v ( h ) z ¯ p v ( h ) z _ w ( h ) z ¯ w ( h ) ] s . t   :   [ 1 1 1 1 1 0 0 0 0 1 0 0 0 0 1 0 0 0 0 1 ] [ z _ p v ( h ) z ¯ p v ( h ) z _ w ( h ) z ¯ w ( h ) ] [ Γ ( h ) 1 1 1 1 ] [ z _ p v ( h ) z ¯ p v ( h ) z _ w ( h ) z ¯ w ( h ) ] 0
In Equation (31), P W C ( h ) is a part of the balancing constraint, which is the sum of the output power of the worst-case scenario; z _ R E S ( h ) and z ¯ R E S ( h ) are decision variables for considering worst-case uncertainty; and Γ ( h ) is the uncertainty budget factor, which the problem can be solved by setting its value for the most pessimistic and optimistic state. This parameter can contain values between zero (i.e., the deterministic or optimistic state) and the number of uncertain parameters (i.e., the pessimistic state). The number of uncertain parameters is two in this condition because of the existence of PV and wind turbine.
As a result, a maximization optimization subproblem appears in the investment cost minimization main problem. Therefore, the subproblem needs to change to a minimization problem. By using duality concept, this goal can be obtained [38,46]:
min z p = c T x max z D = b T y s . t A x b s . t A T y c x 0 y 0
For converting the subproblem obtained to a minimization problem in the first step, subproblem terms of Equation (31) must be rewritten as Equation (32) matrices [43,44,45].
b T = [ Δ P _ p v ( h ) Δ P ¯ p v ( h ) Δ P _ w ( h ) Δ P ¯ w ( h ) ]
A T = [ 1 1 1 1 1 0 0 0 0 1 0 0 0 0 1 0 0 0 0 1 ]
c = [ Γ 1 1 1 1 ]  
y = [ z _ p v ( h ) z ¯ p v ( h ) z _ w ( h ) z ¯ w ( h ) ]
After replacing these matrices in duality formula, the minimization subproblem can be derived as follows [38,46]:
m i n z p = [ Γ 1 1 1 1 ] T x   s . t : [ 1 1 0 0 0 1 0 1 0 0 1 0 0 1 0 1 0 0 0 1 ] x [ Δ P _ p v ( h ) Δ P ¯ p v ( h ) Δ P _ w ( h ) Δ P ¯ w ( h ) ] x 0
By placing the Equation (38) (i.e., duality variables) into Equation (37), the final form of the subproblem can be obtained as follows:
x = [ ζ ( h ) λ _ p v ( h ) λ ¯ p v ( h ) λ _ w ( h ) λ ¯ w ( h ) ]  
min { ζ ( h ) Γ ( h ) + R D G { p v , w } λ ¯ R D G ( h ) + λ _ R D G ( h ) }
ζ ( h ) + λ ¯ R D G ( h ) Δ P ¯ R D G ( h ) ;     R D G ,   h
ζ ( h ) + λ _ R D G ( h ) Δ P _ R D G ( h ) ;     R D G ,   h  
ζ ( h )   , λ _ R D G ( h )   , λ ¯ R D G ( h ) 0 ;     R D G ,   h
Therefore, by adding Equation (39) to the left side of Equation (16), the final balancing constraint is obtained for the RO-sizing problem as follows:
P p v ( h ) + P w ( h ) + P d i s ( h ) + ζ ( h ) Γ ( h ) + R E S { p v , w } λ ¯ R E S ( h ) + λ _ R E S ( h ) = D D R ( h ) + P c h ( h )
Finally, the ultimate form of RO sizing problem uses Equations (1)–(19), and (40)–(43) to obtain optimal decision of the IMG considering the uncertain parameters.

5. Case Study

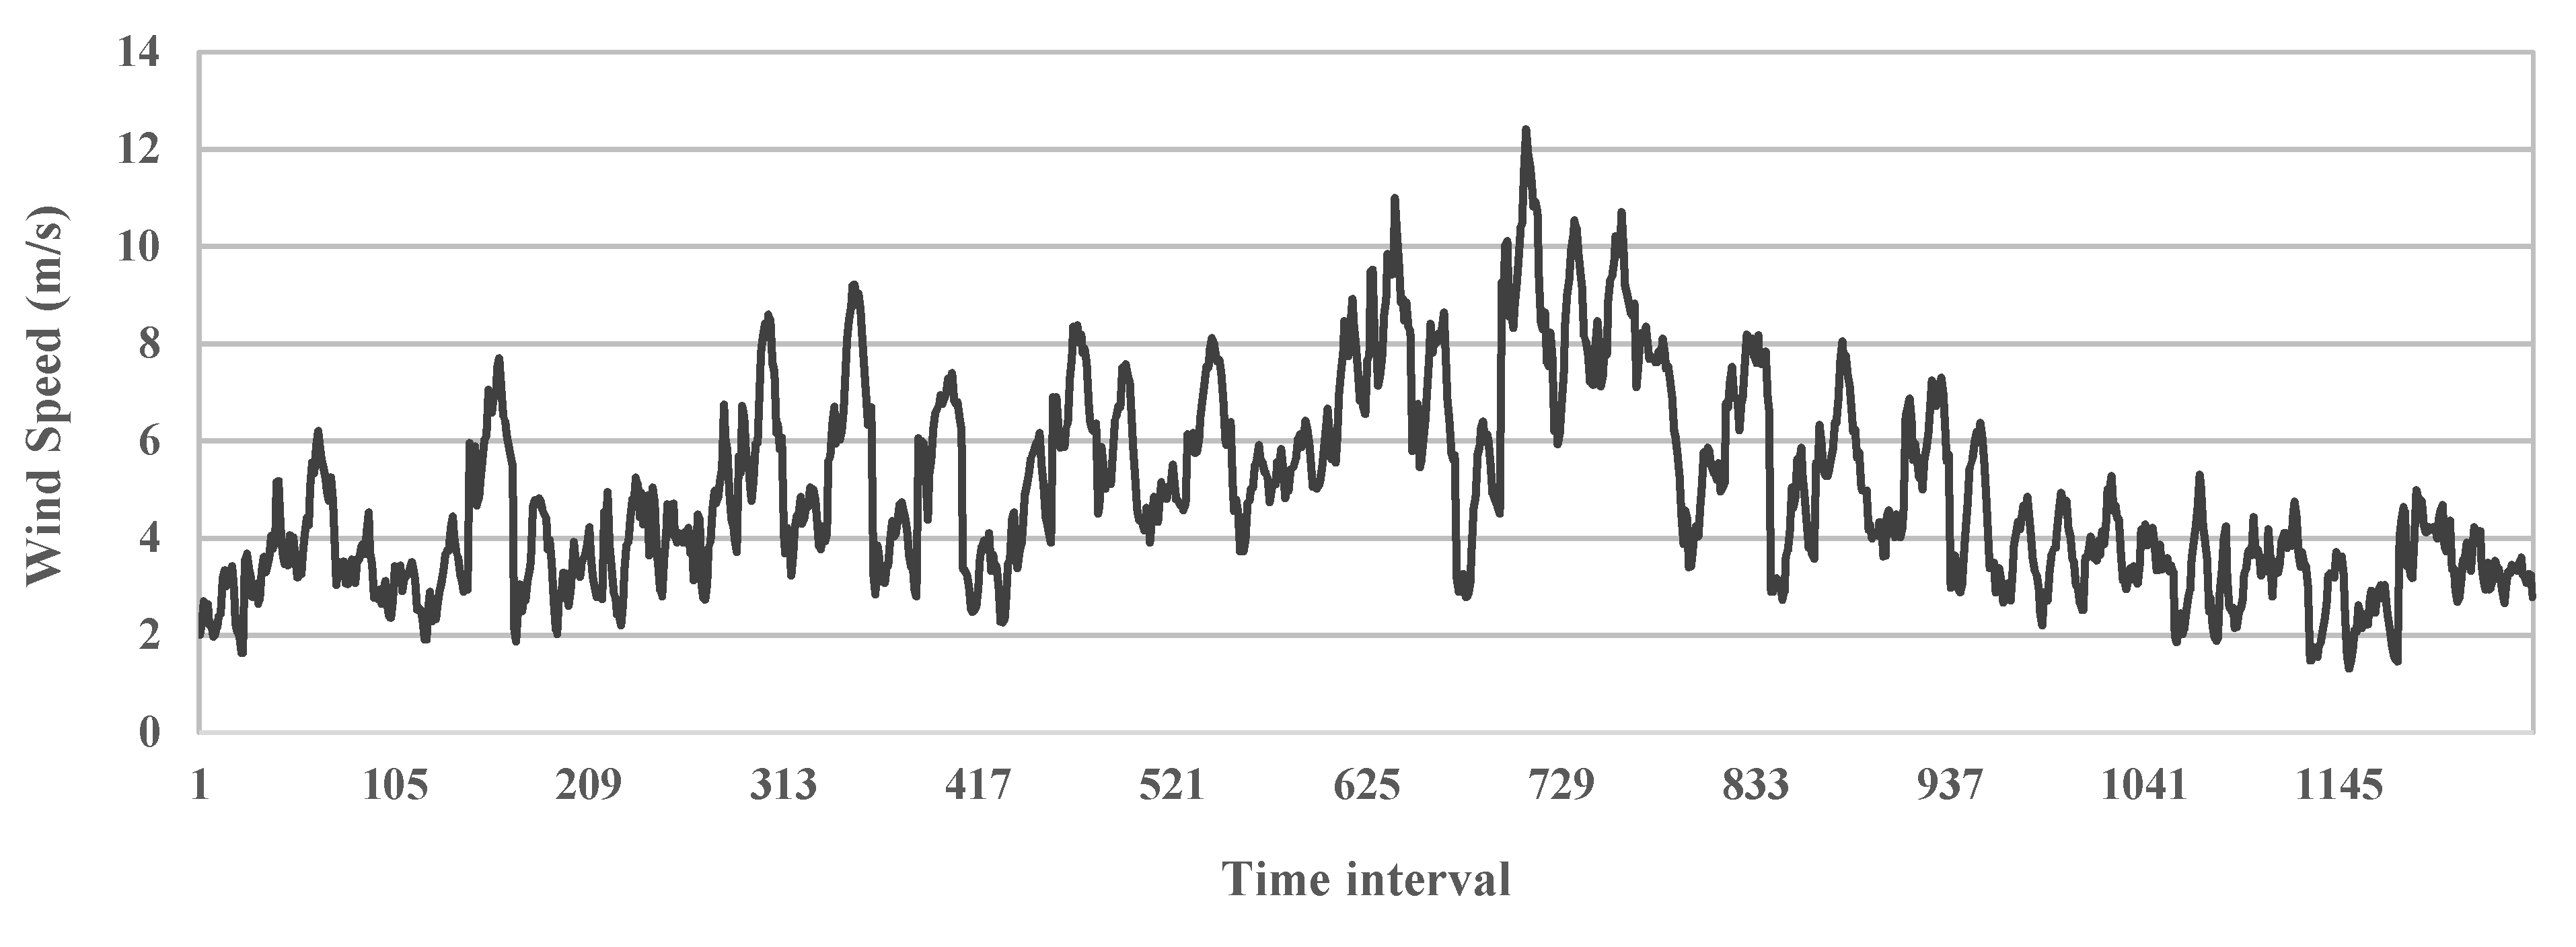
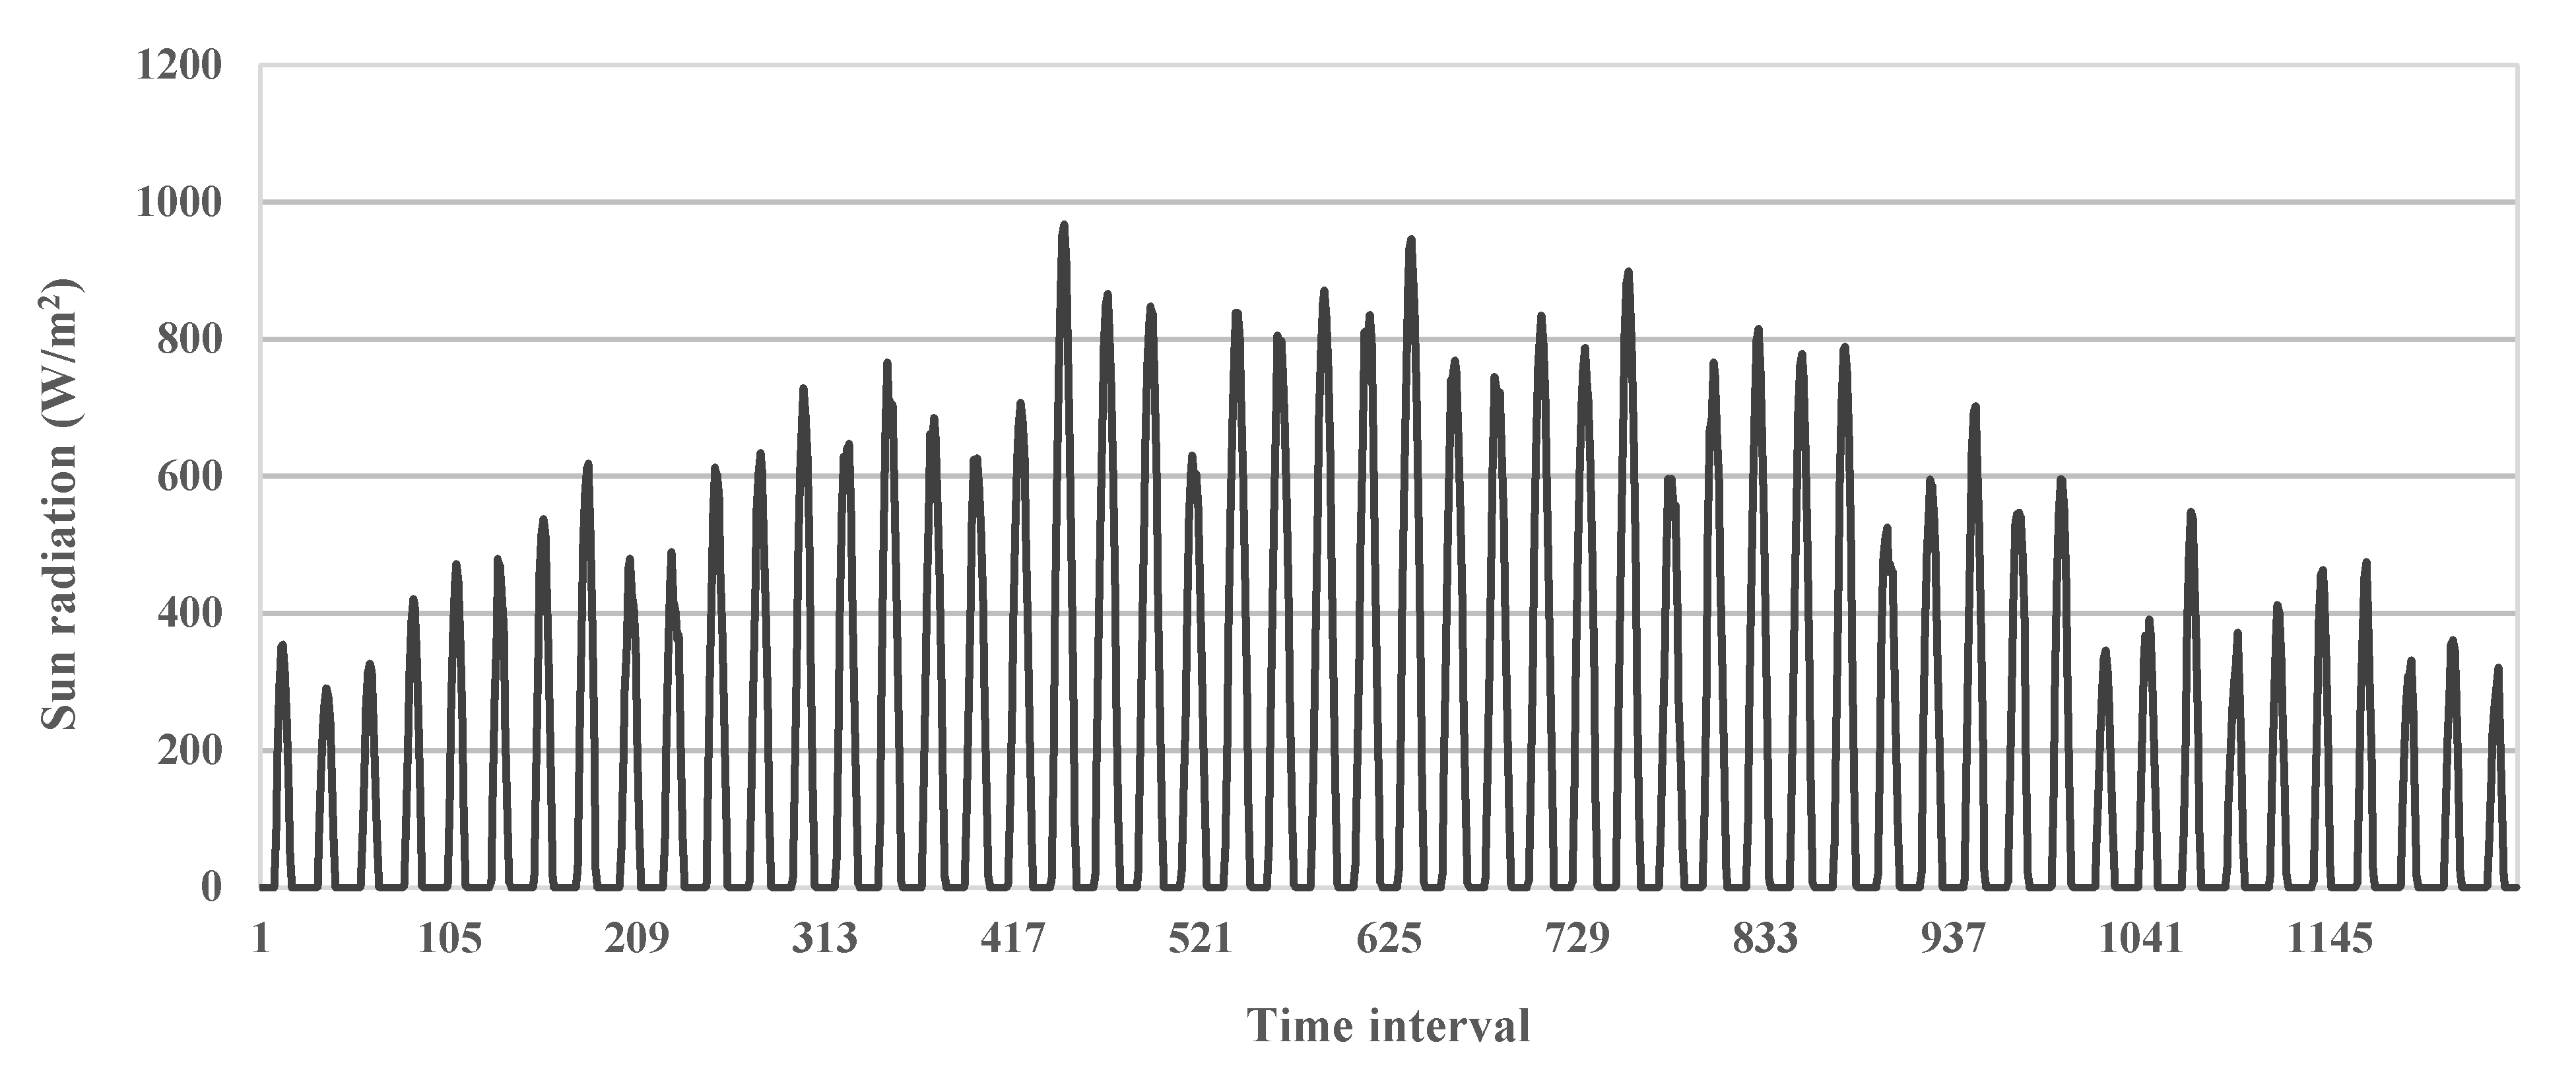
In this section, the meteorological data and economic parameters related to the project components are given. The meteorological data including wind speed and sun irradiation belong to Ardabil City in Iran (Latitude = 38.250°, Longitude = 48.300°), which is obtained through Meteonorm software [42]. Figure 2 and Figure 3 are the wind speed and solar radiation figures for 1248 h of a one-year period, where each 24 h is representative of a week.
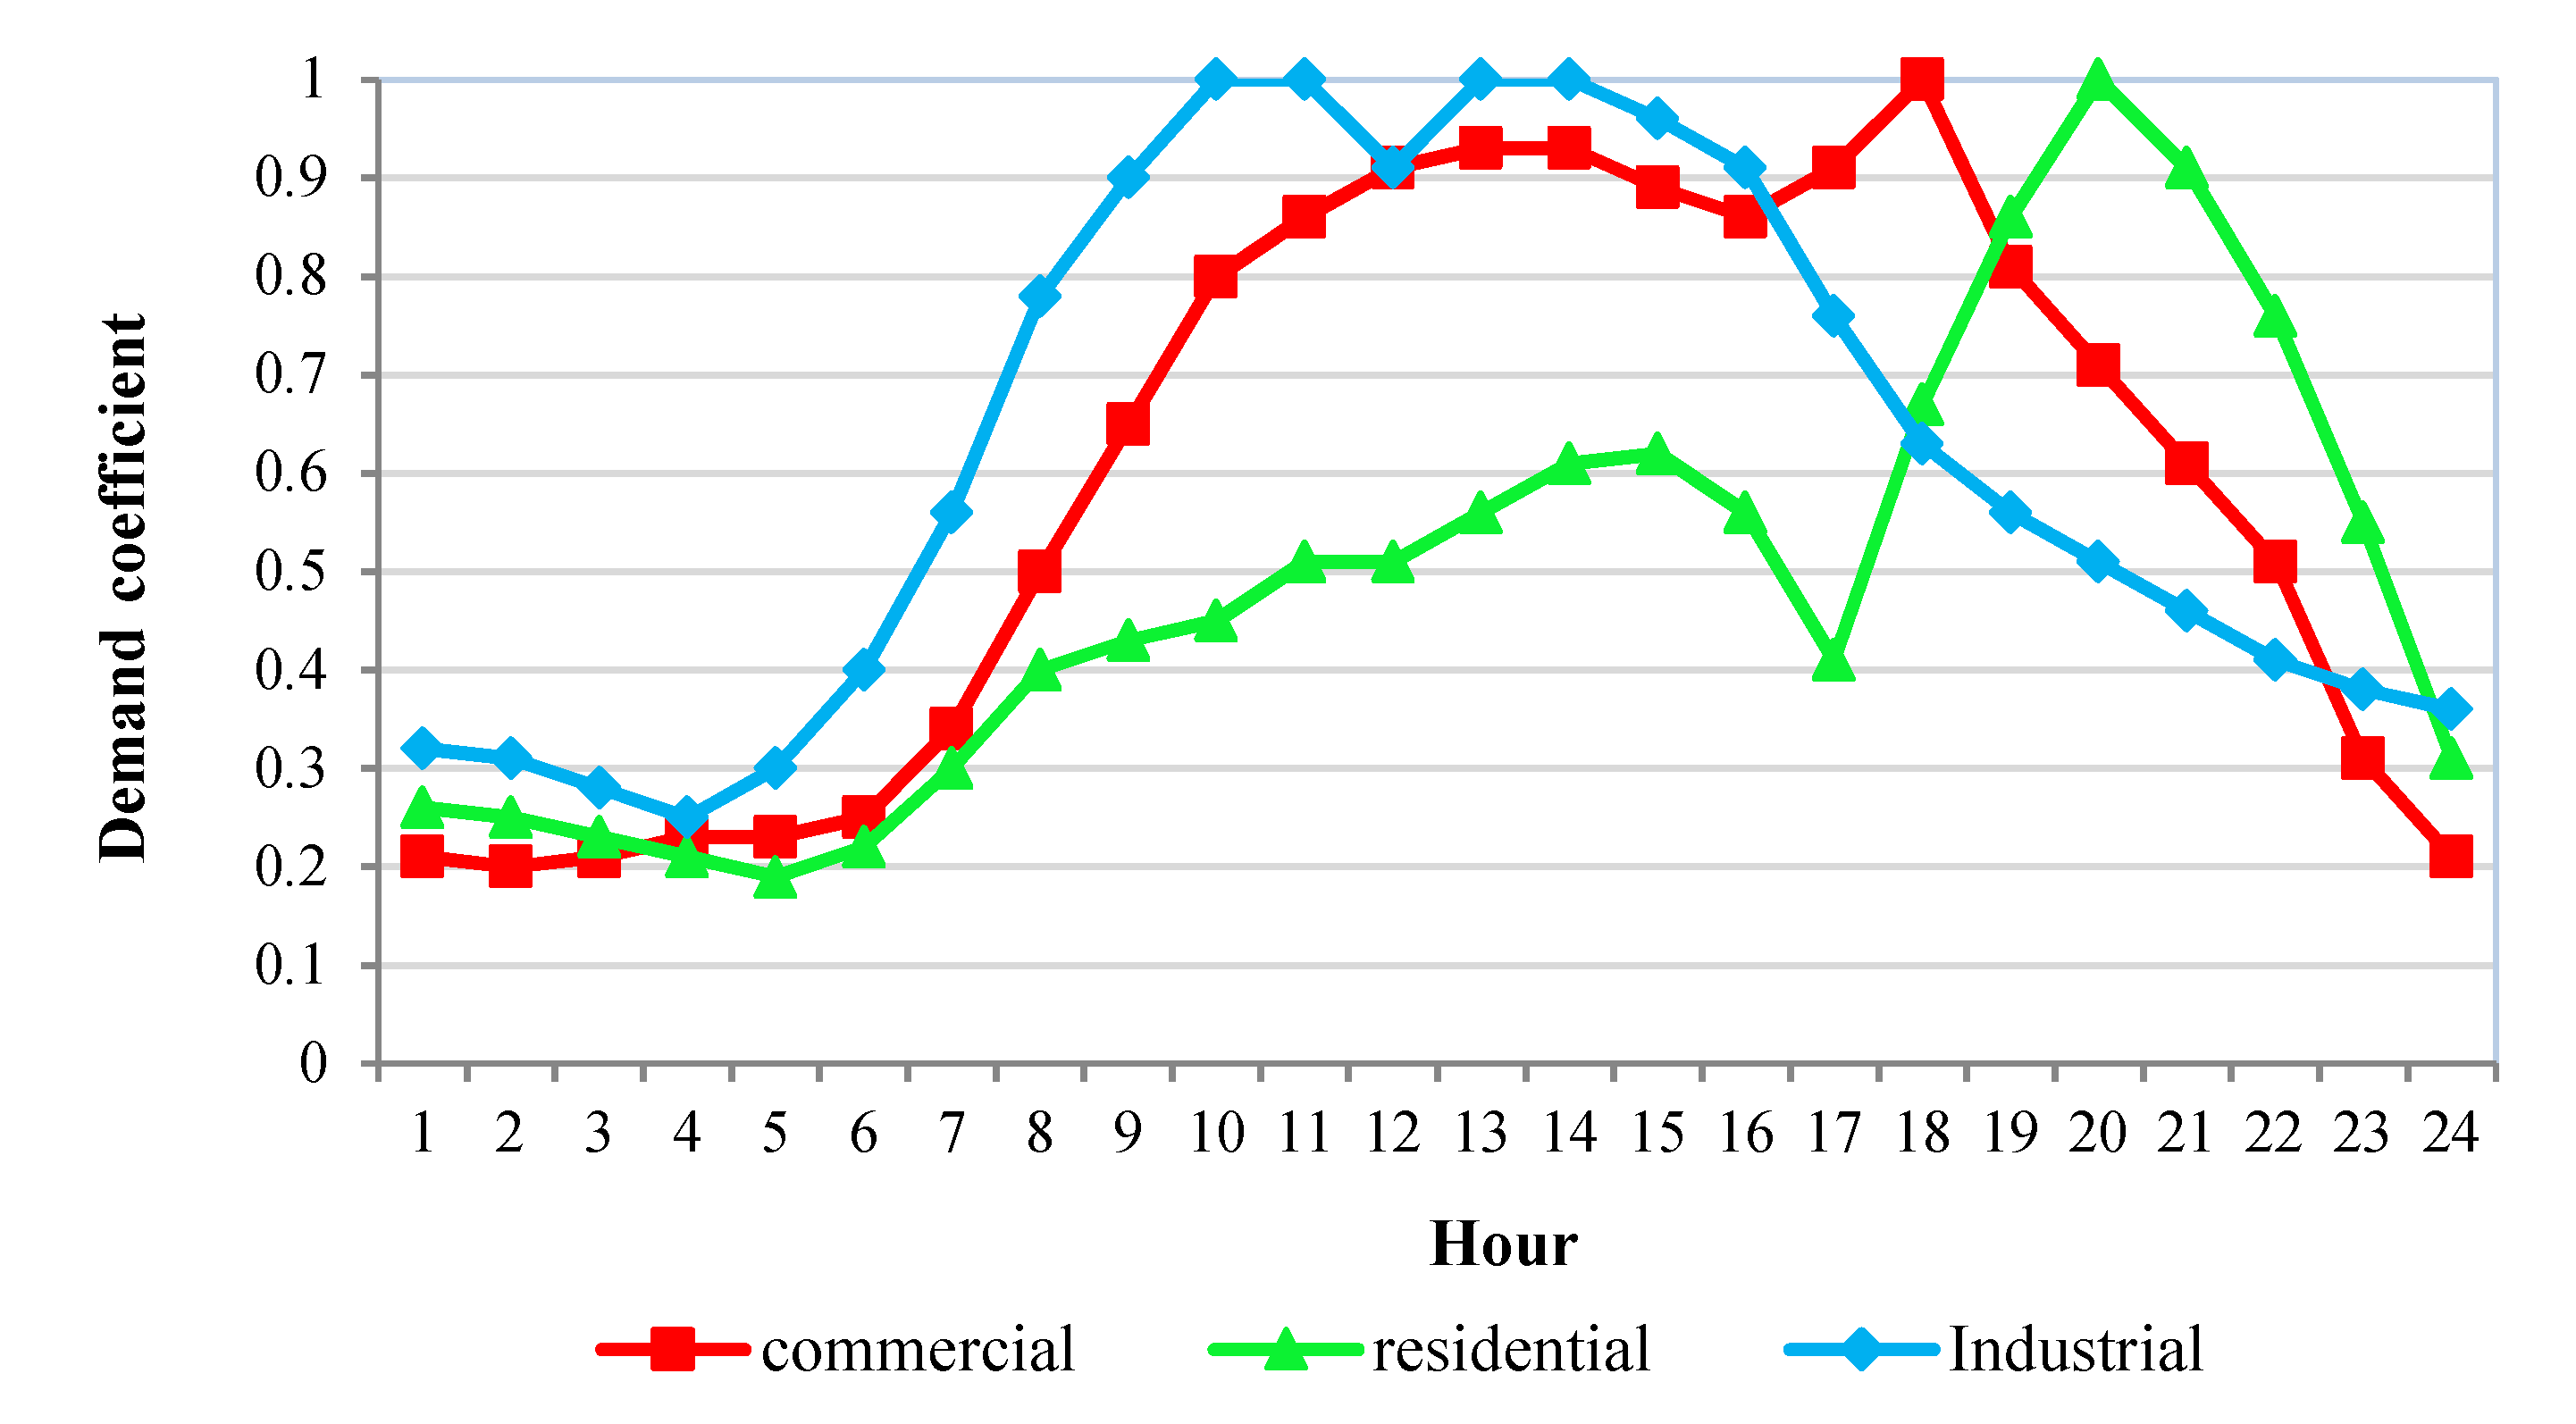
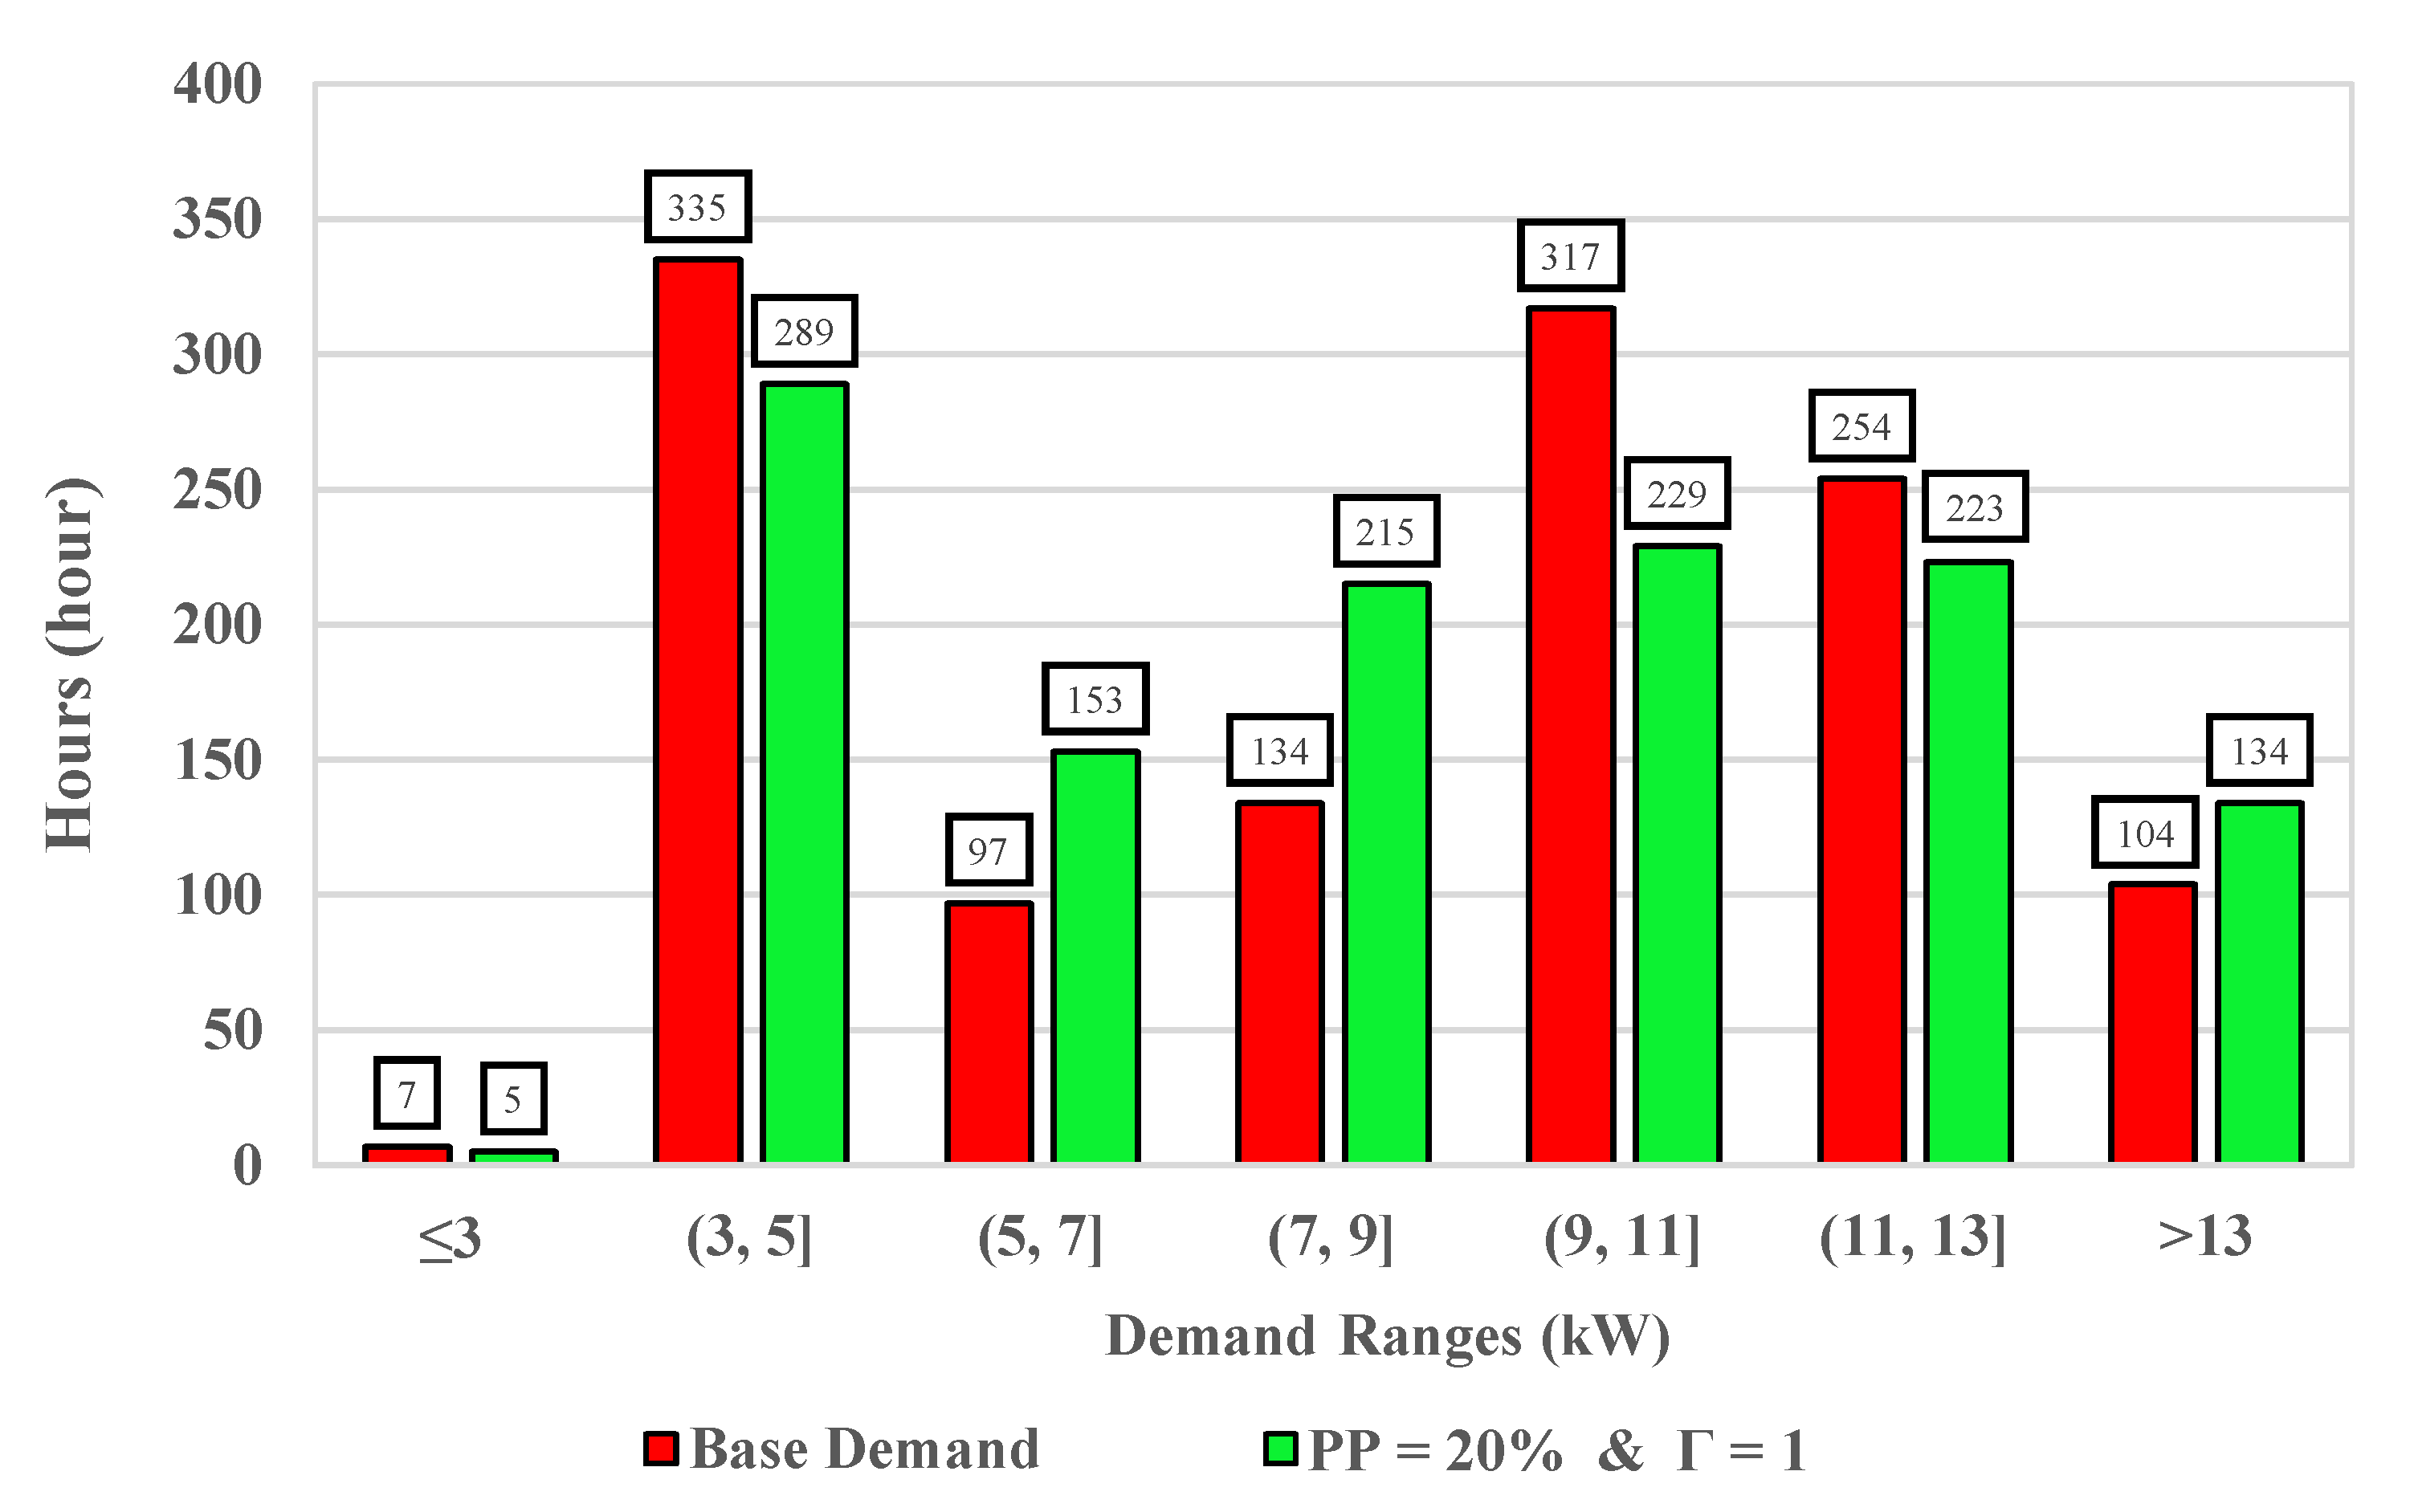
Figure 4 presents daily data for three types of demand [47] and Figure 5 indicates the statistical dispersion of hourly demand after applying seasonal and random daily coefficients to it, which is described in Section 3.4 and 3.5. In the Figure 5, the meaning of numbers related to the hours is the number of hours which the related demand is in that range. For example, demand range (3, 5) with 335 h means that 335 h of total hours are in range of (3, 5) kW.
The components of the microgrid and project specifications are also given in Table 2.

6. Simulations and Sensitivity Analysis

In this section, the introduced optimal sizing problem is simulated using GAMS version 24.2.1 software. In addition, the internal solver of the GAMS software, which is used in this paper, is BARON [50,51].
For validating the results and proposing tradeoff scenarios for investors, the sensitivity analysis is applied. The parameters considered for the sensitivity analysis are the Γ and P P factors. According to Table 3, there are 27 scenarios (by removing similar scenarios) for different values of the mentioned parameters. The base scenario (BS) is the scenario with Γ = 0 and P P = 0 % that is considered as the optimistic scenario and the other scenarios will be evaluated concerning this scenario. Scenarios 20 and 25 are also selected as problem tradeoff and worst scenarios to perform further comparisons, respectively.
The simulation results are listed in Table 3. Scenarios with Γ = 0 and Γ = 2 are the deterministic optimization problems with 0% and 100% uncertainty, respectively. According to the simulation results, it can be seen that an increase in the uncertainty set, bound and RO budget would increase the N P C , together with an increase in the DRP participation factor (PP), would decrease the N P C .
In this paper, our main purpose is to propose an optimization model that can be robust against uncertain parameters or uncertainty sets. For this reason, we used GAMS as a solver, which can solve problems with algebraic modeling. Because of complexity of formulation (number of variables is high), the best tool for finding optimum points for this paper is GAMS software. In spite of this fact, there are other methods for finding the optimum points of the parameters, such as heuristic methods which are useful, but have some major problems. These methods are not suitable for the problems that have a high number of variables and usually become stuck at the local optimal points or cannot find the optimal solutions. Therefore, we used the GAMS software, which is potent in solving these types of problems.
However, there are many mathematical methods that can be used in GAMS and each uses a unique path to solve the problem. For comparing GAMS solvers and using best solver for this paper, we used the base scenario for testing and ran our model considering different GAMS solvers. The comparison result is given in Table 4, which proves the efficiency of the method used.
Next, we want to point to the high comprehensiveness of our method and investigate the robustness of our method against the changing variables. According to Table 3, we investigated different scenarios and conditions to prove the performance of our method. According to Table 3, we consider all possible modes for uncertainty sets, Γ, and PP. We investigated the different modes (including the worst-case scenario), but we eliminated some same modes and presented 27 potent modes in Table 3. According to Table 3, our method can consider all plausible modes for different modes of uncertainties and it can also reduce the cost by applying the demand–respond program. For example, in scenarios 4–6, we keep constant the uncertainty sets and Γ parameters and vary the PP to investigate the effect of demand response program on cost; in scenarios 4 and 7, we keep constant the uncertainty sets and PP to investigate the effect of Γ on our survey; in scenarios 4 and 16, we keep constant the PP and Γ parameters to investigate the effect of uncertainty sets on our planning. Therefore, our method is very robust, comprehensive, and economic.
Our general purpose in this paper is planning for the desired microgrid. In other words, this paper is a very good reference for the owners who want to invest in microgrids. Because our desired microgrid do not have reliable sources such as CHP or diesel generator (due to investigating worst modes or high-bound uncertainties), the owner is wary about uncertainties of RESs; therefore, the owner wants to ensure robustness of the designed microgrid. We present a method which assures the owner of the uncertainties (even for the worst case) and by considering the DRP, the owner has an opportunity to reduce the costs. Therefore, we cannot eliminate the investment and operation costs because our general intention is planning for the designed microgrid and investigating the different modes in it. According to Table 5, for comparing scenarios from a financial perspective, we chose three scenarios from the results of the Table 3. The first is the base scenario that is labeled as scenario number 1. This scenario is the simplest, having no robust model and DRP participation. The second is labeled as scenario number 26 with a 20 percent uncertainty set and 20 percent DRP participation. The third is the worst-case scenario, labeled as scenario number 25, with a 20 percent uncertainty set and 0 percent DRP. By comparing these scenario values, it can be inferred that considering 20% uncertainty set without DRP can increase investment cost by 16%. In addition, it can be seen in scenario 26 using 20 percent DRP, that the scenario decreases investment cost by 4 percent.
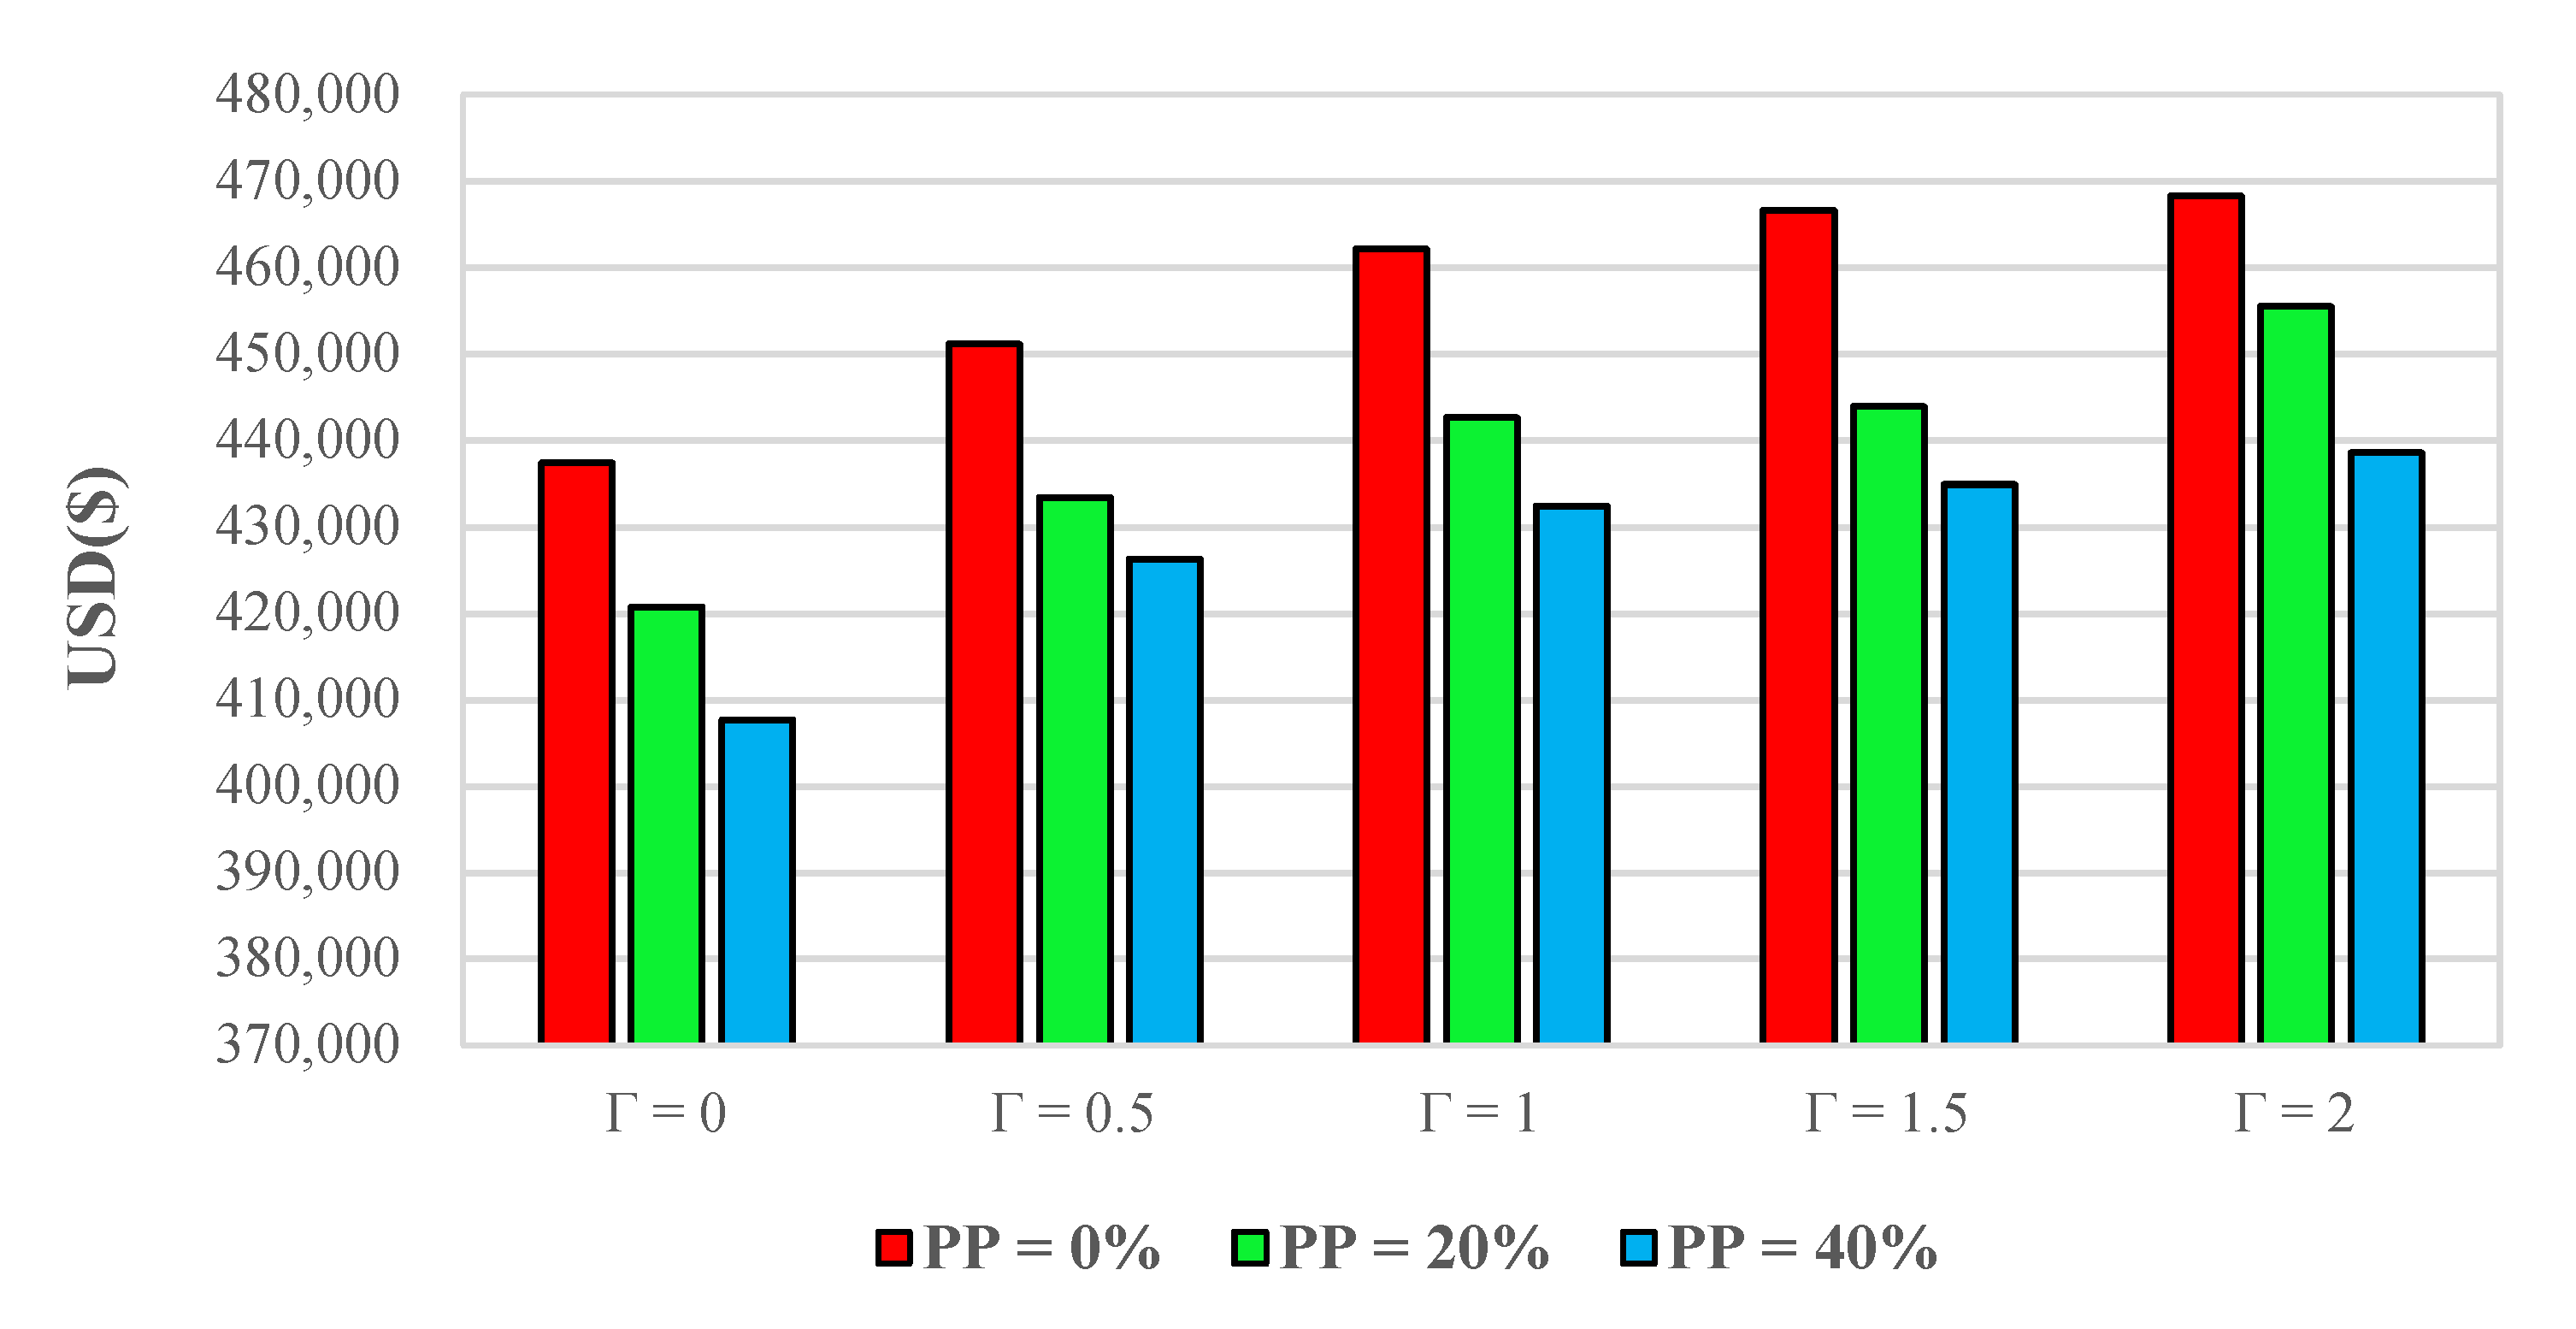
According to Figure 6, by comparing N P C . for each scenario, it would be stated that the simultaneous implementation of the DRP and RO method creates tradeoff scenarios. For example, in this figure, the scenario with R B = 1 and P P = 20 % is a good choice for investment.
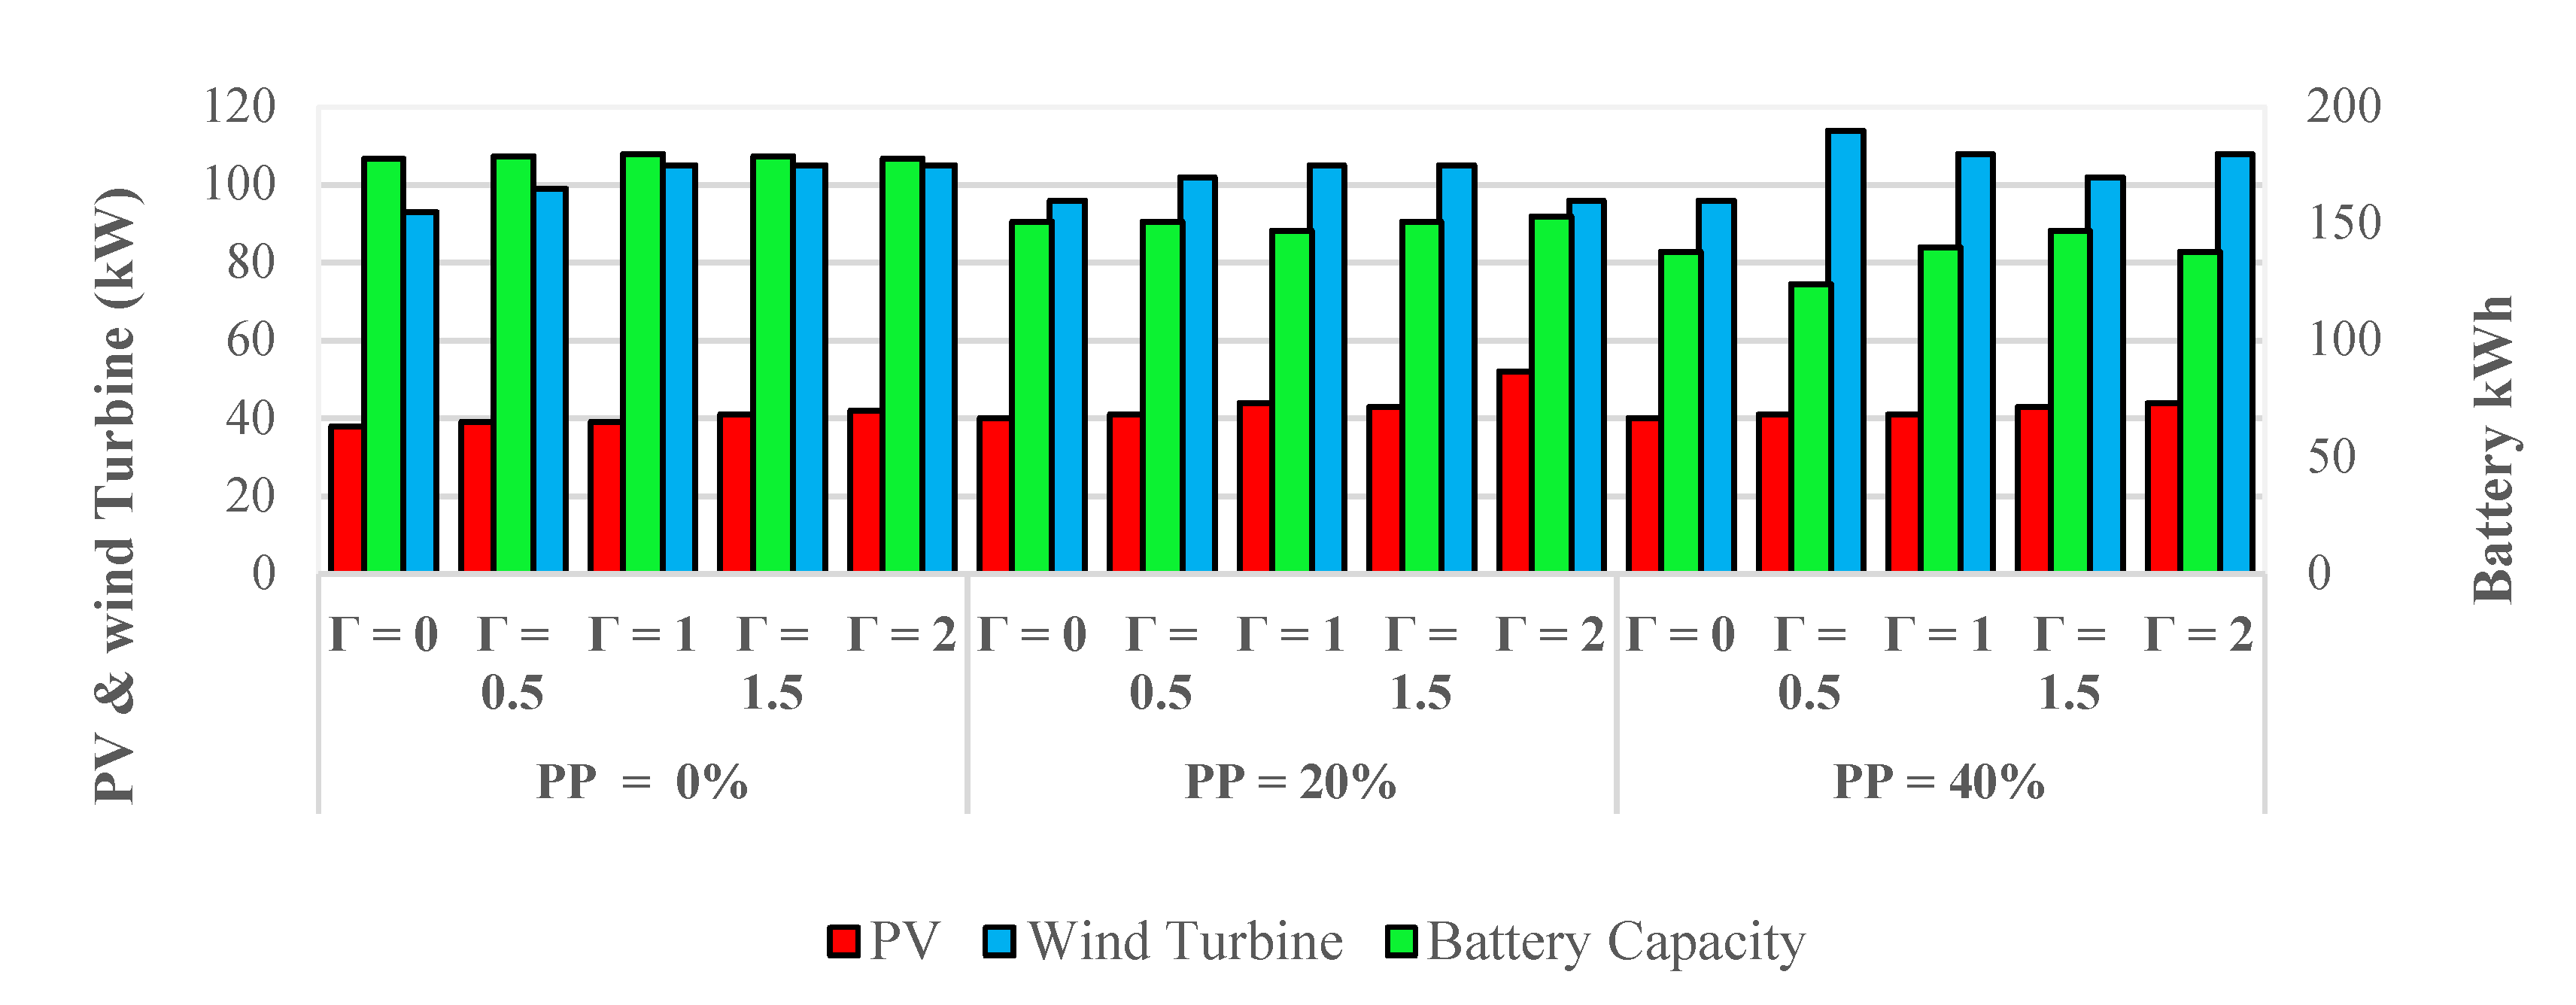
The calculated capacity of the RESs and the BESS are shown in Figure 7, considering 10% of uncertainty bound. By comparing these figures in the first step, it is obvious that the consideration of uncertainty for RESs increases the size of system components and in the second step, it can be noted that the DRP implementation increases the calculated capacity of RESs and decreases the calculated capacity of the BESS. This means that DRP implementation can decrease the dependency on BESS and increase the dependency on real-time generation.
Figure 8 shows the demand intervals for one year after the DRP implementation with P P = 20 % , Γ = 1 , and 10% uncertainty set-bound. By comparing this scenario with base demand, and considering Figure 9, it can be noted that the demand in specified hours has often been shifted to the hours with more generated output power. As a result, uniform distribution for generation and demand is obtained. In addition, by computing the annual cumulative shifted demand per hour of the 24 h profile, as shown in Figure 9, it can be realized that the shifted demand is mostly transferred to the 8 a.m.–4 p.m. period. Considering the daily generation of solar power, it has a dependency on the daily solar power generation pattern. During other hours, such as hours without solar power generation, the wind energy would match between generation and consumption. This is the reason for the increase in installed capacity of RESs and the decrease in the reliance on BESS.
Finally, considering Figure 10, which is the comparative figure for BESS state of charge and wind speed, it is obvious that BESS state of charge is highly dependent on wind speed. It can be said that almost whenever wind speed is under the cut-in wind turbine speed, the MGCC begins to send signals to BESS.

7. Conclusions

By implementing a shiftable DRP for robust optimal sizing of a microgrid, it was shown in this case study that the uncertainty in RESs can increase project cost, and implementation of DRP in the optimal sizing problem can reduce the investment cost and BESS capacity. From an economic perspective, these results can lead to different tradeoff scenarios for investor persuasion. Comparing the base scenario (BS) with the worst scenario (WS), it was shown that considering only 20% uncertainty sets, the cost of the project increased by 16%. In addition, by choosing scenario 20 as a tradeoff scenario (TS), the project cost only increases 7%. This scenario considers 20% uncertainty sets with Γ = 1 for robust optimal sizing and PP = 20% for DRP implementation. In addition, from this microgrid planner perspective, it can be concluded that the shiftable DRP is highly correlated with the solar energy power output. Furthermore, comparing wind speed with state of charge of the BESS, another correlation between BEES state of charge and wind speed was discovered. These correlations among different components and DRPs show the significance of each component specification that can affect the other component performance.

Author Contributions

Conceptualization, M.K.D., H.G.G., A.J. and M.N.-H.; methodology, M.K.D., H.G.G., A.J. and M.N.-H.; software, M.K.D. and H.G.G.; validation, M.N.-H., G.B.G. and M.A.; formal analysis, M.K.D. and H.G.G.; investigation, M.K.D., H.G.G., A.J. and M.N.-H.; data curation, M.K.D., H.G.G. and A.J.; writing—original draft preparation, M.K.D., H.G.G. and A.J.; writing—review and editing, M.N.-H., G.B.G. and M.A.; supervision, G.B.G. and M.A.; project administration, G.B.G. and M.A. All authors have read and agreed to the published version of the manuscript.

Funding

This research received no external funding.

Institutional Review Board Statement

Not applicable.

Informed Consent Statement

Not applicable.

Conflicts of Interest

The authors declare no conflict of interest.

Abbreviations

Nomenclature
O & M Operation and maintenance cost
R e p Replacement cost
R e s Residual value
M 0 Lifetime of components
N Total lifetime of the project
I C Investment cost
N P C Net present cost
O F Objective function
N k Size of components
i Discount rate
k Index for problem components   { P V , W T , B A T }
P w Wind turbine output (kW)
P r Wind turbine rated power (kW)
v Wind speed
v r Wind turbine rated speed
v c u t   i n Wind turbine cut-in speed
v c u t   o u t Wind turbine cut-out speed
P P V PV panels output (kW)
P n o m PV panel rated power (kW)
G t Sun radiant (w/m2)
η p v PV panels power reduction factor
β T PV panels temperature coefficient
T C , S T C PV panels cell standard test conditions (STC) temperature
T C PV panels cell temperature
N O C T Normal operation cell temperature
T a m b Ambient temperature
C S e a s o n ,       t y p e Seasonal demand effect
D c Demand coefficient
P t y p e Peak demand coefficient
R F Constant percentage of demand
D Hourly demand of islanded microgrid (IMG)
S O C BESS state of charge
δ BESS self-discharge coefficient
η B A T BESS efficiency
P c h a r g e BESS charged power
P d i s c h a r g e BESS discharged power
I c h   , I d i s BESS charge and discharge binary variables
R B A T Maximum charge or discharge rate of battery energy storage system (BESS)
E m a x , E m i n Minimum and maximum capacity of BESS
D O D BESS depth of discharge
E r a t e d BESS rated capacity
P s h i f t i n Shifted-in demand
P s h i f t o u t Shifted-out demand
P P DRP participation percentage
D D R Demand after implementation of demand response programs (DRP)
c m , d k Integer and continuous coefficients of variables
x m , y k Integer and continuous variables
a ˜ i m ,   b ˜ i k , p ˜ i Uncertain parameter matrices
P ˜ k The uncertain output power of renewable energy sources (RESs)
Δ P _ R E S , Δ P ¯ R E S Uncertainty upper and lower bounds for RESs
z _ R E S , z ¯ R E S Uncertainty decision variables for lower and upper bounds of RESs
Γ Robust uncertainty budget factor
ζ , λ _ k ,   λ ¯ k Duality variables for Γ and lower and upper bounds for uncertainty decision variables (k   ( R D G . w . p v . R E S ) )

References

  1. Ustun, T.S.; Ozansoy, C.; Zayegh, A. Recent developments in microgrids and example cases around the world—A review. Renew. Sustain. Energy Rev. 2011, 15, 4030–4041. [Google Scholar] [CrossRef]
  2. Chen, C.; Duan, S.; Cai, T.; Liu, B.; Hu, G. Smart energy management system for optimal microgrid economic operation. IET Renew. Power Gener. 2011, 5, 258. [Google Scholar] [CrossRef]
  3. Shen, J.; Jiang, C.; Liu, Y.; Qian, J. A microgrid energy management system with demand response for providing grid peak shaving. Electr. Power Compon. Syst. 2016, 44, 843–852. [Google Scholar] [CrossRef]
  4. Hosseini Imani, M.; Niknejad, P.; Barzegaran, M.R. The impact of customers’ participation level and various incentive values on implementing emergency demand response program in microgrid operation. Int. J. Electr. Power Energy Syst. 2018, 96, 114–125. [Google Scholar] [CrossRef]
  5. Palensky, P.; Dietrich, D. Demand side management: Demand response, intelligent energy systems, and smart loads. Ind. Inform. 2011, 7, 381–388. [Google Scholar] [CrossRef] [Green Version]
  6. U.S. Department of Energy. Benefits of Demand Response in Electricity Markets and Recommendations for Achieving Them; U.S. Department of Energy: Washington, DC, USA, 2006; p. 122.
  7. Kammen, D.M. Proceedings of the Renewable energy options for the emerging economy: Advances, opportunities and obstacles. Background paper for “The 10-50 Solution: Technologies and Policies for a Low-Carbon Future” Pew Center & NCEP Conference. Washington, DC, USA, 25–26 March 2004; Available online: https://scholar.google.com/scholar?cluster=2465164507733390681&hl=en&as_sdt=0,5 (accessed on 30 August 2021).
  8. Khodaei, A.; Bahramirad, S.; Shahidehpour, M. Microgrid planning under uncertainty. IEEE Trans. Power Syst. 2015, 30, 2417–2425. [Google Scholar] [CrossRef]
  9. Maleki, A.; Askarzadeh, A. Optimal sizing of a PV/wind/diesel system with battery storage for electrification to an off-grid remote region: A case study of Rafsanjan, Iran. Sustain. Energy Technol. Assess. 2014, 7, 147–153. [Google Scholar] [CrossRef]
  10. Katsigiannis, Y.A.; Georgilakis, P.S.; Karapidakis, E.S. Hybrid simulated annealing-Tabu search method for optimal sizing of autonomous power systems with renewables. IEEE Trans. Sustain. Energy 2012, 3, 330–338. [Google Scholar] [CrossRef]
  11. Maleki, A.; Ameri, M.; Keynia, F. Scrutiny of multifarious particle swarm optimization for finding the optimal size of a PV/Wind/Battery hybrid system. Renew. Energy 2015, 80, 552–563. [Google Scholar] [CrossRef]
  12. Akram, U.; Khalid, M.; Shafiq, S. Optimal sizing of a wind/solar/battery hybrid grid-connected microgrid system. IET Renew. Power Gener. 2018, 12, 72–80. [Google Scholar] [CrossRef]
  13. Moretti, L.; Meraldi, L.; Niccolai, A.; Manzolini, G.; Leva, S. An innovative tunable rule-based strategy for the predictive management of hybrid microgrids. Electronics 2021, 10, 1162. [Google Scholar] [CrossRef]
  14. Jafari, A.; Ganjehlou, H.G.; Khalili, T.; Mohammadi-Ivatloo, B.; Bidram, A.; Siano, P. A two-loop hybrid method for optimal placement and scheduling of switched capacitors in distribution networks. IEEE Access 2020, 8, 38892–38906. [Google Scholar] [CrossRef]
  15. Ramli, M.A.; Bouchekara, H.; Alghamdi, A.S. Optimal sizing of PV/Wind/Diesel hybrid microgrid system using multi-objective self-adaptive differential evolution algorithm. Renew. Energy 2018, 121, 400–411. [Google Scholar] [CrossRef]
  16. Jafari, A.; Ganjehlou, H.G.; Darbandi, F.B.; Mohammdi-Ivatloo, B.; Abapour, M. Dynamic and multi-objective reconfiguration of distribution network using a novel hybrid algorithm with parallel processing capability. Appl. Soft Comput. 2020, 90, 106146. [Google Scholar] [CrossRef]
  17. Ganjehlou, H.G.; Niaei, H.; Jafari, A.; Aroko, D.O.; Marzband, M.; Fernando, T. A novel techno-economic multi-level optimization in home-microgrids with coalition formation capability. Sustain. Cities Soc. 2020, 60, 102241. [Google Scholar] [CrossRef]
  18. Ahmad, F.; Alam, M.S. Optimal sizing and analysis of solar PV, wind, and energy storage hybrid system for campus microgrid. Smart Sci. 2018, 6, 150–157. [Google Scholar] [CrossRef]
  19. Amrollahi, M.H.; Bathaee, S.M.T. Techno-economic optimization of hybrid photovoltaic/wind generation together with energy storage system in a stand-alone micro-grid subjected to demand response. Appl. Energy 2017, 202, 66–77. [Google Scholar] [CrossRef]
  20. Belfkira, R.; Zhang, L.; Barakat, G. Optimal sizing study of hybrid wind/PV/diesel power generation unit. Sol. Energy 2011, 85, 100–110. [Google Scholar] [CrossRef]
  21. Khalili, T.; Ganjehlou, H.G.; Bidram, A.; Nojavan, S.; Asadi, S. Financial risk-based scheduling of micro grids accompanied by surveying the influence of the demand response program. In Proceedings of the 2021 IEEE/IAS 57th Industrial and Commercial Power Systems Technical Conference, Las Vegas, NV, USA, 27–30 April 2021; pp. 1–9. [Google Scholar]
  22. Diaf, S.; Diaf, D.; Belhamel, M.; Haddadi, M.; Louche, A. A methodology for optimal sizing of autonomous hybrid PV/wind system. Energy Policy 2007, 35, 5708–5718. [Google Scholar] [CrossRef] [Green Version]
  23. Moretti, L.; Polimeni, S.; Meraldi, L.; Raboni, P.; Leva, S.; Manzolini, G. Assessing the impact of a two-layer predictive dispatch algorithm on design and operation of off-grid hybrid microgrids. Renew. Energy 2019, 143, 1439–1453. [Google Scholar] [CrossRef]
  24. Jafari, A.; Ganjehlou, H.G.; Khalili, T.; Bidram, A. A fair electricity market strategy for energy management and reliability enhancement of islanded multi-microgrids. Appl. Energy 2020, 270, 115170. [Google Scholar] [CrossRef]
  25. Yazdani, A.; Bhuiyan, F.A.; Primak, S.L. Optimal sizing approach for islanded microgrids. IET Renew. Power Gener. 2015, 9, 166–175. [Google Scholar] [CrossRef]
  26. Wang, Z.; Chen, B.; Wang, J.; Kim, J.; Begovic, M.M. Robust optimization based optimal DG placement in microgrids. IEEE Trans. Smart Grid 2014, 5, 2173–2182. [Google Scholar] [CrossRef]
  27. Eltamaly, A.M.; Mohamed, M.A.; Alolah, A.I. A novel smart grid theory for optimal sizing of hybrid renewable energy systems. Sol. Energy 2016, 124, 26–38. [Google Scholar] [CrossRef]
  28. Jafari, A.; Khalili, T.; Ganjehlou, H.G.; Bidram, A. Optimal integration of renewable energy sources, diesel generators, and demand response program from pollution, financial, and reliability viewpoints: A multi-objective approach. J. Clean. Prod. 2020, 247, 119100. [Google Scholar] [CrossRef]
  29. Uluski, R.; Kumar, J.; Venkata, S.S.; Vishwakarma, D.; Schneider, K.; Mehrizi-Sani, A.; Terry, R.; Agate, W. Microgrid controller design, implementation, and deployment: A journey from conception to implementation at the philadelphia navy yard. IEEE Power Energy Mag. 2017, 15, 50–62. [Google Scholar] [CrossRef]
  30. Folmer, R.L.; Griest, S.E.; Meikle, M.B.; Martin, W.H. Tinnitus severity, loudness, and depression. Otolaryngol.—Head Neck Surg. 1999, 121, 48–51. [Google Scholar] [CrossRef]
  31. Li, L.; Wang, Y.; Liu, Y. Wind velocity prediction at wind turbine hub height based on CFD model. In Proceedings of the 2013 International Conference on Materials for Renewable Energy and Environment, Chengdu, China, 19–21 August 2013; volume 1, pp. 411–414. [Google Scholar]
  32. Lan, H.; Wen, S.; Hong, Y.Y.; Yu, D.C.; Zhang, L. Optimal sizing of hybrid PV/diesel/battery in ship power system. Appl. Energy 2015, 158, 26–34. [Google Scholar] [CrossRef] [Green Version]
  33. Park, C.S.; Kim, G.; Choi, S. Engineering Economics; Prentice Hall: Upper Saddle River, NJ, USA, 2007; Volume 22. [Google Scholar]
  34. Li, C.Z.; Shi, Y.M.; Huang, X.H. Sensitivity analysis of energy demands on performance of CCHP system. Energy Convers. Manag. 2008, 49, 3491–3497. [Google Scholar] [CrossRef]
  35. Mavrotas, G.; Diakoulaki, D.; Florios, K.; Georgiou, P. A mathematical programming framework for energy planning in services’ sector buildings under uncertainty in load demand: The case of a hospital in athens. Energy Policy 2008, 36, 2415–2429. [Google Scholar] [CrossRef]
  36. Siddiqui, A.S.; Marnay, C. Distributed generation investment by a microgrid under uncertainty. Energy 2008, 33, 1729–1737. [Google Scholar] [CrossRef] [Green Version]
  37. Rezvan, A.T.; Gharneh, N.S.; Gharehpetian, G.B. Robust optimization of distributed generation investment in buildings. Energy 2012, 48, 455–463. [Google Scholar] [CrossRef]
  38. Bertsimas, D.; Sim, M. The price of robustness. Oper. Res. 2004, 52, 35–53. [Google Scholar] [CrossRef]
  39. Gorissen, B.L.; Yanikoğlu, I.; den Hertog, D. A practical guide to robust optimization. Omega 2015, 53, 124–137. [Google Scholar] [CrossRef] [Green Version]
  40. Zheng, T.; Zhao, J.; Litvinov, E.; Zhao, F. Robust optimization and its application to power system operation. CIGRE Int. Counc. Large Electr. Syst. 2012, 1–8. Available online: https://e-cigre.org/publication/C2-110_2012-robust-optimization-and-its-application-to-power-system-operation (accessed on 30 August 2021).
  41. Soyster, A.L. Technical note—Convex programming with set-inclusive constraints and applications to inexact linear programming. Oper. Res. 1973, 21, 1154–1157. [Google Scholar] [CrossRef] [Green Version]
  42. Li, Z.; Ding, R.; Floudas, C.A. A comparative theoretical and computational study on robust counterpart optimization: I. robust linear optimization and robust mixed integer linear optimization. Ind. Eng. Chem. Res. 2011, 50, 10567–10603. [Google Scholar] [CrossRef] [Green Version]
  43. Hussain, A.; Bui, V.H.; Kim, H.M. Robust optimization-based scheduling of multi-microgrids considering uncertainties. Energies 2016, 9, 278. [Google Scholar] [CrossRef] [Green Version]
  44. Hussain, A.; Bui, V.H.; Kim, H.M. Impact analysis of demand response intensity and energy storage size on operation of networked microgrids. Energies 2017, 10, 882. [Google Scholar] [CrossRef] [Green Version]
  45. Mehdizadeh, A.; Taghizadegan, N. Robust optimisation approach for bidding strategy of renewable generation-based microgrid under demand side management. IET Renew. Power Gener. 2017, 11, 1446–1455. [Google Scholar] [CrossRef]
  46. Sioshansi, R.; Conejo, A.J. Optimization Is Ubiquitous; Springer: Cham, Switzerland, 2017; Volume 120, ISBN 1931-6828. [Google Scholar]
  47. Mazidi, M.; Zakariazadeh, A.; Jadid, S.; Siano, P. Integrated scheduling of renewable generation and demand response programs in a microgrid. Energy Convers. Manag. 2014, 86, 1118–1127. [Google Scholar] [CrossRef]
  48. LAZARD. Lazard’S Levelized Cost of Storage Analysis—Version 3.0.; LAZARD: Hamilton, Bermuda, 2017. [Google Scholar]
  49. LAZARD. Lazard’s Levelized Cost of Energy Analysis—Version 11.0.; LAZARD: Hamilton, Bermuda, 2017. [Google Scholar]
  50. Corporation, G.D. General Algebraic Modeling System (GAMS). Release; General Algebraic Modeling System (GAMS): Washington, DC, USA, 2013. [Google Scholar]
  51. Tawarmalani, M.; Sahinidis, N.V. A polyhedral branch-and-cut approach to global optimization. Math. Program. 2005, 103, 225–249. [Google Scholar] [CrossRef]
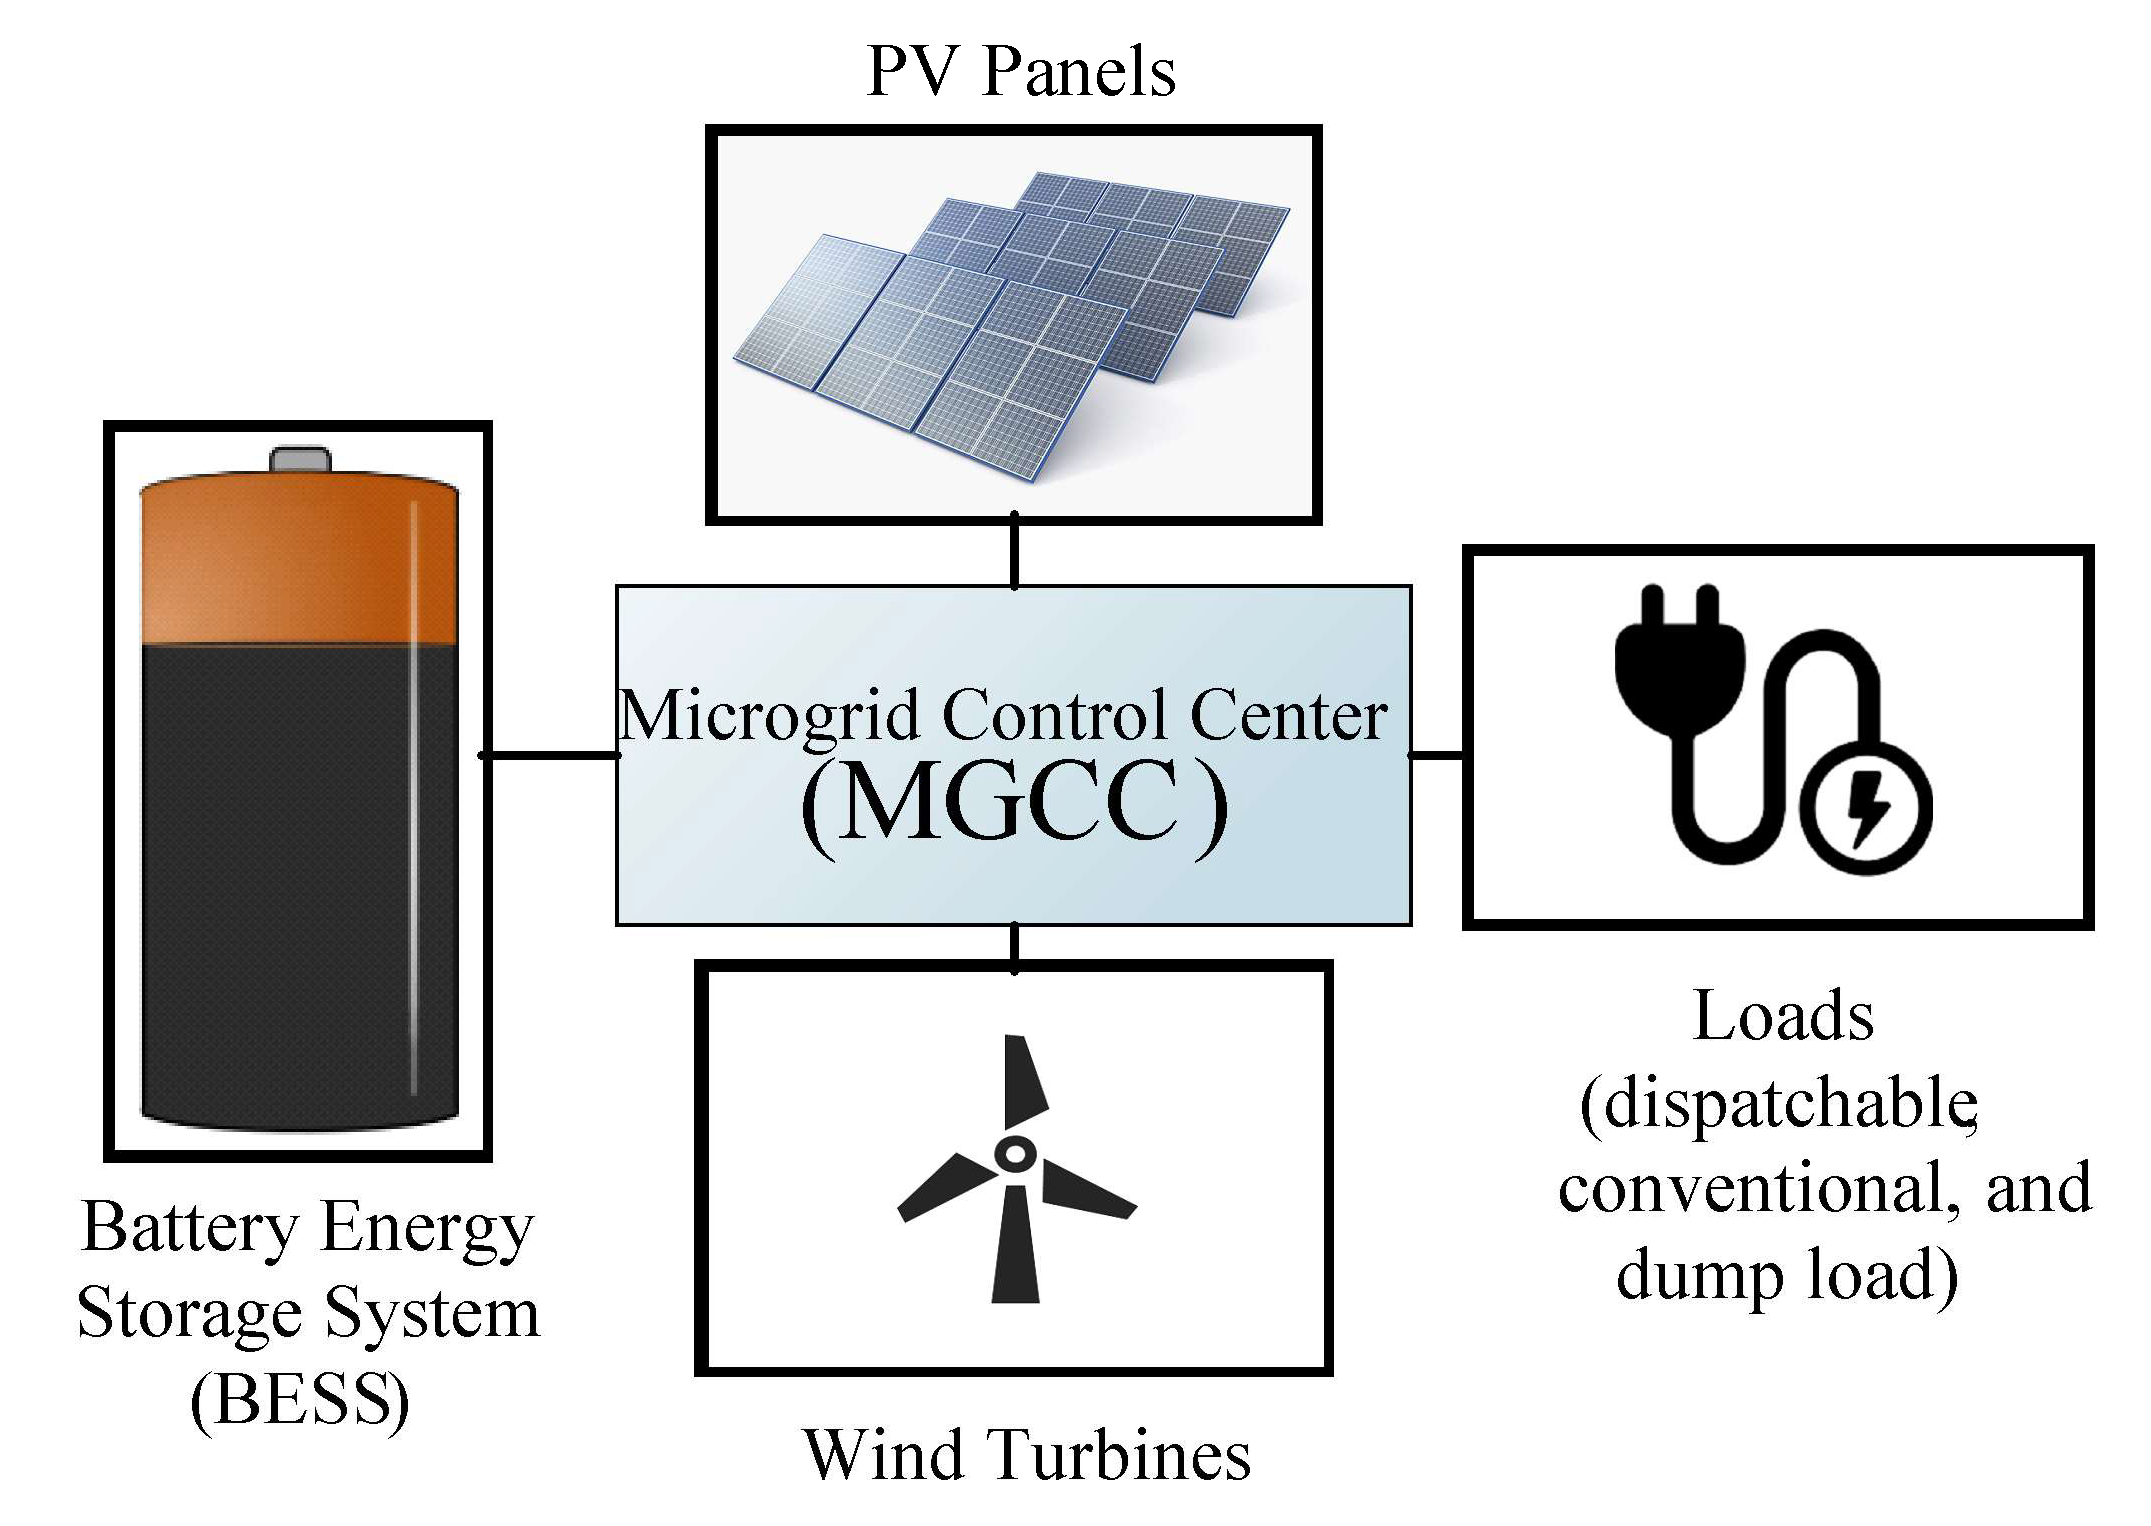
Figure 1. Structure of studied microgrid.
Energies 14 05750 g001
Figure 2. Average wind speed annual data.
Energies 14 05750 g002
Figure 3. Average sun radiation annual data.
Energies 14 05750 g003
Figure 4. Daily data for three types of demand [47].
Energies 14 05750 g004
Figure 5. Statistical dispersion of demand for a one-year horizon.
Energies 14 05750 g005
Figure 6. NPC for simulation with a 10% uncertainty set.
Energies 14 05750 g006
Figure 7. The calculated capacity of microgrid components with a 10% uncertainty set bound.
Energies 14 05750 g007
Figure 8. Comparison of statistical demand dispersion for a one-year horizon after DRP implementation.
Energies 14 05750 g008
Figure 9. Total shifted cumulative demand versus average power output of a PV module for a one-year horizon.
Energies 14 05750 g009
Figure 10. BESS state of charge versus wind speed.
Energies 14 05750 g010
Table 1. Demand model coefficients.
Type P type C Season ,   type ( 1 R F )
WinterSpringSummerAutumn
Industrial 51.111.110.25
Commercial 21.111.11
Residential 7.51.311.31
Table 2. Project and components specifications [19,48,49].
PV Panels SpecificationsWind Turbine SpecificationsBESS Specifications
Rated Power1 kWRated power ( P r ) 3 kWRated Capacity ( E r a t e d )1 kW
η p v 85% v   r a t e d 9 m/s η B A T 80%
-- v c u t   o u t 20 m/sInvestment Cost ( I C )494 USD
Lifetime ( M 0 )20 years v c u t   i n 2.1 m/sDepth of Discharge ( D O D ) 80%
Investment Cost ( I C )2500 USDLifetime ( M 0 )20 yearsSelf-Discharge ( σ )0.002
--Investment Cost ( I C )3900 USDLifetime ( M 0 )5 years
Project General Specifications
Interest rate ( i )6%Replacement Cost ( R e p ) 90% I C Residual Value ( R e s )10% I C
O & M 5% ICProject Horizon ( N )20 years--
Table 3. Parameter values for sensitivity analysis.
ScenarioUncertainty Set Γ P P NPC (USD)
1 (BS)-00% 437,386.5 (BS)
2-020%420,729.8
3-040%407,675.6
4%(90–110)0.50%451,116.7
5%(90–110)0.520%433,455.8
6%(90–110)0.540%426,338.4
7%(90–110)10%462,118.4
8%(90–110)120%442,623.4
9%(90–110)140%432,407.5
10%(90–110)1.50%466,571.3
11%(90–110)1.520%443,911.6
12%(90–110)1.540%434,896.2
13%(90–110)20%468,295.6
14%(90–110)220%455,480.1
15%(90–110)240%438,584.7
16%(80–120)0.50%462,118.4
17%(80–120)0.520%441,183.1
18%(80–120)0.540%432,407.5
19%(80–120)10%488,574.7
20 (TS)%(80–120)120% 470,913.8 (TS)
21%(80–120)140%460,502.1
22%(80–120)1.50%495,756
23%(80–120)1.520%478,095.1
24%(80–120)1.540%466,373.2
25 (WS)%(80–120)20% 508,918.2 (WS)
26%(80–120)220%488,004.9
27%(80–120)240%474,012.8
Table 4. Cost function value for different solvers in GAMS software.
GAMS SolverBARONALPHAECPLINDOGLOBALSCIP
Base Scenario’s Investment Cost (USD)437,386.5441,381.1444,283.8442,123.3
Table 5. Cost function value for different scenarios for investigating the investment cost.
ScenarioUncertainty Set Γ P P NPC (USD)
1 (BS)-00%437,386.5 (BS)
25 (WS)%(80–120)20%508,918.2 (WS)
26%(80–120)220%488,004.9
Publisher’s Note: MDPI stays neutral with regard to jurisdictional claims in published maps and institutional affiliations.