Article

A Study on the Predictive Maintenance Algorithms Considering Load Characteristics of PMSMs to Drive EGR Blowers for Smart Ships

High Power Electric Propulsion Center, Korea Maine Equipment Research Institute, Ulsan 44776, Korea
Energies 2021, 14(18), 5744; https://doi.org/10.3390/en14185744
Submission received: 26 June 2021 / Revised: 12 August 2021 / Accepted: 27 August 2021 / Published: 13 September 2021
(This article belongs to the Special Issue Advances in Shipboard Power Systems)

Abstract

:
Exhaust gas recirculation (EGR) is a NOx reduction technology that can meet stringent environmental regulatory requirements. EGR blower systems must be used to increase the exhaust gas pressure at a lower rate than the scavenging air pressure. Electric motor drive systems are essential to rotate the EGR blowers. For the effective management of the EGR blower systems in smart ships, there is a growing need for predictive maintenance technology fused with information and communication technology (ICT). Since an electric motor accounts for about 80% of electric loads driven by the EGR, it is essential to apply the predictive maintenance technology of the electric motor to maximize the reliability and operation time of the EGR blower system. Therefore, this paper presents the predictive maintenance algorithm to prevent the stator winding turn faults, which is the most significant cause of the electrical failure of the electric motors. The proposed algorithm predicts the remaining useful life (RUL) by obtaining the winding temperature value by considering the load characteristics of the electric motor. The validity of the proposed algorithm is verified through the simulation results of an EGR blower system model and the experimental results derived from using a test rig.

1. Introduction

The International Maritime Organization (IMO) regulations on pollutants emitted from ships are getting stronger every year. The IMO NOx Tier III regulations require newly built ships with keel placement after 2016 to reduce emission control areas (ECA) by approximately 76% compared to the Tier II regulatory values [1]. To satisfy these strict requirements, various NOx reduction technologies are being continuously studied. Typically, exhaust after-treatment technologies, such as exhaust gas recirculation (EGR) and selective catalytic reduction (SCR), are the main options for ship manufacturers to ensure their environmental requirements [2,3,4,5,6,7,8,9]. The SCR method is the most effective for reducing NOx emissions using the urea–water solution. However, this system has the disadvantages of significant volume footprint requirements, additional weight, increased capital cost, engine heat, and pressure drop. Moreover, the efficiency of the SCR is highly dependent on the exhaust gas inlet temperature and the system maintenance [10,11].
On the other hand, EGR is a technology that recirculates a part of exhaust gas discharged from an installed engine to the intake air. It can reduce the oxygen concentration in the combustion chamber and increase the ratio of inert gas, thereby suppressing the temperature rise of combustion gas and thermal NOx formation reactions [12,13,14,15]. Because NOx is formed when oxygen and nitrogen combine due to extreme cylinder temperatures, replacing some of the oxygen (O2) in the cylinder with inert exhaust gas (CO2) reduces NOx production. Recirculating this small fraction of exhaust gas back through the intake manifold can provide other benefits besides NOx reduction [16,17,18].
One of the additional benefits of modern EGR systems is that the internal engine air temperature is maintained. Thermodynamics plays an important role in the atomization of fuels in gasoline and diesel engines. For this reason, the internal engine temperature must be manipulated carefully and accurately. Modern EGR systems are designed with this in mind. The EGR system can help achieve the desired internal engine air temperature to reduce NOx, and this adds another benefit: a reduction in internal engine temperature is also associated with increased engine life. Valves, especially exhaust valves, are susceptible to stress from sudden temperature changes and the loads they must withstand. Exhaust and intake valve failures are directly related to engine failure, as valve failures often damage pistons, connecting rods, and cylinder walls. Keeping the valve cooler can help the valve last longer and stay in the proper position [19,20,21].
Figure 1 shows a configuration of the EGR system for the smart ship. The EGR system has two loops (the main loop and the EGR loop) to induce the air (exhaust gas and fresh air) into the scavenge air receiver. The main loop is positioned to deliver fresh air through the compressor and cooler. The EGR loop is positioned so that the recirculated exhaust gas is delivered to the scavenge air receiver. The EGR loop contains the EGR scrubber, demister, and EGR blower system. Since the pressure of the exhaust gas is lower than the pressure of the scavenging air, the recirculated exhaust gas should be forced by the EGR blower [22]. The EGR blower system is classified as an impeller and an electric motor drive system with an inverter.
With the advent of the fourth industrial revolution, predictive maintenance techniques for the non-intrusive management of electrical and mechanical systems on smart ships have been the subject of many research papers in recent years [23].
Since the electric motors make up about 80% of all electrical loads driven in the EGR, there has been much focus on ways to better diagnose the wellness condition of these motors. To maximize the reliability and operation time of the EGR blower system, it is essential to apply the predictive maintenance technology of the electric motor [24]. The frequent causes of electric motor failures are bearing failures (41%), stator winding turn faults (37%), and other causes (22%). The main causes of stator turn winding faults are the overvoltage due to the PWM waveforms of an inverter and the insulation aging due to the winding temperature [25]. The EGR blower system suppresses the overvoltage by adding an LC filter to the output of the inverter. However, the winding temperature of the electric motor for the EGR blower depends on the input phase current according to the load fluctuation. Thermal aging of the motor, due to these phase currents, is also a major cause of winding turn faults. The existing studies performed accelerated life evaluation using sample coils to predict the remaining life of motor windings [26,27,28]. They cannot predict the remaining life, depending on the load on the system. Predictive maintenance is the accurate inference of the life of a part based on the experience and data recorded by the sensor. Predictive maintenance is a huge advantage for businesses. Factory closures are expensive and knowing the remaining life of a part allows businesses to replace a part during their operational downtime, thus reducing maintenance costs by 30% and unplanned downtime by 70% [29].
It is necessary to consider these load characteristics in predicting the insulation aging of the winding. Therefore, this paper proposes the predictive maintenance algorithm, which considers the load characteristics of permanent magnet synchronous motors (PMSMs) for driving the EGR blowers for smart ships to prevent stator winding turn faults. Based on the trend line of the required lifetimes according to the winding temperature, the proposed algorithm derives the predicted remaining life of winding by using the information about the motor that is received through wireless communication with the inverter.
To prove the validity of the proposed algorithm, the power load of the PMSM—based on the EGR blower performance curves—is analyzed for each speed, according to the air flow and the power equation and is derived using the trend line. Based on the derived power equation, the performance of the PMSM that is suitable for the EGR blower operation is analyzed through a basic design and an electromagnetic field analysis. The operation simulation of the EGR blower system for one day is performed using the load model, and the RUL results are analyzed. Then, the validity of the proposed algorithm is verified through comparison with the experimental results.

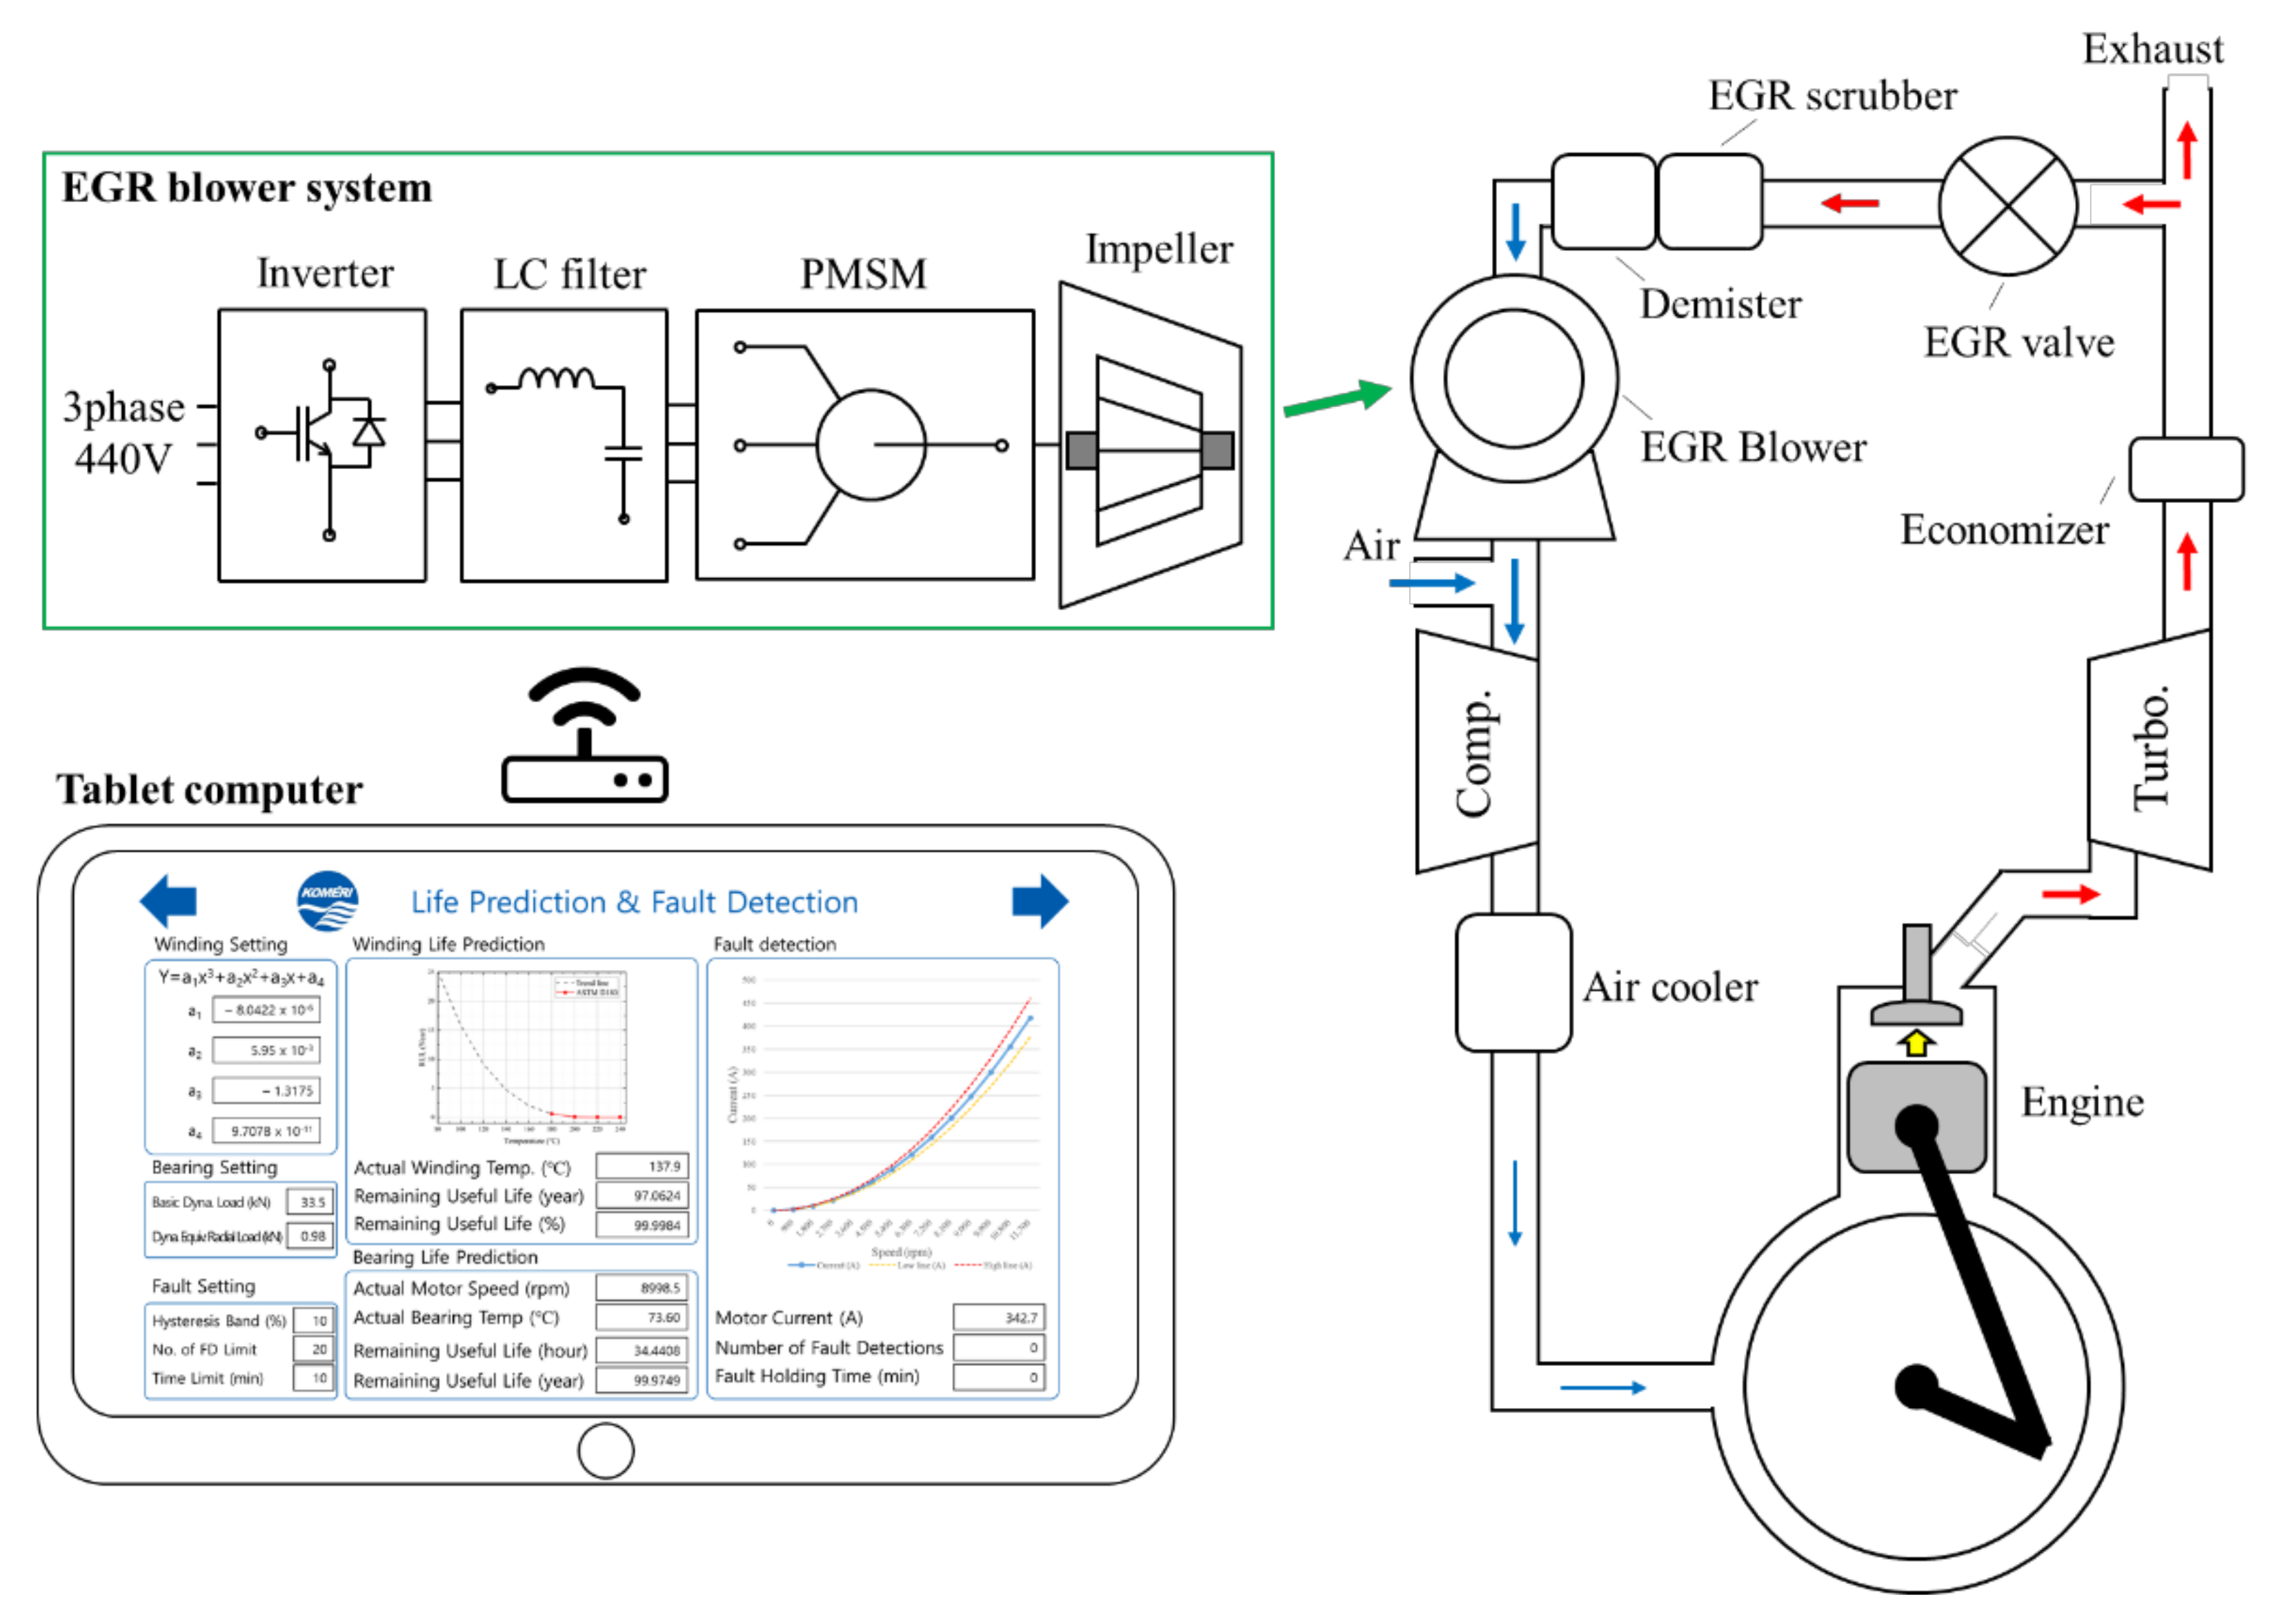
2. Performance Analysis of the EGR Blower System

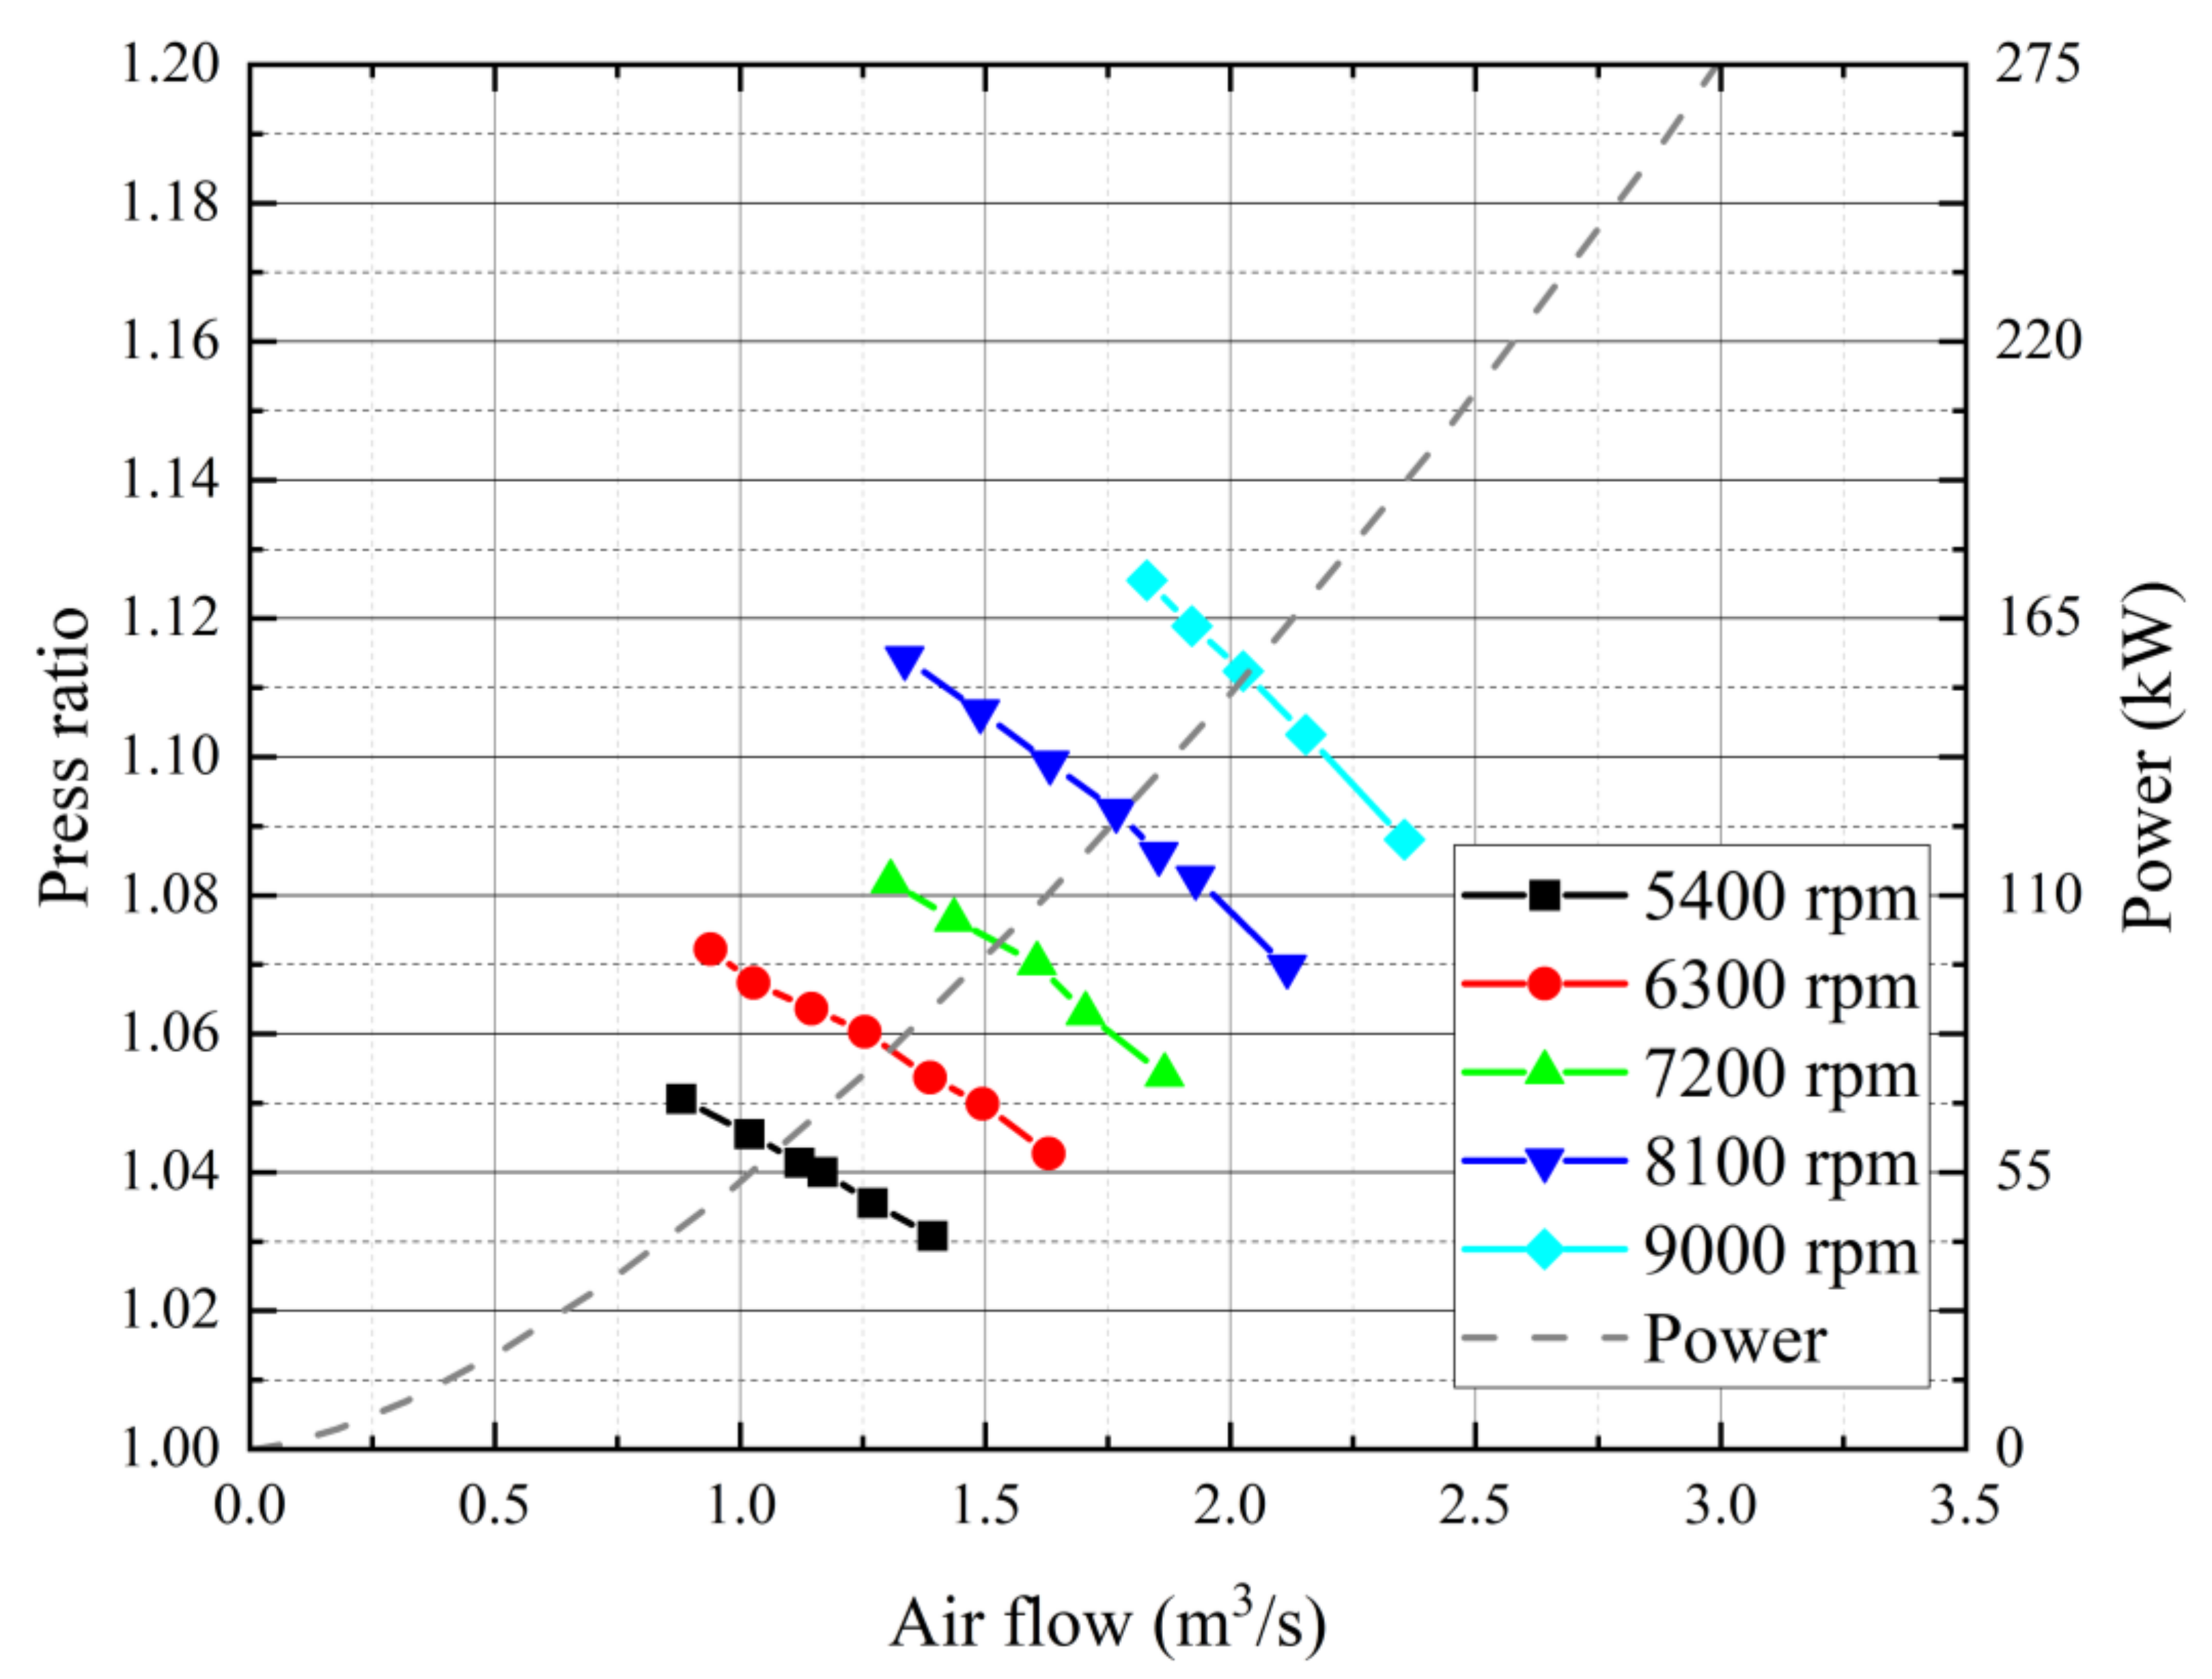
2.1. Performance Analysis of the EGR Blower

Figure 2 shows the performance curves of the EGR blower. The press ratio is a ratio of inlet pressure and outlet pressure. The EGR blower delivers the required air flow to the engine by controlling the speed of the PMSM while maintaining a constant pressure. The range of required air flow is 1~2 m3/s, so the speed control range is from 5400 rpm to 9000 rpm. In this control range, the transmission power to the impeller in the EGR blower for stable air flow supply can be expressed as follows [30]:
P L = K blower 2 π n 60 3
where Kblower is the EGR blower constant [31], and n is the rotor rotation speed in rpm. When the air flow and pressure ratios are 2 m3/s and 1.11, respectively, the required transmission power and torque are 150 kW and 159 Nm, respectively, at 9000 rpm. Table 1 shows the specification of the EGR blower and the selected specifications of the PMSM while considering the performance curve of the EGR blower. The specifications of the EGR blower system are as follows: a pressure of 3.5 bar, an input voltage of 440 V, a rated current of 340 A, 8 poles, 36 slots, and the insulation class F.

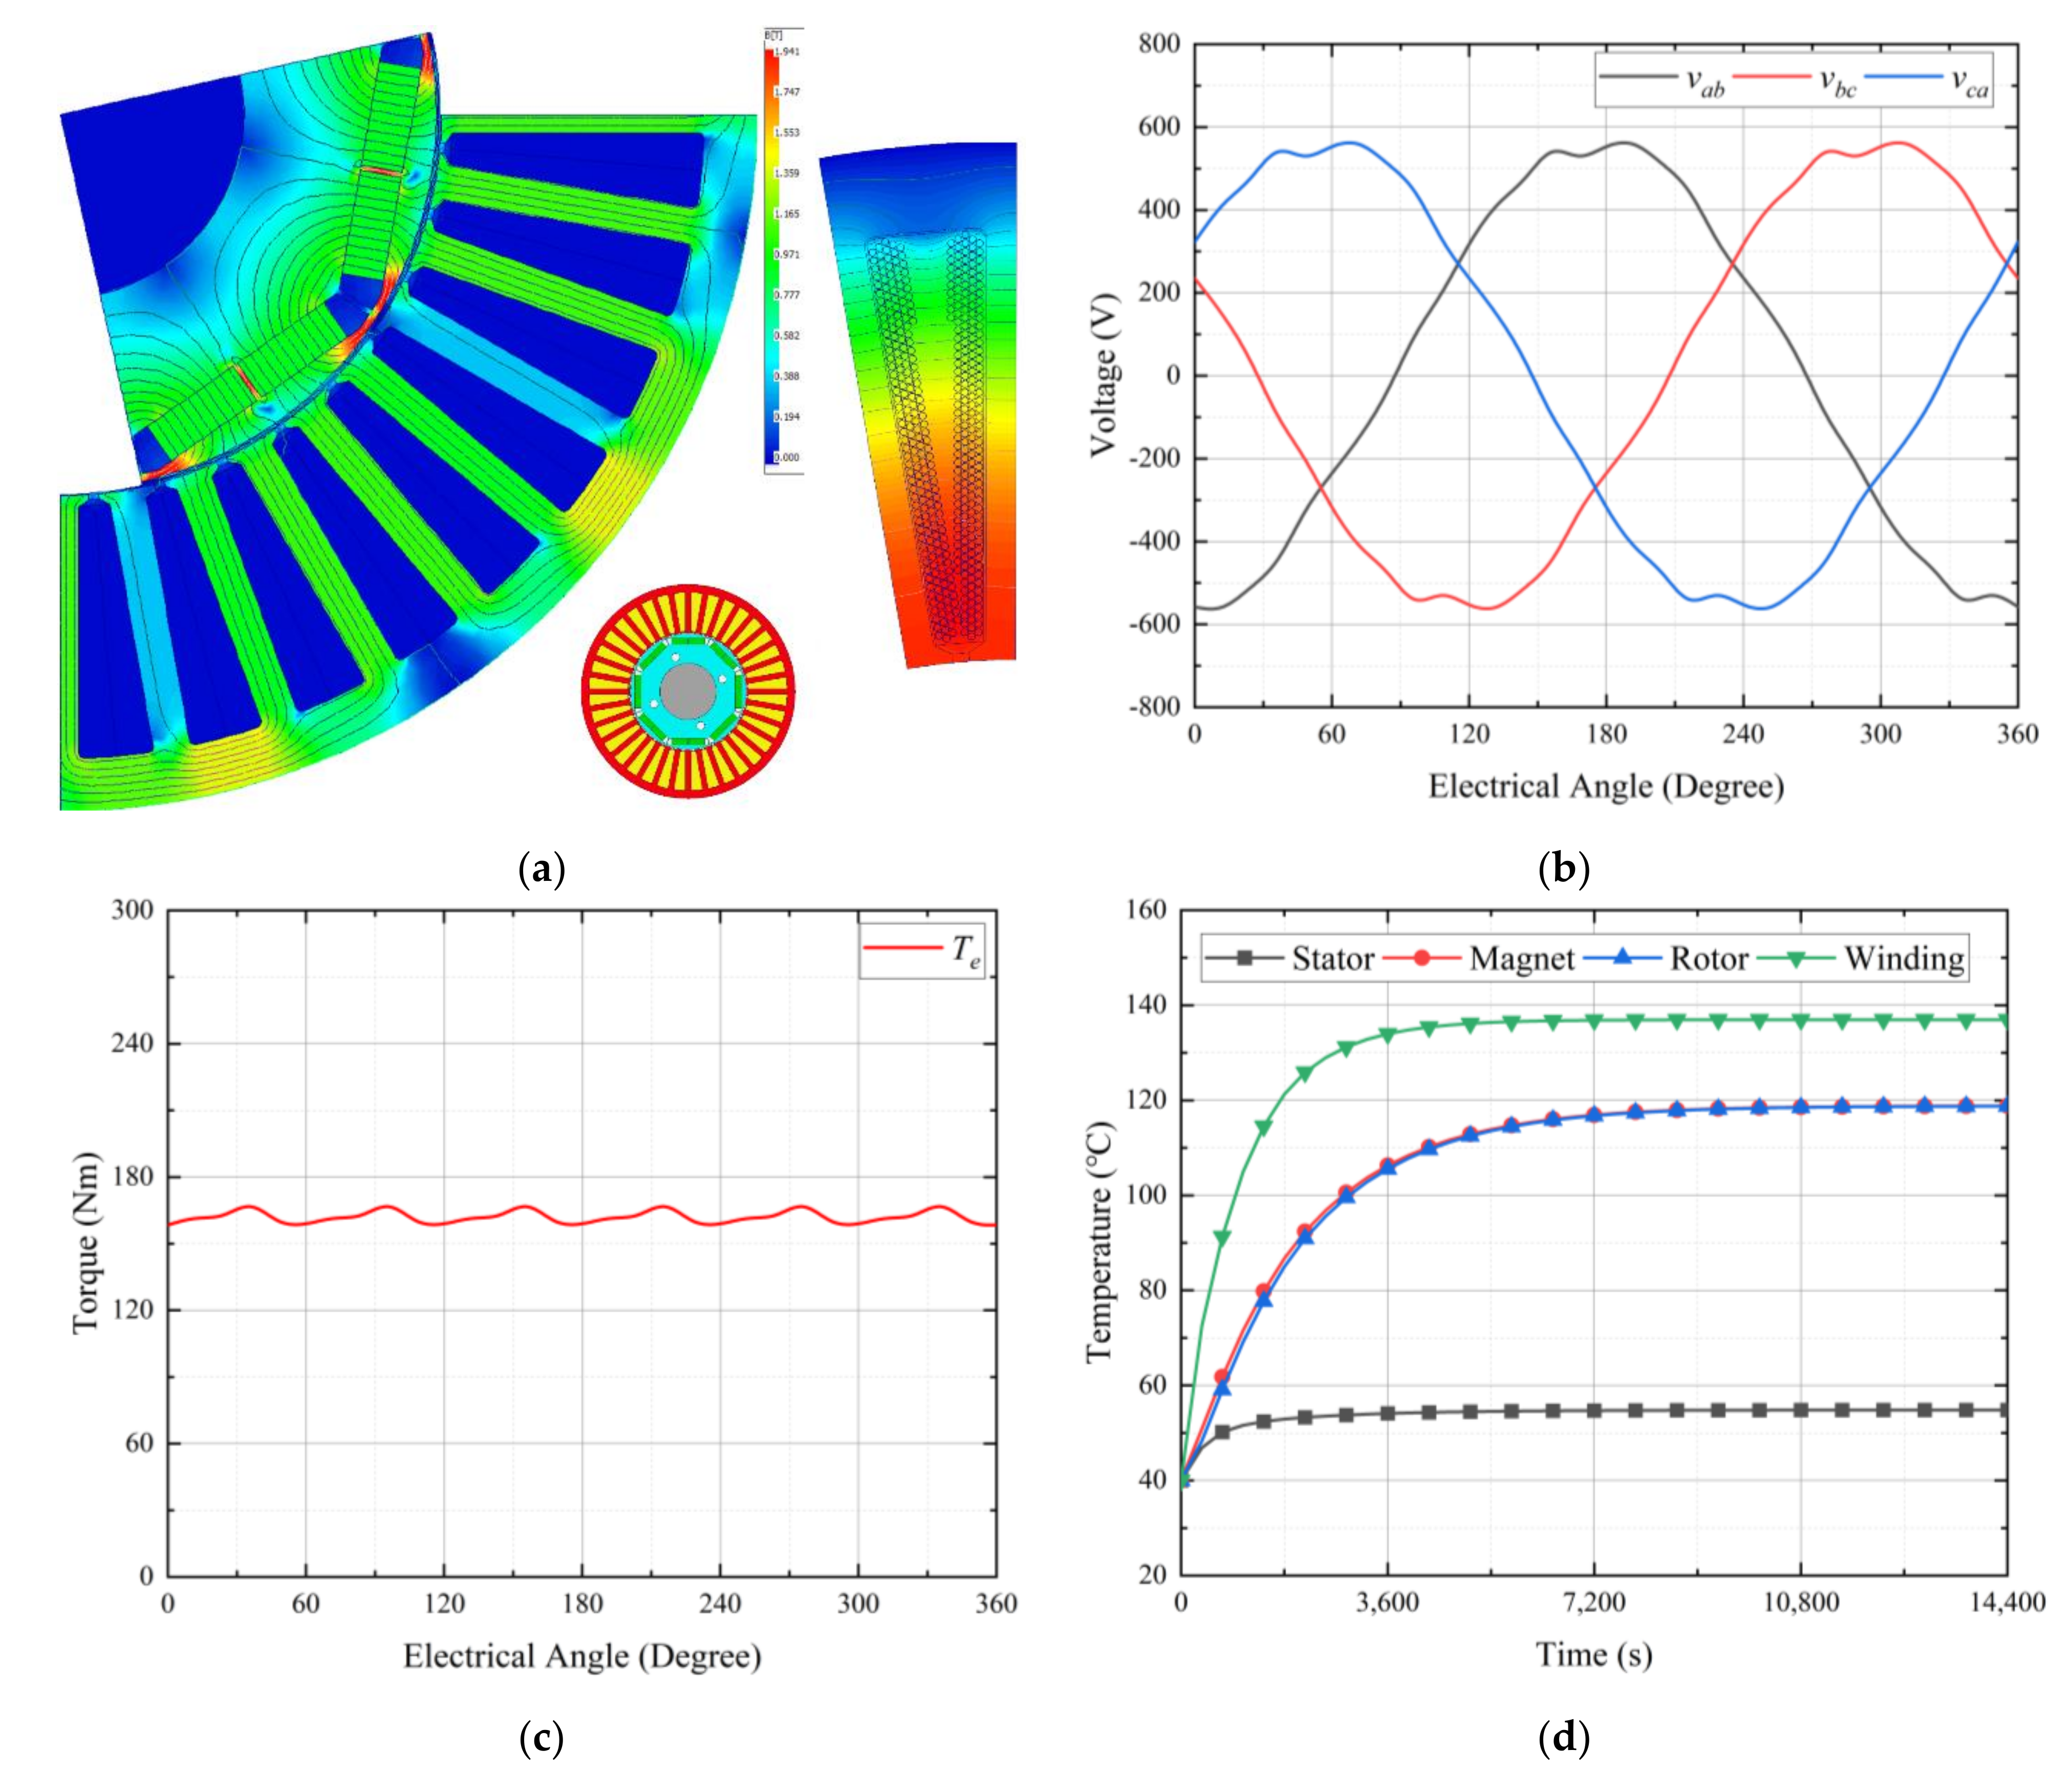
2.2. Performance Analysis of the PMSM

Figure 3a shows the geometric and FEA results of the PMSM using the electric motor software Motor-CAD. Figure 3b,c show the finite element analysis results of the PMSM based on Table 1. When three-phase sine wave currents of 340 A are conducted in three phases, the windings of PMSM are at a rated speed of 9000 rpm and the peak value of the line voltage is 569.6 V, which has a voltage margin of about 8.5% compared to the DC link voltage of 622 V of the inverter. The electromagnetic torque and efficiency of the PMSM are 162 Nm and 96.5%, respectively, which satisfies the requirements of the blower. Figure 3d shows the temperature saturation curves of the PMSM, where the ambient temperature maintained at 40 °C, the point with the highest saturation temperature is 137 °C for the winding, the saturation time is about 2 h, and it satisfies the required insulation class F.

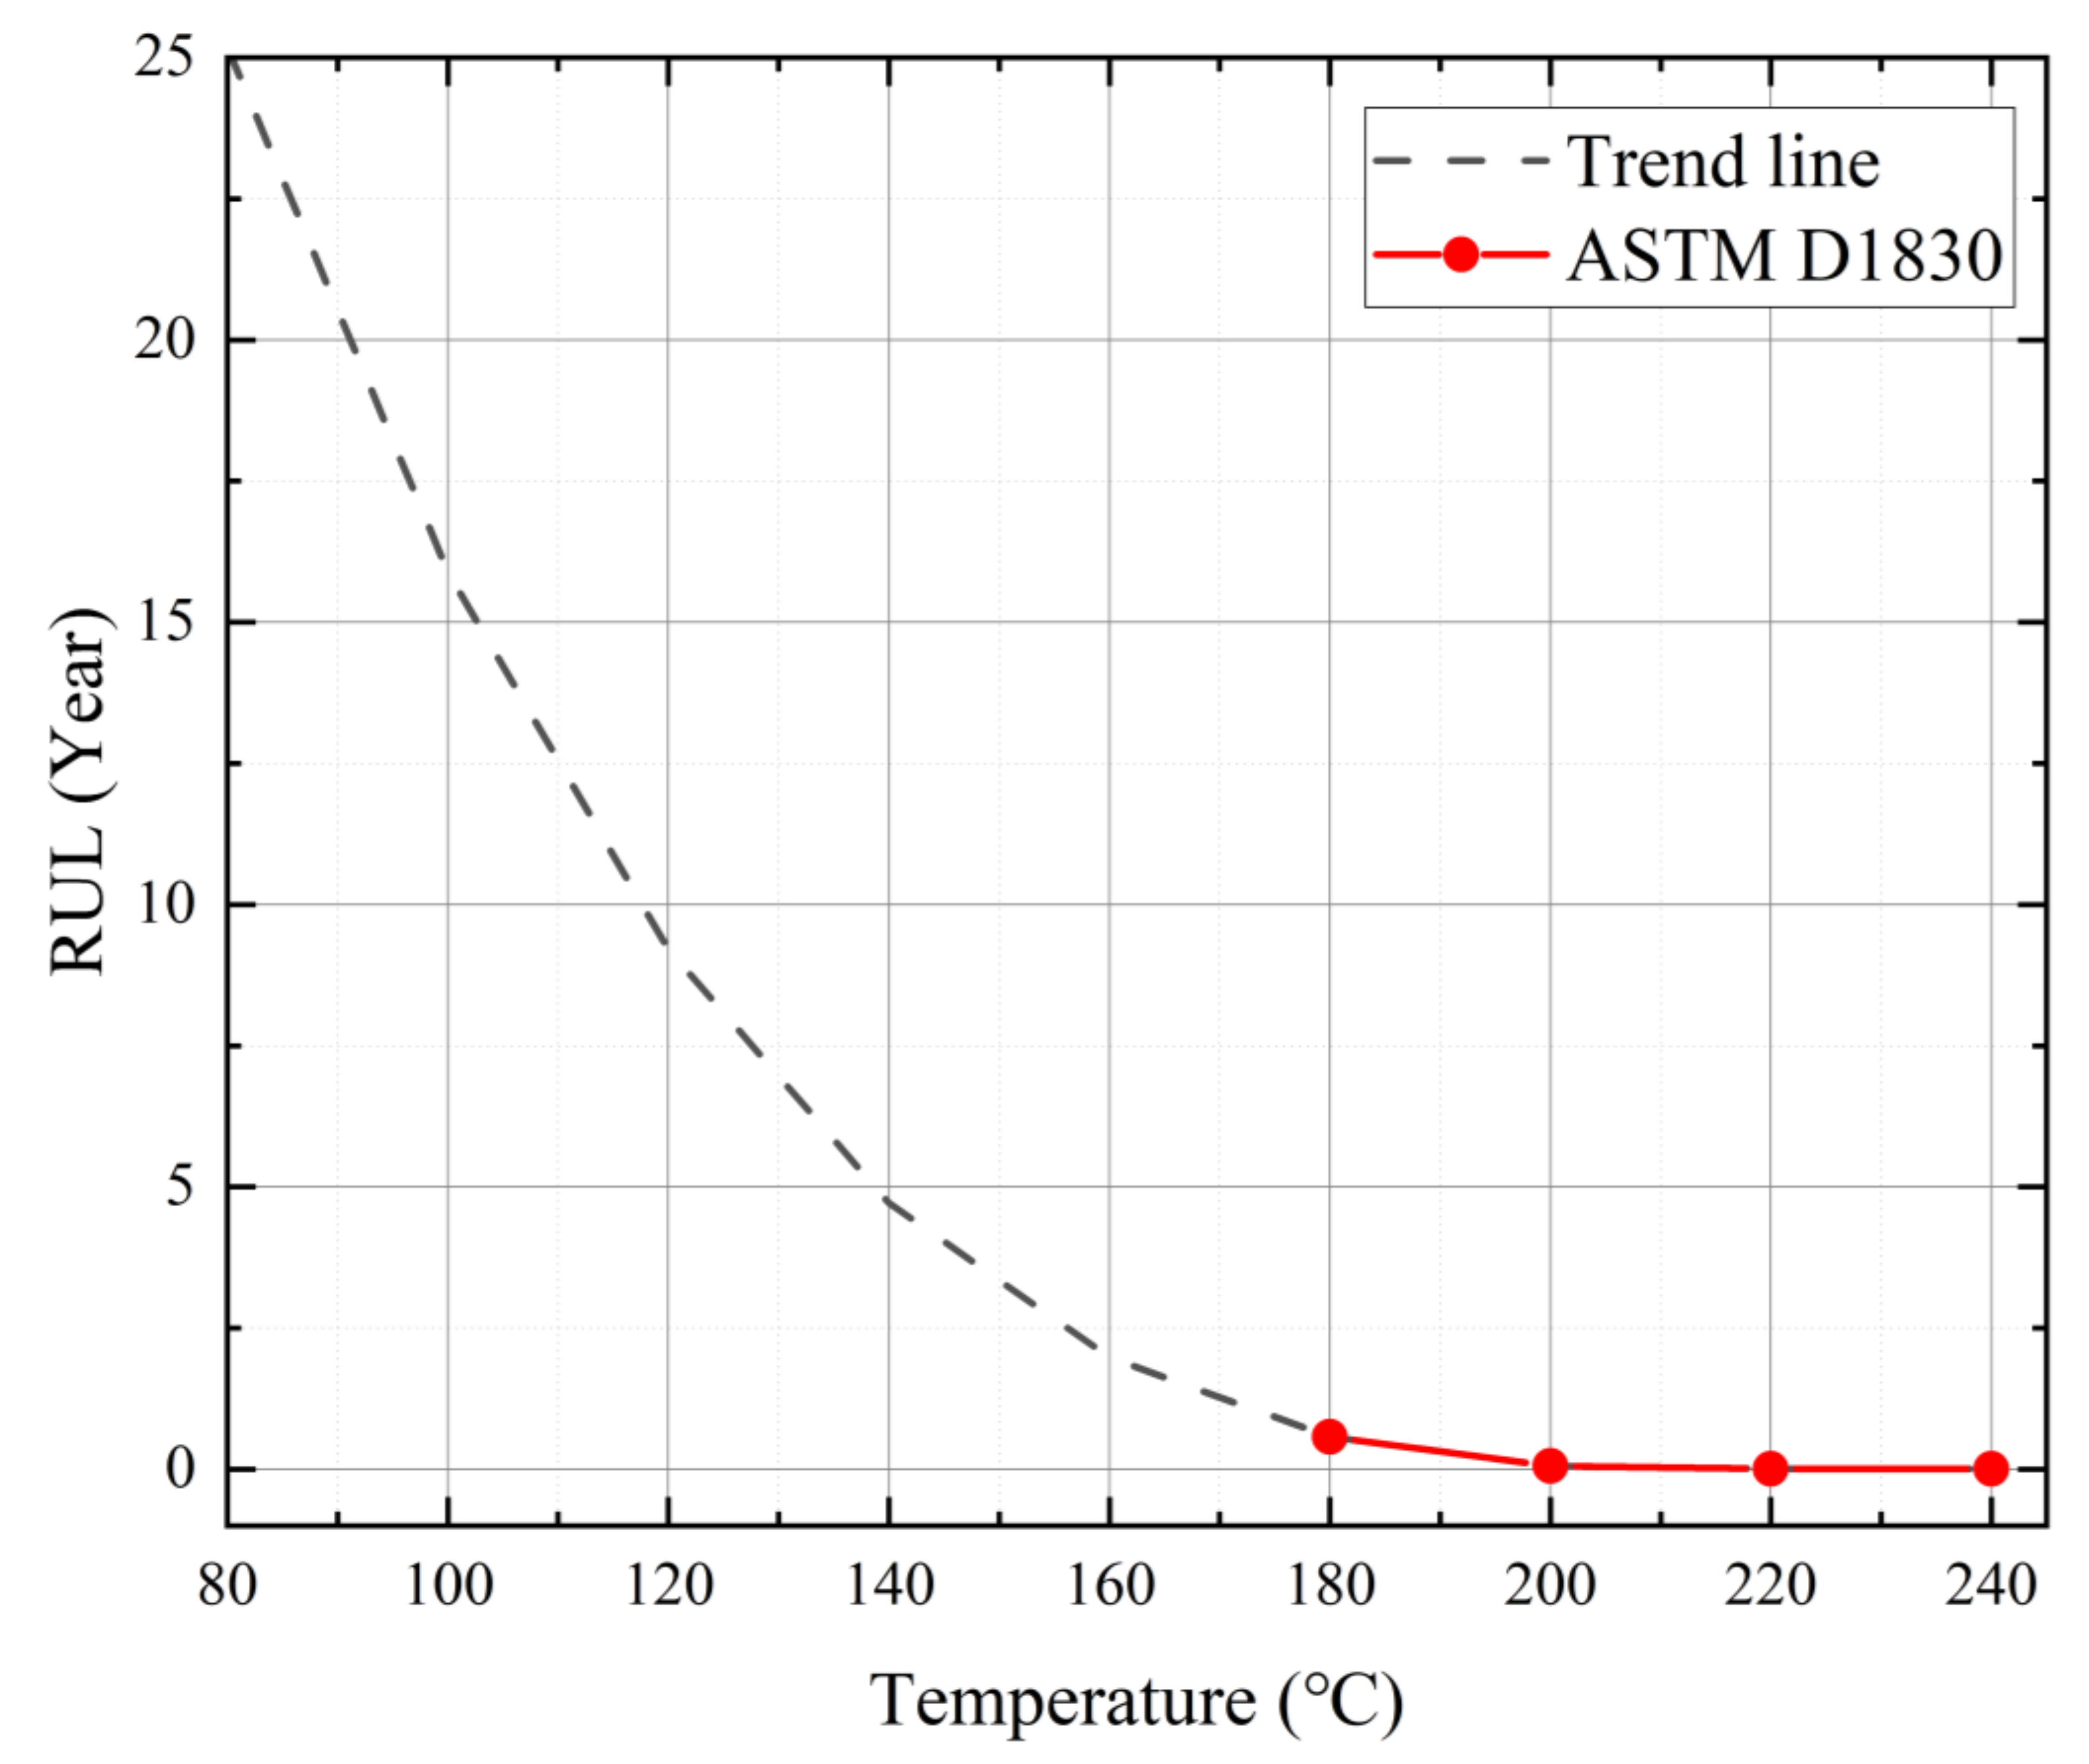
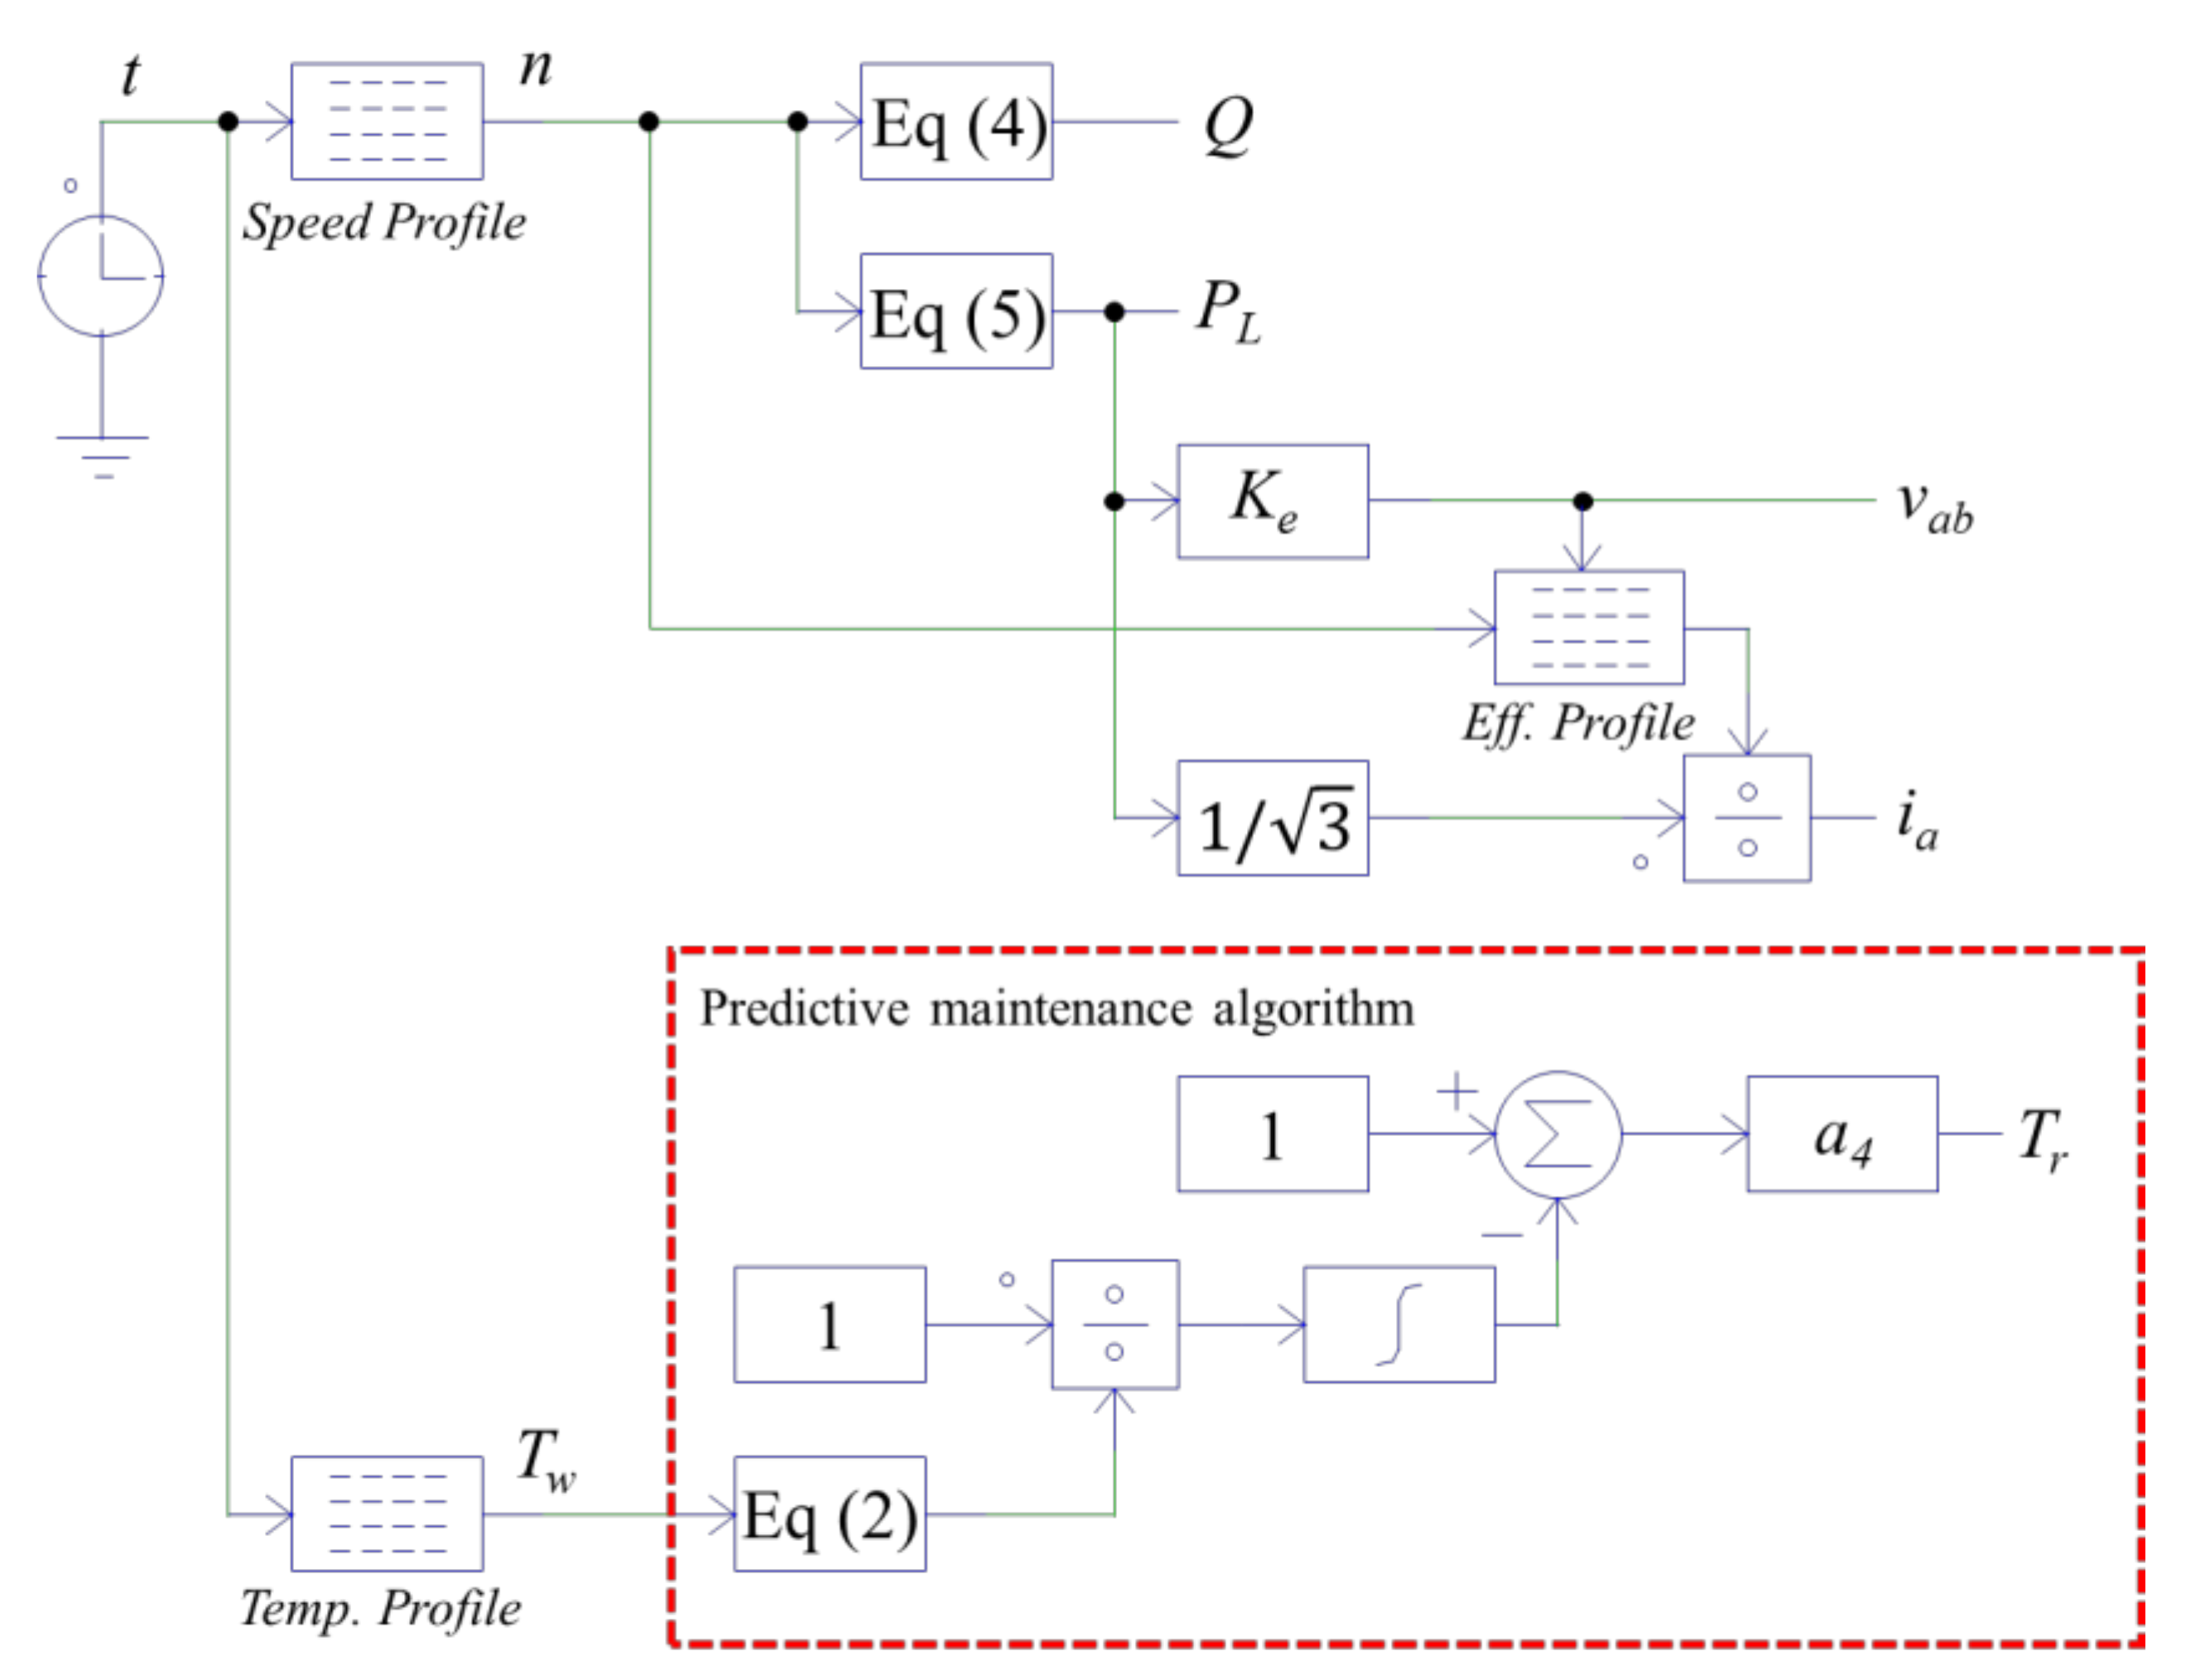
3. Predictive Maintenance Algorithm of the PMSM

Table 2 shows the minimum lifetimes according to the winding temperatures required by ASTM D1830 when the insulation class of the electric motor is F. The designed PMSM has an insulation class F and operates under 140 °C, as shown in Figure 3d. Therefore, a trend line is used to predict the lifetimes of the winding over the operating temperature range. Figure 4 shows the trend line of the required lifetimes according to the winding temperatures, based on the ASTM D1830.
The equation (Tl), using the trend line analysis of the required lifetime curves according to the winding temperature, can be expressed as follows:
T l = 8 . 94   ×   10 6 T w 3 + 5 . 95   ×   10 3 T w 2 1 . 31 T w + 97 . 08
where TW is the real-time temperature of the winding. The winding temperature of the PMSM for driving the EGR blower is measured in real-time by a temperature sensor installed inside the PMSM. The analog signal of the temperature sensor is transmitted to the inverter, converted into digital data, and transmitted to a tablet computer through wireless communication. The transmitted information calculates the RUL using the predictive maintenance algorithm equation. The RUL equation (Tr), can be expressed as follows:
T r = T i 1   1 T l dt
The RUL, according to the real-time temperature data, is calculated and integrated to calculate the reduction amount. After that, this value is subtracted from the initial RUL value (Ti) to finally calculate the RUL for predictive maintenance. Ti is 97.08 when Tw is 0 in Equation (2).

4. Verification

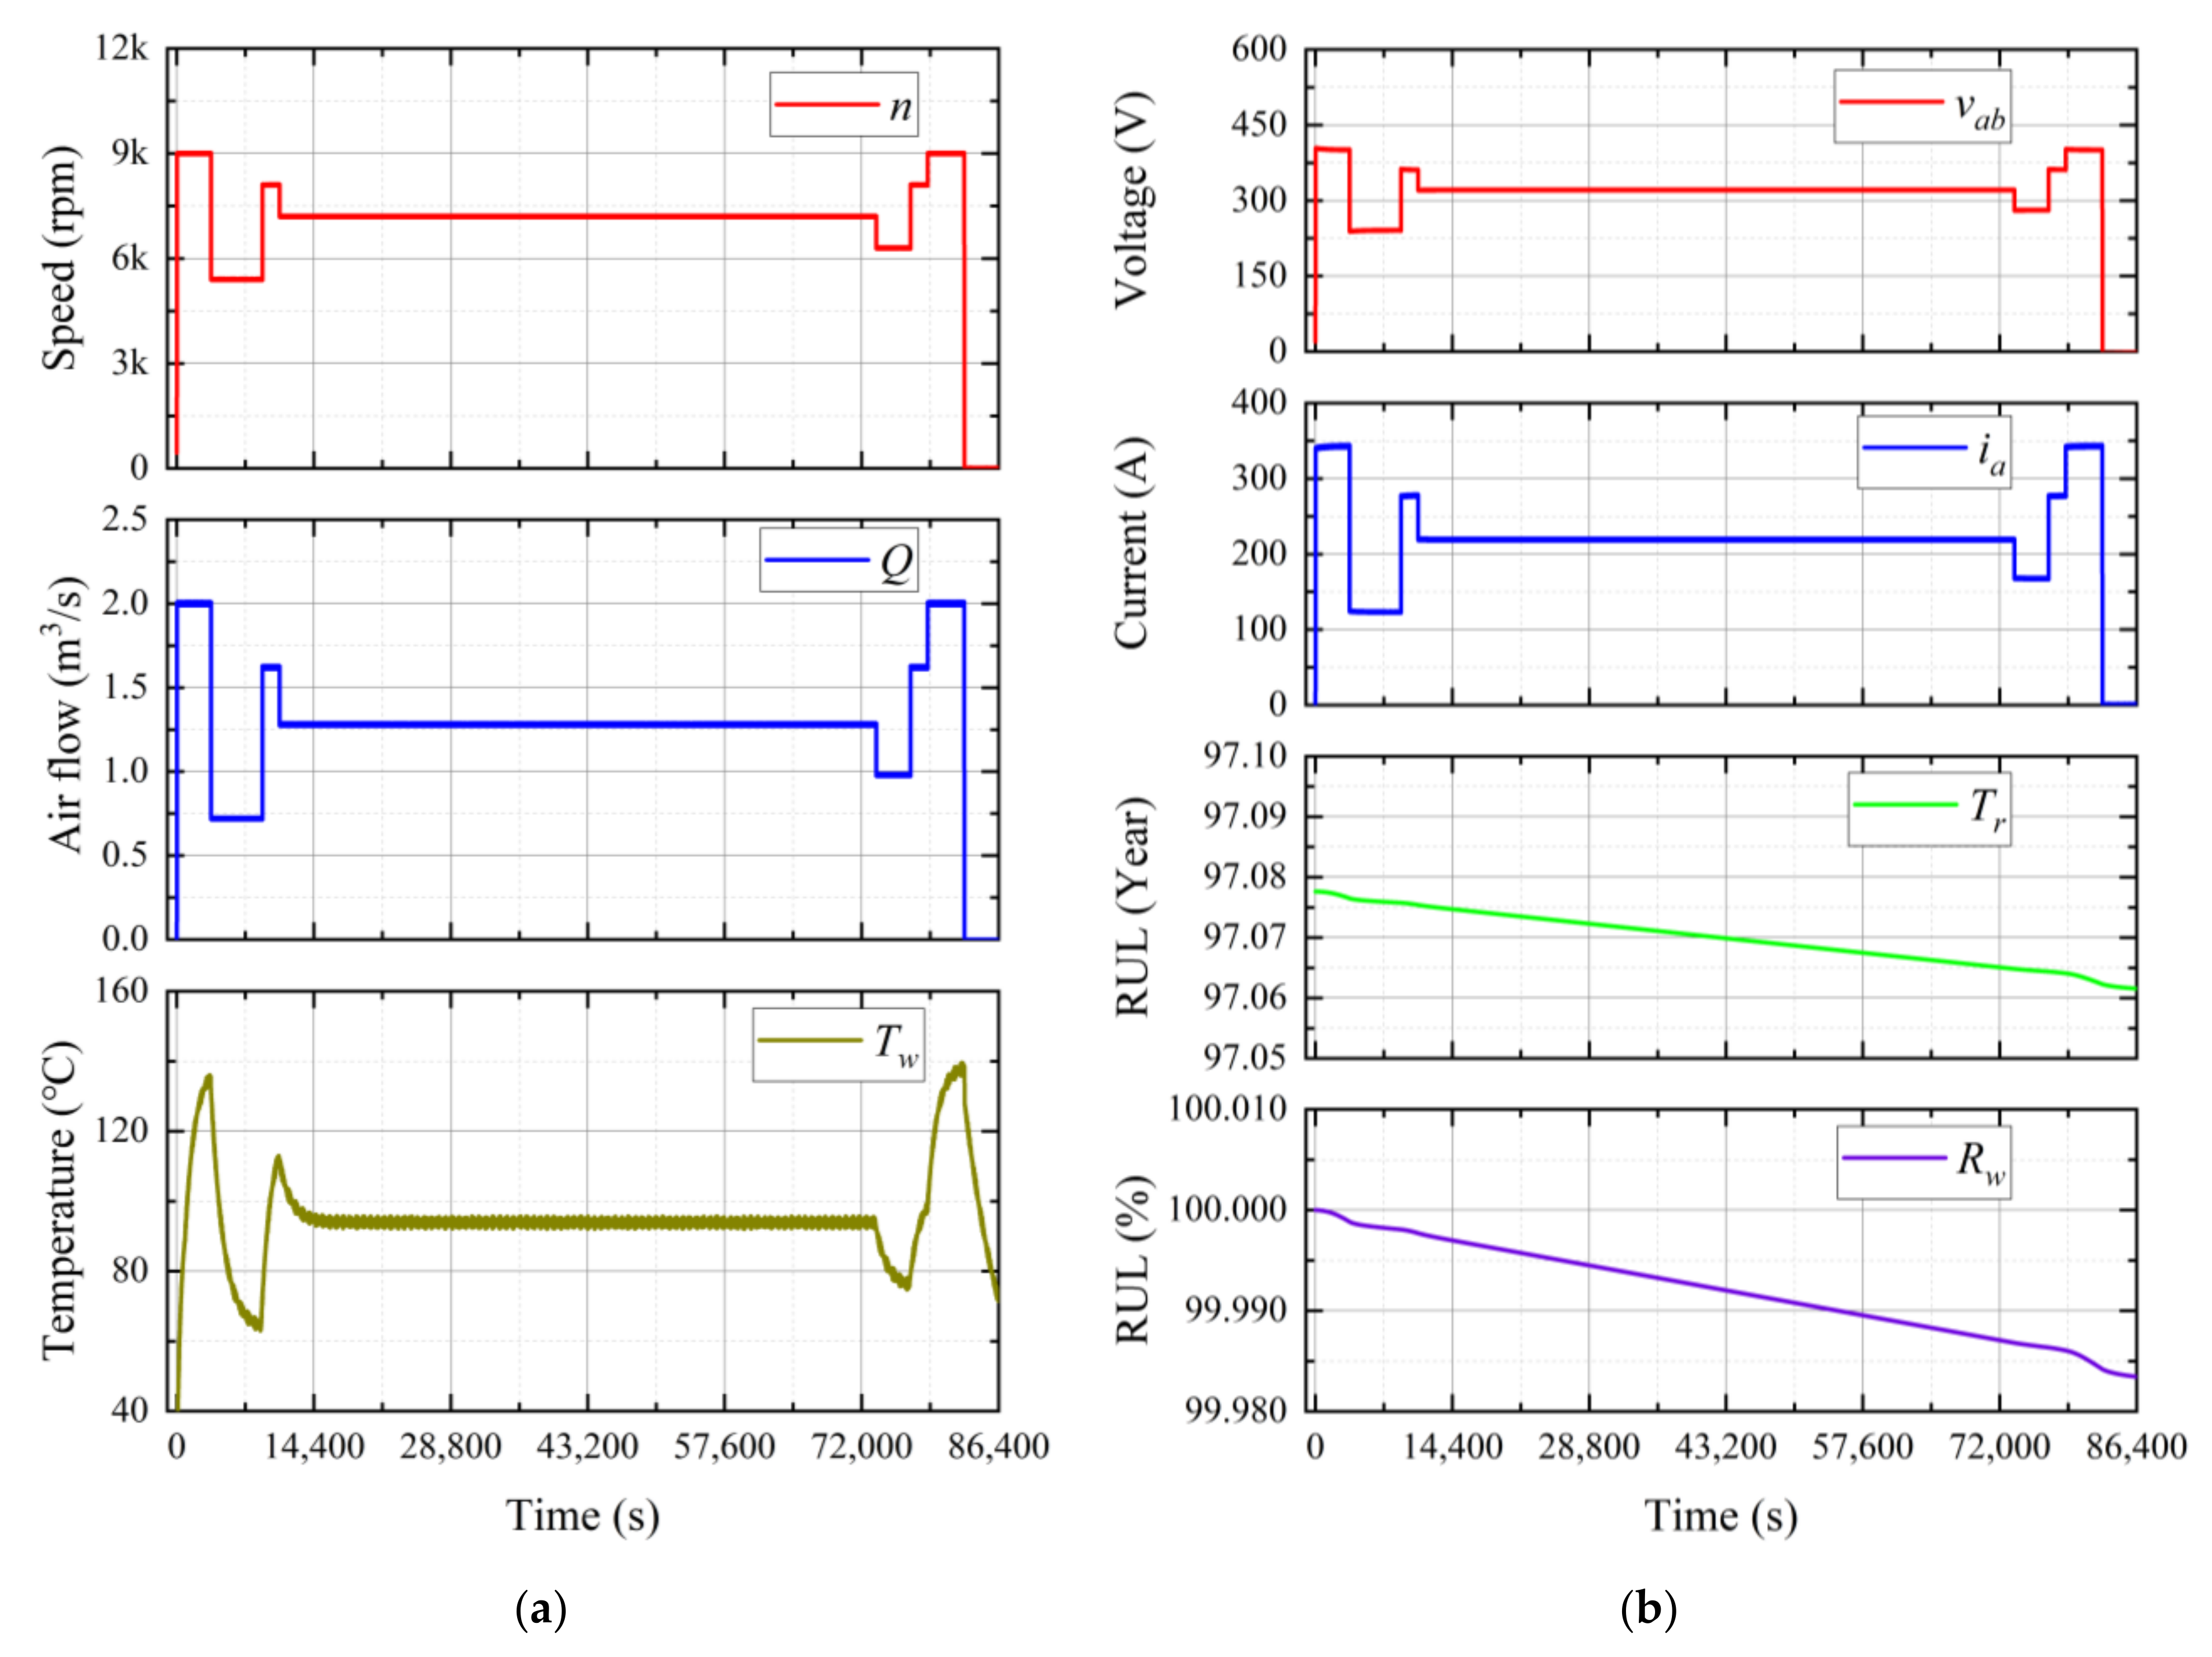
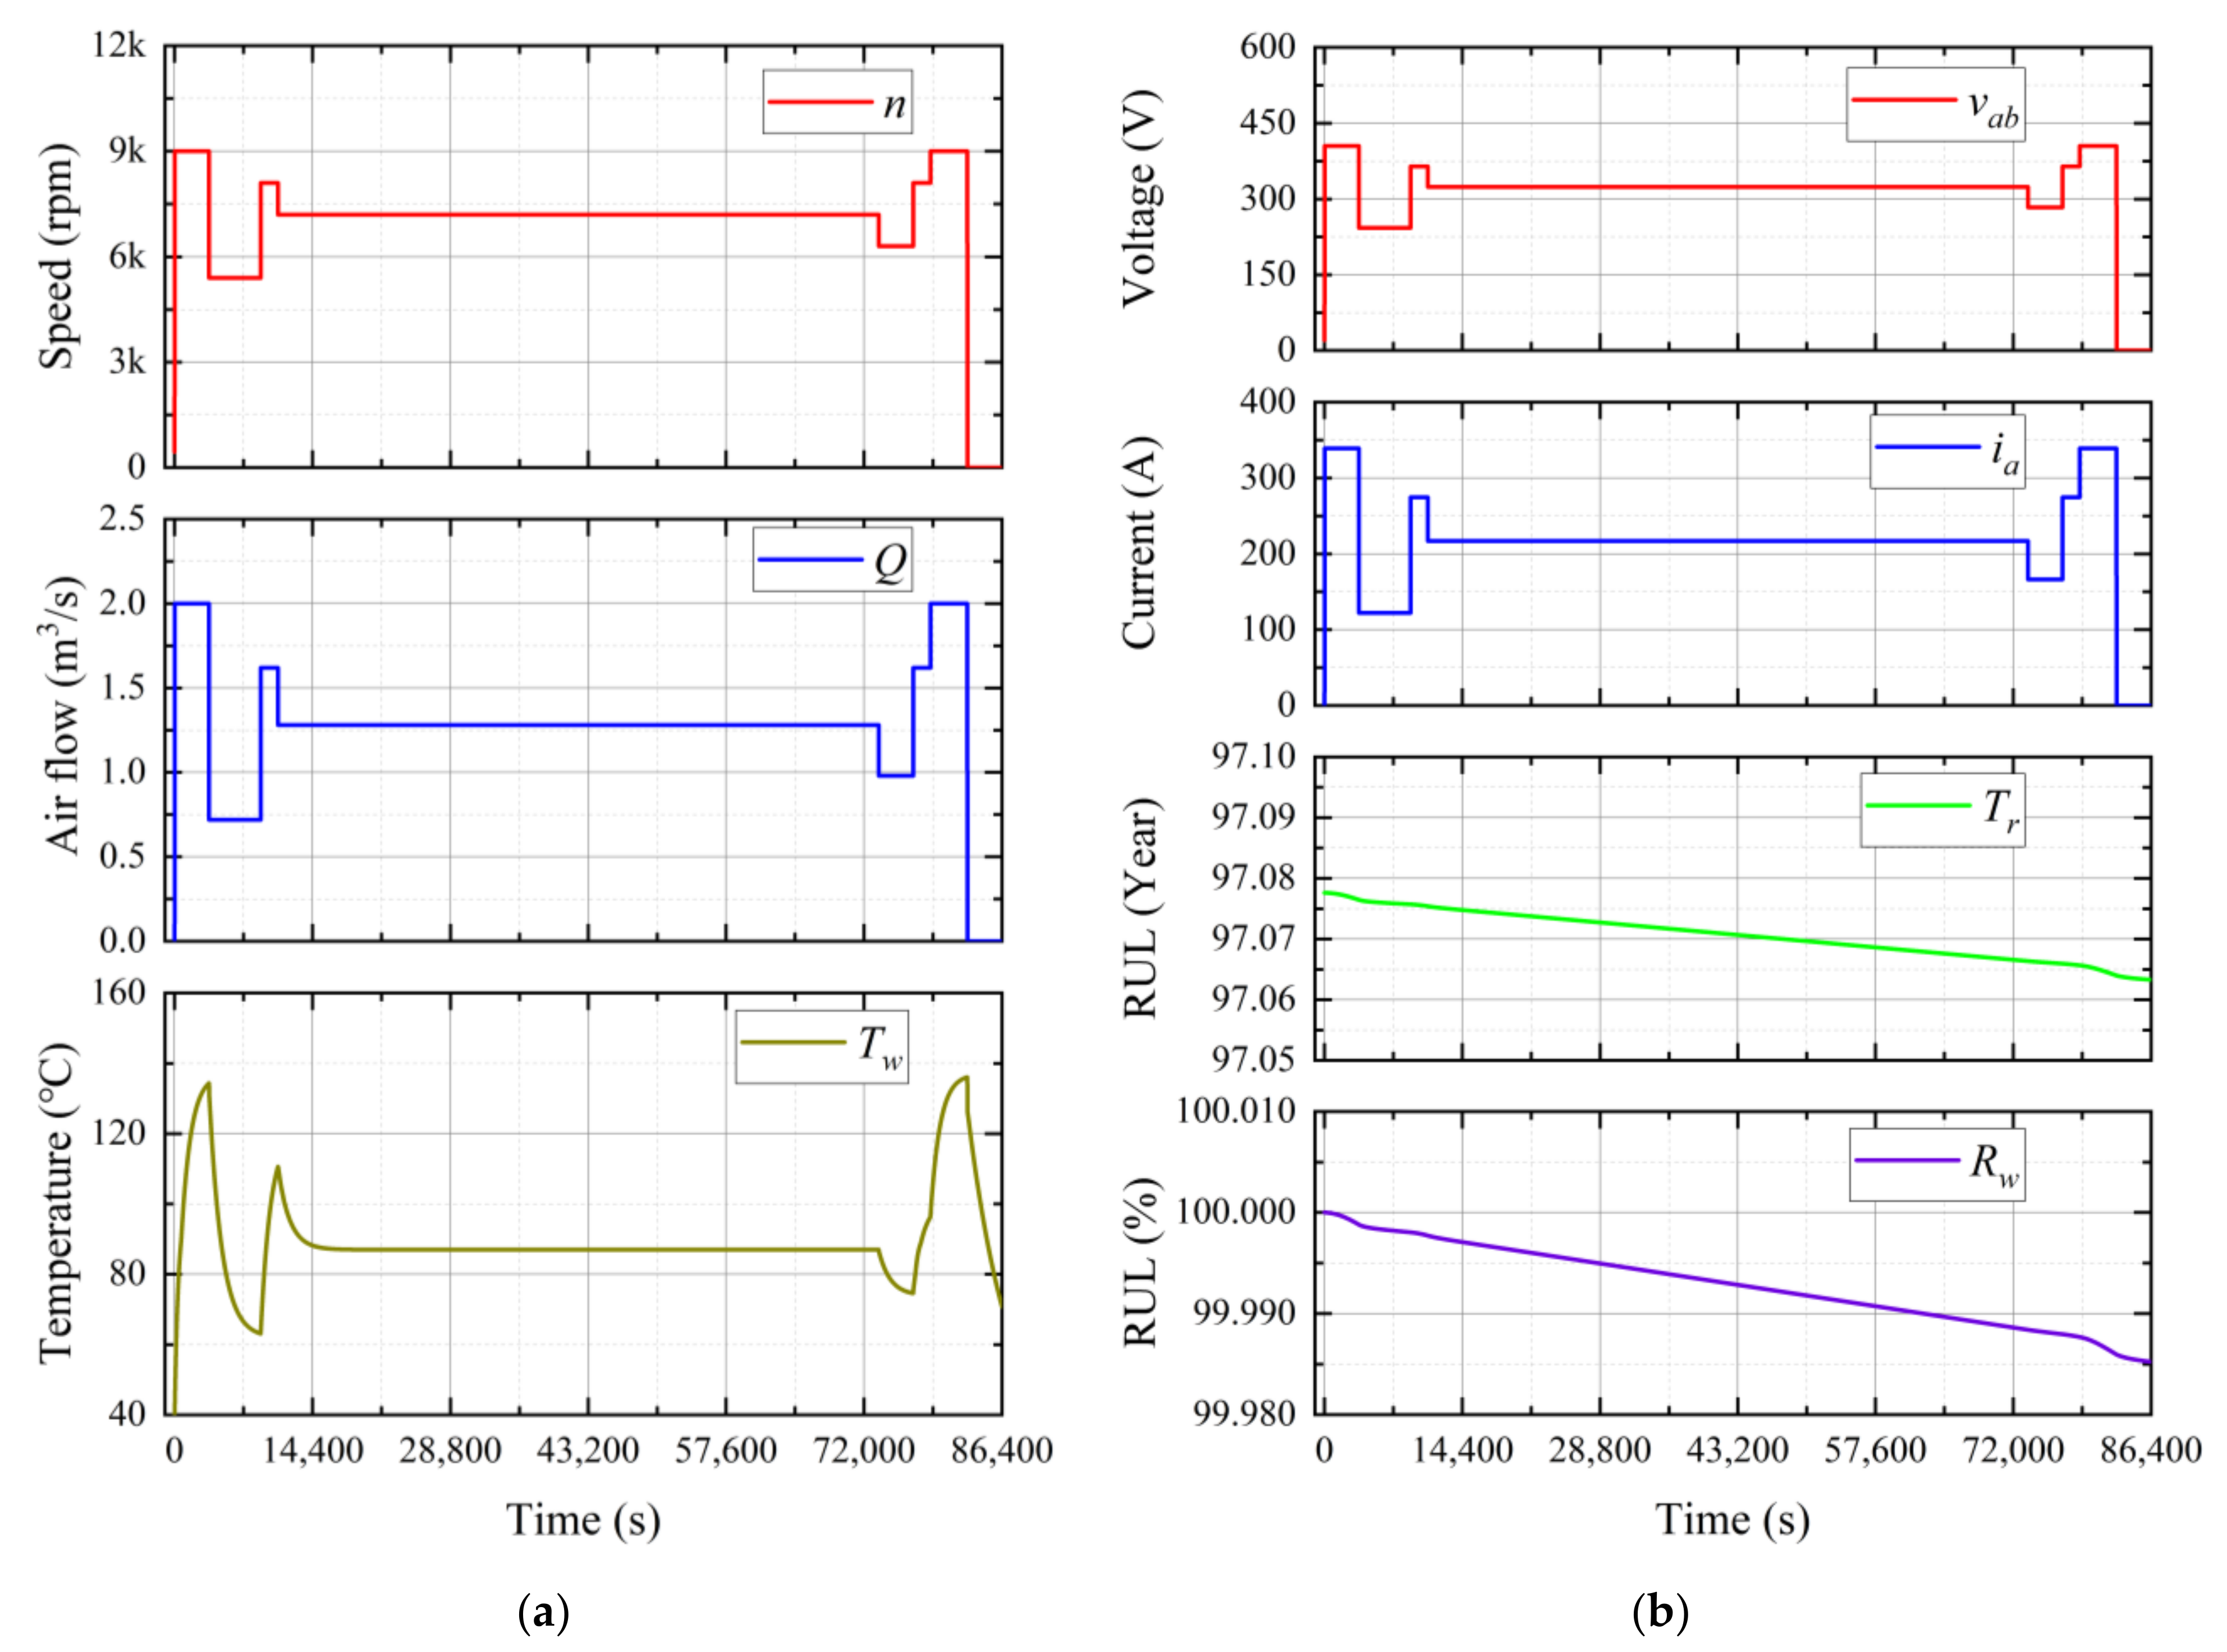
4.1. Simulation Results

To verify the validity of the proposed algorithm, a simulation using an electronic circuit simulation software (PSIM) was performed through the model of the EGR blower system, as shown in Figure 5. The step time of the simulation was set to 1, and the total time selected was 86,400 s to reflect the driving time for one day.
The speed profile of the EGR blower system, according to time, was applied in the consideration of the engine load for one day. The temperature profile was obtained through thermal analysis of the PMSM by applying load conditions based on the speed profile. The equations, using a trend line analysis of the air flow (Q) and the power (PL) according to the speed (n), can be expressed as follows:
Q = 2 . 47   ×   10 8 n 2 + 7 . 23   ×   10 20
P L = 2 . 06   ×   10 10 n 3 + 1 . 72   ×   10 21 n 2   1 . 29   ×   10 17 n + 1 . 42   ×   10 14
The line–to–line voltage (vab) of the PMSM was calculated by multiplying the power (PL) value by the motor constant (Ke). The phase A current (ia) was calculated by multiplying the power (PL) value by 1 / 3 and dividing the calculated efficiency profile according to the calculated line–to–line voltage (vab) and the speed (n). The RUL (Tr) was calculated using Equations (2) and (3).
Figure 6 shows the simulation results of the EGR blower system, which were derived by calculating data at 1 s intervals for 24 h. Figure 6a shows the motor speed (n), air flow (Q), and winding temperature (Tw). The air flow fluctuates according to the speed of the EGR blower. An increase in the air flow is a torque load in the PMSM side, so the phase A current of the PMSM increases. The phase current fluctuations appear as frequent steady states and transient states on the winding temperature curve. Figure 6b shows the line–to–line voltage (vab), the phase A current (ia), the RUL (Tr), and the percentage of the RUL (Rw). Rw is calculated as follows:
R w = T r T i   ×   100
It can be seen that the response of the line–to–line voltage and phase current of the PMSM depends on the speed of the EGR blower. As a result, it can be confirmed through simulation that the change in the amount of RUL reduction is affected by the increase in the temperature of the winding due to the change in the phase current according to the load of the PMSM.

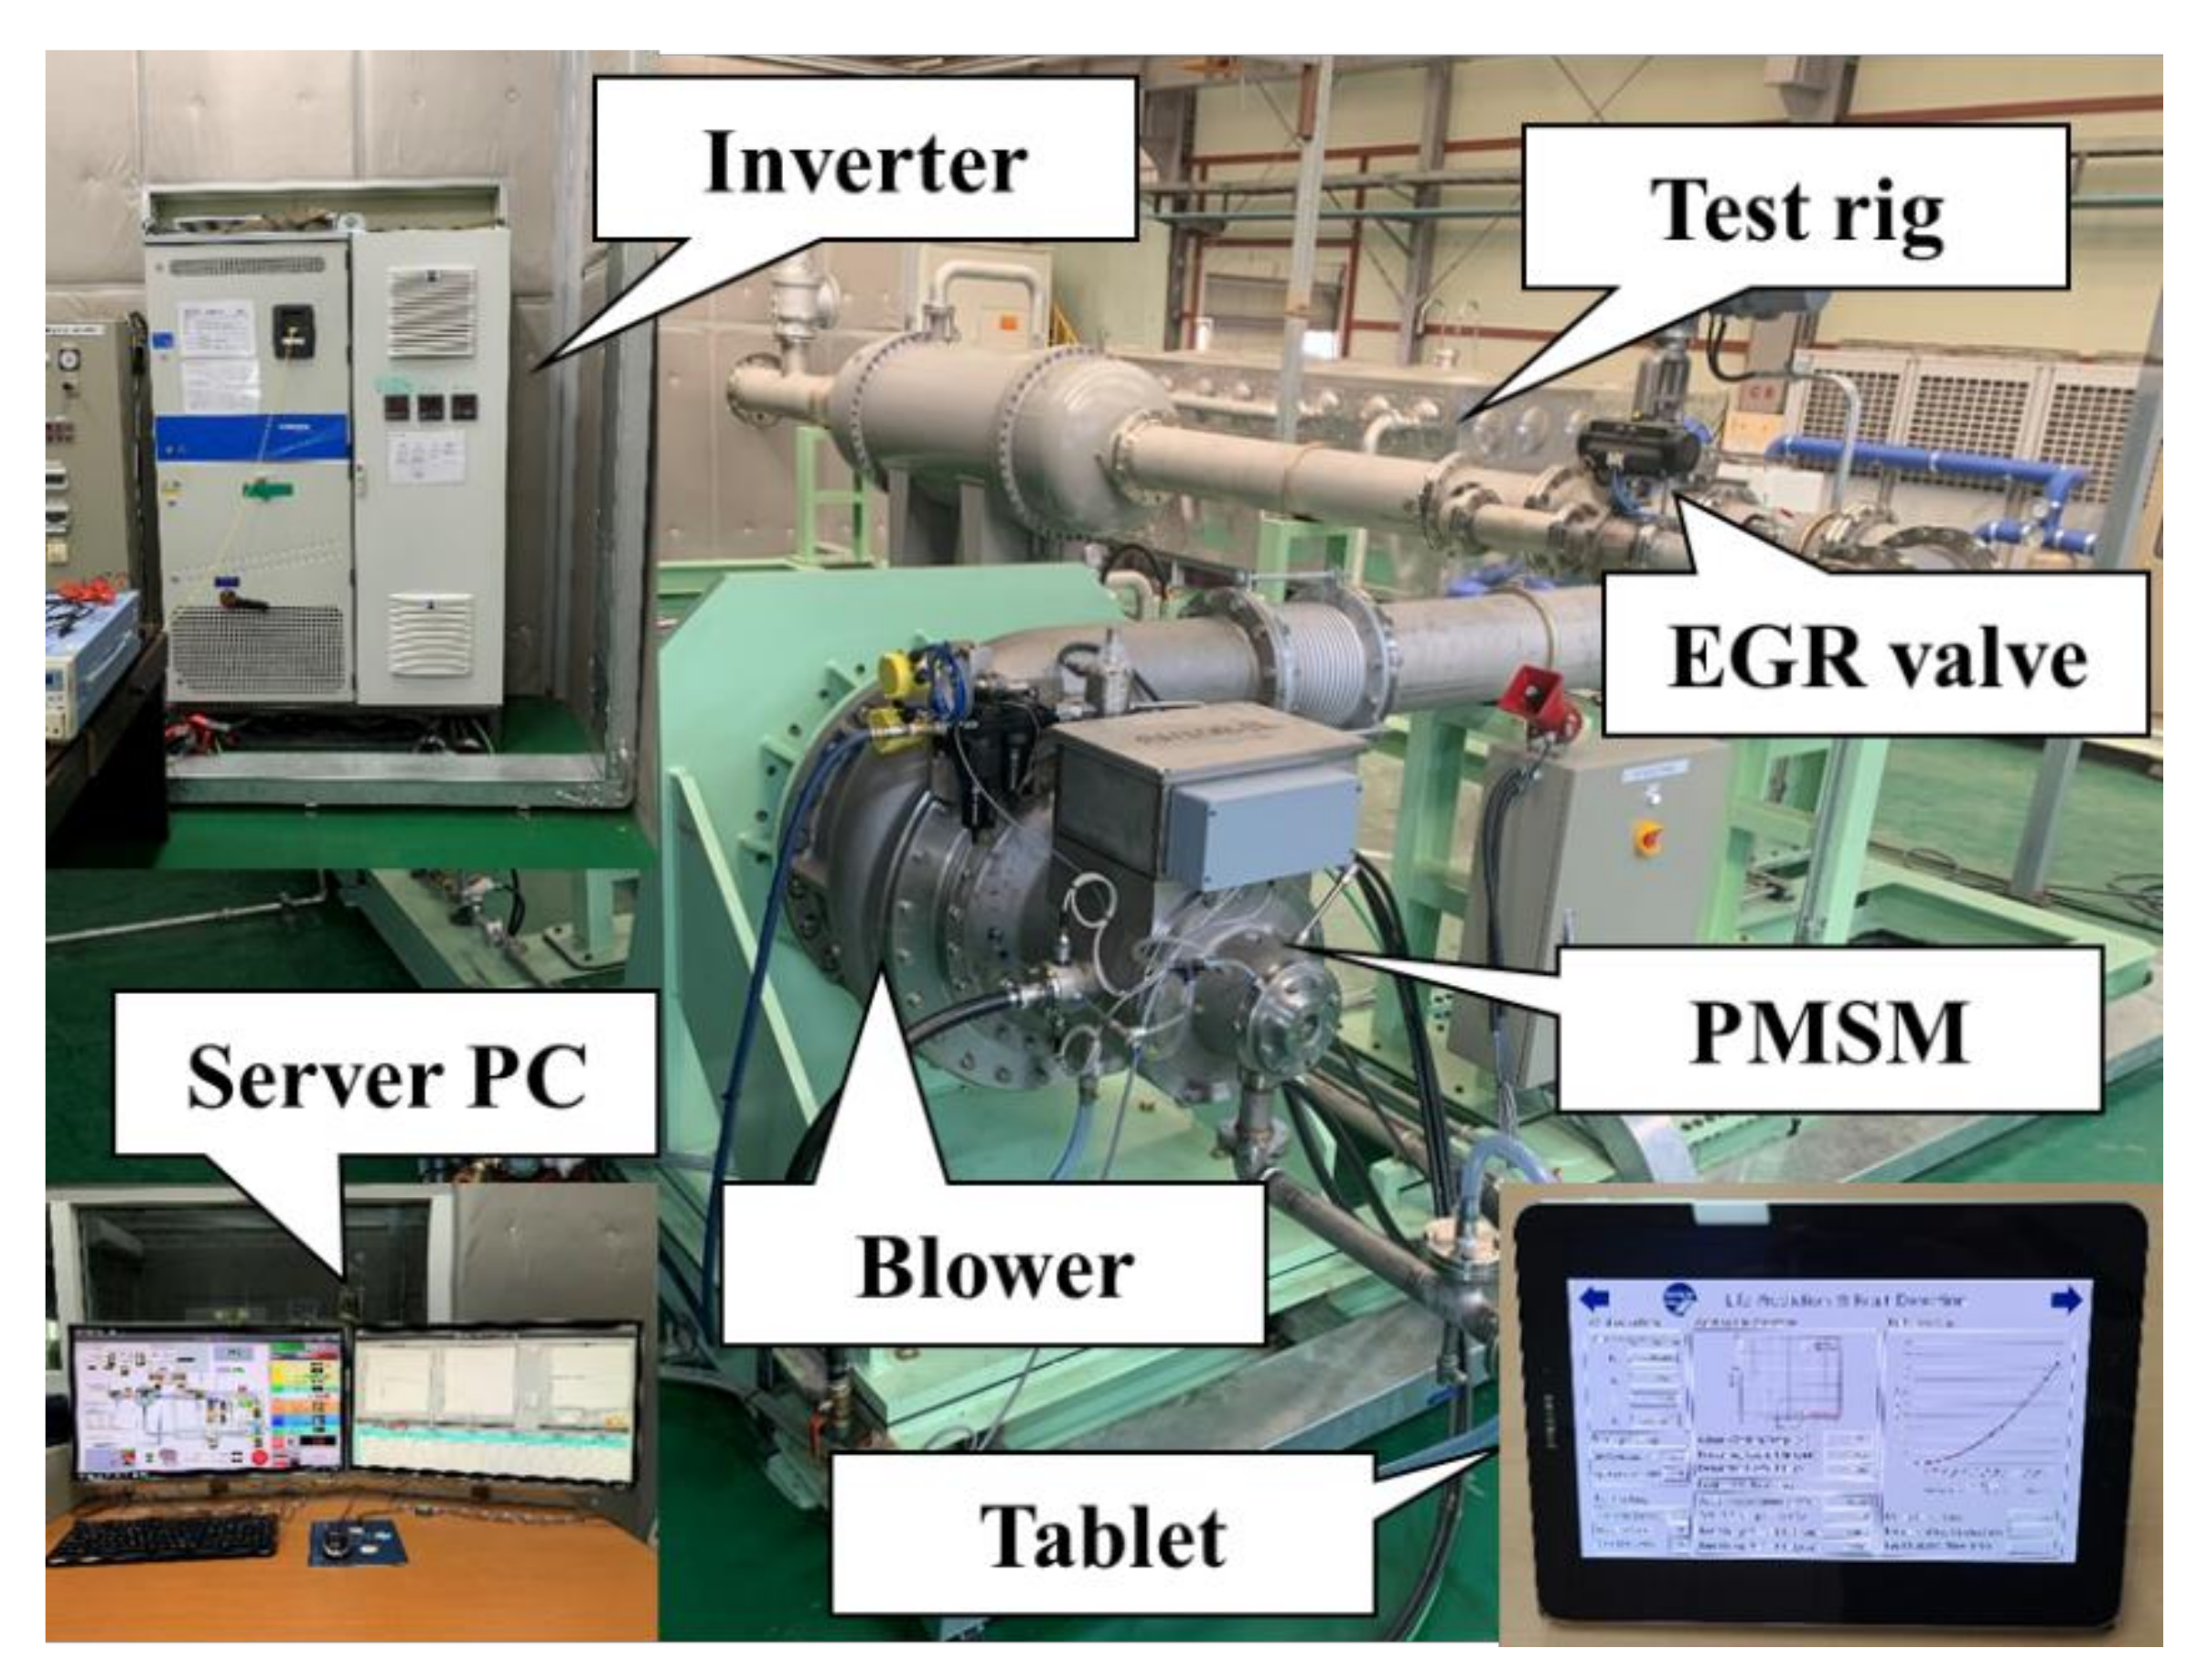
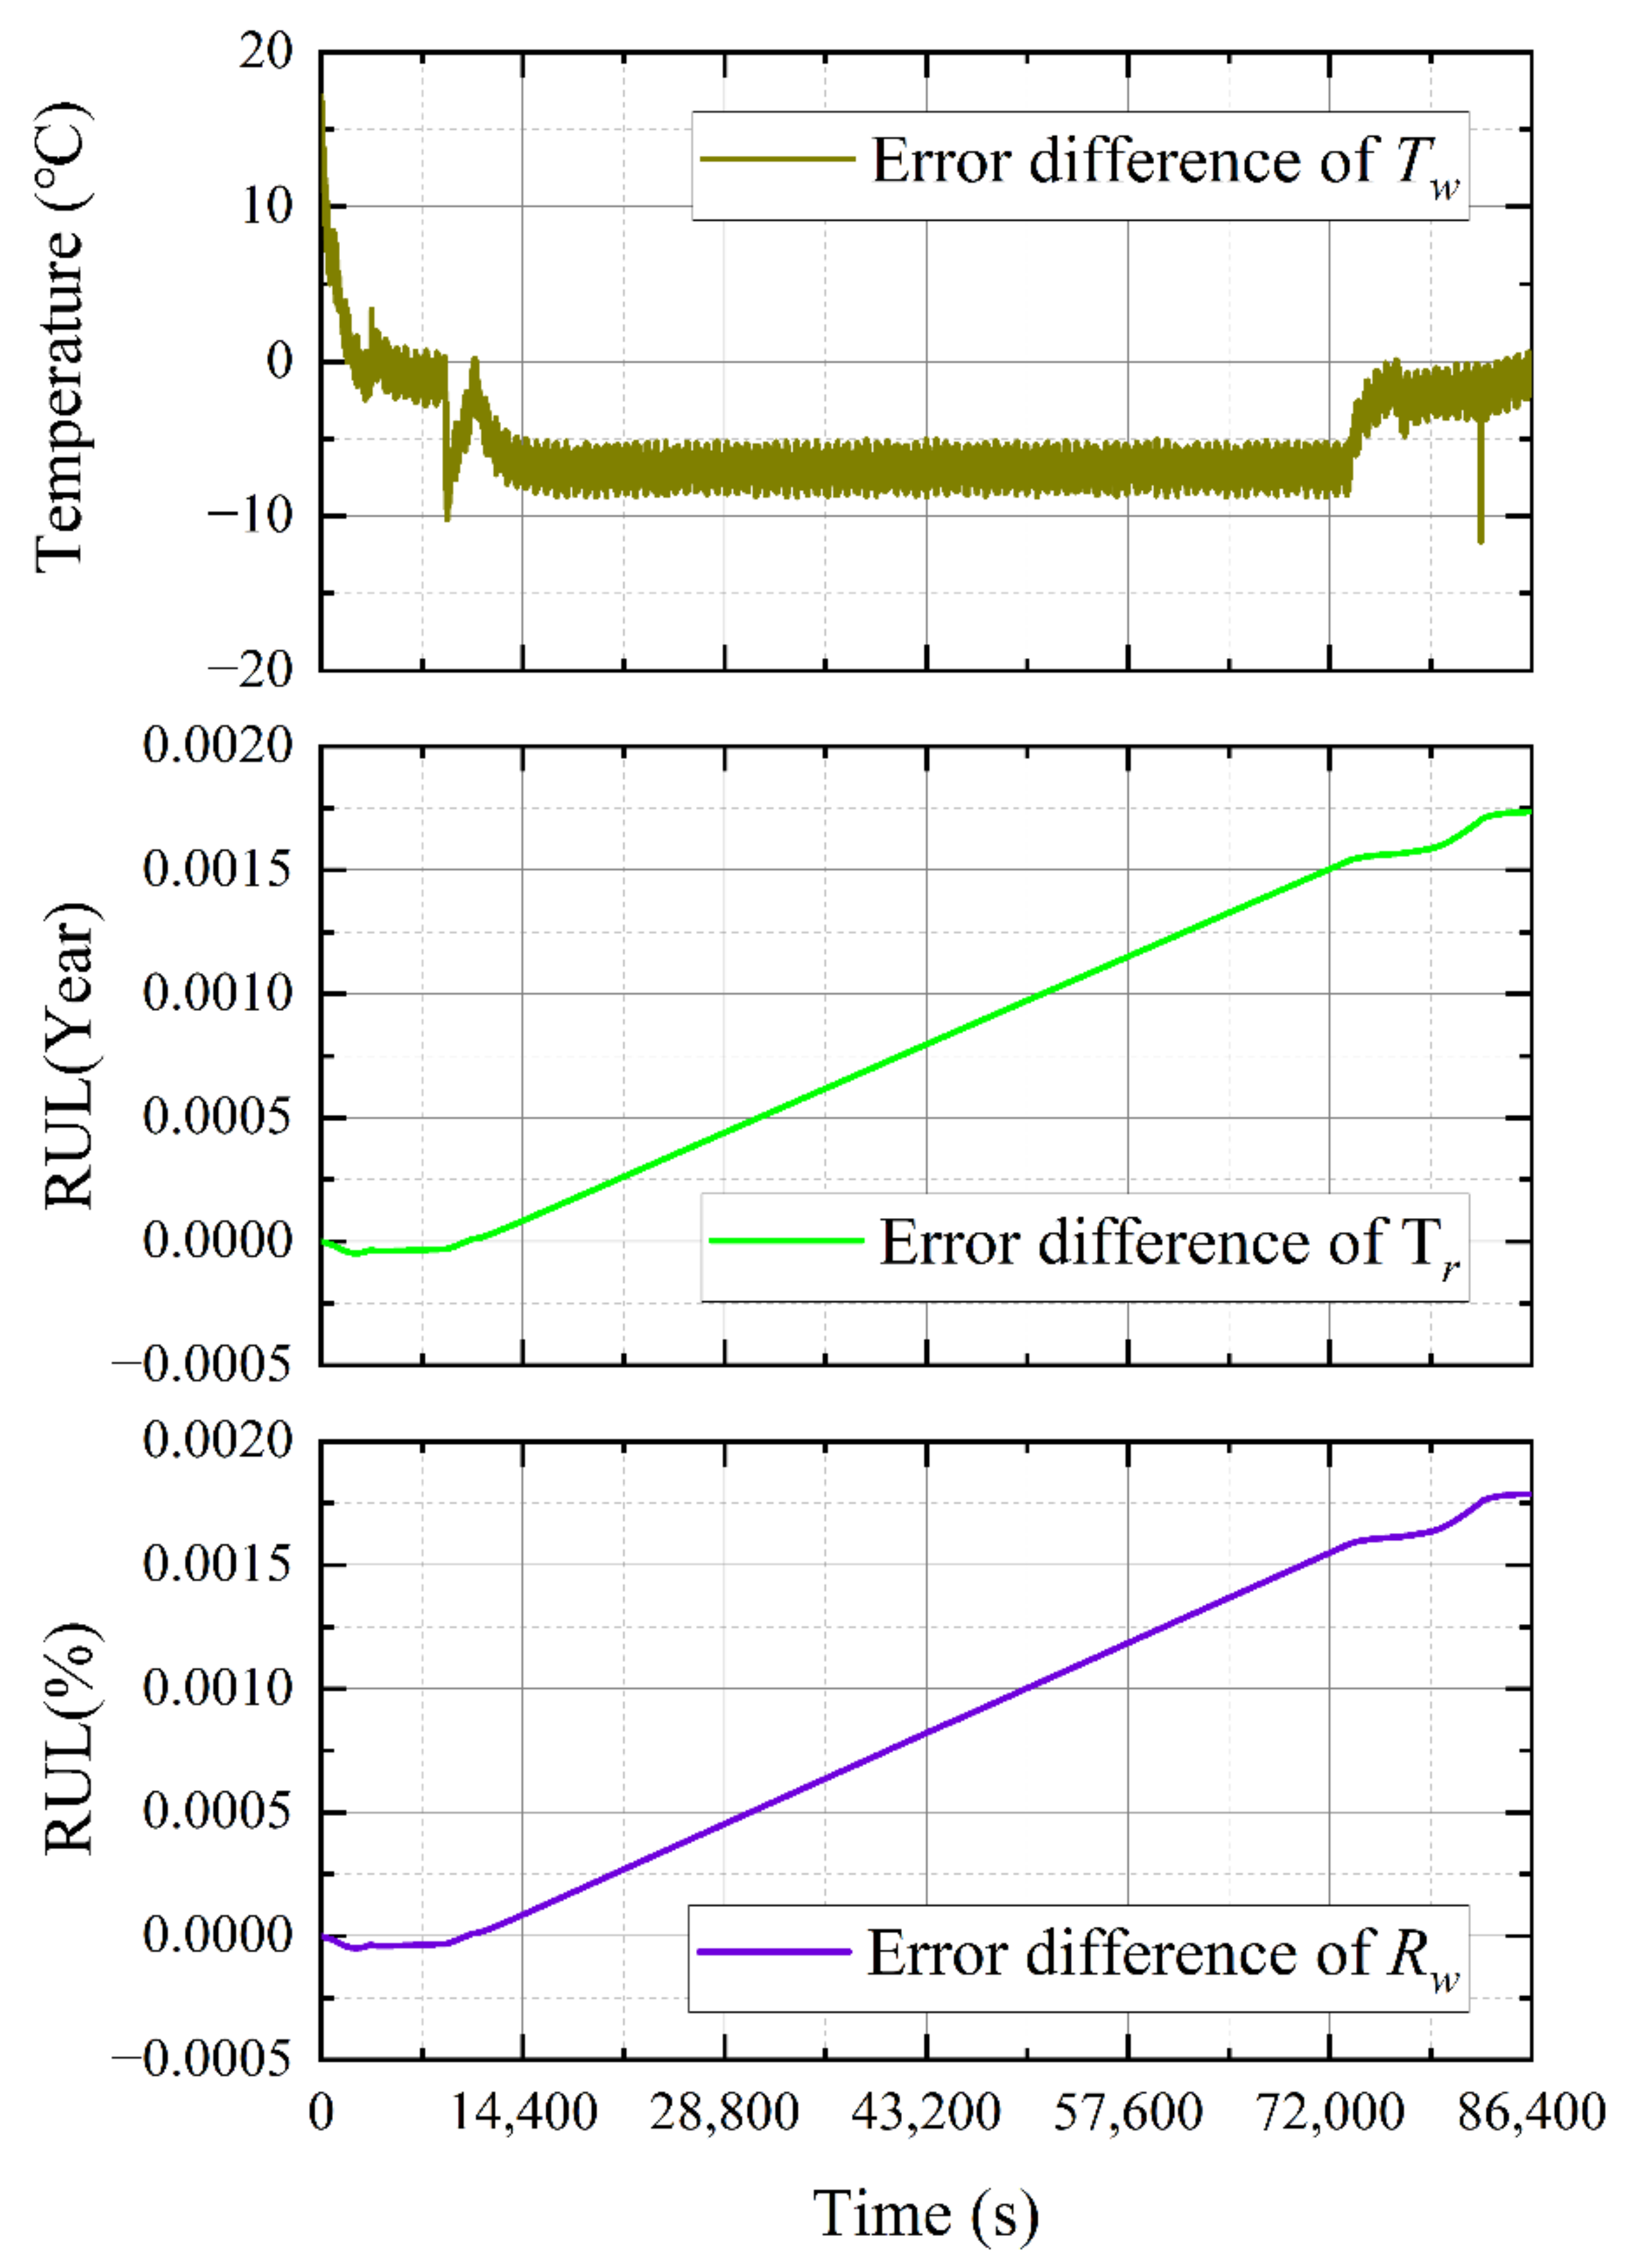
4.2. Experimental Results

To validate the simulation results, an experimental setup was developed that used the test rig to evaluate the EGR blower system, as shown in Figure 7. To maintain the pressure of 3.5 bar, the required air flow was adjusted, using the EGR control valve, based on the speed profile over time; the speed of the EGR blower was controlled by the inverter. The air flow value is transmitted to the server PC through the air flow sensor installed in the test rig. The values of the speed, winding temperature, line–to–line voltage, and phase current are transferred to the tablet computer through the inverter. The RUL and RUL percentages are calculated based on received values using software implemented with LabVIEW NXG.
Figure 8 shows the experimental results of the EGR blower system derived by calculating data at 1 s intervals for 24 h. Compared with the simulation results, the response and magnitude of the speed and air flow are the same. In the case of winding temperature, a slight ripple occurred due to the difference in saturation temperature as a result of the ambient temperature fluctuating from 31 to 36 °C as well as the noise of the inverter.
Compared with the simulation results as shown in Table 3, the values of the RUL show a difference in the reduction amount due to the change in ambient temperature; thus, the RUL and the percentage of the RUL are 97.0616 years and 99.9834%, respectively, after one day of operation with the EGR blower system. To analyze the difference between the simulation and experiment results, the error difference between the simulation results and the experimental results is expressed as shown in Figure 9. The ambient temperatures for the simulation and the experiment are 40 °C and 23 °C, respectively. The error difference in the initial temperature of the winding of the PMSM is about 17 °C. Since the percentage of the RUL is the ratio of the initial RUL and the real-time calculated RUL, the error difference between the RUL and the percentage of RUL is the same. The maximum error difference of the winding is about 7 °C. This difference results in a higher RUL for one day in the experiment. Due to this difference, a high RUL is calculated in the experiment, but it is a satisfactory result in terms of the effectiveness of the proposed algorithm.

5. Conclusions

Due to the fourth industrial revolution and environmental regulations, the need for predictive maintenance technology fused with ICT is increasing to maximize the reliability and operation time of the EGR blower system for reducing NOx in smart ships. Therefore, this paper presented the predictive maintenance algorithm for preventing the stator winding turn faults of the electric motor in the EGR blower system.
The equation for deriving the real-time RUL of the winding by applying the time required by standard ASTM D1830 was proposed to predict the amount of insulation aging caused by the winding temperature, which is the main cause of the stator winding turn faults. Secondly, for the implementation of the algorithm, an electromagnetic analysis and a thermal analysis of the PMSM were performed based on the performance curve of the EGR blower. The validity of the proposed algorithm was verified by implementing a simulation model of the EGR blower system using the analysis results. To verify the simulation results, a test rig used to evaluate the EGR blower system was constructed and tested under the same load conditions as the simulation. As a result, the validity of the proposed algorithm was verified through the comparison of the simulation results and the experimental results.

Author Contributions

Conceptualization, S.-A.K.; methodology, S.-A.K.; software, S.-A.K.; validation, S.-A.K.; formal analysis, S.-A.K.; investigation, S.-A.K.; writing—original draft preparation, S.-A.K.; writing—review and editing, S.-A.K.; visualization, S.-A.K. All authors have read and agreed to the published version of the manuscript.

Funding

This study was supported by a grant from the Korea Industrial Complex Corp. (KICOX. No. PBS21005).

Institutional Review Board Statement

Not applicable.

Informed Consent Statement

Not applicable.

Data Availability Statement

Not applicable.

Conflicts of Interest

The authors declare no conflict of interest.

References

  1. Hiraoka, N.; Miyanagi, A.; Kuroda, K.; Ito, K.; Nakagawa, T.; Ueda, T. The World’s First Onboard Verification Test of UE Engine with Low Pressure EGR complied with IMO’s NOx Tier III Regulations. Mitsubishi Heavy Ind. Tech. Rev. 2016, 53, 40. [Google Scholar]
  2. Stoumpos, S.; Theotokatos, G. Multiobjective optimisation of a marine dual fuel engine equipped with exhaust gas recirculation and air bypass systems. Energies 2020, 13, 5021. [Google Scholar] [CrossRef]
  3. Lao, C.T.; Akroyd, J.; Eaves, N.; Smith, A.; Morgan, N.; Nurkowski, D.; Bhave, A.; Kraft, M. Investigation of the impact of the configuration of exhaust after-treatment system for diesel engines. Appl. Energy 2020, 267, 114844. [Google Scholar] [CrossRef]
  4. Forzatti, P.; Lietti, L.; Nova, I.; Tronconi, E. Diesel NOx aftertreatment catalytic technologies: Analogies in LNT and SCR catalytic chemistry. Catal. Today 2010, 151, 202–211. [Google Scholar] [CrossRef]
  5. Koop, J.; Deutschmann, O. Detailed surface reaction mechanism for Pt-catalyzed abatement of automotive exhaust gases. Appl. Catal. B Environ. 2009, 91, 47–58. [Google Scholar] [CrossRef]
  6. Gurupatham, A.; He, Y. Architecture design and analysis of diesel engine exhaust aftertreatment system and comparative study with close-coupled DOC-DPF System. SAE Int. J. Fuels Lubr. 2009, 1, 1387–1396. [Google Scholar] [CrossRef]
  7. Wei, L.; Yan, F.; Hu, J.; Xi, G.; Liu, B.; Zeng, J. NOx conversion efficiency optimization based on NSGA-II and state-feedback nonlinear model predictive control of selective catalytic reduction system in diesel engine. Appl. Energy 2017, 206, 959–971. [Google Scholar] [CrossRef]
  8. Cho, C.P.; Pyo, Y.D.; Jang, J.Y.; Kim, G.C.; Shin, Y.J. NOx reduction and N2O emissions in a diesel engine exhaust using Fe-zeolite and vanadium based SCR catalysts. Appl. Therm. Eng. 2017, 110, 18–24. [Google Scholar] [CrossRef]
  9. Kim, J.H.; Kim, M.Y.; Kim, H.G. NO2-assisted soot regeneration behavior in a diesel particulate filter with heavy-duty diesel exhaust gases. Numer. Heat Transf. Part A Appl. 2010, 58, 725–739. [Google Scholar] [CrossRef]
  10. Pakarinen, R. IMO Tier III and Beyond. Available online: https://www.wartsila.com/twentyfour7/environment/imo-tier-iii-and-beyond (accessed on 17 June 2019).
  11. Rudrabhate, S.D.; Chaitanya, S.V. Comparison between EGR & SCR Technologies. In Proceedings of the International Conference on Ideas, Impact and Innovation in Mechanical Engineering (ICIIIME), Pune, India, 1–2 June 2017; pp. 856–861. [Google Scholar]
  12. Gautier, P.; Albrecht, A.; Chasse, A.; Moulin, P.; Pagot, A.; Fontvieille, L.; Issartel, D. A Simulation Study of the Impact of LP EGR on a Two-Stage Turbocharged Diesel Engine. Oil Gas Sci. Technol. Rev. IFP 2009, 64, 361–379. [Google Scholar] [CrossRef]
  13. Zamboni, G.; Capobianco, M. Influence of High and Low Pressure Egr and Vgt Control on in-Cylinder Pressure Diagrams and Rate of Heat Release in an Automotive Turbocharged Diesel Engine. Appl. Therm. Eng. 2013, 51, 586–596. [Google Scholar] [CrossRef]
  14. Beatrice, C.; Rispoli, N.; Di Blasio, G.; Patrianakos, G.; Kostoglou, M.; Konstandopoulos, A.; Imren, A.; Denbratt, I.; Palacín, R. Emission Reduction Technologies for the Future Low Emission Rail Diesel Engines: EGR vs. SCR; SAE Technical paper; SAE International: Warrendale, PA, USA, 2013. [Google Scholar]
  15. Buenaventura, F.C.; Witrant, E.; Talon, V.; Dugard, L. Air Fraction and EGR Proportion Control for Dual Loop EGR Diesel Engines. Ing. Univ. 2015, 19, 115. [Google Scholar]
  16. Yasin, M.H.M.; Mamat, R.; Yusop, A.F.; Idris, D.M.N.D.; Yusaf, T.; Rasul, M.; Najafi, G. Study of a diesel engine performance with exhaust gas recirculation (EGR) system fuelled with palm biodiesel. Energy Procedia 2017, 110, 26–31. [Google Scholar] [CrossRef] [Green Version]
  17. Maiboom, A.; Tauzia, X.; Shah, S.R.; Hétet, J.F. Experimental Study of an LP EGR System on an Automotive Diesel Engine, compared to HP EGR with respect to PM and NOx Emissions and Specific Fuel Consumption. SAE Int. J. Engines 2010, 2, 597–610. [Google Scholar] [CrossRef]
  18. Chao, Y.; Lu, H.; Hu, Z.; Deng, J.; Wu, Z.; Li, L.; Yuan, S. Comparison of Fuel Economy Improvement by High and Low Pressure EGR System on a Downsized Boosted Gasoline Engine; No. 2017-01-0682; SAE International: Warrendale, PA, USA, 2017. [Google Scholar]
  19. Alegret, G.; Llamas, X.; Vejlgaard-Laursen, M.; Eriksson, L. Modeling of a large marine two-stroke diesel engine with cylinder bypass valve and EGR system. IFAC-PapersOnLine 2015, 48, 273–278. [Google Scholar] [CrossRef]
  20. Lundqvist, U.; Smedler, G.; Stålhammar, P. A Comparison between Different EGR Systems for HD Diesel Engines and Their Effect on Performance, Fuel Consumption and Emissions; No. 2000-01-0226; SAE International: Warrendale, PA, USA, 2000. [Google Scholar]
  21. Mossa, M.A.A.; Hairuddin, A.A.; Nuraini, A.A.; Zulkiple, J.; Tobib, H.M. Effects of hot exhaust gas recirculation (EGR) on the emission and performance of a single-cylinder diesel engine. Int. J. Automot. Mech. Eng. 2019, 16, 6660–6674. [Google Scholar] [CrossRef]
  22. Wang, Z.; Zhou, S.; Feng, Y.; Zhu, Y. Research of NOx reduction on a low-speed two-stroke marine diesel engine by using EGR (exhaust gas recirculation)–CB (cylinder bypass) and EGB (exhaust gas bypass). Int. J. Hydrog. Energy 2017, 42, 19337–19345. [Google Scholar] [CrossRef]
  23. Kiangala, K.S.; Wang, Z. Initiating predictive maintenance for a conveyor motor in a bottling plant using industry 4.0 concepts. Int. J. Adv. Manuf. Technol. 2018, 97, 3251–3271. [Google Scholar] [CrossRef]
  24. Lu, B.; Durocher, D.B.; Stemper, P. Predictive maintenance techniques. IEEE Ind. Appl. Mag. 2009, 15, 52–60. [Google Scholar] [CrossRef]
  25. Toni, K.; Slobodan, M.; Aleksandar, B. Detection of turn to turn faults in stator winding with axial magnetic flux in induction motors. In Proceedings of the IEEE International Electric Machines & Drives Conference, Antalya, Turkey, 3–5 May 2007; pp. 826–829. [Google Scholar]
  26. Husach, S.; Yatsiuk, R.; Mamchur, D. Induction Motors Condition Monitoring and Lifetime Estimation System. In Proceedings of the IEEE International Conference on Modern Electrical and Energy Systems (MEES), Kremenchuk, Ukraine, 23–25 September 2019; pp. 34–37. [Google Scholar]
  27. Tshiloz, K.; Smith, A.C.; Mohammed, A.; Djurović, S.; Feehally, T. Real-time insulation lifetime monitoring for motor windings. In Proceedings of the XXII International Conference on Electrical Machines (ICEM), Lausanne, Switzerland, 4–7 September 2016; pp. 2335–2340. [Google Scholar]
  28. Khowja, M.R.; Turabee, G.; Giangrande, P.; Madonna, V.; Cosma, G.; Vakil, G.; Galea, M. Lifetime estimation of enameled wires under accelerated thermal aging using curve fitting methods. IEEE Access 2021, 9, 18993–19003. [Google Scholar] [CrossRef]
  29. Huber, W. Standortbestimmung. In Industrie 4.0 in Der Automobilproduktion; Springer: Berlin/Heidelberg, Germany, 2016; pp. 7–21. [Google Scholar]
  30. Kim, S.A.; Hong, K.P. Analysis and Experimental Verification of a Variable Speed Turbo Air Centrifugal Compressor System for Energy Saving. Energies 2021, 14, 1208. [Google Scholar] [CrossRef]
  31. Kim, S.A. Improved Modeling of a Multi-Level Inverter for TACS to Reduce Computational Time and Improve Accuracy. Energies 2021, 14, 849. [Google Scholar] [CrossRef]
Figure 1. Configuration of the EGR system for the smart ship.
Energies 14 05744 g001
Figure 2. Performance curves of the EGR blower.
Energies 14 05744 g002
Figure 3. Electromagnetic field analysis of the PMSM. (a) Geometric and FEA results; (b) line–to–line voltages; (c) electromagnetic torque; and (d) temperature saturation curves of the PMSM.
Energies 14 05744 g003
Figure 4. The trend line of required lifetimes according to winding temperatures, based on ASTM D1830.
Energies 14 05744 g004
Figure 5. Simulation model of the EGR blower system.
Energies 14 05744 g005
Figure 6. Simulation results. (a) Motor speed (n), air flow (Q), and winding temperature (Tw); (b) line–to–line voltage (vab), phase A current (ia), the RUL (Tr), and the percentage of the RUL (Rw).
Energies 14 05744 g006
Figure 7. Experimental setup of the EGR blower system.
Energies 14 05744 g007
Figure 8. Experimental results. (a) Motor speed (n), air flow (Q), and winding temperature (Tw); (b) line–to–line voltage (vab), phase A current (ia), the RUL (Tr), and the percentage of the RUL (Rw).
Energies 14 05744 g008
Figure 9. Differences between simulation and experimental errors.
Energies 14 05744 g009
Table 1. Specifications of the EGR blower system.
ItemValueItemValue
Rated pressure3.5 barMotor typePMSM
Rated air flow2 m3/sInput voltage/current440 V/340 A
Shaft power/torque150 kW/159 NmPoles/slots8/36
Shaft speed9000 rpmInsulation classF
Table 2. Hours required for class F in standard ASTM D1830.
Aging Temperature (°C)Time (Hours)
24040
220100
200500
1805000
Table 3. Comparison of RUL.
SimulationExperimental
RUL (Year)97.063397.0616
RUL (%)99.985299.9834
Publisher’s Note: MDPI stays neutral with regard to jurisdictional claims in published maps and institutional affiliations.

