Article

Solar-Driven Desalination Using Nanoparticles

by
Dmitrii M. Kuzmenkov
1,
Pavel G. Struchalin
2,
Andrey V. Olkhovskii
1,
Vladimir S. Yunin
1,
Kirill V. Kutsenko
1 and
Boris V. Balakin
1,2,*
1
Department of Thermal Physics, National Research Nuclear University MEPhI (Moscow Engineering Physics Institute), 115409 Moscow, Russia
2
Department of Mechanical and Marine Engineering, Western Norway University of Applied Sciences, 5063 Bergen, Norway
*
Author to whom correspondence should be addressed.
Energies 2021, 14(18), 5743; https://doi.org/10.3390/en14185743
Submission received: 22 July 2021 / Revised: 2 September 2021 / Accepted: 8 September 2021 / Published: 13 September 2021

Abstract

:
Due to the high light absorption and the possibility of localizing boiling to the interior of the receiver, nanoparticles are promising for solar-driven desalination. The paper presents an experimental study of the nanoparticle-based photothermal boiling of water with sea salt. The experiments were carried out using a laboratory-scale system with a transparent photothermal receiver of light and a closed condensate cycle. In this study, we tested three types of nanoparticles: multiwall carbon nanotubes with two main sizes of 49 nm and 72 nm, 110 nm iron oxide particles Fe 3 O 4 , and a commercial paste based on carbon nanotubes. The concentration of nanoparticles was varied up to 10% wt. We found that the nanoparticles enhance the steam generation by 23%, relative to a conventional desalinator with a black-body receiver. The best result was obtained for the 5% wt. concentration of carbon nanotubes.

1. Introduction

According to the UNESCO World Water Assessment Program (WWAP), about 2 billion people live in countries that regularly experience acute shortages of fresh water, and about 4 billion with seasonal problems with water resources [1]. By 2050, the global demand for fresh water will increase by 20–30% [1], expanding the list of countries experiencing a shortage of freshwater. The analysis provided in [2] shows that the global water consumption will increase by 2050 by at least 30% (according to one of the considered scenarios). Different measures are taken to optimize the consumption of water resources, such as infrastructure development, improvement of supply systems, and rational use. However, they aim at balancing the existing water resources without expanding them. In this regard, the primary method of increasing freshwater reserves is the desalination of seawater.
Thermal methods of desalination are the second most widespread in the world and currently cover about 25% of global installation capacity [3,4,5]. They are based on subsequent evaporation and condensation of fresh water out of the brine [6]. However, thermal methods consume a significant amount of energy on an industrial scale. For example, according to [7], multi-effect distillation requires at least 5.5 kWh of total energy to produce 1 m 3 of pure water. Meanwhile, another standard thermal desalination method, called multi-stage flash, consumes 10–16 kWh for producing the same amount of purified water [7]. Due to the shortage of conventional power, multiple projects of industrial desalination are based on renewables [3,4,7,8].
The efficiency of thermal methods of desalination based on solar energy can be increased via the dispersion of nanoparticles in seawater [9,10,11,12], i.e., production of a nanofluid. The nanoparticles make it possible to implement the process of absorbing solar energy directly in the volume of the fluid and significantly reduce energy losses in the environment [13]. The first studies devoted to the boiling of nanofluids exposed to thermal radiation were carried out using lasers [14,15]. The first experimental study of the boiling of nanofluids under the action of concentrated solar radiation was presented in [16]. The authors used a water-based nanofluid with dispersed gold nanoparticles. The results of an experimental study showed that the evaporation efficiency was about 80%. The high efficiency of nanofluid evaporation with gold particles was also shown in [17], where the nanoparticles with a size of 20 nm were used with a 220-fold solar concentrator.
Despite the high evaporation efficiency, the widespread use of gold nanoparticles in desalination and steam-generating plants is complex due to their high cost. As an alternative to expensive gold nanoparticles, carbon nanoparticles or nanoparticles of metal oxides can be used. As was shown in [18], the evaporation efficiency can reach 75% when using such nanoparticles.
The studies mentioned above mainly focus on analyzing the dynamics of boiling nanofluids under thermal radiation and assessing the efficiency of this process. However, they do not explore the prospect of using this process in desalination plants. In these works, either distilled or tap water was used as the dispersing fluid. This article presents an experimental study of photothermal steam generation in saltwater with dispersed nanoparticles. We consider how the concentration of the particles influences the efficiency of the process.

2. Materials and Methods

2.1. Nanoparticles and Fluids

In our experiments, we used three types of nanoparticles: iron oxide Fe 3 O 4 nanoparticles from the “Technology Company “ Nanopowders” (Saransk, Russia) [19] with an average size of 80–120 nm in dry conditions, and multi-wall carbon nanotubes (MWCNT) [20] and commercial paste NT AQUA DEALTOM from the “Nanotechnology Center” (Moscow, Russia) [20]. The MWCNTs were of two main sizes: 49.3 ± 0.45 nm and 72.0 ± 0.45 nm in dry conditions. Their maximum length did not exceed 5 μ m [20]. NT AQUA DEALTOM is based on the same type of MWCNTs, a commercial organic surfactant, and water.
For all the mentioned types of particles, distilled degassed water with the addition of sea salt from Doctor Sea Cosmetics [21] was used as the base liquid. The amount of sea salt was determined in such a way that the salinity of the resulting base fluid was 35 g/kg (35 ppt), corresponding to the average salinity of seawater. To analyze the influence of the sea salt on the photothermal boiling, we prepared the dispersion with a similar composition without the salt.
The suspensions were prepared using the conventional two-step method, which is usually used to produce nanofluid [22,23]. First, the initial dry nanopowder was added into the base fluid, and then the resulting suspension was mixed using an ultrasonic homogenizer MEF93.T from MELFIZ (Moscow, Russia). The suspension was sonicated for 30 min at a power of 600 W and a frequency of 22 ± 1.65 kHz.

2.2. Experimental System

To carry out the experiments, we designed and constructed a photothermal boiling rig. The main purpose of the rig was the measurement of the mass flow of the steam generated in the suspension under the action of thermal radiation. The scheme of the experimental system is shown in Figure 1.
The main element of the experimental system was the steam generator denoted as “1” in Figure 1. The steam generator was a transparent spherical flask with a volume of 1 L. The radius of the spherical part of the flask is 13.5 cm. The steam generator, filled with 500 mL of the suspension, was fixed with an aluminum frame between 3 halogen lamps, Osram R7s [24], with a power of 400 W each, so the total radiant heat supplied to the flask surface was about 260 W. This total heat was determined by integrating the heat flux from each lamp over the flask surface occupied by the suspension, i.e., the integral was limited by the suspension level in the flask. The heat flux was obtained in a separate series of experiments by measuring the light flux of one lamp depending on the distance and angle between radiation and the power meter. The measurements were carried out using an LS 122 IR power meter (uncertainty of ±10%). More detailed information on the measurement of heat flux can be found in [22]. Furthermore, we note that the measured radiant heat flux corresponds to that for low degree concentration devices [25]. Furthermore, the minimum distance between the steam generator and lamps was 15 cm, which is well above the convective layer thickness of the lamps (∼1 cm) [26]. Hence, the convective heat transport from the lamps to the steam generator was assumed to be negligible.
The steam generator was closed with a rubber plug with two openings for a steam line and a line returning the condensed water to the flask while operating the experimental system. The produced steam was directed into condenser “10” through flow meter “4”. The cooling and the condensation of steam in condenser “10” were due to the circulation of water in the secondary circuit of the system. The secondary circuit was equipped with an air radiator for cooling the water, circulation pump “9” to provide the water flow, and water tank “8”. The condensate from the condenser was directed to expansion tank “6” and placed at a height of 50 cm, relative to the steam generator. The condensate was recycled back to the process under the hydrostatic pressure gradient. The volume of the studied sample in steam generator “1” was maintained approximately constant during experiments. All pipelines in the system were made of PVC pipes and were thermally insulated with a 10 mm layer of ceramic fiber with the thermal conductivity of 0.2 W/(m·K).
The measurement system of the experimental set-up consisted of a pressure gauge M043-R06 produced by Camozzi Automation [27] “3” (maximum error ± 0.15 bar), two K-type thermocouples TP-K01 connected to a data logger thermometer Center 309 from Prist (Moscow, Russia) [28] “7” (error ± 2.2 ° C), and a video camera was connected. The video camera was used as an indicative tool. The data from the sensors and the camera were gathered on a laptop. The sensitive parts of the thermocouples were placed into the steam generator through the supplementary holes in the rubber plug. The first thermocouple was placed in the bulk of the suspension, and the second was placed above the fluid to measure the temperature of the steam. The steam flow was measured with an Aqua Computer MPS Flow 100 flow meter [29], which was modified in-house to be able to measure the steam flow. Information on the flow meter calibration is given in the supplementary materials.
The experimental uncertainty for the measurement of the flow of steam was composed of statistical σ s and instrumental σ i errors. The statistical uncertainty is due to averaging the flow rate over time during the measurement duration; it is determined concerning a confidence interval of 95%. The instrumental error of the flow meter is determined according to the methodology given in [22]. The total uncertainty of measuring the steam flow was calculated following the standard technique as Δ G = σ s 2 + σ i 2 1 / 2 .
When the fluid started to boil, the flow in the system was unsteady for 40 min due to the condensation in initially cold tubes. After this period, a continuous recirculation of water and steam was established in the pipes, and the bulk temperature of the suspension and steam remained approximately constant and equal to the saturation temperature of the water. Thus, monitoring the steam and suspension bulk temperatures allowed us to determine the steady operation of the experimental set-up. The flowmeter signal was recorded during this steady operation for at least 3 min. Then, the steam flow was determined according to flow meter calibration (supplementary materials). Note that at least three identical experiments were carried out to determine the steam flow rate for all the considered suspension compositions.
To evaluate the influence of the nanoparticles, a similar experiment was carried out using brine without the nanoparticles. In this case, the transparent steam generator was replaced with an equivalent flask whose outer surface was covered by graphite.
Here, we should note that although the suspensions were prepared based on the degassed water, the presence of dissolved gasses was measured neither for the suspension after sonication nor after boiling. It is well known that the presence of dissolved gasses significantly affects vapor bubble formation [15,30]. However, as mentioned above, the steam flow measurements were carried out at a steady regime, i.e., after 40 min from starting the boiling. Therefore, the effect of dissolved gasses on steam generation was expected to be negligible during the measurements.

3. Results and Discussion

3.1. Experiments

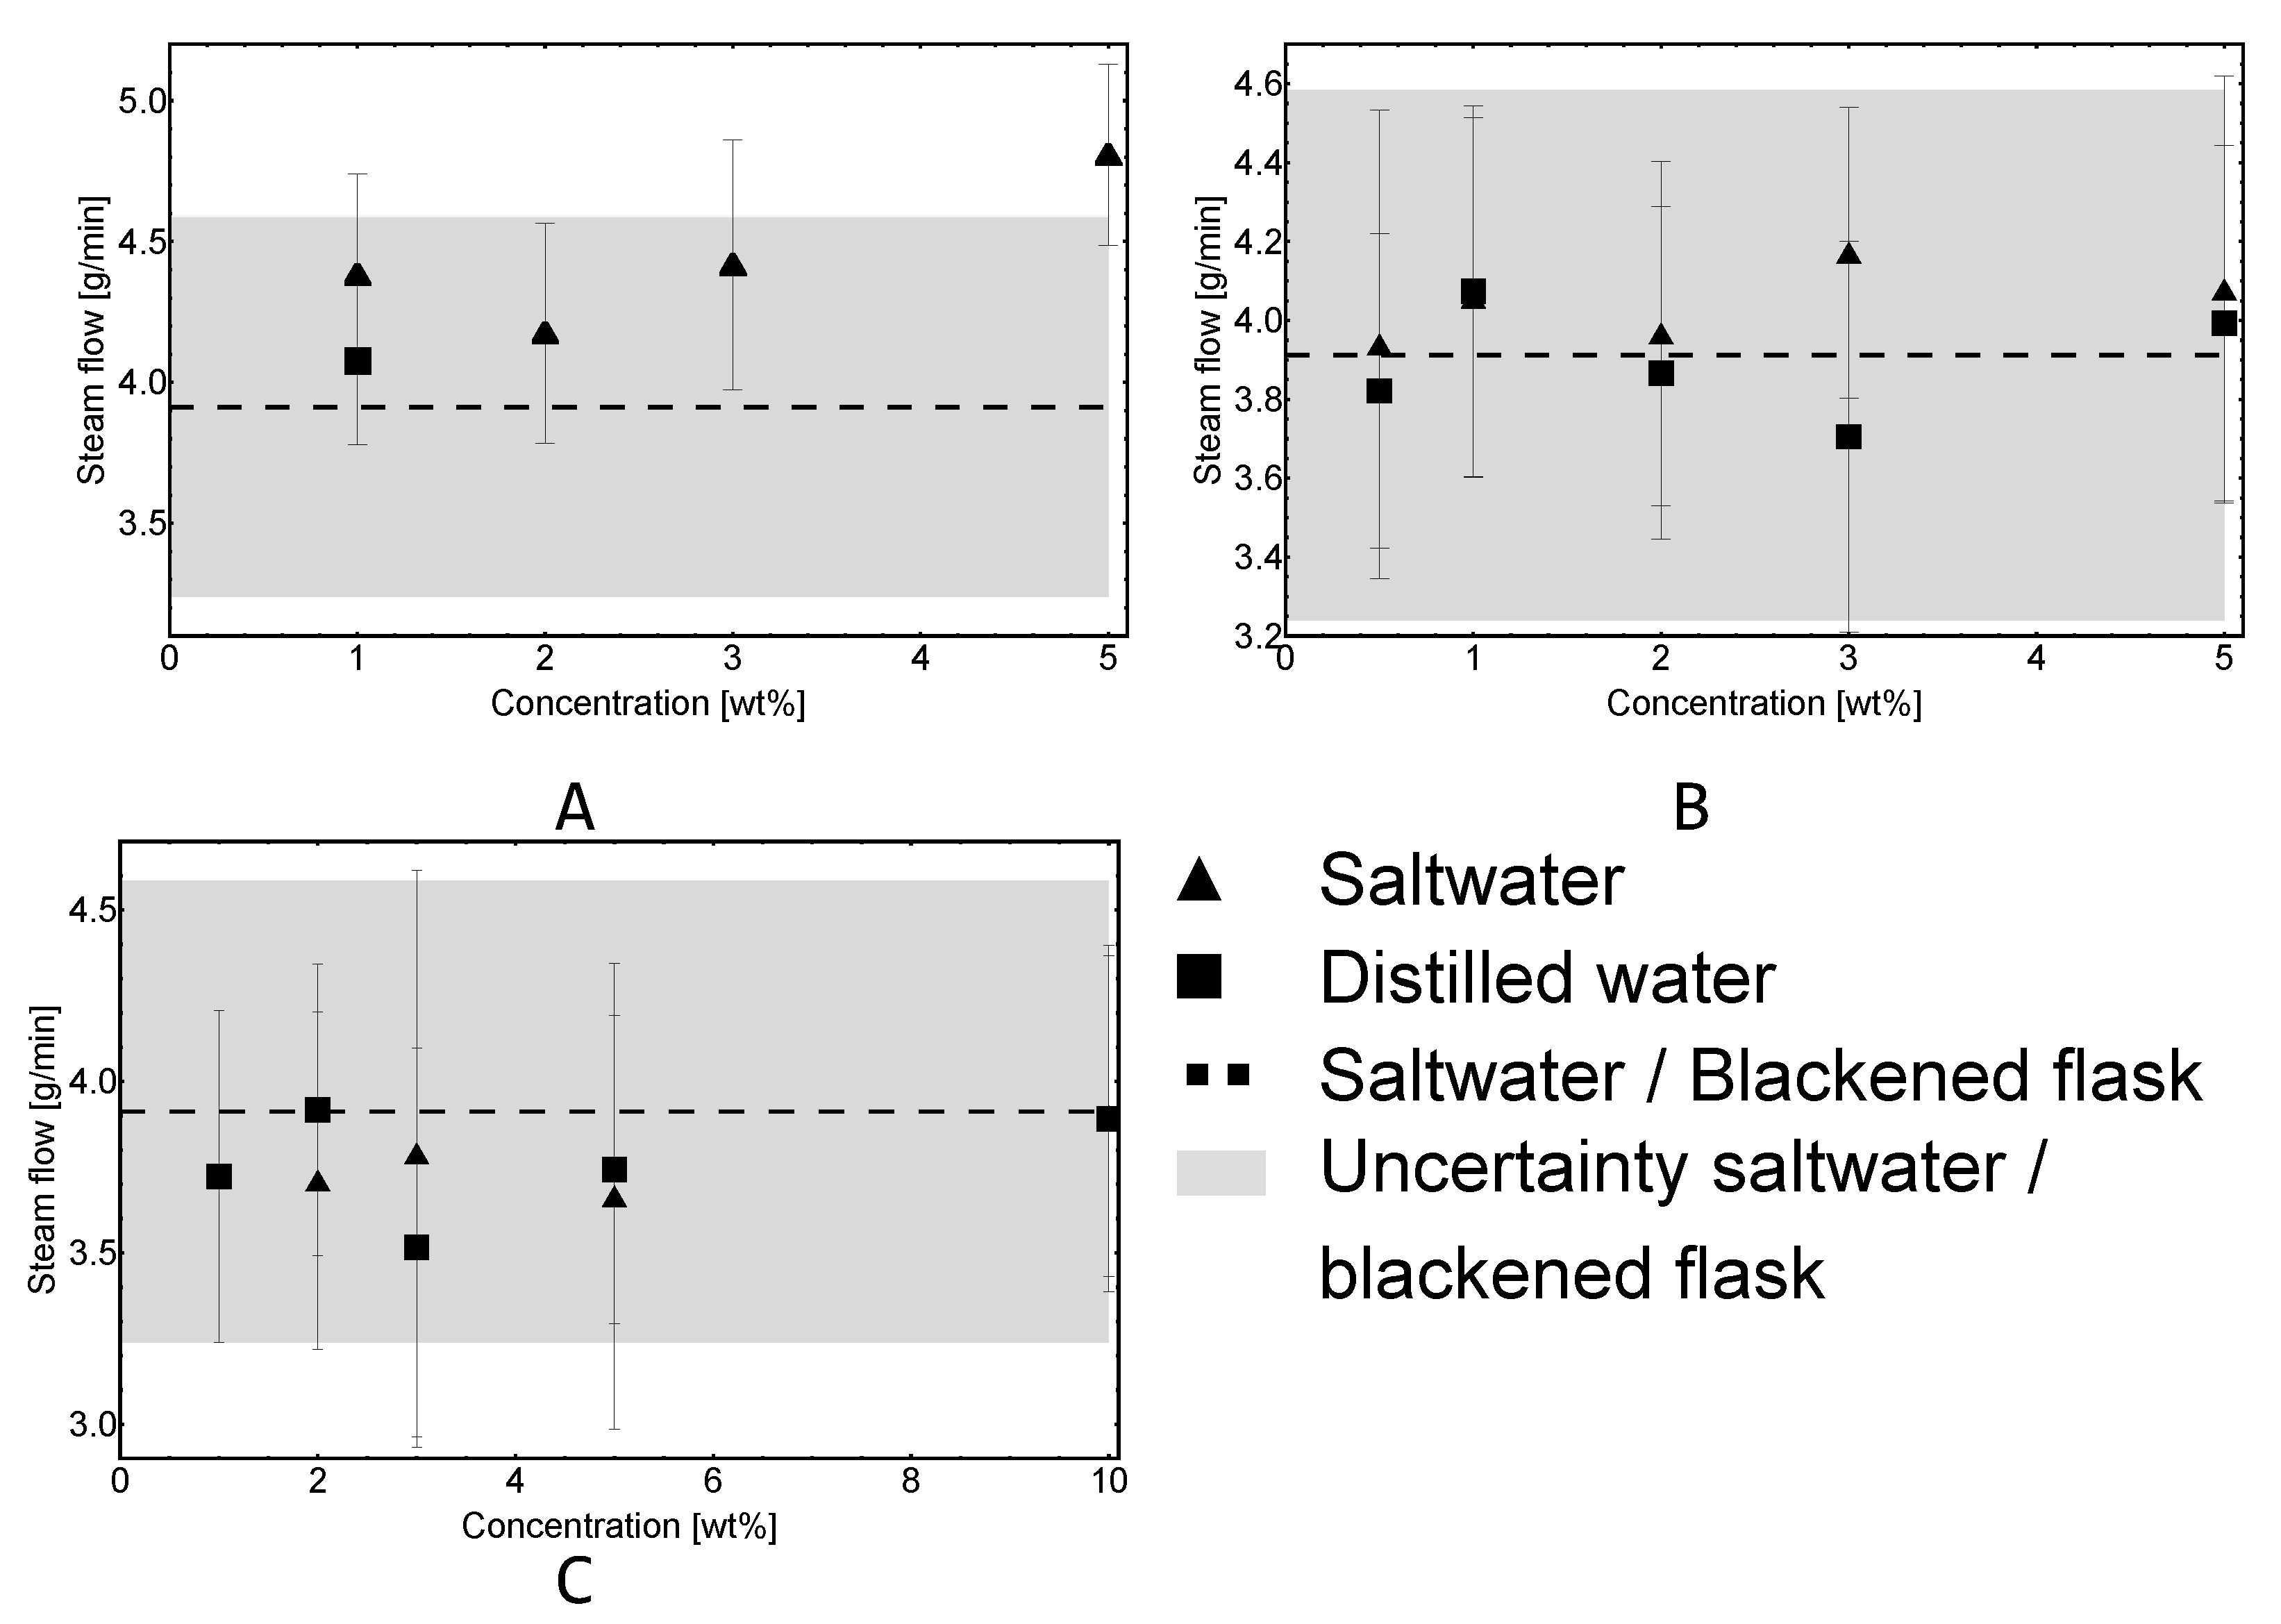
Figure 2 demonstrates how the measured flow rate of the steam depends on different types and concentrations of particles.
The total uncertainty of the measurement for saltwater in the blackened flask is highlighted with a gray area in the figure.
Reading Figure 2, we observe no significant differences in the steam flow for most of the considered alternatives when using brine as the base fluid. Within the specified uncertainties, the steam flow for the nanofluids with salt was almost the same as for the nanofluid produced using the distilled water. Therefore, it is possible to theoretically estimate the steam generation rate in the fluids with salt based on the data for distilled water for all suspension compositions considered in this work. Exceptions are the nanofluid with 1% wt. of carbon nanotubes and 3% wt. of iron oxide. For these nanofluids, a slight increase in the steam flow is observed when adding salt compared to the cases with distilled water. The observed experimental data are considered in more detail in the following Section 3.2.
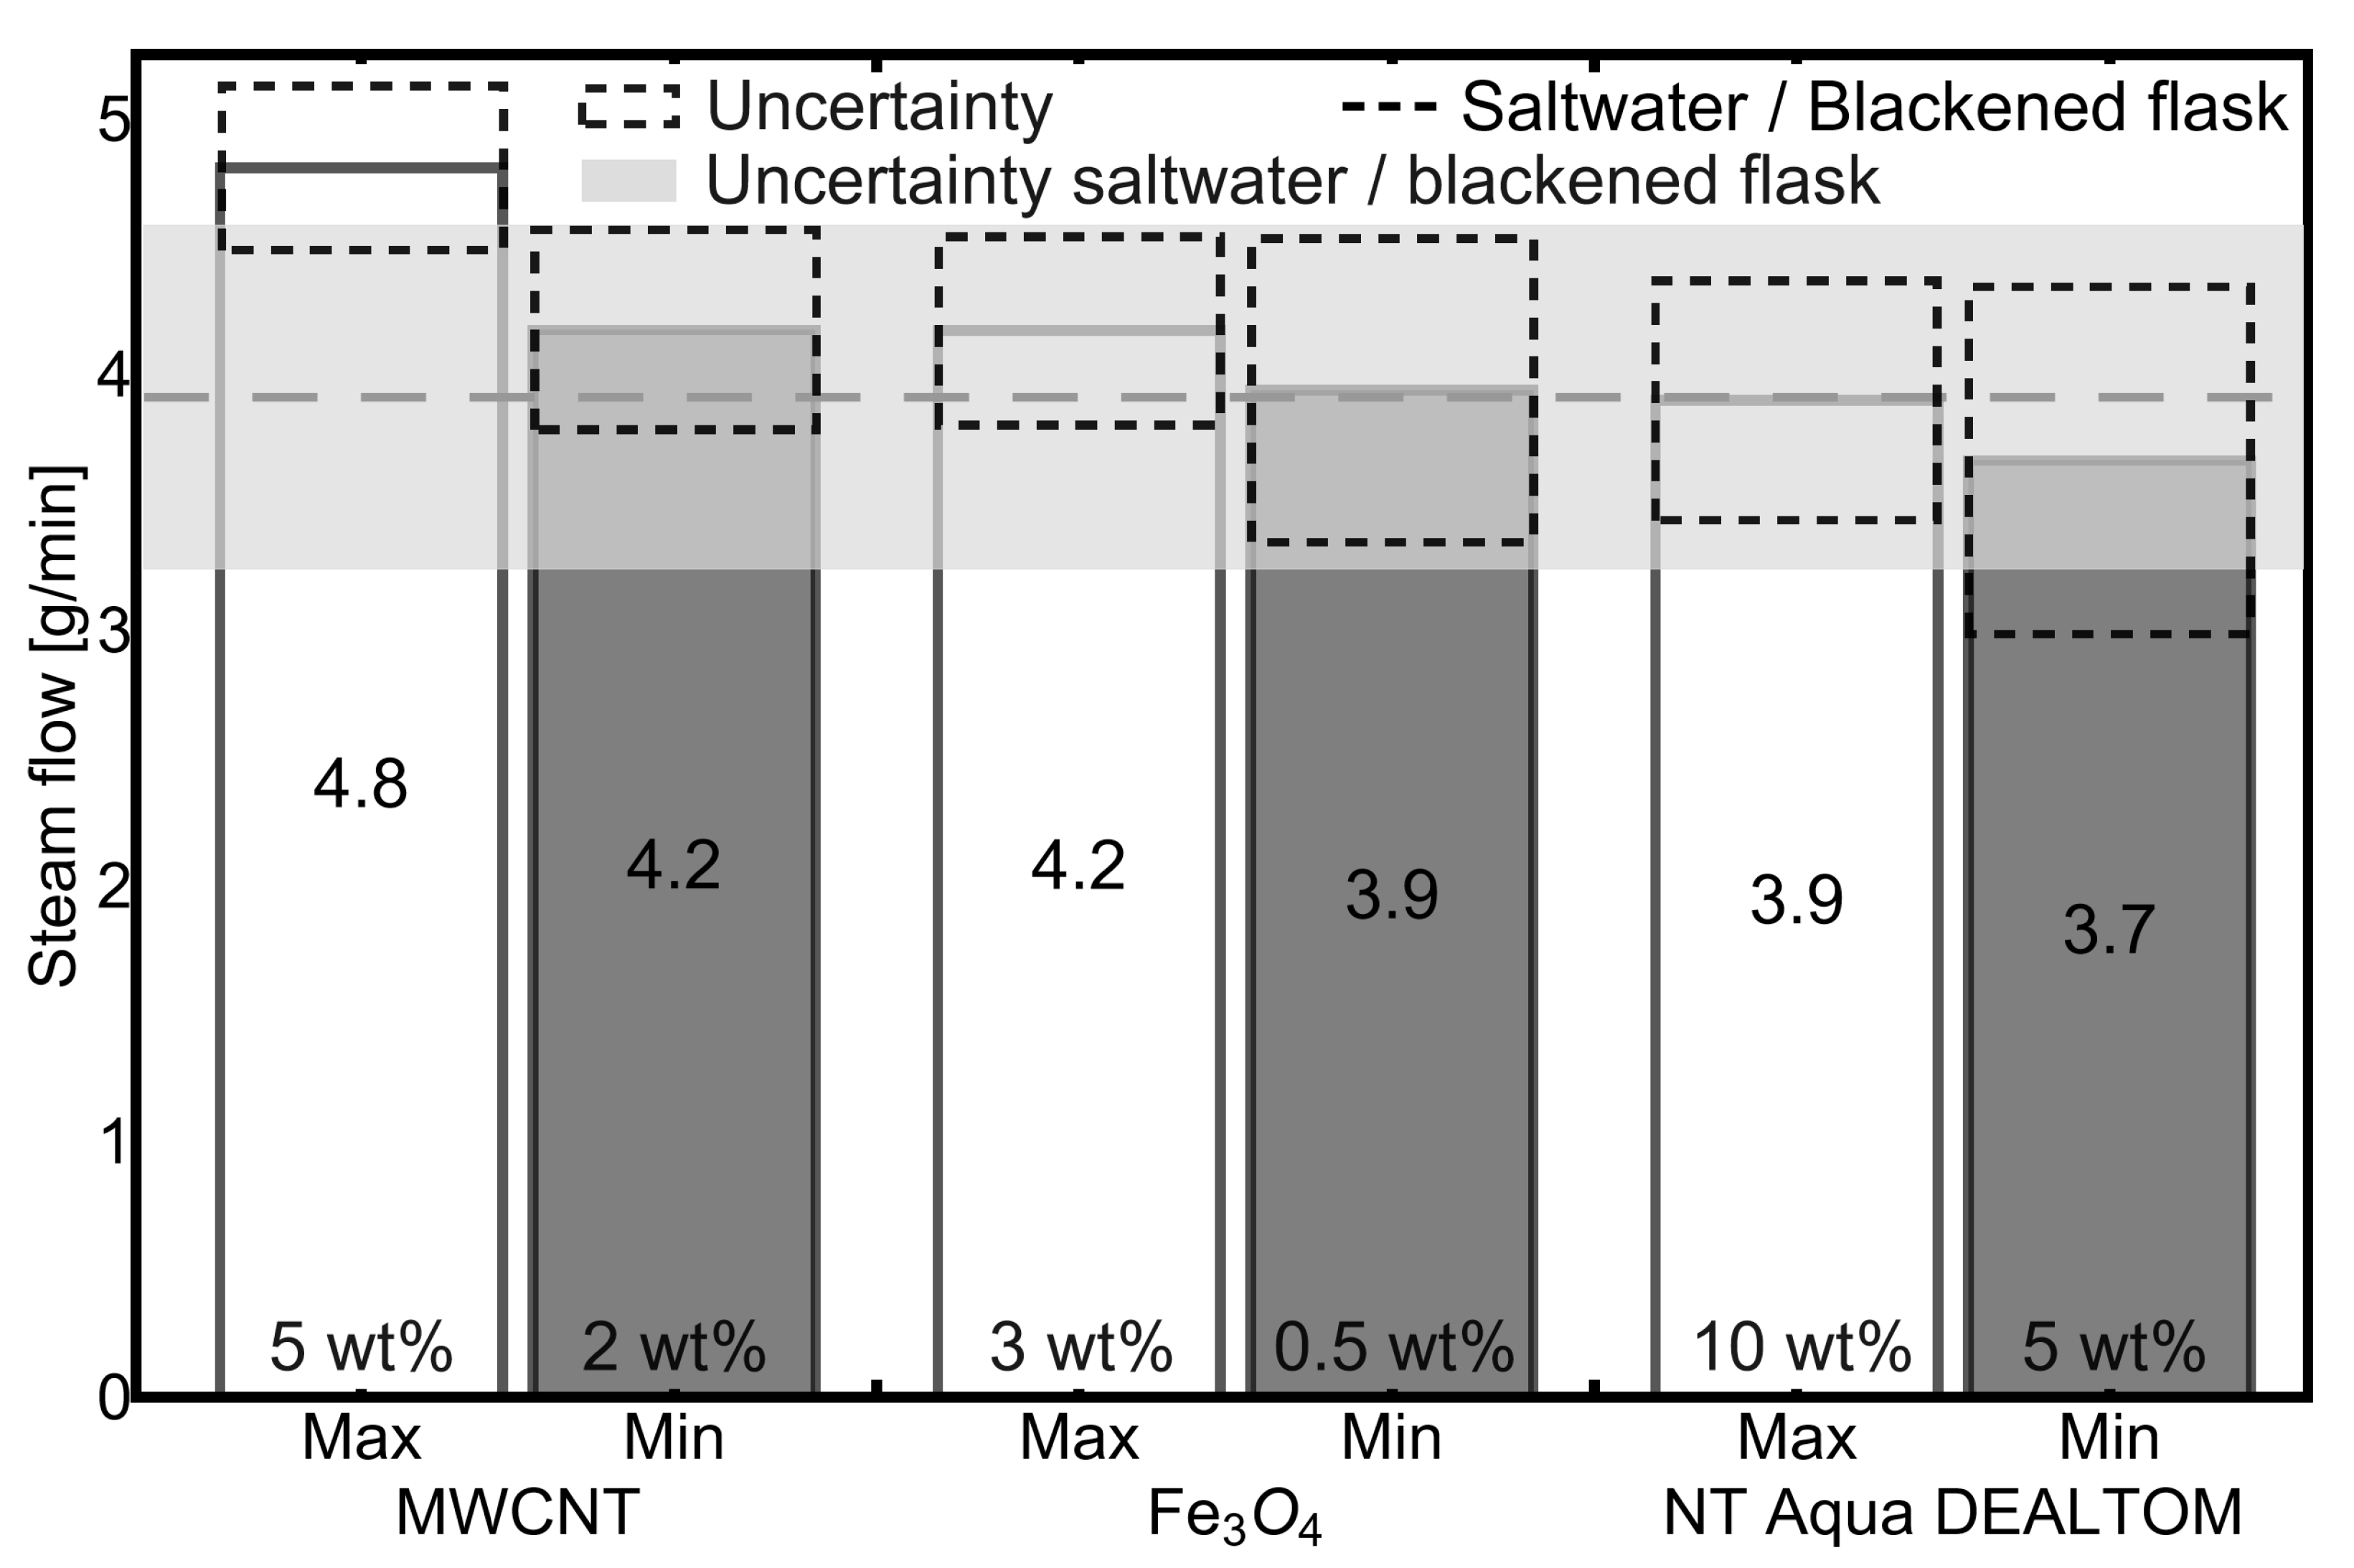
To determine the optimal composition of suspension that comes with the highest flow of the steam, we use Figure 3. The figure shows the maximum and minimum steam flows obtained in experiments for all suspensions considered. As a reference measurement, the steam flow for saltwater in the blackened flask and corresponding uncertainty are also depicted in Figure 3 with a dashed line and a gray area, respectively. As shown in Figure 3, the most significant increase in the steam generation rate occurs when MWCNT with a mass fraction of 5% wt. is added. In this case, the steam flow increases by 23% compared to the brine in the blackened flask. Notably, the error bar for 5% MWCNT suspension intersects the error bar for brine in the blackened flask. However, the intersection is primarily within the round-off error. Indeed, the steam flow for 5% MWCNT suspension is 4.8 ± 0.3 g/min against 3.9 ± 0.7 g/min for the brine. Thus, the coincidence of steam flow rates along the lower boundary for a 5% MWCNT suspension and along the upper boundary for the brine is unlikely, which indicates an increase in the steam generation rate when adding MWCNT. This conclusion is also confirmed statistically since the mentioned increase in steam flow by 23% was obtained by averaging the results from several repeating trials.
By contrast, adding 10% wt. of the NT AQUA DEALTOM does not affect the steam generation rate. The steam flow for this suspension coincides with that for the brine in the blackened flask within experimental uncertainty for all considered fractions. Adding 3% wt. of iron oxide nanoparticles increases the steam flow by 7% compared to the brine. However, as shown in Figure 3, the experimental uncertainty of steam flow for the suspension with 3% wt. of iron oxide nanoparticles is within the uncertainty for the brine, so we cannot unambiguously conclude about an increase in the steam generation rate for this suspension composition.

3.2. Evaporation Efficiency

For further analysis of the obtained results, it is convenient to evaluate the evaporation efficiency, which is commonly used to assess the efficiency of solar steam generation [17,22,31,32]. Evaporation efficiency η is the ratio of the energy spent on the evaporation of the liquid to the total heat supplied to the system:
η = G r Q ,
where G is the steam generation rate and r is the latent heat of vaporization; Q is the total heat flux supplied to the system.
In a previous work by Struchalin et al. [22], a model was developed that allows one to estimate the efficiency of evaporation during boiling of a suspension exposed to thermal radiation. According to this model, the evaporation efficiency is computed as:
η = 2 π 3 3 1 f v ϕ c r γ Ja p + 1 f v f v 1 + Ja + σ ρ v r D p 6 + 2 ϕ c r f v + 4 ϕ c r 1 ,
where f v is the particle volume fraction; ϕ c r is the ratio of thickness of boiling zone l to the average particle diameter D p , ϕ c r = l / D p ; γ is the ratio of the density of the particles ρ p to the steam density ρ v , γ = ρ p / ρ v ; Ja p is a modified Jacob number with the specific heat of the particles C p , Ja p = C p Δ T / r ; Δ T is the superheat relative to the saturation temperature, which was estimated as Δ T = 4 σ T s / ( r ρ v D p ) [30]; Ja is the Jacob number, Ja = C f Δ T /r; C f is the specific heat of the base fluid; σ is the surface tension of the base fluid in a saturated state; and T s is the water saturation temperature.
Derivation of Equation (2) is based on the assumption that the vapor bubbles are produced in a narrow boundary layer of liquid that is adjacent to the irradiated surface. This layer is termed the boiling zone, and its thickness is assumed to be equal to the optical penetration depth and can be estimated according to [22,31], as l = K f + 6 f v / D p 1 , where K f is the wavelength-averaged extinction coefficient of the base fluid.
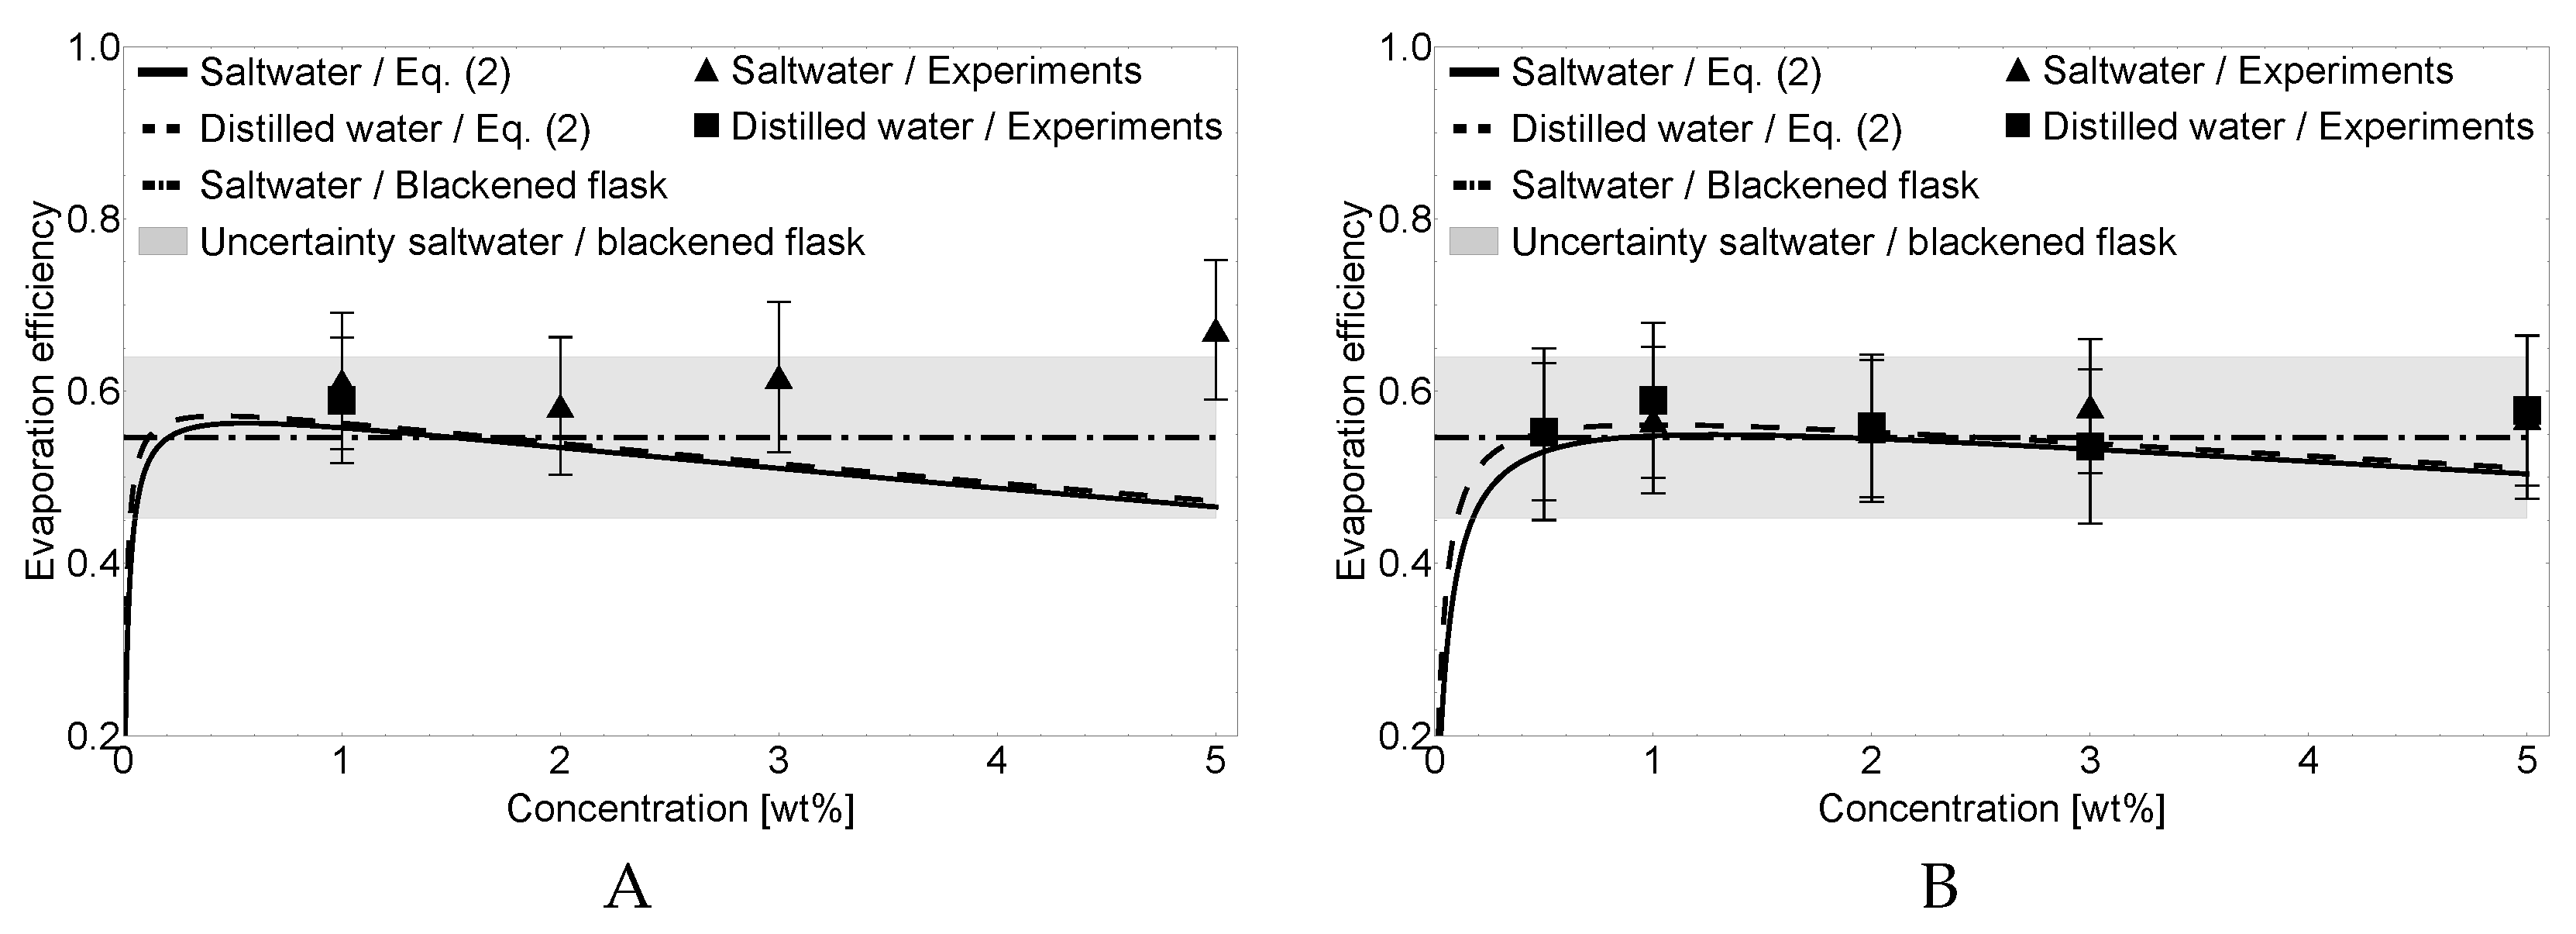
Figure 4 shows the dependence of evaporation efficiency on the particle mass fraction for suspensions with MWCNTs (A) and iron oxide nanoparticles (B). The experimental results are compared to the calculations according to Equation (2).
The thermophysical properties of salt and distilled water used for calculation are determined following [33,34], respectively.
The experimental evaporation efficiency in Figure 4 is calculated using Equation (1) and experimental values of the steam flow. Here, we note that the evaporation efficiency calculated following Equations (1) and (2) does not consider the energy spent on heating the recycled condensate to saturation temperature since the current study focuses on steam generation performances of the system. Hence, the energy required to heat the recycled condensate is not considered “useful work”. Moreover, taking into account that the temperature of the condensate during the steady-state operation was about 40 ° C, we can estimate this energy, which is about 16 W and does not exceed 6% of energy supplied to the system. Therefore, the energy used to heat the recycled condensate to saturation temperature has no significant impact on the evaporation efficiency in this study, altering it within the experimental uncertainty. However, we should note that this issue could be of vital importance in case of the unsteady transient processes in the system or when the desalinator is fed with cold seawater.
As shown in Figure 4, Equation (2) reproduces the experimental data with high accuracy as the concentration-averaged discrepancy is below 7.2%. The maximum discrepancy of 31% is observed for the MWCNT at a mass fraction of 5 wt%.
Furthermore, reading Figure 4, we note that the experimental evaporation efficiencies for suspensions based on saltwater and distilled water coincide within the uncertainties. Similar behavior is observed for theoretical curves, which demonstrate the coincidence in almost the entire range of the considered concentrations, except the region of low concentrations (less than 1% wt.). The independence of evaporation efficiency on water salinity indicates that the slow increase in steam flow with an increase in salinity during the steady operation, as noted earlier, is primarily due to a decrease in the latent heat of vaporization for saltwater [33].
The influence of salinity on steam generation is not limited to the heat of vaporization. The noted effect is due to the steady-state operation of the experimental system and high condensate temperature. However, the salinity changes most properties of water and affects steam generation complexly. Thus, for example, the increase in salinity causes a reduction in specific heat, resulting in a change in the dynamics of heating the suspension. Of particular importance is the modification of the capillary properties of the liquid (surface tension, wettability, etc.), which significantly affects the stability of the suspension.
In previous studies by the authors, in which the base fluid was either distilled or tap water, the results were different from those observed in this paper. In article [31], the evaporation efficiency of the suspension with dispersed graphite particles had a maximum of 70% at a particle mass fraction of 3% wt. In this study, the maximum evaporation efficiency is 67% with a particle mass concentration of 5% wt. This difference should be primarily attributed to the difference in the shape of the particles used in [31]; graphite particles with a shape close to spherical and with an average size of 51 ± 17 nm were used. This shape of the particles simplifies their maintenance in a suspended state due to the Brownian forces. It makes it possible to assume the better stability of the suspension, which leads to the noted difference in the evaporation efficiency. Moreover, we should note the significant differences in the experimental systems on which the measurements were carried out and the resulting scale factors (in [15], a test tube with a diameter of 14 mm and height of 148 mm was used as a steam generator). Similar results for graphite nanofluid were also presented in [18].
The evaporation efficiency of suspension based on iron oxide nanoparticles in this work varied from 55 to 58% depending on the particle fraction, and slightly exceeds the evaporation efficiency in a blackened flask, which is consistent with the results obtained in [22]. The maximum evaporation efficiency (and steam flow, as a proportional value) for dispersion with iron oxide particles in [22] is also observed at a mass concentration of 3% wt.
It is interesting to note that in the recent study by Sattar et al. [9], several types of water-based nanofluids with graphene oxide, zinc oxide, copper oxide, and their hybrids were tested under the natural solar heat flux for application in a direct absorption collector. The authors found that the evaporation efficiency for all cases varied within a range of 0.2 to 0.5. The highest evaporation efficiency of about 0.46–0.48 was observed for graphene oxide nanoparticles at a mass fraction of 1.2 × 10 3 % wt. Similar values of evaporation efficiency are obtained in this study for iron oxide Fe 3 O 4 nanoparticles at a significantly higher mass fraction of particles of 3% wt. Here, we should note that Sattar et al. in their study [9] used the term “photothermal efficiency,” which is slightly different from that used in the present study. Namely, the photothermal efficiency accounts for the energy spent on heating the nanofluid in addition to the evaporation energy. For this reason, we can observe sufficient differences in the particle fraction at similar efficiencies between the present study and the work by Sattar et al. Considering the relatively high evaporation efficiency for our cases with iron oxide nanoparticles, these types of particles may be of most significant interest for several applications, including solar-driven desalination, due to their ability to remove particles from a condensate using an external magnetic field.
A detailed analysis of the results obtained for suspensions based on the commercial NT Aqua by DEALTOM is complex due to the lack of accurate information on its composition. However, it should be noted that due to the presence of auxiliary components in the paste, the actual mass concentration of particles differs from the concentration of the composition itself.

4. Conclusions

This paper presents the results of the experimental study of photothermal desalination enabled by nanoparticles. The research was carried out for three types of nanoparticles: multi-wall carbon nanotubes, particles of iron oxide Fe 3 O 4 , and the commercial paste NT Aqua DEALTOM. This choice of the type of particles is due to several advantages in applications of solar steam generation and, in particular, desalination of seawater using solar energy. A low cost, light-absorbing solid properties, and the possibility of organizing a closed steam cycle make it promising to create a laboratory-scale prototype of a solar desalinator.
We carried out the experiments altering the mass concentration of nanoparticles from 0.5 to 10% wt. For comparison, additional series of experiments were carried out for suspensions based on distilled water. A comparative analysis of the vapor generation rate for the cases with salt and the distilled water did not reveal significant differences in steam flow when sea salt was added to the fluid. An additional analysis of the evaporation efficiency using a previously developed model of photothermal boiling in nanoparticles demonstrated that a slight increase in the steam flow upon adding salt is due to a decrease in the latent heat of vaporization for the brine. However, this effect should be attributed to the methodology of the present experimental study, namely steady-state operation and condensate recirculation. The evaporation efficiencies for all considered experiments are well reproduced by the theoretical model with a concentration-averaged discrepancy of about 7%. Comparing the experimental results for the brine with the results for the saltwater in the blackened flask showed that the highest steam generation rate is achieved by adding 5% wt. MWCNT to the brine. In this case, the steam generation rate increases by 23% compared to saltwater in the blackened flask, and the evaporation efficiency reaches 67%.
The results obtained are of interest for the enhancement of the existing technologies of solar desalination. Further research in this direction should also investigate the purity of the resulting condensate, particles in the condensate, and the long-term stability of this type of solar desalination process.

Supplementary Materials

The following are available online at https://www.mdpi.com/article/10.3390/en14185743/s1.

Author Contributions

Conceptualization, K.V.K. and B.V.B.; methodology, P.G.S. and D.M.K.; software, D.M.K.; validation, D.M.K.; formal analysis, D.M.K.; investigation, A.V.O., V.S.Y. and P.G.S.; resources, K.V.K. and B.V.B.; data curation, P.G.S.; writing—original draft preparation, D.M.K. and P.G.S.; writing—review and editing, B.V.B. and K.V.K.; visualization, D.M.K. and A.V.O.; supervision, B.V.B.; project administration, K.V.K.; funding acquisition, K.V.K. All authors have read and agreed to the published version of the manuscript.

Funding

The reported study was funded by RFBR, project number 19-38-90306.

Institutional Review Board Statement

Not applicable.

Informed Consent Statement

Not applicable.

Data Availability Statement

Not applicable.

Acknowledgments

The authors thank Maksim I. Pisarevskii from the National Research Nuclear University MEPhI (Moscow Engineering Physics Institute) for their help in conducting experiments.

Conflicts of Interest

The authors declare no conflict of interest. The funders had no role in the design of the study; in the collection, analyses, or interpretation of data; in the writing of the manuscript; or in the decision to publish the results.

References

  1. UNESCO World Water Assessment Programme. The United Nations World Water Development Report 2019: Leaving No One behind; UNESCO: Paris, France, 2019. [Google Scholar]
  2. Ercin, A.; Hoekstra, A. Water footprint scenarios for 2050: A global analysis. Environ. Int. 2014, 64, 71–82. [Google Scholar] [CrossRef]
  3. Ahmed, F.; Hashaikeh, R.; Hilal, N. Solar powered desalination–Technology, energy and future outlook. Desalination 2019, 453, 54–76. [Google Scholar] [CrossRef] [Green Version]
  4. Panagopoulos, A. Water-energy nexus: Desalination technologies and renewable energy sources. Environ. Sci. Pollut. Res. 2021, 28, 21009–21022. [Google Scholar] [CrossRef]
  5. Jones, E.; Qadir, M.; van Vliet, M.; Smakhtin, V.; Kang, S.M. The state of desalination and brine production: A global outlook. Sci. Total Environ. 2019, 657, 1343–1356. [Google Scholar] [CrossRef] [PubMed]
  6. Mahavar, S.; Goyal, A.; Balakin, B.V. Investigation of a Solar Concentrator for Water Distillation. In Advances in Thermal Engineering, Manufacturing, and Production Management; Springer: Singapore, 2020; pp. 209–217. [Google Scholar]
  7. Ihsanullah, I.; Atieh, M.; Sajid, M.; Nazal, M. Desalination and environment: A critical analysis of impacts, mitigation strategies, and greener desalination technologies. Sci. Total Environ. 2021, 780, 146585. [Google Scholar] [CrossRef]
  8. Ahmed, F.; Khalil, A.; Hilal, N. Emerging desalination technologies: Current status, challenges and future trends. Desalination 2021, 517, 115183. [Google Scholar] [CrossRef]
  9. Sattar, A.; Farooq, M.; Amjad, M.; Saeed, M.; Nawaz, S.; Mujtaba, M.; Anwar, S.; El-Sherbeeny, A.; Soudagar, M.; Bandarra Filho, E.; et al. Performance evaluation of a direct absorption collector for solar thermal energy conversion. Energies 2020, 13, 4956. [Google Scholar] [CrossRef]
  10. Kasaeian, A.; Daneshazarian, R.; Pourfayaz, F. Comparative study of different nanofluids applied in a trough collector with glass-glass absorber tube. J. Mol. Liq. 2017, 234, 315–323. [Google Scholar] [CrossRef]
  11. Boldoo, T.; Ham, J.; Kim, E.; Cho, H. Review of the photothermal energy conversion performance of nanofluids, their applications, and recent advances. Energies 2020, 13, 5748. [Google Scholar] [CrossRef]
  12. Boldoo, T.; Ham, J.; Cho, H. Comprehensive experimental study on the thermophysical characteristics of di water based co0.5zn0.5fe2o4 nanofluid for solar thermal harvesting. Energies 2020, 13, 6218. [Google Scholar] [CrossRef]
  13. Lucas, M.; Kosinski, P.; Balakin, B. Eulerian–Eulerian model for photothermal energy conversion in nanofluids. AIP Conf. Proc. 2019, 2116, 030011. [Google Scholar] [CrossRef]
  14. Sani, E.; Papi, N.; Mercatelli, L.; Żyła, G. Graphite/diamond ethylene glycol-nanofluids for solar energy applications. Renew. Energy 2018, 126, 692–698. [Google Scholar] [CrossRef]
  15. Wang, Y.; Zaytsev, M.; The, H.; Eijkel, J.; Zandvliet, H.; Zhang, X.; Lohse, D. Vapor and Gas-Bubble Growth Dynamics around Laser-Irradiated, Water-Immersed Plasmonic Nanoparticles. ACS Nano 2017, 11, 2045–2051. [Google Scholar] [CrossRef]
  16. Neumann, O.; Urban, A.; Day, J.; Lal, S.; Nordlander, P.; Halas, N. Solar vapor generation enabled by nanoparticles. ACS Nano 2013, 7, 42–49. [Google Scholar] [CrossRef] [PubMed]
  17. Jin, H.; Lin, G.; Bai, L.; Zeiny, A.; Wen, D. Steam generation in a nanoparticle-based solar receiver. Nano Energy 2016, 28, 397–406. [Google Scholar] [CrossRef] [Green Version]
  18. Ulset, E.; Kosinski, P.; Zabednova, Y.; Zhdaneev, O.; Struchalin, P.; Balakin, B. Photothermal boiling in aqueous nanofluids. Nano Energy 2018, 50, 339–346. [Google Scholar] [CrossRef]
  19. Technology Company “Nanopowders”. 2021. Available online: http://www.technopark-mordovia.ru/ (accessed on 13 July 2021).
  20. DEALTOM. 2021. Available online: http://dealtom.ru/ (accessed on 8 June 2021).
  21. Doctor Sea. 2021. Available online: https://www.doctor-sea.com/ (accessed on 13 July 2021).
  22. Struchalin, P.; Thon, H.; Kuzmenkov, D.; Kutsenko, K.; Kosinski, P.; Balakin, B. Solar steam generation enabled by iron oxide nanoparticles: Prototype experiments and theoretical model. Int. J. Heat Mass Transf. 2020, 158, 119987. [Google Scholar] [CrossRef]
  23. Kuzmenkov, D.; Delov, M.; Zeynalyan, K.; Struchalin, P.; Alyaev, S.; He, Y.; Kutsenko, K.; Balakin, B.V. Solar steam generation in fine dispersions of graphite particles. Renew. Energy 2020, 161, 265–277. [Google Scholar] [CrossRef]
  24. OSRAM. 2021. Available online: https://www.osram.com/ (accessed on 8 June 2021).
  25. Sukhatme, S.; Nayak, J. Solar Energy: Principles of Thermal Collection and Storage; Tata McGraw Hill: New Delhi, India, 2011. [Google Scholar]
  26. Ulset, E. Utilizing Solar Vapour Energy by Use of Nanofluids in a Direct Absorption Solar Collector. Master’s Thesis, University of Bergen, Bergen, Norway, 2018. [Google Scholar]
  27. Camozzi Automation. 2021. Available online: https://www.camozzi.ru/ (accessed on 13 July 2021).
  28. Prist. 2021. Available online: https://prist.ru/ (accessed on 13 July 2021).
  29. Aqua Computer. 2021. Available online: https://shop.aquacomputer.de/ (accessed on 13 July 2021).
  30. Prosperetti, A. Vapor Bubbles. Annu. Rev. Fluid Mech. 2017, 49, 221–248. [Google Scholar] [CrossRef]
  31. Ulset, E.; Kosinski, P.; Balakin, B. Solar steam in an aqueous carbon black nanofluid. Appl. Therm. Eng. 2018, 137, 62–65. [Google Scholar] [CrossRef]
  32. Ni, G.; Miljkovic, N.; Ghasemi, H.; Huang, X.; Boriskina, S.; Lin, C.T.; Wang, J.; Xu, Y.; Rahman, M.; Zhang, T.; et al. Volumetric solar heating of nanofluids for direct vapor generation. Nano Energy 2015, 17, 290–301. [Google Scholar] [CrossRef] [Green Version]
  33. Sharqawy, M.; Lienhard V, J.; Zubair, S. Thermophysical properties of seawater: A review of existing correlations and data. Desalin. Water Treat. 2010, 16, 354–380. [Google Scholar] [CrossRef]
  34. Wagner, W.; Pruß, A. The IAPWS formulation 1995 for the thermodynamic properties of ordinary water substance for general and scientific use. J. Phys. Chem. Ref. Data 2002, 31, 387–535. [Google Scholar] [CrossRef] [Green Version]
Figure 1. Scheme of the experimental system: 1—Steam generator; 2—Lamps; 3—Pressure gauge; 4—Flow meter; 5—Air condenser; 6—Condensate reservoir; 7—Data logger thermometer; 8—Water tank; 9—Circulation pump; 10—Water condenser; 11—Computer.
Energies 14 05743 g001
Figure 2. Steam flow as a function of particle mass concentration for carbon nanotubes MWCNT (A), iron oxide Fe 3 O 4 nanoparticles (B), and NT AQUA DEALTOM composition (C).
Energies 14 05743 g002
Figure 3. Maximum and minimum values of the mass flow of steam.
Energies 14 05743 g003
Figure 4. Evaporation efficiency as a function of particle mass concentration for carbon nanotubes MWCNT (A) and iron oxide Fe 3 O 4 nanoparticles (B). The experimental results (points) are compared to the calculations according to Equation (2) (lines). The evaporation efficiency for the saltwater in the blackened flask (dash-dotted line) and corresponding uncertainty are plotted for reference.
Energies 14 05743 g004
Publisher’s Note: MDPI stays neutral with regard to jurisdictional claims in published maps and institutional affiliations.