1. Introduction
The terms energy, production and use of energy have started to be used in every field, especially in recent years, as energy is a great power that directly affects all humanity. We have to use this power in a correct, environmentally friendly, innovative and sustainable way, otherwise the irreversible consequences of climate change and global warming will endanger the future of humanity. In addition to this ongoing danger, as of March 2019, humanity faced the Coronavirus (COVID-19) pandemic [
1]. Countries have taken many measures to fight against this pandemic; the most important of which is the lockdown, which is thought to prevent contact and contamination. As the lockdown times increased, some environmental analyses began to be performed. This process showed that there was a great change in air quality, especially in crowded cities and areas with high mobility [
2,
3]. The main reason for this change is the decrease in the mobility of conventional motor vehicles used in urban transportation and emissions caused by transportation [
4,
5,
6]. The reduction in emissions has many positive effects in terms of both human health and the environment. However, in order to ensure this effect is permanent, it is vital to encourage and expand the use of sustainable energy and transportation types in urban transportation. Istanbul, which has the highest human and vehicle mobility in Turkey [
7], was selected as the study area, and the change in air quality, traffic density and vehicle speeds pre- and post-lockdown were analyzed.
The study seeks answers to two main research questions in which the pre- and post-lockdown situation is discussed. These are:
In this analysis process, traffic density and vehicle speed data measured with the help of sensors placed by the local municipality throughout Istanbul, as well as air quality index values obtained from air quality measurement stations were considered. The data used can be classified as big data. Geographic Information Systems (GIS) were used for both the size of the data and the analysis results, in order to be more understandable. Although GIS is a frequently preferred analysis tool in the literature in various analyses of COVID-19 and monitoring the air quality of cities, remote sensing-based machine learning has also been a very popular tool in recent years. GIS and remote sensing techniques are tools widely applied to the energy field in various sectors, ranging from building construction [
8] to energy management [
9], as well as to mobility [
10]. In the mobility sector, the adoption of new technologies related to vehicle traction (electric motors) is leading to improvements in environmental impacts [
11,
12]. GIS maps are implemented in various areas, such as in the monitoring, analysis of road accidents, identifying risk factors, in assessing road congestion and in choosing mitigation strategies [
13].
Optimal control and management of mobility entails starting with the inclusion of electric vehicles in the national fleet and control by means of a series of sensors installed in the infrastructure (such as video cameras, sensors for environmental and acoustic parameters, sensors for measuring road flows, etc.) and finally the mapping of the results acquired on a GIS basis in order to assess and draw up risk maps and consider the optimal or most critical scenarios for a city as vehicle flows change [
14,
15,
16]. The recent pandemic has highlighted a number of critical issues and benefits brought about by the drastic reduction of mobility that laid the basis for an assessment of mobility development in the pre-pandemic phase, taking into account the sustainable and resilient aspect [
17].
The paper is organized as follows:
Section 2 presents literature studies on traffic parameters, air quality and COVID-19. In
Section 3, brief material and method information about the study are given. In
Section 4, there is analysis information of the GIS approach by conducting a case study for Istanbul. In
Section 5, the results of the study are discussed, and sustainable transportation proposals were mentioned. Finally, it provides information about the result of the study and future studies.
2. Literature Review on Vehicular Pollutant Emission Pre and Post Pandemic
In general, scientific or public questions about COVID-19 are discussed on social media and related scientific studies. Some of the questions discussed, especially in terms of transportation, are listed below [
18]:
Is air quality related to virus spread?
How did traffic parameters such as traffic congestion and number of vehicles change during the pandemic period?
Are public transportation sufficient and safe during the pandemic process?
How does air quality change pre- and post-lockdown?
Have the types of vehicles used and their purpose changed?
In this study, the authors focus on the second and fourth questions. Researchers have conducted many studies on the air quality change and traffic mobility of the partial and/or total lockdown imposed to struggle against the COVID-19 pandemic. Different methods are used in current studies. In this section, studies on air quality change and traffic mobility were presented. Finally, the contribution part of this paper to the literature was given.
Çelik and Gül conducted a study to measure air quality during the COVID-19 pandemic. Comparison was made considering seven different emission parameters on post and pre lockdown. While improvements were observed in PM
10, NO
2, NO and NO
x parameters, it was found that there was a partial deterioration in O
2 parameter [
19].
Şahin examined the impact of COVID-19 measures on air pollutants. In March 2020, PM
10, PM
2.
5, NO
2, CO and SO
2 from air pollutants were taken into consideration for the Anatolian and European Side in Istanbul, and there were decreases of 32–43%, 19–47%, 29–44%, 40–58%, 38–69%, respectively [
20].
Wang and Su analyzed the impact of the COVID-19 pandemic on air quality in China. They observed that air quality in China improved, and global carbon emissions decreased. The decrease of NO
2 parameter was seen first in Wuhan, and then in all cities [
21]. Dantas et al. conducted a study on air quality in Brazil. When the partial lockdown period and the same period of the previous year are compared in terms of air quality, the median values of NO
2 and CO are 24.1–32.9% and 37.0–43.6% lower, respectively [
22].
Tian et al. examined the impact of the pandemic in Canadian cities in terms of urban transportation and air pollution. Fuel consumption and CO
2 emission values were taken into consideration. Due to partial lockdown, fuel consumption and estimated CO
2 values declined to very low levels in April 2020. However, it started to rise again in May 2020. Furthermore, while NO
2 and CO parameters are found to be strongly associated with COVID-19, the situation is not the same for the SO
2 parameter [
23].
Parker et al. observed that traffic mobility decreased by up to 50% as a result of the pandemic in the Southern California region. When the 19 March–30 June period of the last five years are compared with the same period in 2020, there are significant decreases in PM
2.
5 and NO
x parameters [
24].
Gualtieri et al. analyzed changes in pollutant and greenhouse gas emissions due to pandemic restrictions. It was found that urban road traffic in Italy has decreased by 48–60%. For comparison, the NO
2, O
3, PM
2.
5 and PM
10 parameters on 24 February 2020–30 April 2020 and 25 February 2019–2 May 2019 were evaluated for six cities. There was an improvement of 59.1% in the NO
2, 17% in the PM
2.
5 and 32.1% in the PM
10. An increase of 14.7% was observed in the O
3 parameter [
25].
Marinello et al. examined the traffic flow and air quality in the case study (Northern Italy). The consideration period is February, May 2019/2020. The results showed that the number of vehicles in traffic decreased by up to 82% in 2020. The decrease of the NO
2 and CO emissions is above 30% and 22%, respectively. On the other hand, an increase of 13% was observed in the O
3 parameter [
26].
Chen et al. examined the effects of travel restriction on air pollution of 49 cities in China. They found that the negative impact of usage private vehicle on air pollution decreased during the pandemic. Significant improvements were observed in the parameters PM
2.
5, PM
10, SO
2, NO
2, CO and O
3 [
27].
Patra et al. studied short-term changes in road traffic patterns in the city of Chennai (India). It has been observed that non-compulsory travel has dropped. However, as the lockdown measures eased, road traffic started to increase. It can be stated that total lockdown is most effective in reducing road travel activity, but a partial lockdown can only provide temporary benefits [
28].
Hicks et al. examined the effects of lockdowns on exhaust gas emissions in London. During the lockdown periods, a 32% decrease in the traffic volume on the Marylebone road and 15% increase in the average speed were observed. Thus, it has been revealed that vehicle emissions have also decreased [
29].
Teufel et al. have developed several simulations to measure the effect of reduction of traffic-related heat emissions on urban temperature characteristics in the COVID-19 period. As it clear from simulation results, it has been revealed that an 80% reduction in traffic density will reduce the temperatures by 1 °C on average in the city of Montreal (Canada) [
30].
Boroujeni et al. conducted a study to examine the public effects of the pandemic. Impacts in terms of mobility, traffic, air pollution, noise pollution and waste generation were studied. It was observed that between January 3 and February 6, mobility in public transport centers decreased by 85%. PM
2.
5 parameter was decreased by 24% in the state of Victoria (Australia) [
31].
Doucette et al. examined daily travel and accident values in Connecticut during COVID-19. After the lockdown, the distance traveled by the vehicles was reduced by 43%. When comparing the pre- and post-stay at home periods, single vehicle crash ratios increased by 2.29 times. In addition, the fatal accident severity in a single vehicle increased by 4.10 times [
32].
Lee et al. examined the changes in traffic in the first three months of 2020 in South Korea during the pandemic process. There was a 9.7% decrease compared to 2019. It was observed that the number of vehicles in traffic increased after the number of cases decreased [
33]. Parr et al. conducting a similar study, observed that the traffic volume decreased to 47.5% compared to 2019 [
34].
During and after the pandemic, several studies have been undertaken to analyze the environmental impacts generated by mobility. One study conducted in China states that correlation analysis between measured data and the ArcGIS system was useful in revealing the relationships between pollutants and seven different sources [
35].
A study in Poland monitored emissions during pandemic phases by defining a heat map, i.e., a graphical illustration of the value of the tested characteristic, depending on its concentration level and size, presented with a selected color palette [
36].
In addition, a study conducted in India in the cities of Kolkata and Howrah Municipal Corporation, West Bengal was designed to assess changes in air quality from the pre-closure period to the closure period. This study focused on the application of GIS-based techniques (spatial and temporal distribution of pollutants) using the interpolation method and statistical methods such as analysis of variance (ANOVA) to understand the changing association of pollutants in the pre- and during-closure phases [
37].
When the aforementioned studies are examined, it is seen that there is an improvement in air quality and a decrease in traffic mobility as a result of partial and/or total lockdown. In most of the current studies, the limited and insufficient data, the simple of the results, the lack of spatial analysis to better understand the results and the lack of recommendations for permanent solutions, are expressed as gaps in the literature. In order to fill this gap, in this study, traffic mobility and air quality change were examined using GIS-based spatial analysis. Permanent solutions are suggested for administrators for these.
The contributions of this study to the literature are as follows:
To make it easier to understand and interpret the comparison of the periods before and after the restriction in terms of air quality and traffic mobility, the relevant data was comprehensively visualized.
Istanbul, a mega city, was chosen as the study area and the whole city was included in the analysis and a huge traffic data was used. Hence, the study area was enlarged and the integrity of the analysis was provided. Thus, robustness was ensured in the change analysis of air pollutants.
Changes in traffic speeds are included in the study to analyze traffic mobility more accurately. The including of traffic speeds in the study provided a unique opportunity for managers to analyze travel delay. By comparing traffic changes in the normal and pandemic situation, the delays can be revealed realistically.
Permanent solutions are required for positive situations such as improving air quality and decreasing traffic mobility. For this purpose, e-mobility service recommendations are given in this paper.
3. Materials and Method
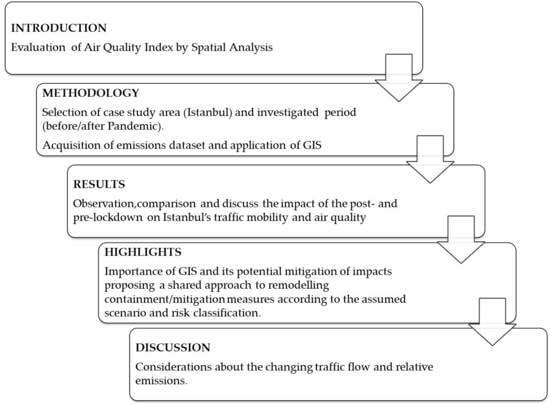
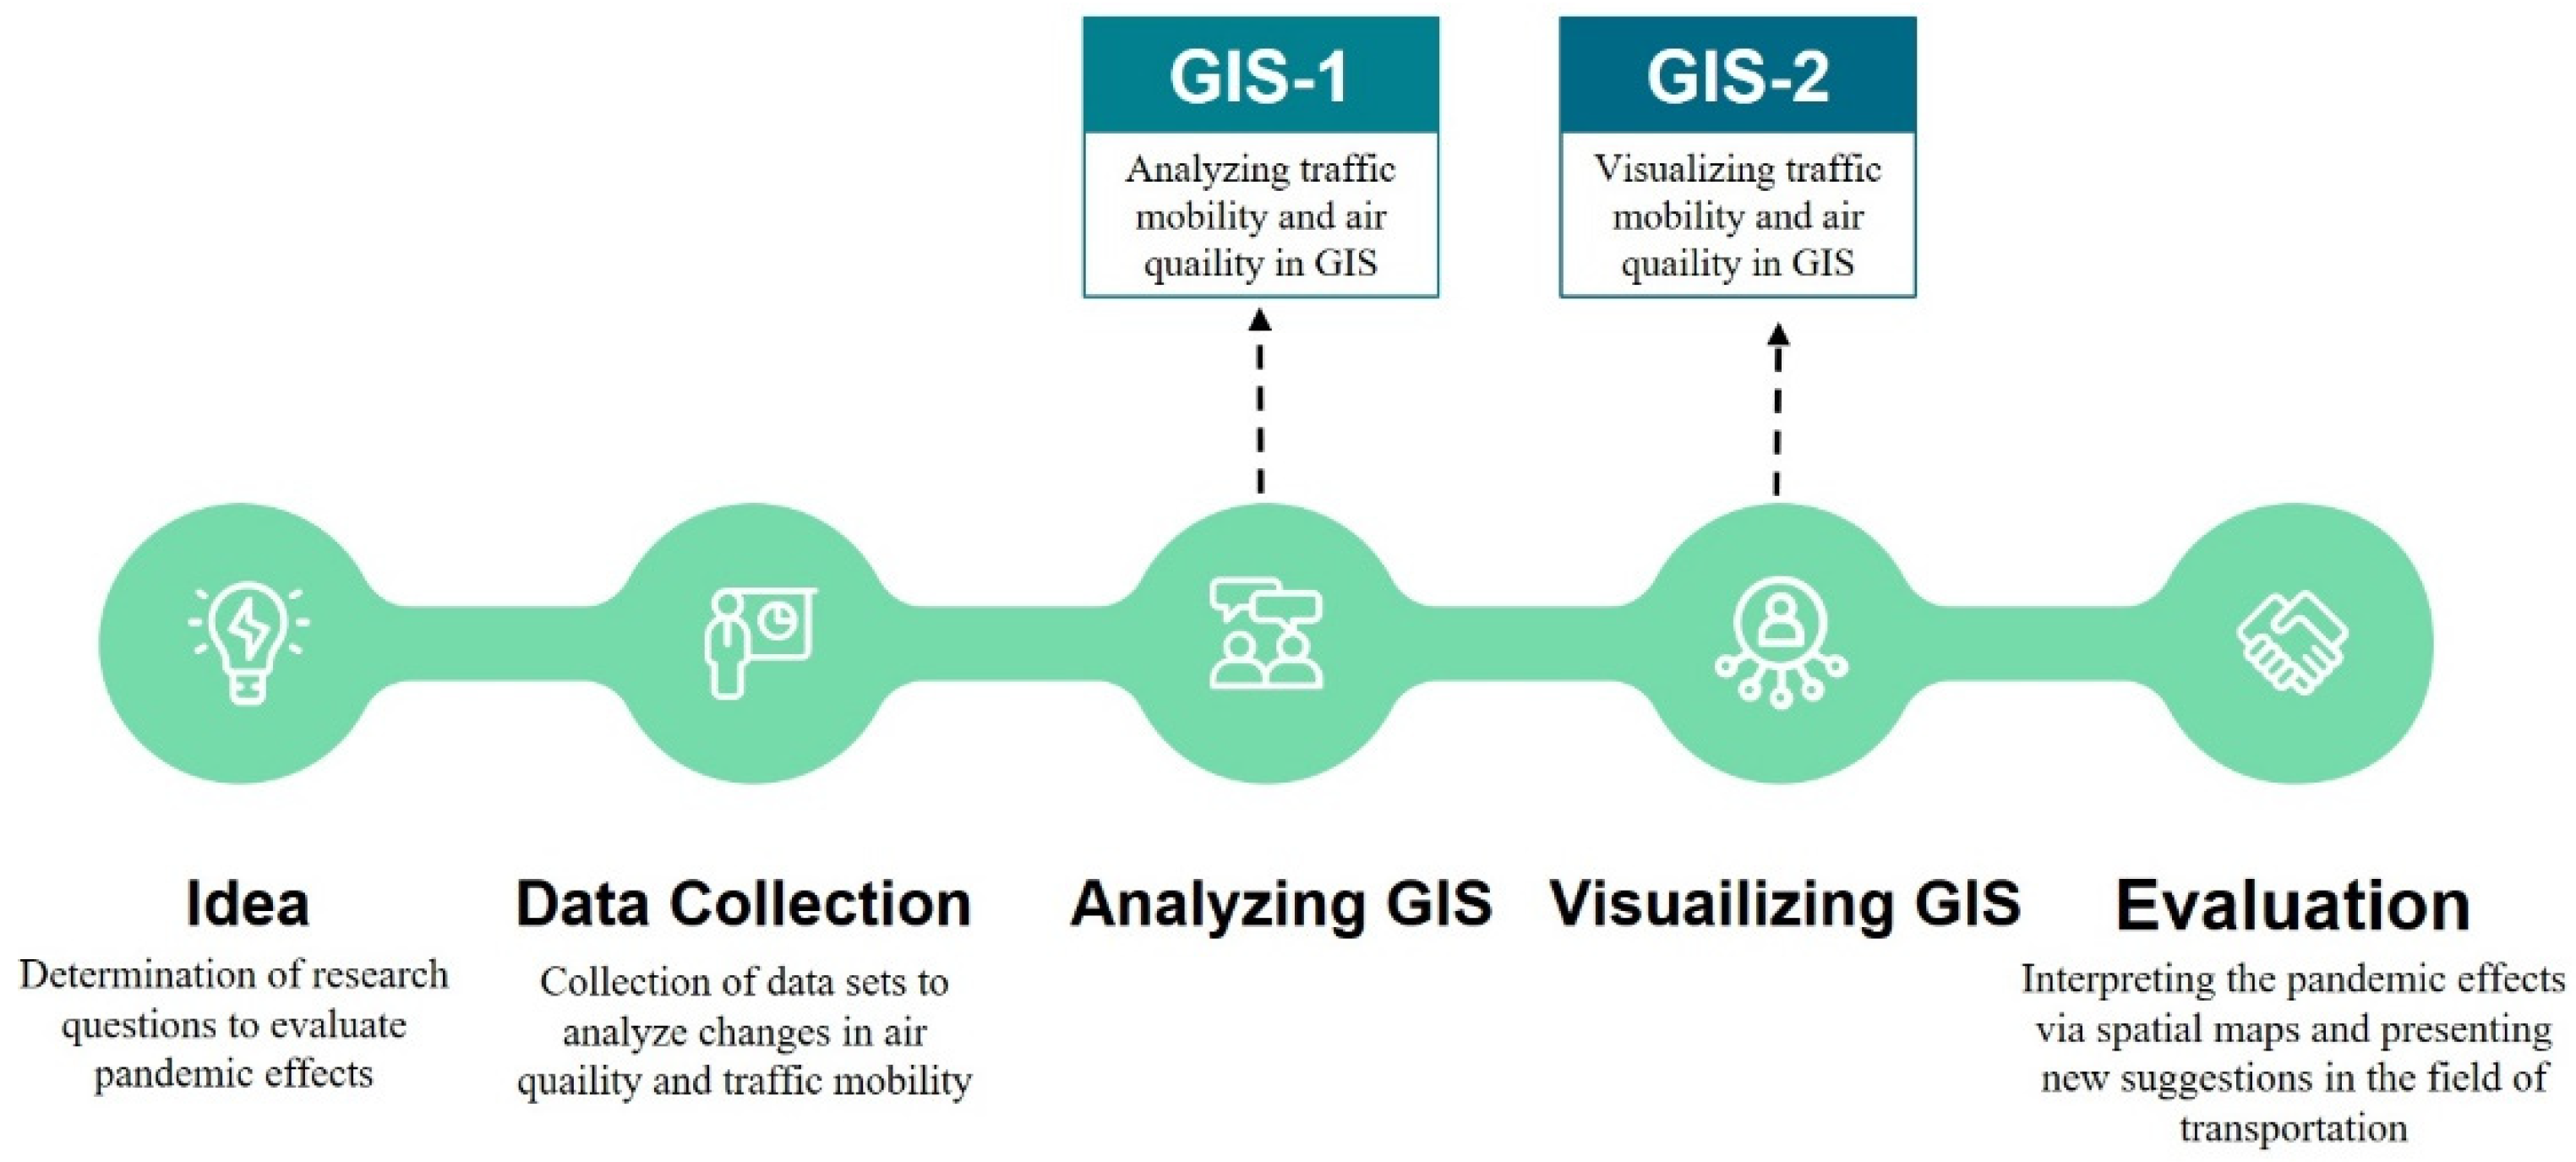
A GIS-based approach was developed to find solutions to the determined research questions. Data were collected to analyze air quality and traffic mobility. Traffic mobility and air quality data were processed in the GIS environment, and changes were analyzed. The study stages are briefly given in the framework given in
Figure 1. First of all, data were collected for the study. The collected data was transferred to the GIS environment. Visualization of the data has been achieved thanks to analyses applied in GIS. After spatial analysis, it is easier to interpret the effects of the pandemic.
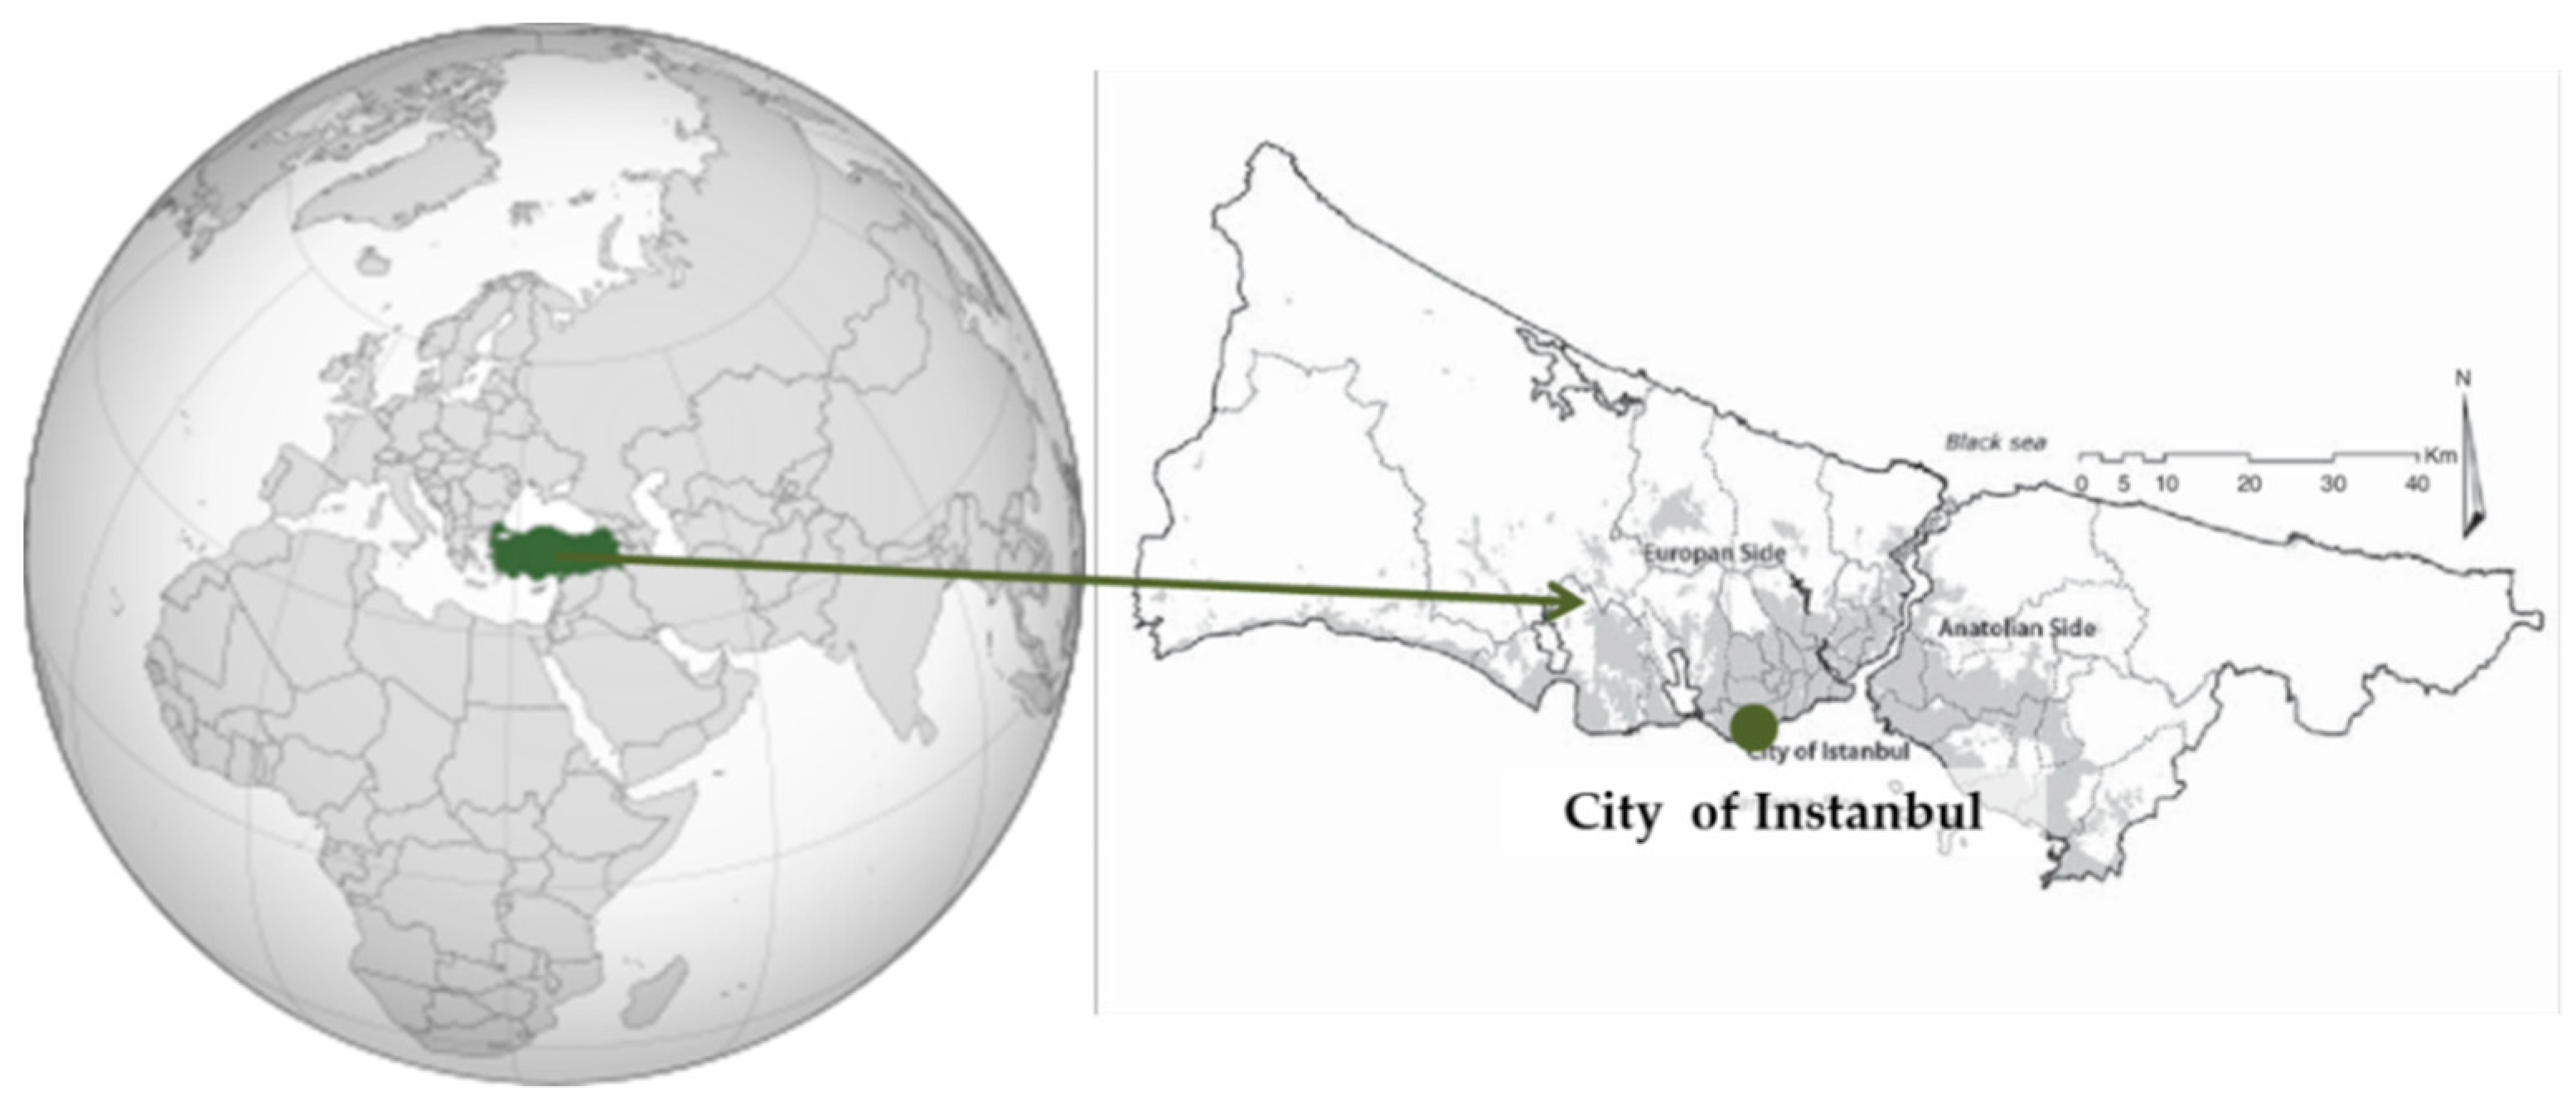
3.1. Study Area
Istanbul, with a population of about 16 million, is the most urbanized city in Turkey [
38]. Naturally, human mobility is quite high, and this mobility is usually provided by road. Percent of 20 the number of motor vehicles in the country are located in this city. Istanbul has a total surface area of 5500 km
2. However, the total surface area of the regions with high activity in Istanbul is 2000 km
2. These areas are southeast of Europe and southwest of Anatolia. The study area is given in
Figure 2.
Traffic parameters in Istanbul are different from many other cities in Turkey. The reason for this is that despite its small surface area, it has a very crowded population (although there are 16 million residents, this number increases significantly in the summer season). To meet the transportation mobility of the crowded population, highway/seaway and airline transports are all used together. For this reason, Istanbul is expressed as a “transportation laboratory”. In addition, 25% of the motor vehicles in Turkey and most other types of vehicles (motorcycles, shared vehicles, electric vehicles, etc.) are located in Istanbul. Micro mobility and innovative vehicle transportation applications are first launched in Istanbul. Since traffic congestion is a big problem in Istanbul, it is seen that innovative micro mobility applications are easily adopted by the public. Another reason for this is that the young population and the number of people in Gen Z is very high. For all these reasons, Istanbul can be shown as the city where the effects of the pandemic are best analysed in the country.
Due to the high number of vehicles and other activities, problems in air quality are observed. Automobile types constitute 69% of the traffic in Istanbul. Trucks have a large share, with 16%. In addition, more than 50% of the vehicles used in Istanbul are diesel vehicles [
39]. In the “Air Pollution in Istanbul” report presented by the Ministry of Foreign Affairs in 2018, the causes of air pollution are shown in the vehicle (traffic) and industry, mining operations, agriculture and household sectors, respectively [
40]; the biggest proof of this situation is that Istanbul ranks first in the country in terms of carbon footprint. Because of all these reasons, it is the city where most of COVID-19 cases seen in Turkey. In fact, the first case and death in the country occurred in this city [
41]. For this reason, the partial and/or total lockdown, which is an important measure in fighting the pandemic, first took place in Istanbul in the second half of March and in April–May (2020). During this period, the authors think that traffic mobility decreased and air quality was improved. Traffic data must be collected instantly to show the changes between post- and pre-lockdown. This data collection process is not available in most cities, as it is costly. However, these data are collected by the Istanbul Metropolitan Municipality (IMM) and shared for academic studies. In addition, there are 36 air quality monitoring stations actively in Istanbul and seven emission parameters are collected at air monitoring stations. Considering all these reasons, Istanbul was chosen as the study area. The first case in Turkey on March 11 and the first death occurred on March 17. The partial and/or total lockdown was implemented throughout the country from the second half of March to June. Within the scope of the study, certain periods were considered to measure the effects of the restrictions/lockdowns. Post- and pre-lockdown were considered equal times for consistency of results. To do so, data in January–February–March–April–May were collected to show the changes in traffic mobility and air quality. Since the normalization process started with June, the other months were not included in the study.
3.2. Collected Data
In order to measure the change in traffic mobility and air quality pre- and post-lockdown, the number of vehicles in traffic, average vehicle speeds and air quality measurement data are needed. For this purpose, traffic density data for five months was provided by IMM. Real-time traffic density data are collected 24 h a day in the city with the help of 1455 sensors. Vehicle data are collected in terms of passenger car unit in terms of the homogeneity of the data. These data consist of the number of vehicles in traffic and the average vehicle speed values.
36 air quality monitoring stations were established in Istanbul by the Ministry of Environment and Urbanization. Measurements are officially made by the Ministry of Environment and Urbanization of the Republic of Turkey At these stations, measurements of emission values such as PM
10, SO
2, CO, NO
2, NO
X, O
3, PM
2.
5 are made instantaneously, and their averages are stored hourly and daily. Due to inconsistencies in O
3 and PM
2.
5 emission values, the parameters were not included in the study. Five months of data were considered for the other five air pollutants. In order for the five air pollutant values to be meaningful and to be used in the study, there should be a difference in the values pre- and post-pandemic. This difference can be revealed by various statistical methods. In this study, this difference was analyzed using the “Paired-Samples T Test”. There is a significant difference between the air pollutant data used pre and post the pandemic. The values of statistical analysis are presented in
Table 1. As a result of the statistical analysis, the
p-alpha value was found to be 0.01. In the literature, this value should be less than 0.05. It states that if the
p-value is less than the value of alpha 0.05, this means has a significant difference and strong correlations [
42].
PM
10 is a complex mixture in a solid or liquid state with a molecule larger than 0.0002 μm and smaller than 500 μm in the atmosphere or a gas mass. Particles below 10 μm are called PM
10 [
19]. SO
2 is a highly harmful gas with one sulfur and two oxygen atoms with a covalent-polar bond between them, colorless and pungent odor [
43]. CO gas is a colorless, tasteless, odorless, flammable and toxic gas. As the rate of CO in the air increases, death can occur in a shorter time. Air basically consists of Nitrogen (78%) and Oxygen (21%) [
44]. The most common nitrogen oxides (generally defined as NO
x) are NO and NO
2. NO
2 generally results from the burning of fossil fuels [
45].
3.3. Geographical Information Systems
GIS is an integrated system where collection, storage, association, query and visualization processes of geographic data are carried out [
46]. GIS was preferred to analyze traffic mobility and changes in air quality. The ArcMap 10.5 program was used in this study. To ensure the consistency of spatial analysis, the data and data sources must be reliable and accurate. The authors were very sensitive in this regard and the data were obtained from official sources. The five-month traffic density data were transferred to the GIS. By transferring the data to the GIS environment, it was possible to visualize the data. The point density analysis type was used for spatial analysis of the number of vehicles and average speed values. Emission values were also transferred to GIS and spatial analysis was performed with Inverse Distance Weighted (IDW) analysis. An interpolation process needs to be applied to air pollutants, vehicle numbers and vehicle speed data. In order to visually present the analysis to the readers, the IDW interpolation method offered by the ArcMap 10.5 program was preferred. When the studies in the literature are examined, it is seen that there are many interpolation methods [
47,
48,
49,
50]. IDW is one of these methods and is frequently used in the literature. In this study, IDW was used to obtain predictive values between stations and to perform analysis. Thanks to the IDW method, which is based on Tobler’s First Law of Geography, values in two distances and two value ranges can be estimated [
51,
52].
Thanks to visualization within the borders of Istanbul, the effects of the pandemic can be better analyzed. To accurate comparisons of these analysis results for five months, the same interval was used in all analyses. The pixel values of the maps obtained are 900 m2 (30 × 30).
GIS is frequently used in the literature to analyze, visualize and interpret the change of emission values and traffic parameters. Having proved its usability in this field, GIS is very useful in terms of understanding the relevant data more easily during the pandemic period. In this context, both researchers and administrators have used GIS-based approaches quite widely.
4. Results
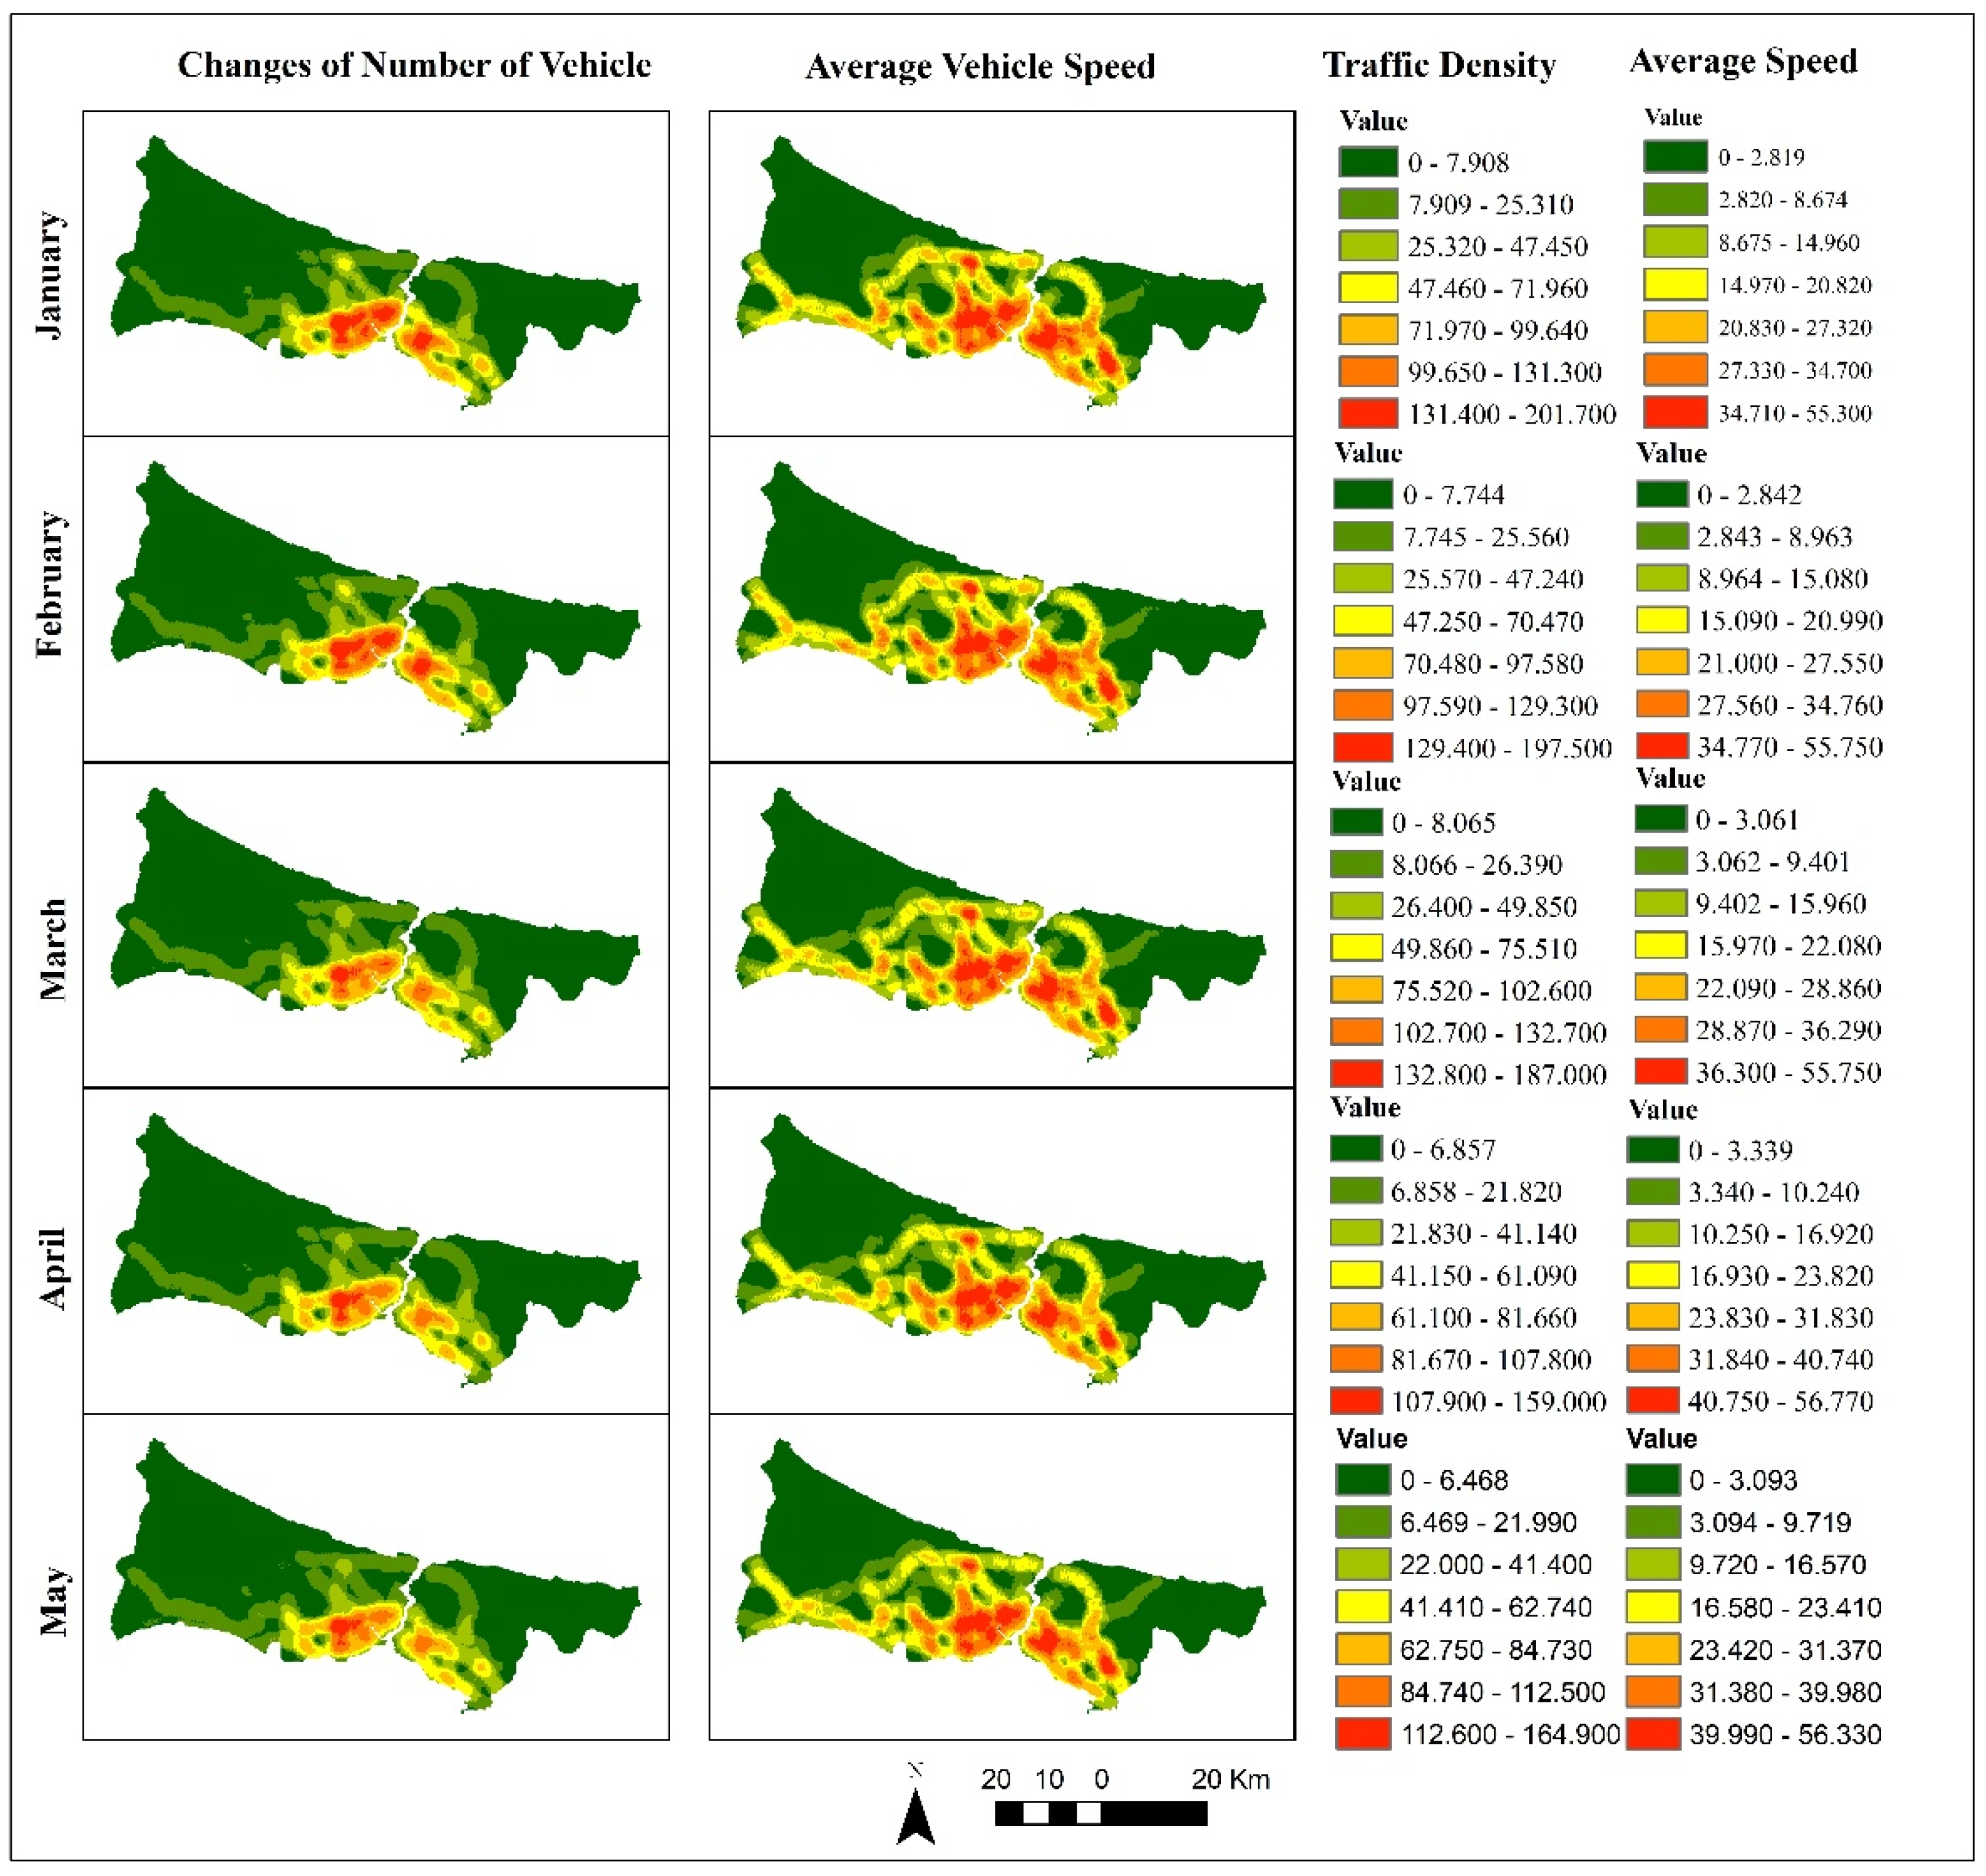
The key part of the study is the correct transfer of data to the GIS environment and the implementation of the necessary analysis. Point density analysis was applied to show the change of traffic density data over the five-month period in the most robust way. Both the number of vehicles and the average vehicle speed data were used for this analysis. The classification intervals must be the same in to provide a clear representation of the change in the five-month period (to not mislead the readers and to transfer correct information to the literature).
The change maps of the number of vehicles and average vehicle speeds are given in
Figure 3. While red indicates congestion in the number of vehicles, green indicates free flow. Red color on average vehicle speed indicates high speed. As is clear from
Figure 3, traffic density measurement sensors are located in road networks with high mobility and dense traffic.
As can be seen from
Figure 3, there are significant changes in both the number of vehicles and the average vehicle speed, especially in January–February–March and April–May.
Partial/total lockdown in April and May significantly reduced the density of vehicle traffic in the city center. In fact, this situation shows us that there will be a significant improvement in traffic density if the use of private vehicles is reduced.
There has been an increase in average vehicle speed due to the improvement in traffic density. Average vehicle speeds by months are 57.50, 55.20, 56.90, 59.00 and 58.56 (km/h), respectively.
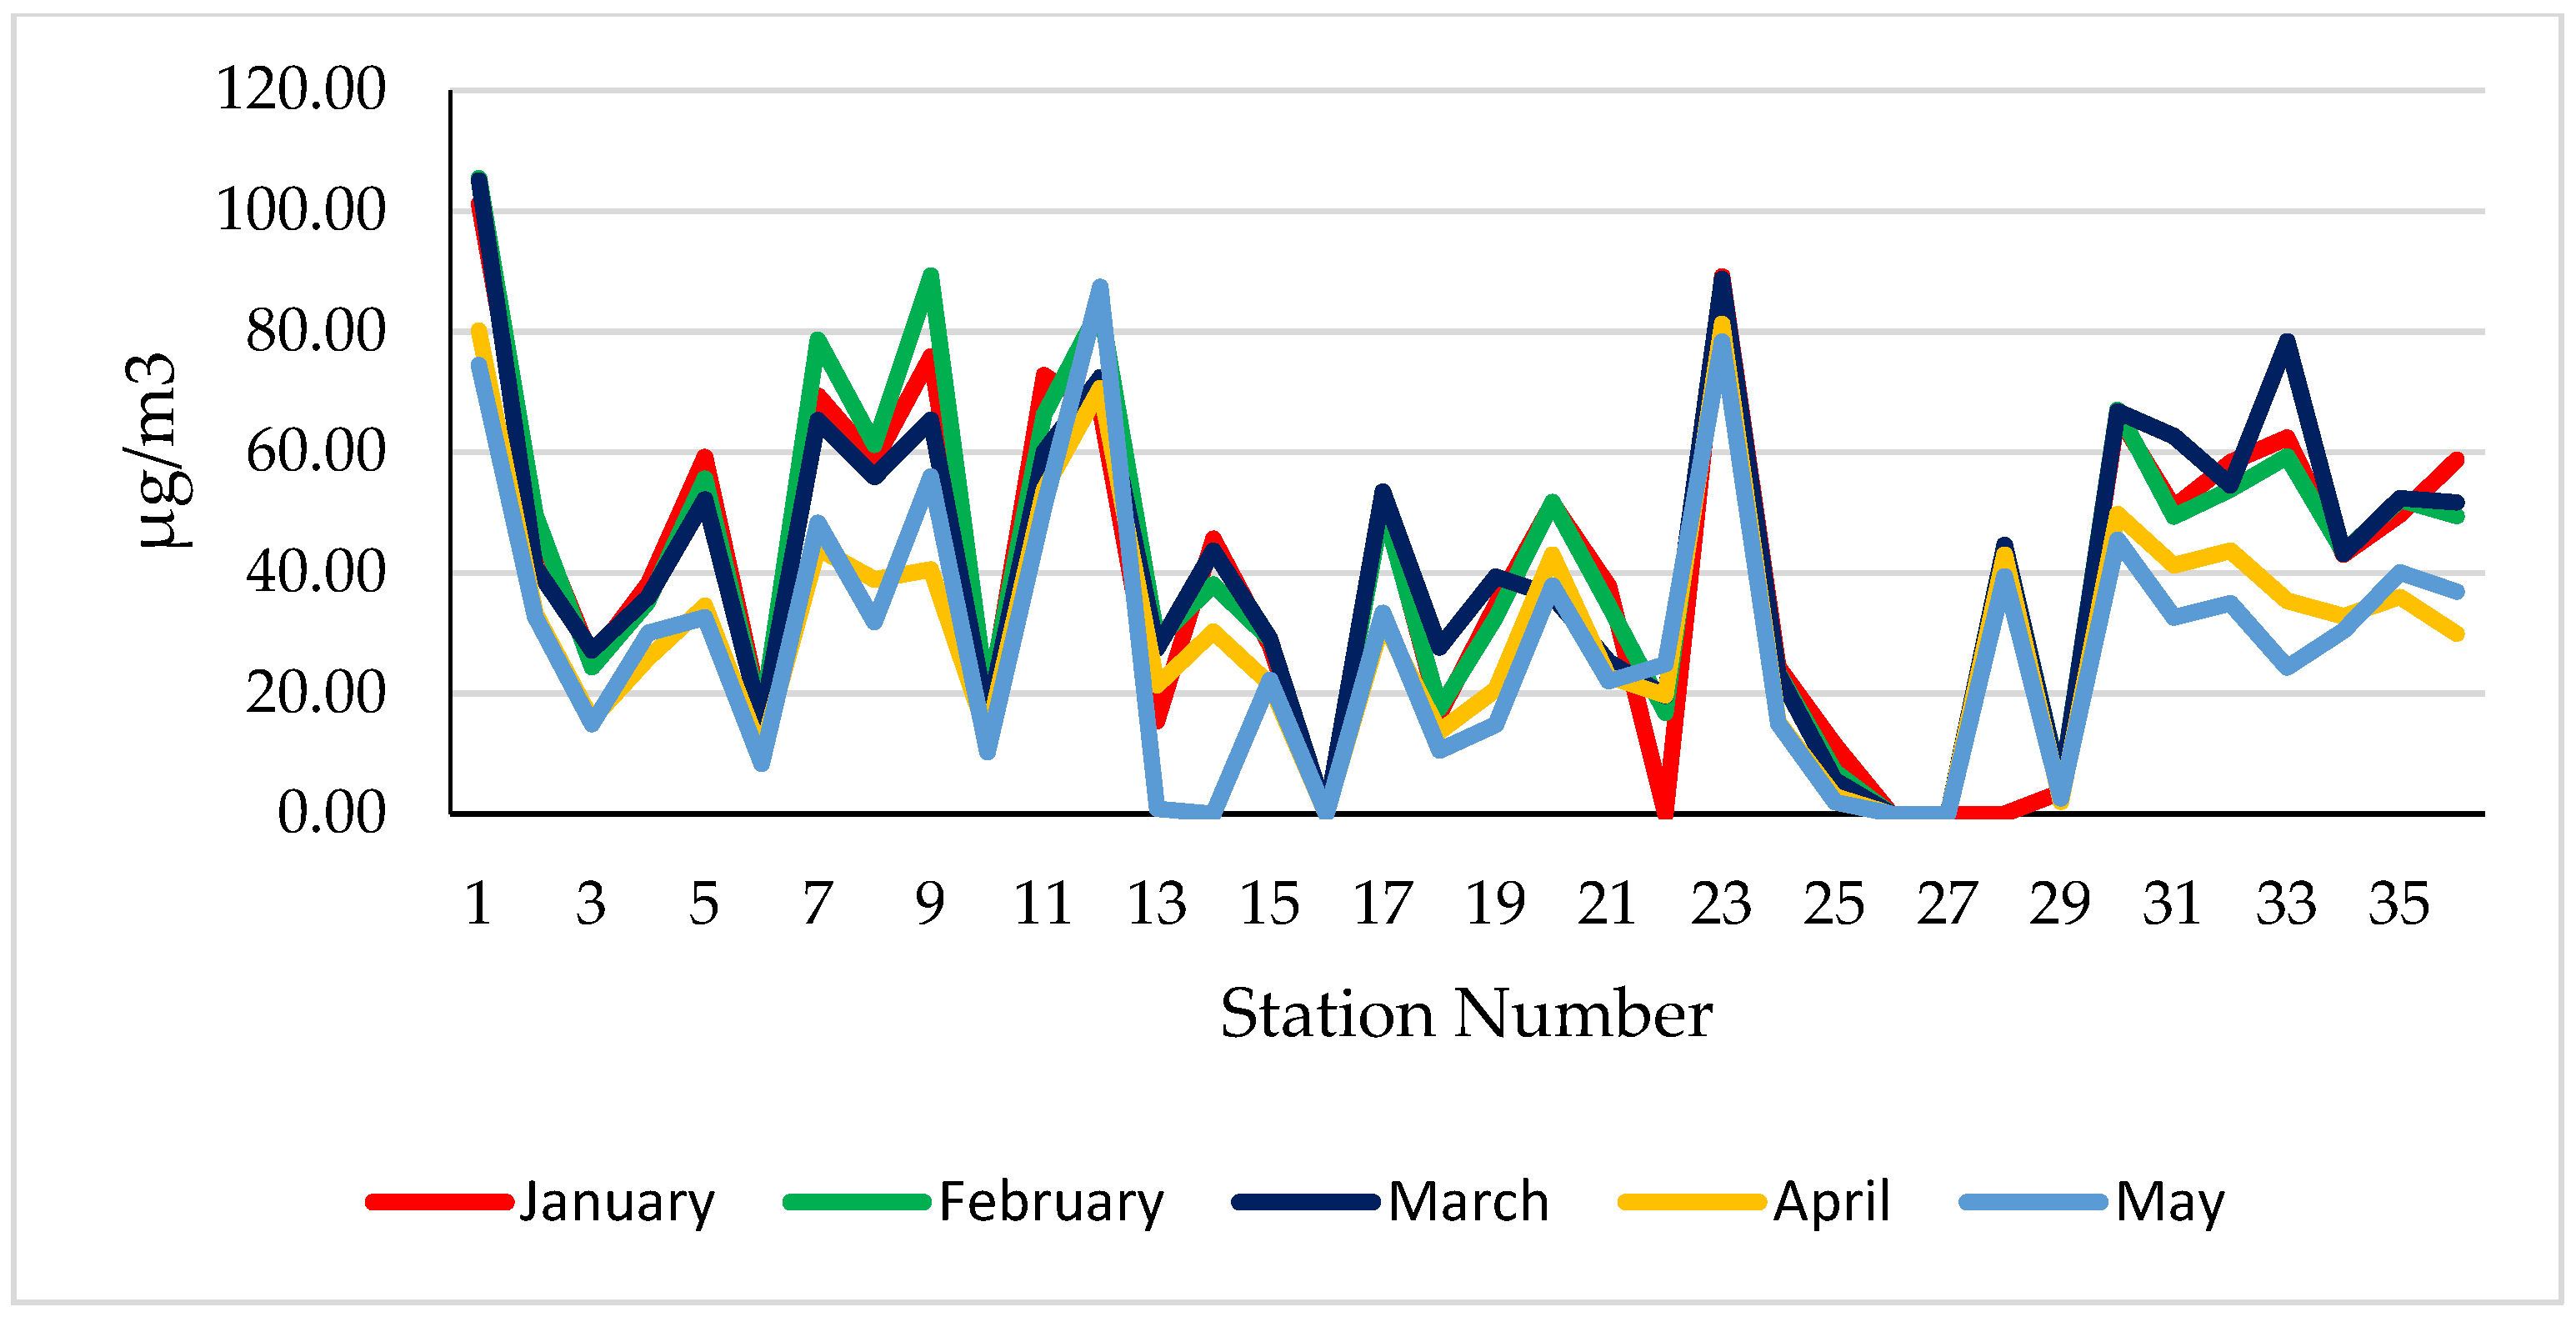
The effect of restrictions on traffic also affects air quality. We used Interpolation (IDW), a type of spatial analysis, to better show this effect. Five-month changes of five air pollutants from 36 air quality stations established in Istanbul were analyzed. An important part of the change in air quality occurs due to transport mobility. In
Figure 4, changes according to months and pollutants are given.
The red color indicates the positive situation and the blue color the negative situation. However, the improvement ratios of air quality parameters are presented
Table 2.
Therefore, the individual concentrations are shown in comparison in
Figure 4 using a better/worse display scale depending on the regulatory threshold values for each individual concentration. One of the biggest reflective pollution parameters of traffic mobility is NO
2. In this context, both temporal and spatial changes of NO
2 parameter are given as examples in
Figure 5.
When
Figure 5 is examined, there is a serious decrease in NO
2 parameter values in May and April. When the maps in
Figure 3 are examined, it is seen that the traffic mobility decreased considerably in April and May. Thus, it can be said that NO
2 air pollutant increases and decreases in relation to traffic mobility.
The main emissions (air pollutants) from traffic are known as NOx, PM and CO. When the parameters are examined, it is seen that PM10 parameter density in city centers decreases. However, the news of partial lockdown in March caused people to migrate to rural areas. Therefore, a serious increase was observed in PM10 in March.
The SO2 parameter has generally remained stable except for February. The main reason for the increase in February is the energy consumed for warming due to the cold air temperature. A significant improvement is observed in the parameters of CO, NO2 and NOx during the partial lockdown period. The decrease in the number of vehicles in traffic can be shown as the main reason for this decrease. These parameters have a significant impact on human health. Emission values occur intensively in urban areas. Different sustainable transportation practices can be developed for urban areas to achieve permanent emission values during the pandemic period. These applications, which are not very suitable for rural areas, will be fully integrated with urban transportation systems.
5. Discussion
Air quality is an important indicator for urban sustainability. On the other hand, poor air quality has a very negative effect on human health and its consequences. The World Health Organization announced that three million people die each year due to air pollution, and billions of people are adversely affected. Recently, significant changes in air quality have been observed due to pandemic. In particular, the restriction measures applied in the fight against pandemic have seriously affected both people and vehicle mobility. This situation has created a positive change in air quality. In other words, the reduction in emission values as a result of reducing the use of private vehicles gives us an important message. As is clear from
Figure 3, a decrease in traffic density and an increase in average traffic speed are observed, especially in April, compared to previous periods. Since the emission values originating from transportation have decreased, the positive change in air quality is clearly seen in
Figure 4. However, positive situations lost its effect with the normalization period, and even got worse. To make the improvements permanent, especially in the areas marked in red, various micro mobility solutions need to be implemented. It may be necessary to prohibit individual motor vehicles from entering areas with poor air quality or central areas, or to introduce paid entry (congestion charge), as has been done in various cities (Singapore, London, Milan, Stockholm). As with the rest of the world, the devastating effects of climate change can now be seen concretely in Turkey. Flood and fire disasters in July and August are the best examples of this situation. While fire disasters were seen in 49 of the 81 provinces, flood disasters were seen in various provinces simultaneously. In a two-month period, approximately 100 people died in these disasters. These events show the dimensions of climate change. The phrase “climate change in our lives” is now more appropriate instead of “climate change is at hand”. Sustainable practices should be implemented in order to permanently ensure positive change in air quality in our living spaces. In this direction, sustainable transportation modes should be quickly integrated into the existing transport system to reduce traffic-related emissions. The most popular sustainable practices in recent years are e-mobility and sharing system. E-mobility applications of transportation systems with electrification are increasing, but currently insufficient. In addition, a demand-responsive transport (DRT) approach should be expanded in urban transportation, considering passenger demands. In this context, the suggestions for sustainable transportation are:
Providing electrification in public transportation vehicles
Promoting electric vehicles instead of conventional motor vehicles (developed countries such as Germany-France-Norway currently provide these incentives)
Developing car sharing services
Reducing the use of private vehicles and encouraging shared mobility
Disseminating the bicycle and e-bike sharing network
Implementation and dissemination of e-scooter services
Promotion of DRT for weak demand areas
With the implementation of such suggestions in urban transportation as soon as possible, positive changes in air quality will be achieved permanently. In addition, a decrease in traffic density will be observed with the dissemination use of sharing transportation modes.
The study has a few limits to be discussed. The fact that the traffic sensors used to measure traffic mobility are only located on the road networks with high mobility and dense traffic, prevents the analysis of the change in other transportation networks. However, most mobility in Istanbul is in 2000 km2 (total surface: 5500 km2). Therefore, most of the sensors are located in these areas. A total of 44 air quality-monitoring stations have been established in Istanbul to measure air quality by the Ministry of Environment and Urbanization. Eight of stations were not included in the study due to the data discontinuity. Since there is no correct data flow for O3 and PM2.5 air pollutants, these parameters were not used in the study.
6. Conclusions
The GIS information system related to the comparison of scenarios and related emissions from vehicle traffic can be the starting point for the definition of a permanent technical table, a meeting point for all the operators in the sector, i.e., local authorities, mobility service providers, researchers, etc.
In this way it is possible to share knowledge and experience and to define timely, effective and efficient actions to combat the phenomenon.
The information system for the evaluation of vehicle flows and environmental emissions ensures. The information system for assessing vehicle flows and environmental emissions ensures easier and more reliable recognition of environmental risk factors and can be associated with other useful information, such as accident risk. In addition, such tools allow an assessment of scenarios in different traffic and disaster contexts (such as the recent pandemic) and enable a definition of solutions to improve the resilience and sustainability of transport in the examined area.
In the absence of pharmaceutical interventions for the COVID-19, governments have taken drastic steps like social distancing, quarantine, limited transport, partial/total lockdown to prevent the spread of the virus.
The rapid change in vehicle flows in Istanbul from January to May 2020 showed a change in vehicle emissions. The number of vehicles and the average speed were the parameters evaluated not in a hotspot way, as it happens in several literature works but on a map through the use of GIS. This made it possible to determine the real structure of vehicular traffic on the road and its influencing factors, thus hypothesizing a possible reduction in emissions.
Starting from the 2020 autumn–winter season, several countries have been facing a slow and progressive worsening of the epidemic. Although the epidemic trend during the summer of 2021 is showing reductions in some parts of the world, it is essential to strengthen monitoring and mitigation activities in light of all possible epidemic scenarios that may arise. This paper lays the groundwork for assessing the environmental effects of reducing vehicle traffic during the 2020 lockdown period in Turkey. After reconstructing the activities carried out since the start of this pandemic event, the document takes stock of several pollutants and the comparison of concentrations during the period examined.
The paper identifies the GIS and potential mitigation of impacts by proposing a shared approach to remodelling containment/mitigation measures according to the assumed scenario and risk classification. The aim of this study is therefore to show the changes on traffic mobility and air quality of the restrictions applied during the pandemic process. To do so, a GIS-based approach was proposed. A five-month period was considered to visualize the change. As can be seen from the spatial analysis results, there are improvements in traffic mobility and air quality in April–May. The parameter values in air quality are divided into two as the averages of January–February–March and April–May. Thus, the change in values pre- and post-restriction can be interpreted more easily. PM10, SO2, CO, NO2, NOx parameter values are improved by 21.21%, 16.55%, 18.82%, 28.62% and 39.99%, respectively. In addition, there was an increase up to 7% in average traffic speed. This positive development in a short period time is very important, and new sustainable transportation practices should be included in the transportation system in order to become permanent.
The results showed that:
Rigorous short-term control measures during the COVID-19 pandemic drastically reduced both traffic flow and emissions. However, as the COVID-19 pandemic situation and the resumption of social and economic activities, traffic flow and emissions will tend to recover.
Regardless of the pandemic phase, the largest circulating vehicle fleet has always been medium and small passenger vehicles.
In the spatial distribution, in Istanbul, the southeast of the European side and the southwest of the Anatolian side has been the biggest contributor to emission intensity due to a large cumulative volume of vehicles.
The likelihood of road congestion has been reduced.
The comprehensive analysis of changing air quality and average speed can help the government assess make corresponding strategy for sustainable transportation in the future with help of this study. The findings of this paper provide some positive improvements information to evaluate in understanding the effects of reduced traffic in urban areas on air quality.


 ,
, 


