Article

Comparative Analysis of Solar Panels with Determination of Local Significance Levels of Criteria Using the MCDM Methods Resistant to the Rank Reversal Phenomenon

by
Aleksandra Bączkiewicz
1,2,
Bartłomiej Kizielewicz
3,
Andrii Shekhovtsov
3,
Mykhailo Yelmikheiev
4,
Volodymyr Kozlov
4 and
Wojciech Sałabun
3,*
1
Institute of Management, University of Szczecin, ul. Cukrowa 8, 71-004 Szczecin, Poland
2
Doctoral School of University of Szczecin, ul. Mickiewicza 16, 70-383 Szczecin, Poland
3
Research Team on Intelligent Decision Support Systems, Department of Artificial Intelligence and Applied Mathematics, Faculty of Computer Science and Information Technology, West Pomeranian University of Technology in Szczecin, ul. Żołnierska 49, 71-210 Szczecin, Poland
4
Machine Learning Group, Department of Artificial Intelligence and Applied Mathematics, Faculty of Computer Science and Information Technology, West Pomeranian University of Technology in Szczecin, ul. Żołnierska 49, 71-210 Szczecin, Poland
*
Author to whom correspondence should be addressed.
Energies 2021, 14(18), 5727; https://doi.org/10.3390/en14185727
Submission received: 12 August 2021 / Revised: 2 September 2021 / Accepted: 8 September 2021 / Published: 11 September 2021
(This article belongs to the Special Issue Power System Simulation, Control and Optimization Ⅱ)

Abstract

:
This paper aims to present an innovative approach based on two newly developed Multi-Criteria Decision-Making (MCDM) methods: COMET combined with TOPSIS and SPOTIS, which could be the basis for a decision support system (DSS) in the problem of selecting solar panels. Solar energy is one of the most promising and environmentally friendly energy sources because of the enormous potential of directly converting available solar radiation everywhere into electricity. Furthermore, ever-lower prices for photovoltaic systems make solar electricity more competitive with power from conventional energy sources, increasing interest in solar panels among companies and households. This fact generates the need for a user-friendly, objective, fully automated DSS to support the multi-criteria selection of solar panels. Both MCDM methods chosen for this purpose are rank-reversal-free and precise. First, the objective entropy weighting method was applied for determining criteria weights. Final rankings were compared by two ranking correlation coefficients: symmetrical r w and asymmetrical W S . Then the sensitivity analysis providing local weights of alternatives for decision criteria was performed. The obtained results prove the adequacy and practical usefulness of the presented approach in solving the problem of solar panels selection.

1. Introduction

The necessity to reduce greenhouse gas emissions requires the development of energy systems with lower emissions than traditional fossil-fuel-based systems [1]. Sustainable energy systems are designed to have zero or low emissions of pollutants, carbon dioxide, and greenhouse gases into the atmosphere. Thus, their use contributes to the sustainable development of countries and regions. Sustainable development can be defined as integrated economic, social, environmental, and technological development with the consumption of natural resources that considers regeneration possibilities. Renewable energy sources include hydro, wind, solar, biomass, geothermal, wave, and tidal. Solar energy is considered a significant sector to support sustainable development due to its high availability, environmental harmlessness, and non-exhaustibility [2].
Photovoltaics are the future of renewable energy technology due to the unlimited availability of solar radiation and the ability of photovoltaic cells to convert it directly into electricity [3]. Solar PV systems produce clean energy that is not harmful to the environment and human health and allows reduction of CO 2 emissions, and its dynamic expansion in recent years in developing countries provides new jobs, contributing to the improvement of welfare. Moreover, renewable energy generation supports countries’ independence from foreign energy imports, is characterized by high social acceptability, and is one of the factors of sustainable development. Photovoltaics acquire energy in a decentralized way, which contributes to building a sustainable energy management system. Solar energy is an effective way to ensure clean energy in industrialized and developing countries without the risk of pollution and volatility of supply. Due to several advantages of PV, policy makers are introducing encouragement programs to increase interest in this technology also within householders [4]. In this way, increasing individual participation in electricity generation from solar energy contributes to the expected decentralization of renewable energy generation [5]. Currently, there are two main generations of photovoltaic panels available in the world market: monocrystalline solar PV panels and polycrystalline PV panels. Monocrystalline solar PV panels have the highest efficiency and longest lifespan. They can be recognized by the presence of a black frame and are usually the most expensive. Polycrystalline PV panels, in comparison with monocrystalline solar PV panels, have a larger size and lower efficiency due to the presence of only one crystal. Their lifespan is usually shorter, and their price is lower. They are characterized by blue color. Photovoltaic systems provide an increase in energy potential by providing maximum efficiency with minimum losses.
Increasing the use of renewable energy sources is becoming a necessity in view of the exhaustion of fossil fuels due to industrial growth. PV can act as an environmentally friendly alternative to the mix of fossil fuels. The main component of a photovoltaic system is the solar panel. Solar panels consist of photovoltaic modules that create the photovoltaic array of the system, which generates and delivers electricity from sunlight. The cost of energy provided by PV systems is currently less than the cost of energy from fossil fuels [6]. Solar panels used alone generate electricity on a smaller scale, such as for individual businesses and homes. Solar panels consist of several individual solar cells composed of layers of silicon, phosphorus to provide a negative charge, and boron to provide a positive charge [2].
The solar panel’s price depends on many factors such as size, brand, durability, and efficiency, for example. The presence of many attributes of solar panels makes their selection for a PV system a complex multi-criteria decision problem [7]. One of the most important decisions in designing a photovoltaic system is selecting the most suitable solar panel. Due to the increasing popularity of photovoltaic technology, more and more producers are offering solar panels with different parameters, which causes difficulties in choosing the most appropriate type. The aim of this paper is to propose a decision support system for the evaluation of solar panels used in photovoltaic installations.
The problem of renewable energy sources requires consideration of many different criteria that are often conflicting, uncertain data, and possible inaccuracies [8]. MCDM methods provide an opportunity to take into account the multidimensional nature of the considered problem. It enables comparative analysis of the evaluated alternatives according to the regarded quantitative and qualitative criteria. The MCDM approach supports rational decision making that takes into account the priorities of the decision-maker, which results in an optimal solution that combines all objectives of the decision-maker [9]. MCDM increases the compatibility of the decision-making process with the decision-maker’s goals [10]. MCDM methods are suitable for evaluating available alternatives considering multiple attributes, prioritizing them, and selecting the most favorable one [11,12]. The goal of using MCDM methods is to correctly determine the values of the preference functions for the alternatives under consideration and to rank them appropriately [13,14]. One of the challenges that occur in the field of decision problems solved with MCDM is a phenomenon known as the rank reversal paradox. This problem involves the appearance of changes in ranking when alternatives are added or removed from their set under consideration. In this situation, the order of priority for alternatives changes, which is incompatible with the concept of independence from alternatives. In order to eliminate this negative phenomenon, MCDM methods that are completely rank-reversal-free have been proposed in recent years, among which Characteristic Objects Method (COMET) [15], Stable Preference Ordering Towards Ideal Solution (SPOTIS) [16], and Ranking of Alternatives through Functional mapping of criterion sub-intervals into a Single Interval (RAFSI) [17] can be mentioned. A method that is not susceptible to rank reversal is also the Sequential Interactive Model of Urban Systems (SIMUS) [18], R-TOPSIS [19,20], and R-VIKOR [21].
The purpose of this article is to present an innovative approach based on two newly developed MCDM methods, COMET combined with TOPSIS and SPOTIS, which could be applied in decision support systems to evaluate solar panels for photovoltaic systems. Criteria weights were determined using the objective entropy weighting method. The similarity of the obtained rankings was compared using two ranking correlation coefficients, symmetrical r w and asymmetrical W S . A sensitivity analysis of the weights for COMET and SPOTIS was also performed to determine local weights for each alternative to investigate the dependence of the rankings on local criterion weights. The results indicate the high suitability of the methods considered in the study in DSSs to evaluate solar panels. Furthermore, both methods show adequacy for the considered problem. Furthermore, a strong influence of global and local criteria weights on the final preference value for both MCDM methods is visible.
The rest of the paper is organized as follows. Section 2 presents a literature review accounting for the recent application of MCDM methods to renewable energy problems focusing on solar energy. In Section 3.1 the background, assumptions, and steps of the methods and techniques used in this article are explained, while in Section 3.2, an illustrative case study for demonstrating the performance of the MCDM approach is presented.
Section 4 provides results, including comparative analysis of both rankings and sensitivity analysis of criteria weights. In Section 5, the proposed approach and obtained results are discussed. Finally, in Section 6, the summary and conclusions are presented and further work directions are drawn.

2. Literature Review

The effectiveness and usefulness of MCDM methods have been demonstrated through a comprehensive presentation of its applications to solve decision-making problems related to renewable solar energy. MCDM methods are used for solar farm site selection. The article [22] presents the use of Fuzzy AHP and Fuzzy ANP to select the most advantageous solar farm location in Iran. AHP, ELECTRE, TOPSIS, and VIKOR methods were used for comparative analysis in the solar farm site selection problem in Turkey [23]. To find the best location for a solar farm in Vietnam, FAHP was used to determine the criteria weights and TOPSIS to rank the alternatives considered [24]. Multi-criteria performance analysis of photovoltaic systems for India was performed using AHP [5]. The AHP method has also been applied to the site selection of the solar farm in Northern Ireland [25] and to select a site for a photovoltaic solar power plant in Northern Chile [26]. In another work, an integrated approach combining AHP with TOPSIS was used to solve the same problem in India [27]. AHP was used for the decision problem involving the selection of a photovoltaic system in a Caribbean Country [28]. The COMET method is also applied in solving decision problems related to renewable energy sources. The use of this method in selecting offshore wind farm locations is presented in the paper [29] and in [8], where a comparative analysis of the COMET method with TOPSIS and VIKOR is provided. The COMET method was also applied to the multi-criteria problem of selecting a hydropower plant infrastructure system [30]. In the problems of renewable energy sources, such as site selection for a wind farm, the PROMETHEE method was also applied, whose results were compared with AHP [31] and PROSA, which, similarly to PROMETHEE, is based on outranking relations and has similar mathematical foundations [32]. The solution to the multi-criteria problem of identifying the most advantageous locations for wind farm installation for the province of Vojvodina in Serbia, using a model incorporating Decision Making Trial and Evaluation Laboratory (DEMATEL), Analytic Network Process (ANP), and Multi-Attributive Border Approximation area Comparison (MABAC) is presented in [33]. The DEMATEL-ANP method was used to determine the weights, and MABAC was applied to rank the alternatives by preference. Another model for selecting wind farm sites is based on the Best-Worst Method (BWM) to determine the weights of criteria and the Multi Attributive Ideal–Real Comparative Analysis (MAIRCA) method to determine the order of available sites according to preferences [34]. To assess regions’ energy consumption and potential to implement sustainable energy policies with renewable energy sources in regions in Iran’s Caspian Sea coastline, a model combining Level-Based Weight Assessment (LBWA) for weighting and Weighted Aggregated Sum Product Assessment (WASPAS) was used [35].
The above literature review confirms the usefulness of MCDM methods in both the RES problem and the solar energy problem addressed in this paper and justifies the choice of this approach for solving the multi-criteria decision problem of solar panel selection. However, using methods based on fuzzy numbers is advisable due to the risk of uncertainty and imprecision in the RES problem. An example is the use of the COPRAS-Z method for renewable energy selection [36], Fuzzy TOPSIS and Fuzzy VIKOR [37], and Fuzzy AHP [22,24] used in decision problems considering RES. Therefore, COMET, founded on fuzzy set theory, was chosen as the first method used as a DSS engine for selecting solar panels. The COMET method is an efficient approach that is completely rank-reversal-free because it is based on pairwise comparisons of characteristic objects that are not dependent on the alternatives under consideration. An additional advantage resulting from this is that the algorithm’s complexity is independent of the number of alternatives being evaluated [15,29,38,39,40]. However, when the decision problem considers multiple criteria with more than two characteristic values, the number of COs pairwise comparisons increases exponentially. Most decision-making problems related to renewable energy sources require considering multiple criteria, so it was decided that it is appropriate to use a modification of the COMET method consisting of replacing the COs pairwise comparison step by an expert with automatic and objective evaluation using the TOPSIS method. In this modification, the S J vector is not created from the M E J matrix but is returned by the TOPSIS method integrated with the COMET method. The described approach was successfully applied, where the laborious step of pairwise comparison of COs by an expert was replaced using TOPSIS and PROMETHEE II, and the two strategies were then compared [41]. In many papers focused on RES issues mentioned in the literature review, the authors were not limited to one MCDM method, but a comparative analysis with other methods was performed. Comparison of results is essential because various MCDM methods may provide divergent results for the same decision problem. This happens because various methods use different algorithms [42]. The authors of this paper chose the SPOTIS method to perform a comparative analysis. This method has a simple algorithm and, like many other MCDM methods, requires a decision matrix with alternatives in rows and criteria in columns, a vector of weights for the criteria and information on whether they are profit or cost. The main assumptions of this method include the need to determine the absolute bounds of the values of each criterion in order to define the decision problem correctly. In this way, all values for each criterion are within the range defined by the set bounds. The SPOTIS method is based on calculating the normalized distance of each alternative with respect to the ideal solution point [16]. SPOTIS, similar to COMET, uses reference objects in the process of determining preferences of alternatives [43]. SPOTIS is thus a distance-based method, like COMET, in which preference values for alternatives are derived from the distance to the nearest characteristic objects and their values [40]. Besides being rank-reversal-free, this is another feature that SPOTIS has in common with COMET, which justifies the suitability of the SPOTIS method to perform a comparative analysis with the hybrid approach, which is COMET joined with TOPSIS. A commonly used approach for determining criteria weights for MCDM methods in decision problems involving RES is applying objective weighting methods. Entropy objective weighting is based on Shannon entropy, which measures information uncertainty in the context of probability. Entropy provides intrinsic information about the relative intensity of the criteria. Its use for determining criteria weights is found in many works that are focused on RES problems [36,44,45,46,47,48,49,50]. The widespread use of entropy weighting became the motivation for applying this method to determine the vector of criteria weights in this study.

3. Materials and Methods

The approach based on COMET and SPOTIS methods, which is considered to be applied in a decision support system for selecting solar panels for PV systems, is presented as an illustrative example of a multi-criteria problem for selecting solar panels from among thirty available alternatives, considering six selection criteria.

3.1. Preliminaries

This section provides basic notions, concepts, fundamental assumptions and stages of MCDM methods and other techniques applied in this paper.

3.1.1. The COMET Method

The COMET is an innovative approach that solves decision-making problems by identifying with the participation of an expert decision-making model including many criteria [51]. The significant advantage of the newly developed method described here involves its complete robustness to the rank reversal paradox [15,41,43]. A description of the five stages of this method is presented below, based on [40]:
Step 1. Definition of the problem dimension with the expert involves choosing criteria number r: C 1 , C 2 , . . . , C r . Further, the collection of fuzzy numbers for every criterion C i considered is chosen, i.e., C ˜ i 1 , C ˜ i 2 , . . . , C ˜ i c i . Every fuzzy number establishes the value representing the membership for a given linguistic concept for concrete crisp values [52,53]. Accordingly, it is even suitable for non-continuous variables. Thus, the following result is received (1):
C 1 = C ˜ 11 , C ˜ 12 , . . . , C ˜ 1 c 1 C 2 = C ˜ 21 , C ˜ 22 , . . . , C ˜ 2 c 2 . . . C r = C ˜ r 1 , C ˜ r 2 , . . . , C ˜ r c r
where C 1 , C 2 , . . . , C r are ordinates with fuzzy numbers for considered criteria.
Step 2. Generating characteristic objects that represent reference points in n-dimensional space. These objects can exist in reality, or they may be ideal and do not exist in the real world [54]. The characteristic objects ( C O s ) are received with the Cartesian product of fuzzy numbers cores produced for every criterion [55]. It results in obtaining the ordered set of all C O s (2): required here.
C O 1 = C ( C ˜ 11 ) , C ( C ˜ 21 ) , . . . , C ( C ˜ r 1 ) C O 2 = C ( C ˜ 11 ) , C ( C ˜ 21 ) , . . . , C ( C ˜ r 2 ) . . . C O t = C ( C ˜ 1 c 1 ) , C ( C ˜ 2 c 2 ) , . . . , C ( C ˜ r c r )
where t expresses the number of C O s (3):
t = i = 1 r c i
Step 3. This step aims to determine the Matrix of Expert Judgement ( M E J ) involving the expert. This procedure is performed by comparing pairwise the characteristic objects. The result of this step is entirely dependent on the opinion of the expert [56]. The M E J structure is displayed in Equation (4):
M E J = α 11 α 12 . . . α 1 t α 21 α 22 . . . α 2 t . . . . . . . . . . . . α t 1 α t 2 . . . α t t
where α i j is the effect of comparing C O i and C O j . The preferable C O receives a score equal to 1, and the less preferred object receives a score equal to 0. If there is no difference between compared objects, both of them obtain a score equal to 0.5 [57]. This process is totally dependent on the expert’s statement and is shown by Equation (5):
α i j = 0.0 , f e x p ( C O i ) < f e x p ( C O j ) 0.5 , f e x p ( C O i ) = f e x p ( C O j ) 1.0 , f e x p ( C O i ) > f e x p ( C O j )
where f e x p means an expert mental judgement function. In this study, however, the TOPSIS method was used instead of an expert function. This approach is presented in [41].
Subsequently, the vertical vector containing the Summed Judgements ( S J ) is received according to Equation (6):
S J i = j = 1 t α i j
The number of required comparisons is expressed by p = t ( t 1 ) 2 . It is due to the fact that for every considered element, α i j α j i = 1 α i j can be observed. The vector named P is generated as an outcome, where i-th row includes the estimated value of preference identified for C O i .
In this paper, the expert’s evaluation of characteristic objects by pairwise comparison is replaced by evaluating a matrix containing the set of possible COs by the TOPSIS method. The vector of preference values returned by the TOPSIS method acts as a vertical vector S J . Based on S J , a vector P is constructed in a further step according to the classical principles of the COMET method. The subsequent stages are no longer different from the classical version of COMET.
Step 4. Every characteristic object is transformed into a fuzzy rule, in which the grade of membership to specific criteria is a reason for activating inference in P i as presented with details in (7). In such a manner, the whole fuzzy rule base is achieved, which estimates the mental judgment function of the expert and is represented by f e x p ( C O i ) [58].
IF C C ˜ 1 i AND C C ˜ 2 i AND THEN P i
Step 5. Every considered alternative A i represents a collection of crisp numbers a r i related to criteria C 1 , C 2 , . . . , C r . It can be demonstrated as follows (8):
A i = { a 1 i , a 2 i , , a r i }

3.1.2. The TOPSIS Method

TOPSIS (Technique of Order Preference Similarity) is a popular and widely used MCDM method for decision problems in many fields due to its uncomplicated algorithm and ease of use. The algorithm of this method is based on determining the distance from reference points to the considered alternatives that are represented by positive and negative ideal solutions [59]. Therefore, the best alternative is the option that is closest to the Positive Ideal Solution (PIS) and is the furthest away from the Negative Ideal Solution (NIS) [60].
Step 1. This step involves determining the normalized decision matrix. In minimum–maximum method normalization, which authors of this paper used, the normalized values of r i j are calculated for the profit criteria applying equation (9), while for the cost criteria, Equation (10) is applied.
r i j = x i j m i n j ( x i j ) m a x j ( x i j ) m i n j ( x i j )
r i j = m a x j ( x i j ) x i j m a x j ( x i j ) m i n j ( x i j )
Step 2. The weighted values contained in the normalized decision matrix v i j are calculated using Equation (11).
v i j = w i r i j
Step 3. This step aims to calculate the values in vectors named positive ideal solution (PIS) values and negative ideal solution (NIS). The PIS (12) represents the maximum values determined for every criterion considered in the problem, and the NIS (13) represents minimum values. There is no necessity to split the criteria into cost and profit types here since the cost criteria were converted to profit criteria in the step, including the normalization procedure.
v j + = { v 1 + , v 2 + , , v n + } = { m a x j ( v i j ) }
v j = { v 1 , v 2 , , v n } = { m i n j ( v i j ) }
Step 4. Distance from PIS is calculated as Equation (14) shows and from NIS, according to Equation (15) for every alternative taken into account [42].
D i + = j = 1 n ( v i j v j + ) 2
D i = j = 1 n ( v i j v j ) 2
Step 5. The result for every alternative is computed as given in Equation (16). The values of this result, named preference values, are between 0 and 1. Thus, the best alternative has a preference value closest to 1.
C i = D i D i + D i +

3.1.3. The SPOTIS Method

Stable Preference Ordering Towards Ideal Solution, for which the acronym is SPOTIS, is a newly developed method dedicated to multi-criteria decision making [16]. The authors’ main objective of the technique described was to introduce a new method that is rank-reversal-free (free of the phenomenon of reversing the ranking when changing the number of alternatives in the provided data). The detailed method applies the idea of reference objects and is based on distance measurement. In contrast to other MCDM techniques, for instance, TOPSIS and VIKOR, where reference objects are created from a decision matrix, the SPOTIS method needs the specification of data boundaries. Application of data borders to determine the Ideal Solution Point for a linear distribution of variants between ISP prevents ranking reversals.
To apply this method, a definition of data boundaries is required. For every criterion C j , the maximum S j m a x and minimum S j m i n borders are chosen. The Ideal Positive Solution S j * is represented by S j * = S j m a x for benefit criteria and by S j * = S j m i n for cost criteria. The decision matrix is expressed by X = ( x i j ) m × n , where x i j represents the value of the attribute of the i-th variant for j-th criterion.
Step 1. The first stage of SPOTIS involves the determination of the normalized distances calculated for Ideal Positive Solution (17).
d i j ( A i , S j * ) = | S i j S j * | | S j m a x S j m i n |
Step 2. The second step of the SPOTIS procedure includes computation of weighted normalized distances d ( A i , S * ) [ 0 , 1 ] in accordance with (18).
d ( A i , S * ) = j = 1 N w j d i j ( A i , S j * )
Completed ranking is established on the basis of d ( A i , S * ) values. More preferred alternatives have lower values of d ( A i , S * ) .
The technique demonstrated here can be described by an alternative algorithm, which is presented in reference [16]. The authors of this paper described and applied this version since it is clear and understandable and since both versions provide the same results.

3.1.4. Entropy Weighting Method

In this weighting technique, the weights of the criteria are calculated by applying the measure of uncertainty included in a given piece of information [61].
Step 1. The procedure of normalization of input data is realized with the sum normalization method (19).
p i j = x i j i = 1 m x i j i = 1 , , m ; j = 1 , , n
Step 2. The purpose of this step is to calculate the entropy value of jth criterion as Equation (20) presents.
E j = i = 1 m p i j l n ( p i j ) l n ( m ) j = 1 , , n
Step 3. The last stage aims to compute the objective weight for jth by Equation (21).
w j = 1 E j i = 1 n ( 1 E j ) j = 1 , , n

3.1.5. Weighted Spearman’s Rank Correlation Coefficient

The calculation of the weighted Spearman correlation coefficient r w is performed as shown in Equation (22), where N is ranking size and x i , and y i are the values in the compared rankings.
r w = 1 6 i = 1 N ( x i y i ) 2 ( ( N x i + 1 ) + ( N y i + 1 ) ) N 4 + N 3 N 2 N
For this coefficient, the top-ranked items are more significant. The importance weight is calculated for each comparison [42,57,62].

3.1.6. Rank Similarity Coefficient

The W S similarity coefficient of the ranking is calculated by Equation (23). N is ranking size, and x i and y i represent values in the compared rankings.
W S = 1 i = 1 N 2 x i | x i y i | m a x ( | x i 1 | , | x i N | )
It is an asymmetrical coefficient that is sensitive to significant changes in ranking. The value of this coefficient is closely related to the part of the rankings where differences occur. Thus, the differences appearing at the top of the rankings are more significant than those found at the bottom [42,57,62,63].

3.2. An Illustrative Case Study of a Multi-Criteria Solar Panel Selection Problem

Table 1 provides data for the six selected evaluation criteria after conversion to the units in the form of a decision matrix.
Data on the selected alternatives used in this study, including the values of their evaluation criteria, which are displayed in Table 2, were obtained from various websites. Evaluation criteria are listed in Table 3. Three criteria are profit types ( C 2 , C 3 , C 4 ), and their direction is maximization, while the other three criteria are cost types ( C 1 , C 5 , C 6 ), and their direction is minimization. The weights, reflecting the significance of the criteria in the decision-making process, were determined with the objective entropy weighting technique. As can be observed, noticeably, the highest weight value was assigned to cost criterion C 5 , which is the cost per m 2 . The second most important decision criterion is C 1 , the open circuit voltage, which is similar to C 5 cost type. The least important criteria are C 2 , profit type, and C 6 , cost type.

4. Results

Preference function values and rankings of the evaluated alternatives obtained using COMET and SPOTIS are contained in Table 4.
From the results obtained, differences can be observed between the rankings obtained using the two methods. The COMET method identified alternative A 4 (Trina TSM-DD06M.05-330BK) as the ranking leader. This alternative has an attractive low value for cost criterion C 5 , which is the cost per m 2 . Only alternative A 24 (Canadian Solar CS3U-355P-35MM), which was indicated as the ranking leader of the SPOTIS method, has a lower value for this criterion. A 4 came second in the SPOTIS ranking, and A 24 was fourth in the COMET ranking. For A 4 , although its value of cost criterion C 5 with the highest weight was not the lowest, it took first place in the COMET ranking because the other criteria were also taken into account, which, despite their lower weight, also influence the final results. Furthermore, A 4 has an attractive low value of the second most important cost criterion C 1 , whose value for A 24 is higher. Alternative A 2 (Peimar SG315M) was ranked second by COMET and third by SPOTIS. This option has attractive, low values for relevant cost criteria C 5 and C 1 compared to most other variants considered. A 2 was ranked third in the SPOTIS ranking. Third place in the COMET ranking was taken by A 7 (Peimar SM325M), which was sixth in the SPOTIS ranking. In the form of a difference of six ranks, the most significant discrepancy in outcomes was noted for the A 3 alternative (Phono Solar PS315M-20/U), which ranked ninth in the COMET ranking and fifteenth in the SPOTIS ranking.
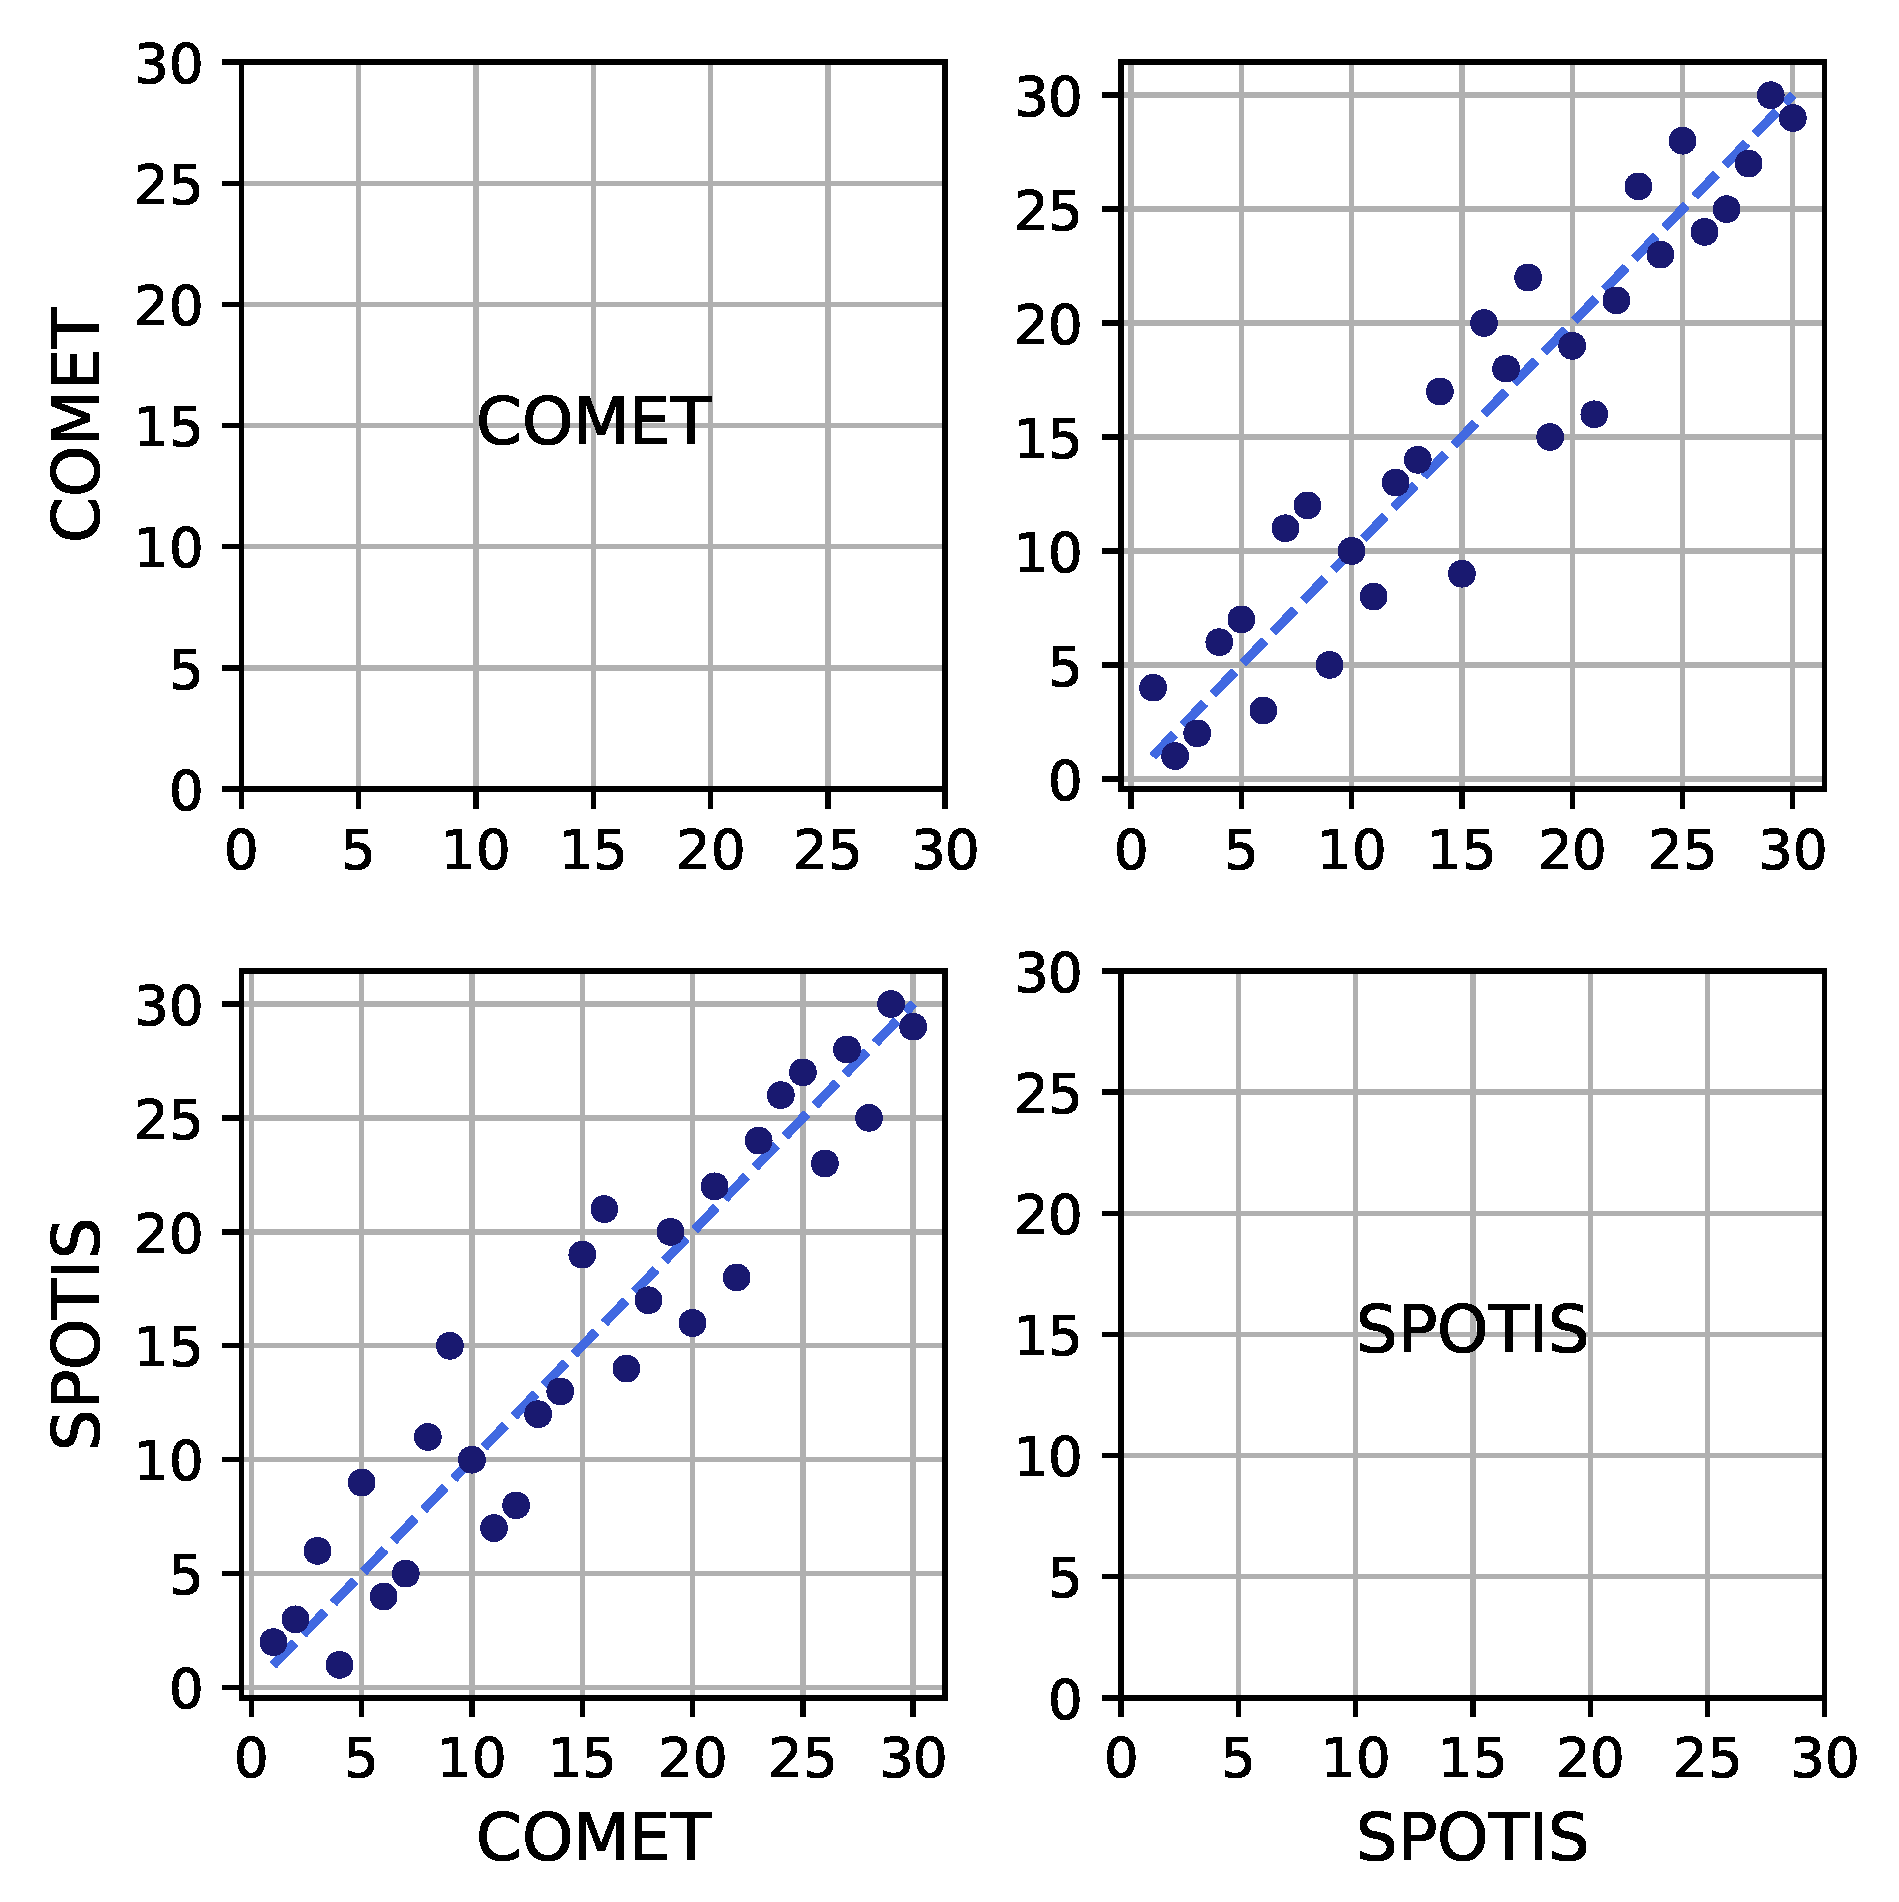
Despite the observed differences in the rankings provided by the two methods investigated, the convergence of the two received rankings is high. The value of the symmetrical r w coefficient was 0.9427. The asymmetrical W S coefficient has a value of 0.9445 for comparing COMET ranking with SPOTIS and 0.9229 for comparing SPOTIS ranking with COMET. Because it is asymmetrical, the W S coefficient takes on different values depending on the order of the compared rankings. The differences when the rankings compared are reordered illustrate graphs displayed in Figure 1. The asymmetrical W S coefficient accounts for these differences, while the r w value is the same regardless of the order of the rankings compared to each other. The value of the W S coefficient depends on which positions in the compared rankings are different. Discrepancies occurring at the top of the ranking more significantly impact its value than discrepancies at lower positions [63].

Sensitivity Analysis

The next step in this study was to perform a sensitivity analysis to determine the significance of the impact of each decision criteria on the preference values of the alternatives. Sensitivity analysis was repeated separately for both MCDM methods. The procedure involves increasing criteria values of alternatives evaluated by 1% and calculating the preference value changed in each direction and percentage. Then, local weights are determined for each alternative based on the values obtained in the previous step by dividing by the sum of their absolute values. Results of sensitivity analysis including changes of preference values for COMET are contained in Table 5 and obtained local weights are included in Table 6. For SPOTIS results of sensitivity analysis are displayed in Table 7 and received local weights are presented in Table 8. Based on the obtained local weights, a more detailed analysis of the obtained rankings and differences for the two methods can be performed.
In the case of the leader of the COMET ranking, which is A 4 , it can be observed that the highest local importance affecting the preference value is criterion C 1 (0.3962), and the second criterion in terms of local importance is C 5 (0.1947). Therefore, it explains why A 4 got first place in the COMET ranking, although it had a less attractive value of the globally most relevant criterion C 5 than A 24 . The value of C 1 , which is the most locally relevant criterion for A 4 , is more advantageous in its case than in A 24 . For the SPOTIS method, the local weights determined for A 4 have different values than for COMET. The highest local significance for A 4 is criterion C 5 (0.4687), while the second-highest local significance is criterion C 1 (0.1957). It explains why A 4 is preferred in the COMET ranking but no longer preferred in the SPOTIS ranking. For SPOTIS, C 5 (0.4101) proved to be the most locally relevant criterion for the leader of its ranking, A 24 , followed by C 1 (0.2440), so in the SPOTIS ranking, alternative A 24 appeared to be the most preferred.
For alternative A 2 , which ranked second in COMET, the local significance for the COMET method is highest for criterion C 1 (0.3354), and the second most relevant criterion is C 5 (0.1682). For SPOTIS, it is otherwise, as the most locally significant criterion for A 2 is (0.4810) and the second most important criterion is C 1 (0.1938).
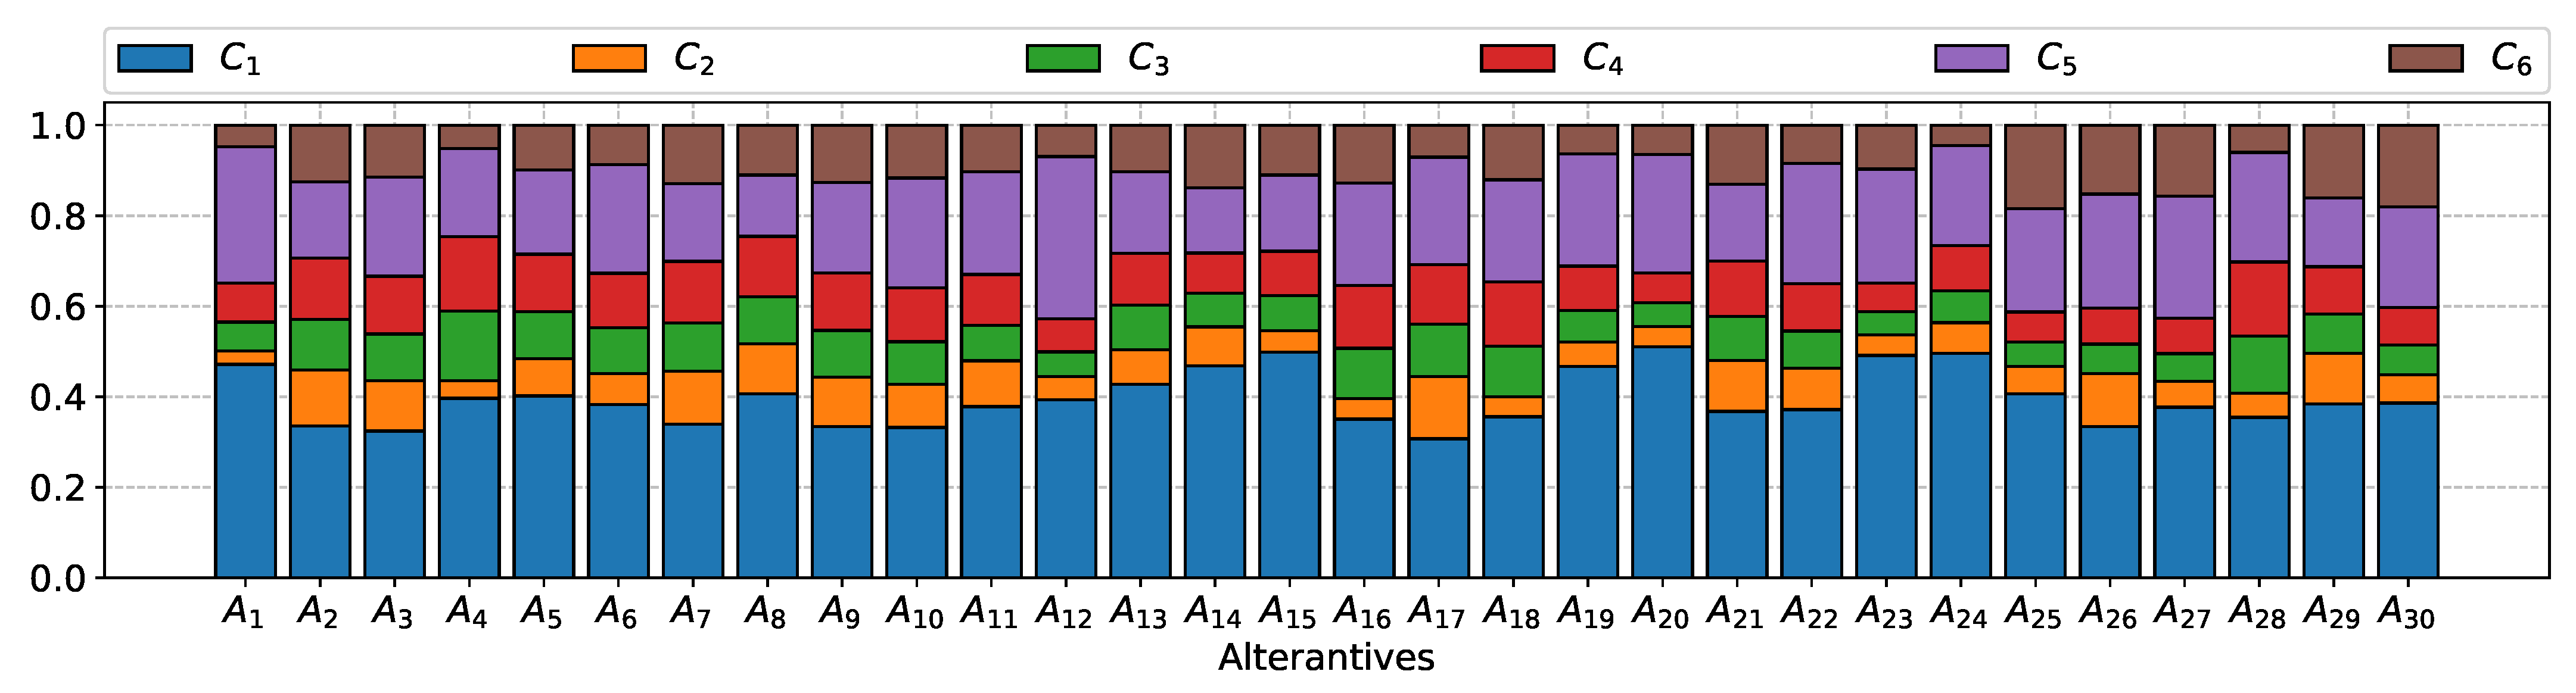
The local weights for each alternative determined by the sensitivity analysis procedure are visualized as a cumulative column chart in Figure 2. The highest contribution of criterion C 1 for all alternatives can be observed, which means it is the most locally relevant criterion in the COMET method. The second most locally relevant criterion is C 5 .
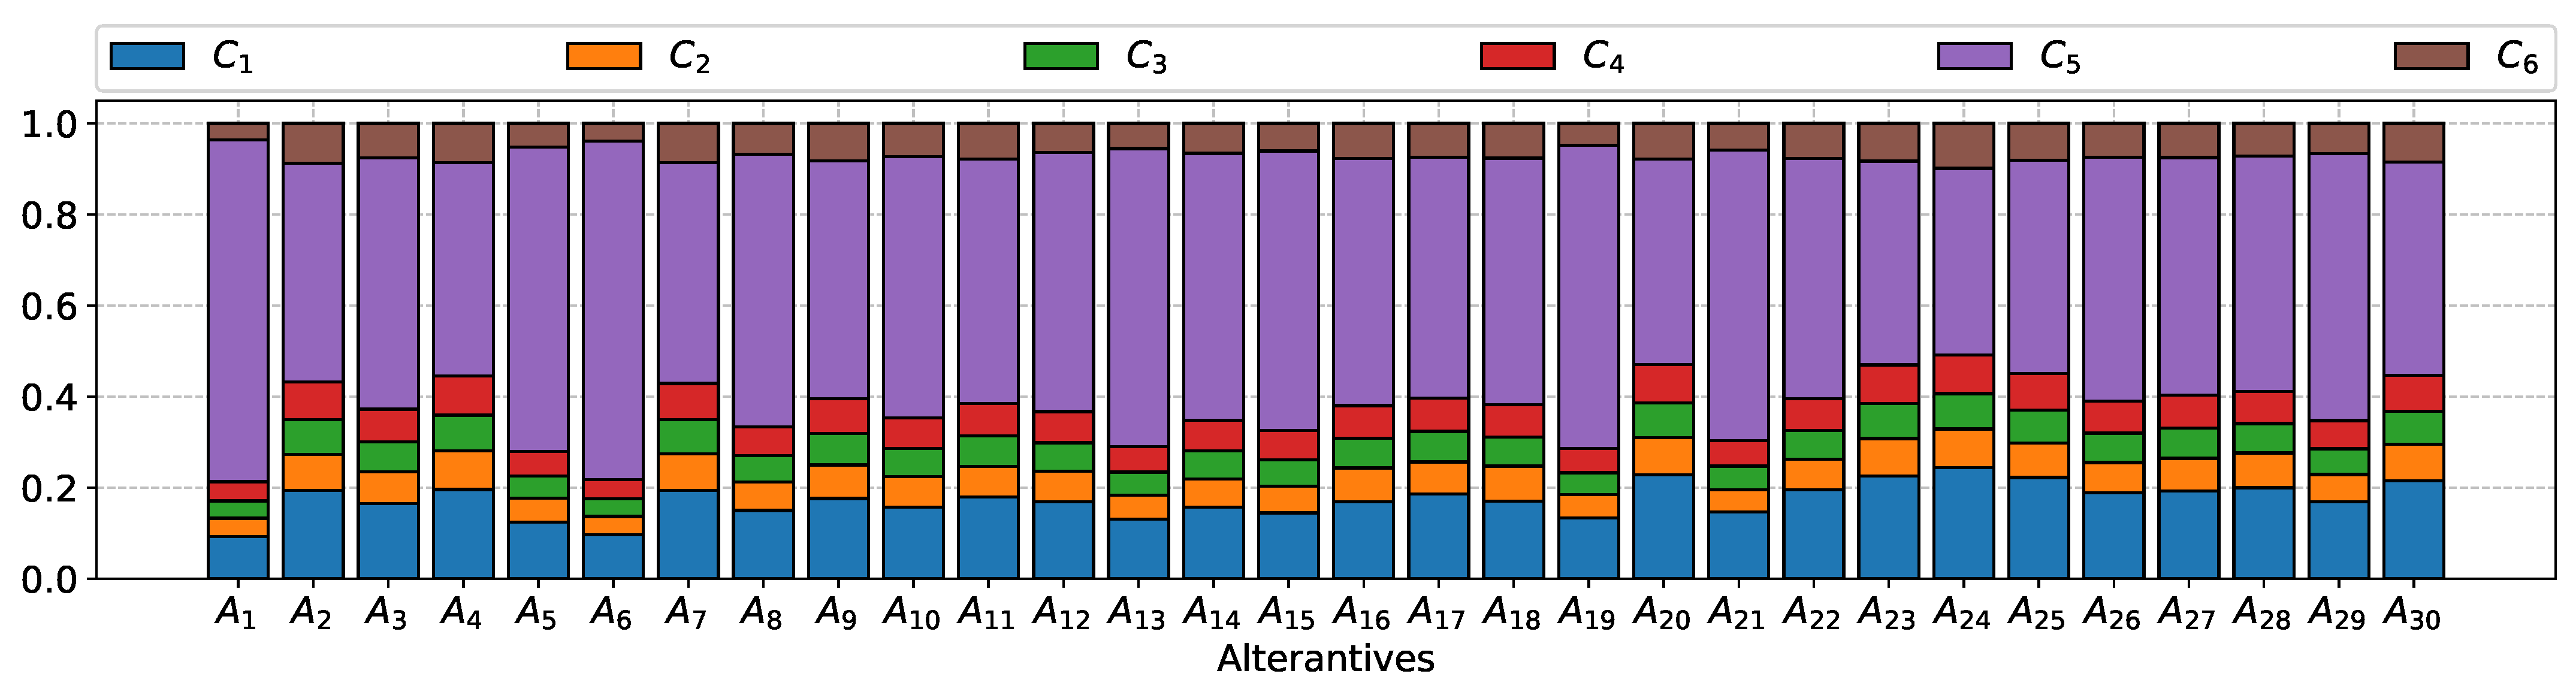
Figure 3 displays a cumulative column chart representing the share of criteria in terms of their local relevance to the alternatives analyzed for the SPOTIS method. In this case, the highest local importance is shown by criterion C 5 , followed by C 1 .
For all alternatives analyzed, criterion C 1 has the highest local significance for the COMET method, while for the SPOTIS method, the most locally relevant criterion is C 5 . The results obtained indicate that the preference for each alternative depends on the values of the criteria that are most relevant not only globally, according to the weights determined by an objective weighting technique. Furthermore, of great importance are the local weights, which are different for each alternative but are dependent on the global weights. The COMET method indicated A 4 as the best alternative, which does not have the most attractive value of the globally most important criterion, price ( C 5 ), but has a very advantageous value of the second most important criterion ( C 1 ). The SPOTIS method, on the other hand, indicated A 24 as the leader of the ranking, which has the lowest price, even though the value of C 1 is not among the most favorable in its case compared to the other alternatives. The results obtained suggest that, in this case, the decision-maker, in addition to considering the rankings provided by both methods, should take into account their individual preferences regarding the relevance of the decisive criteria in the final decision.

5. Discussion

This article is intended to present an approach based on two innovative rank-reversal-free MCDM methods, COMET and SPOTIS, which could be applied in a decision support system for multi-criteria selection of solar panels for photovoltaic systems. The proposed approach is demonstrated with an illustrative example of selecting the most advantageous solar panel option from thirty available alternatives, taking into account six criteria relevant to the decision-makers. The obtained results confirmed the well-known fact that the same decision problem could be evaluated differently if different MCDM methods are used for this purpose. Due to the various algorithms of the methods and the different ways they scale the targets, choosing the most appropriate method for a particular problem is not straightforward. In this situation, a comparative analysis of the methods is suggested to identify fields for their applicability [42]. A practical approach to selecting MCDM methods for benchmarking considers selecting methods with similar assumptions and algorithms. In this paper, whose subject was multi-criteria wind farm site selection, the problem was evaluated using three methods: TOPSIS, VIKOR, and COMET. Algorithms based on distance measurement and using reference points in the problem space are their common features, making their selection for comparative analysis justified [8]. Furthermore, the same set of MCDM methods was chosen to evaluate the sustainable transportation problem in [62]. Ease of application and adaptation of the method to the problem under consideration is also significant in the choice of methods, for example, usefulness in evaluating quantitative data, which are often found in renewable energy problems [31]. In selecting an MCDM method, it is also essential to consider whether the ranking that the method returns provides comparability with the other methods [42].
The authors of this paper took into account the suggestions for the adequate choice of MCDM methods present in the literature review and decided to use in the proposed approach two methods, COMET and SPOTIS. Their common features are robustness to rank reversal paradox, use of reference objects, measurement of distances from reference objects, high accuracy, and ability to work with data in the form of decision matrix with numerical values and return results in quantitative form. The mentioned advantages of both methods are useful in case of intention to use them in practice as a decision support system engine, as they enable easy, automated, and objective evaluation considering both multiple alternatives and numerous criteria. An aspect that seems to be advantageous from the point of view of attempting to develop an automated DSS that is objective and easy to use for the decision-maker is the replacement of the laborious step of pairwise comparison of characteristic objects by an expert with the evaluation of a set of COs objects using the TOPSIS method. The COMET method retains its main advantage, which is rank-reversal-free because the TOPSIS method combined with COMET operates on characteristic objects and not on alternatives [41]. For the multi-criteria problem solved in this paper, with six criteria and three characteristic values for each criterion, 729 characteristic objects are generated. It follows that if the monolithic structure of this problem were used in the classical version of COMET, 265,356 pairwise comparisons by an expert would be required. However, the number of pairwise comparisons can be obviously reduced by using a decomposition procedure that divides the criteria into modules to obtain a hierarchical structure of the problem [64]. Such a hierarchical model with ten decision criteria divided into three modules was created for offshore wind farm site selection using COMET in [29]. However, subjective comparisons performed manually by an expert are still necessary, while replacing this step with the TOPSIS method makes the proposed hybrid approach more compatible with the authors’ attempt to create a fully automated and objective system for evaluating solar panels.
When a significant effect of criterion weights on rankings is observed, it is advisable to conduct a selected kind of sensitivity analysis that supports analysis and more accurately determines the influence of criterion weights on rankings [45]. Sensitivity analysis performed in this study, providing local weights for the individual alternatives concerning the criteria, demonstrated that criterion C 1 , which is Open Circuit Voltage, is more relevant for determining preferences for the COMET method. In contrast, the SPOTIS method takes more C 5 (Cost per m 2 ) into account.
Despite the observed differences in the rankings, the values of both r w and W S ranking similarity coefficients showed their high correlation. Thus, the results demonstrate that both methods were appropriately selected for the problem to be solved, and they have high potential as the basis of DSS for solar panel selection.

6. Conclusions

This paper aimed to present the application of two innovative rank-reversal-free MCDM methods, which are COMET and SPOTIS, on the example of a multi-criteria solar panel selection problem. In addition, the COMET method was combined with the TOPSIS method to replace the labor-intensive and subjective step of pairwise comparison of characteristic objects by an expert with an automatic and objective evaluation of the set of characteristic objects. Criteria weights were determined using an objective entropy weighting technique and were identified as the most relevant two following selection criteria: cost per m 2 ( C 5 ) and open circuit voltage ( C 1 ).
The COMET method identified A 4 with an advantageous C 1 value as the best alternative, while the SPOTIS ranking indicated A 24 with a very favorable C 5 value as the best variant. The discrepancies in obtained rankings are caused by different considerations of the significance of the criteria weights at the local level by both methods, as demonstrated in the sensitivity analysis procedure. COMET prefers alternatives with advantageous C 1 values, and SPOTIS favors alternatives with attractive C 5 values. Identification of such properties can be useful in supporting the selection of the more favorable alternative in terms of the criteria that are more important to the decision-maker.
The obtained results proved that the approach proposed by the authors is suitable and applicable as the basis of a DSS supporting the selection of solar panels. Its main advantages include ease of use, the objectivity of the obtained rankings with respect to the relevance of the criteria, and full automation of all procedures. Solar panel technology is becoming more popular and available as prices drop and the number of attributes that characterize it is large. The presented advantages of the approach, which is the subject of this article, make it seem promising and future-proof for supporting the decision of choosing solar panels both for individual customers representing households and for companies needing complex photovoltaic systems. Furthermore, the obtained results encourage the continuation of the presented research, involving the study of other techniques for criteria weighting—for example, CRITIC [65], IDOCRIW [66], CILOS [67], and extending the scope of the performed research to other fields, including the problem of renewable energy sources and, depending on the obtained results, other MCDM methods.

Author Contributions

Conceptualization, A.B., B.K., A.S., M.Y., V.K. and W.S.; methodology, A.B., B.K., A.S. and W.S.; software, A.B., B.K., A.S. and W.S.; validation, A.B., B.K. and W.S.; formal analysis, W.S.; investigation, A.B., B.K., A.S., M.Y., V.K. and W.S.; resources, M.Y. and V.K.; data curation, A.B., B.K., A.S., M.Y., V.K. and W.S.; writing—original draft preparation, A.B., B.K. and W.S.; writing—review and editing, A.B., B.K. and W.S.; visualization, A.B. and B.K.; supervision, W.S.; project administration, W.S.; funding acquisition, W.S. All authors have read and agreed to the published version of the manuscript.

Funding

The work was supported by the National Science Centre, Decision number UMO-2018/29/B/HS4/02725 (A.S., B.K. and W.S.).

Institutional Review Board Statement

Not applicable.

Informed Consent Statement

Not applicable.

Data Availability Statement

Not applicable.

Acknowledgments

The authors would like to thank the editor and the anonymous reviewers, whose insightful comments and constructive suggestions helped us to significantly improve the quality of this paper.

Conflicts of Interest

The authors declare no conflict of interest.

Abbreviations

The following abbreviations are used in this manuscript:
AHPAnalytical Hierarchy Process
ANPAnalytic Network Process
BWMBest-Worst Method
COCharacteristic Object
COMETCharacteristic Object METhod
COPRASCOmplex PropoRtional ASsessmen
DEMATELDecision Making Trial and Evaluation Laboratory
DSSDecision Support System
ELECTREELimination Et Choix Traduisant la REalité
ISPIdeal Solution Point
LBWALevel Based Weight Assessment
MABACMulti-Attributive Border Approximation area Comparison
MAIRCAMulti Attributive Ideal-Real Comparative Analysis
MCDAMulti-Criteria Decision-Analysis
MCDMMulti-Criteria Decision-Making
MEJMatrix of Expert Judgement
NISNegative Ideal Solution
PISPositive Ideal Solution
PROMETHEEPreference Ranking Organization METHod for Enrichment of Evaluation
PROSAPROMETHEE for Sustainability Assessment
PVPhotovoltaic
RAFSIRanking of Alternatives through Functional mapping of criterion sub-intervals
into a Single Interval
RESRenewable Energy Supply
rwWeighted Spearman’s Rank Correlation Coefficient
SIMUSSequential Interactive Model of Urban Systems
SJvector of the Summed Judgements
SPOTISStable Preference Ordering Towards Ideal Solution
TOPSISTechnique for Order of Preference by Similarity to Ideal Solution
VIKORVlseKriterijumska Optimizacija I Kompromisno Resenje
WASPASWeighted Aggregated Sum Product Assessment
WS coefficientWeighted Similarity Coefficient

References

  1. Lak Kamari, M.; Isvand, H.; Alhuyi Nazari, M. Applications of multi-criteria decision-making (MCDM) methods in renewable energy development: A review. Renew. Energy Res. Appl. 2020, 1, 47–54. [Google Scholar]
  2. Rani, P.; Mishra, A.R.; Mardani, A.; Cavallaro, F.; Štreimikienė, D.; Khan, S.A.R. Pythagorean fuzzy SWARA–VIKOR framework for performance evaluation of solar panel selection. Sustainability 2020, 12, 4278. [Google Scholar] [CrossRef]
  3. Van de Kaa, G.; Rezaei, J.; Kamp, L.; de Winter, A. Photovoltaic technology selection: A fuzzy MCDM approach. Renew. Sustain. Energy Rev. 2014, 32, 662–670. [Google Scholar] [CrossRef]
  4. Seker, S.; Kahraman, C. Socio-economic evaluation model for sustainable solar PV panels using a novel integrated MCDM methodology: A case in Turkey. Socio-Econ. Plan. Sci. 2021, 77, 100998. [Google Scholar] [CrossRef]
  5. Govindarajan, U.; Ramachandaramurthy, V.K. Multiple criteria decision making (MCDM) based economic analysis of solar PV system with respect to performance investigation for Indian market. Sustainability 2017, 9, 820. [Google Scholar]
  6. Wang, T.C.; Tsai, S.Y. Solar panel supplier selection for the photovoltaic system design by using fuzzy multi-criteria decision making (MCDM) approaches. Energies 2018, 11, 1989. [Google Scholar] [CrossRef] [Green Version]
  7. Gnanasekaran, S.; Venkatachalama, N. A review on applications of multi-criteria decision making (MCDM) for solar panel selection. Int. J. Mech. Prod. Eng. Res. Dev. 2019, 9, 11–20. [Google Scholar]
  8. Kizielewicz, B.; Wątróbski, J.; Sałabun, W. Identification of relevant criteria set in the MCDA process—Wind farm location case study. Energies 2020, 13, 6548. [Google Scholar] [CrossRef]
  9. Nesticò, A.; Somma, P. Comparative analysis of multi-criteria methods for the enhancement of historical buildings. Sustainability 2019, 11, 4526. [Google Scholar] [CrossRef] [Green Version]
  10. Nesticò, A.; Elia, C.; Naddeo, V. Sustainability of urban regeneration projects: Novel selection model based on analytic network process and zero-one goal programming. Land Use Policy 2020, 99, 104831. [Google Scholar] [CrossRef]
  11. Wątróbski, J.; Jankowski, J.; Ziemba, P.; Karczmarczyk, A.; Zioło, M. Generalised framework for multi-criteria method selection. Omega 2019, 86, 107–124. [Google Scholar] [CrossRef]
  12. Wątróbski, J.; Jankowski, J.; Ziemba, P.; Karczmarczyk, A.; Zioło, M. Generalised framework for multi-criteria method selection: Rule set database and exemplary decision support system implementation blueprints. Data Brief 2019, 22, 639. [Google Scholar] [CrossRef]
  13. Wątróbski, J.; Jankowski, J. Guideline for MCDA method selection in production management area. In New Frontiers in Information and Production Systems Modelling and Analysis; Springer: Berlin/Heidelberg, Germany, 2016; pp. 119–138. [Google Scholar]
  14. Wątróbski, J.; Małecki, K.; Kijewska, K.; Iwan, S.; Karczmarczyk, A.; Thompson, R.G. Multi-criteria analysis of electric vans for city logistics. Sustainability 2017, 9, 1453. [Google Scholar] [CrossRef] [Green Version]
  15. Sałabun, W.; Ziemba, P.; Wątróbski, J. The rank reversals paradox in management decisions: The comparison of the AHP and COMET methods. In International Conference on Intelligent Decision Technologies; Springer: Berlin/Heidelberg, Germany, 2016; pp. 181–191. [Google Scholar]
  16. Dezert, J.; Tchamova, A.; Han, D.; Tacnet, J.M. The SPOTIS Rank Reversal Free Method for Multi-Criteria Decision-Making Support. In Proceedings of the 2020 IEEE 23rd International Conference on Information Fusion (FUSION), Rustenburg, South Africa, 6–9 July 2020; pp. 1–8. [Google Scholar]
  17. Žižović, M.; Pamučar, D.; Albijanić, M.; Chatterjee, P.; Pribićević, I. Eliminating rank reversal problem using a new multi-attribute model—The RAFSI method. Mathematics 2020, 8, 1015. [Google Scholar] [CrossRef]
  18. Munier, N. A new approach to the rank reversal phenomenon in MCDM with the SIMUS method. Multiple Criteria Decis. Mak. 2016, 11, 137–152. [Google Scholar] [CrossRef]
  19. De Farias Aires, R.F.; Ferreira, L. A new approach to avoid rank reversal cases in the TOPSIS method. Comput. Ind. Eng. 2019, 132, 84–97. [Google Scholar] [CrossRef]
  20. Seiti, H.; Hafezalkotob, A. Developing the R-TOPSIS methodology for risk-based preventive maintenance planning: A case study in rolling mill company. Comput. Ind. Eng. 2019, 128, 622–636. [Google Scholar] [CrossRef]
  21. Yang, W.; Wu, Y. A new improvement method to avoid rank reversal in VIKOR. IEEE Access 2020, 8, 21261–21271. [Google Scholar] [CrossRef]
  22. Mokarram, M.; Mokarram, M.J.; Gitizadeh, M.; Niknam, T.; Aghaei, J. A novel optimal placing of solar farms utilizing multi-criteria decision-making (MCDA) and feature selection. J. Clean. Prod. 2020, 261, 121098. [Google Scholar] [CrossRef]
  23. Akkas, O.P.; Erten, M.Y.; Cam, E.; Inanc, N. Optimal site selection for a solar power plant in the Central Anatolian Region of Turkey. Int. J. Photoenergy 2017, 2017, 7452715. [Google Scholar] [CrossRef] [Green Version]
  24. Wang, C.N.; Nguyen, V.T.; Thai, H.T.N.; Duong, D.H. Multi-criteria decision making (MCDM) approaches for solar power plant location selection in Viet Nam. Energies 2018, 11, 1504. [Google Scholar] [CrossRef] [Green Version]
  25. Finn, T.; McKenzie, P. A high-resolution suitability index for solar farm location in complex landscapes. Renew. Energy 2020, 158, 520–533. [Google Scholar] [CrossRef]
  26. Suuronen, A.; Lensu, A.; Kuitunen, M.; Andrade-Alvear, R.; Celis, N.G.; Miranda, M.; Perez, M.; Kukkonen, J.V. Optimization of photovoltaic solar power plant locations in northern Chile. Environ. Earth Sci. 2017, 76, 1–14. [Google Scholar] [CrossRef]
  27. Sindhu, S.; Nehra, V.; Luthra, S. Investigation of feasibility study of solar farms deployment using hybrid AHP-TOPSIS analysis: Case study of India. Renew. Sustain. Energy Rev. 2017, 73, 496–511. [Google Scholar] [CrossRef]
  28. Peña, K.; Sosa, I.; Suero, D.; Cruz-Diloné, P.; Faxas, J. A MCDA for Selecting Photovoltaic System in a Caribbean Country. In Proceedings of the IIE Annual Conference, Institute of Industrial and Systems Engineers (IISE), Pittsburgh, PA, USA, 20–23 May 2017; pp. 1625–1630. [Google Scholar]
  29. Sałabun, W.; Wątróbski, J.; Piegat, A. Identification of a multi-criteria model of location assessment for renewable energy sources. In Proceedings of the International Conference on Artificial Intelligence and Soft Computing; Springer: Berlin/Heidelberg, Germany, 2016; pp. 321–332. [Google Scholar]
  30. Kizielewicz, B.; Szyjewski, Z. Handling economic perspective in multicriteria model-renewable energy resources case study. Proc. Comput. Sci. 2020, 176, 3555–3562. [Google Scholar] [CrossRef]
  31. Wątróbski, J.; Ziemba, P.; Jankowski, J.; Zioło, M. Green energy for a green city—A multi-perspective model approach. Sustainability 2016, 8, 702. [Google Scholar] [CrossRef] [Green Version]
  32. Ziemba, P.; Wątróbski, J.; Zioło, M.; Karczmarczyk, A. Using the PROSA method in offshore wind farm location problems. Energies 2017, 10, 1755. [Google Scholar] [CrossRef] [Green Version]
  33. Gigović, L.; Pamučar, D.; Božanić, D.; Ljubojević, S. Application of the GIS-DANP-MABAC multi-criteria model for selecting the location of wind farms: A case study of Vojvodina, Serbia. Renew. Energy 2017, 103, 501–521. [Google Scholar] [CrossRef]
  34. Pamučar, D.; Gigović, L.; Bajić, Z.; Janošević, M. Location selection for wind farms using GIS multi-criteria hybrid model: An approach based on fuzzy and rough numbers. Sustainability 2017, 9, 1315. [Google Scholar] [CrossRef] [Green Version]
  35. Pamučar, D.; Behzad, M.; Božanić, D.; Behzad, M. Decision making to support sustainable energy policies corresponding to agriculture sector: Case study in Iran’s Caspian Sea coastline. J. Clean. Prod. 2021, 292, 125302. [Google Scholar] [CrossRef]
  36. Chatterjee, K.; Kar, S. A multi-criteria decision making for renewable energy selection using Z-numbers in uncertain environment. Technol. Econ. Dev. Econ. 2018, 24, 739–764. [Google Scholar] [CrossRef] [Green Version]
  37. Rathi, R.; Prakash, C.; Singh, S.; Krolczyk, G.; Pruncu, C.I. Measurement and analysis of wind energy potential using fuzzy based hybrid MADM approach. Energy Rep. 2020, 6, 228–237. [Google Scholar] [CrossRef]
  38. Sałabun, W.; Karczmarczyk, A.; Wątróbski, J.; Jankowski, J. Handling data uncertainty in decision making with COMET. In Proceedings of the 2018 IEEE Symposium Series on Computational Intelligence (SSCI), Bangalore, India, 18–21 November 2018; pp. 1478–1484. [Google Scholar]
  39. Watróbski, J.; Sałabun, W. The characteristic objects method: A new intelligent decision support tool for sustainable manufacturing. In Proceedings of the International Conference on Sustainable Design and Manufacturing; Springer: Berlin/Heidelberg, Germany, 2016; pp. 349–359. [Google Scholar]
  40. Sałabun, W. The Characteristic Objects Method: A New Distance-based Approach to Multicriteria Decision-making Problems. J. Multi-Criteria Decis. Anal. 2015, 22, 37–50. [Google Scholar] [CrossRef]
  41. Kizielewicz, B.; Shekhovtsov, A.; Sałabun, W. A New Approach to Eliminate Rank Reversal in the MCDA Problems. In Proceedings of the International Conference on Computational Science; Springer: Berlin/Heidelberg, Germany, 2021; pp. 338–351. [Google Scholar]
  42. Sałabun, W.; Wątróbski, J.; Shekhovtsov, A. Are MCDA methods benchmarkable? a comparative study of TOPSIS, VIKOR, COPRAS, and PROMETHEE II methods. Symmetry 2020, 12, 1549. [Google Scholar] [CrossRef]
  43. Shekhovtsov, A.; Kizielewicz, B.; Sałabun, W. New Rank-Reversal Free Approach to Handle Interval Data in MCDA Problems. In Proceedings of the International Conference on Computational Science; Springer: Berlin/Heidelberg, Germany, 2021; pp. 458–472. [Google Scholar]
  44. Şengül, Ü.; Eren, M.; Shiraz, S.E.; Gezder, V.; Şengül, A.B. Fuzzy TOPSIS method for ranking renewable energy supply systems in Turkey. Renew. Energy 2015, 75, 617–625. [Google Scholar] [CrossRef]
  45. Lee, H.C.; Chang, C.T. Comparative analysis of MCDM methods for ranking renewable energy sources in Taiwan. Renew. Sustain. Energy Rev. 2018, 92, 883–896. [Google Scholar] [CrossRef]
  46. Sun, Y.; Wang, R.; Li, J.; Liu, J. GIS-based multiregional potential evaluation and strategies selection framework for various renewable energy sources: A case study of eastern coastal regions of China. Energy Sci. Eng. 2017, 5, 123–140. [Google Scholar] [CrossRef] [Green Version]
  47. Štreimikienė, D.; Šliogerienė, J.; Turskis, Z. Multi-criteria analysis of electricity generation technologies in Lithuania. Renew. Energy 2016, 85, 148–156. [Google Scholar] [CrossRef]
  48. Tsai, C.T.; Beza, T.M.; Wu, W.B.; Kuo, C.C. Optimal configuration with capacity analysis of a hybrid renewable energy and storage system for an island application. Energies 2020, 13, 8. [Google Scholar] [CrossRef] [Green Version]
  49. Ilbahar, E.; Cebi, S.; Kahraman, C. A state-of-the-art review on multi-attribute renewable energy decision making. Energy Strategy Rev. 2019, 25, 18–33. [Google Scholar] [CrossRef]
  50. Xu, X.; Niu, D.; Qiu, J.; Wu, M.; Wang, P.; Qian, W.; Jin, X. Comprehensive evaluation of coordination development for regional power grid and renewable energy power supply based on improved matter element extension and TOPSIS method for sustainability. Sustainability 2016, 8, 143. [Google Scholar] [CrossRef] [Green Version]
  51. Faizi, S.; Sałabun, W.; Ullah, S.; Rashid, T.; Więckowski, J. A new method to support decision-making in an uncertain environment based on normalized interval-valued triangular fuzzy numbers and COMET technique. Symmetry 2020, 12, 516. [Google Scholar] [CrossRef] [Green Version]
  52. Faizi, S.; Sałabun, W.; Rashid, T.; Wątróbski, J.; Zafar, S. Group decision-making for hesitant fuzzy sets based on characteristic objects method. Symmetry 2017, 9, 136. [Google Scholar] [CrossRef]
  53. Sałabun, W.; Karczmarczyk, A.; Wątróbski, J. Decision-making using the hesitant fuzzy sets COMET method: An empirical study of the electric city buses selection. In Proceedings of the 2018 IEEE Symposium Series on Computational Intelligence (SSCI), Bangalore, India, 18–21 November 2018; pp. 1485–1492. [Google Scholar]
  54. Sałabun, W. Reduction in the number of comparisons required to create matrix of expert judgment in the COMET method. Manag. Prod. Eng. Rev. 2014, 5, 62–69. [Google Scholar] [CrossRef]
  55. Sałabun, W.; Karczmarczyk, A. Using the COMET method in the sustainable city transport problem: An empirical study of the electric powered cars. Procedia Comput. Sci. 2018, 126, 2248–2260. [Google Scholar] [CrossRef]
  56. Kizielewicz, B.; Kołodziejczyk, J. Effects of the selection of characteristic values on the accuracy of results in the COMET method. Procedia Comput. Sci. 2020, 176, 3581–3590. [Google Scholar] [CrossRef]
  57. Shekhovtsov, A.; Kołodziejczyk, J.; Sałabun, W. Fuzzy Model Identification Using Monolithic and Structured Approaches in Decision Problems with Partially Incomplete Data. Symmetry 2020, 12, 1541. [Google Scholar] [CrossRef]
  58. Wątróbski, J.; Sałabun, W.; Karczmarczyk, A.; Wolski, W. Sustainable decision-making using the COMET method: An empirical study of the ammonium nitrate transport management. In Proceedings of the 2017 Federated Conference on Computer Science and Information Systems (FedCSIS), Prague, Czech Republic, 3–6 September 2017; pp. 949–958. [Google Scholar]
  59. Zolfani, S.; Yazdani, M.; Pamucar, D.; Zarate, P. A VIKOR and TOPSIS focused reanalysis of the MADM methods based on logarithmic normalization. arXiv 2020, arXiv:2006.08150. [Google Scholar]
  60. Sałabun, W. The mean error estimation of TOPSIS method using a fuzzy reference models. J. Theor. Appl. Comput. Sci. 2013, 7, 40–50. [Google Scholar]
  61. Li, H.; Wang, W.; Fan, L.; Li, Q.; Chen, X. A novel hybrid MCDM model for machine tool selection using fuzzy DEMATEL, entropy weighting and later defuzzification VIKOR. Appl. Soft Comput. 2020, 91, 106207. [Google Scholar] [CrossRef]
  62. Shekhovtsov, A.; Kozlov, V.; Nosov, V.; Sałabun, W. Efficiency of Methods for Determining the Relevance of Criteria in Sustainable Transport Problems: A Comparative Case Study. Sustainability 2020, 12, 7915. [Google Scholar] [CrossRef]
  63. Sałabun, W.; Urbaniak, K. A new coefficient of rankings similarity in decision-making problems. In Proceedings of the International Conference on Computational Science; Springer: Berlin/Heidelberg, Germany, 2020; pp. 632–645. [Google Scholar]
  64. Sałabun, W. Fuzzy Multi-Criteria Decision-Making Method: The Modular Approach in the Characteristic Objects Method. Stud. Proc. Polish Assoc. Knowl. Manag. 2015, 77, 54–64. [Google Scholar]
  65. Tuş, A.; Adalı, E.A. The new combination with CRITIC and WASPAS methods for the time and attendance software selection problem. Opsearch 2019, 56, 528–538. [Google Scholar] [CrossRef]
  66. Alao, M.A.; Popoola, O.M.; Ayodele, T.R. Selection of waste-to-energy technology for distributed generation using IDOCRIW-Weighted TOPSIS method: A case study of the City of Johannesburg, South Africa. Renew. Energy 2021, 178, 162–183. [Google Scholar] [CrossRef]
  67. Zavadskas, E.K.; Podvezko, V. Integrated determination of objective criteria weights in MCDM. Int. J. Inf. Technol. Decis. Mak. 2016, 15, 267–283. [Google Scholar] [CrossRef]
Figure 1. Comparison of rankings similarity obtained with COMET and SPOTIS.
Energies 14 05727 g001
Figure 2. Local weights for individual alternatives for the COMET method.
Energies 14 05727 g002
Figure 3. Local weights for individual alternatives for SPOTIS method.
Energies 14 05727 g003
Table 1. Decision matrix including values of criteria for evaluated alternatives.
A i C 1 C 2 C 3 C 4 C 5 C 6
A 1 42.800010.820021.4000213.8728358.959510.1156
A 2 40.93009.820019.3600193.2515105.128811.0429
A 3 40.20009.980019.3600193.2515139.263811.0429
A 4 40.600010.400019.6000196.4286100.595210.7143
A 5 41.200010.350019.7000196.5318230.057810.4046
A 6 43.300010.500020.8000208.0925344.739910.4046
A 7 41.670010.080019.4800188.6228107.784411.1377
A 8 40.56009.940019.0000189.3491167.751511.0651
A 9 40.600010.000019.3000192.7711124.698811.3253
A 10 40.500010.200019.2100191.6168153.293411.3772
A 11 43.30009.510019.5700189.3491133.875711.3609
A 12 45.040010.500020.1000200.0000156.842110.2632
A 13 44.000010.370020.6000205.7143228.000011.1429
A 14 44.300010.260020.9000208.5714170.857111.1429
A 15 44.200010.580021.4000214.2857194.285711.1429
A 16 40.660010.520019.0000189.9441135.335211.1173
A 17 45.400010.200019.7000196.7213133.879810.9290
A 18 41.000010.920018.7000187.5000135.097811.0326
A 19 48.000010.830021.0000211.0553248.743710.3015
A 20 49.860010.390020.2000201.4925101.990010.2985
A 21 48.30009.600020.5000204.4199218.232011.6022
A 22 47.62009.660018.6000186.5285133.160611.2953
A 23 49.600010.660020.4000206.4677101.990010.9453
A 24 46.80009.590017.8900179.292981.399011.3636
A 25 51.200010.290020.2000201.9704111.822711.2315
A 26 48.910010.220020.2000202.0202143.888911.6162
A 27 48.910010.790020.3800203.9801137.313411.4428
A 28 49.140011.050019.1000190.9091131.563610.6364
A 29 49.000010.240019.9000198.0198176.237611.6337
A 30 49.330010.830020.1000200.9346111.317811.6822
Table 2. Data on the evaluated alternatives obtained from websites.
A i NameOpen Circuit Voltage (V)Short Circuit Current (A)Peak Power (W)Cost ($)Module Efficiency (%)Weight (kg)Area (m 2 )
A 1 LG LG370Q1C-V542.8010.82370621.0021.4017.51.73
A 2 Peimar SG315M40.939.82315171.3619.3618.01.63
A 3 Phono Solar PS315M-20/U40.209.98315227.0019.3618.01.63
A 4 Trina TSM-DD06M.05-330BK40.6010.40330169.0019.6018.01.68
A 5 LG LG340N1K-L541.2010.35340398.0019.7018.01.73
A 6 LG LG360N1K-V543.3010.50360596.4020.8018.01.73
A 7 Peimar SM325M41.6710.08315180.0019.4818.61.67
A 8 Q CELLS BLK-G5 32040.569.94320283.5019.0018.71.69
A 9 Trina TSM-DD05H.05(II)40.6010.00320207.0019.3018.81.66
A 10 Heliene 320 Black Mono PERC Solar Panel40.5010.20320256.0019.2119.01.67
A 11 Canadian Solar CS1H-320MS43.309.51320226.2519.5719.21.69
A 12 Q.Peak Duo BLK ML-G9+ 38045.0410.50380298.0020.1019.51.90
A 13 Panasonic EVPV36044.0010.37360399.0020.6019.51.75
A 14 REC Solar REC365AA44.3010.26365299.0020.9019.51.75
A 15 REC Solar REC375AA44.2010.58375340.0021.4019.51.75
A 16 Q CELLS DUO BLK-G6-34040.6610.52340242.2519.0019.91.79
A 17 Silfab SIL-360-NX45.4010.20360245.0019.7020.01.83
A 18 MIssion Solar Energy MSE345SX5T41.0010.92345248.5818.7020.31.84
A 19 LG420QAK-A648.0010.83420495.0021.0020.51.99
A 20 JA Solar JAM72-S10-405MR49.8610.39405205.0020.2020.72.01
A 21 Solaria PowerXT-370R-PD48.309.60370395.0020.5021.01.81
A 22 Astronergy CHSM6612M-370-HV Silver Mono Solar Panel47.629.66360257.0018.6021.81.93
A 23 Trina TSM-DE15M-41549.6010.66415205.0020.4022.02.01
A 24 Canadian Solar CS3U-355P-35MM46.809.59355161.1717.8922.51.98
A 25 Trina TSM-DE15H(II)51.2010.29410227.0020.2022.82.03
A 26 URE/NSP D7M400H8A48.9110.22400284.9020.2023.01.98
A 27 Phono Solar PS410M1-24/TH48.9110.79410276.0020.3823.02.01
A 28 MIssion Solar Energy MSE420SX6W49.1411.05420289.4419.1023.42.20
A 29 Q CELLS DUO L-G5.249.0010.24400356.0019.9023.52.02
A 30 Q CELLS DUO L-G8.2-43049.3310.83430238.2220.1025.02.14
Table 3. Criteria selected for evaluation alternatives.
C i Criterion NameUnitCharacteristic ValuesDirectionWeight
C 1 Open Circuit Voltage[V]{39.798, 44.8977, 51.712}min0.0401
C 2 Short Circuit Current[A]{9.4149, 10.3033, 11.1605}max0.0100
C 3 Module Efficiency[%]{17.7111, 19.855, 21.614}max0.0109
C 4 Peak Power per m 2 [W/m 2 ]{177.5, 198.0988, 216.4286}max0.0119
C 5 Cost per m 2 [$/m 2 ]{80.585, 160.6035, 362.5491}min0.9171
C 6 Weight per m 2 [kg/m 2 ]{10.0145, 11.027, 11.7991}min0.0100
Table 4. Preference values and rankings obtained for evaluated alternatives with COMET and SPOTIS.
A i COMET PSPOTIS PCOMET RSPOTIS R
A 1 0.26870.91942930
A 2 0.81110.110423
A 3 0.68750.2181915
A 4 0.86900.087812
A 5 0.47970.50912426
A 6 0.26210.88183029
A 7 0.78240.121736
A 8 0.56400.31451621
A 9 0.73110.173959
A 10 0.61360.26631519
A 11 0.61780.21611413
A 12 0.55030.28011920
A 13 0.42960.51062527
A 14 0.52760.32462122
A 15 0.50210.39552324
A 16 0.69250.2062811
A 17 0.62050.21421312
A 18 0.68370.20541010
A 19 0.35010.58142728
A 20 0.70410.118075
A 21 0.34010.50092825
A 22 0.53400.23062016
A 23 0.70720.117164
A 24 0.74910.064541
A 25 0.62450.1602128
A 26 0.51140.25932218
A 27 0.55590.23261817
A 28 0.56360.21621714
A 29 0.40470.36692623
A 30 0.64710.1523117
Table 5. Sensitivity analysis for COMET.
A i C 1 C 2 C 3 C 4 C 5 C 6
A 1 −3.47520.21440.47350.6344 2.2234 0.3486
A 2 −1.09260.40090.36470.4424 0.5479 0.4087
A 3 1.2723 0.43580.40710.5008 0.8588 0.4523
A 4 1.0049 0.09820.39100.4175 0.4936 0.1307
A 5 1.8741 0.38440.48560.5928 0.8700 0.4607
A 6 3.6035 0.64600.95871.1316 2.2602 0.8220
A 7 1.1517 0.39530.36250.4620 0.5830 0.4372
A 8 1.5688 0.42800.40390.5144 0.5243 0.4252
A 9 1.2012 0.39050.37190.4570 0.7177 0.4560
A 10 1.4375 0.41190.40890.5162 1.0518 0.5049
A 11 1.5076 0.40400.31190.4471 0.9063 0.4094
A 12 1.3402 0.17370.18760.2477 1.2221 0.2371
A 13 2.2344 0.39640.51620.5982 0.9451 0.5365
A 14 1.8318 0.33900.29250.3459 0.5657 0.5414
A 15 1.9163 0.18360.29800.3754 0.6490 0.4229
A 16 1.2767 0.16500.40560.5051 0.8252 0.4666
A 17 1.1991 0.53840.45140.5133 0.9268 0.2768
A 18 1.3050 0.16360.41110.5202 0.8281 0.4435
A 19 2.2482 0.25830.33570.4728 1.1954 0.3038
A 20 1.1963 0.10510.12430.1525 0.6143 0.1526
A 21 2.3291 0.71160.61900.7729 1.0798 0.8258
A 22 1.4581 0.35780.32390.4101 1.0454 0.3312
A 23 1.1861 0.11000.12370.1520 0.6092 0.2347
A 24 1.0201 0.13830.14500.2055 0.4537 0.0931
A 25 1.3546 0.20140.17950.2206 0.7614 0.6144
A 26 1.5733 0.54920.30730.3722 1.1878 0.7166
A 27 1.4526 0.21940.23650.3006 1.0407 0.6048
A 28 1.4330 0.21740.51100.6615 0.9800 0.2434
A 29 1.9947 0.58150.45180.5443 0.7885 0.8377
A 30 1.2590 0.20350.21540.2717 0.7250 0.5886
Table 6. Local weights for COMET.
A i C 1 C 2 C 3 C 4 C 5 C 6
A 1 0.47160.02910.06430.08610.30170.0473
A 2 0.33540.12310.11200.13580.16820.1255
A 3 0.32400.11100.10370.12750.21870.1152
A 4 0.39620.03870.15420.16460.19470.0515
A 5 0.40150.08240.10400.12700.18640.0987
A 6 0.38250.06860.10170.12010.23990.0872
A 7 0.33960.11660.10690.13620.17190.1289
A 8 0.40600.11070.10450.13310.13570.1100
A 9 0.33420.10870.10350.12720.19970.1269
A 10 0.33190.09510.09440.11920.24280.1166
A 11 0.37820.10130.07820.11220.22740.1027
A 12 0.39320.05100.05500.07270.35860.0696
A 13 0.42750.07580.09880.11440.18080.1026
A 14 0.46770.08660.07470.08830.14440.1382
A 15 0.49830.04770.07750.09760.16880.1100
A 16 0.35030.04530.11130.13860.22640.1280
A 17 0.30700.13780.11560.13140.23730.0709
A 18 0.35540.04460.11200.14170.22560.1208
A 19 0.46700.05360.06970.09820.24830.0631
A 20 0.51010.04480.05300.06500.26190.0651
A 21 0.36750.11230.09770.12190.17040.1303
A 22 0.37140.09110.08250.10440.26620.0844
A 23 0.49100.04560.05120.06290.25220.0971
A 24 0.49620.06730.07050.10000.22070.0453
A 25 0.40660.06040.05390.06620.22850.1844
A 26 0.33430.11670.06530.07910.25240.1523
A 27 0.37680.05690.06140.07800.27000.1569
A 28 0.35410.05370.12630.16350.24220.0602
A 29 0.38370.11190.08690.10470.15170.1611
A 30 0.38580.06240.06600.08330.22220.1804
Table 7. Sensitivity analysis for SPOTIS.
A i C 1 C 2 C 3 C 4 C 5 C 6
A 1 0.1567 0.06730.06490.0711 1.2699 0.0618
A 2 1.2473 0.50810.48870.5348 3.0960 0.5615
A 3 0.6203 0.26150.24750.2708 2.0769 0.2843
A 4 1.5565 0.67710.62250.6839 3.7271 0.6854
A 5 0.2724 0.11620.10790.1180 1.4697 0.1148
A 6 0.1653 0.06810.06580.0721 1.2717 0.0663
A 7 1.1524 0.47340.44630.4737 2.8807 0.5139
A 8 0.4340 0.18060.16840.1840 1.7348 0.1976
A 9 0.7860 0.32870.30950.3389 2.3329 0.3658
A 10 0.5119 0.21890.20110.2199 1.8725 0.2399
A 11 0.6744 0.25150.25250.2678 2.0151 0.2952
A 12 0.5412 0.21420.20010.2182 1.8214 0.2058
A 13 0.2900 0.11610.11250.1231 1.4525 0.1226
A 14 0.4593 0.18060.17950.1964 1.7118 0.1927
A 15 0.3761 0.15290.15080.1656 1.5976 0.1582
A 16 0.6636 0.29160.25690.2815 2.1346 0.3027
A 17 0.7134 0.27220.25640.2807 2.0331 0.2865
A 18 0.6718 0.30380.25380.2790 2.1392 0.3016
A 19 0.2779 0.10650.10070.1109 1.3915 0.0995
A 20 1.4222 0.50330.47730.5219 2.8115 0.4901
A 21 0.3245 0.10950.11410.1247 1.4170 0.1301
A 22 0.6949 0.23940.22480.2472 1.8779 0.2750
A 23 1.4252 0.52010.48560.5388 2.8322 0.5247
A 24 2.4421 0.84980.77330.8496 4.1049 0.9894
A 25 1.0760 0.36720.35170.3854 2.2711 0.3938
A 26 0.6349 0.22530.21720.2381 1.8050 0.2516
A 27 0.7078 0.26520.24430.2681 1.9204 0.2763
A 28 0.7650 0.29210.24630.2699 1.9794 0.2763
A 29 0.4495 0.15950.15120.1650 1.5626 0.1781
A 30 1.0905 0.40650.36810.4034 2.3781 0.4309
Table 8. Local weights for SPOTIS.
A i C 1 C 2 C 3 C 4 C 5 C 6
A 1 0.09260.03980.03840.04200.75070.0365
A 2 0.19380.07890.07590.08310.48100.0872
A 3 0.16490.06950.06580.07200.55220.0756
A 4 0.19570.08510.07830.08600.46870.0862
A 5 0.12390.05280.04910.05370.66840.0522
A 6 0.09670.03980.03850.04220.74400.0388
A 7 0.19400.07970.07510.07970.48490.0865
A 8 0.14970.06230.05810.06350.59830.0681
A 9 0.17620.07370.06940.07600.52290.0820
A 10 0.15680.06710.06160.06740.57360.0735
A 11 0.17950.06700.06720.07130.53640.0786
A 12 0.16910.06690.06250.06820.56900.0643
A 13 0.13080.05240.05070.05550.65520.0553
A 14 0.15730.06190.06150.06720.58620.0660
A 15 0.14460.05880.05800.06370.61420.0608
A 16 0.16880.07420.06530.07160.54300.0770
A 17 0.18570.07080.06670.07310.52910.0746
A 18 0.17010.07690.06430.07060.54170.0764
A 19 0.13310.05100.04830.05320.66680.0477
A 20 0.22840.08080.07670.08380.45150.0787
A 21 0.14620.04930.05140.05620.63830.0586
A 22 0.19520.06730.06320.06940.52760.0773
A 23 0.22530.08220.07680.08520.44770.0829
A 24 0.24400.08490.07730.08490.41010.0988
A 25 0.22210.07580.07260.07960.46870.0813
A 26 0.18830.06680.06440.07060.53530.0746
A 27 0.19220.07200.06640.07280.52160.0750
A 28 0.19980.07630.06430.07050.51690.0722
A 29 0.16860.05980.05670.06190.58610.0668
A 30 0.21480.08010.07250.07940.46840.0849
Publisher’s Note: MDPI stays neutral with regard to jurisdictional claims in published maps and institutional affiliations.

