
Pro-Environmental Behaviour in the European Union Countries


Abstract
:1. Introduction
2. Literature Review
3. Materials and Methods
- 1.
- Choice of diagnostic variables (simple characteristics), which are partial determinants of the considered complex phenomenon. From the database of available data, the authors chose those that could describe the pro-environmental behaviour of households. Using our own research experience and findings of other authors, we chose those variables that best reflect the level of pro-ecological behaviour.
- 2.
- Verification and selection of variables in terms of their informative value, considering two basic criteria:
- a.
- Discriminative capacity (variability of characteristics against the tested objects). The coefficient of variation, which is a relative measure of dispersion, is calculated using the formula below:where: —coefficient of variation for the j-th variable, —standard deviation for the j-th variable, where:where: —arithmetic mean of the j-th variable, where:
- b.
- The capacity of the variables (the degree, to which they are correlated with other characteristics). Calculation of the Pearson correlation coefficient, which takes the following form:where: —Pearson’s linear correlation coefficient, —measurable statistical features, —arithmetic mean of the features x and y, respectively.
- 3.
- Determining the nature of the variables: stimulants, destimulants.
- 4.
- Developing a normalised data matrix according to the formula below:where: xij—observation of the j-th variable for the object i.
- 5.
- Consideration of the weights assigned to each characteristic:where: —weight of the j-th variable, .
- 6.
- Determining the model coordinates of the benchmark and anti-benchmark. The values of the benchmark (A+) and anti-benchmark (A−) are defined as [85]:where: —collection of stimulants, —collection of destimulants.
- 7.
- Calculation of Euclidean distances of the analysed objects from the ideal solution (benchmark) and the anti-ideal solution (anti-benchmark) according to the formulas below [87]:where: Euclidean distance of the i-th object from the pattern, —Euclidean distance of the i-th object from the anti-pattern.
- 8.
- Determining the ranking coefficient which defines the similarity of objects to the ideal solution:
- 9.
- Linear ordering and designation of types based on statistical criteria using the arithmetic mean and standard deviation of the synthetic measure values [88]. The obtained values of the synthetic measure were divided into four class intervals:
- Class I (high): .
- Class II (upper medium): .
- Class III (lower medium): .
- Class IV (low): .
where: arithmetic mean of the value of the synthetic feature, —standard deviation from the value of the synthetic measure, —value of the synthetic measure. - 10.
- Calculating the basic statistics for the pooled characteristics in each country class.
- 11.
- Determining the Spearman rank correlation between the obtained rank and selected demographic, economic, and education-related variables. The Spearman’s rank correlation coefficient is more appropriate than Pearson’s linear correlation coefficient in the case of outliers [89] in the sample, or for a small number of observations [90]. It is calculated according to the formula below [91]:where: —differences between the ranks of the corresponding features and feature (i = 1, 2, …, n).
4. Results and Discussion
5. Conclusions
Author Contributions
Funding
Institutional Review Board Statement
Informed Consent Statement
Data Availability Statement
Conflicts of Interest
References
- Nordlund, A.M.; Garvill, J. Value Structures behind Proenvironmental Behavior. Environ. Behav. 2002, 34, 740–756. [Google Scholar] [CrossRef]
- Pieters, R.; Bijmolt, T.; van Raaij, F.; de Kruijk, M. Consumers’ Attributions of Proenvironmental Behavior, Motivation, and Ability to Self and Others. J. Public Policy Mark. 1998, 17, 215–225. [Google Scholar] [CrossRef]
- Garvill, J. Choice of transportation mode: Factors influencing drivers’ willingness to reduce personal car use and support car regulations. In Resolving Social Dilemmas: Dynamics, Structural, and Intergroup Aspects; Foddy, M., Smithson, M., Schneider, S., Hogg, M., Eds.; Psychology Press: Philadelphia, PA, USA, 1999; pp. 263–280. ISBN 0-86377-574-8. [Google Scholar]
- Vlek, C. Why We Should and How We Could Decrease the Use of Motor Vehicles in the near Future. IATSS Res. 1992, 15, 82–93. [Google Scholar]
- Ebreo, A.; Hershey, J.; Vining, J. Reducing Solid Waste: Linking Recycling to Environmentally Responsible Consumerism. Environ. Behav. 1999, 31, 107–135. [Google Scholar] [CrossRef] [Green Version]
- Werner, C.M.; Makela, E. Motivations and Behaviors That Support Recycling. J. Environ. Psychol. 1998, 18, 373–386. [Google Scholar] [CrossRef]
- Stern, P.C.; Gardner, G.T. Psychological Research and Energy Policy. Am. Psychol. 1981, 36, 329–342. [Google Scholar] [CrossRef]
- Steg, L.; Vlek, C. Encouraging Pro-Environmental Behaviour: An Integrative Review and Research Agenda. J. Environ. Psychol. 2009, 29, 309–317. [Google Scholar] [CrossRef]
- Stern, P.C.; Dietz, T.; Kalof, L. Value Orientations, Gender, and Environmental Concern. 1993. Available online: https://journals.sagepub.com/doi/10.1177/0013916593255002 (accessed on 1 July 2021).
- Ajzen, I. The Theory of Planned Behavior. Organ. Behav. Hum. Decis. Process. 1991, 50, 179–211. [Google Scholar] [CrossRef]
- Stern, P.C. New Environmental Theories: Toward a Coherent Theory of Environmentally Significant Behavior. J. Soc. Issues 2000, 56, 407–424. [Google Scholar] [CrossRef]
- Hira, T.K.; Loibl, C. Gender Differences in Investment Behavior. In Handbook of Consumer Finance Research; Xiao, J.J., Ed.; Springer: New York, NY, USA, 2008; pp. 253–270. ISBN 978-0-387-75734-6. [Google Scholar]
- Williams, G. Some Determinants of the Socially Responsible Investment Decision: A Cross-Country Study. J. Behav. Financ. 2007, 8, 43–57. [Google Scholar] [CrossRef]
- Mueller, J.T.; Mullenbach, L.E. Looking for a White Male Effect in Generation Z: Race, Gender, and Political Effects on Environmental Concern and Ambivalence. Soc. Nat. Resour. 2018, 31, 925–941. [Google Scholar] [CrossRef]
- Wiernik, B.M.; Ones, D.S.; Dilchert, S. Age and Environmental Sustainability: A Meta-Analysis. J. Manag. Psychol. 2013, 28, 826–856. [Google Scholar] [CrossRef]
- Kennedy, E.H.; Krahn, H.; Krogman, N.T. Are We Counting What Counts? A Closer Look at Environmental Concern, pro-Environmental Behaviour, and Carbon Footprint. Local Environ. 2015, 20, 220–236. [Google Scholar] [CrossRef]
- Meyer, A. Does Education Increase Pro-Environmental Behavior? Evidence from Europe. Ecol. Econ. 2015, 116, 108–121. [Google Scholar] [CrossRef] [Green Version]
- Kubicek, B.; Korunka, C.; Hoonakker, P.; Raymo, J.M. Work and Family Characteristics as Predictors of Early Retirement in Married Men and Women. Res. Aging 2010, 32, 467–498. [Google Scholar] [CrossRef]
- Agovino, M.; Casaccia, M.; Crociata, A.; Sacco, P.L. European Regional Development Fund and Pro-Environmental Behaviour. The Case of Italian Separate Waste Collection. Socio-Econ. Plan. Sci. 2019, 65, 36–50. [Google Scholar] [CrossRef]
- Burns, S.B.; Savan, B. The Post-Intervention Persistence of Energy Conservation Behaviors: An Evaluation of the ‘Start Green’ Program. Sustainability 2018, 10, 809. [Google Scholar] [CrossRef] [Green Version]
- Walczak, D.; Dziawgo, L.; Dziawgo, D.; Buszko, M.; Pawłowski, J.; Żołądkiewicz-Kuzioła, A.; Krupa, D. Attitudes and Behaviors Regarding Environmental Protection in the Financial Decisions of Individual Consumers. Energies 2021, 14, 1934. [Google Scholar] [CrossRef]
- Díaz-Siefer, P.; Neaman, A.; Salgado, E.; Celis-Diez, J.L.; Otto, S. Human-Environment System Knowledge: A Correlate of Pro-Environmental Behavior. Sustainability 2015, 7, 15510–15526. [Google Scholar] [CrossRef] [Green Version]
- Hiramatsu, A.; Kurisu, K.; Hanaki, K. Environmental Consciousness in Daily Activities Measured by Negative Prompts. Sustainability 2016, 8, 24. [Google Scholar] [CrossRef] [Green Version]
- Kollmuss, A.; Agyeman, J. Mind the Gap: Why Do People Act Environmentally and What Are the Barriers to pro-Environmental Behavior? Environ. Educ. Res. 2002, 8, 239–260. [Google Scholar] [CrossRef] [Green Version]
- Iarossi, G. The Power of Survey Design: A User’s Guide for Managing Surveys, Interpreting Results, and Influencing Respondents; The World Bank: Washington, DC, USA, 2006; Available online: http://elibrary.worldbank.org/doi/book/10.1596/978-0-8213-6392-8 (accessed on 23 August 2021).
- Kaiser, F.G.; Ranney, M.; Hartig, T.; Bowler, P.A. Ecological Behavior, Environmental Attitude, and Feelings of Responsibility for the Environment. Eur. Psychol. 1999, 4, 59–74. [Google Scholar] [CrossRef] [Green Version]
- Milfont, T.L. The Effects of Social Desirability on Self-Reported Environmental Attitudes and Ecological Behaviour. Environmentalist 2009, 29, 263–269. [Google Scholar] [CrossRef]
- Sivek, D.J.; Hungerford, H. Predictors of Responsible Behavior in Members of Three Wisconsin Conservation Organizations. J. Environ. Educ. 1990, 21, 35–40. [Google Scholar] [CrossRef]
- Lange, F.; Dewitte, S. Measuring Pro-Environmental Behavior: Review and Recommendations. J. Environ. Psychol. 2019, 63, 92–100. [Google Scholar] [CrossRef]
- Bamberg, S.; Möser, G. Twenty Years after Hines, Hungerford, and Tomera: A New Meta-Analysis of Psycho-Social Determinants of pro-Environmental Behaviour. J. Environ. Psychol. 2007, 27, 14–25. [Google Scholar] [CrossRef]
- Webster, F.E., Jr. Determining the Characteristics of the Socially Conscious Consumer. J. Consum. Res. 1975, 2, 188–196. [Google Scholar] [CrossRef]
- Tapia-Fonllem, C.; Corral-Verdugo, V.; Fraijo-Sing, B.; Durón-Ramos, M. Assessing Sustainable Behavior and Its Correlates: A Measure of Pro-Ecological, Frugal, Altruistic and Equitable Actions. Sustainability 2013, 5, 711–723. [Google Scholar] [CrossRef] [Green Version]
- Collado, S.; Evans, G.W.; Corraliza, J.A.; Sorrel, M.A. The Role Played by Age on Children’s pro-Ecological Behaviors: An Exploratory Analysis. J. Environ. Psychol. 2015, 44, 85–94. [Google Scholar] [CrossRef] [Green Version]
- Do Paço, A.; Shiel, C.; Alves, H. A New Model for Testing Green Consumer Behaviour. J. Clean. Prod. 2019, 207, 998–1006. [Google Scholar] [CrossRef]
- Narula, S.A.; Desore, A. Framing Green Consumer Behaviour Research: Opportunities and Challenges. Soc. Responsib. J. 2016, 12, 1–22. [Google Scholar] [CrossRef]
- Otto, S.; Pensini, P. Nature-Based Environmental Education of Children: Environmental Knowledge and Connectedness to Nature, Together, Are Related to Ecological Behaviour. Glob. Environ. Chang. 2017, 47, 88–94. [Google Scholar] [CrossRef]
- Cheng, T.-M.; Wu, H.C. How Do Environmental Knowledge, Environmental Sensitivity, and Place Attachment Affect Environmentally Responsible Behavior? An Integrated Approach for Sustainable Island Tourism. J. Sustain. Tour. 2015, 23, 557–576. [Google Scholar] [CrossRef]
- Ogiemwonyi, O.; Harun, A.; Othman, B.; Ismael, D.; Alam, M.; Hamawandy, N.M. Analyzing Issues and Challenges on Environmentally Supportive Behaviour among Malaysian and Nigerian Consumers. Sci. Int. 2020, 32, 87–92. [Google Scholar]
- Wang, C.; Zhang, J.; Yu, P.; Hu, H. The Theory of Planned Behavior as a Model for Understanding Tourists’ Responsible Environmental Behaviors: The Moderating Role of Environmental Interpretations. J. Clean. Prod. 2018, 194, 425–434. [Google Scholar] [CrossRef]
- Liobikienė, G.; Juknys, R. The Role of Values, Environmental Risk Perception, Awareness of Consequences, and Willingness to Assume Responsibility for Environmentally-Friendly Behaviour: The Lithuanian Case. J. Clean. Prod. 2016, 112, 3413–3422. [Google Scholar] [CrossRef]
- Geiger, J.L.; Steg, L.; van der Werff, E.; Ünal, A.B. A Meta-Analysis of Factors Related to Recycling. J. Environ. Psychol. 2019, 64, 78–97. [Google Scholar] [CrossRef]
- Oztekin, C.; Teksöz, G.; Pamuk, S.; Sahin, E.; Acarlı, D. Gender Perspective on the Factors Predicting Recycling Behavior: Implications from the Theory of Planned Behavior. Waste Manag. 2017, 62, 290–302. [Google Scholar] [CrossRef]
- Garcia-Sierra, M.; van den Bergh, J.C.; Miralles-Guasch, C. Behavioural Economics, Travel Behaviour and Environmental-Transport Policy. Transp. Res. Part D Transp. Environ. 2015, 41, 288–305. [Google Scholar] [CrossRef]
- Nordfjærn, T.; Rundmo, T. Acceptance of Disincentives to Driving and Pro-Environmental Transport Intentions: The Role of Value Structure, Environmental Beliefs and Norm Activation. Transportation 2019, 46, 2381–2396. [Google Scholar] [CrossRef]
- Pablo-Romero, M.P.; Cruz, L.; Barata, E. Testing the Transport Energy-Environmental Kuznets Curve Hypothesis in the EU27 Countries. Energy Econ. 2017, 62, 257–269. [Google Scholar] [CrossRef]
- Das, S.; Lee, S.-H.; Kumar, P.; Kim, K.-H.; Lee, S.S.; Bhattacharya, S.S. Solid Waste Management: Scope and the Challenge of Sustainability. J. Clean. Prod. 2019, 228, 658–678. [Google Scholar] [CrossRef]
- Zorpas, A.A. Strategy Development in the Framework of Waste Management. Sci. Total Environ. 2020, 716, 137088. [Google Scholar] [CrossRef]
- Malinauskaite, J.; Jouhara, H.; Czajczyńska, D.; Stanchev, P.; Katsou, E.; Rostkowski, P.; Thorne, R.J.; Colón, J.; Ponsá, S.; Al-Mansour, F.; et al. Municipal Solid Waste Management and Waste-to-Energy in the Context of a Circular Economy and Energy Recycling in Europe. Energy 2017, 141, 2013–2044. [Google Scholar] [CrossRef]
- Acheampong, A. Economic Growth, CO2 Emissions and Energy Consumption: What Causes What and Where? Energy Econ. 2018, 74, 677–692. [Google Scholar] [CrossRef]
- Deb, C.; Zhang, F.; Yang, J.; Lee, S.E.; Shah, K.W. A Review on Time Series Forecasting Techniques for Building Energy Consumption. Renew. Sustain. Energy Rev. 2017, 74, 902–924. [Google Scholar] [CrossRef]
- De Medeiros, J.F.; Ribeiro, J.L.D. Environmentally Sustainable Innovation: Expected Attributes in the Purchase of Green Products. J. Clean. Prod. 2017, 142, 240–248. [Google Scholar] [CrossRef]
- Choi, D.; Johnson, K.K.P. Influences of Environmental and Hedonic Motivations on Intention to Purchase Green Products: An Extension of the Theory of Planned Behavior. Sustain. Prod. Consum. 2019, 18, 145–155. [Google Scholar] [CrossRef]
- Landry, N.; Gifford, R.; Milfont, T.L.; Weeks, A.; Arnocky, S. Learned Helplessness Moderates the Relationship between Environmental Concern and Behavior. J. Environ. Psychol. 2018, 55, 18–22. [Google Scholar] [CrossRef]
- Latif, S.A.; Omar, M.S.; Bidin, Y.H.; Awang, Z. Role of Environmental Knowledge in Creating Pro-Environmental Residents. Procedia-Soc. Behav. Sci. 2013, 105, 866–874. [Google Scholar] [CrossRef] [Green Version]
- Rhead, R.; Elliot, M.; Upham, P. Using Latent Class Analysis to Produce a Typology of Environmental Concern in the UK. Soc. Sci. Res. 2018, 74, 210–222. [Google Scholar] [CrossRef] [PubMed]
- Zareie, B.; Navimipour, N.J. The Impact of Electronic Environmental Knowledge on the Environmental Behaviors of People. Comput. Hum. Behav. 2016, 59, 1–8. [Google Scholar] [CrossRef]
- Klöckner, C.A. A Comprehensive Model of the Psychology of Environmental Behaviour—A Meta-Analysis. Glob. Environ. Chang. 2013, 23, 1028–1038. [Google Scholar] [CrossRef] [Green Version]
- Morren, M.; Grinstein, A. Explaining Environmental Behavior across Borders: A Meta-Analysis. J. Environ. Psychol. 2016, 47, 91–106. [Google Scholar] [CrossRef]
- Kurisu, K. Pro-Environmental Behaviors; Springer: Tokyo, Japan; New York, NY, USA, 2016; ISBN 978-4-431-55832-3. [Google Scholar]
- McDonald, F.V. Developing an Integrated Conceptual Framework of Pro-Environmental Behavior in the Workplace through Synthesis of the Current Literature. Adm. Sci. 2014, 4, 276–303. [Google Scholar] [CrossRef]
- Aral, Ö.H.; López-Sintas, J. A Comprehensive Model to Explain Europeans’ Environmental Behaviors. Sustainability 2020, 12, 4307. [Google Scholar] [CrossRef]
- European Council. 12–13 December 2019. Available online: https://www.consilium.europa.eu/en/meetings/european-council/2019/12/12-13/ (accessed on 13 July 2021).
- Team, E. Special Eurobarometer 490—Climate Change. Available online: https://www.buildup.eu/en/practices/publications/special-eurobarometer-490-climate-change (accessed on 9 July 2021).
- Soares, J.; Miguel, I.; Venâncio, C.; Lopes, I.; Oliveira, M. Public Views on Plastic Pollution: Knowledge, Perceived Impacts, and pro-Environmental Behaviours. J. Hazard. Mater. 2021, 412, 125227. [Google Scholar] [CrossRef]
- Balundė, A.; Perlaviciute, G.; Steg, L. The Relationship Between People’s Environmental Considerations and Pro-Environmental Behavior in Lithuania. Front. Psychol. 2019, 10, 2319. [Google Scholar] [CrossRef] [Green Version]
- Jotanovic, S.R.; Ratkovic, M.; Zakic, N. Pro-Environmental Activities of Consumers. Pol. J. Manag. Stud. 2017, 16, 1. [Google Scholar] [CrossRef]
- Punzo, G.; Panarello, D.; Pagliuca, M.M.; Castellano, R.; Aprile, M.C. Assessing the Role of Perceived Values and Felt Responsibility on Pro-Environmental Behaviours: A Comparison across Four EU Countries. Environ. Sci. Policy 2019, 101, 311–322. [Google Scholar] [CrossRef]
- Sargisson, R.J.; de Groot, J.I.M.; Steg, L. The Relationship Between Sociodemographics and Environmental Values Across Seven European Countries. Front. Psychol. 2020, 11, 2253. [Google Scholar] [CrossRef]
- De Boer, J.; Aiking, H. Prospects for Pro-Environmental Protein Consumption in Europe: Cultural, Culinary, Economic and Psychological Factors. Appetite 2018, 121, 29–40. [Google Scholar] [CrossRef]
- Gómez-Román, C.; Lima, M.L.; Seoane, G.; Alzate, M.; Dono, M.; Sabucedo, J.-M. Testing Common Knowledge: Are Northern Europeans and Millennials More Concerned about the Environment? Sustainability 2021, 13, 45. [Google Scholar] [CrossRef]
- Stolarski, M.J.; Warmiński, K.; Krzyżaniak, M.; Olba-Zięty, E.; Akincza, M. Bioenergy Technologies and Biomass Potential Vary in Northern European Countries. Renew. Sustain. Energy Rev. 2020, 133, 110238. [Google Scholar] [CrossRef]
- Ossowska, L.J.; Janiszewska, D.A. Toward Sustainable Energy Consumption in the European Union. Polityka Energetyczna 2020, 23, 1. [Google Scholar] [CrossRef]
- The Countries of Northern Europe. Available online: https://www.worldatlas.com/articles/which-countries-are-considered-to-be-part-of-northern-europe.html (accessed on 28 August 2021).
- Poortinga, W.; Steg, L.; Vlek, C. Values, Environmental Concern, and Environmental Behavior: A Study into Household Energy Use. Environ. Behav. 2004, 36, 70–93. [Google Scholar] [CrossRef]
- Van Liere, K.D.; Dunlap, R.E. The Social Bases of Environmental Concern: A Review of Hypotheses, Explanations and Empirical Evidence. Public Opin. Q. 1980, 44, 181–197. [Google Scholar] [CrossRef]
- Ecological Behavior across the Lifespan: Why Environmentalism Increases as People Grow Older—ScienceDirect. Available online: https://www.sciencedirect.com/science/article/pii/S0272494414000826 (accessed on 28 August 2021).
- Salehi, S.; Telešienė, A.; Pazokinejad, Z. Socio-Cultural Determinants and the Moderating Effect of Gender in Adopting Sustainable Consumption Behavior among University Students in Iran and Japan. Sustainability 2021, 13, 8955. [Google Scholar] [CrossRef]
- Hines, J.M.; Hungerford, H.R.; Tomera, A.N. Analysis and Synthesis of Research on Responsible Environmental Behavior: A Meta-Analysis. J. Environ. Educ. 1987, 18, 1–8. [Google Scholar] [CrossRef]
- Johnson, C.Y.; Bowker, J.M.; Cordell, H.K. Ethnic Variation in Environmental Belief and Behavior: An Examination of the New Ecological Paradigm in a Social Psychological Context. Environ. Behav. 2004, 36, 157–186. [Google Scholar] [CrossRef]
- Home-Eurostat. Available online: https://ec.europa.eu/eurostat (accessed on 28 August 2021).
- Jahanshahloo, G.R.; Lotfi, F.H.; Izadikhah, M. Extension of the TOPSIS Method for Decision-Making Problems with Fuzzy Data. Appl. Math. Comput. 2006, 181, 1544–1551. [Google Scholar] [CrossRef]
- Nemery, P.; Ishizaka, A. Multi-Criteria Decision Analysis: Methods and Software; Wiley: Chichester, UK, 2013; ISBN 978-1-119-97407-9. [Google Scholar]
- Yoon, K. System Selection by Multiple Attribute Decision Making; Kansas State University: Manhattan, KS, USA, 1980. [Google Scholar]
- Hwang, C.-L.; Yoon, K. Multiple Attribute Decision Making: Methods and Applications A State-of-the-Art Survey; Lecture Notes in Economics and Mathematical Systems; Springer: Berlin/Heidelberg, Germany, 1981; ISBN 978-3-540-10558-9. [Google Scholar]
- Jahanshahloo, G.R.; Lotfi, F.H.; Izadikhah, M. An Algorithmic Method to Extend TOPSIS for Decision-Making Problems with Interval Data. Appl. Math. Comput. 2006, 175, 1375–1384. [Google Scholar] [CrossRef]
- Chen, S.-J.; Hwang, C.-L. Fuzzy Multiple Attribute Decision Making: Methods and Applications; Lecture Notes in Economics and Mathematical Systems; Springer: Berlin/Heidelberg, Germany, 1992; ISBN 978-3-540-54998-7. [Google Scholar]
- Ban, A.I.; Ban, O.I.; Bogdan, V.; Popa, D.C.S.; Tuse, D. Performance Evaluation Model of Romanian Manufacturing Listed Companies by Fuzzy AHP and TOPSIS. Technol. Econ. Dev. Econ. 2020, 26, 808–836. [Google Scholar] [CrossRef]
- Wysocki, F.; Lira, J. Statystyka Opisowa; Wydawnictwo Akademii Rolniczej Imienia Augusta Cieszkowskiego: Poznań, Poland, 2003; ISBN 83-7160-304-5. [Google Scholar]
- De Winter, J.C.F.; Gosling, S.D.; Potter, J. Comparing the Pearson and Spearman Correlation Coefficients across Distributions and Sample Sizes: A Tutorial Using Simulations and Empirical Data. Psychol Methods 2016, 21, 273–290. [Google Scholar] [CrossRef]
- Klepacki, B.; Kusto, B.; Bórawski, P.; Bełdycka-Bórawska, A.; Michalski, K.; Perkowska, A.; Rokicki, T. Investments in Renewable Energy Sources in Basic Units of Local Government in Rural Areas. Energies 2021, 14, 3170. [Google Scholar] [CrossRef]
- Spearman, C. The Proof and Measurement of Association between Two Things. Am. J. Psychol. 1904, 15, 72–101. [Google Scholar] [CrossRef]
- Understanding Waste Management: Policy Challenges and Opportunities—Think Tank. Available online: https://www.europarl.europa.eu/thinktank/ro/document.html?reference=EPRS_BRI(2015)559493 (accessed on 3 September 2021).
- Waste Management—European Environment Agency. Available online: https://www.eea.europa.eu/themes/waste/waste-management (accessed on 28 August 2021).
- Wang, Y.; Hao, F.; Liu, Y. Pro-Environmental Behavior in an Aging World: Evidence from 31 Countries. Int. J. Environ. Res. Public Health 2021, 18, 1748. [Google Scholar] [CrossRef]
- Fielding, K.S.; Head, B.W. Determinants of Young Australians’ Environmental Actions: The Role of Responsibility Attributions, Locus of Control, Knowledge and Attitudes. Environ. Educ. Res. 2012, 18, 171–186. [Google Scholar] [CrossRef]
- Hoornweg, D.; Bhada-Tata, P. What a Waste: A Global Review of Solid Waste Management. Urban Dev. Ser. Knowl. Pap. 2012, 15, 87–88. [Google Scholar]
- Ferrara, I.; Missios, P. Recycling and Waste Diversion Effectiveness: Evidence from Canada. Environ. Resour. Econ. 2005, 30, 221–238. [Google Scholar] [CrossRef]
- Debrah, J.K.; Vidal, D.G.; Dinis, M.A.P. Raising Awareness on Solid Waste Management through Formal Education for Sustainability: A Developing Countries Evidence Review. Recycling 2021, 6, 6. [Google Scholar] [CrossRef]
- Carducci, A.; Fiore, M.; Azara, A.; Bonaccorsi, G.; Bortoletto, M.; Caggiano, G.; Calamusa, A.; de Donno, A.; de Giglio, O.; Dettori, M.; et al. Pro-Environmental Behaviors: Determinants and Obstacles among Italian University Students. Int. J. Environ. Res. Public Health 2021, 18, 3306. [Google Scholar] [CrossRef] [PubMed]
- Poškus, M.S. Personality and Pro-Environmental Behaviour. J. Epidemiol. Community Health 2018, 72, 969–970. [Google Scholar] [CrossRef] [PubMed]

| Variable Symbol | The Name of the Variable |
|---|---|
| x1 | Final energy consumption in households per capita |
| x2 | Generation of municipal waste per capita |
| x3 | Population connected to at least secondary wastewater treatment (in %) |
| x4 | Share of busses and trains in total passenger transport (in %) |
| x5 | Recycling rate of municipal waste (in %) |
| x6 | Renewable energy sources in heating and cooling (in %) |
| Diagnostic Variables | x1 | x2 | x4 | x5 | x6 |
|---|---|---|---|---|---|
| x1 | 1.000 | ||||
| x2 | 0.211 | 1.000 | |||
| x4 | 0.178 | −0.168 | 1.000 | ||
| x5 | 0.541 | 0.237 | −0.175 | 1.000 | |
| x6 | 0.367 | −0.047 | −0.253 | −0.175 | 1.000 |
| Variable Symbol | The Name of the Variable | Definition | Character 1 |
|---|---|---|---|
| Renewable energy sources in heating and cooling | The share of renewable energy in the total energy used for heating and cooling in households, industry, hospitals, schools, etc.—in % | S | |
| Share of busses and trains in total passenger transport | The share of collective transport means in the total land work of passenger transport—in %. Mass transport refers to buses, including coaches, trolleybuses, and trains. | S | |
| Recycling rate of municipal waste | Share of recycled municipal waste in total municipal waste generation—in%. Recycling includes material recycling, composting, and anaerobic digestion. | S |
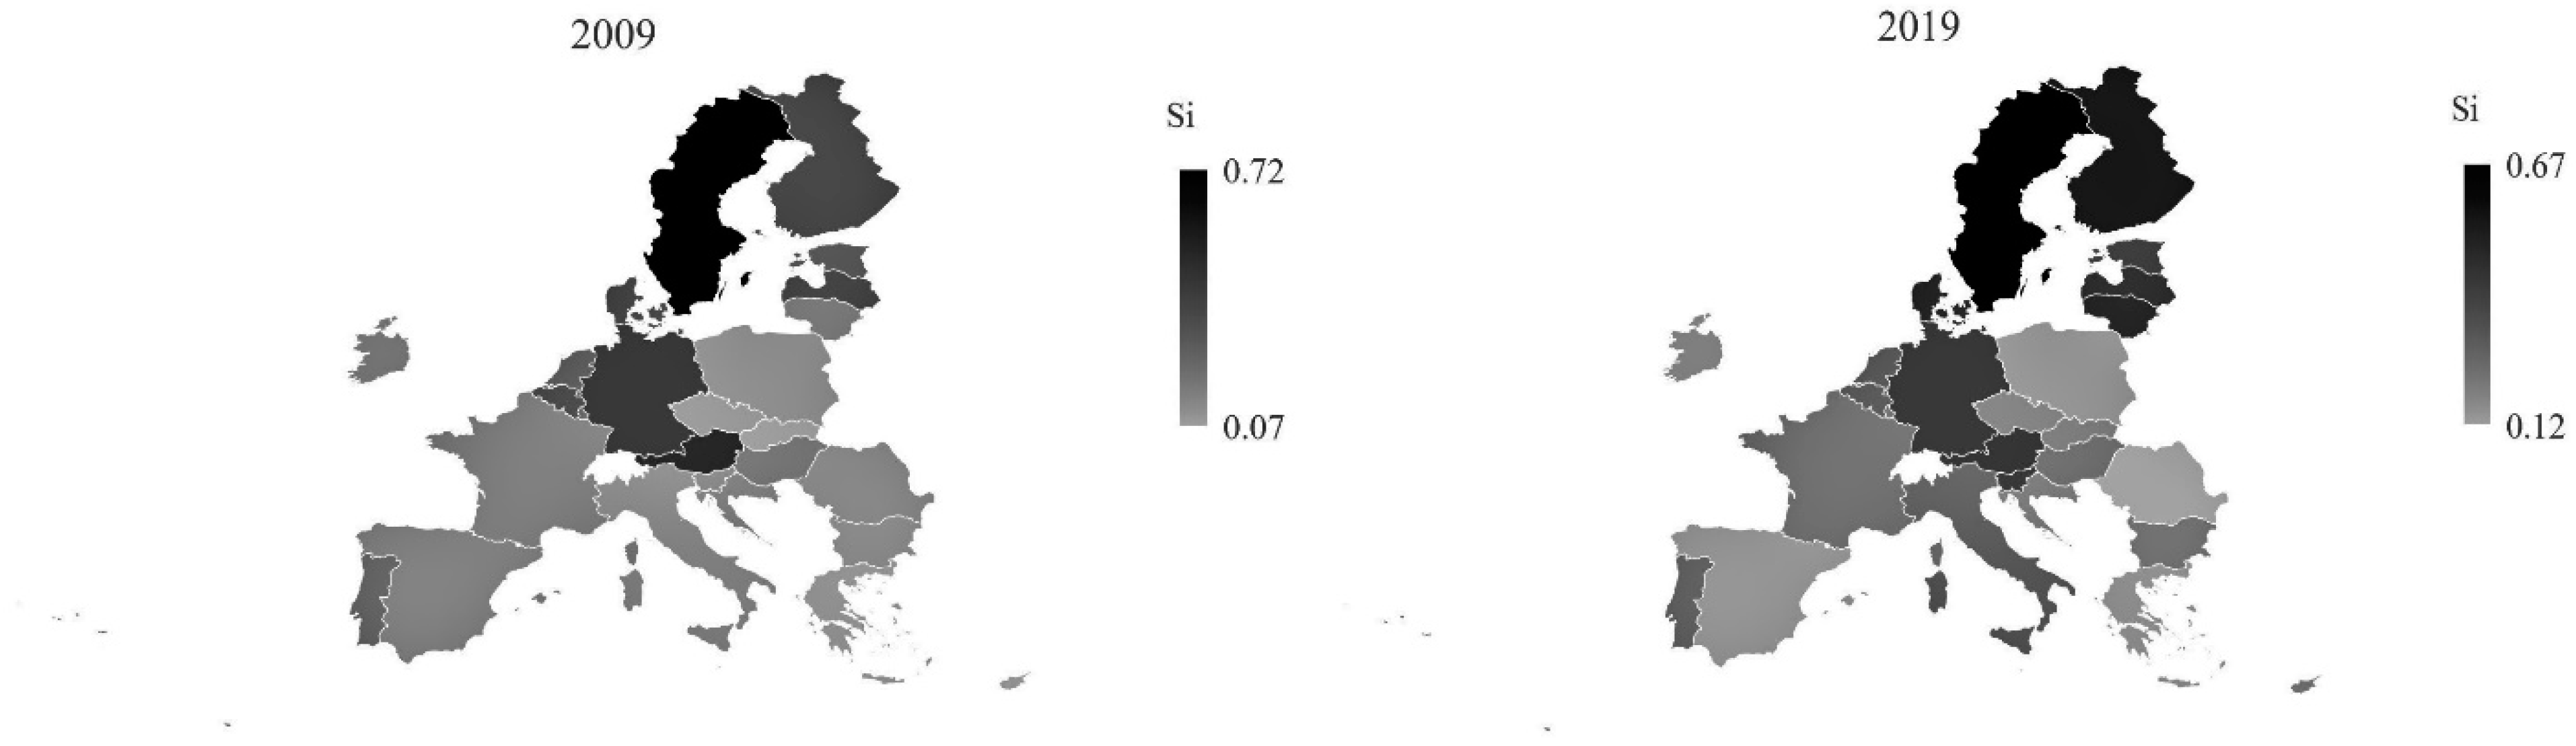
| 2009 | 2019 | |||||||
|---|---|---|---|---|---|---|---|---|
| Rank | Country | The Value of the Synthetic Indicator (Si) | Typological Group | Rank | Country | The value of the Synthetic Indicator (Si) | Typological Group | Change in Rank |
| 1 | Sweden | 0.718 | I | 1 | Sweden | 0.673 | I | unchanged |
| 2 | Austria | 0.531 | 2 | Finland | 0.566 | ↑2 | ||
| 3 | Germany | 0.468 | 3 | Denmark | 0.517 | ↑2 | ||
| 4 | Finland | 0.412 | II | 4 | Lithuania | 0.514 | ↑9 | |
| 5 | Denmark | 0.406 | 5 | Latvia | 0.487 | ↑1 | ||
| 6 | Latvia | 0.395 | 6 | Austria | 0.467 | II | ↓4 | |
| 7 | Belgium | 0.389 | 7 | Germany | 0.458 | ↓4 | ||
| 8 | Estonia | 0.337 | 8 | Slovenia | 0.447 | ↑10 | ||
| 9 | Netherlands | 0.328 | 9 | Estonia | 0.437 | ↓1 | ||
| 10 | Luxembourg | 0.302 | 10 | Netherlands | 0.352 | ↓1 | ||
| 11 | Portugal | 0.275 | 11 | Belgium | 0.345 | ↓4 | ||
| 12 | Hungary | 0.226 | III | 12 | Italy | 0.316 | III | ↑7 |
| 13 | Lithuania | 0.21 | 13 | Portugal | 0.299 | ↓2 | ||
| 14 | France | 0.201 | 14 | Luxembourg | 0.29 | ↓4 | ||
| 15 | Croatia | 0.191 | 15 | Hungary | 0.275 | ↓3 | ||
| 16 | Spain | 0.189 | 16 | France | 0.274 | ↓2 | ||
| 17 | Ireland | 0.183 | 17 | Bulgaria | 0.245 | ↑5 | ||
| 18 | Slovenia | 0.176 | 18 | Slovakia | 0.242 | ↑6 | ||
| 19 | Italy | 0.162 | 19 | Croatia | 0.237 | ↓4 | ||
| 20 | Romania | 0.159 | 20 | Czechia | 0.233 | ↑3 | ||
| 21 | Poland | 0.153 | 21 | Cyprus | 0.213 | ↑5 | ||
| 22 | Bulgaria | 0.148 | 22 | Ireland | 0.187 | ↓5 | ||
| 23 | Czechia | 0.14 | 23 | Poland | 0.178 | IV | ↓2 | |
| 24 | Slovakia | 0.116 | 24 | Spain | 0.168 | ↓8 | ||
| 25 | Greece | 0.11 | IV | 25 | Greece | 0.166 | unchanged | |
| 26 | Cyprus | 0.09 | 26 | Romania | 0.136 | ↓6 | ||
| 27 | Malta | 0.072 | 27 | Malta | 0.122 | unchanged | ||
| Typological Group | Descriptive Statistics | 2009 | 2019 | ||||
|---|---|---|---|---|---|---|---|
| Renewable Energy Sources in Heating and Cooling | Share of Busses and Trains in Total Passenger Transport | Recycling Rate Of Municipal Waste | Renewable Energy Sources in Heating and Cooling | Share of Busses and Trains in Total Passenger Transport | Recycling Rate of Municipal Waste | ||
| I | Average | 33.78 | 16.60 | 58.07 | 55.35 | 15.50 | 43.14 |
| Maximum | 60.57 | 20.30 | 63.10 | 66.12 | 18.00 | 52.50 | |
| Minimum | 11.16 | 14.00 | 49.20 | 47.36 | 9.60 | 25.20 | |
| Standard deviation | 20.39 | 2.69 | 6.29 | 6.98 | 3.03 | 9.62 | |
| Coefficient of variation | 60.35 | 16.19 | 10.83 | 12.62 | 19.57 | 22.30 | |
| II | Average | 26.74 | 16.59 | 35.26 | 22.88 | 16.12 | 52.86 |
| Maximum | 47.89 | 20.50 | 53.90 | 52.28 | 22.90 | 67.10 | |
| Minimum | 3.37 | 10.60 | 7.70 | 7.08 | 13.60 | 28.00 | |
| Standard deviation | 17.80 | 3.43 | 16.02 | 16.23 | 3.30 | 12.17 | |
| Coefficient of variation | 66.56 | 20.65 | 45.44 | 70.96 | 20.48 | 23.02 | |
| III | Average | 18.62 | 19.12 | 17.87 | 24.25 | 19.29 | 35.44 |
| Maximum | 33.72 | 30.90 | 35.30 | 41.65 | 29.40 | 49.80 | |
| Minimum | 4.19 | 7.70 | 1.10 | 6.32 | 11.60 | 16.50 | |
| Standard deviation | 8.76 | 5.61 | 11.41 | 11.09 | 5.39 | 9.63 | |
| Coefficient of variation | 47.06 | 29.36 | 63.86 | 45.73 | 27.94 | 27.18 | |
| IV | Average | 12.19 | 17.93 | 10.30 | 23.29 | 18.06 | 21.96 |
| Maximum | 17.32 | 18.10 | 18.90 | 30.19 | 20.70 | 34.80 | |
| Minimum | 2.01 | 17.60 | 3.70 | 15.98 | 15.10 | 10.00 | |
| Standard deviation | 7.20 | 0.24 | 6.36 | 5.15 | 1.97 | 10.67 | |
| Coefficient of variation | 59.05 | 1.31 | 61.79 | 22.09 | 10.88 | 48.60 | |
| Variable | rS | p-Value |
|---|---|---|
| Demographic variables | ||
| Proportion of population aged 0–14 years | 0.208 | 0.297 |
| Proportion of population aged 15–24 years | 0.081 | 0.689 |
| Proportion of population aged 25–49 years | −0.606 | 0.001 |
| Proportion of population aged 50–64 years | 0.370 | 0.057 |
| Proportion of population aged 65 and over | 0.345 | 0.078 |
| The share of households with dependent children in total households | −0.657 | 0.000 |
| Total fertility rate | 0.266 | 0.180 |
| Women per 100 men | −0.065 | 0.747 |
| Economic variables | ||
| Adjusted gross disposable income of households per capita in PPS | 0.385 | 0.057 |
| GDP per capita in PPS | 0.366 | 0.060 |
| The share of people at risk of poverty or social exclusion | −0.326 | 0.097 |
| Education-related variables | ||
| At least upper secondary educational attainment, age group 25–64 (the share) | 0.387 | 0.046 |
| Early leavers from education and training | −0.179 | 0.327 |
| Students in tertiary education—as % of 20–24 years old in the population | 0.005 | 0.979 |
Publisher’s Note: MDPI stays neutral with regard to jurisdictional claims in published maps and institutional affiliations. |
© 2021 by the authors. Licensee MDPI, Basel, Switzerland. This article is an open access article distributed under the terms and conditions of the Creative Commons Attribution (CC BY) license (https://creativecommons.org/licenses/by/4.0/).
Share and Cite
Mikuła, A.; Raczkowska, M.; Utzig, M. Pro-Environmental Behaviour in the European Union Countries. Energies 2021, 14, 5689. https://doi.org/10.3390/en14185689
Mikuła A, Raczkowska M, Utzig M. Pro-Environmental Behaviour in the European Union Countries. Energies. 2021; 14(18):5689. https://doi.org/10.3390/en14185689
Chicago/Turabian StyleMikuła, Aneta, Małgorzata Raczkowska, and Monika Utzig. 2021. "Pro-Environmental Behaviour in the European Union Countries" Energies 14, no. 18: 5689. https://doi.org/10.3390/en14185689
APA StyleMikuła, A., Raczkowska, M., & Utzig, M. (2021). Pro-Environmental Behaviour in the European Union Countries. Energies, 14(18), 5689. https://doi.org/10.3390/en14185689