Article

The Impact of Incentives on Employees to Change Thermostat Settings—A Field Study

by
Mariola E. Zalewska
Faculty of Management, University of Warsaw, ul. Szturmowa 1/3, 02-678 Warszawa, Poland
Energies 2021, 14(17), 5315; https://doi.org/10.3390/en14175315
Submission received: 16 July 2021 / Revised: 23 August 2021 / Accepted: 24 August 2021 / Published: 27 August 2021
(This article belongs to the Special Issue Analysis of Pro-ecological Behavior of Consumers)

Abstract

:
When looking for energy-saving solutions, one should bear in mind the savings that can be obtained through behavioral changes. The article shows that a simple incentive can have a statistically significant impact on employees’ pro-ecological behavior. First, the introduction refers to the general perspective of striving for a global implementation of the Sustainable Developments Goals (SDGs). Additionally, the stakeholders’ point of view is presented, based on reports submitted to the Responsible Business Forum competition (Poland). The two motivating trends are referenced, which include increasing the contribution of powering office buildings to the overall energy demand and increasing the appreciation of behavioral changes as alternatives or complements to technological solutions in pursuit of the SDGs. The following sections of the article present an experiment carried out at one faculty of the University of Warsaw, which consisted of checking the effect of the incentive to lower the temperature in offices after working hours on the actual change in the behavior of the employees. After several weeks of observation of end-of-day thermostat settings in several dozen offices, a statistically significant effect was found. This proves that even simple incentives can lead to pro-ecological behavioral changes.

1. Introduction

In September 2019, the Heads of State and Government at the SDG Summit renewed their determination to implement the 2030 Agenda for Sustainable Development. It was recognized that the implementation of the SDGs (Sustainable Development Goals) had seen some significant progress, but, overall, the world was not on track to attain the SDGs by 2030 [1].
Humanity is facing several global environmental challenges, such as the depletion of non-renewable natural resources, biodiversity loss, climate change, and changing lifestyles [2,3]. Kates [4] pointed out that sustainability research itself should be focused on the ability to guide nature–society interactions along sustainable trajectories, as well as on methods to promote the social learning that is necessary to move toward sustainability. Individuals and organizations alike should work towards behavioral changes and engage in mutual social learning.

1.1. Sustainable Trends in Organizational Behavior

The results of the research [5,6,7] show that stakeholders expect organizations to provide products and services while reducing the impact of their activities and behavior on the environment, and to not only declare their intentions but also take actions to protect the environment and its resources by way of introducing mitigating actions to reduce environmental impacts and threats. Many organizations have taken action on sustainability and report their reasons for doing so and the extent to which they have integrated sustainability into their operations.
Based on the analysis of the Sustainable Development or CSR reports submitted to the Social Reports Competition organized by the Responsible Business Forum in Poland [8], five main trends in behavioral changes and actions taken by organizations and their stakeholders can be distinguished.
Trend 1: “We save resources.” Justifying this as care for the environment, organizations implement mechanisms to, for example, save heat, electricity, water, electro-waste, and paper consumption, to separate waste collection, to digitize their handling processes, and to make use of a resources audit.
Trend 2: “We do not serve these customers.” Insurance companies withdraw from policies, for example, for coal-fired power plants, giving up capital involvement in polluting projects. Companies state that they no longer buy from these suppliers.
Trend 3: “We live in harmony with nature.” Companies install hives on the roofs of their buildings, forgo the use of plastic bottles in social rooms, encourage resource conservation in the workplace and at home (including water and energy), install composters and bicycle racks, and encourage car sharing.
Trend 4: “Promote sustainability in the workplace.” Organizations remind everyone in the workplace and explain why sustainability is important and how everyone can benefit from it. Becoming a pro-environmental company demonstrably improves its reputation and has positive effects on the organization’s image and brand.
Trend 5: “We are SD leaders.” Companies actively create rules or regulations to implement the SDGs within the organization’s environment.
These activities are undertaken by organizations independently and there is no time sequence between them.

1.2. Growing Energy Demand

One of the key factors in enabling development is to ensure access to affordable, reliable, sustainable, and modern energy for all (SDG 7). The world is making good progress on increasing access to electricity and improving energy efficiency, but progress on access to clean cooking fuels and technologies and improving energy efficiency is too slow [1].
When analyzing the global situation, it is apparent that increasing global energy consumption results in problems related to the ever-growing energy demand, energy distribution and sharing, natural resource depletion, and environmental impacts [9]. The International Energy Agency publishes data on energy trends that show that total energy demand is growing and will continue to grow. An increase of about 28% worldwide is expected by the year 2040 [10]. The structure of energy consumption is changing. Residential and commercial energy demand is increasing and, for years, has amounted to about 20 to 40% in developed countries [9,11] and about 20% worldwide [10]. As the amount of time spent in office buildings increases, the need for work comfort increases as well. Growing energy demand in office buildings makes them significant consumers of energy and, therefore, producers of carbon dioxide (CO2). For example, U.S. commercial buildings increased their share of total U.S. energy consumption from 13.5% in 1980 to 18.6% in 2010 [12]. According to the recent review [13], the building and construction sectors account for more than one-third of global final energy consumption and almost 40% of total direct and indirect CO2 emissions. Improving energy efficiency at every level (from global to individual) is widely recognized as a key element of sustainable development, with a view to increasing energy security as well as economic sustainability. However, efforts to encourage the sustainable use of resources or a reduction in use do not lead to significant achievements, and energy consumption continues to increase.
One of the most important components of energy consumption related to buildings is the need to ensure the thermal comfort of users. It is well established [14] that the internal temperature corresponding to the feeling of thermal comfort depends on the external temperature and habits specific to a given area.
On the other hand, the energy consumption itself can be significantly reduced by the temperature settings and appropriate construction of the building. Change of internal temperature setting by a centigrade alters energy consumption by about 10% [14,15].

1.3. Emerging Importance of Human Behavior as Energy Saving Factor

In general, two approaches can be taken. The first is to obtain energy savings through investments in energy-efficient technologies. It is reasonable to seek such approaches that can be integrated into management systems, but the outcomes depend on the willingness to undertake appropriate efforts and financial abilities. Technological innovation and improvement have long been at the center of policies and approaches to improving the energy performance and reducing the energy consumption of buildings, but technology alone will not achieve their energy-saving goals. People and their energy behaviors in buildings must be included in the research and measures to improve energy efficiency [16]. This leads to the second approach, by which energy saving in office buildings is obtained through changes in the individual behaviors of employees. This second approach enables energy consumption and greenhouse gas emissions to be reduced immediately, without incurring the significant financial costs that are necessary for technological improvements. Previous studies have shown that there is a potential for increasing consumer energy efficiency, but such behavioral changes are not straightforward [17]. Nowadays, most researchers agree that employee behavior plays an increasingly important role in energy use in the workplace, and that by changing user behavior, building energy performance can be improved [18,19]. To analyze the dynamics of the changes in interest in the research relating to behavior and technology, a simple search was carried out in the series of reports from the International Energy Agency World Energy Outlook in 2016–2020 [10,10,11,12,13,14,15,16,17,18,19,20,21,22,23]. It was found that the root of the word “technology” appears in successive reports 246, 226, 162, 199, and 79 times, whereas the root of the word “behavior” appears 13, 11, 6, 12, and 105 times. Additionally, the phrase “behavior change” or “behavioral changes” appeared 0, 1, 0, 3, and 47 times. This indicates that there are opposing tendencies in the rates of technology and behavior references in the context of energy. It is likely that social sciences, through the research of society–environment interactions, can make a much greater contribution to sustainable development by saving resources and protecting or reducing the impact on the environment than normally supposed [10,11]. Behavioral change induced by various interventions is becoming a promising strategy for reducing energy consumption and carbon emissions in buildings [24]. Research [25] has shown that the “shocking amounts of energy wasted during off hours in commercial buildings” are mainly due to behavior (for example, occupants leaving appliances on at the end of the day or improper control of energy use). In a study [26] based on an extensive literature review, it was estimated that residents’ energy-saving behavior potential amounts to 10–25% for residential buildings and 5–30% for commercial buildings. The report from the same study states that “the role of occupants behavior in the effectiveness of buildings energy efficiency policy is a big research gap”.

1.4. Complexity of the Human Behavior Factor

However, human behavior is one of the most complex phenomena. The accumulated knowledge of human behavior and behavior change in the context of sustainability has been reviewed, for example, in a highly recognized report [2], where an integrated approach, the Comprehensive Action Determination Model (CADM), was successfully examined through an elaborated meta-analysis. In a more recent study [27], emphasis was put on planning successful behavior change programs and, in particular, on behavior change tools, among which information intervention tools were highlighted.
Attempting an experimental approach to various aspects of sustainable development is part of the transition between considering what changes should be made (and why and how to make them) and how to reliably assess the effectiveness of change initiatives [28].

1.5. Towards a Pro-Ecological Behavior Change—An Experimental Approach

Providing information and feedback on energy consumption is seen as an entryway to the sustainable use of energy sources because energy-unaware behavior leads to the use of much more energy than the minimum that can be achieved [29]. According to Shove et al., most energy-consuming behaviors are the result of inconsistent routines and habits and rarely the subject of conscious decision-making; this makes it difficult for people to link specific behavior with energy [30]. Therefore, it is worth remembering that educational institutions have a potentially significant role in terms of promoting energy saving because they not only implement their own activities but they also provide education on this matter. Among the recent works examining both energy efficiency in educational communities and opinions on the ways of promoting it are the studies by [31,32].
However, education does not end with graduation. Providing the correct information in an effective way can lead to the desired behavior change. In particular, it could lead to overcoming the problem that we propose to call the triple invisibility of energy. Energy and its consumption are already regarded as double invisible to householders [33] because they are not aware of where the energy comes from or by what means. For example, electricity is perceived as “a commodity, a social necessity or a strategic material” [34]. In the case of energy use in office buildings, there is an additional—a third—dimension of invisibility. Simply, the one who pays for energy at the workplace is the employer and not the employee. This additionally undermines the link between the use of energy at the workplace and the economic effect of that use. It prevents the usage of any tangible rewards for reducing energy consumption in the office. Such incentives seem to be appropriate for the residential sector, but their expected effectiveness is not always confirmed. For example, in a well-known meta-analysis [35] of 156 field experiments, it was found (via the meta-regression method) that “pecuniary feedback and incentives lead to a relative increase in energy usage rather than induce conservation”. It was concluded that “non-monetary, information-based strategies can be effective at reducing overall energy usage”.
It is often overlooked that employees’ behaviors determine the use and saving of energy in office buildings to a large extent, even though it was indicated to be as significant as technological changes [36]. On the other hand, it was shown that smart building energy management systems outperform the best conventional policy measures [37]. However, technological improvements are rarely possible without significant investments.
As far as the effectiveness of incentives for energy saving is concerned, empirical studies have yielded mixed results. An in-depth summary of behavioral interventions and experiments performed in commercial and residential buildings in the years 2005–2015 can be found in the publication by [38]. From a total of more than a thousand publications found by a keyword search, about a hundred with quantifiable results or assessment of the effectiveness of intervention were selected. The results of almost twenty most relevant studies were presented in detail. The most successful interventions were those in which occupants could confront their attitudes with others. Strategies with untargeted information were less efficient or inefficient. Most interventions pertained to the use of electricity. An increase in energy-saving awareness due to an intervention was usually reported by participants, but the correlation with changes in behavior was weak, if present. In many studies, a weakening of the positive change over time was reported.
In general, it could be concluded that providing appropriate information can lead to energy-efficient behaviors, but such improvements are not guaranteed, nor is their durability. Reviewers [36,38] underline that further energy behavior intervention studies call for an interdisciplinary approach and that the durability of effects is one of the most difficult issues to address. Incoming technological improvements will not only enforce energy effectiveness but also facilitate studies about its behavioral aspects, which cannot be neglected, even in the case of the use of the best possible technology.
Our own keyword search for publications reporting an experiment about thermostat setting, done in the preparation phase, did not result in any scientific paper in which a reaction to incentives for energy saving was experimentally studied. The most similar study was by [39], in which a reaction of employees to changes to the default thermostat settings was studied. However, the tested population was not informed in any way about the study. What was measured was the actual reaction to temperature changes and/or actual thermostat settings during working hours. Our recent literature search showed growing interest in studies of thermostat settings, but mainly in the context of automatized combined air conditioning and heating systems. A good example is the study by [40], in which the measurements were performed using automatized sampled temperature and thermostat setting readouts.

2. Objectives

The objective of the present study was to gain knowledge about the possibility of changing employees′ attitudes regarding energy use for heating after working hours. For this purpose, Energy Saving in the Office (ESO) experiment was designed and carried out, as described in Section 3. The specific objective of the ESO experiment was to obtain an increased number of thermostats with settings reduced by the employees themselves to 2.5 or lower at the end of a working day. Such a setting corresponds to a temperature of about 18 °C.
The most important feature of the experiment was to check whether a statistically significant change could be achieved with a simple incentive.
In contrast to [39,40], the focus of our study was the reaction to incentives to reduce thermostat settings after working hours. These thermostats were to be set manually by office occupants. In our case, automatized readouts were not possible. The settings were weakly related to temperature comfort at work.
One more significant and unique aspect of our study was that we were able to utilize a control group of participants who were not at all informed about the experiment. Thus, we were able to assess the pure cognitive reactions to the incentives.

3. Materials and Methods

3.1. Energy Saving in the Office (ESO)—Experiment Design

The experiment was designed as follows. The experimental data were obtained by regular readouts of thermostat settings in the offices of administrative, research, and teaching staff in the buildings of one faculty. The experiment was carried out in a period of intense heating from 8 December 2016 to 27 February 2017, in a complex of three faculty buildings forming a small campus in Warsaw, Poland (see Figure 1). The readouts were done on working days after working hours (between 4 p.m. and 6 p.m.). In total, 17 measurements were taken.
The adopted research objective pertained to determining whether it is possible, after providing incentives, to change occupants’ behavior, leading to a reduced thermostat setting of the proposed value. Taking all the considerations into account, the ESO experiment was designed, as graphically presented in Scheme 1.
All available offices were randomly [41] assigned to three groups. The first (G1) was the control group, to which no information about the project was delivered. The second (G2) and the third (G3) groups received the first incentive after the fourth readout. This first incentive contained a suggestion to reduce thermostat settings to 2.5 or lower before leaving the office and the information on the room temperature that such a setting corresponds was attached. This and other incentives were in the form of A6 cards placed in a visible place in a given room. The second incentive was delivered after the ninth readout, but only to group G3. This second incentive was in the form of recognition or a reminder, depending on the records taken for a given office. The recognition went to rooms where the thermostat setting was in line with the first incentive. It contained a thank you note and an encouragement to continue. The reminder went to the other rooms of the G3 group. It contained a renewed incentive the same as before. Finally, both the G2 and G3 test groups received information about the end of the main part of the project after the 14th readout. The moments and the recipients of subsequent incentives are marked with the symbols of the scroll in Schema 1.

3.2. Carrying out the ESO Experiment

Graphical representation of the experiment flow is shown in Schema 1. It could be summarized as follows. Seven phases of the experiment were designed and performed:
  • Thermostat readout Nos. 1, 2, 3, and 4;
  • Intervention—The first incentive for energy saving delivered to groups G2 and G3;
  • Thermostat readout Nos. 5, 6, 7, 8, and 9;
  • Intervention—The second incentive for energy saving delivered to group G3 only;
  • Thermostat readout Nos. 10, 11, 12, 13, and 14;
  • Intervention—The information about the end of the main part of the project delivered to groups G2 and G3;
  • Thermostat readout Nos. 15, 16, and 17.
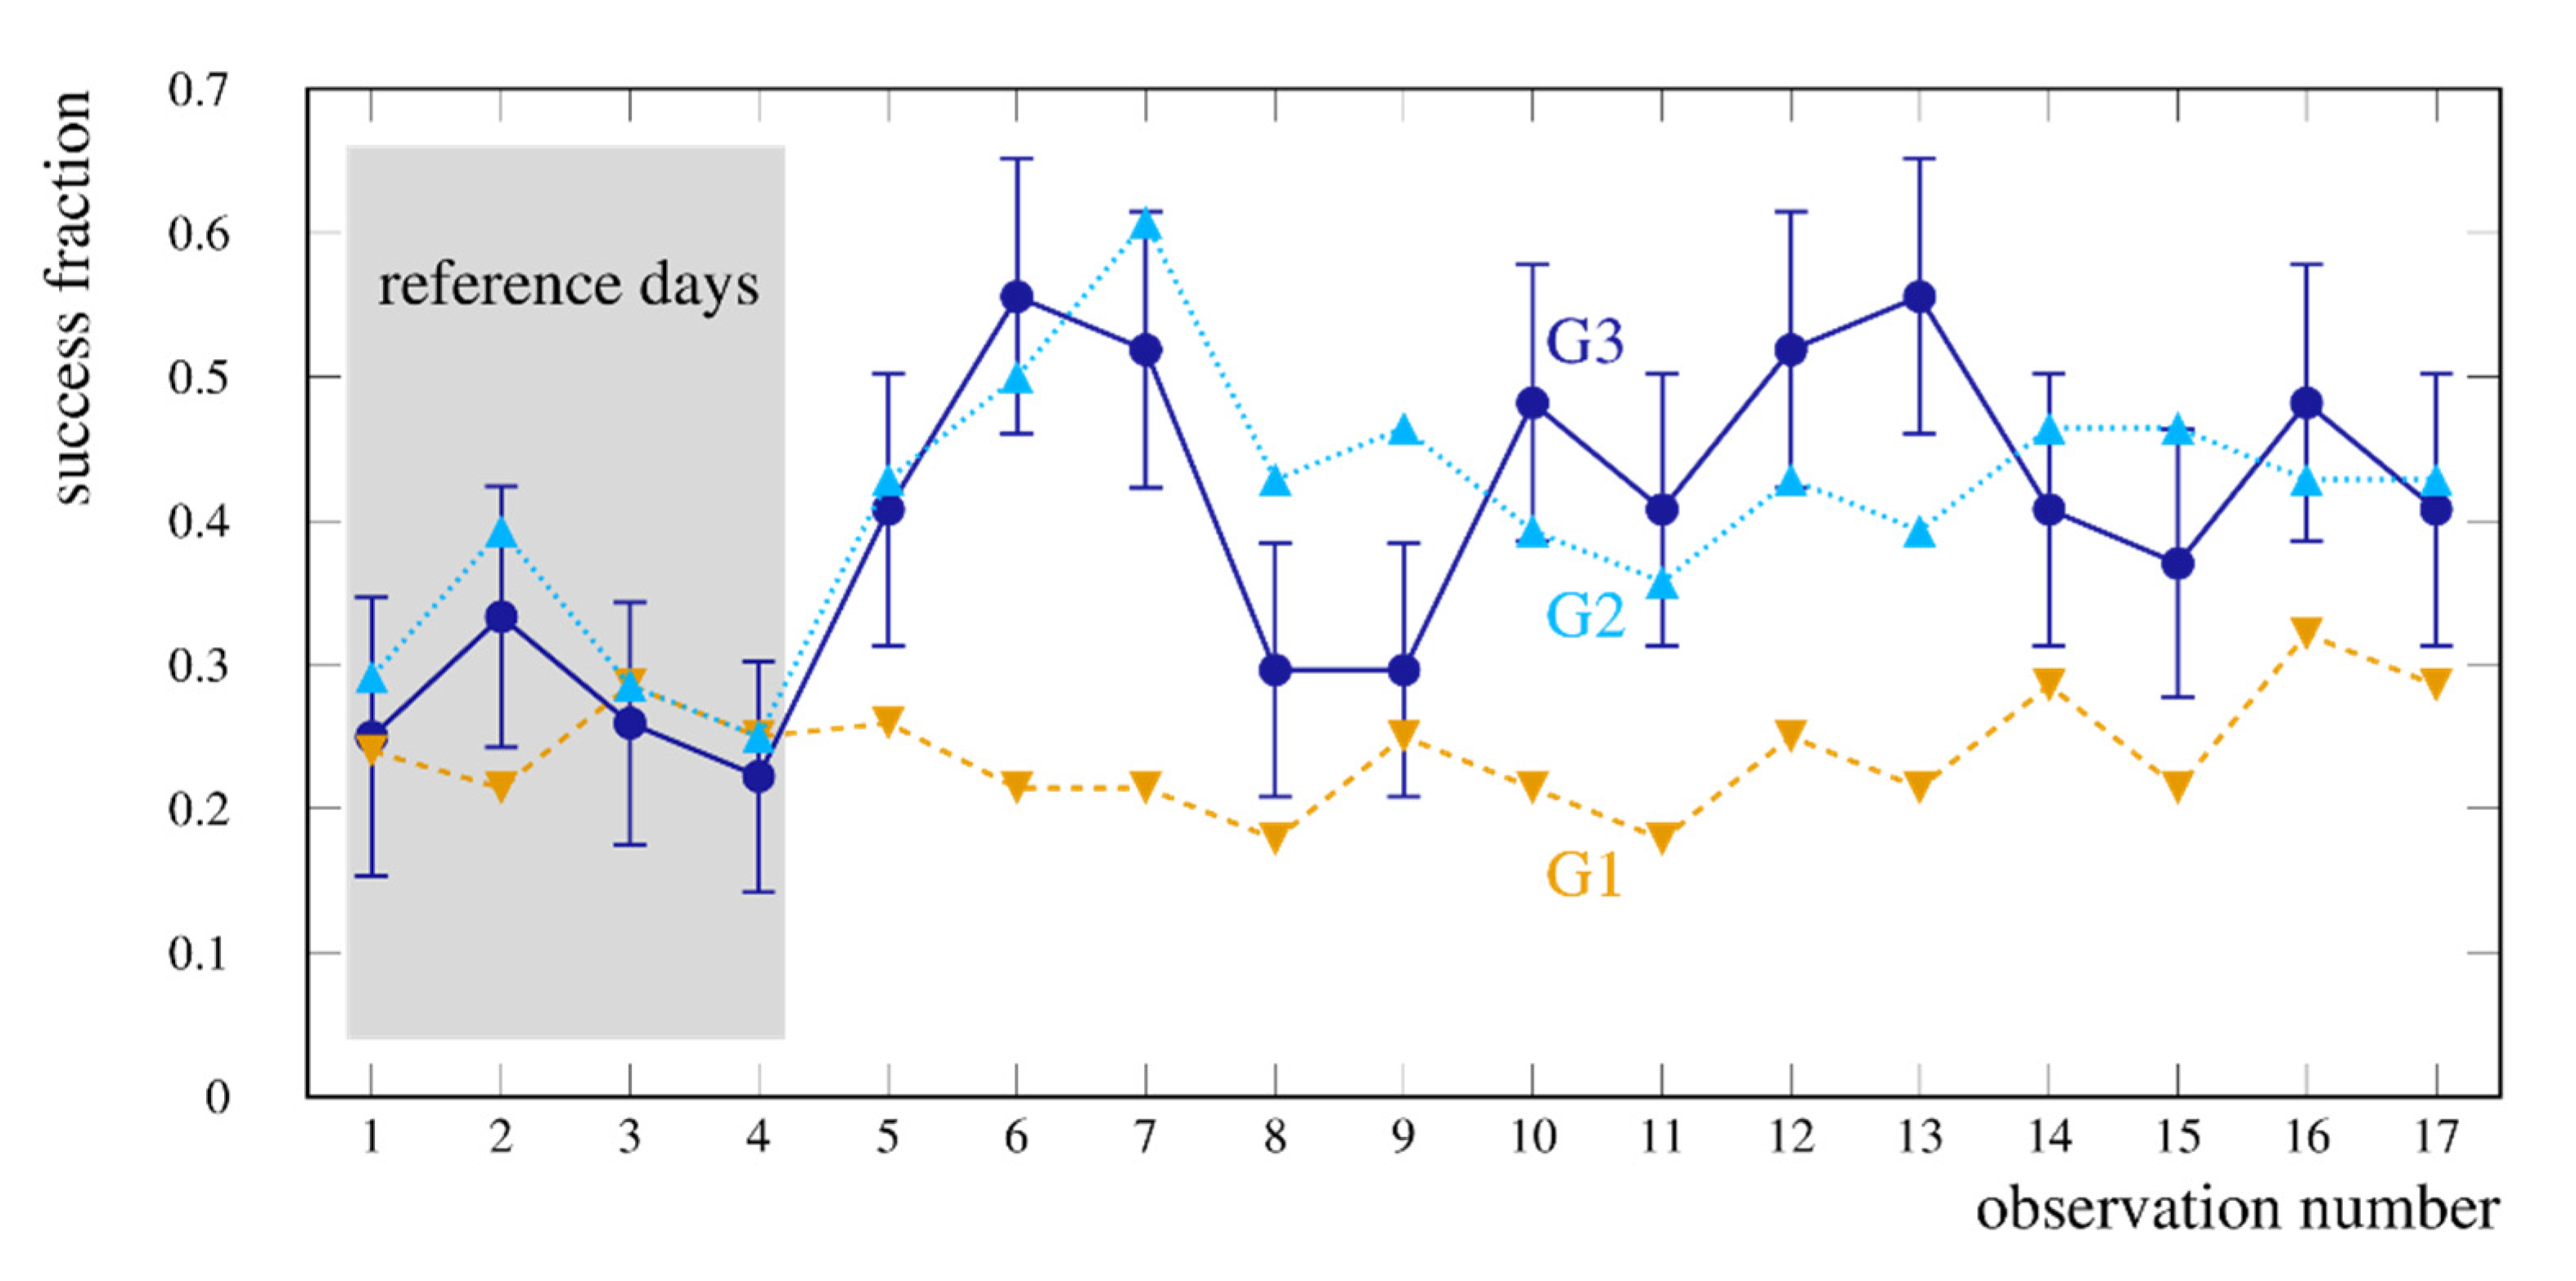
The selection of readout days was subject to the following constraints. Not more than three days per week were to be selected (this was imposed by administrative staff who assisted in opening the offices). Additionally, two longer breaks between measurements were foreseen and used for the purpose of testing the durability of the potential behavioral changes. The first happened between the seventh (2016-12-22) and eighth (2017-01-10) readouts and was prompted by the Christmas/New Year break. The second happened between the 15th (2017-01-24) and the 16th (2017-02-20) readouts and corresponded to the session and the semester break.
Eleven offices were excluded from the study due to thermostat failures, a permanent lack of users, or access problems. The final numbers of offices used in the study were 28, 28, and 27 in groups G1, G2, and G3, respectively. Two research hypotheses were formulated.
RH1: Obtaining information about energy-saving opportunities leads to energy-saving behaviors.
RH2: Employees sustain energy-saving behavior over time.
These research hypotheses were investigated by statistical hypothesis tests of the acquired data, as explained in Section 4

4. Results

The two-dimensional distributions of all collected thermostat setting readouts is shown in Figure 2 for control group G1 and in Figure 3 for combined test groups G2 and G3. The area of each box in a given drawing is proportional to the number of readouts with a given setting for a given observation. In Figure 2, the minimum non-zero number of readouts represented by a single box is 1, and the maximum is 9. In Figure 3, they are 1 and 22, respectively. The thermostats were graduated from 0 (the valve closed) to 5 (maximum opening) with the possibility of setting half values. At maximum and minimum opening, the valves were not temperature sensitive.
A trained eye will notice a change in the pattern in Figure 3 when shifting from observation 4 to 5. Such a change is not seen in Figure 2.
One can also observe a significant fraction of the maximum settings in both figures.
The quantitative analysis of this data is presented in the following sections with the use of a success fraction understood as the part of the settings consistent with the incentive delivered to the test groups.

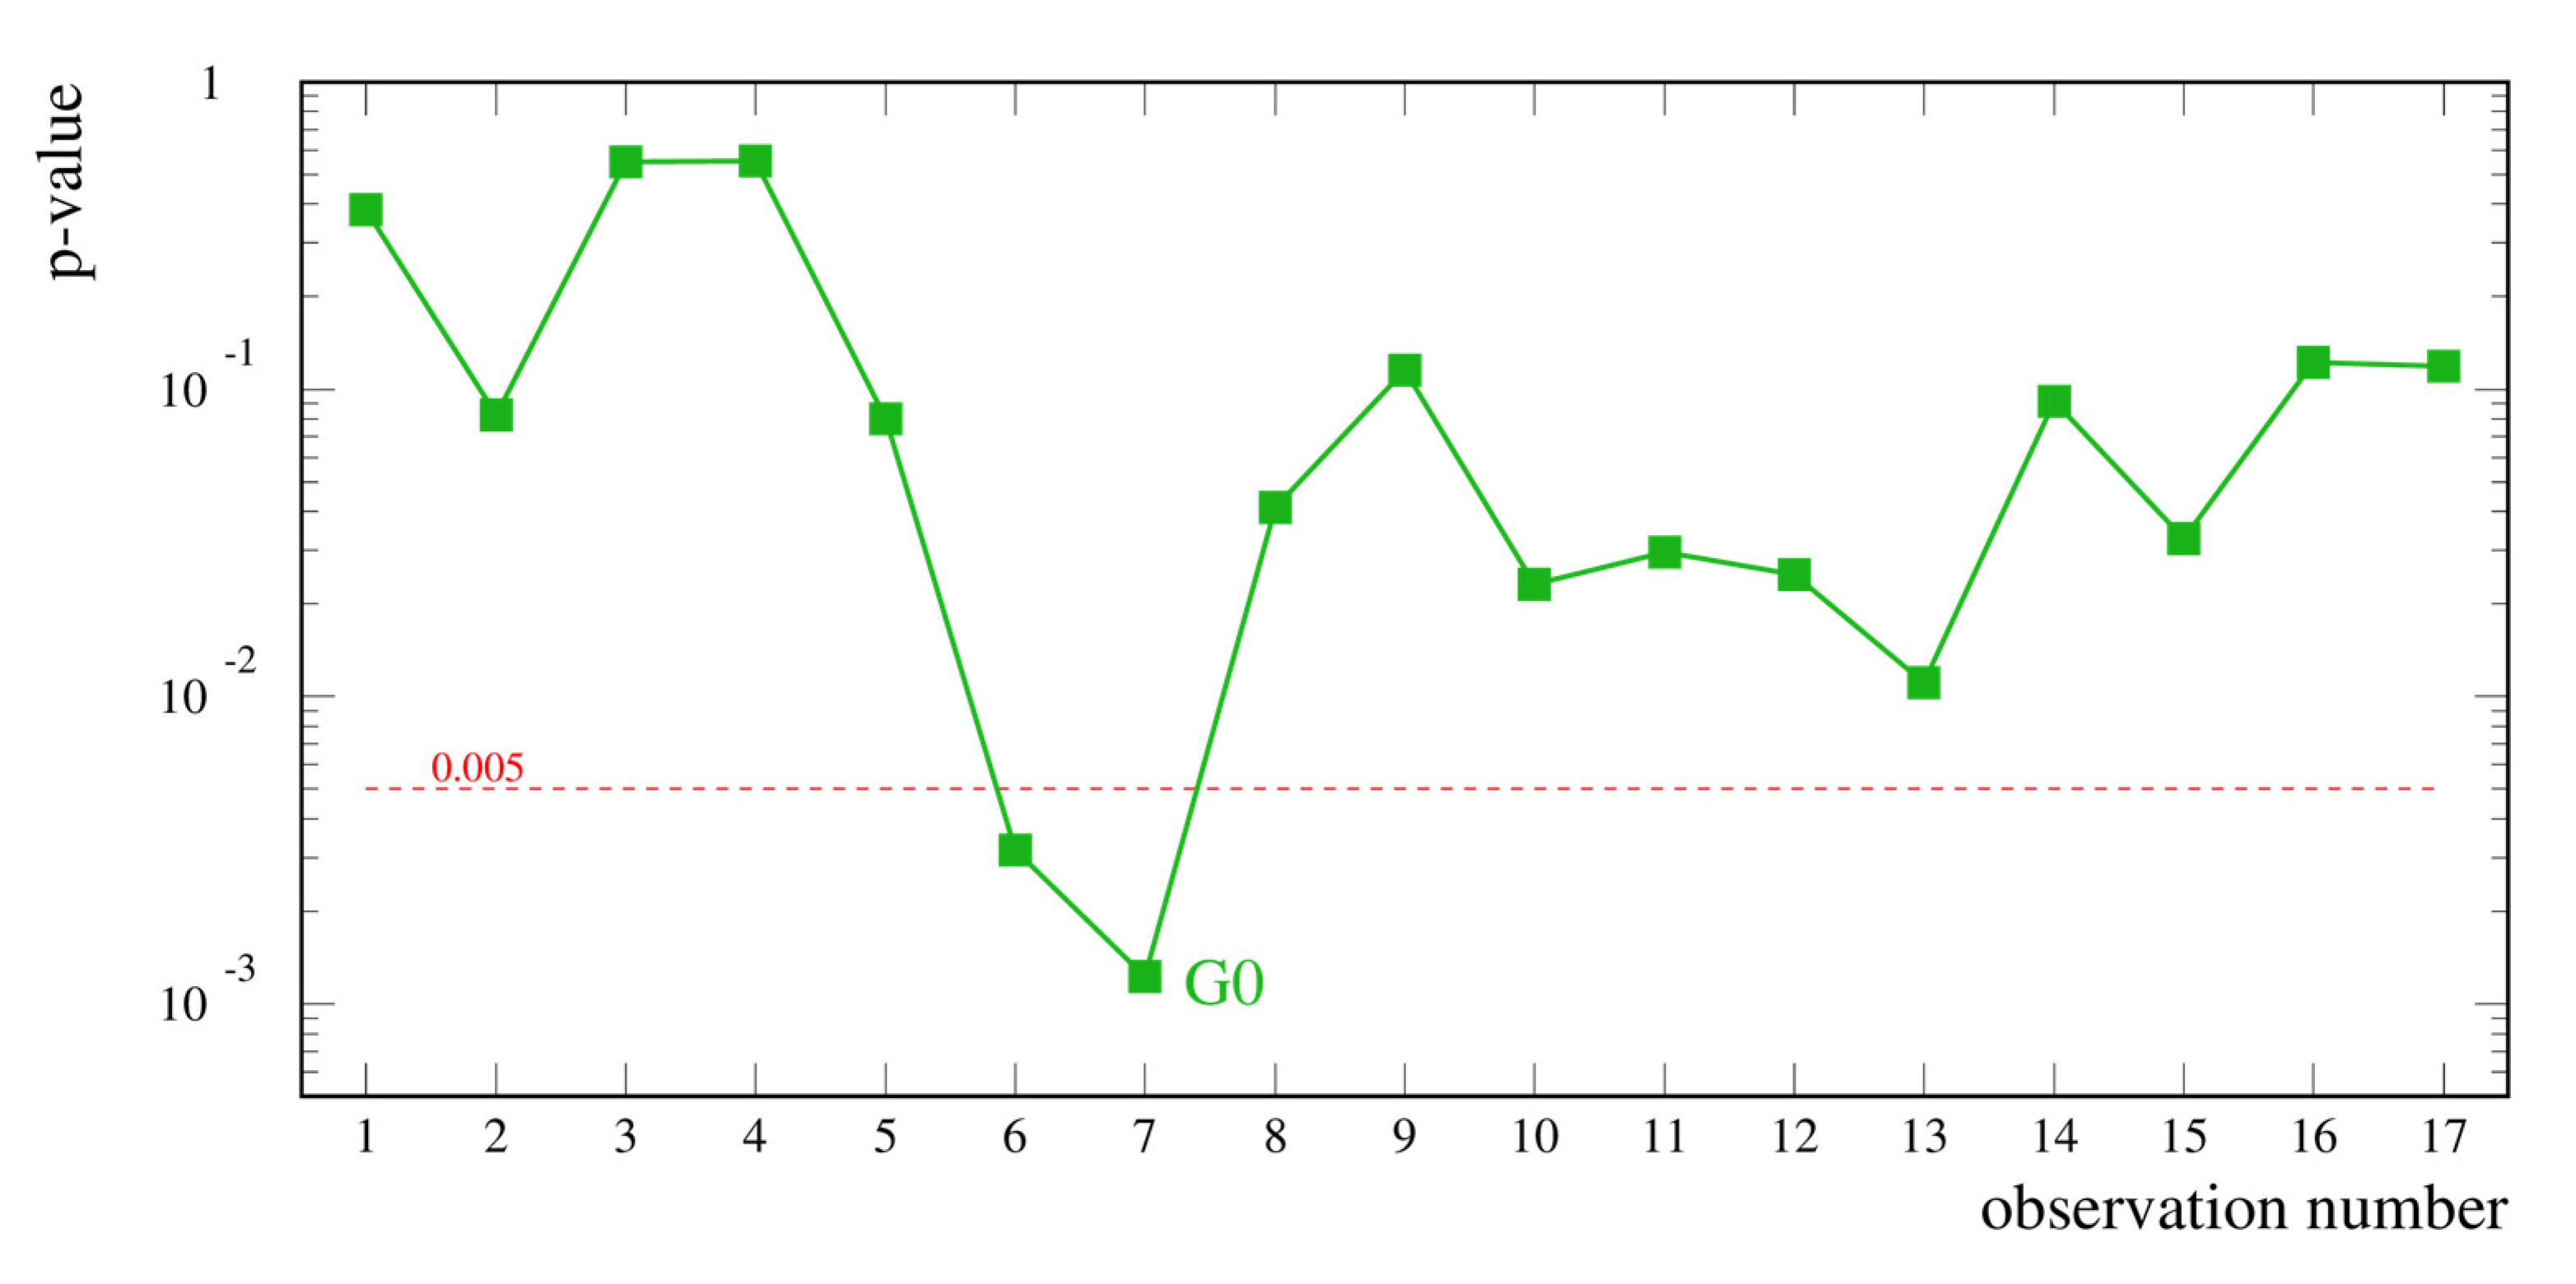
4.1. Statistical Test of the Effect of the First Incentive Delivery

We interpreted the results as outcomes of 3∙17 (3 groups times 17 readouts) independent binomial processes in which success was identified as a thermostat setting of 2.5 or less at the time of the readout, that is, in line with the first incentive.
We began the analysis by studying the effect of the first incentive by putting forward the following statistical hypotheses.
Hypothesis 1a.
There is no difference in the success fractions between the control group G1 and the test group G0, consisting of both the G2 and G3 groups.
Hypothesis 1b.
The success fraction in G0 is higher than in G1.
This allowed the validity of both research hypotheses formulated in Section 3.2 to be verified in regard to an effect of the delivery of the first incentive because these hypotheses could be tested for every day of measurement separately.
The time evolution of the success fractions is presented in Figure 4.
It is easy to spot an increase in the success fraction for G0 starting at the fifth readout, after the delivery of the first incentive. A decline of this success fraction at the eighth readout could be attributed to the Christmas/New Year break, as well as to the significant reduction in external temperature, graph of which is shown in Figure 5.
To test the 1a hypothesis, we used the z-test of the difference of two population proportions [42]. At each observation day t ∊ {1,…, 17} and in each group Gi (i {0,1}), the population comprises ni(t) measurements with ki(t) successes.
The success fraction is defined as pi(t) = ki(t)/ni(t).
The   variable   z ( t ) = p 0 ( t ) p 1 ( t ) p ^ ( t ) ( 1 p ^ ( t ) ) ( 1 n 0 ( t ) + 1 n 1 ( t ) ) ,
where
p ^ ( t ) = ( k 0 ( t ) + k 1 ( t ) ) / ( n 0 ( t ) + n 1 ( t ) )
is the joint success probability and has an approximate standard normal distribution if both binomial processes are identical. Since we expected that the success fraction after incentive delivery would be greater for the test group G0 than for the control group G1 we did a one-tailed test, meaning that the p-value of the 1a hypothesis (the probability that one is wrong, rejecting this hypothesis) is equal to the integral of the standard normal distribution from z(t) to infinity.
The time evolution of the p-value is shown in Figure 6. The level of 0.005 is indicated by the horizontal dashed line. If a point is below the line, the null hypothesis 1a is rejected if the significance of the test is set at 0.005. The p-value goes down as far as a permille level at the seventh readout (the third after the delivery of the first incentive).
It can be concluded that the effect of the delivery of the first incentive is statistically significant, although not instantaneous. This confirms the RH1 hypothesis in regard to the effect of the first incentive. The Christmas/New Year break (in between the seventh and the eighth readouts) nullified the learned energy saving to a considerable extent; however, the test group showed a higher success fraction to the end of the experiment. The p-value oscillates around 0.05 and deteriorates towards the end of the experiment, but it appears that this is mainly due to a slight increase in the success fraction of the control group. It could also be attributed to a diffusion of information to that group, but the population under examination is too small to draw definitive conclusions. From the point of view of the statistical hypothesis test, the second RH2 hypothesis verification was constrained by the small number of offices that were available for the study. The 1a hypothesis cannot be rejected even at the least (reasonable) stringent significance of 10% for 4 out of 12 readouts. The statistical support results of the RH2 hypothesis are too weak.

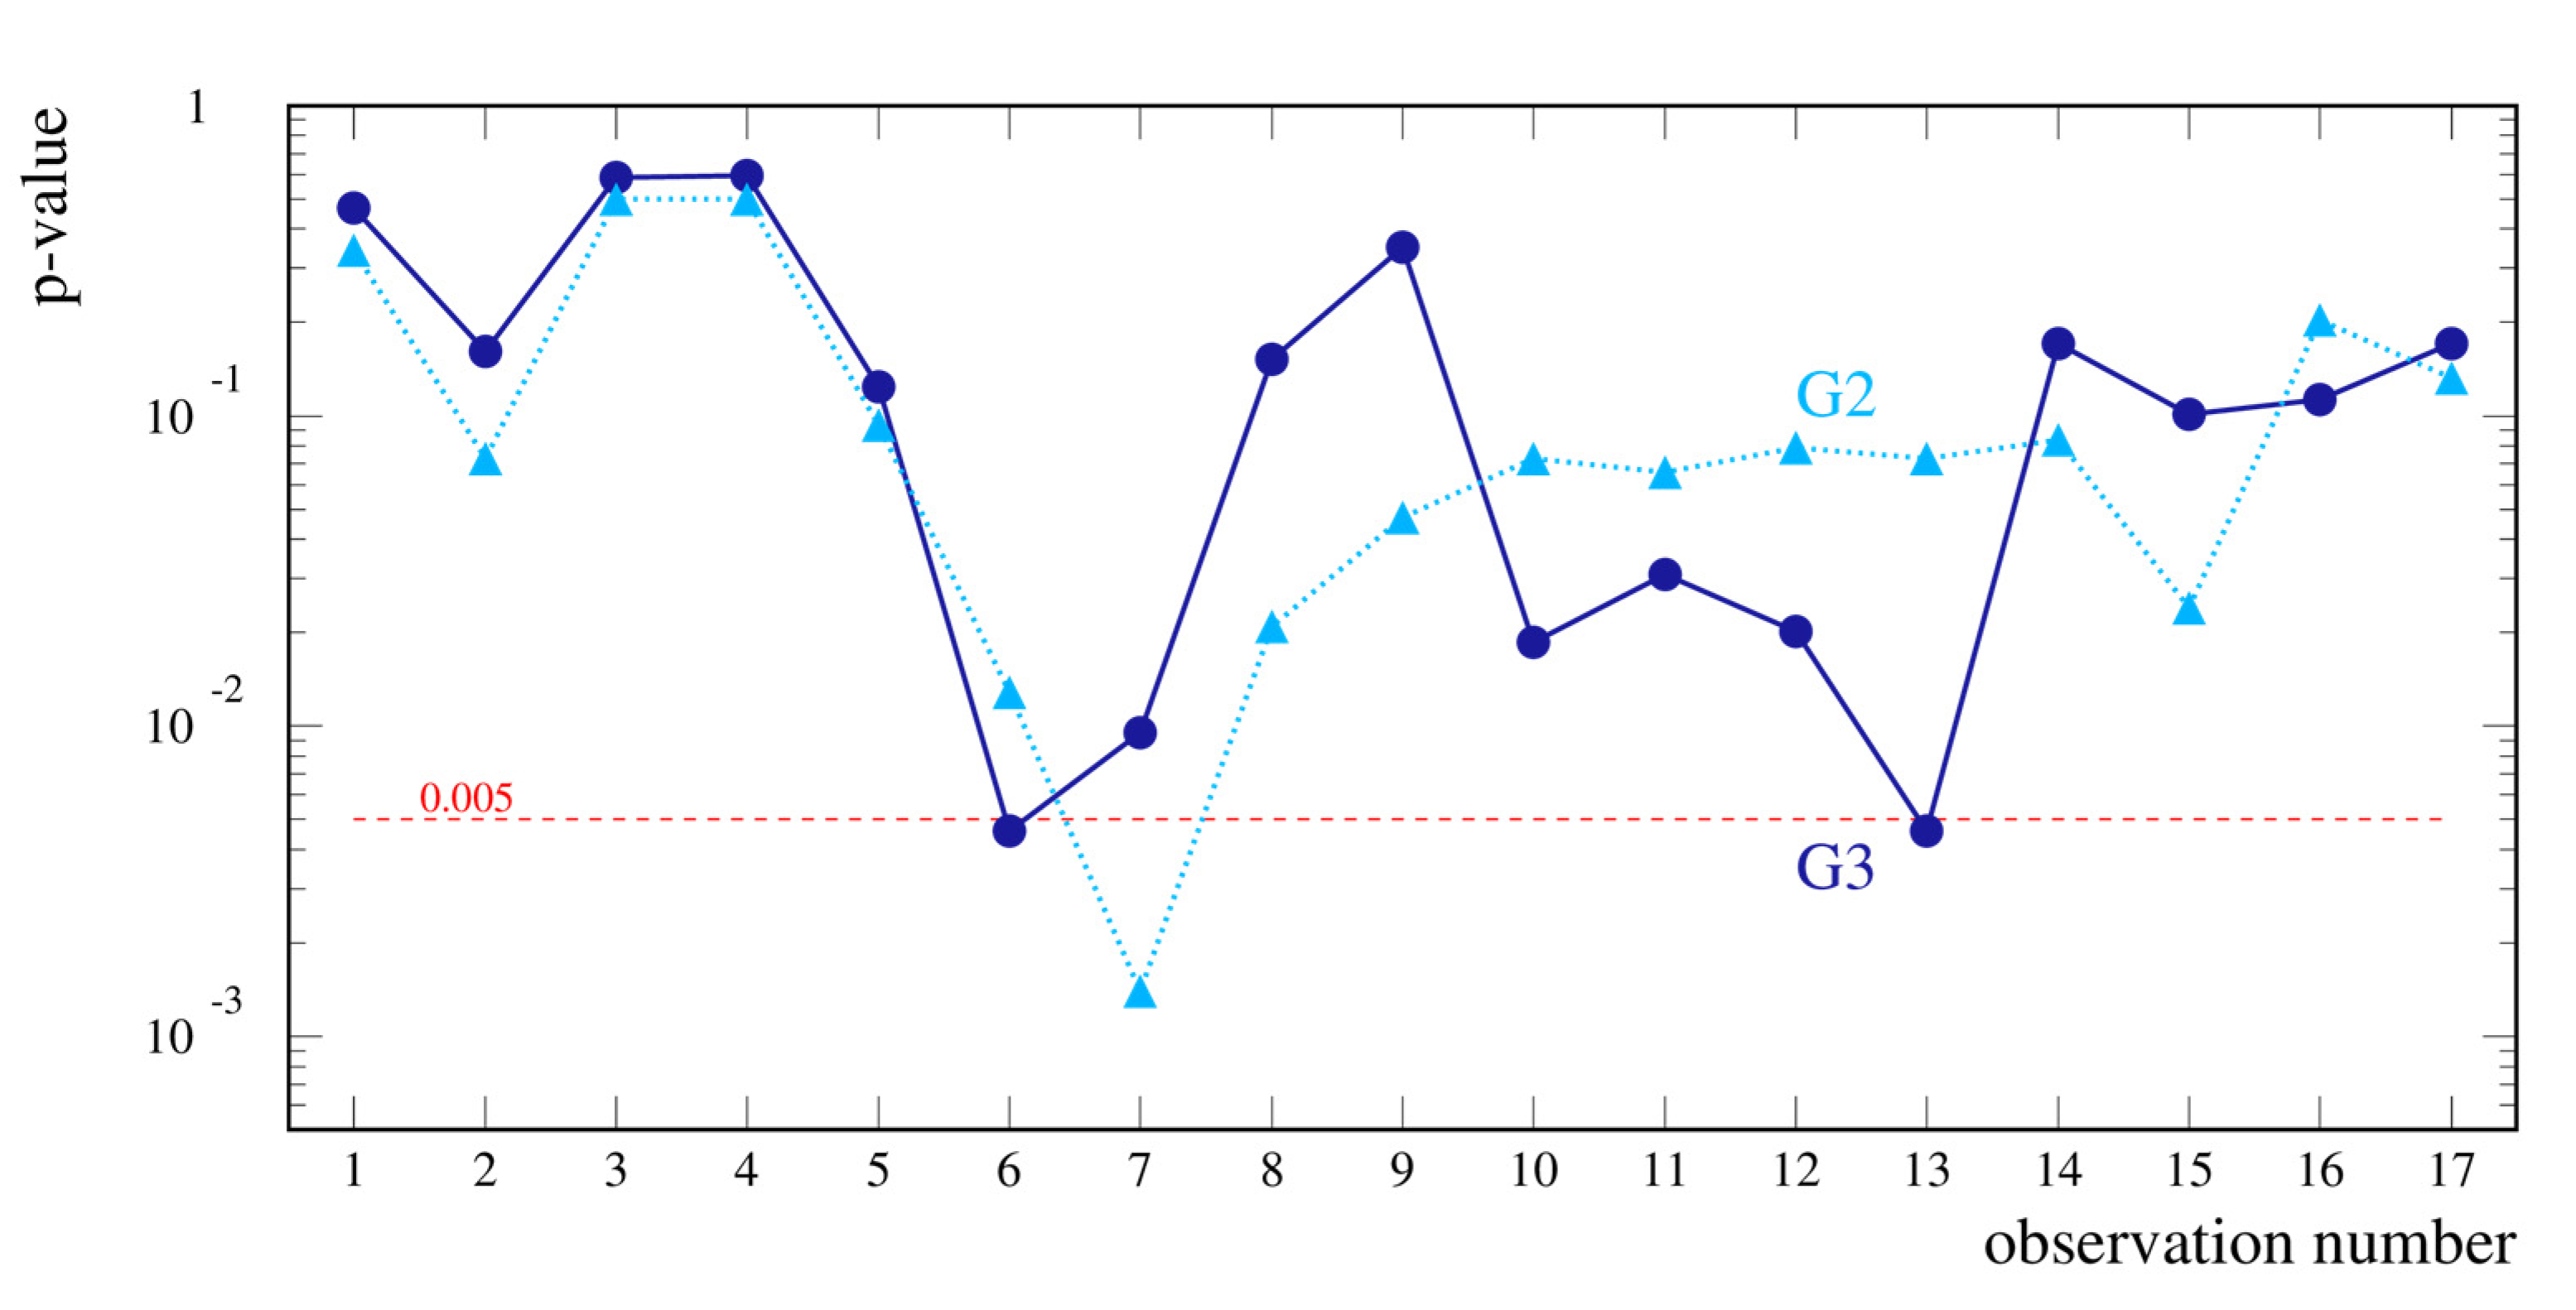
4.2. Consideration of Effect of the Second Incentive Delivery

We also considered the effect of the second incentive delivery to the G3 group only. The time evolution of the success fraction for all three groups separately is presented in Figure 7. The line for the control group G1 is identical to that in Figure 4. The G2 group is shown using triangles connected with a dotted line, and group G3, to which the second incentive was delivered before the 10th observation, is shown using circles and a full line. Additionally, the reference period of thermostat readout Nos. 1–4, before the first incentive delivery, is shadowed. To estimate the statistical significance of the second incentive delivery, we put forward the following set of hypotheses.
Hypothesis 2a.
There is no difference in the success fractions between the control group G1 and the test group G3.
Hypothesis 2b.
The success fraction increases in the test group G3 with respect to the control group G1 after the incentive delivery.
Once again, there was an increase in the success rate after the delivery of the first incentive to groups G2 and G3, and a decrease after the Christmas/New Year break (Figure 7). It can be observed that, for group G2 (triangles, dotted line), there was a stabilization of the success rate at a slightly higher level than during the reference days, whereas, after the delivery of the second incentive to only group G3 (circles, continuous line), the success rate for that group gradually increased.
The time evolution of the p-value is shown in Figure 8 for groups G2 and G3 separately. It drops down below the line of 0.005 for the 13th observation of group G3. However, it goes up at the next observation. It can also be concluded that the effect of the delivery of the second incentive is statistically significant, although not instantaneous. This supports the RH1 hypothesis in regard to the effect of the second incentive. There is no sufficient statistical evidence to support the RH2 hypothesis, that employees sustain energy-saving behavior over time. Even if the success rates for both the G2 and G3 groups were greater at the end of the experiment than in the reference period prior to the delivery of any incentives, the number of available offices emerged to be too small.
The information about the end of the experiment delivered to both the G2 and G3 groups before the 15th readout had no significant influence on the success fraction in these groups.

5. Discussion

There were several limitations to the present study. The most significant was the limited number of available rooms in which the readouts were possible. There were also some aspects regarding the specific usage of these rooms. Most of the rooms were shared, and the employees used them only for a few hours a day, and not every day. In these cases, no one felt that they were the only ones responsible for the room. It is worth mentioning, however, that this did not increase the effectiveness of the incentives, so it does not weaken the results. The employees were mainly researchers and/or lecturers, eliciting the possibility that their energy-saving awareness is above average. On the other hand, one might expect a high level of independence, which could lead to objections against impositions. Finally, it was impossible to avoid leakage of information about the experiment from the test groups to the control group.
Another factor that could potentially influence the result was variations in the external temperature. To quantify such an effect, Pearson correlation coefficients between a series of temperature records (Figure 5) and a series of success fractions for all three groups G1, G2 and G3 (Figure 7) were separately calculated, yielding r1 = +0.45, r1 = −0.17 and r3 = −0.04. The correlation turned out to be positive for only the reference group, G1 (as expected in the case of a causal dependence) and only for this group was it statistically significant (using the bootstrap technique, it was estimated that a single-valued statistical significance level of 0.05 was achieved if r1 > 0.35). However, the size of the effect measured in the G1 group as a difference of success fractions corresponding to the extreme temperatures (the lowest, −7 °C, and the highest, +10 °C, external temperatures were recorded on the days of the 8th and the 17th readouts, respectively) was equal to 0.11, which was comparable with the average statistical uncertainty of 0.08 and much smaller than changes to the success fractions observed in the test groups G2 and G3 (see Figure 7). One may conclude that the level of positive changes to the success fractions observed for test groups G2 and G3 exceeded potential bias due to variations in the external temperature. On the other hand, it cannot be excluded that the most prominent drop of the success fractions recorded for the eighth and ninth readouts (with respect to the seventh one) was in part due to a low external temperature.
Furthermore, it must be stressed that the effect size found in the study, even for the largest readouts, was moderate. The maximum of the absolute effect, measured as a difference of fractions, amounts to about 1/3.

6. Summary and Conclusions

This article presents results of the experiment Energy Saving in the Office. Main conclusions are the following.
  • Providing incentives for energy saving resulted in a statistically significant positive reaction of the employees of the department studied.
  • This reaction was not instantaneous and weakened with time, but to a success rate level higher than the starting one.
When recalling the main points of the study, it should be remembered that the success rate was defined as the number of offices in which the thermostat settings were reduced at the end of the day, in line with the incentive delivered to the test groups. The increase in this success rate in the test groups compared to the control group excluded the hypothesis of no positive change at a significance level of 0.005. However, this success rate decreased over time, and even though it was higher than in the control group by the end of the experiment, the final difference showed lower statistical significance.
However, given the main limitations of the experiment, namely the relatively small number of offices available and their use by multi-person teams, the following overall conclusions can be considered reasonable.
  • When seeking to save resources (water, energy, paper, etc.) in offices or other buildings, it is important to remember to raise awareness and train staff, to learn from each other, and to encourage adapting resource-efficient behaviors. It is equally important that select employees declare that they will transfer their changes in behavior to their private lives.
  • In regard to the methods leading to changes in the behaviors of individuals and organizations towards becoming more resourceful and energy-efficient, the experimental approach proposed in this article can be an effective solution.
The described experiment fits into the framework of inter-organizational cooperation between business and academia.
The acquired knowledge about how changing employees′ behaviors can lead to savings can be applied to any company and the resources used. It is most likely easiest to conduct similar experiments at universities and share knowledge between business and science.

Funding

This research received no external funding. Thanks to the support of the faculty authorities, it was possible to carry out the readings in the rooms.

Institutional Review Board Statement

Not applicable.

Informed Consent Statement

Not applicable.

Data Availability Statement

Not applicable.

Acknowledgments

The author is grateful to the authorities of the Faculty of Management of the University of Warsaw for allowing the study and acknowledges the assistance of Master’s student Katarzyna Parfianowicz in carrying out the readouts during the experiment.

Conflicts of Interest

The author declares no conflict of interest.

References

  1. United Nations Report of the Secretary-General on SDG Progress 2019: Special Edition; United Nations Publishing: New York, NY, USA, 2019.
  2. Klöckner, C.A. A comprehensive model of the psychology of environmental behaviour-A meta-analysis. Glob. Environ. Chang. 2013, 23, 1028–1038. [Google Scholar] [CrossRef] [Green Version]
  3. IPCC. Climate Change 2014: Synthesis Report. Contribution of Working Groups I, II and III to the Fifth Assessment Report of the Intergovernmental Panel on Climate Change; IPCC: Geneva, Switzerland, 2014. [Google Scholar]
  4. Kates, R.W.; Clark, W.C.; Corell, R.; Hall, J.M.; Jaeger, C.C.; Lowe, I.; McCarthy, J.J.; Schellnhuber, H.J.; Bolin, B.; Dickson, N.M.; et al. Environment and development: Sustainability science. Science 2001, 292, 641–642. [Google Scholar] [CrossRef] [PubMed]
  5. Kuzior, A.; Ober, J.; Karwot, J. Stakeholder Expectation of Corporate Social Responsibility Practices: A Case Study of PWiK Rybnik, Poland. Energies 2021, 14, 3337. [Google Scholar] [CrossRef]
  6. Garrido-Yserte, R.; Gallo-Rivera, M.T. The potential role of stakeholders in the energy efficiency of higher education institutions. Sustainability 2020, 12, 8908. [Google Scholar] [CrossRef]
  7. Altan, H. Energy efficiency interventions in UK higher education institutions. Energy Policy 2010, 38, 7722–7731. [Google Scholar] [CrossRef] [Green Version]
  8. Responsible Business in Poland 2019. English Summary; Forum Odpowiedzialnego Biznesu: Warsaw, Poland, 2020.
  9. Pérez-Lombard, L.; Ortiz, J.; Pout, C. A review on buildings energy consumption information. Energy Build. 2008, 40, 394–398. [Google Scholar] [CrossRef]
  10. World Energy Outlook 2016; World Energy Outlook; OECD: Paris, France, 2016; ISBN 9789264264946.
  11. Al-Sallal, K.A. A Review of Buildings’ Energy Challenges. Int. J. Environ. Sustain. 2014, 3, 42–49. [Google Scholar] [CrossRef]
  12. U.S. Department of Energy. In Buildings Energy Databook; Energy Efficiency and Renewable Energy (EERE): Washington, DC, USA, 2012.
  13. IEA. Global Energy Review 2021; IEA: Paris, France, 2021. [Google Scholar]
  14. Rijal, H.B.; Yoshida, K.; Humphreys, M.A.; Nicol, J.F. Development of an adaptive thermal comfort model for energy-saving building design in Japan. Archit. Sci. Rev. 2021, 64. [Google Scholar] [CrossRef]
  15. Yang, L.; Yan, H.; Lam, J.C. Thermal comfort and building energy consumption implications-A review. Appl. Energy 2014, 115. [Google Scholar] [CrossRef]
  16. Lamb, W.F.; Wiedmann, T.; Pongratz, J.; Andrew, R.; Crippa, M.; Olivier, J.G.J.; Wiedenhofer, D.; Mattioli, G.; Al Khourdajie, A.; House, J.; et al. A review of trends and drivers of greenhouse gas emissions by sector from 1990 to 2018. Environ. Res. Lett. 2021, 16, 073005. [Google Scholar] [CrossRef]
  17. Stephenson, J.; Barton, B.; Carrington, G.; Gnoth, D.; Lawson, R.; Thorsnes, P. Energy cultures: A framework for understanding energy behaviours. Energy Policy 2010, 38, 6120–6129. [Google Scholar] [CrossRef] [Green Version]
  18. Gaetani, I.; Hoes, P.J.; Hensen, J.L.M. Estimating the influence of occupant behavior on building heating and cooling energy in one simulation run. Appl. Energy 2018, 223, 159–171. [Google Scholar] [CrossRef]
  19. Fajilla, G.; De Simone, M.; Cabeza, L.F.; Bragança, L. Assessment of the impact of Occupants’ Behavior and climate change on heating and cooling energy needs of buildings. Energies 2020, 13, 6468. [Google Scholar] [CrossRef]
  20. World Energy Outlook 2017; OECD: Paris, France, 2017; ISBN 9789264282056.
  21. World Energy Outlook 2018; OECD: Paris, France, 2018; ISBN 9789264064522.
  22. World Energy Outlook 2019; OECD: Paris, France, 2019; ISBN 9789264523272.
  23. OECD. World Energy Outlook 2020—Analysis; OECD: Paris, France, 2020. [Google Scholar]
  24. Li, D.; Xu, X.; Chen, C.-F.; Menassa, C. Understanding energy-saving behaviors in the American workplace: A unified theory of motivation, opportunity, and ability. Energy Res. Soc. Sci. 2019, 51, 198–209. [Google Scholar] [CrossRef]
  25. Masoso, O.T.; Grobler, L.J. The dark side of occupants’ behaviour on building energy use. Energy Build. 2010, 42, 173–177. [Google Scholar] [CrossRef]
  26. Zhang, Y.; Bai, X.; Mills, F.P.; Pezzey, J.C.V. Rethinking the role of occupant behavior in building energy performance: A review. Energy Build. 2018, 172, 279–294. [Google Scholar] [CrossRef]
  27. Klaniecki, K.; Wuropulos, K.; Hager, C.P. Behaviour Change for Sustainable Development. In Encyclopedia of Sustainability in Higher Education; Springer International Publishing: Berlin/Heidelberg, Germany, 2019; pp. 1–10. [Google Scholar]
  28. Zollo, M.; Cennamo, C.; Neumann, K. Beyond What and Why: Understanding Organizational Evolution Towards Sustainable Enterprise Models. Organ. Environ. 2013, 26, 241–259. [Google Scholar] [CrossRef]
  29. Nguyen, T.A.; Aiello, M. Energy intelligent buildings based on user activity: A survey. Energy Build. 2013, 56, 244–257. [Google Scholar] [CrossRef] [Green Version]
  30. Shove, E.; Lutzenhiser, L.; Guy, S.; Hackett, B.; Wilhite, H. Energy and Social Systems. In Human Choice and Climate Change; Reyner, S., Malone, E.L., Eds.; Battele Press: Columbus, OH, USA, 1998; Volume 2, pp. 291–327. [Google Scholar]
  31. Drosos, D.; Kyriakopoulos, G.L.; Ntanos, S.; Parissi, A. School managers perceptions towards energy efficiency and renewable energy sources. Int. J. Renew. Energy Dev. 2021, 10, 573–584. [Google Scholar] [CrossRef]
  32. Ntanos, S.; Ntanos, A.; Salmon, I.; Ziatas, T. Public awareness on Renewable Energy Sources: A case study for the Piraeus University of Applied Sciences. In Proceedings of the 5th International Symposium and 27th National Conference on Operational Research, Aigaleo, Athens, 9–11 June 2016. [Google Scholar]
  33. Burgess, J.; Nye, M. Re-materialising energy use through transparent monitoring systems. Energy Policy 2008, 36, 4454–4459. [Google Scholar] [CrossRef]
  34. Sheldrick, B.; Macgill, S. Local energy conservation initiatives in the UK. Their nature and achievements. Energy Policy 1988, 16, 562–578. [Google Scholar] [CrossRef]
  35. Delmas, M.A.; Fischlein, M.; Asensio, O.I. Information strategies and energy conservation behavior: A meta-analysis of experimental studies from 1975 to 2012. Energy Policy 2013, 61, 729–739. [Google Scholar] [CrossRef] [Green Version]
  36. Lopes, M.A.R.; Antunes, C.H.; Martins, N. Energy behaviours as promoters of energy efficiency: A 21st century review. Renew. Sustain. Energy Rev. 2012, 16, 4095–4104. [Google Scholar] [CrossRef]
  37. Rocha, P.; Siddiqui, A.; Stadler, M. Improving energy efficiency via smart building energy management systems: A comparison with policy measures. Energy Build. 2015, 88, 203–213. [Google Scholar] [CrossRef] [Green Version]
  38. Kosonen, H.K.; Kim, A.A. Advancement of behavioral energy interventions in commercial buildings. Facilities 2017, 35, 367–382. [Google Scholar] [CrossRef]
  39. Brown, Z.; Johnstone, N.; Haščič, I.; Vong, L.; Barascud, F. Testing the effect of defaults on the thermostat settings of OECD employees. Energy Econ. 2013, 39, 128–134. [Google Scholar] [CrossRef] [Green Version]
  40. Zhuang, X.; Wu, C. The effect of interactive feedback on attitude and behavior change in setting air conditioners in the workplace. Energy Build. 2019, 183, 739–748. [Google Scholar] [CrossRef]
  41. Delmas, M.A.; Aragon-Correa, J.A. Field Experiments in Corporate Sustainability Research: Testing Strategies for Behavior Change in Markets and Organizations. Organ. Environ. 2016, 29, 391–400. [Google Scholar] [CrossRef] [Green Version]
  42. Fleiss, J.L.; Levin, B.; Paik, M.C. Statistical Methods for Rates and Proportions, 3rd ed.; Wley-Interscience: Hoboken, NJ, USA, 2003. [Google Scholar]
Figure 1. The campus seen from South-West (left) and North-East (right).
Energies 14 05315 g001
Scheme 1. Model of the Energy Saving in the Office experiment.
Energies 14 05315 sch001
Figure 2. The 2D distribution of thermostat readings in the control group, G1.
Energies 14 05315 g002
Figure 3. The combined 2D distribution of thermostat readings in the test groups, G2 and G3.
Energies 14 05315 g003
Figure 4. The time evolution of the success fraction in the test group, G0, and in the control group, G1. The bars correspond to ± one square root of the variation.
Energies 14 05315 g004
Figure 5. External temperature at 4 p.m. of each observation day as reported by meteo.waw.pl.
Energies 14 05315 g005
Figure 6. The time evolution of the p-value of the 1a hypothesis.
Energies 14 05315 g006
Figure 7. The time evolution of the success fraction for all three groups separately: the control group G1, the test group G2, and the test group G3.
Energies 14 05315 g007
Figure 8. The time evolution of the p-value of the 2a hypothesis for groups G2 and G3. Lines are only to guide eye.
Energies 14 05315 g008
Publisher’s Note: MDPI stays neutral with regard to jurisdictional claims in published maps and institutional affiliations.

