
Life Cycle Assessment of a Barge-Type Floating Wind Turbine and Comparison with Other Types of Wind Turbines


Abstract
:1. Introduction
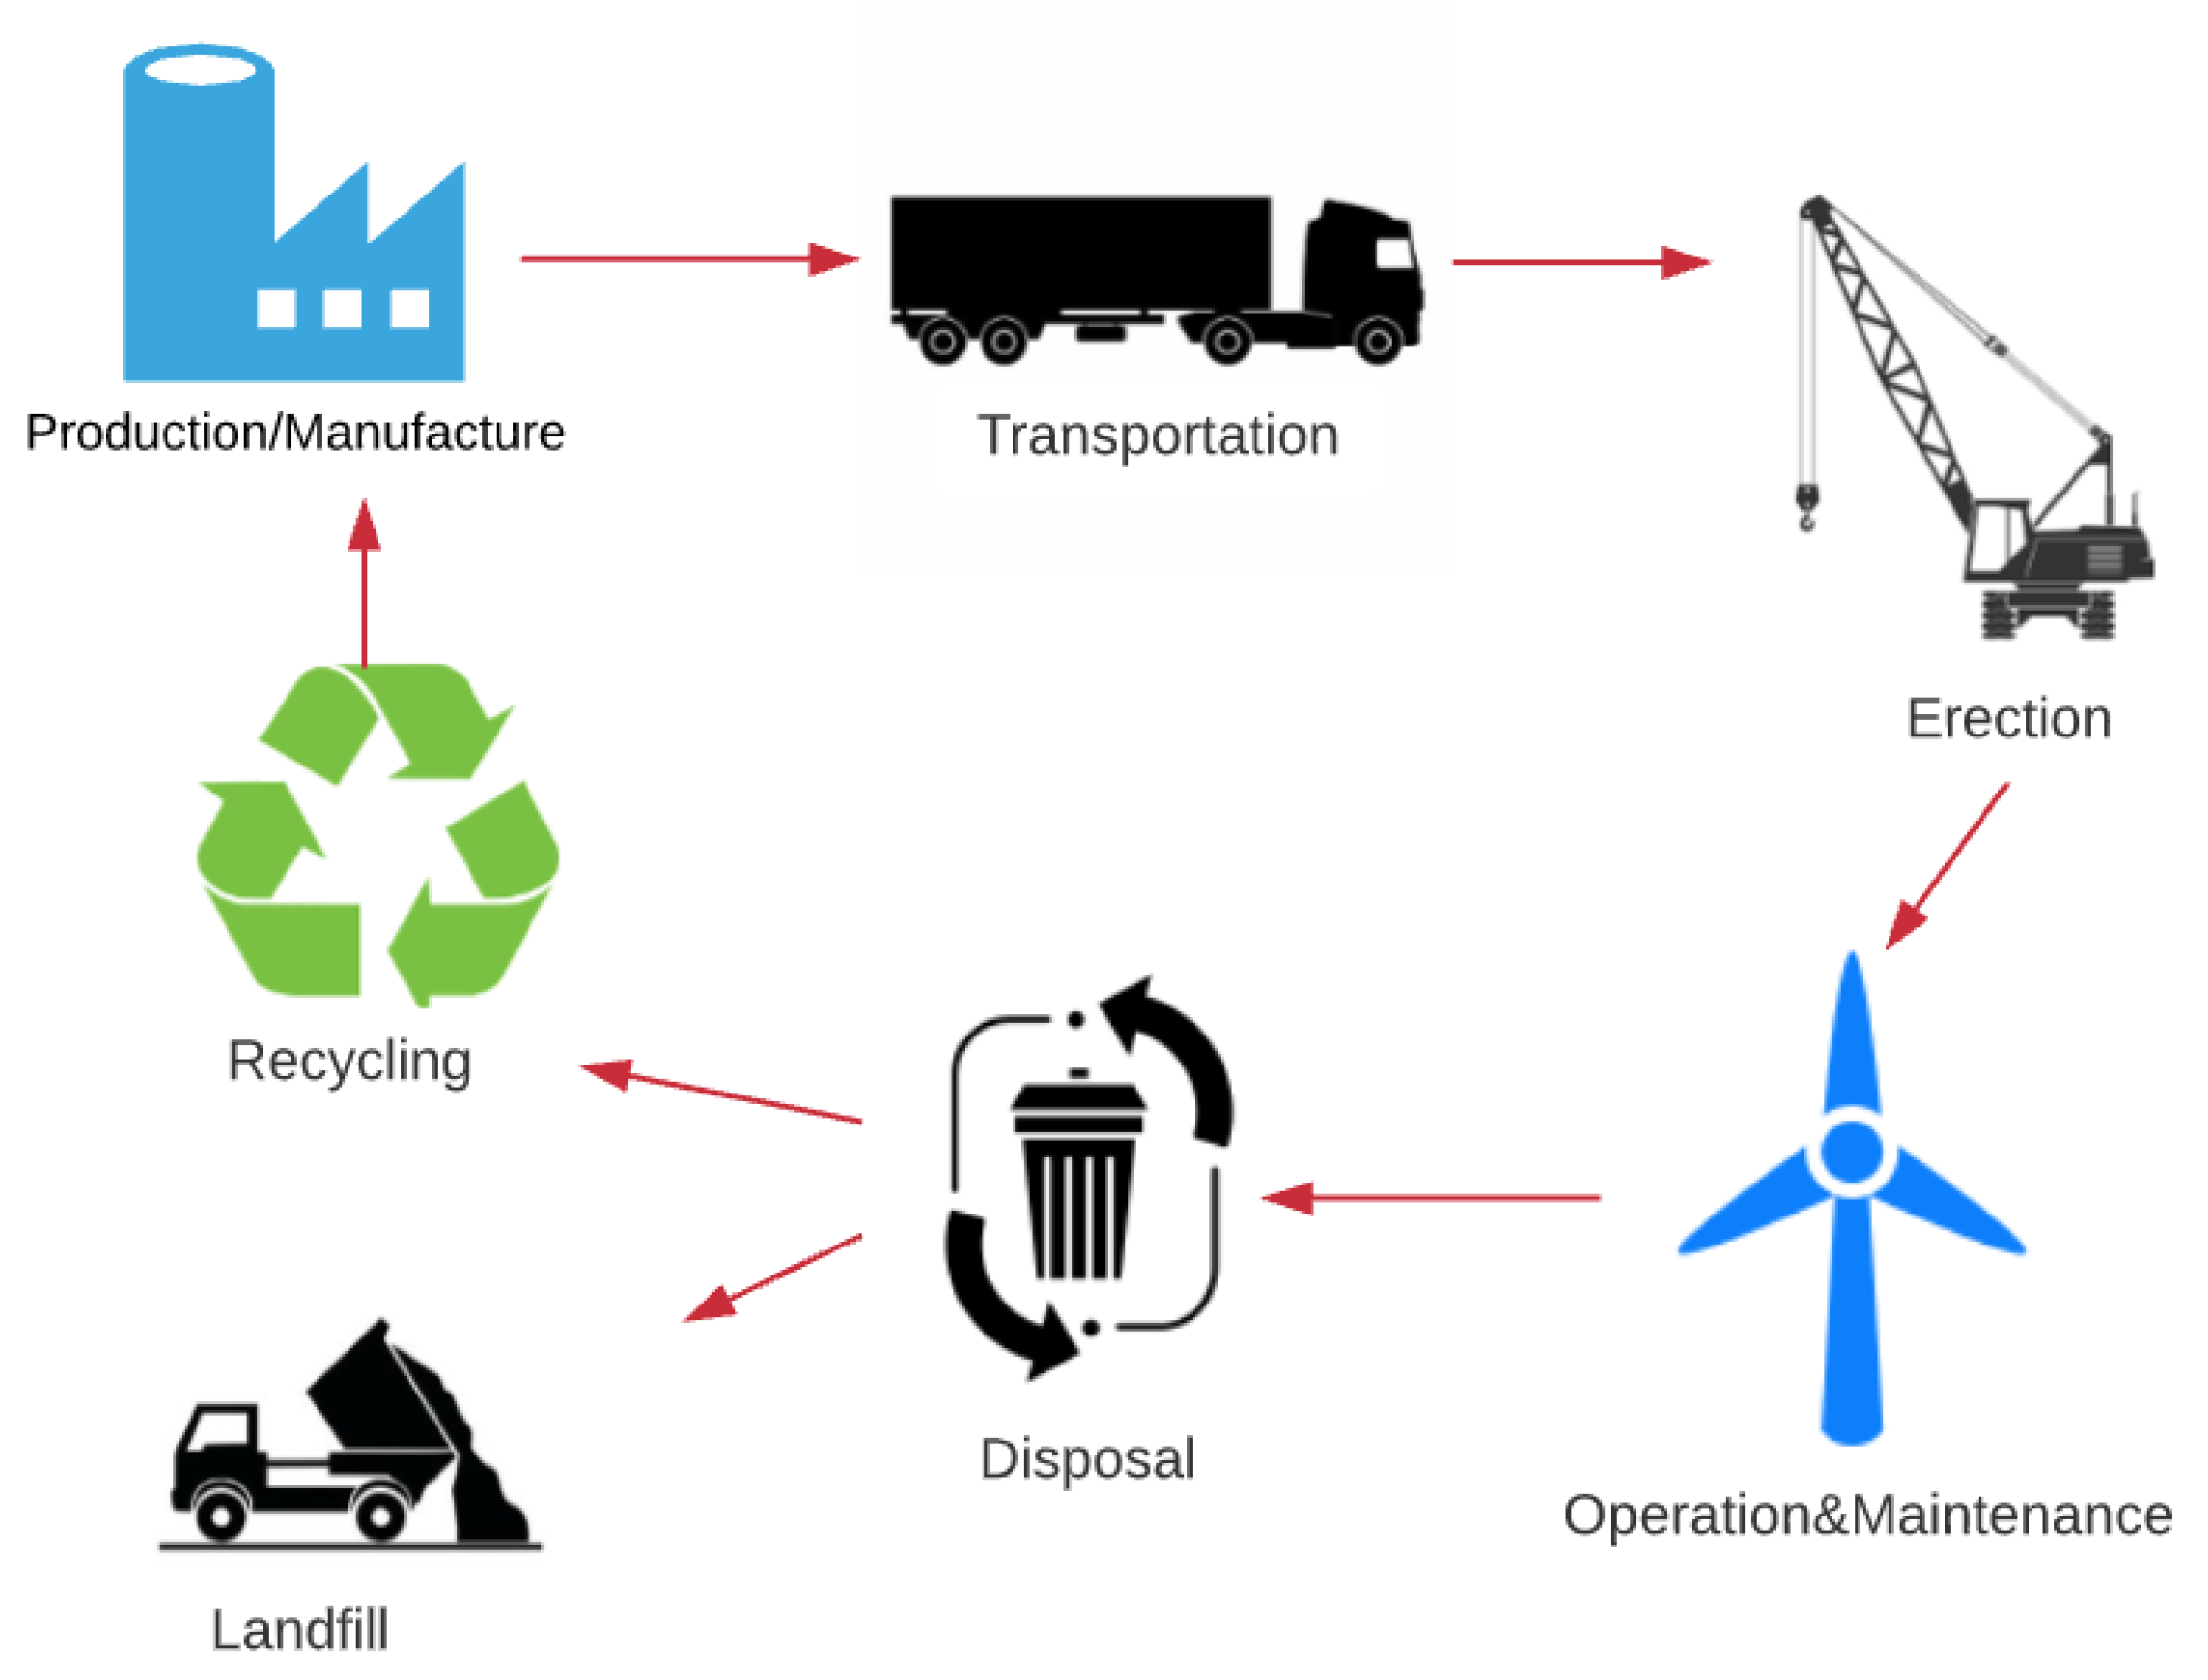
2. Life Cycle Assessment—An Overview
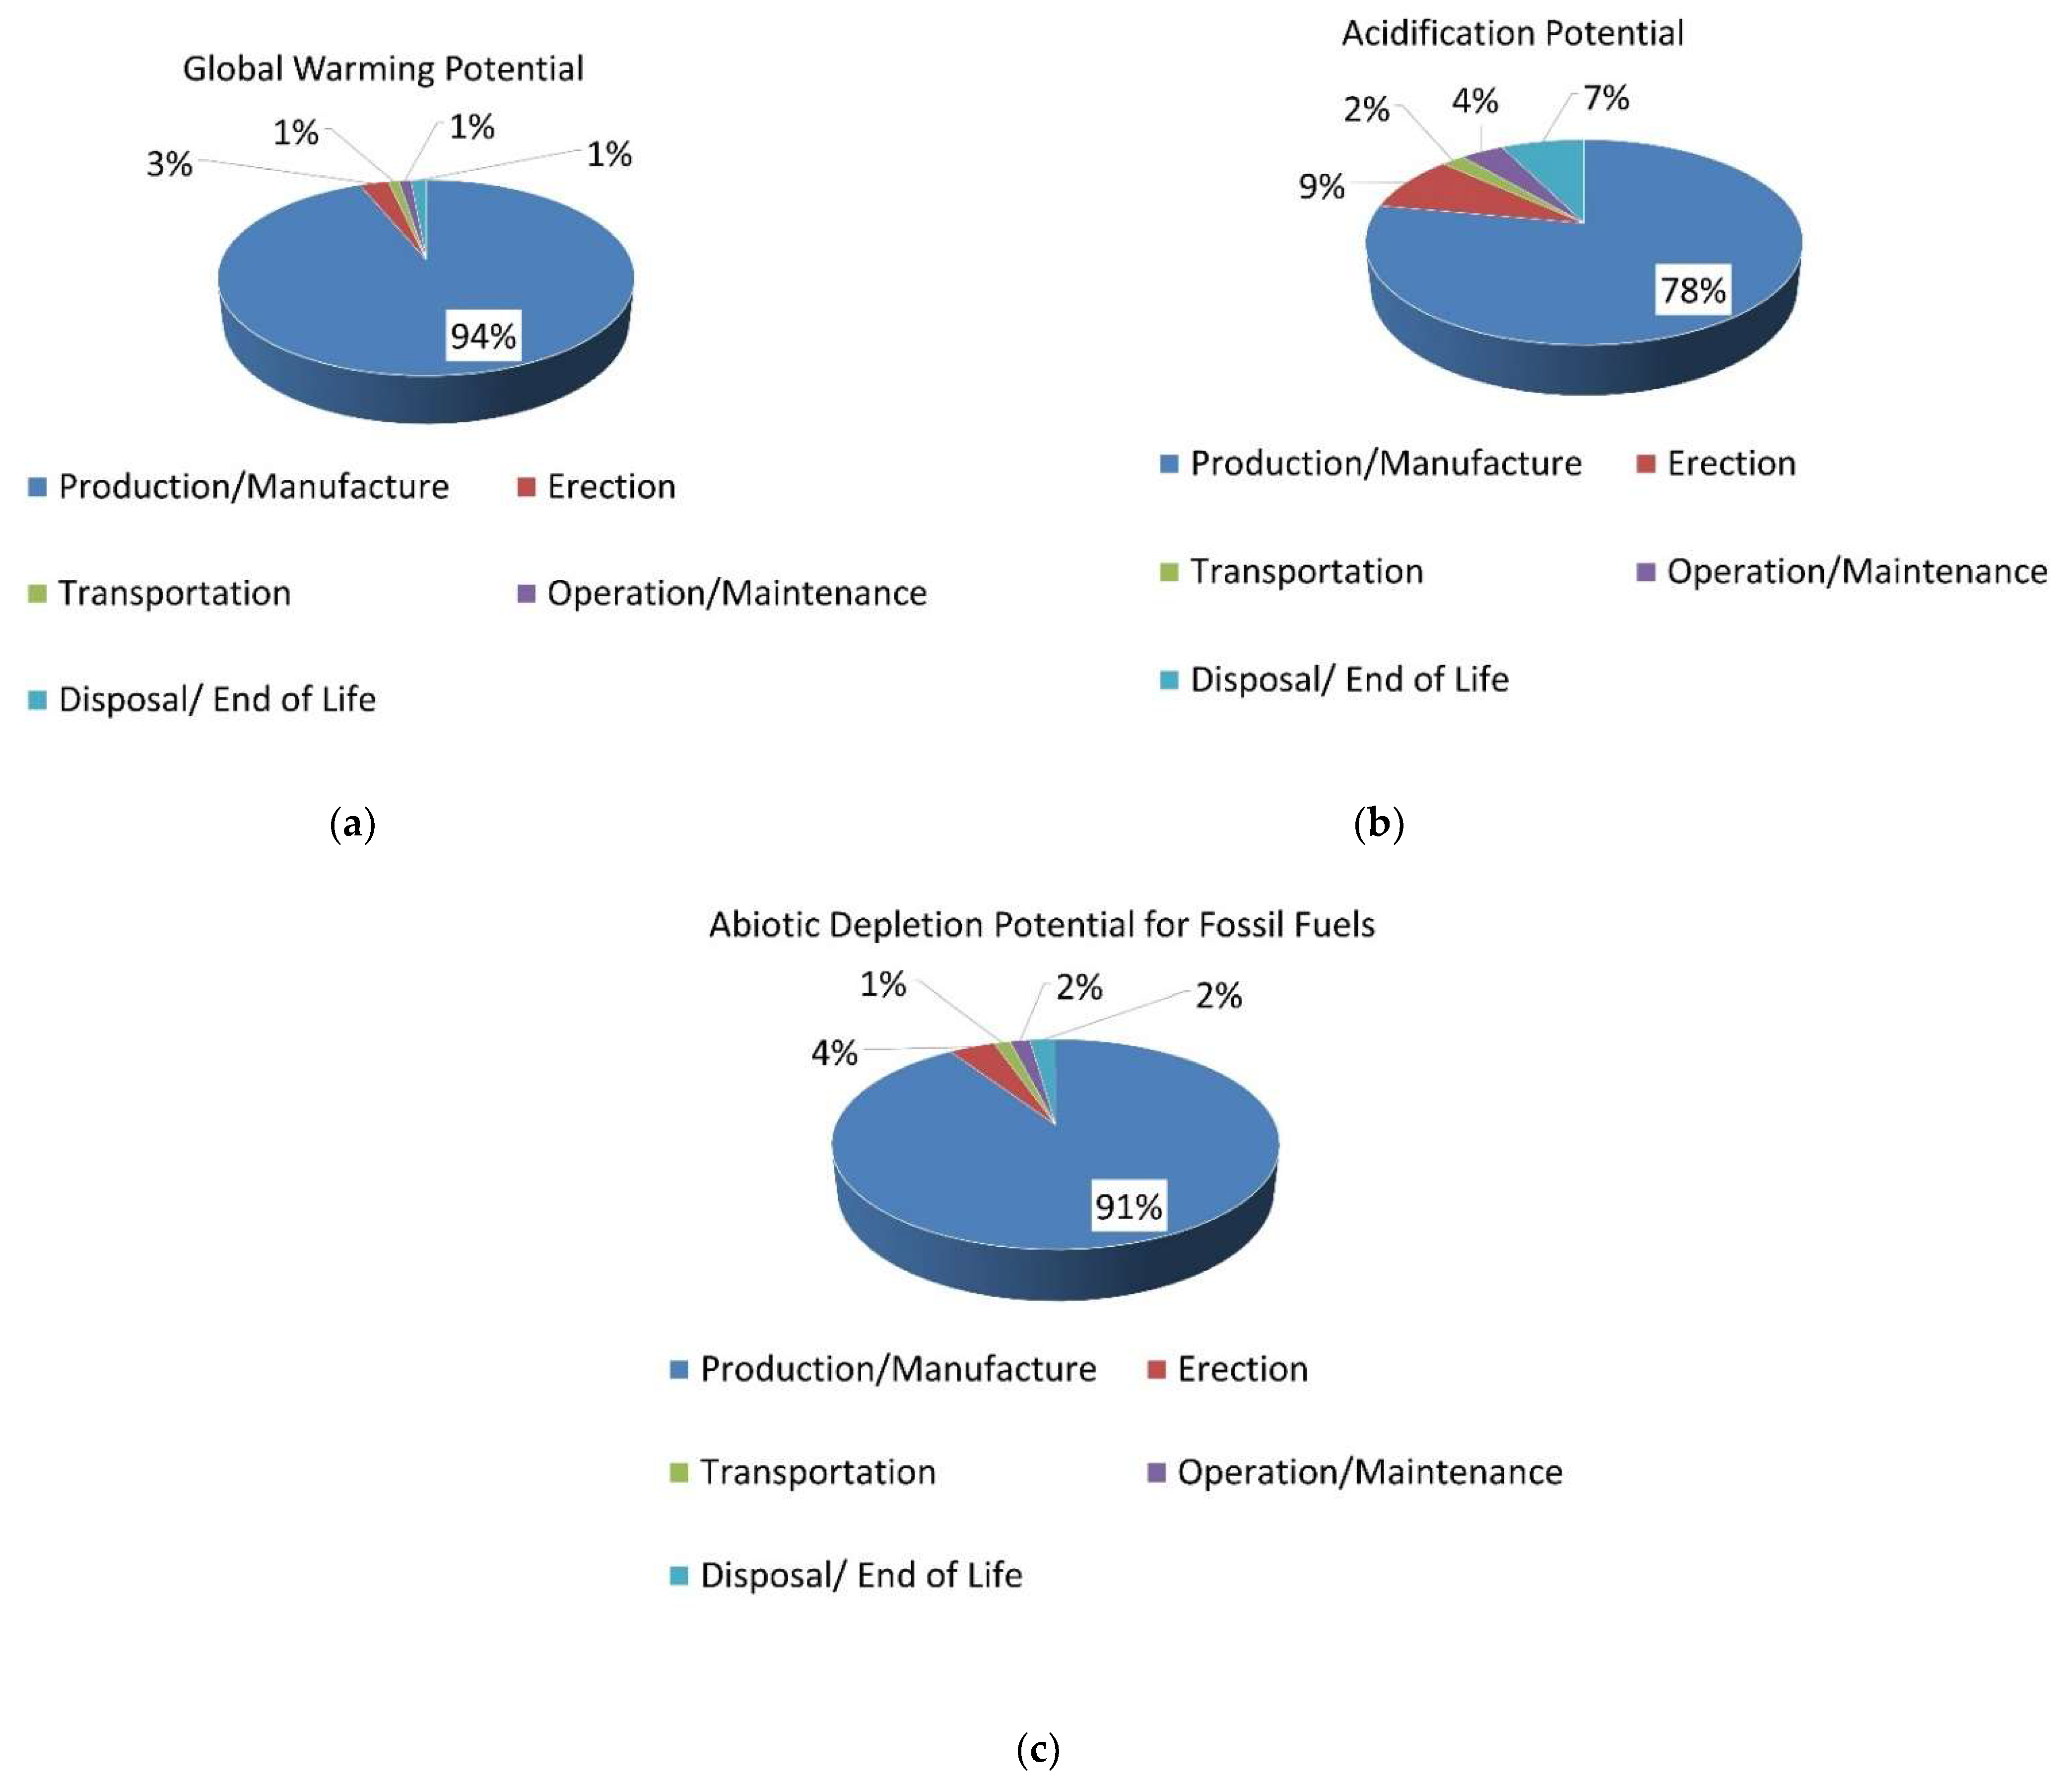
- During the production and manufacture stage, the materials and parts are selected and made for the wind turbine, i.e., the tower, blades, nacelle, foundation, etc. are produced.
- During transportation, the manufactured parts are transferred to the area where the system will be installed. Here, the distance between the factory and the installation area is the critical impact factor.
- During the erection, the installation of the system is completed. The wind turbine parts must be modular and of movable size.
- Concerning the operation and maintenance of the system, a periodic maintenance of the system carried out systematically that has to be taken into account.
- For the disposal, a turbine that has completed its life cycle is dismantled.
3. Life Cycle Assessment of a Floating Wind Turbine Tower
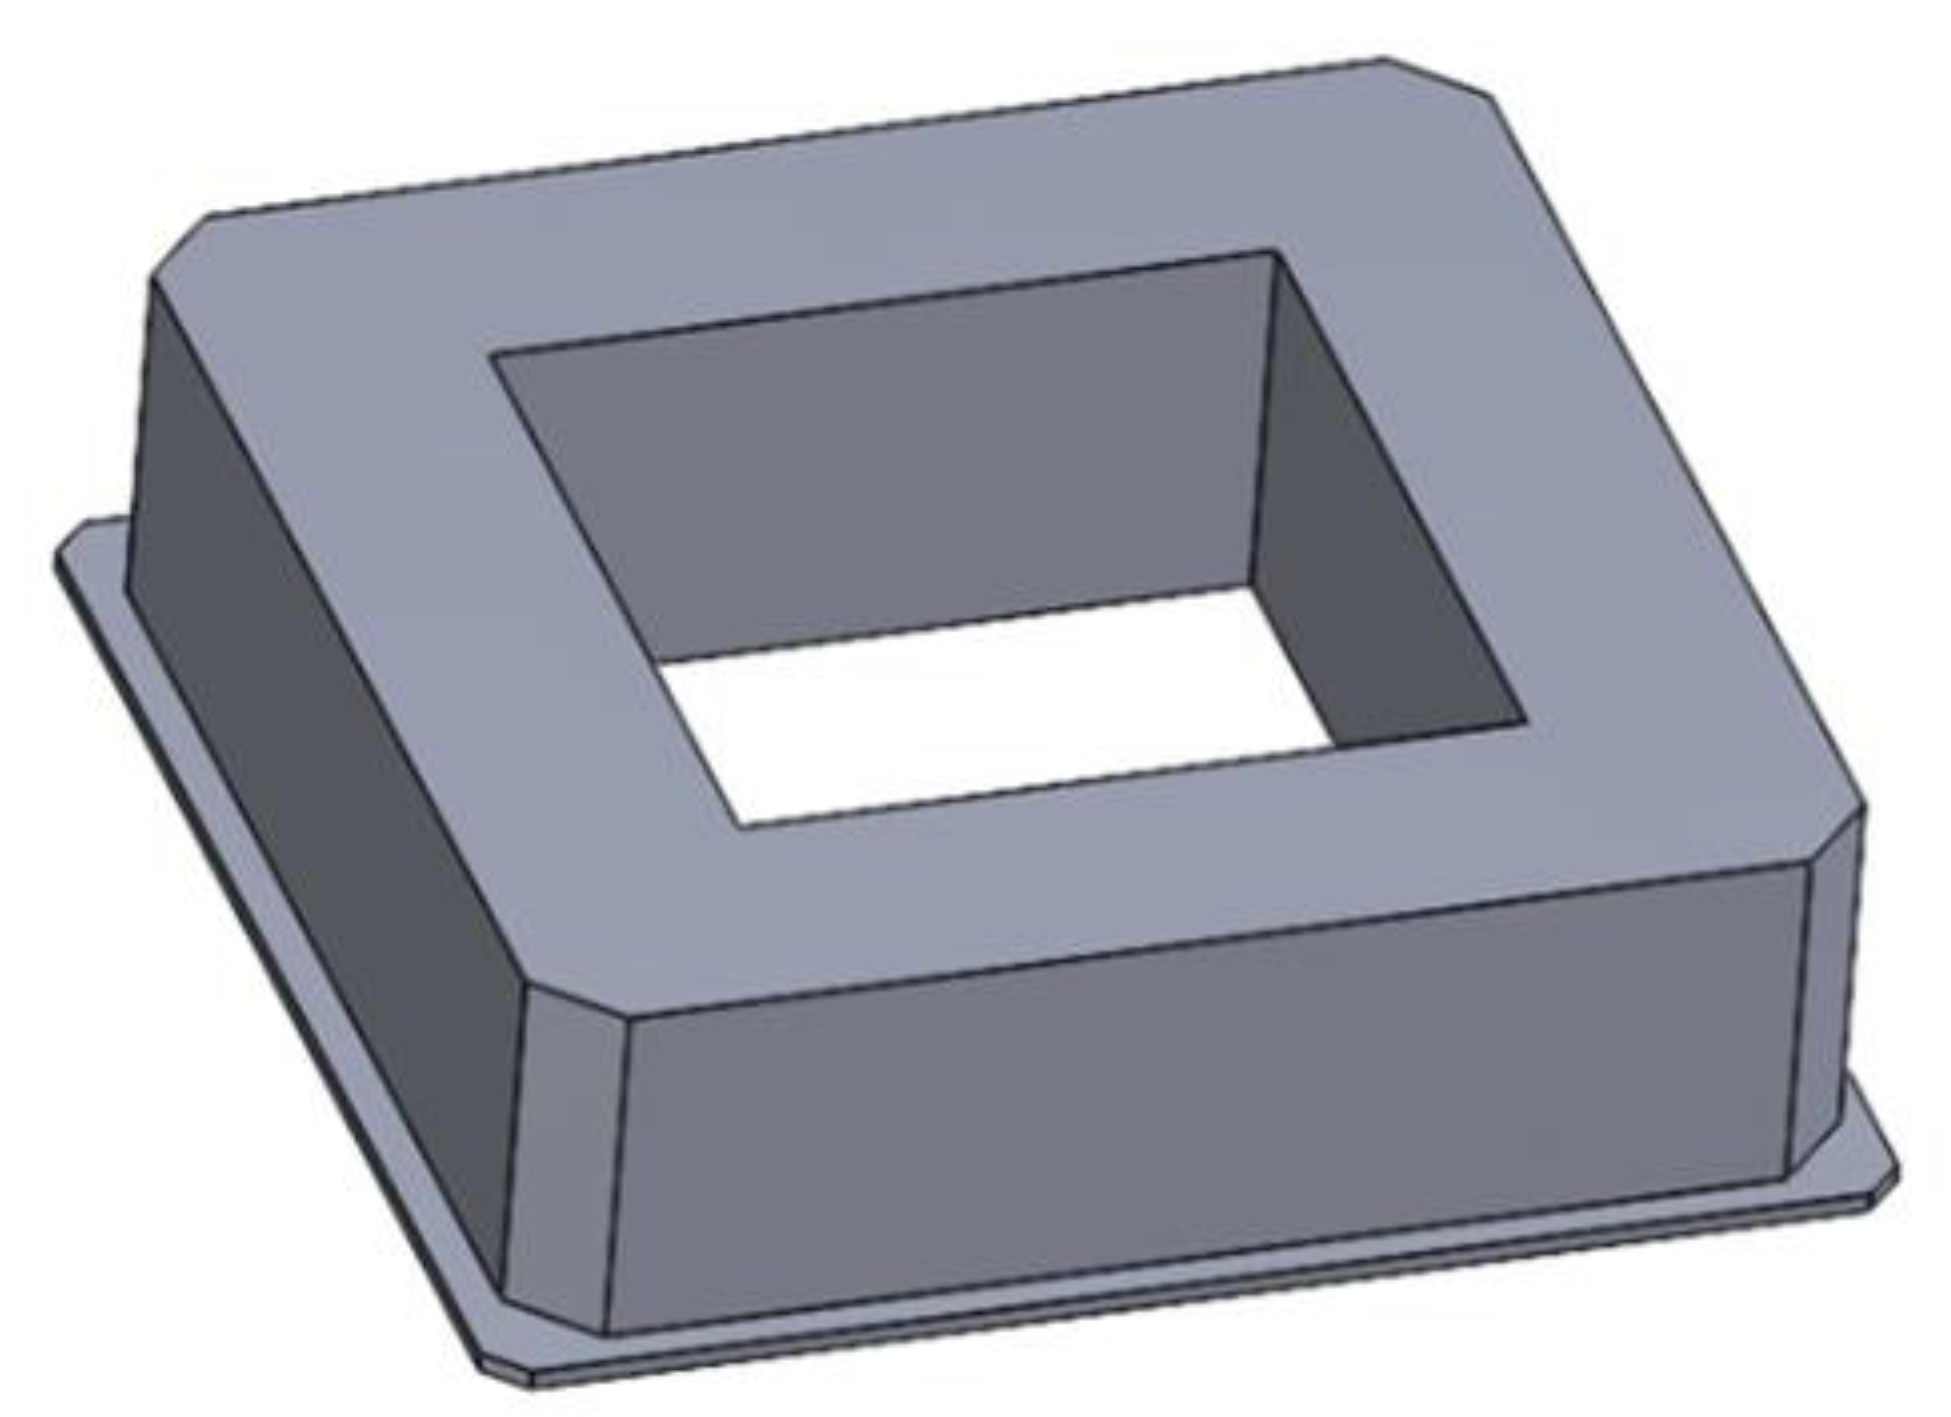
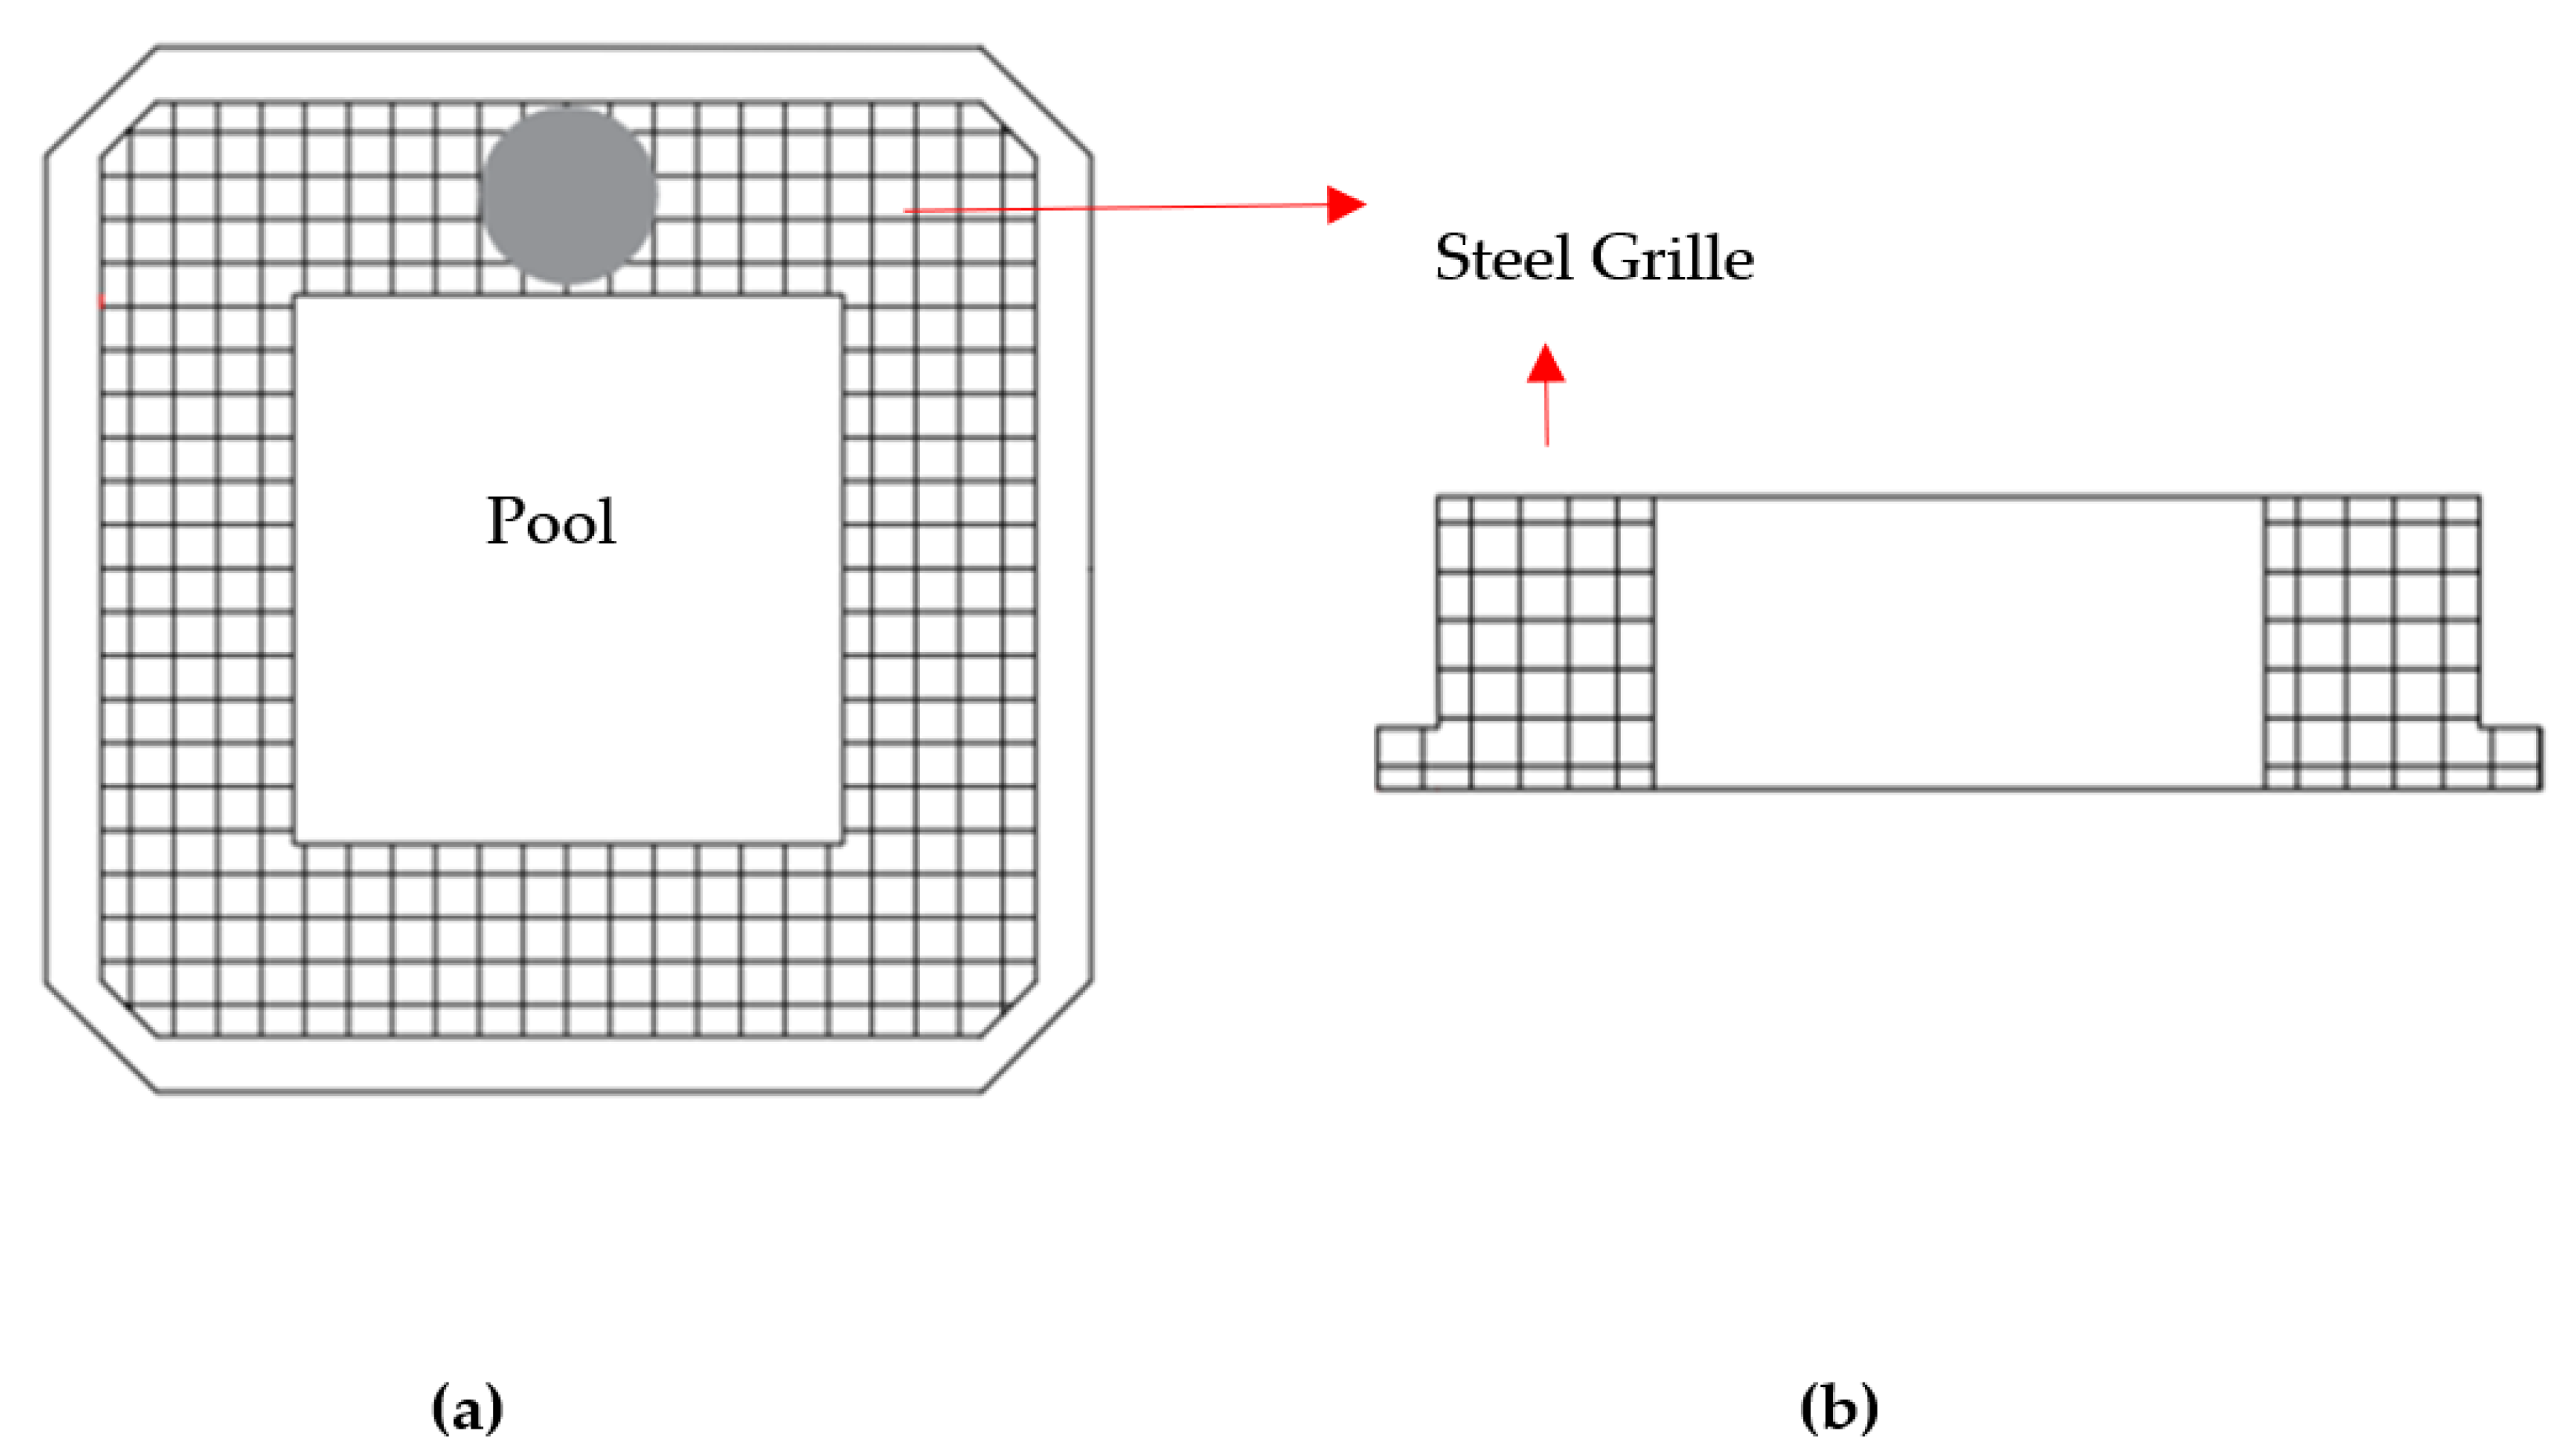
3.1. The Barge-Type Floating Wind Turbine
3.2. Boundary System
3.2.1. Manufacture Stage
3.2.2. Transportation Stage
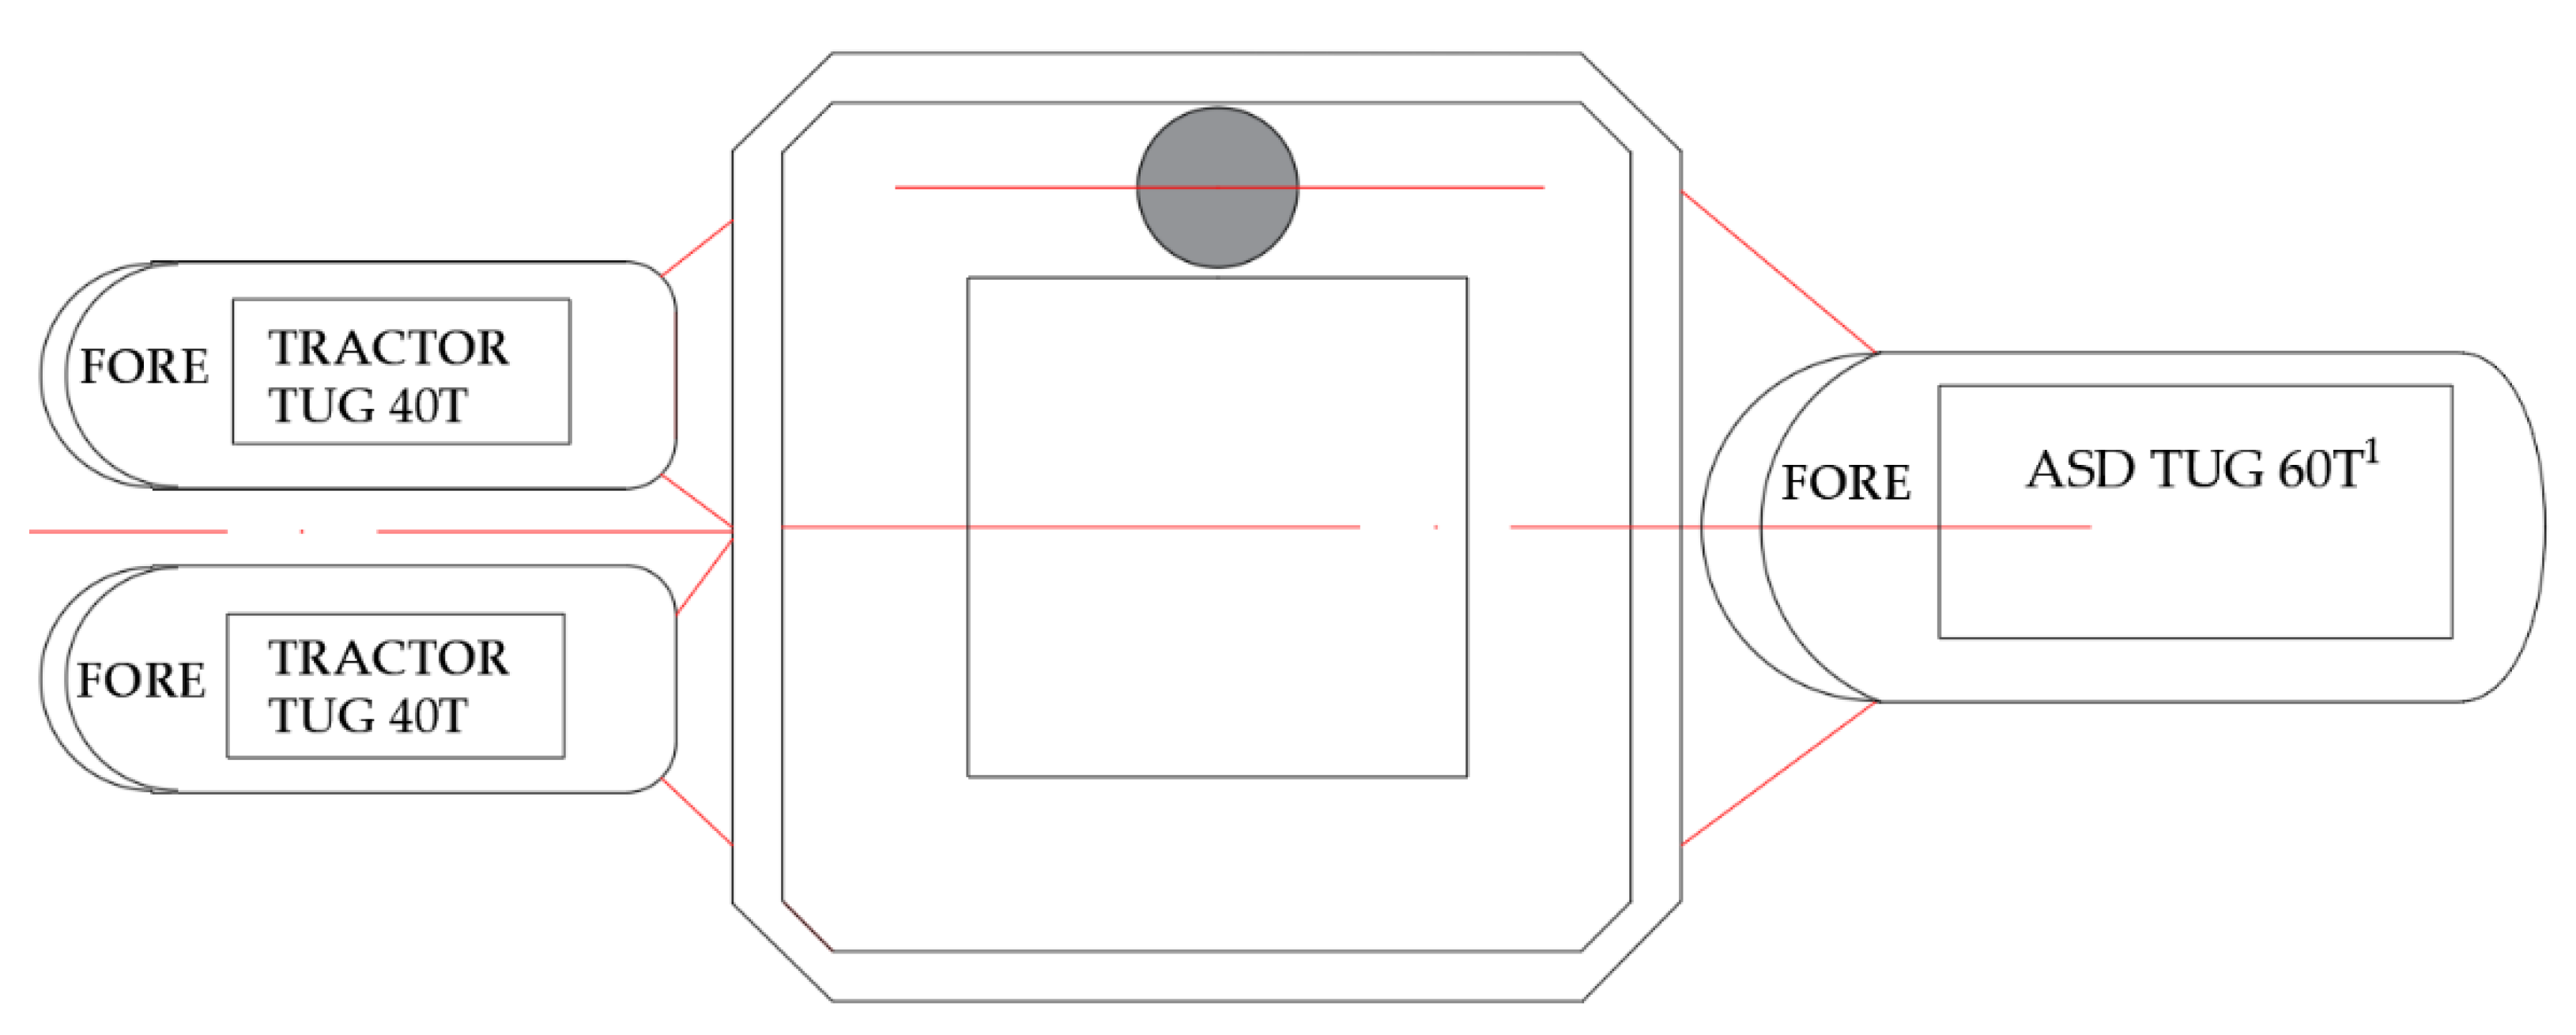
3.2.3. Erection Stage
3.2.4. Operation and Maintenance Stage
3.2.5. Disposal and End-of-Life Stage
- Copper and aluminium: recycling 90%;
- Concrete, glass fibre and glass-reinforced plastic: landfill 100%;
- Nylon fibre: recycling 100%;
- Polyurethane foam: recycling 80%.
4. Life Cycle Inventory (LCI)
5. LCA Results for the Barge-Type Floating Wind Turbine
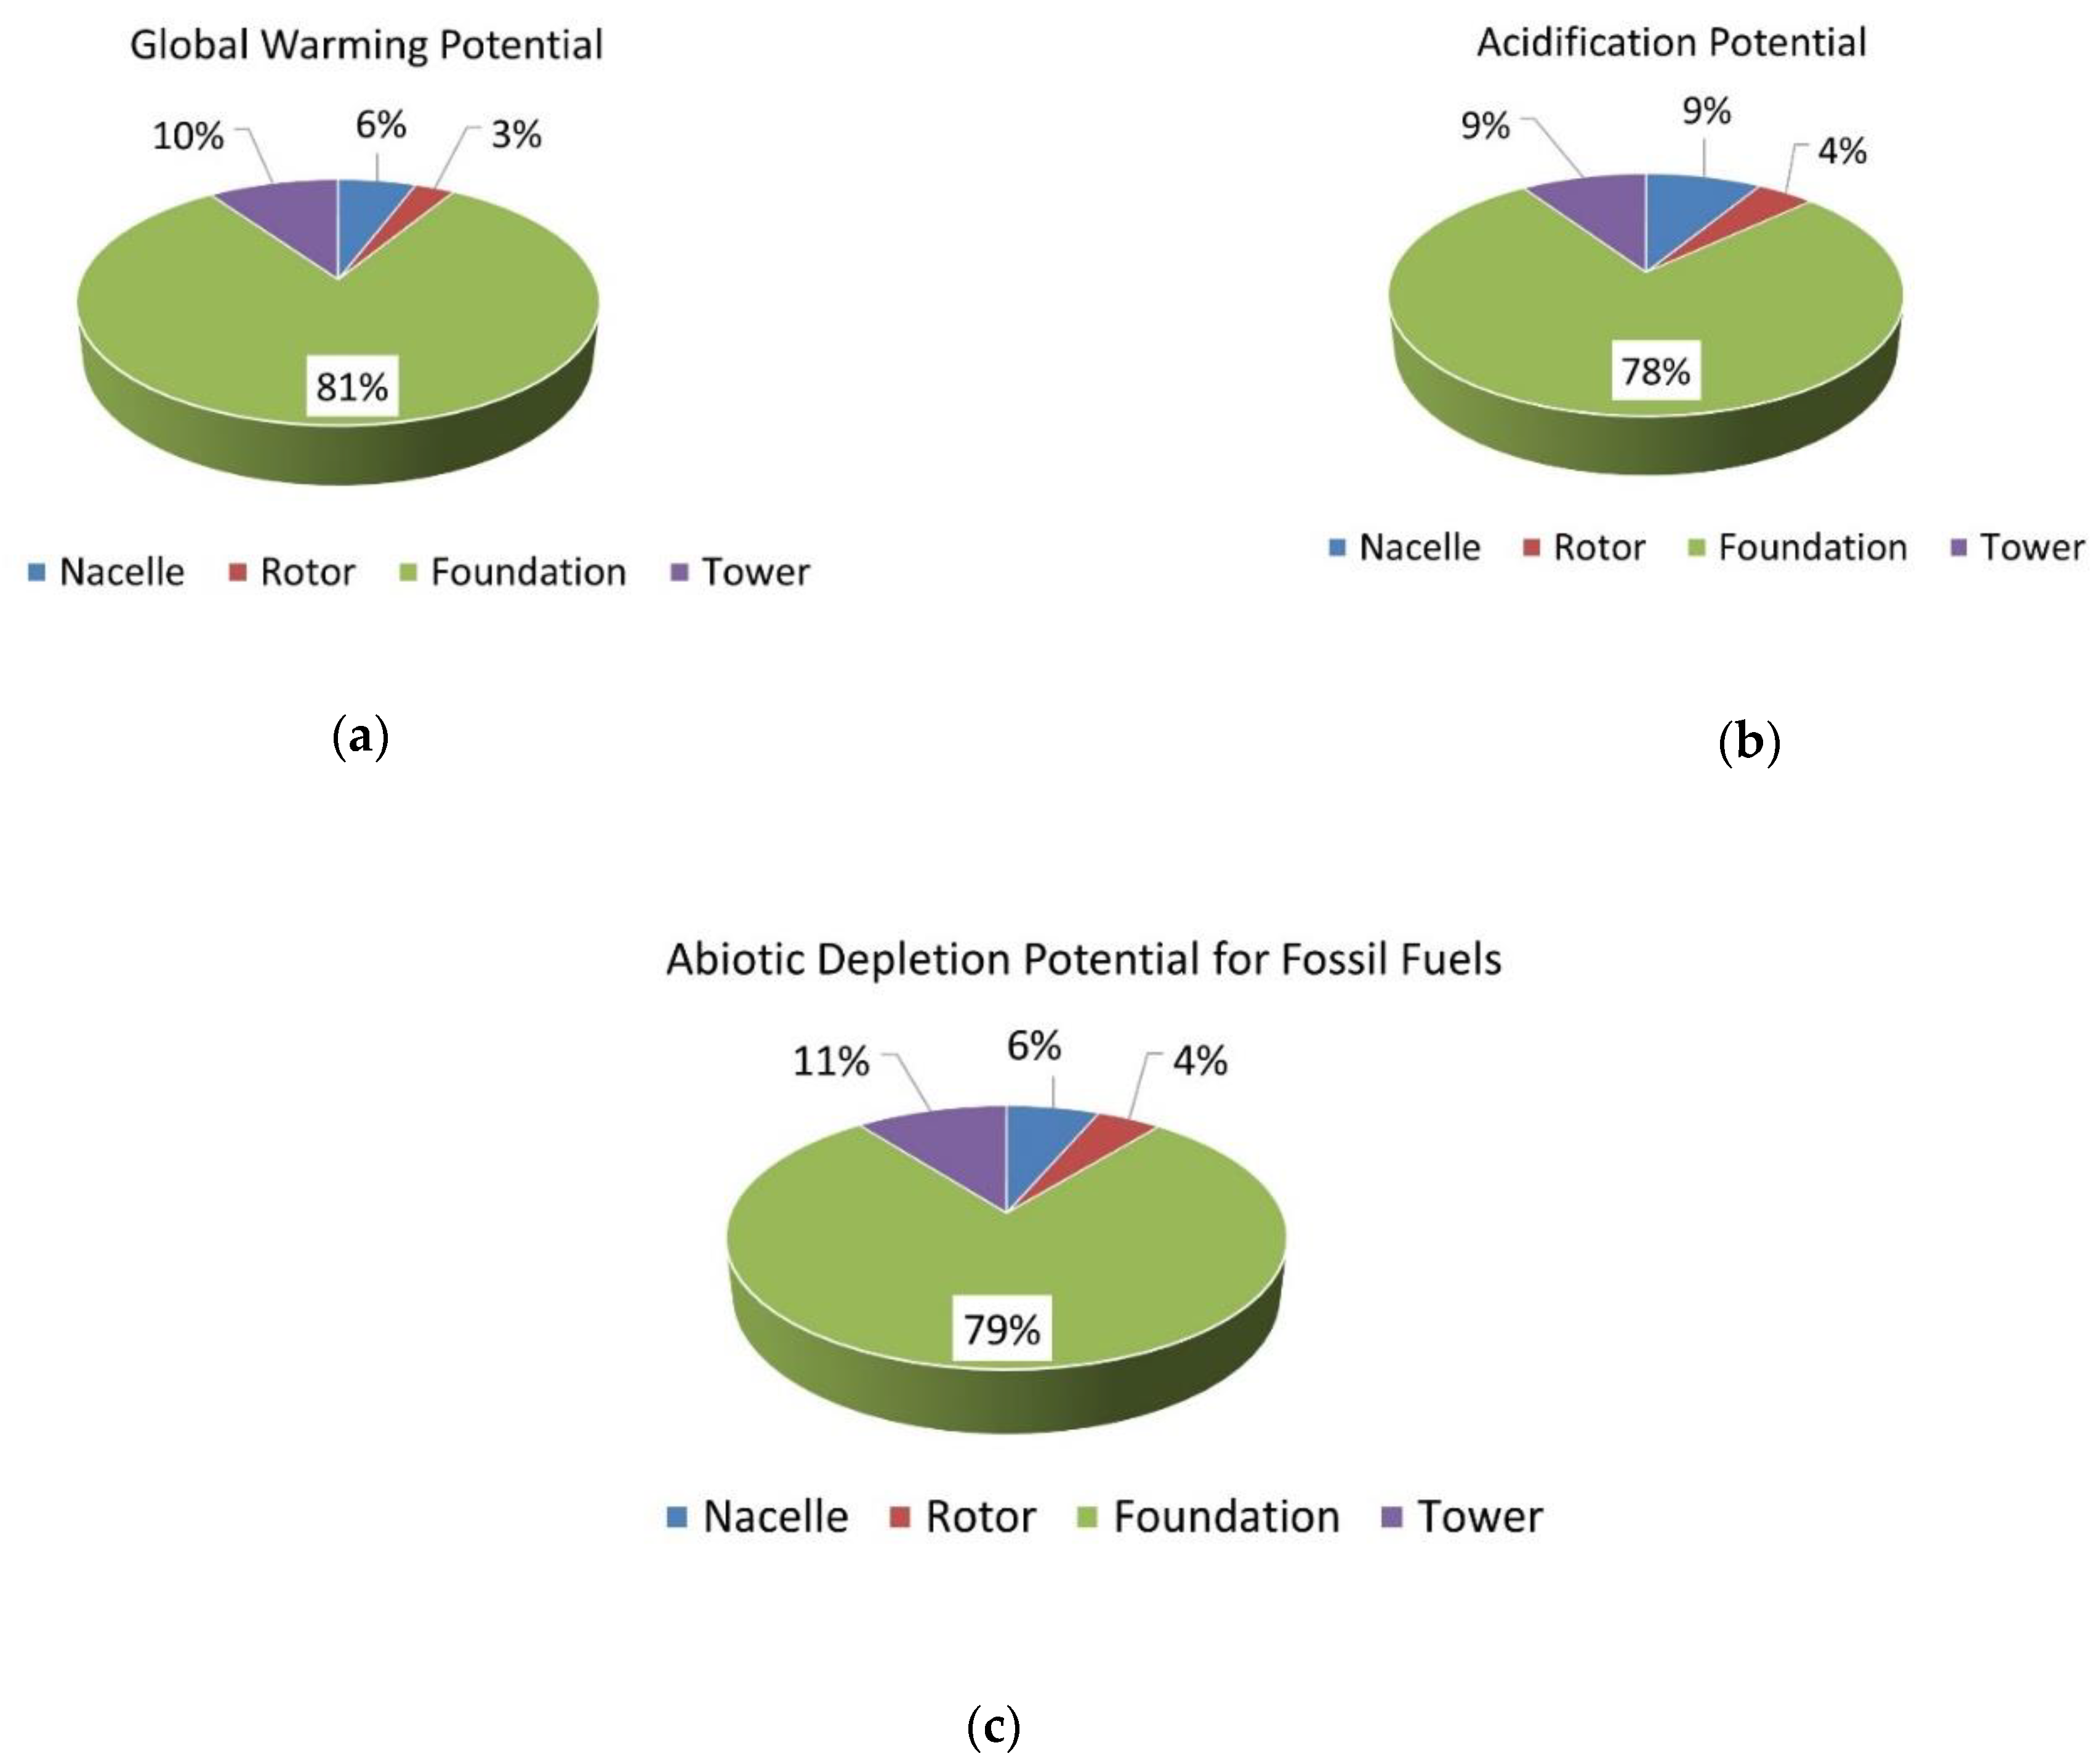
- Abiotic depletion potential for fossil fuels focused on the non-renewable resource is measured in MJ;
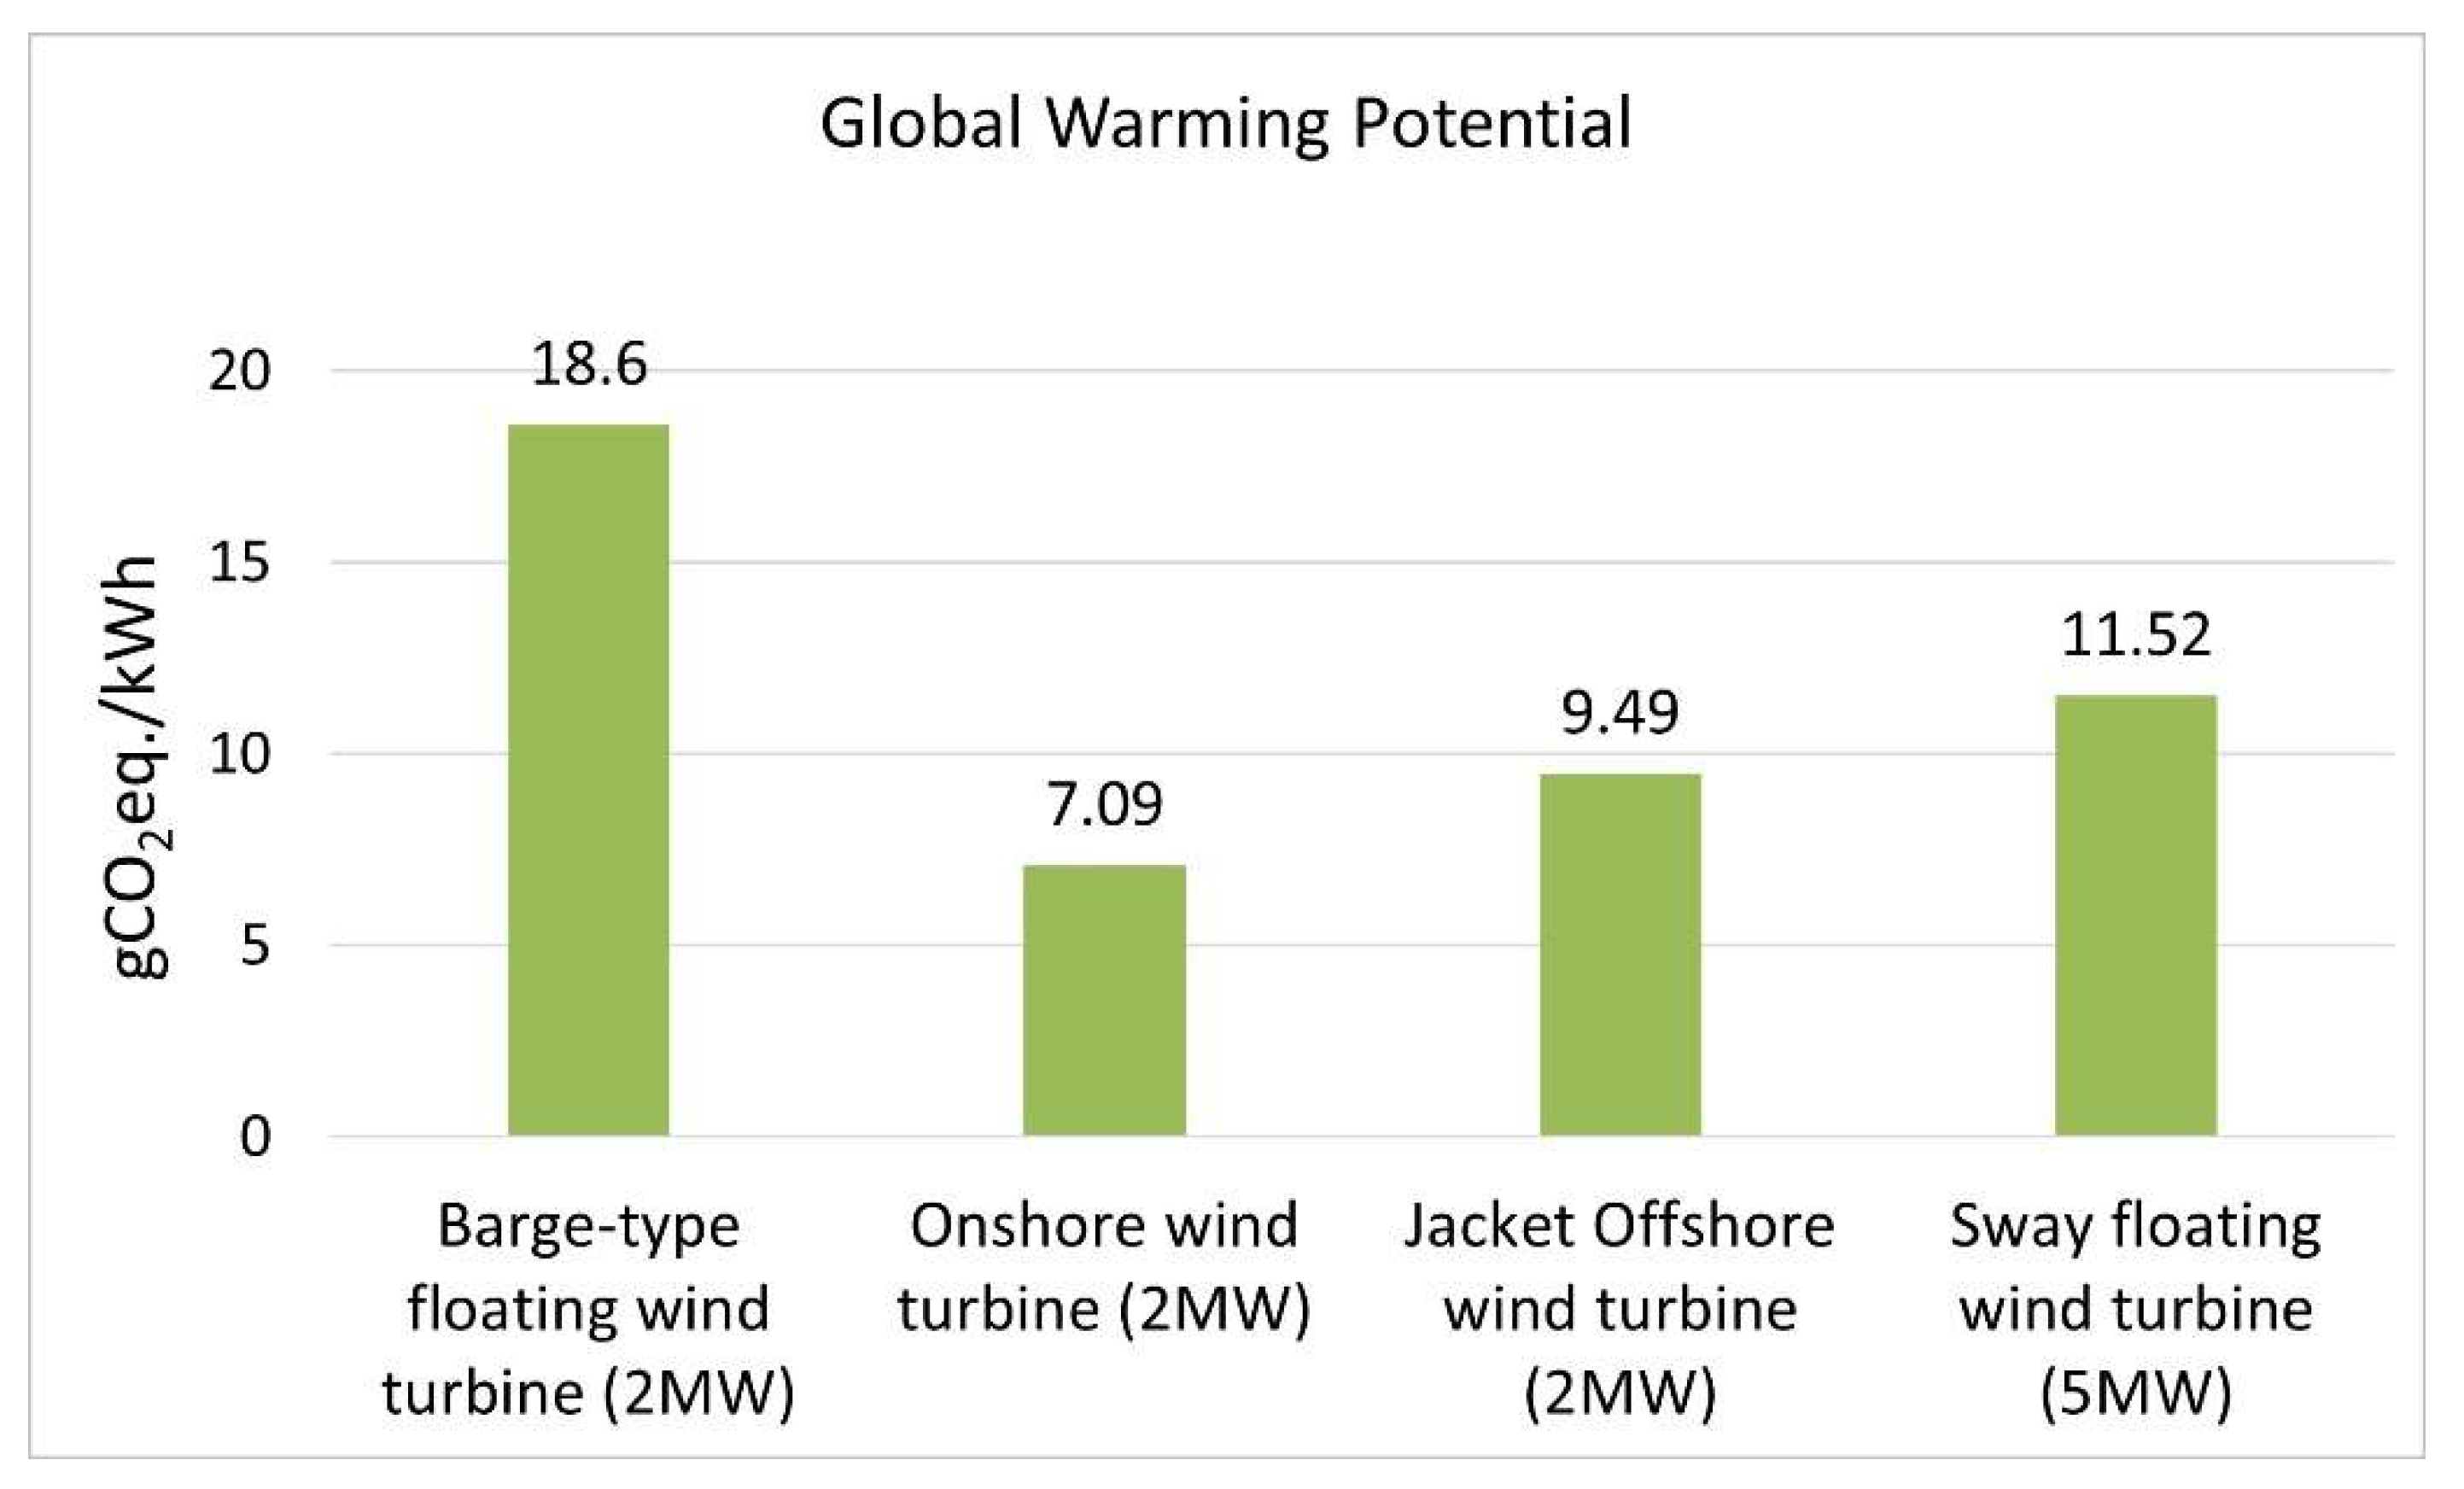
- Global warming potential is related to CO2 emissions measured in CO2-equivalent;
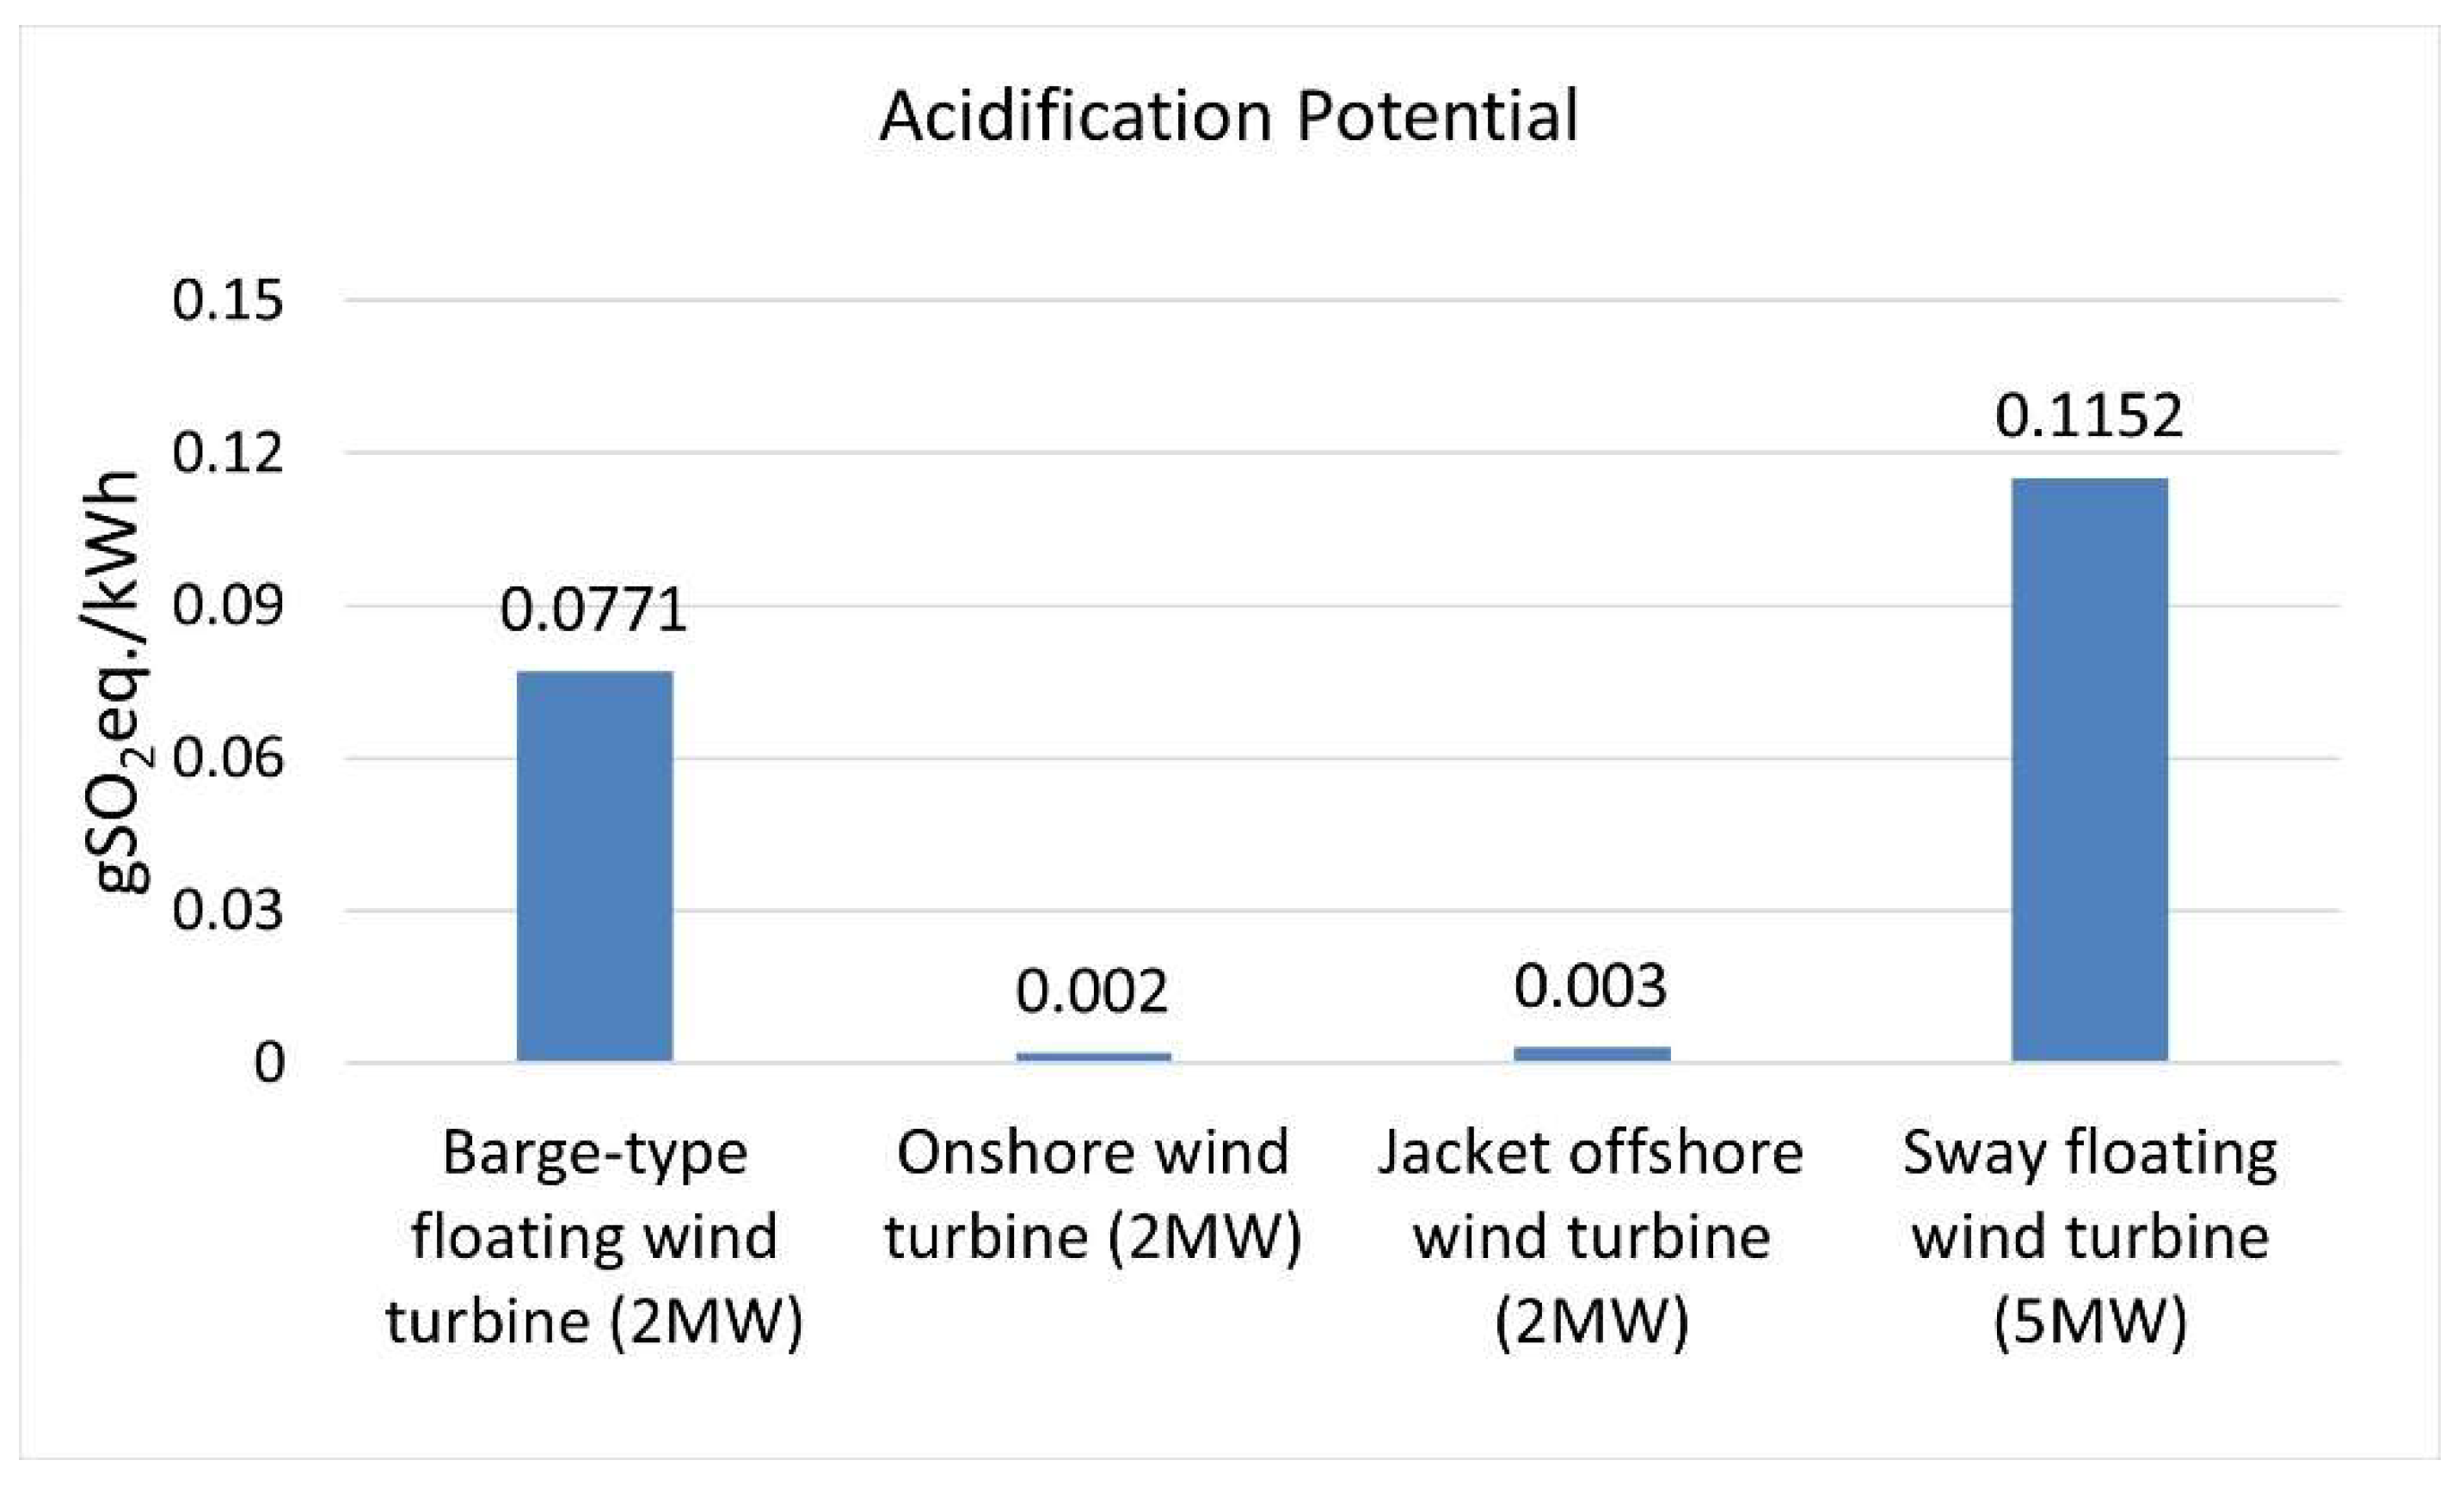
- AP values show aggregated acid air emissions measured in SO2-equivalent;
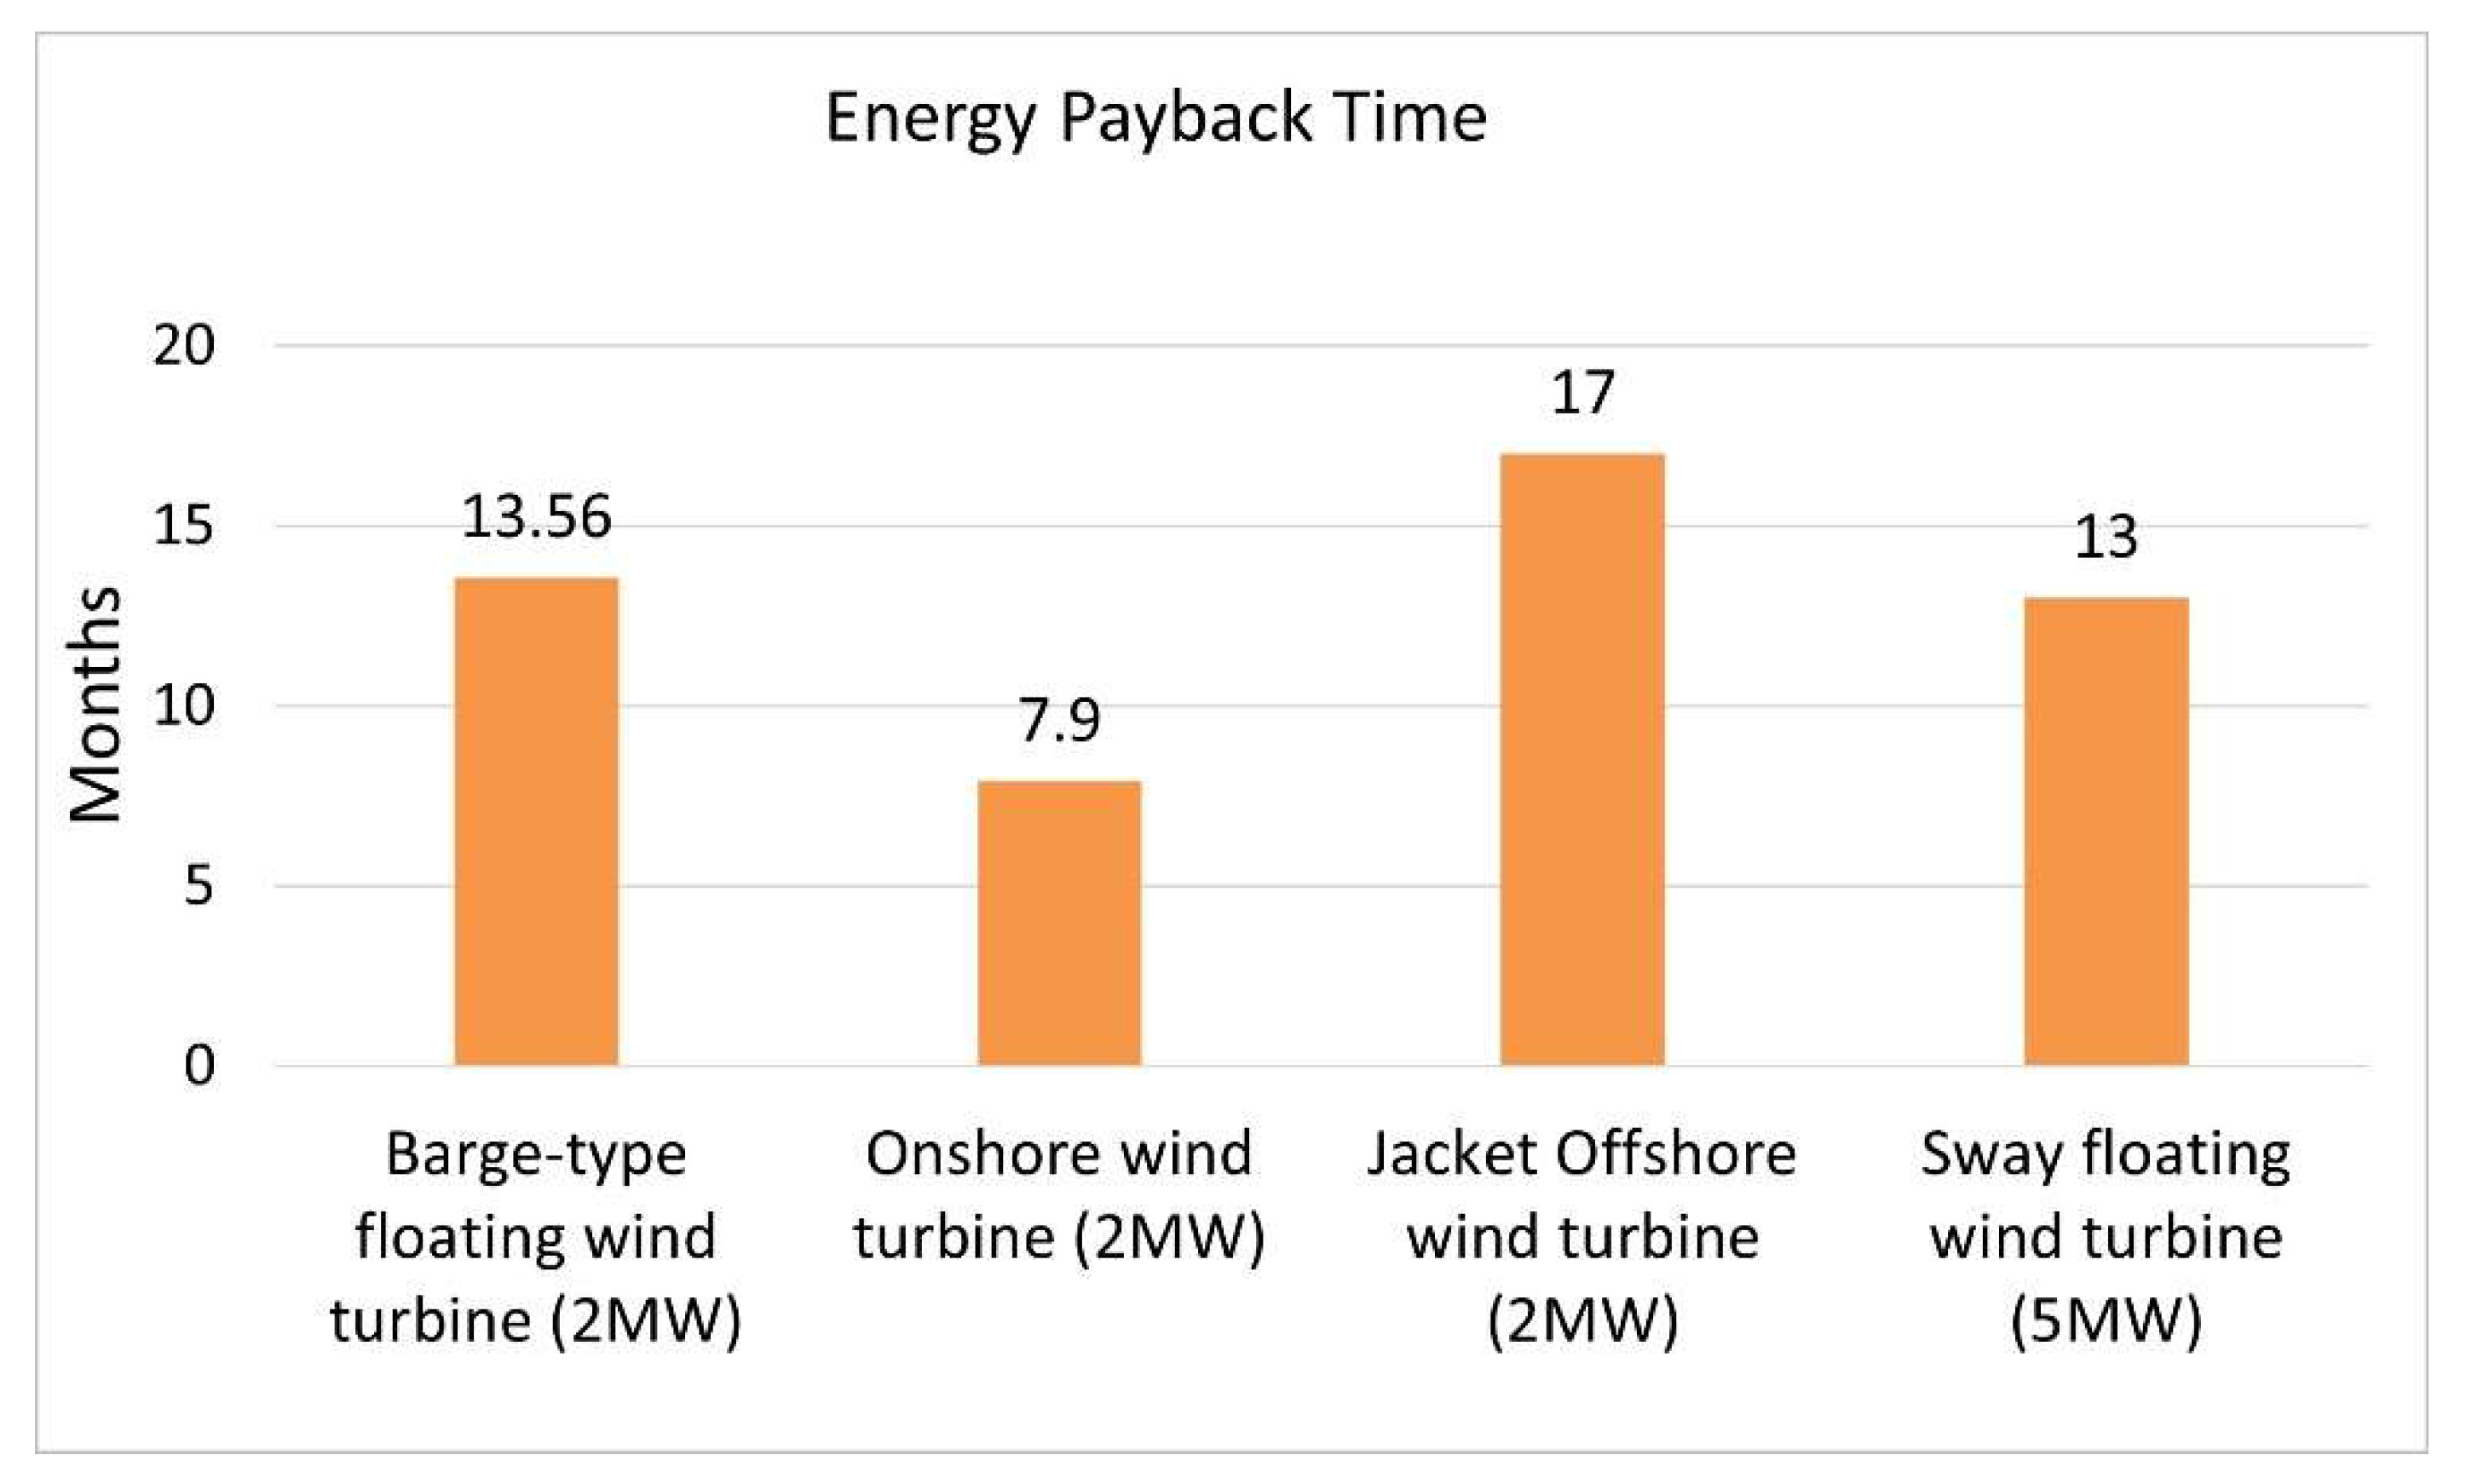
- The energy payback time, a ratio of primary energy to annual energy produced by a wind turbine, is calculated in months and years [11].
5.1. Comparison of the Barge-Type Floating Wind Turbine LCA Results with Those of Other Types of Wind Turbines
5.2. LCA of the Barge-Type Wind Turbine Transportations Scenarios
6. Conclusions
- The energy capacity of the barge-type floating wind turbine should be increased. With this rise, the GWP emissions will reduce, and energy payback time will decrease while increasing the annual energy yield.
- The platform and the tower, which are the most energy-consuming parts of the structure, should be designed optimally to save materials. The platform of the barge-type floating wind turbine is made of concrete and steel. Hence, a type of concrete having less CO2 emissions or an advanced high-strength concrete (saving material) could be preferred.
- As floating wind turbines are located in deep water, a combination of a platform of the barge-type wind turbine that includes a wave energy system should be developed. This combination could decrease the equivalent CO2 emissions by increasing the annual energy yield as described in [24].
- The lifetime of the wind turbine could be extended, e.g., to 25 or 30 years. Thus, the environmental impact (CO2 and SO2) per kWh of electricity generated would diminish.
Author Contributions
Funding
Institutional Review Board Statement
Informed Consent Statement
Data Availability Statement
Acknowledgments
Conflicts of Interest
References
- United Nations Sustainable Development. Take Action for the Sustainable Development Goals. 2021. Available online: https://www.un.org/sustainabledevelopment/energy/ (accessed on 1 March 2021).
- European Commission. Wind Energy. 2021. Available online: https://ec.europa.eu/commission/presscorner/detail/en/IP_20_2096 (accessed on 2 March 2021).
- Energy.gov. Advantages and Challenges of Wind Energy. 2021. Available online: https://www.energy.gov/eere/wind/advantages-and-challenges-wind-energy (accessed on 12 May 2021).
- Acciona.com. What Are the Benefits of Wind Power? ACCIONA|Business as Unusual. 2021. Available online: https://www.acciona.com/renewable-energy/wind-energy/?_adin=02021864894 (accessed on 6 March 2021).
- Thoubboron, K. Advantages and Disadvantages of Renewable Energy|Energy Sage Solar News. 2021. Available online: https://news.energysage.com/ (accessed on 11 June 2021).
- World Wind Energy Association. World Wind Capacity, World Wind Energy Association. 2021. Available online: https://wwindea.org/world-wind-capacity-at-650-gw/ (accessed on 20 January 2021).
- Wind Energy. Country. 2019. Available online: https://www.power-technology.com (accessed on 10 October 2019).
- Wind in Europe. European Statistical Data Support. 2019. Available online: https://windeurope.org/ (accessed on 25 October 2019).
- Wind Energy in Europe: Outlook to 2023. 2019. Available online: https://www.anev.org/wp-content/uploads/2019/10/Market-outlook-2019.pdf (accessed on 10 December 2019).
- EDF Renouvelables. Offshore Wind–EDF Renouvelables. 2020. Available online: https://www.edf-renouvelables.com/en/project-development/offshore-wind/ (accessed on 5 December 2020).
- Gkantou, M.; Rebelo, C.; Baniotopoulos, C. Life Cycle Assessment of Tall Onshore Hybrid Steel Wind Turbine Towers. Energies 2020, 13, 3950. [Google Scholar] [CrossRef]
- Martin, R. Floating Wind Turbines Could Provide Huge Amounts of Clean Power—If They Can Ever Compete on Cost MIT Technology Review. 2020. Available online: https://www.technologyreview.com/s/601481/floating-wind-farms-great-concept-implausible-economics/ (accessed on 17 September 2020).
- Pre-Sustainability. 2018. Available online: https://www.pre-sustainability.com/ (accessed on 18 March 2019).
- ISO. ISO 14040. Environmental Management-Life Cycle Assessment-Principles and Framework; International Organization for Standardization: Geneva, Switzerland, 2006. [Google Scholar]
- ISO. ISO 14044. Environmental Management-Life Cycle Assessment-Requirements and Guidelines; International Organization for Standardization: Geneva, Switzerland, 2006. [Google Scholar]
- Demir, N.; Taşkın, A. Life cycle assessment of wind turbines in Pınarbaşı-Kayseri. J. Clean. Prod. 2013, 54, 253–263. [Google Scholar] [CrossRef]
- Guezuraga, B.; Zauner, R.; Pölz, W. Life cycle assessment of two different 2 MW class wind turbines. Renew. Energy 2012, 37, 37–44. [Google Scholar] [CrossRef]
- Gervasio, H.; Rebelo, C.; Moura, A.; Veljkovic, M.; Simoesdasilva, L. Comparative life cycle assessment of tubular wind towers and foundations–Part 2: Life cycle analysis. Eng. Struct. 2014, 74, 292–299. [Google Scholar] [CrossRef]
- Stavridou, N.; Koltsakis, E.; Baniotopoulos, C.C. A comparative life-cycle analysis of tall onshore steel wind-turbine towers. Clean Energy 2019, 4, 48–57. [Google Scholar] [CrossRef]
- Alsaleh, A.; Sattler, M. Comprehensive life cycle assessment of large wind turbines in the US. Clean Technol. Environ. Policy 2019, 21, 887–903. [Google Scholar] [CrossRef]
- Lenzen, M.; Wachsmann, U. Wind turbines in Brazil and Germany: An example of geographical variability in life-cycle assessment. Appl. Energy 2004, 77, 119–130. [Google Scholar] [CrossRef]
- Kaldellis, J.; Apostolou, D. Life cycle energy and carbon footprint of offshore wind energy. Comparison with onshore counterpart. Renew. Energy 2017, 108, 72–84. [Google Scholar] [CrossRef]
- Huang, Y.-F.; Gan, X.-J.; Chiueh, P.-T. Life cycle assessment and net energy analysis of offshore wind power systems. Renew. Energy 2017, 102, 98–106. [Google Scholar] [CrossRef]
- Bhandari, R.; Kumar, B.; Mayer, F. Life cycle greenhouse gas emission from wind farms in reference to turbine sizes and capacity factors. J. Clean. Prod. 2020, 277, 123385. [Google Scholar] [CrossRef]
- Kasner, R.; Kruszelnicka, W.; Bałdowska-Witos, P.; Flizikowski, J.; Tomporowski, A. Sustainable Wind Power Plant Modernization. Energies 2020, 13, 1461. [Google Scholar] [CrossRef] [Green Version]
- Bonou, A.; Laurent, A.; Olsen, S.I. Life cycle assessment of onshore and offshore wind energy-from theory to application. Appl. Energy 2016, 180, 327–337. [Google Scholar] [CrossRef] [Green Version]
- Al-Behadili, S.; El-Osta, W. Life Cycle Assessment of Dernah (Libya) wind farm. Renew. Energy 2015, 83, 1227–1233. [Google Scholar] [CrossRef]
- Siddiqui, O.; Dincer, I. Comparative assessment of the environmental impacts of nuclear, wind and hydro-electric power plants in Ontario: A life cycle assessment. J. Clean. Prod. 2017, 164, 848–860. [Google Scholar] [CrossRef]
- Wang, Y.; Sun, T. Life cycle assessment of CO2 emissions from wind power plants: Methodology and case studies. Renew. Energy 2012, 43, 30–36. [Google Scholar] [CrossRef]
- Uddin, S.; Kumar, S. Energy, emissions and environmental impact analysis of wind turbine using life cycle assessment technique. J. Clean. Prod. 2014, 69, 153–164. [Google Scholar] [CrossRef]
- Oebels, K.B.; Pacca, S. Life cycle assessment of an onshore wind farm located at the northeastern coast of Brazil. Renew. Energy 2013, 53, 60–70. [Google Scholar] [CrossRef]
- Wagner, H.-J.; Baack, C.; Eickelkamp, T.; Epe, A.; Lohmann, J.; Troy, S. Life cycle assessment of the offshore wind farm alpha ventus. Energy 2011, 36, 2459–2464. [Google Scholar] [CrossRef]
- Vargas, A.; Zenón, E.; Oswald, U.; Islas, J.; Güereca, L.; Manzini, F. Life cycle assessment: A case study of two wind turbines used in Mexico. Appl. Therm. Eng. 2015, 75, 1210–1216. [Google Scholar] [CrossRef]
- Martínez-Cámara, E.; Sanz, F.; Pellegrini, S.; Jimenez, E.; Blanco, J. Life cycle assessment of a multi-megawatt wind turbine. Renew. Energy 2009, 34, 667–673. [Google Scholar] [CrossRef]
- Tremeac, B.; Meunier, F. Life cycle analysis of 4.5 MW and 250 W wind turbines. Renew. Sustain. Energy Rev. 2009, 13, 2104–2110. [Google Scholar] [CrossRef]
- Xu, L.; Pang, M.; Zhang, L.; Poganietz, W.-R.; Marathe, S.D. Life cycle assessment of onshore wind power systems in China. Resour. Conserv. Recycl. 2018, 132, 361–368. [Google Scholar] [CrossRef]
- Chipindula, J.; Botlaguduru, V.S.V.; Du, H.; Kommalapati, R.R.; Huque, Z. Life Cycle Environmental Impact of Onshore and Offshore Wind Farms in Texas. Sustainability 2018, 10, 2022. [Google Scholar] [CrossRef] [Green Version]
- Hywind Scotland Pilot Park. 2019. Available online: https://www.equinor.com/ (accessed on 15 May 2020).
- Weinzettel, J.; Reenaas, M.; Solli, C.; Hertwich, E.G. Life cycle assessment of a floating offshore wind turbine. Renew. Energy 2009, 34, 742–747. [Google Scholar] [CrossRef]
- Raadal, H.L.; Vold, B.I.; Myhr, A.; Nygaard, T.A. GHG emissions and energy performance of offshore wind power. Renew. Energy 2014, 66, 314–324. [Google Scholar] [CrossRef]
- Eligoz, N.; Bas, B. Life Cycle Assessment of a multi-use offshore platform: Combining wind and wave energy production. Ocean. Eng. 2017, 145, 430–443. [Google Scholar]
- Kausche, M.; Adam, F.; Dahlhaus, F.; Großmann, J. Floating offshore wind–Economic and ecological challenges of a TLP solution. Renew. Energy 2018, 126, 270–280. [Google Scholar] [CrossRef]
- The FLOATGEN Project Deliverable. 2019. Available online: https://floatgen.eu/en/node/30 (accessed on 5 June 2019).
- Floatgen-Design and Construction of the First Floating Wind Turbine in France. 2019. Available online: https://www.researchgate.net/publication/332014174_FLOATGEN-Design_and_construction_of_the_first_floating_wind_turbine_in_France (accessed on 4 December 2019).
- GEMIS. Global Emissions Model for Integrated Systems. 2021. Available online: http://iinas.org/news.html (accessed on 20 January 2020).
- Kang, J.; Wang, Z.; Soares, C.G. Condition-Based Maintenance for Offshore Wind Turbines Based on Support Vector Machine. Energies 2020, 13, 3518. [Google Scholar] [CrossRef]
- Properzi, S.; Herk-Hansen, H. Life cycle assessment of a 150 MW offshore wind turbine farm at Nysted/Roedsand, Denmark. Int. J. Environ. Sustain. Dev. 2002, 1, 113. [Google Scholar] [CrossRef]
- Haapala, K.R.; Prempreeda, P. Comparative life cycle assessment of 2.0 MW wind turbines. Int. J. Sustain. Manuf. 2014, 3, 170. [Google Scholar] [CrossRef]


| Authors | Tower Type | Height (m) | Size (MW) | Location | Contributions |
|---|---|---|---|---|---|
| Bonou et al. [26] | Onshore and offshore | 99.5–92.5 onshore 68.25–87.72 offshore | 2.3–3.2 onshore 4.0–6.0 offshore | Europe | The GHG emissions of offshore wind turbine are higher due to more materials and resources (fuel, oil, etc.) for erection and maintenance. |
| Al-Behadili and El-Osta [27] | Onshore | 71 | 1.65 | Libya | Using recycled wind turbine materials gains a reduction of CO2 emissions by 55%. |
| Siddiqui and Dincer [28] | - | - | 2.0 | Canada | Wind energy has a large environmental impact compared nuclear and hydropower due to its manufacturing stage. |
| Wang and Sun [29] | Onshore and offshore | 1.6 and 3.0 | China | Using the short route would decrease the CO2 emissions of the transportation stage. | |
| Uddin and Kumar [30] | Vertical and horizontal axis | 0.3 and 0.5 | Thailand | Reuse of materials could reduce environmental impacts by about 15%. | |
| Oebels and Pacca [31] | Onshore | 2.0 and 3.0 | Brazil | Steel materials comprise more than 50% of the total CO2 emissions. | |
| Wagner et al. [32] | Offshore | - | 5.0 | German | The foundation and submarine cables cause an increase in total CO2 emissions. |
| Vargas et al. [33] | - | - | 2.0 | Mexico | The largest energy requirement and environmental impacts come from the nacelle and tower. |
| Martinez et al. [34] | Onshore | 70 | 2.0 | Spain | The largest environmental impacts and energy requirement come from the foundation and nacelle, respectively. |
| Tremeac and Meunier [35] | Onshore | 124 | 4.5 and 0.25 | France | Minimizing the transportation stage, such as short routes and vehicles emitting lower CO2, can be achieved. |
| Xu et al. [36] | Onshore | 65, 50 | 1.5 and 0.75 | China | Taller wind turbines can improve environmental impact indicators. |
| Chipindula et al. [37] | Onshore and offshore | - | 1.0, 2.0, 2.3 and 5.0 | Texas | There is an inverse correlation between EPT and the turbine size. If the size increases, EPT decreases. |
| Researchers | Year | Hub-Height (m) | Wind Turbine Size (MW) | Water Depth (m) | General Description |
|---|---|---|---|---|---|
| Weinzettel et al. [39] | 2009 | 200 | 5 | 100–300 | Sway floating wind turbine (5 MW) and an offshore wind turbine (2 MW) were examined considering LCA and energy payback time. |
| Raadal et al. [40] | 2014 | 90 | 5 | 100 | UMaine spar, MIT TLB (tension-leg-buoy), sway (tension-leg-spar), UMaine semisubmersible, UMaine TLP (tension-leg-platform) and OC4 jacket turbines were investigated considering their LCAs. |
| Eligoz and Bas [41] | 2017 | 90 | 5 | - | The LCAs of semisubmersible and spar platform floating wind turbines were analysed and compared. |
| Kausche et al. [42] | 2018 | - | 6 | 40–200 | Different material combinations of floating wind tower (tension-leg-platform) were investigated. These combinations were steel, steel-concrete, and steel-reinforced concrete. |
| Components | Unit | Value |
|---|---|---|
| Rotor | tonne | 28.5 |
| Nacelle | tonne | 64 |
| Tower | tonne | 183 |
| Platform | tonne | 5472.5 |
| Component | Stage | Comment | Unit |
|---|---|---|---|
| TOWER | Manufacture | Steel | 133 t |
| TOWER | Manufacture | Steel (Transition part) | 50 t |
| ROTOR | Manufacture | Glass Fibre | 23.5 t |
| ROTOR | Manufacture | Cast Iron | 5 t |
| NACELLE | Manufacture | Steel | 35 t |
| NACELLE | Manufacture | Aluminium | 2 t |
| NACELLE | Manufacture | Copper | 7 t |
| NACELLE | Manufacture | Glass-Reinforced Plastic | 4 t |
| NACELLE | Manufacture | Cast Iron | 16 t |
| PLATFORM | Manufacture | Concrete | 4350 t |
| PLATFORM | Manufacture | Steel | 912.5 t |
| PLATFORM | Manufacture | Cast Iron | 60 t |
| PLATFORM | Manufacture | Nylon Fibre | 126 t |
| PLATFORM | Manufacture | Polyurethane | 24 t |
| TOWER-RNA 2 | Transport | Vessel | 165,300 tkm |
| TOWER-RNA | Transport | Truck | 13,775 tkm |
| PLATFORM | Transport | Truck | 87,000 tkm |
| PLATFORM | Transport | Truck | 16,560 tkm |
| PLATFORM | Transport | Truck | 77,450 tkm |
| PLATFORM | Transport | Truck | 94,500 tkm |
| PLATFORM | Transport | Truck | 2400 tkm |
| PLATFORM | Transport | Truck | 6000 tkm |
| TOWER | Erection | Crane | 7.92 h |
| ROTOR | Erection | Crane | 10.56 h |
| NACELLA | Erection | Crane | 10.56 h |
| PLATFORM | Erection | Crane and Tugboat | 105.56 h |
| TOWER | Disposal & End of Life | Landfill | 27.45 t |
| ROTOR | Disposal & End of Life | Landfill | 24.25 t |
| NACELLE | Disposal & End of Life | Landfill | 12.55 t |
| PLATFORM | Disposal & End of Life | Landfill | 4500.675 t |
| TOWER | Disposal & End of Life | Transport to | 549 tkm |
| ROTOR | Disposal & End of Life | Transport to | 485 tkm |
| NACELLE | Disposal & End of Life | Transport to | 251 tkm |
| FOUNDATION | Disposal & End of Life | Transport to | 900,013.5 tkm |
| LCA Results | Unit | Value |
|---|---|---|
| Abiotic depletion potential for fossil fuels (ADPF) | MJ | 18,429,264 |
| Acidification potential (AP) | kg SO2 eq. | 5945 |
| Global warming potential (GWP) | kg CO2 eq. | 2,187,947 |
| Energy payback time (EPT) | years | 1.13 |
| Scenario | Road Distance (km) | Railway Distance (km) | Seaway Distance (km) |
|---|---|---|---|
| Truck | 2720 | - | - |
| Train | 670 | 2270 | - |
| Vessel | 570 | - | 2022 |
| Hybrid | 2190 | - | 600 |
| Units | Hybrid Scenario | Truck Scenario | Train Scenario | Vessel Scenario | |
|---|---|---|---|---|---|
| Total CO2 | tonnes | 21.3 | 22.6 | 20.6 | 25.9 |
| CO2 | g.eq./kWh | 0.178 | 0.188 | 0.172 | 0.216 |
Publisher’s Note: MDPI stays neutral with regard to jurisdictional claims in published maps and institutional affiliations. |
© 2021 by the authors. Licensee MDPI, Basel, Switzerland. This article is an open access article distributed under the terms and conditions of the Creative Commons Attribution (CC BY) license (https://creativecommons.org/licenses/by/4.0/).
Share and Cite
Yildiz, N.; Hemida, H.; Baniotopoulos, C. Life Cycle Assessment of a Barge-Type Floating Wind Turbine and Comparison with Other Types of Wind Turbines. Energies 2021, 14, 5656. https://doi.org/10.3390/en14185656
Yildiz N, Hemida H, Baniotopoulos C. Life Cycle Assessment of a Barge-Type Floating Wind Turbine and Comparison with Other Types of Wind Turbines. Energies. 2021; 14(18):5656. https://doi.org/10.3390/en14185656
Chicago/Turabian StyleYildiz, Nurullah, Hassan Hemida, and Charalampos Baniotopoulos. 2021. "Life Cycle Assessment of a Barge-Type Floating Wind Turbine and Comparison with Other Types of Wind Turbines" Energies 14, no. 18: 5656. https://doi.org/10.3390/en14185656
APA StyleYildiz, N., Hemida, H., & Baniotopoulos, C. (2021). Life Cycle Assessment of a Barge-Type Floating Wind Turbine and Comparison with Other Types of Wind Turbines. Energies, 14(18), 5656. https://doi.org/10.3390/en14185656