1. Introduction
Global warming has put great threat on the cooling efficiency of the natural draft dry cooling system (NDDCs). Considering the significant water saving benefit of dry cooling, the natural draft hybrid cooling system (NDHCs) offers a potential solution between the conflict between energy and water for arid areas [
1]. Usually, the basic heat load is dissipated in heat exchangers of the dry section, and the wet section is put into operation under high ambient temperature. In the design of all hybrid cooling systems, the dry section has the same form, finned heat exchanger bundles in a delta form with a specific angle [
2]. As for the wet section, there are three main kinds according to the contacts between the water and air as follows.
The simplest structure is achieved by high-pressure nozzles located in the front of the dry section [
3]. Water from the environment is injected into the tower inlet to pre-cool the air. The highest performance of the pre-cooled system is corresponded to the condition where all air passing through the dry section reaches its wet dry bulb temperature. At the same time, water from the nozzles is totally evaporated. This is mainly determined by the spray areas water flow rate [
4], the nozzle diameter [
5] and the water pressure [
6]. According to the 3-D simulation results of a 600 MW cooling system, there will need to be water spraying of 88 kg/s, and the backpressure decreased about 5 kPa. The evaporated mass flow rate is nearly one-third of the pure wet cooling system, while backpressure drop of 15 kPa can be achieved by wet cooling at the same condition. To reduce the mass flow rate of the spraying water, packing fill from the natural draft wet cooling system (NDWCs) is adopted to expand the mass transfer areas [
7]. The stages [
8] and layout [
9] of the fill are optimized according to the airside velocity distribution to further improve the evaporated rate. There is about an average of 5% improvement of the heat transfer rate with water consumption of 25 kg/s [
10,
11]. However, during the weather with low temperature and/or high humidity, the loss of fills brings a decrease of the heat transfer rate [
12].
The second way focuses on spraying directly on the surface of heat exchangers, firstly proposed by Heyns [
13] for direct dry cooling, where steam flows inside the heat exchangers. Water film is formed and the cooling system is operated as an evaporative condenser by deluging. According to the experiments of the cooling system and simulation results, the evaporated mass flow rate of water drops about 20% compared with the pre-cooled design at the same power output [
14]. The deluge section consists of galvanized steel tubes to replace the original bare tube. It cannot be applied to the dense finned heat exchangers in the natural dry cooling tower due to the corrosion issues [
15].
To address the unfavorable characteristics of the above two designs, inspired by the plume-eliminated tower [
16], air flows in parallel of spraying-form [
17] and fill-adopted form [
18] are re-concerned recently. Heat exchangers surround the tower vertically and the wet section is horizontally arranged above the tower supports. The airflow passes through the wet section and heat exchangers at the same time. There is more air passing through the tower compared with other designs due to the larger inlet areas of air. The water outlet temperature difference of hybrid cooling and dry cooling can reach 20 K, with only a 70% water consumption rate of the pure wet cooling [
19]. Cooling system selection is a trade-off between the growth of water evaporation and cooling capacity. The highest heat transfer rate is not necessarily a cooling system that achieves the optimal operation mode [
20]. In our previous studies, the annual operation costs of NDHCs, NDDCs, NDWCs, and pre-cooled NDDCs are analyzed [
19], it was found that nearly 200
$/h can be saved with conditions in 2018 compared to NDDCs.
There have been many studies regarding evaporated cooling integration to typical dry cooling in arid areas. The hybrid cooling with airflows in parallel design gives a potential solution for water saving, performance enhancement and maintenance issues like corrosion. A cost-effective operation is mainly accomplished by decreasing water temperature flows into the wet section, most heat is dissipated in the dry section namely.
Hybrid cooling in existing studies is designed to pump as much circulating water as possible into all sections. Water saving is achieved by decreasing the inlet temperature of the wet section. The biggest advantage, flexible switching of heat load and water consumption, is not fully utilized. There are three reasons limiting its application:
(1) Performances of dry and wet sections interact with each other in the highly integrated system, increasing the complexity of the operation strategies response to ambient conditions.
(2) The raise of pump power due to the longer flow path, including devices of heat exchangers and packing fills simultaneously, cannot be evaluated with heat transfer. That is the main reason all water passes through both dry and wet sections in the existing design, maintaining a constant pump power.
(3) In view of the energy system, output power of a plant depends on the power grid. It is more practical to decrease the water and coal consumption rate under a constant load, other than to boost power output.
To address the above problems, this paper examines eight different operation schemes to reveal the relationships of ambient conditions and operation schemes firstly. The operating schemes can be divided into two modes: Serial and parallel in the view of circulating water. With full consideration of the flow loss of both airside and waterside, a 660 MW thermal cycle of a power generating unit coupled with hybrid cooling, dry cooling and wet cooling is simulated to analyze the influence of operation strategies of the cooling system. In this way, variations of pump power and thermal characteristics are converted into the annual economic performances of the whole system.
Based on a detailed description of the energy system, models and evaluation indicators (
Section 2 and
Section 3), the influence of operation schemes and ambient conditions on the thermal performance are characterized in
Section 4.3 and
Section 4.4. The optimal operation strategy based on practical parameters is designed in
Section 4.5 to demonstrate the water-energy nexus.
2. Description of the System
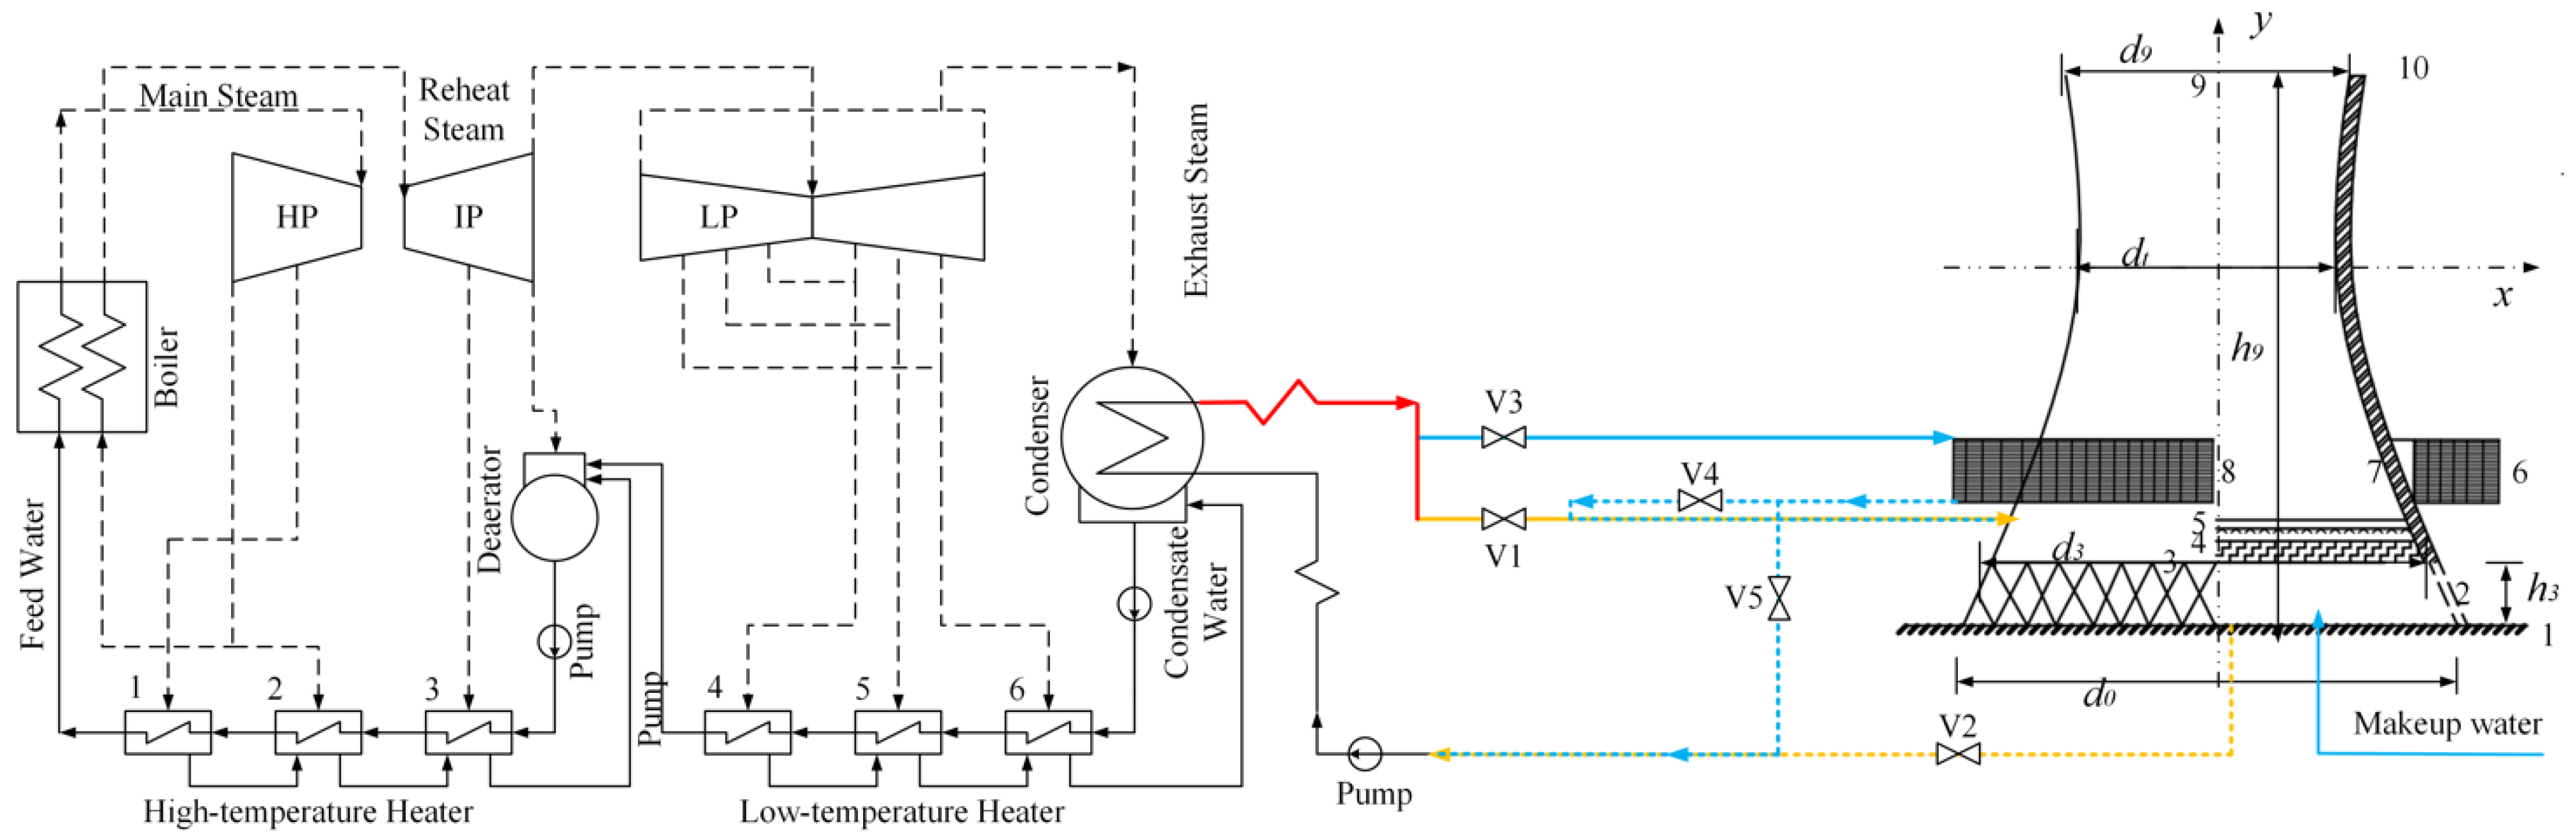
Figure 1 shows the schematic diagram of a thermal power generating unit coupled with the hybrid cooling system. The left side in
Figure 1 represents the thermal cycle, which converts the heat in the boiler into power. Condensate water from the condenser is successively heated by extraction steam and flows to the boiler. Absorbing the heat from the chemical energy released by burning coal, steam with high pressure and high temperature is produced. The kinetic energy of the steam is then converted into mechanical energy in the turbine, leaving exhaust steam cooled in the condenser to maintain a low backpressure of the cycle. Lower backpressure brings a higher efficiency of the thermal cycle, and hence less coal consumption, as well as less carbon emission, can be achieved with a constant power output.
The exhaust steam from the turbine is cooled by circulating water of the cooling system. Lower backpressure of the turbine will be achieved if more heat is dissipated in the cooling system. Circulating water transfers heat to the air in the right side in
Figure 1. The water flow patterns can be adjusted by valves in
Figure 1 in a serial or parallel mode.
(1) For the serial operation of circulating water, keep the valve V1 close and V3 open. The water is pumped into the dry section firstly. Close V5 if there is heat dissipated in the wet section, adjust V4 to control the water mass flow rate of the wet section.
(2) As for the parallel operation mode, close V4 only and adjust V1 and V3 to change the ratio of water mass flow rate of the dry and wet sections.
(3) The hybrid cooling system can be also operated under a pure dry mode (close V1, V2 and V4) or pure wet mode (close V3, V4 and V5).
The above operation strategy can be expressed more clearly in the view of ratios of water mass flow rate in each section to the total, which are defined as:
where
mw,d and
mw,w represent the mass flow rate of water of dry and wet section respectively,
mw,tot is the mass flow rate of circulating water flowing into cooling system.
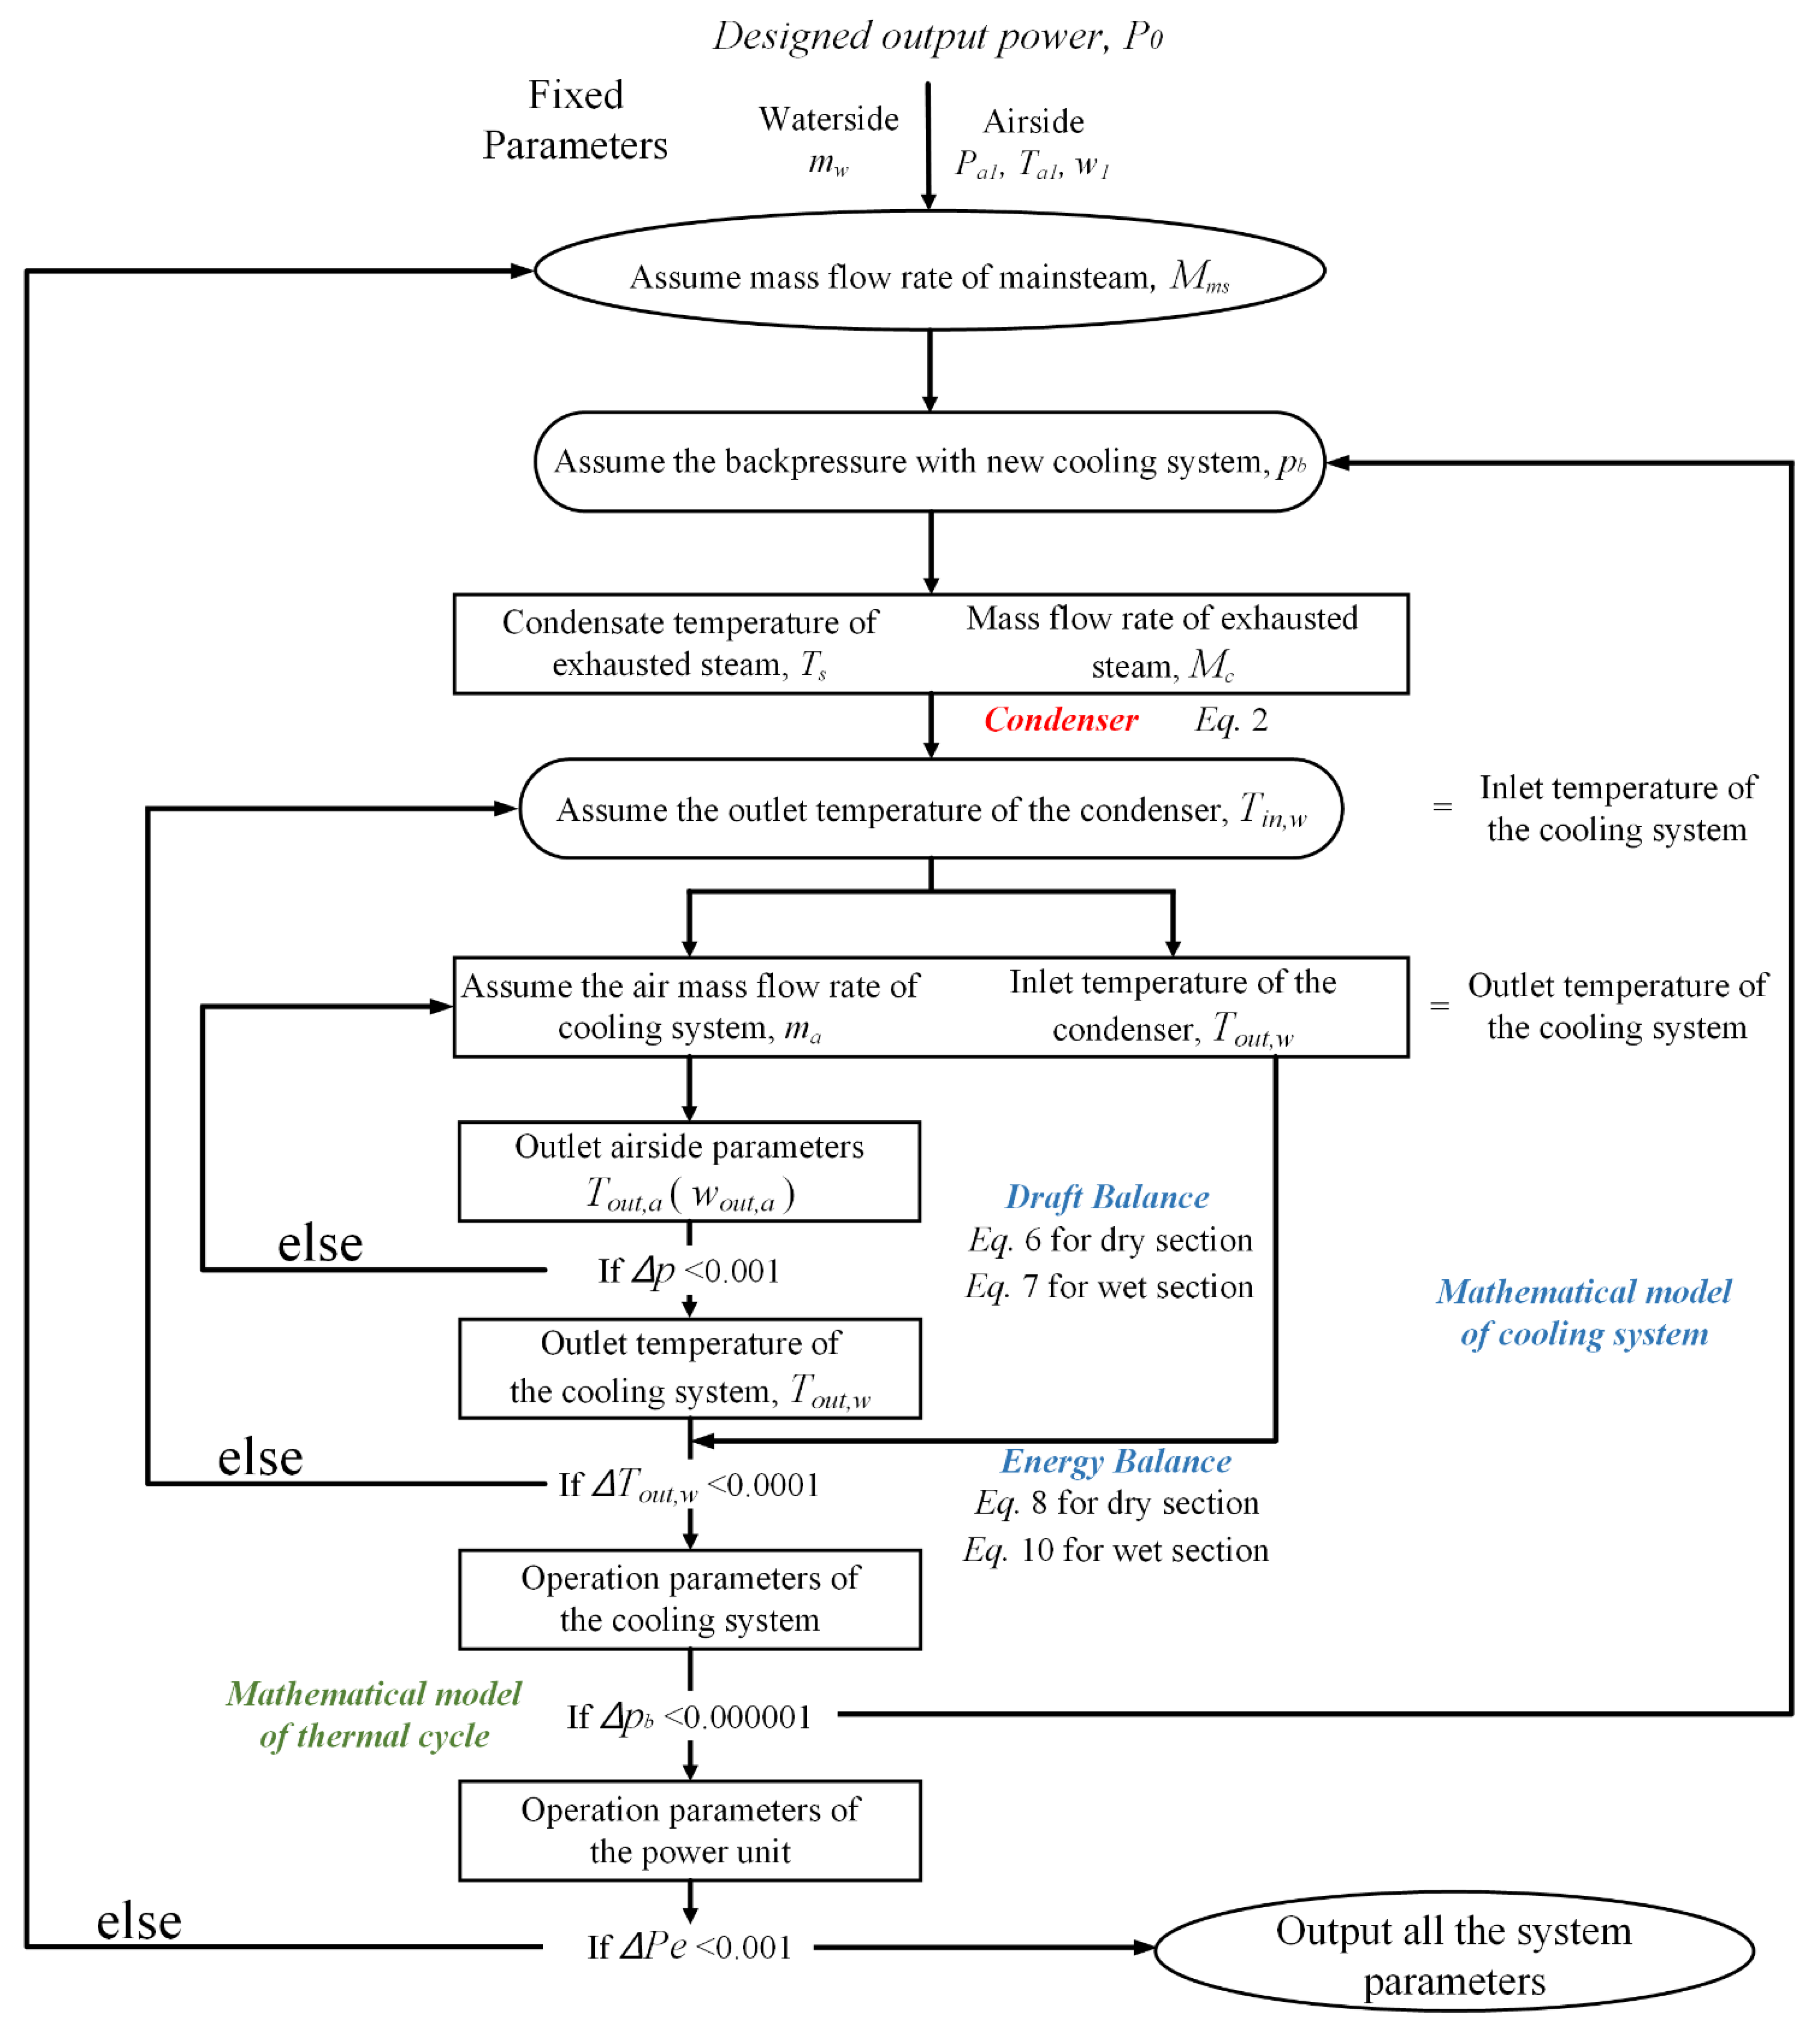
3. Mathematical Models
To evaluate the performance of different cooling systems, the parameters of the practical operation power generating unit with NDDCs are chosen as the design conditions. When the circulating water is pumped into a new cooling system, such as NDWCs or NDHCs, water temperature at the inlet of the condenser changes. A new backpressure is obtained using the design conditions of exhausted steam. The temperature of circulating water at the outlet of the condenser is acquired with a certain mass flow rate of the circulating water, which is described in
Section 3.1. Then the operation parameters of the cooling system are determined with control equations, which are shown in
Section 3.2. The power load of the unit can then be obtained with mathematical models of the power generating unit, which can be seen in
Section 3.3. Repeat the above steps until all the control equations are satisfied. The detailed iteration steps, as well as the input and output variables are shown in
Figure 2.
3.1. Condenser Model
As shown in
Figure 2, the first step is to obtain the inlet temperature of the circulating water of the new cooling system. The control equations are proposed based on the standards from the Heat Exchange Institute’s continuing program.
where
Mc and Δ
hc are the mass flow rate and enthalpy drop of exhausted steam, respectively, (
hA)
c is the heat transfer characteristics of the condenser, which can be obtained by the 10ed. HEI formula [
21],
where
K0,
Kw,
FM and
FC are correction factors.
On the other hand, according to the thermophysical properties of saturated steam and condensate water [
22], the condensate temperature,
Ts, is in one-to-one correspondence to its enthalpy drop and the backpressure,
Both the inlet and outlet temperature of circulating water of the cooling system can be determined with an initial backpressure.
3.2. Cooling System
The outlet temperature of circulating water at the condenser obtained from
Section 3.1 is chosen as the initial value. The second part is to check the consistency of the outlet temperature of the circulating water of the cooling system, which is obtained with the help of the model of the cooling system, and the inlet temperature of the circulating water at the condenser. It is solved with the draft, heat and mass balances of the detailed cooling system.
(1) Draft equations of individual sections
Air passing through heat exchanges or fills experiences certain losses caused by the device. The flow equation can be expressed as the inside and outside heat exchanges or fills [
2],
For the dry section, losses consist of contraction (
kctc), expansion (
kcte) and the core areas (
khe𝜃) [
23],
As for the wet sections [
24],
where detailed losses represent rain zone,
krz, fill,
kfi, separation and redirection,
kct, spray zone,
ksp, and drift eliminator,
kde, respectively.
(2) Energy equations of individual sections
For dry cooling, air and water transfers heat in finned heat exchangers without contacts. The total heat transfer rate in terms of the overall heat transfer coefficient can be expressed as:
where
FT is the correction factor for crossflow, and the total heat transfer characteristics is defined as:
Airside heat transfer characteristics are obtained by a full-scale wind tunnel experiment and fitted as expressions of different frontal velocities of air [
25]. As for the waterside, correlations from Gnielinski [
26] are adopted to deal with laminar or turbulent flow conditions.
The heat transfer rate can also be obtained in the view of waterside and airside, respectively,
As for wet cooling, Merkel theory is adopted to describe the heat and mass transfer process [
24].
The left side in Equation (12) is the total Merkel number, which equals to the sum of three water paths, spray zone, packing fill and rain zone in
Figure 1,
Similar with the airside heat transfer coefficient, the Merkel number of the spray zone and packing fill are described by the experiment on the basis of mass flow rate of water, air and depth [
27]. In the rain zone, water contacts directly with air with a relative long path, the heat and mass transfer processes can be described by the single film theory [
28].
The right side of Equation (12) is solved by the four-point form of the Chebyshev integral:
Similarly, the heat transfer rate of the wet section can also be obtained in the view of waterside and airside, respectively:
(3) Cooling system
The air at the outlet of heat exchangers or packing fills that flows to the outlet of the tower can be regarded as adiabatic process or pseudo-adiabatic when moisture is involved. In addition, the air conditions at the outlet of the tower is also determined by the ambient, then flow equations are converged by solving the two processes: (1) From ambient through the heat transfer devices, (2) from the outlet of the heat transfer devices to the ambient.
The first part has been described above, air from the outlet of the heat transfer devices to the ambient are expressed as follows:
For adiabatic process of NDDCs [
29],
As for the pseudo-adiabatic process of NDWCs,
where
ξTa,out,fill is the lapse rate.
Air from the outlet of the tower that flows to ambient experiences certain loss due to the cylindrical outlet:
where,
.
If there exists both heat exchangers and packing fills, air from the outlet of the individual section mixes and flows to the tower. The pressure uniform assumption proposed in our previous work is adopted [
30], pressure at the outlet of the mixed section equals to that at heat exchangers and packing fills.
The properties of the mixed air at this cross section can be determined as mass and energy conservations,
Since humidity variations also happen in NDHCs, it has the same form as Equation (16) for the process air from the mixed section to the tower outlet.
At this point, the performance of each cooling system can be predicted with known inlet temperature and humidity of air and inlet temperature and mass flow rate of water. Export the water temperature at the outlet of the cooling system, update the assuming backpressure in
Section 3.1 if it does not equal the inlet temperature of the condenser.
3.3. Turbine and Feed Water System
The last loop is to verify if the output power of the thermal cycle under the backpressure obtained from
Section 3.1 and
Section 3.2 is satisfied. The output power of the power generating unit,
Pe, can be calculated by:
where Δ
hc and Δ
hes are the actual enthalpy drop of exhausted steam and extraction steam, respectively;
ηm and
ηg, which are regarded as constant, represent the mechanical efficiency and the effectiveness of the generator, respectively.
The extraction pressures of each stage are calculated with the improved Flugel formula [
31]:
where
M is the mass flow rate of each stage group,
Pi and
Pi+1 are the pressure before and after the stage group, respectively.
The energy and mass balance can be described in the view of the matrix [
32]:
where
γ and
τ are the enthalpy drop of drain water and feed water, respectively.
The mass flow rate of exhausted steam can be then obtained with the mass flow rate of main steam and extraction steam:
With the model of the turbine and feed water system above, changing the operation parameter of the main steam of the output power is not satisfied.
3.4. Operation Costs
Better cooling performance of the cooling system brings lower backpressure, and less coal will be consumed under a constant power output. Then the operation costs of the whole system equals to the operation costs of the boiler and cooling system.
The operation cost of the boiler has the following form:
where
Bstd in g/kWh is the consumption rate of standard coal;
Qcoal in kJ/kg is the calorific value of standard coal;
Mms and
Mreh in t/h are the mass flow rate of main steam and reheat steam, respectively;
ηb and
ηp are the efficiency of boiler and pipe, respectively;
hms and
hreh in kJ/kg are the enthalpy of main steam and reheat steam, respectively.
As for the cooling system, there are two sections, the pump power and water consumption, corresponding to different cooling systems. The pump power of original NDDCs can be calculated as [
33]:
where
and
.
For wet cooling, it can be expressed in the view of the height of each wet section [
24]:
Then the operation cost of dry cooling is proposed:
If there exists wet cooling, the water consumption rate is obtained with the difference of humidity at the inlet and outlet of the wet section:
Makeup water needs to be taken into consideration when calculating the operation cost of wet cooling:
4. Case Study
4.1. Basic Data and Model Validation
A 660 MW supercritical coal-fired power generating unit coupled with NDDC was simulated and validated with the operation data in our previous work [
18]. The geometric parameters and performance of heat exchangers are shown in
Table 1.
As for the wet section, fills are selected from a typical NDWC, which have the same mass transfer and loss coefficient. The mathematical model for the wet section in this study is verified from several NDWC systems in literature [
7,
34]. Adopting the same ambient and operating conditions, the water outlet temperature of different wet cooling systems is calculated with equations in
Section 3.2. Compared with the values in literature, relatively small differences are obtained, as shown in
Table 2.
The same tower shell is selected in this study to give a comparative analysis. However, due to the high heat transfer efficiency of wet cooling, geometric sizes of NDWC are usually smaller than NDDC. The principal parameter is the height of the rain zone, the performance of NDWC with higher rain zone is more easily affected by ambient winds. Then, for wet cooling and hybrid cooling, rain zone has a height of 13.67 m, the same as a typical 600 MW wet cooling tower, as shown in
Table 3.
The detailed parameters of the packing fill are shown in
Table 4.
4.2. Boundary Conditions
The actual weather conditions and operation hours are collected from the local power plant of Yangcheng in North China during 2018, which are shown in
Table 5 and
Table 6, respectively.
As mentioned in
Section 2, NDHCs can be operated under a parallel mode or serial mode. Different ratios of mass flow rate of each section are analyzed to study the influence of water distribution on cooling efficiency itself and economic trade-offs. The operation strategies are listed as in
Table 7.
4.3. Cooling Efficiency
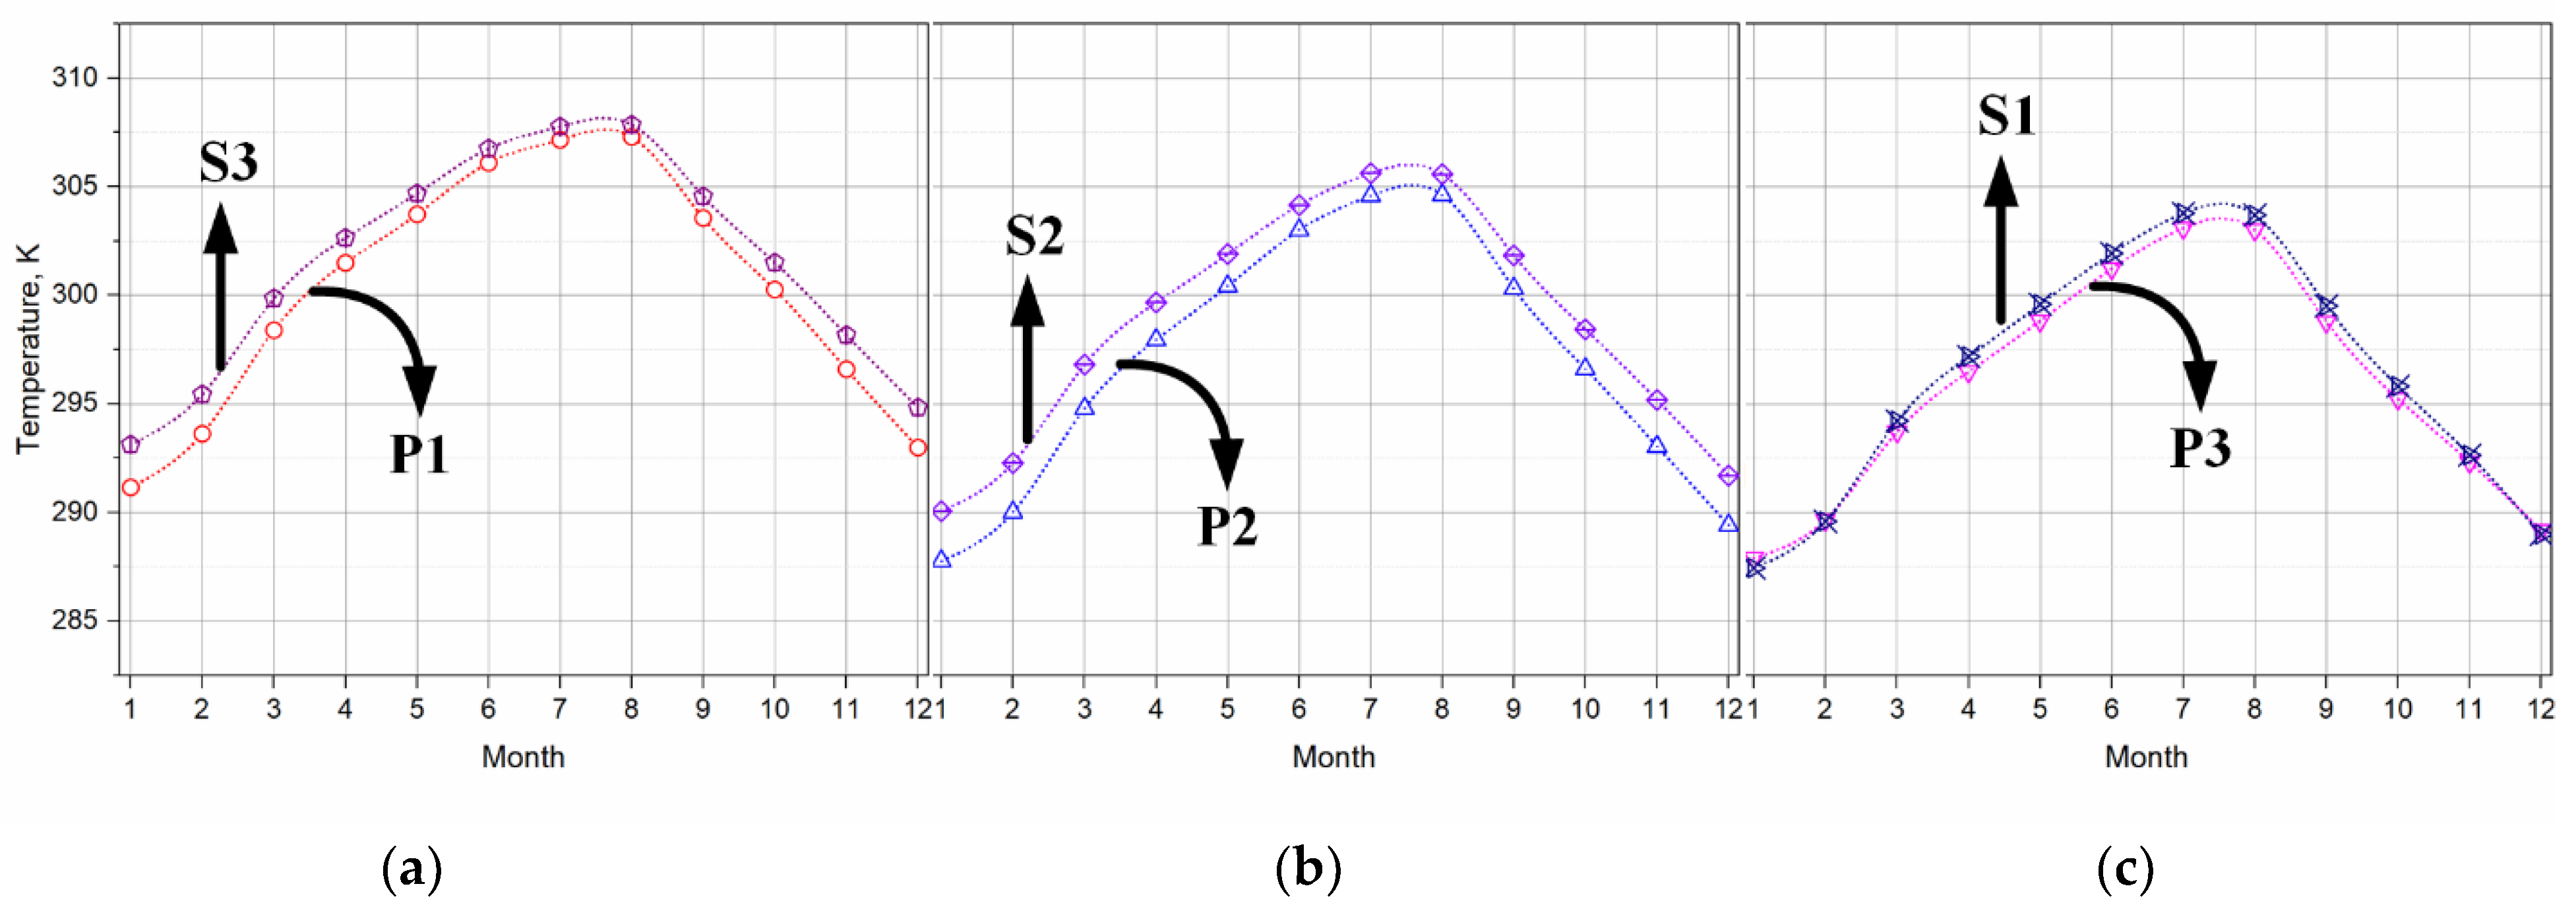
Water temperature at the outlet of different cooling systems under the same inlet temperature is investigated firstly. The results are presented with the same
y-axis legend in
Figure 3. A blue line with the label of NDHC represents total circulating water flows of the dry section and then all passes through the wet section,
Rw,d =
Rw,w = 1 namely. Clearly, the up limit of the heat transfer rate of the hybrid cooling is corresponding to utilize as much recycled water as possible. Hybrid cooling when taking full use of the mass flow rate has the lowest outlet temperature of water. To obtain an insight in regards to the greater number of lines, the individual cooling section itself is explored in
Section 1 and the relationships between the dry and wet sections are analyzed in
Section 2.
The main results are listed as follows.
(1) Relatively low ambient temperatures take away the advantage of wet cooling.
In most conditions, wet cooling with water evaporation has a higher cooling efficiency. Things change when ambient temperature drops. During December, the coldest month in 2018, the performances of wet-mode operation and S3-mode operation are even worse than NDDC. It can be explained by the heat transfer mechanism of dry cooling and wet cooling.
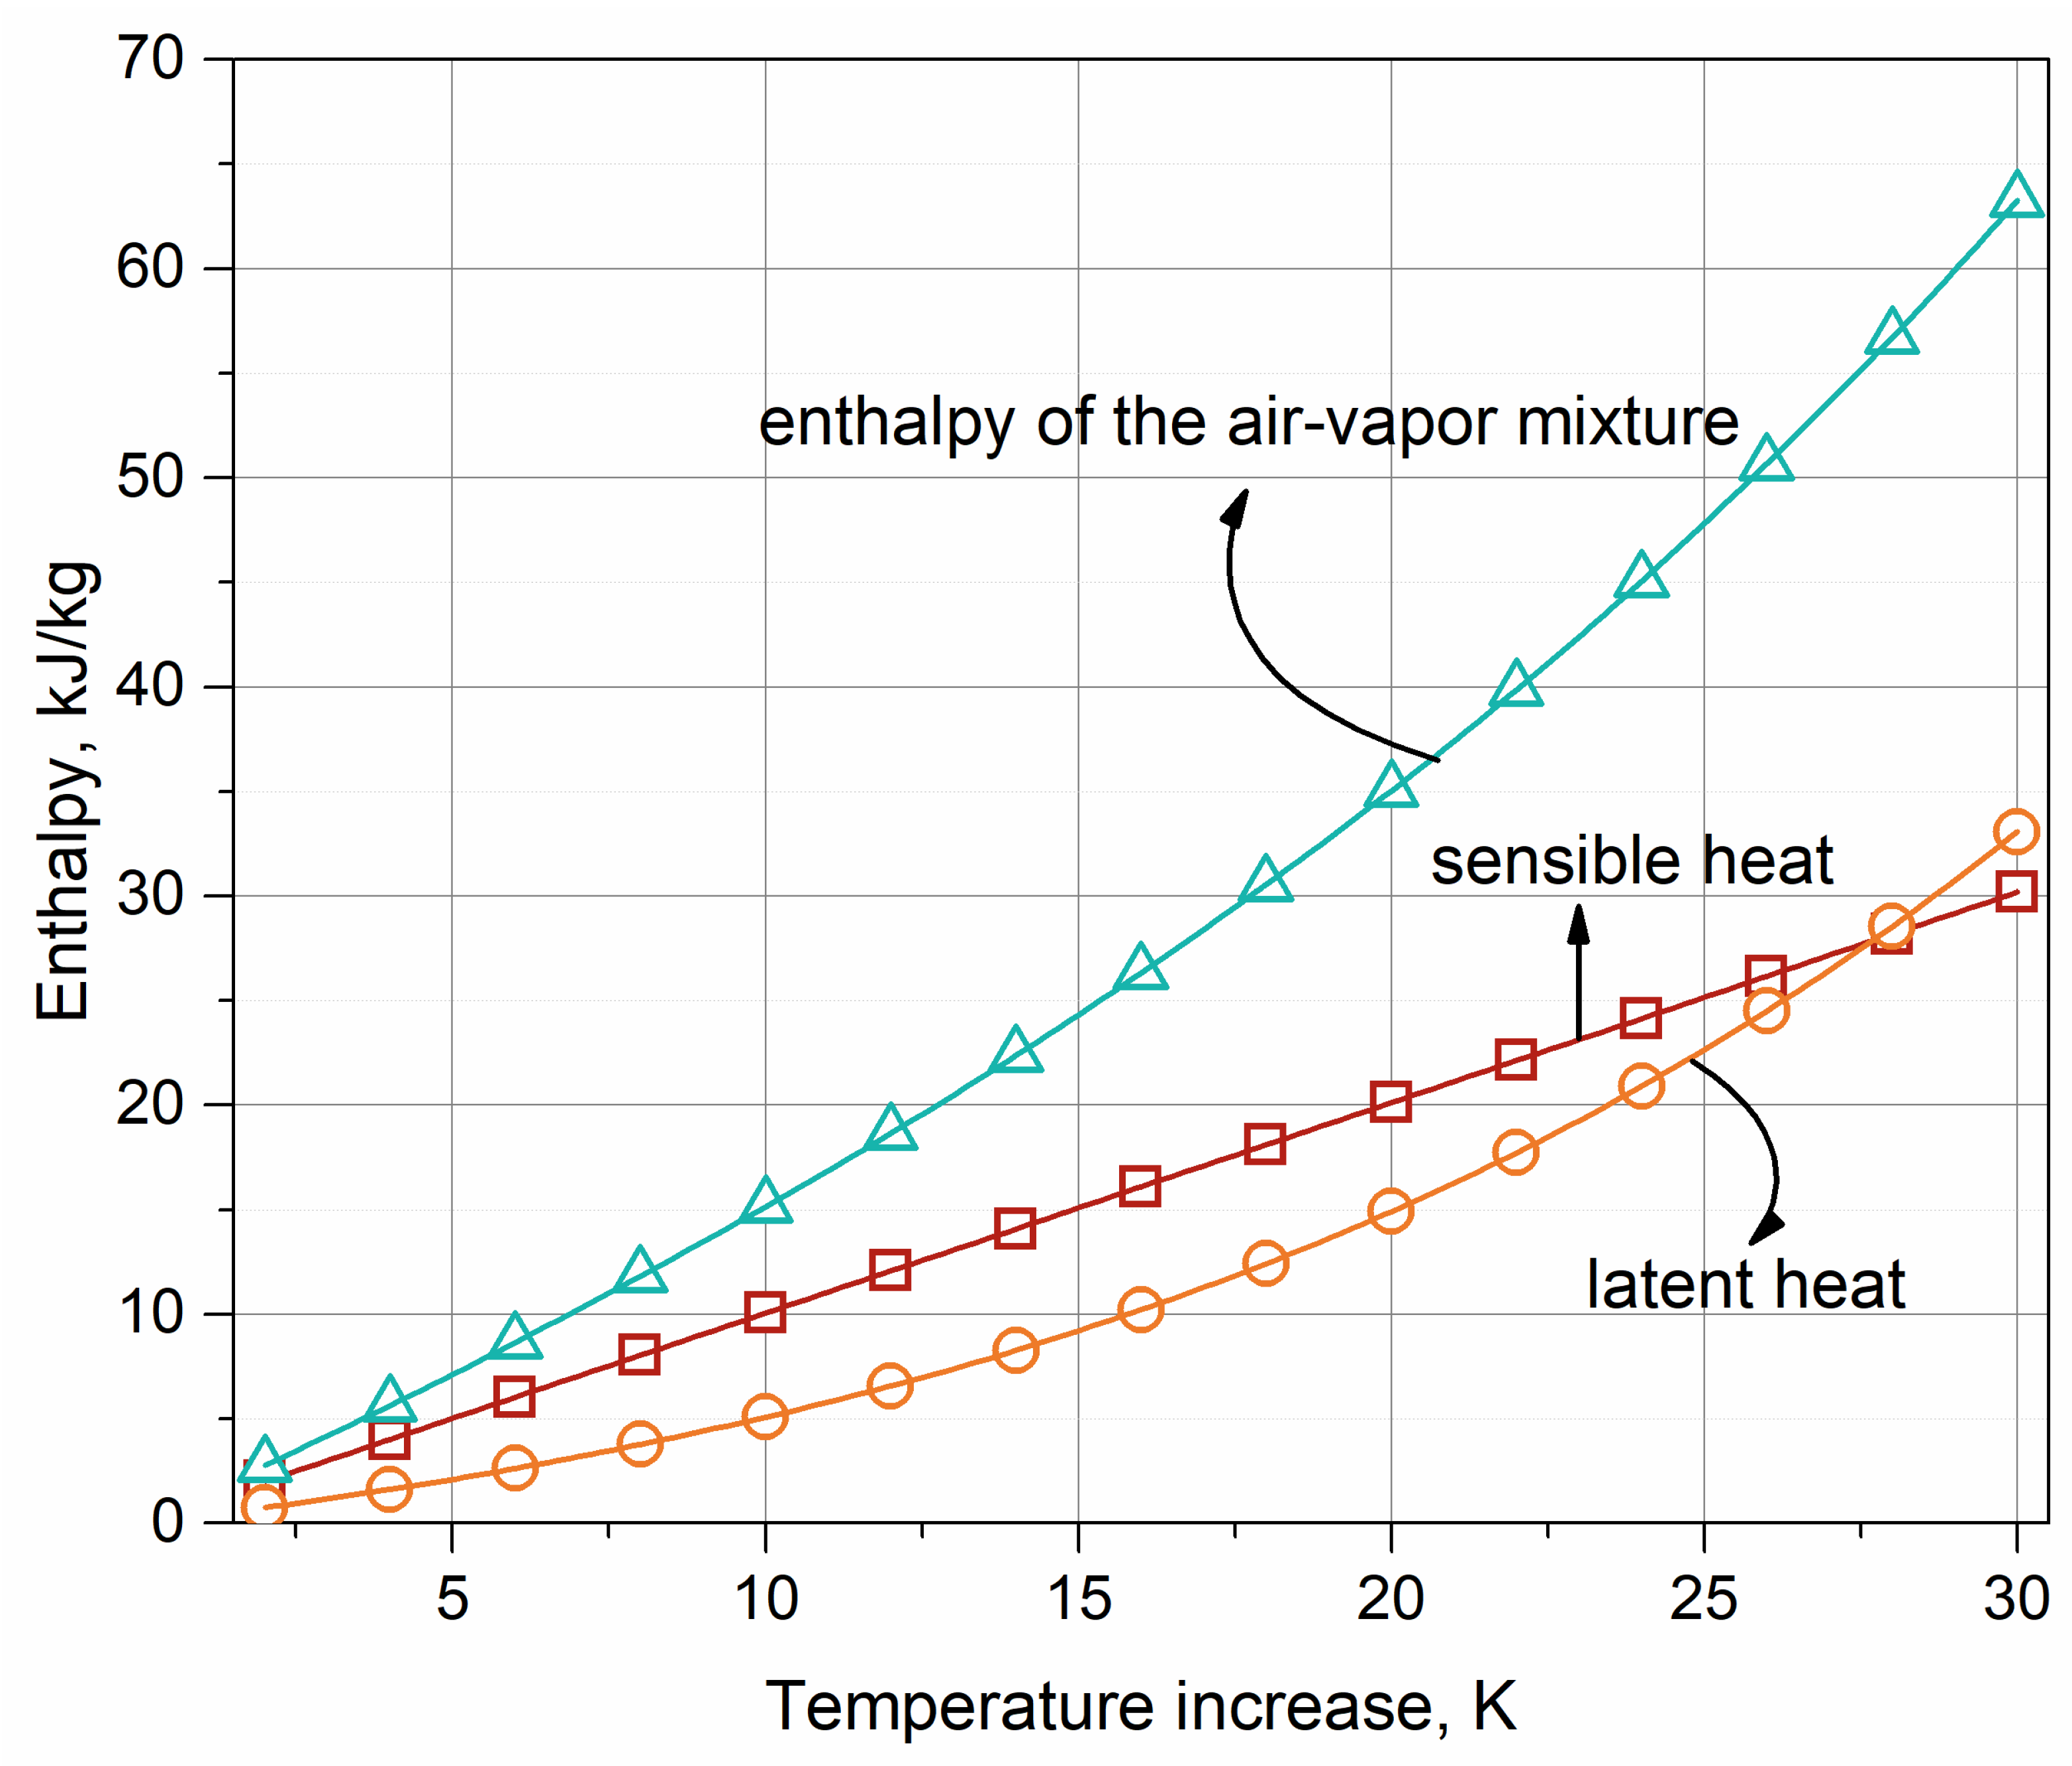
With the same ambient temperature and humidity, the airside energy variations can be expressed as the difference of mass flow rate of air times enthalpy between locations of inlet and outlet. The enthalpy of the mixture of air and vapor is calculated as follows:
where
hfgwo is the latent heat, which is obtained at 273.15 K and a constant number, 2.5015 × 10
6 J/kg.
For dry cooling, variations of humidity of air are not involved. The enthalpy difference is resulted by the increase of dry bulb temperature. As for wet cooling, air at the outlet of the packing fill is usually saturated and more water is evaporated when the dry bulb temperature rises. To illustrate the ratio of sensible heat and latent heat, relationships between dry bulb temperature increase and enthalpy of each part are explored and plotted in
Figure 4. Temperature origins from 263.15 K are used to demonstrate the ambient conditions.
The gap between the enthalpy of air-vapor mixture and dry air is widened with the increase in ambient temperature. In January, the airside parameters are shown in
Table 8.
Compared with NDDC and NDWC, heat transfer of dry cooling is related to the increase of dry bulb temperature. For the cooling system with only one cooling device and inlet, density difference drives air passing through the cooling system. Then more airflow is directed for NDDC. At this point, excessive airflow can cover the difference between sensible heat and latent heat when the temperature is relatively low. The heat transfer characteristics of dry cooling and wet cooling make the performance difference between NDDC and NDWC become smaller with a drop of ambient temperature.
On the other hand, due to the parallel connection of airside, ambient air flows through heat exchangers without heat transfer if the hybrid cooling system is under a wet-mode operation. The mixed progress decreases the temperature difference between mixed section and ambient, which is the suction force of the hybrid cooling system. Compared with the wet-mode and NDHC, air involved heat transfer of the wet section drops from 38,621.48 to 30,494.53 kg/s. A similar reason is behind the dry-mode operation of NDHC.
As for the S3-mode operation, the ratio of the heat transfer rate of the dry section to NDDC decreased from 86.3% of NDHC to 80.45%, while the ratio of the heat transfer rate of the wet section to NDWC decreased form 52.66% of NDHC to 14.67%. Reverse trends are obtained with hot weather.
In a word, relatively low ambient temperatures take away the advantage of wet cooling.
(2) Higher inlet water temperature of the wet section maintains the cooling efficiency with less total mass flow rate.
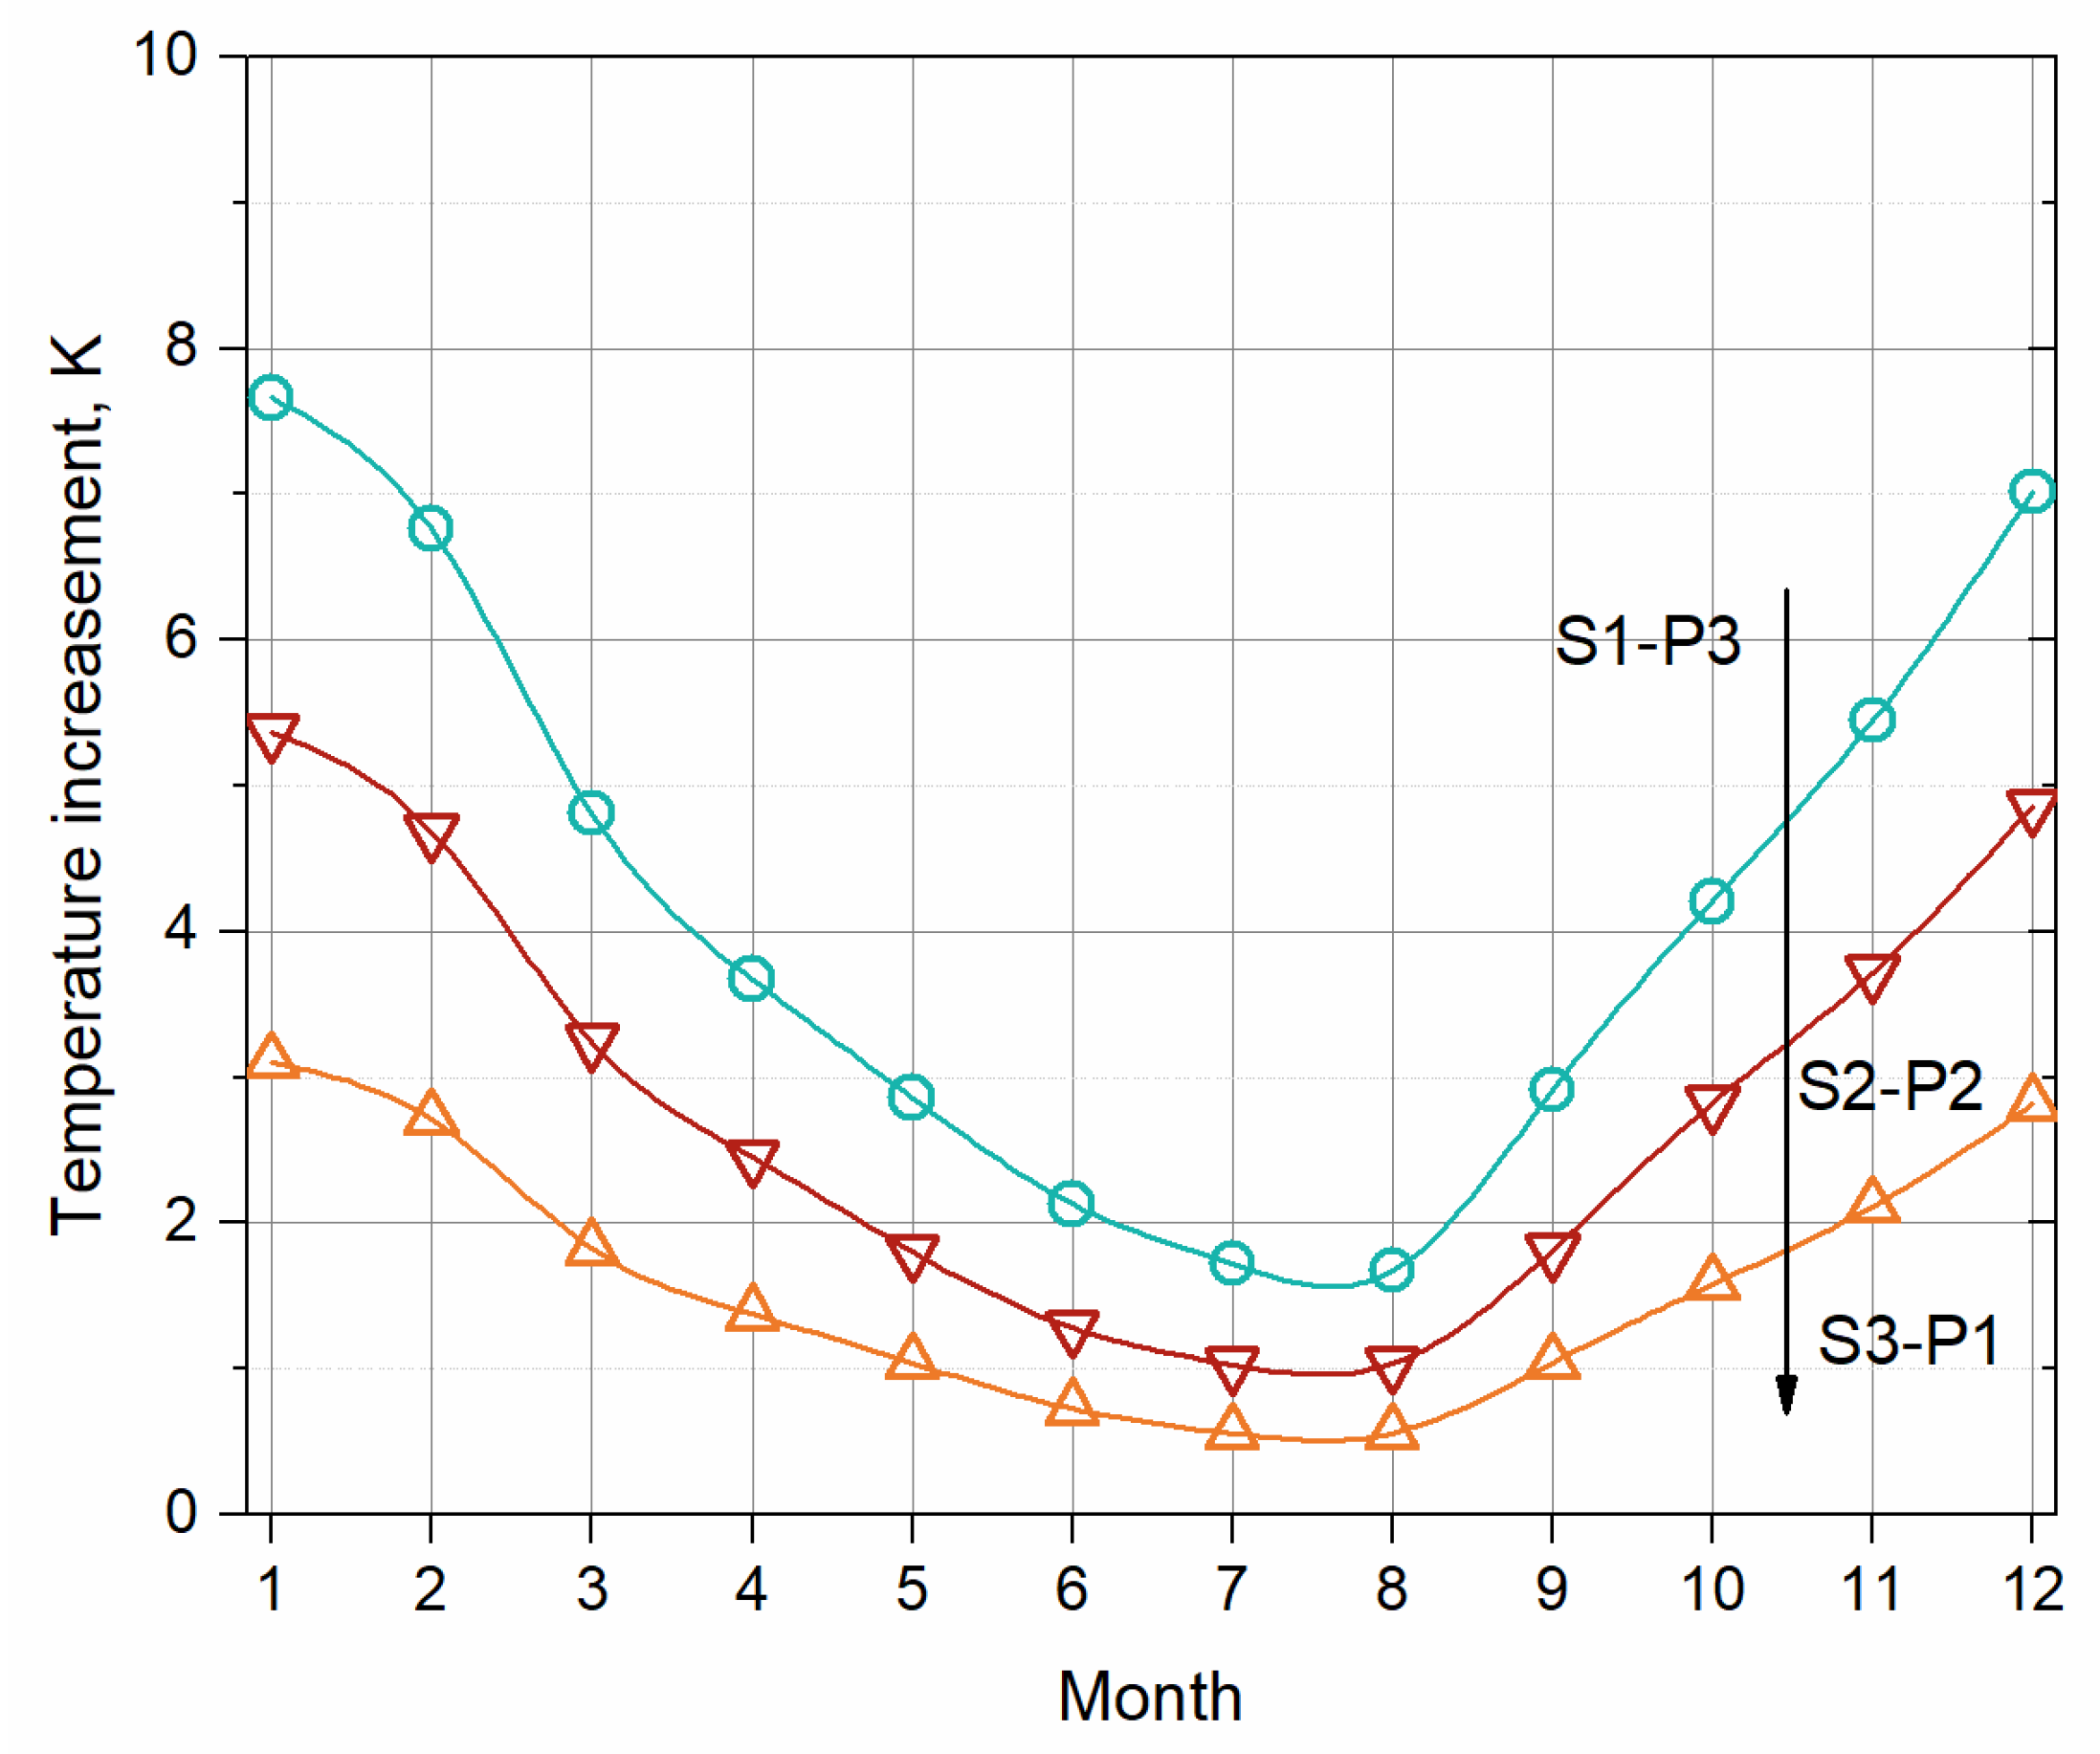
To reveal the influence of operation strategies on the cooling performance of hybrid cooling, different serial modes and parallel modes are categorized based on the water mass flow rate of the wet section. In
Figure 5, ratio of the mass flow rate passing through the wet section are 0.25, 0.5 and 0.75 for S3-P1, S2-P2 and S1-P3, respectively.
When comparing with the three teams, the parallel mode has a higher cooling efficiency than the serial mode, though there is more circulating water put into operation for serial mode. This is mainly achieved by the high water inlet temperature of the wet section. The bulb temperature of air which contacts with circulating water from part of the inlet is higher than that which transfers heat with the water from the dry section. The difference will increase with
Rw,w under serial operation, as shown in
Figure 6. The effect will be enhanced under colder weather with a constant inlet temperature of circulating water.
For the individual team S1-P3, the performance improvement due to high-inlet-temperature water of the wet section cannot cover the heat transfer rate loss of the dry section, especially for the air with maximum cooling capacity during cold weather. With the rise of ambient temperature, air can absorb more vapor. This maintains the higher cooling efficiency.
To illustrate the efficiency of water mass flow rate utilization, the pump powers of different cooling systems are shown in
Figure 7 in kW/(MW), which refers to pump power per MW of heat transfer rate:
The serial mode requires more power costs of the pump due to its large amount of circulating water. Gaps between the different operating strategies provide possibility of cost-effective cooling system selection.
4.4. Water Loss
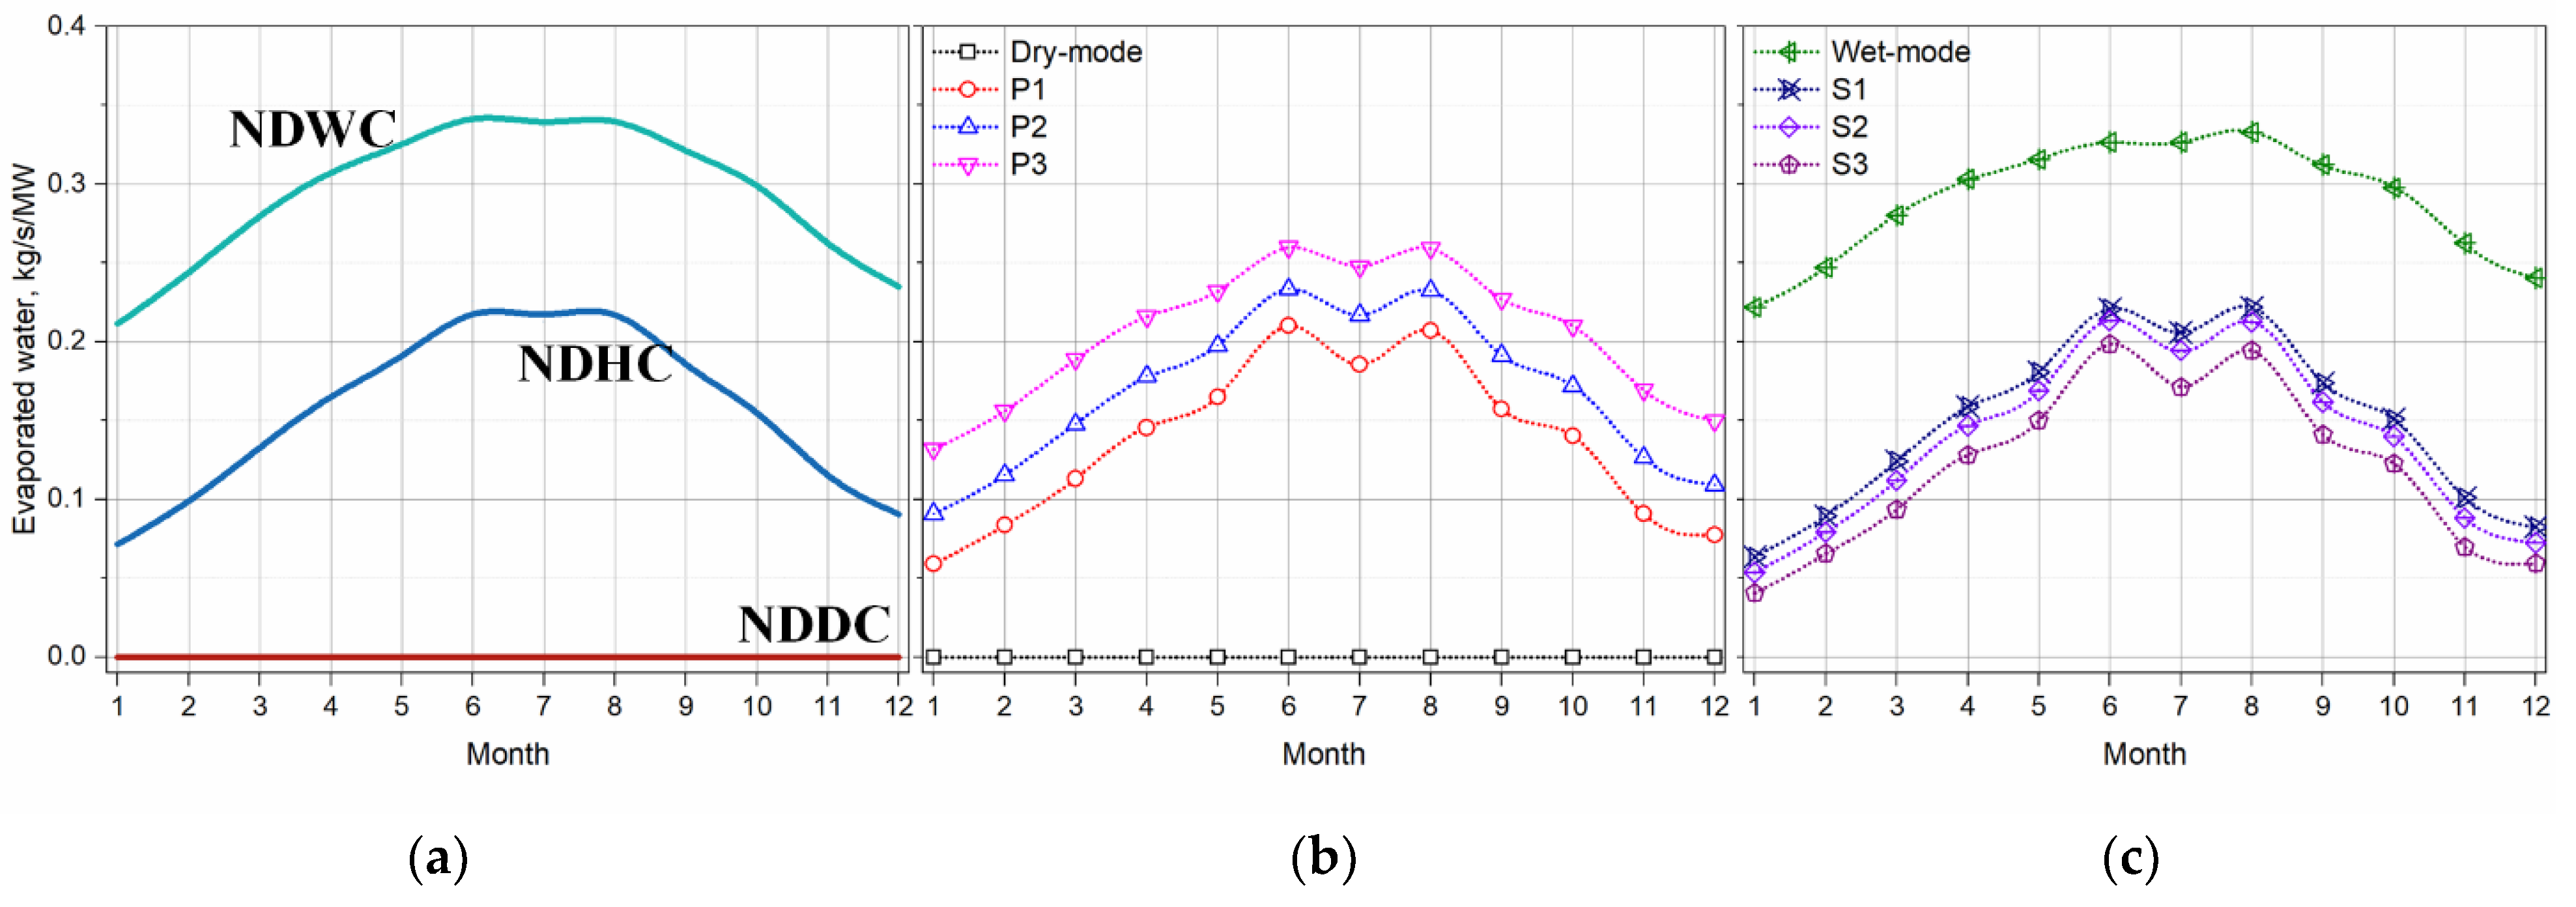
Section 4.3 explains the correlations of the individual cooling section itself and the relationships between the dry and wet sections. Water loss due to evaporation is considered in this subsection. Evaporated water in kg/s for each scheme is shown in
Figure 8.
According to the control equations of mass transfer, Equation (13), the water evaporated rate is determined by the temperature difference and mass flow rate of both air and water.
Influence of temperature difference can be revealed by comparing with the three groups, S3-P1, S2-P2 and S1-P3. More water is evaporated when the inlet temperature is higher at the same mass flow rate. The water evaporated loss of the parallel mode is higher than the serial mode for each condition. When more water is pumped into the wet section, the difference between the evaporated water of parallel mode and serial mode grows. That is to say, the high-efficiency operation is achieved by water loss.
As for the effect of mass flow rate, the evaporated rate between the two modes increases with increasing ambient temperature. The basic cooling load during cold weather is dissipated in the dry section. With ambient temperature rising, the drop of the cooling efficiency of the dry cooling leads to a rise in the inlet water temperature of the wet section for serial operation. The detailed inlet water temperature for different operating strategies is shown in
Figure 9.
To further present the water loss, like pump power in
Section 4.3, the water evaporated loss of the unit heat transfer rate in (kg/s)/MW is adopted:
Data in
Figure 8 are converted in the form of
Figure 10. Compared with
Figure 5 and
Figure 7, it is concluded that water loss and power of pumps per MW of heat transfer rate are nearly contrast. The relative low water evaporated rate and pump power of the parallel mode may offer a cost-effective method during cold weather.
4.5. Economic Analysis
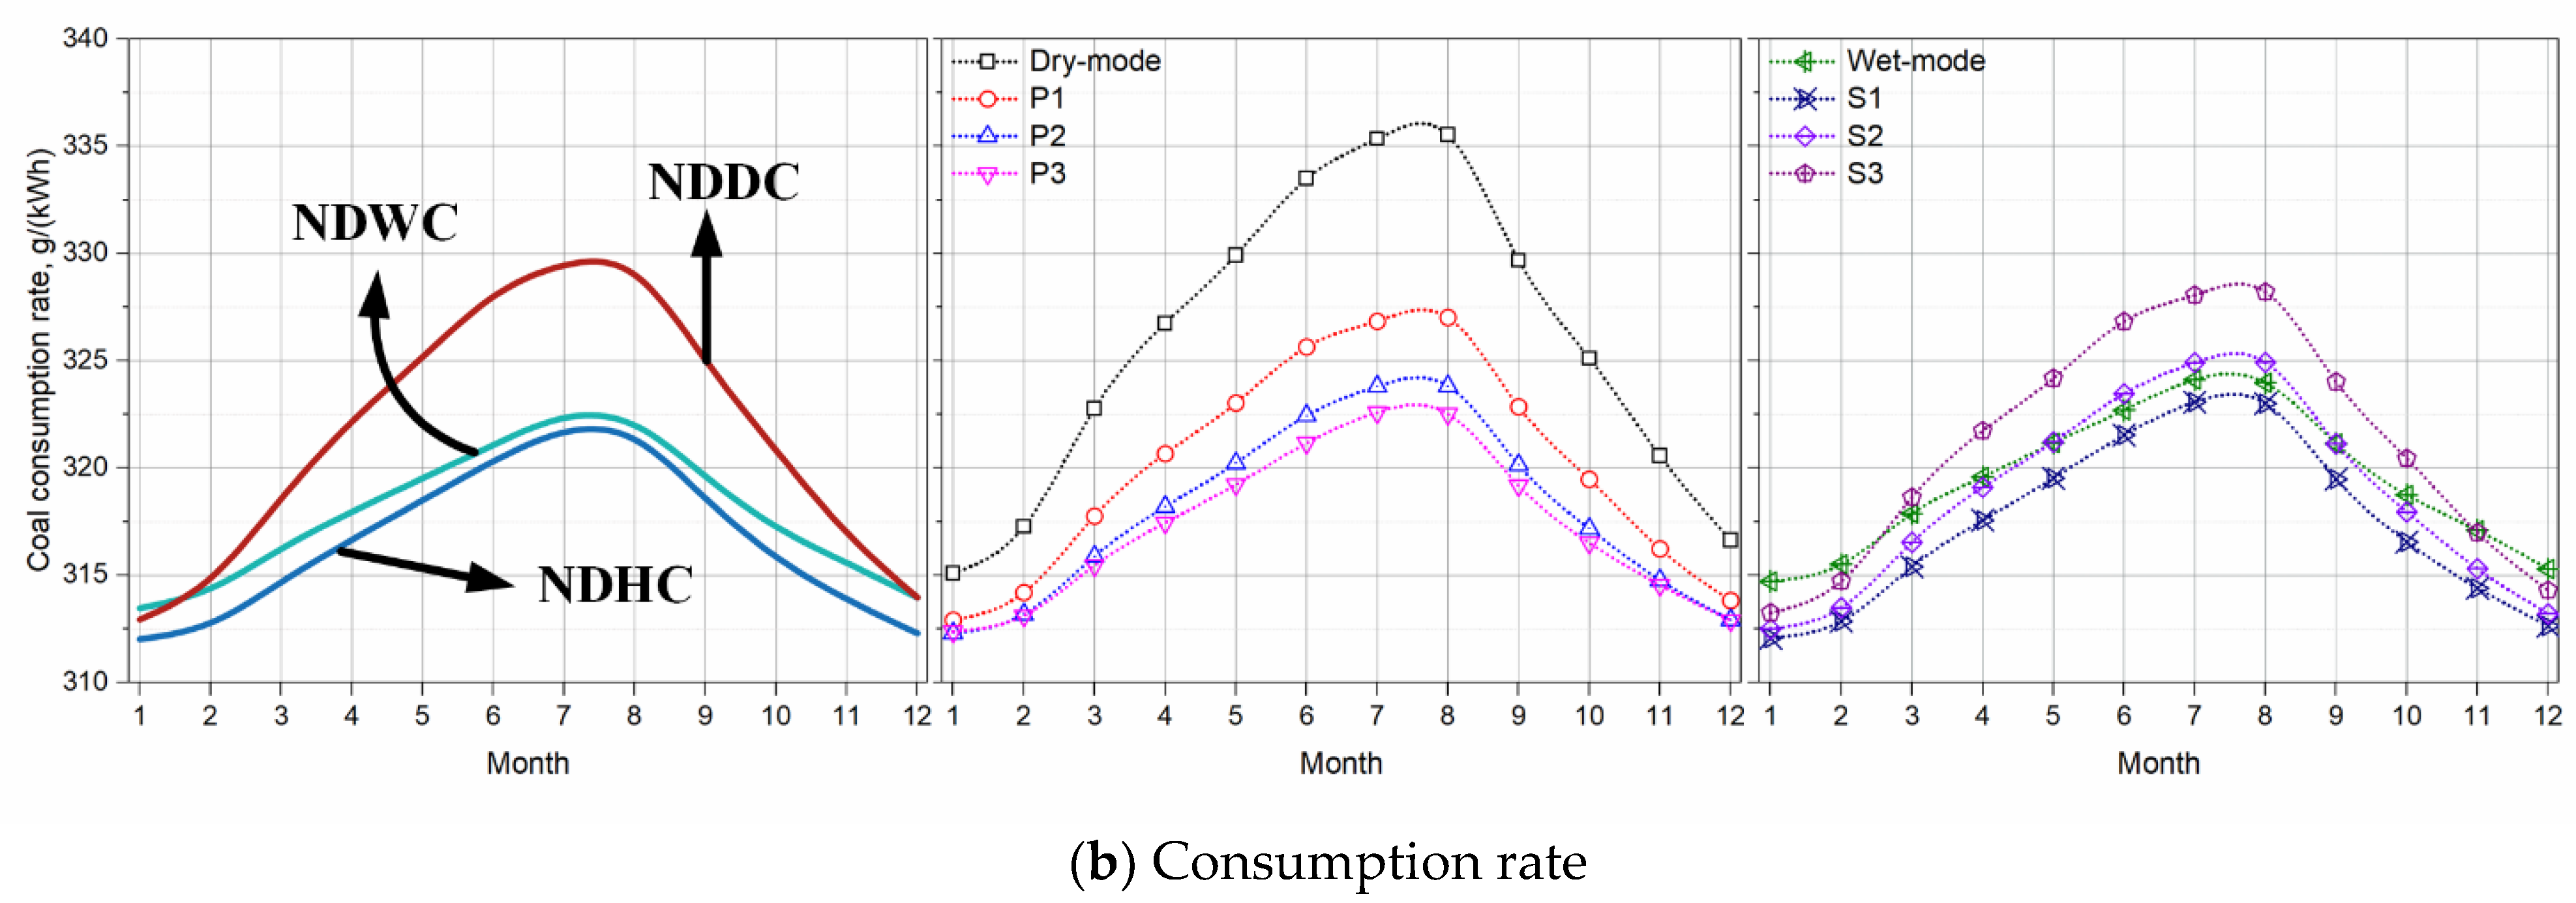
With the mathematical model and the iterative loop above, the economic performances of the power plant coupled with different cooling systems are calculated. The annual variations of backpressure and coal consumption rate are shown in
Figure 11.
Less coal is consumed under lower backpressure, which is directly connected with its cooling efficiency. Compared with the outlet temperature in
Figure 3, the trends of water outlet temperature, backpressure and coal consumption rate are generally consistent. Except the conditions of January. As explained in
Section 2, during the dynamic balance process of thermal cycle and cooling system, lower backpressure means lower inlet temperature of the cooling system, amplifying the advantages of dry cooling.
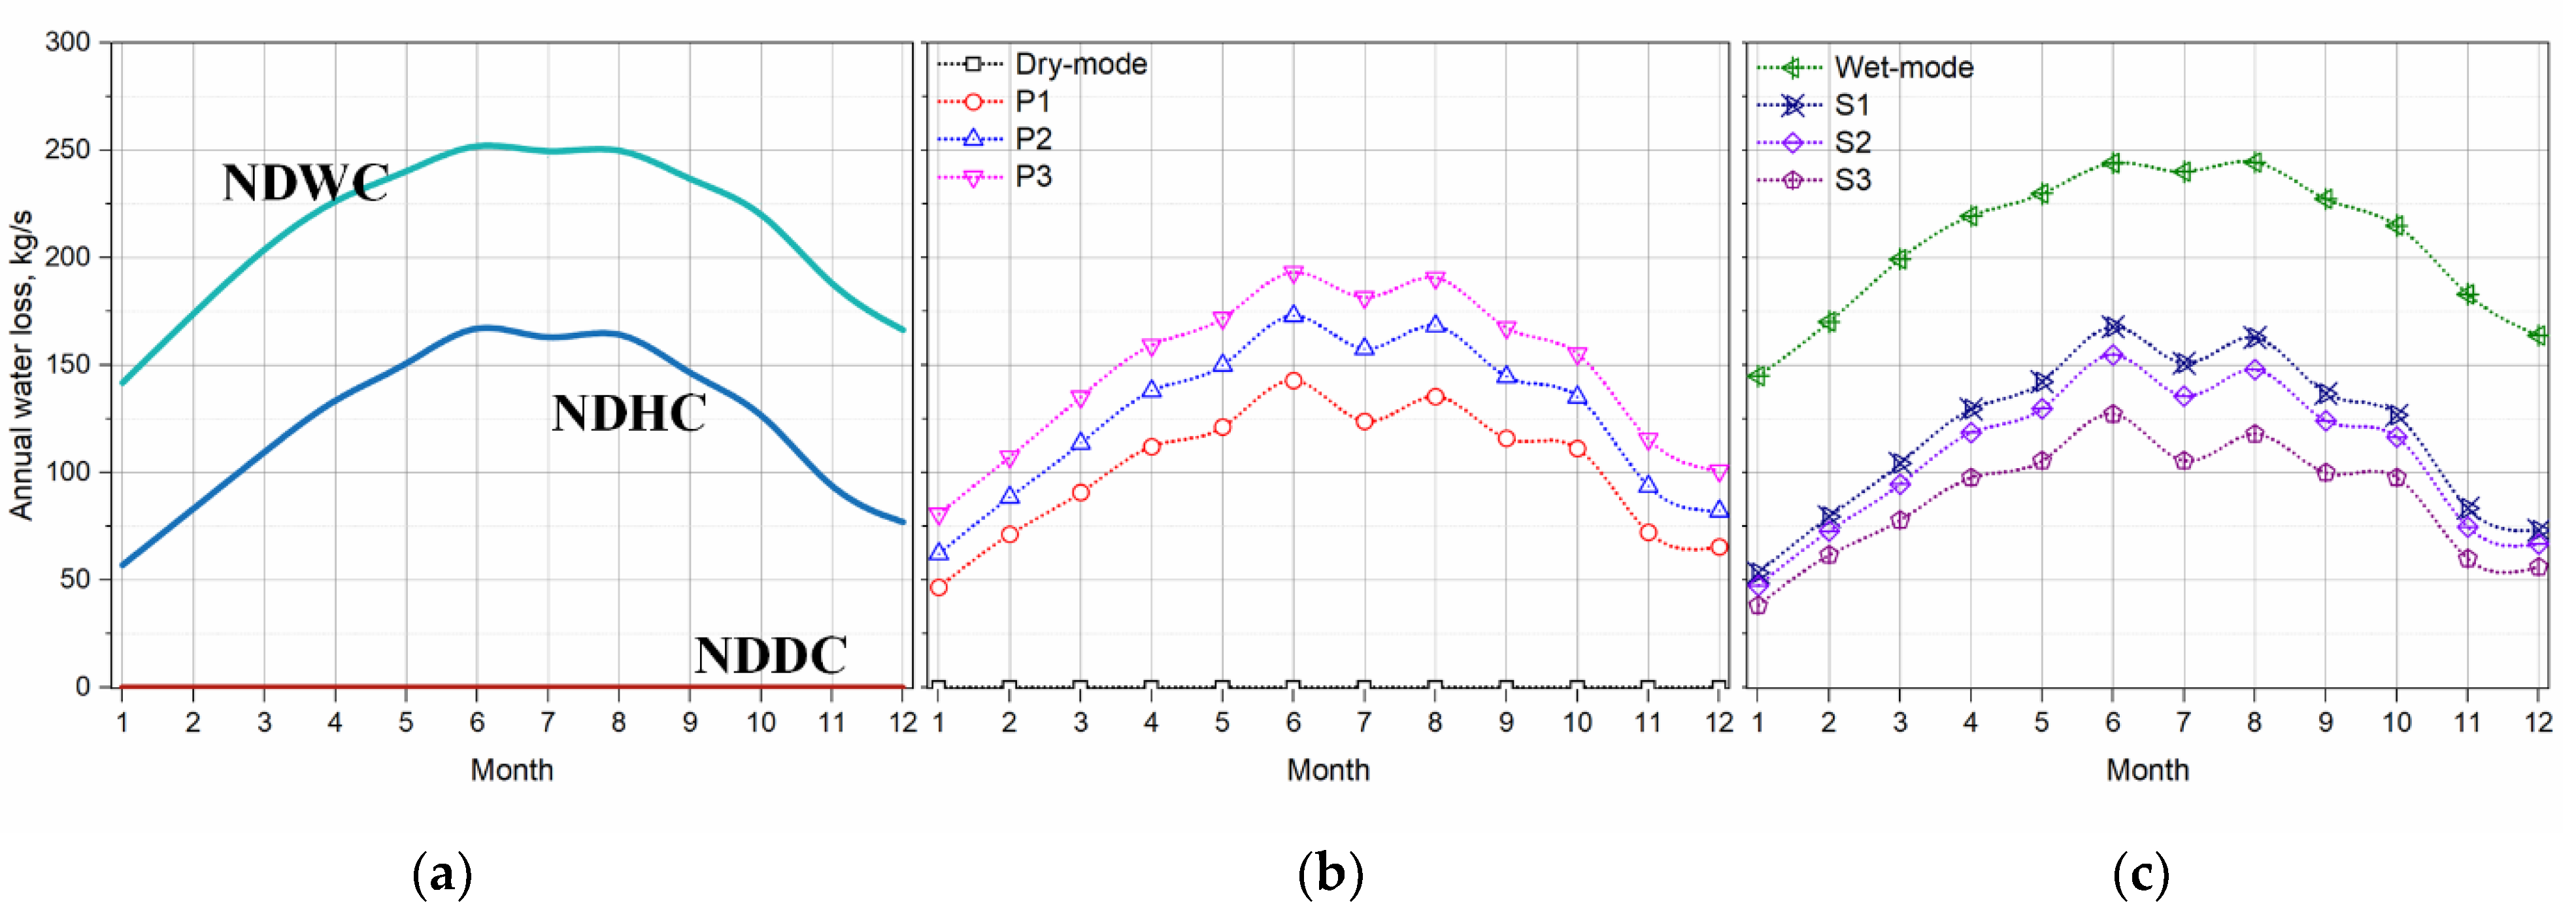
The advantage of lower water inlet temperature is also suitable for the cooling system with wet cooling, reducing the water loss further. The annual water consumption of cooling systems when coupling with the thermal cycle is shown in
Figure 12. Compared with the water evaporation rate under a constant water inlet temperature, the difference of parallel mode and other operation strategies is reduced further.
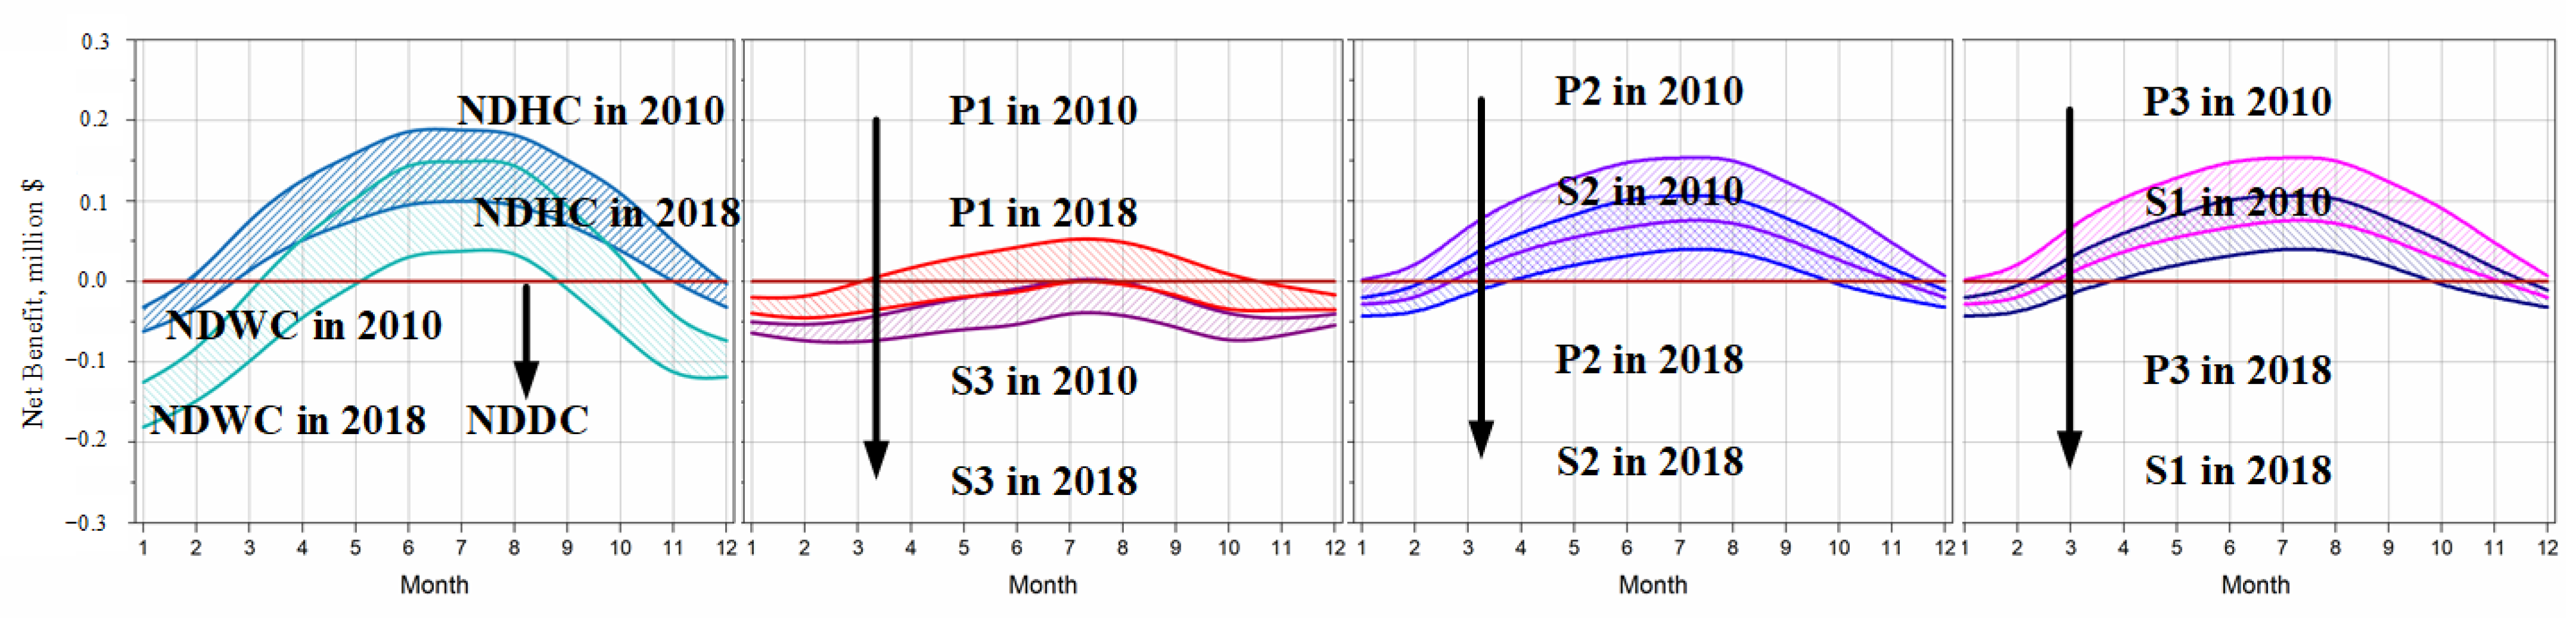
With the help of above data, the operation costs of such a system are calculated. Thermal cycle with NDDC is chosen with the basic data. Obviously, the economic performance is sensible to the unit costs of coal and water. Then comparisons of different years, 2010 and 2018, are selected to present the data, which are shown in
Figure 13.
The
y-axis in
Figure 13 is the net benefits of different cooling systems compared with NDDC:
The horizontal line colored with red represents the benefits of NDDC, which equals to 0 namely. The unit costs of coal and water are 150 $/t and 0.3 $/t in 2010, 130 $/t and 0.5 $/t in 2018, respectively. With the increase of the scarcity of water and the decline of coal-fired power plants, there is a great rise of the unit costs of treatment water. Thus, the economic performance of all cooling systems with the wet section reduces. That is the reason why dry cooling is adopted when the power plant is built, and some wet-assisted cooling method is used to improve the performance of dry cooling during hot weather.
As for the other operation modes of hybrid cooling, all operation modes have a majority of economic zones, except for the S3-mode operation. Combined with
Figure 4, it is concluded that the performance enhancement of hybrid cooling can cover the costs of extra pump power and water loss.
There exists a better operation strategy for hybrid cooling by switching the loads of wet and dry sections. After obtaining the operation costs of different modes, the operation cost minimization of the hybrid cooling system can be converted to typical integer programming, which can be described as:
where
ti refers to the operation hours in each month.
The optimization results of 2010 and 2018 are shown in
Table 9, while NDDC and NDHC are chosen as comparisons.
The operation costs based on NDHC after optimization decreased about 0.8% in 2010 and 0.35% in 2018. These results demonstrate that hybrid cooling gives a solution between water saving and economic operation.
Considering the variations of the unit cost of coal, water and power, the difference between the three groups in
Figure 13 will not change in recent years. Parallel schemes have advantages over serial type due to pumps requiring only half power consumption. Then, the selection of different parallel schemes is decided by ambient conditions. The ratio of dry bulb temperature increase in the dry section and wet section is chosen in this part, which is defined as:
The ratio of dry bulb temperature for the P1 scheme is shown in
Table 10:
Compared with the optimization results, there are three conclusions derived:
(1) It is concluded that the parallel scheme is more recommended when the ratio is higher than 2. This is the quantitative result of
Section 4.3.
(2) The switches in the cases of June, July and August are mainly caused by the economic factors. The increasing scarcity of water and decreasing use of coal will widen the gap. That means full operation of NDHC is recommended when the ratio is lower than 2.
(3) Additionally, the cooling system operation with high efficiency brings large amounts of carbon reduction. In the case study of 2018, 1492 t of carbon reduction is achieved.
4.6. Error Analysis
Take the case with the minimum amount of 0.35% in 2018 as an example to illustrate the uncertainties for the optimal results. The equivalent difference of the annual coal consumption rate is 0.71 g/(kWh), 0.2% of variations.
Based on the root-mean-square error transfer function, the relative error of the coal consumption rate can be calculated:
According to the relative error of integrative steps, which are noted in
Figure 2, the detailed uncertainty of the outlet temperature (reference value of 310 K) of the cooling system is 10
−7. The uncertainty of the heat transfer rate can be expressed in the form of Equation (38), 10
−9 namely.
Similarly, the uncertainties of backpressure and power load are 10−7 and 10−12.
It is concluded the calculation error due to integrative settings (
Figure 2) is 10
−7. Besides, the main measure to save coal consumption of a modern power plant is to add a heat supply device; usually 2–5 g/(kWh) is saved without considering the investment. As for the cold end system, deflectors can save coal consumption of 0.7–1.4 g/(kWh). The optimization of operation strategies brings a similar improvement without any extra devices.
5. Conclusions
An evaluation model of hybrid cooling for thermal power generation in parallel design, with full consideration of the waterside pressure loss, is established in this study. Different schemes of water distribution are investigated to reveal its influence on the individual cooling section itself and the relationships between dry and wet sections. The following conclusions can be obtained.
(1) Compared with dry cooling, relatively low ambient temperatures take away the advantage of wet cooling. The parallel scheme is more recommended when the ratio of the temperature increase of the dry and wet sections is higher than 2.
(2) The cooling efficiency of serial operation of NDHCs is close to the parallel mode and has a lower water evaporation rate. However, reduced pump power cost makes the parallel mode more competitive during cold weather.
(3) There does exist a better operation strategy for hybrid cooling by switching the loads of the wet and dry sections. The operation costs based on NDHC after optimization decreased about 0.8% in 2010 and 0.35% in 2018 for the objective thermal power plant.


