
Clustering Analysis of Energy Consumption in the Countries of the Visegrad Group

 ,
,  , , ,
, , , 
 and
and 
Abstract
:1. Introduction
1.1. General Context
1.2. Literature Review
1.3. Contribution Motivation and Scope
1.4. Document Organization
2. Materials and Methods
3. Results
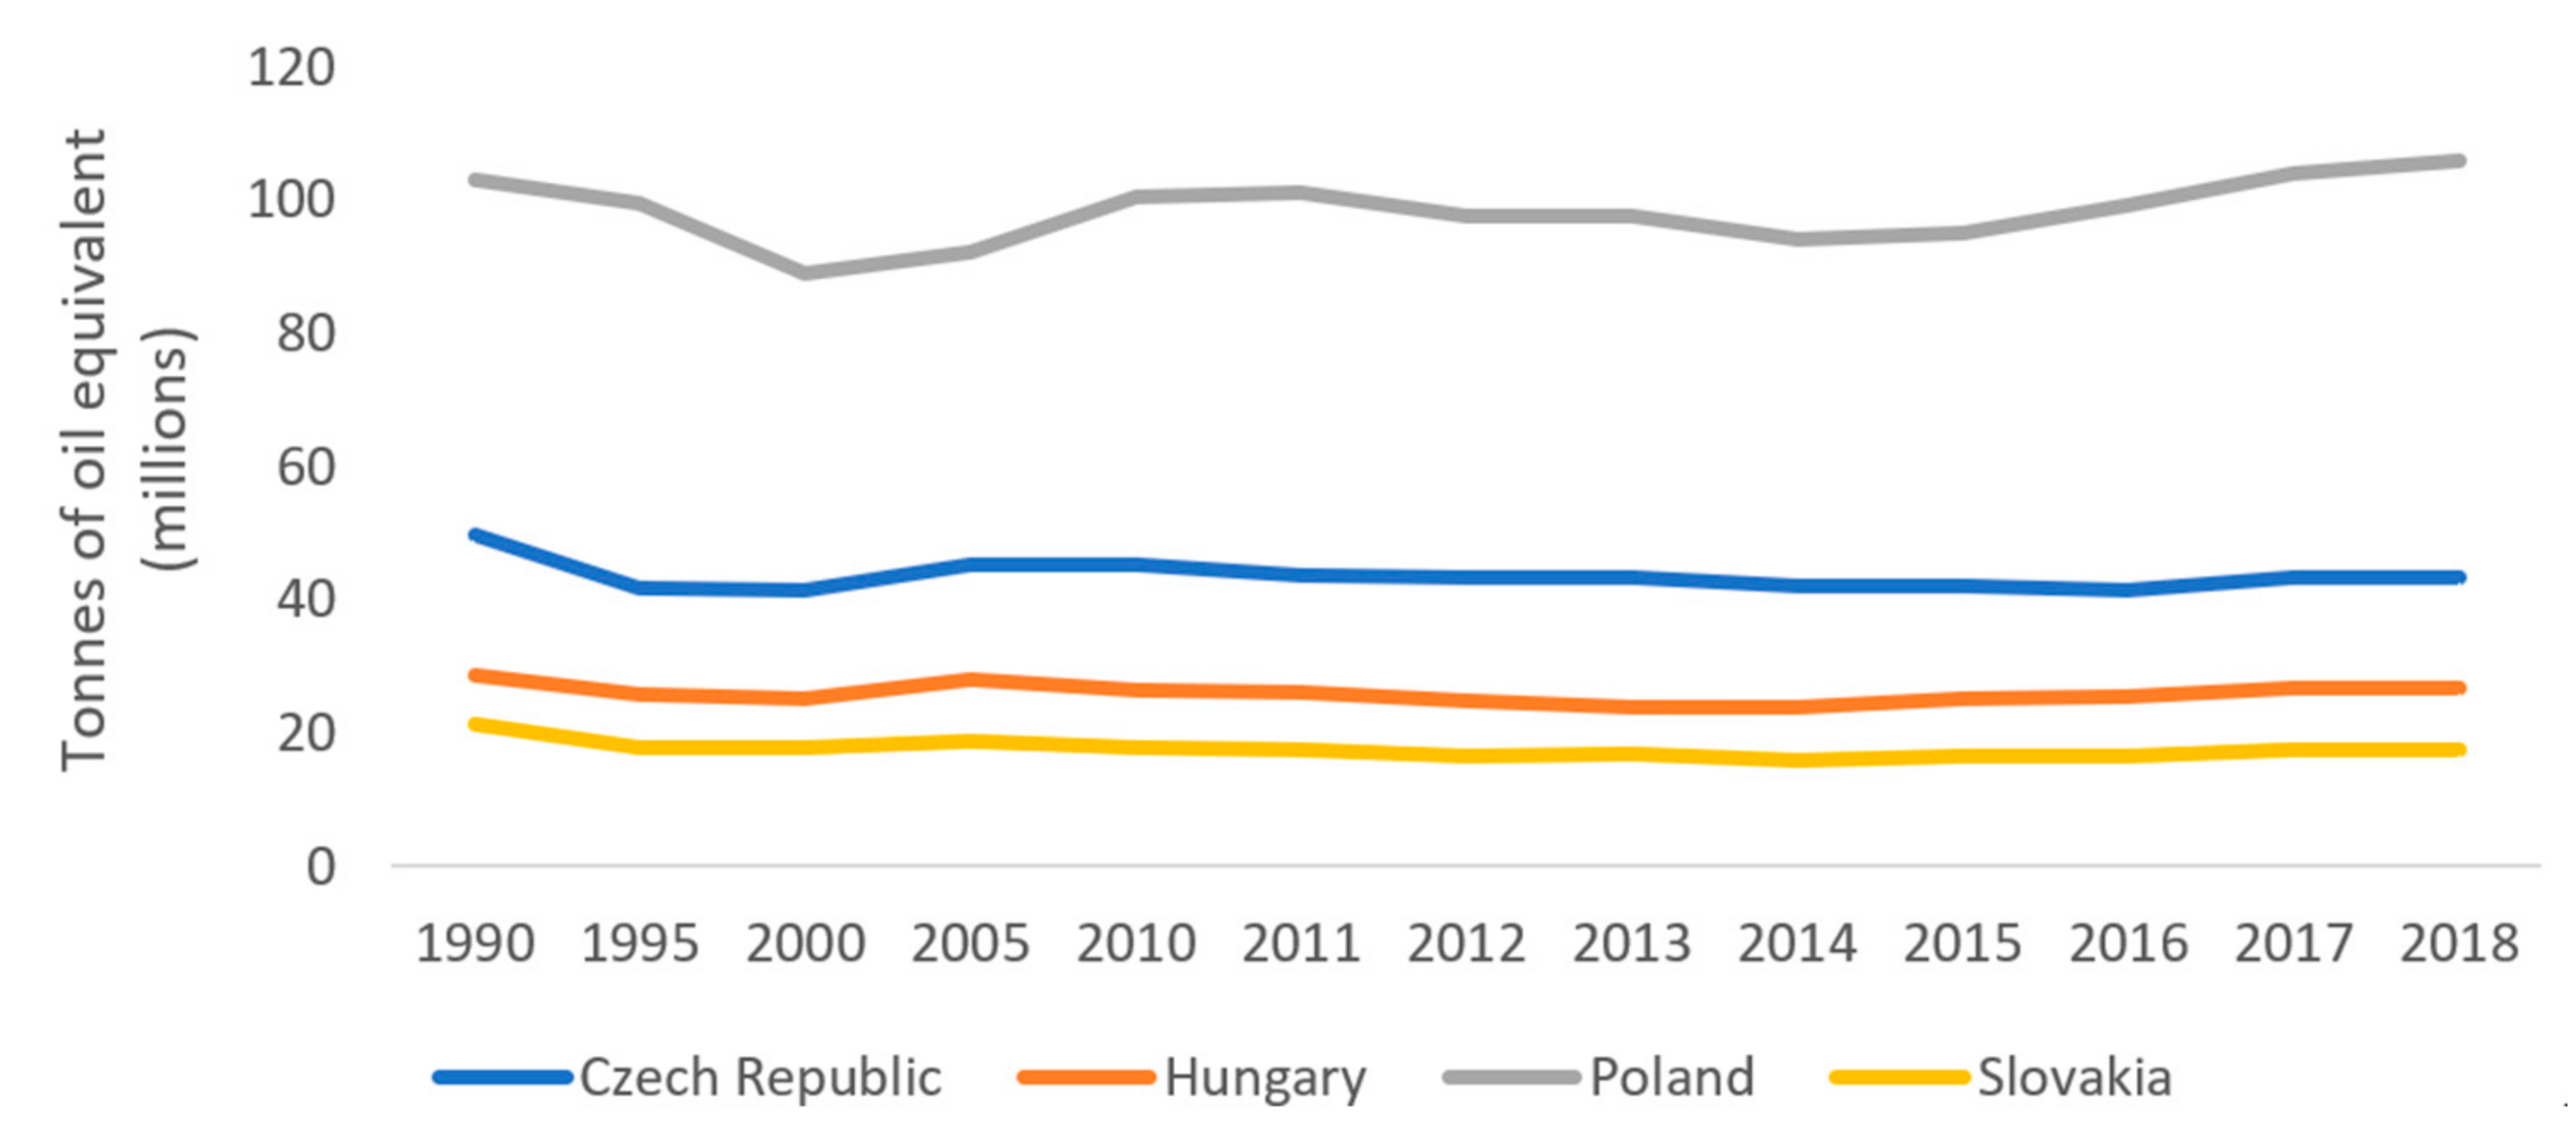
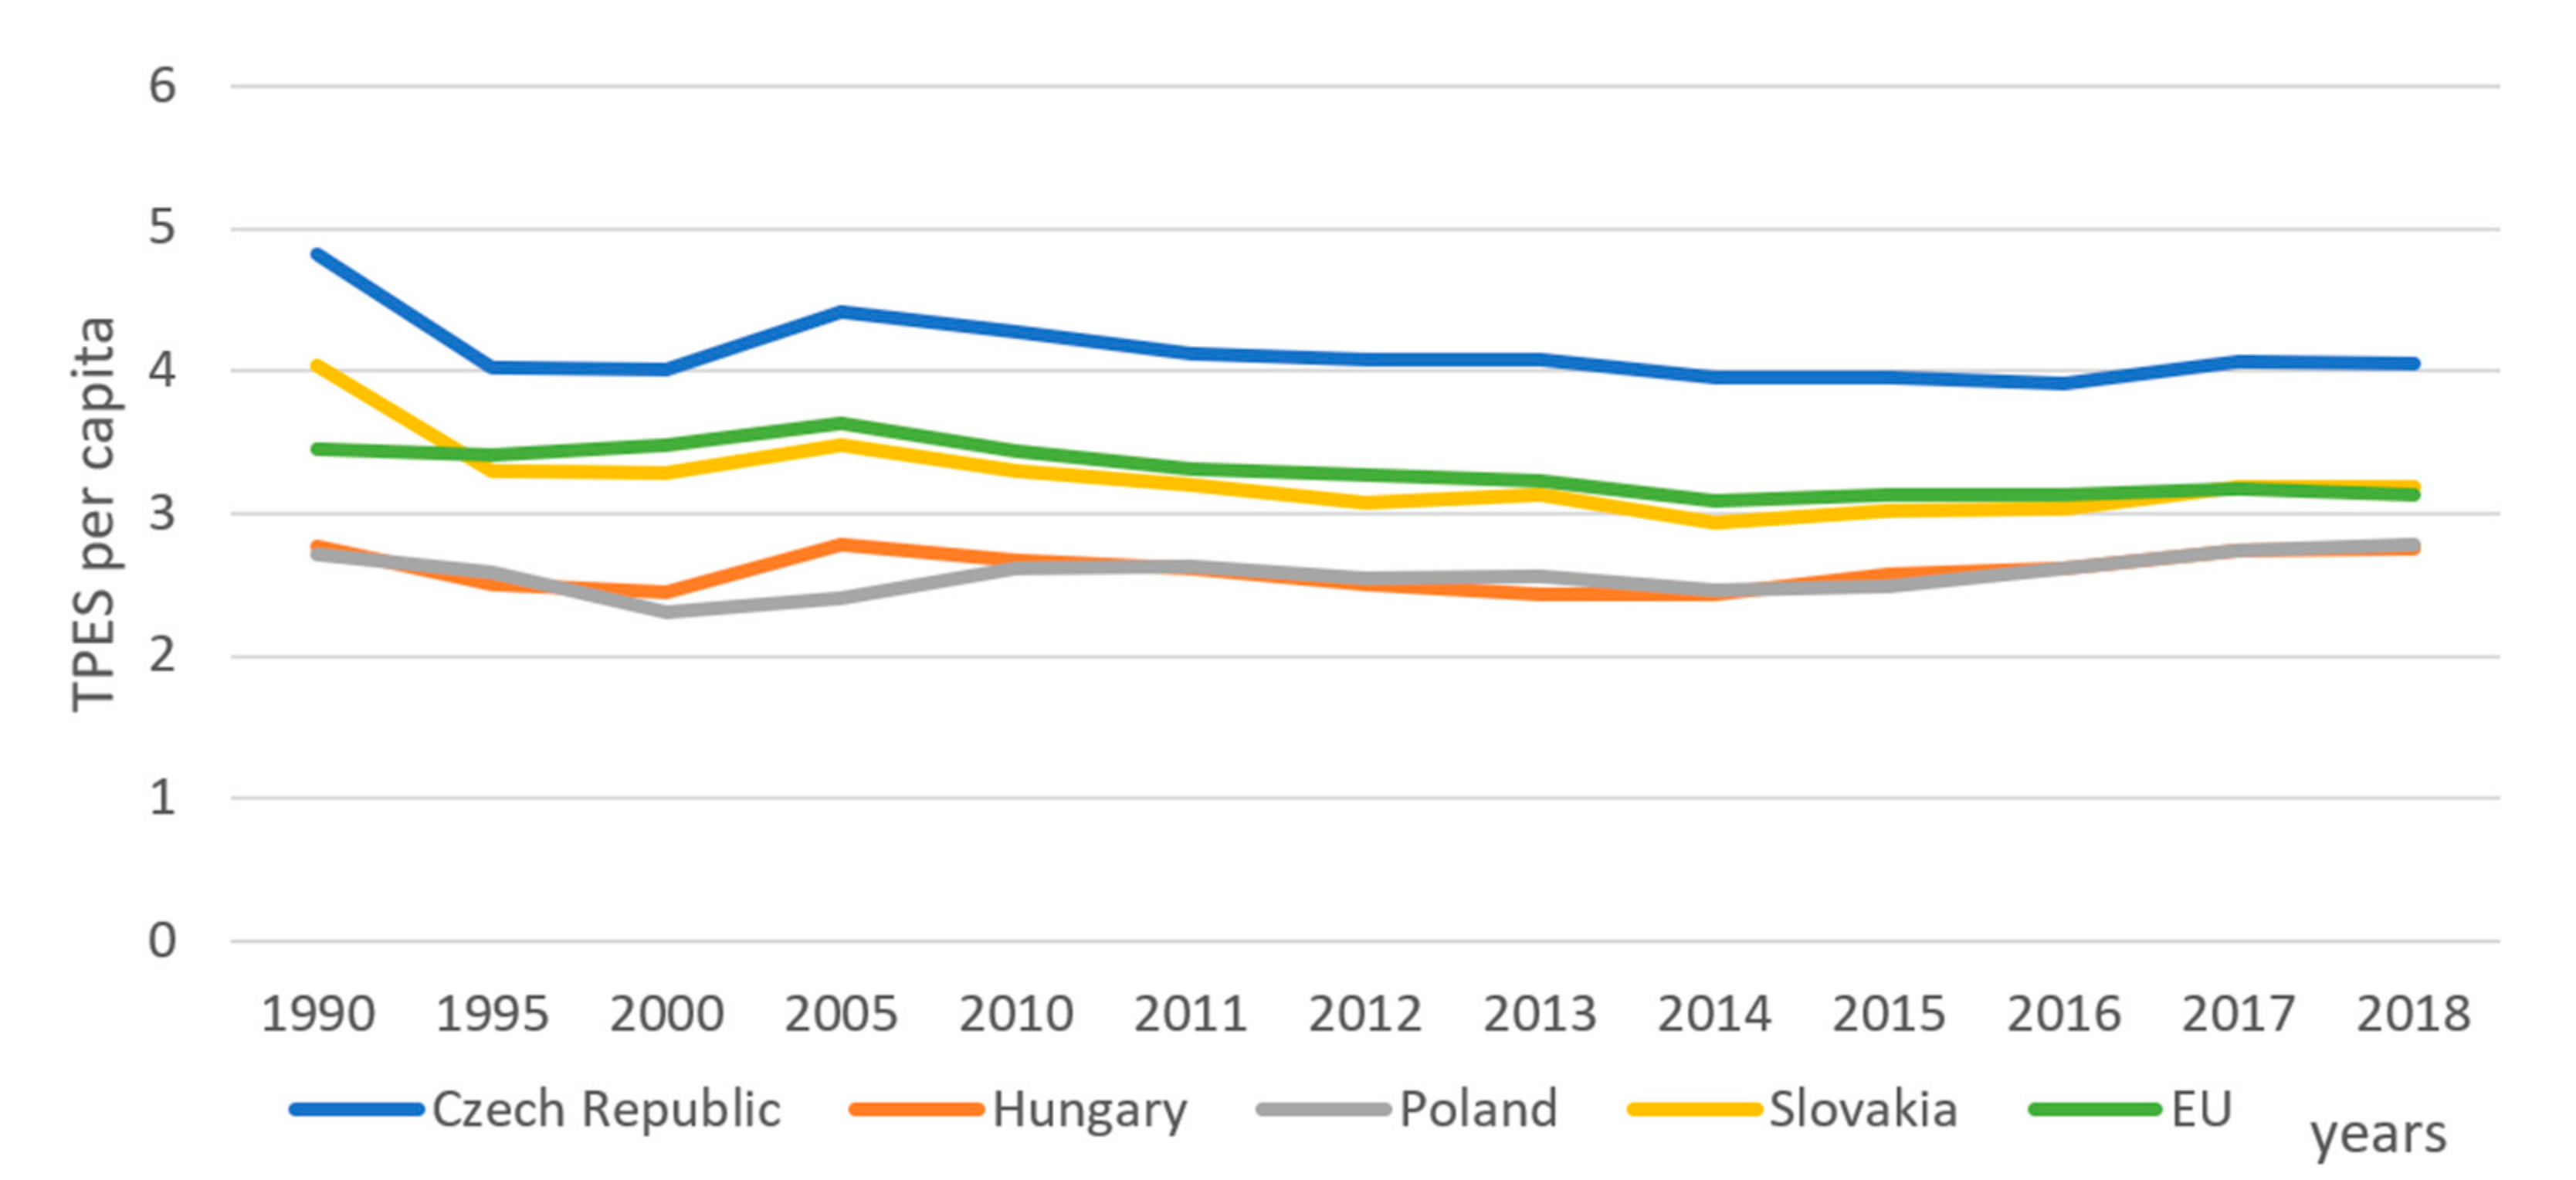
3.1. Basic Parameters of Energy Consumption in the Countries of the Visegrad Group
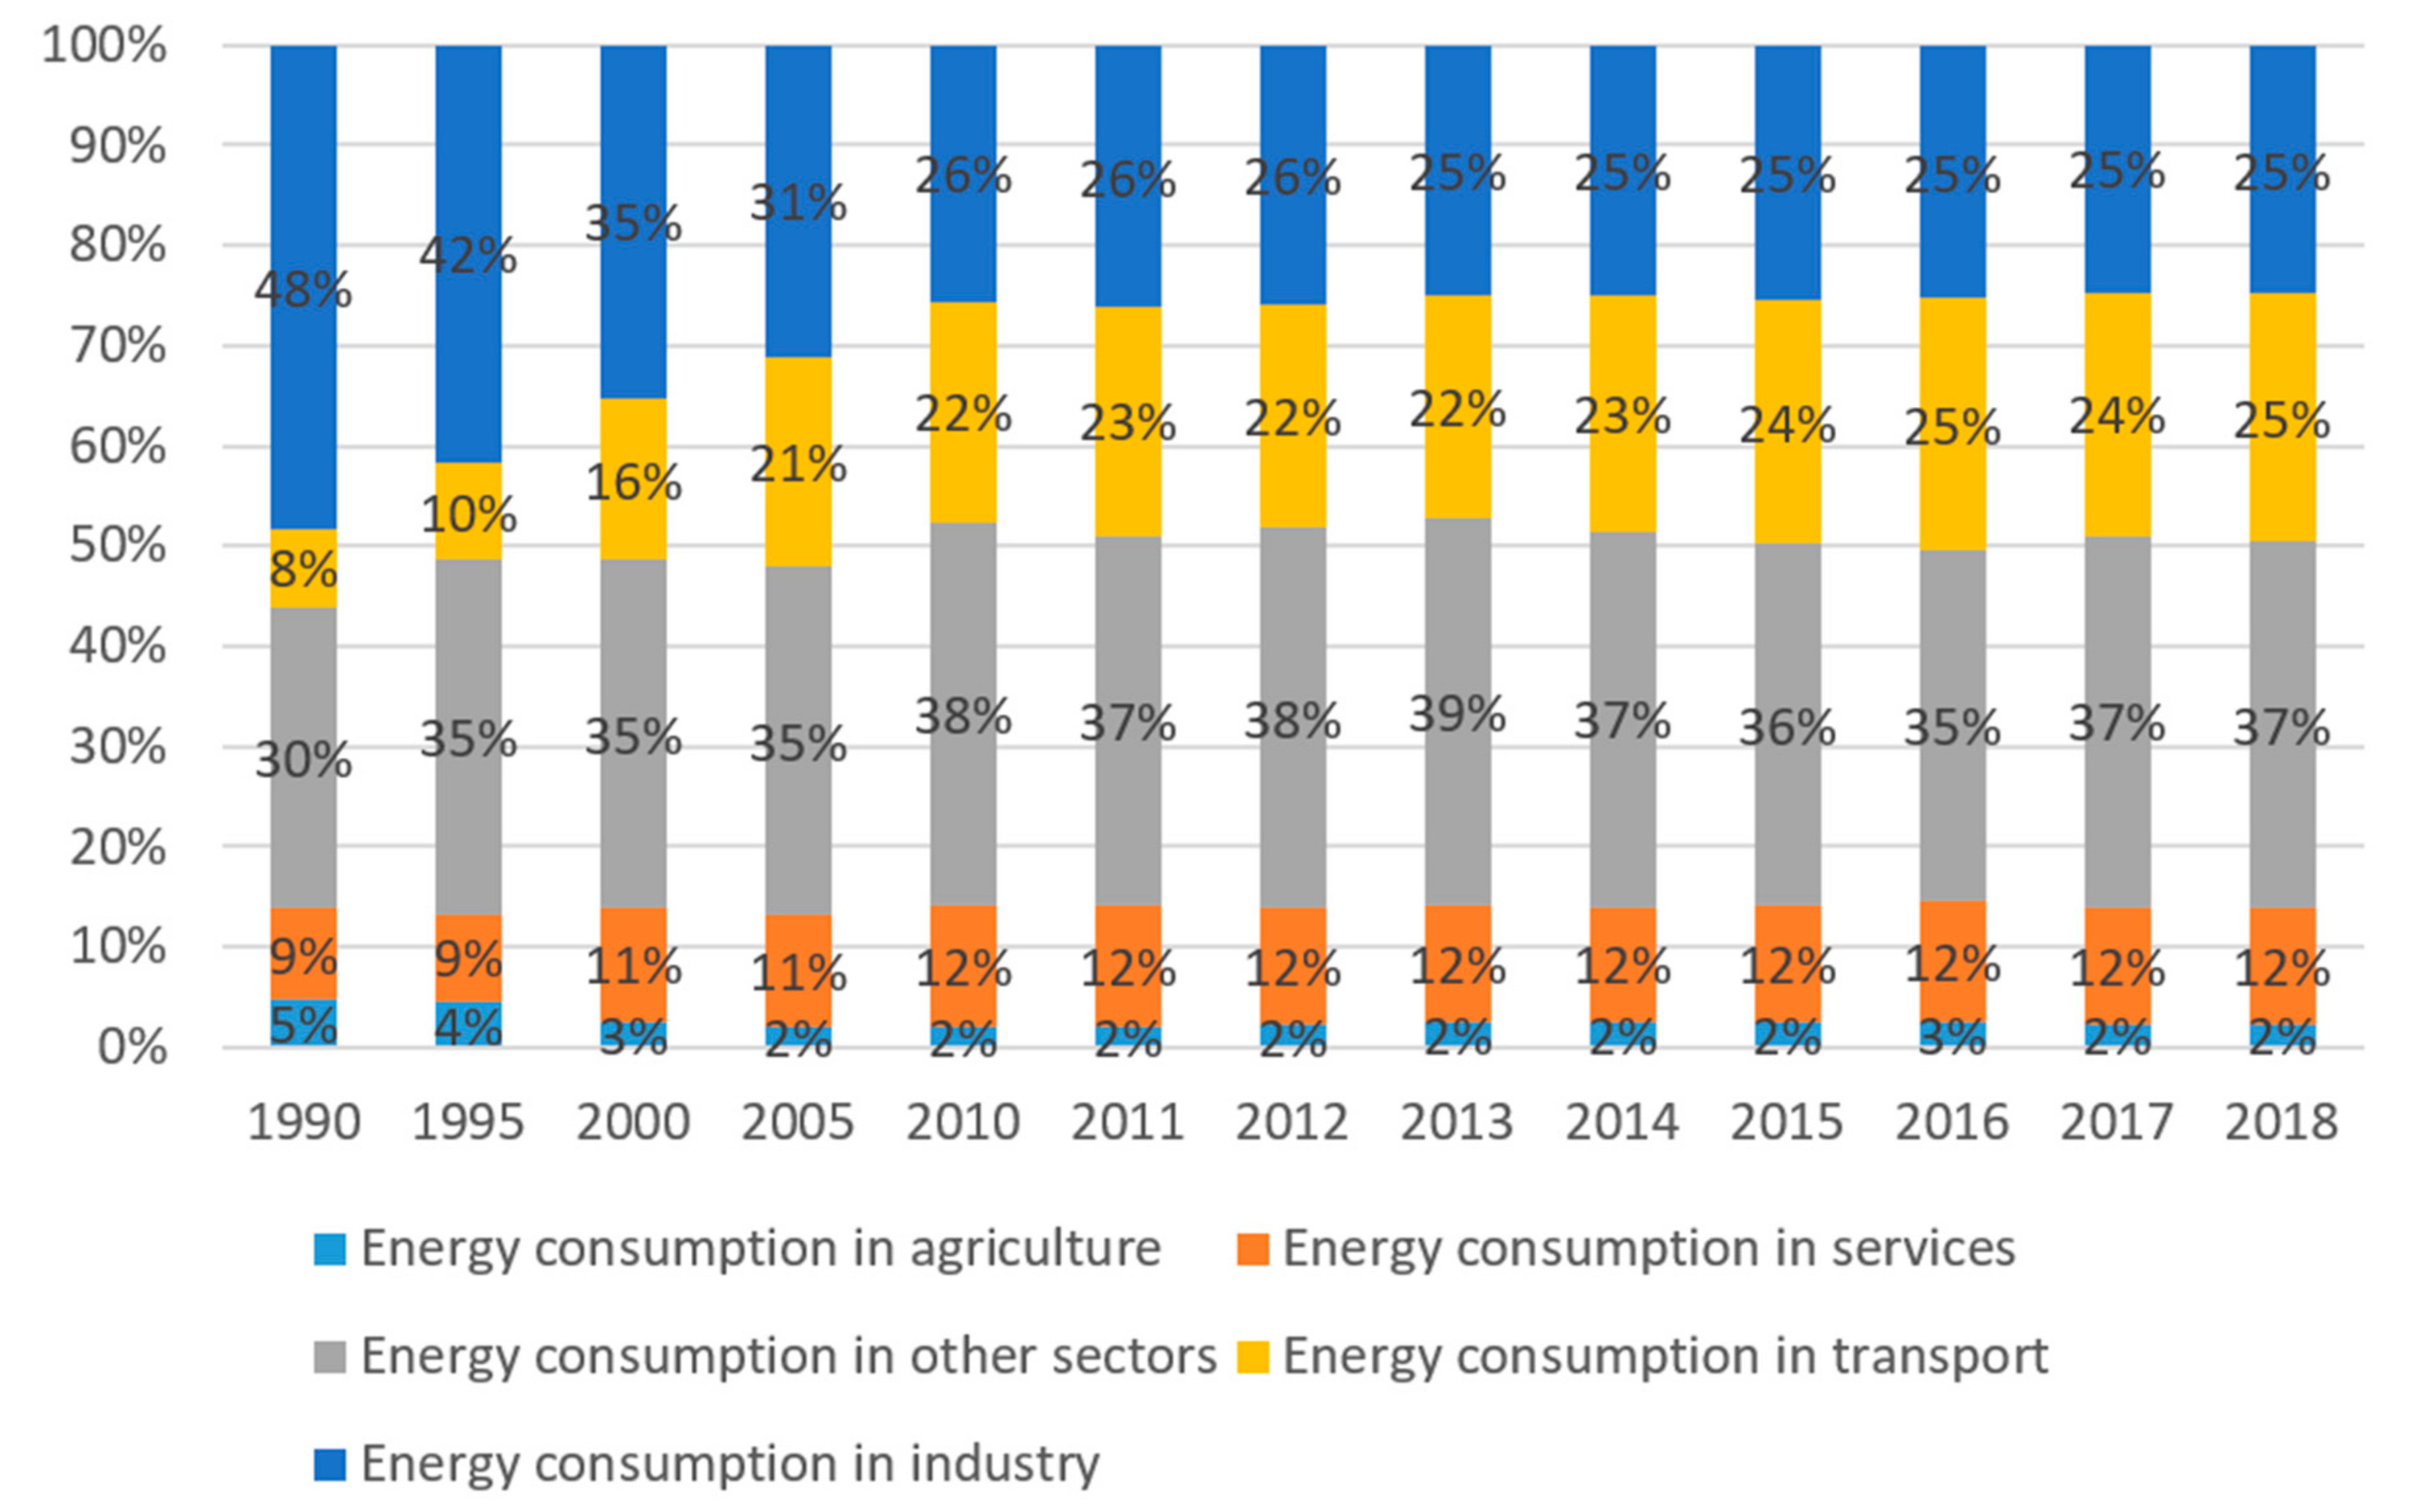
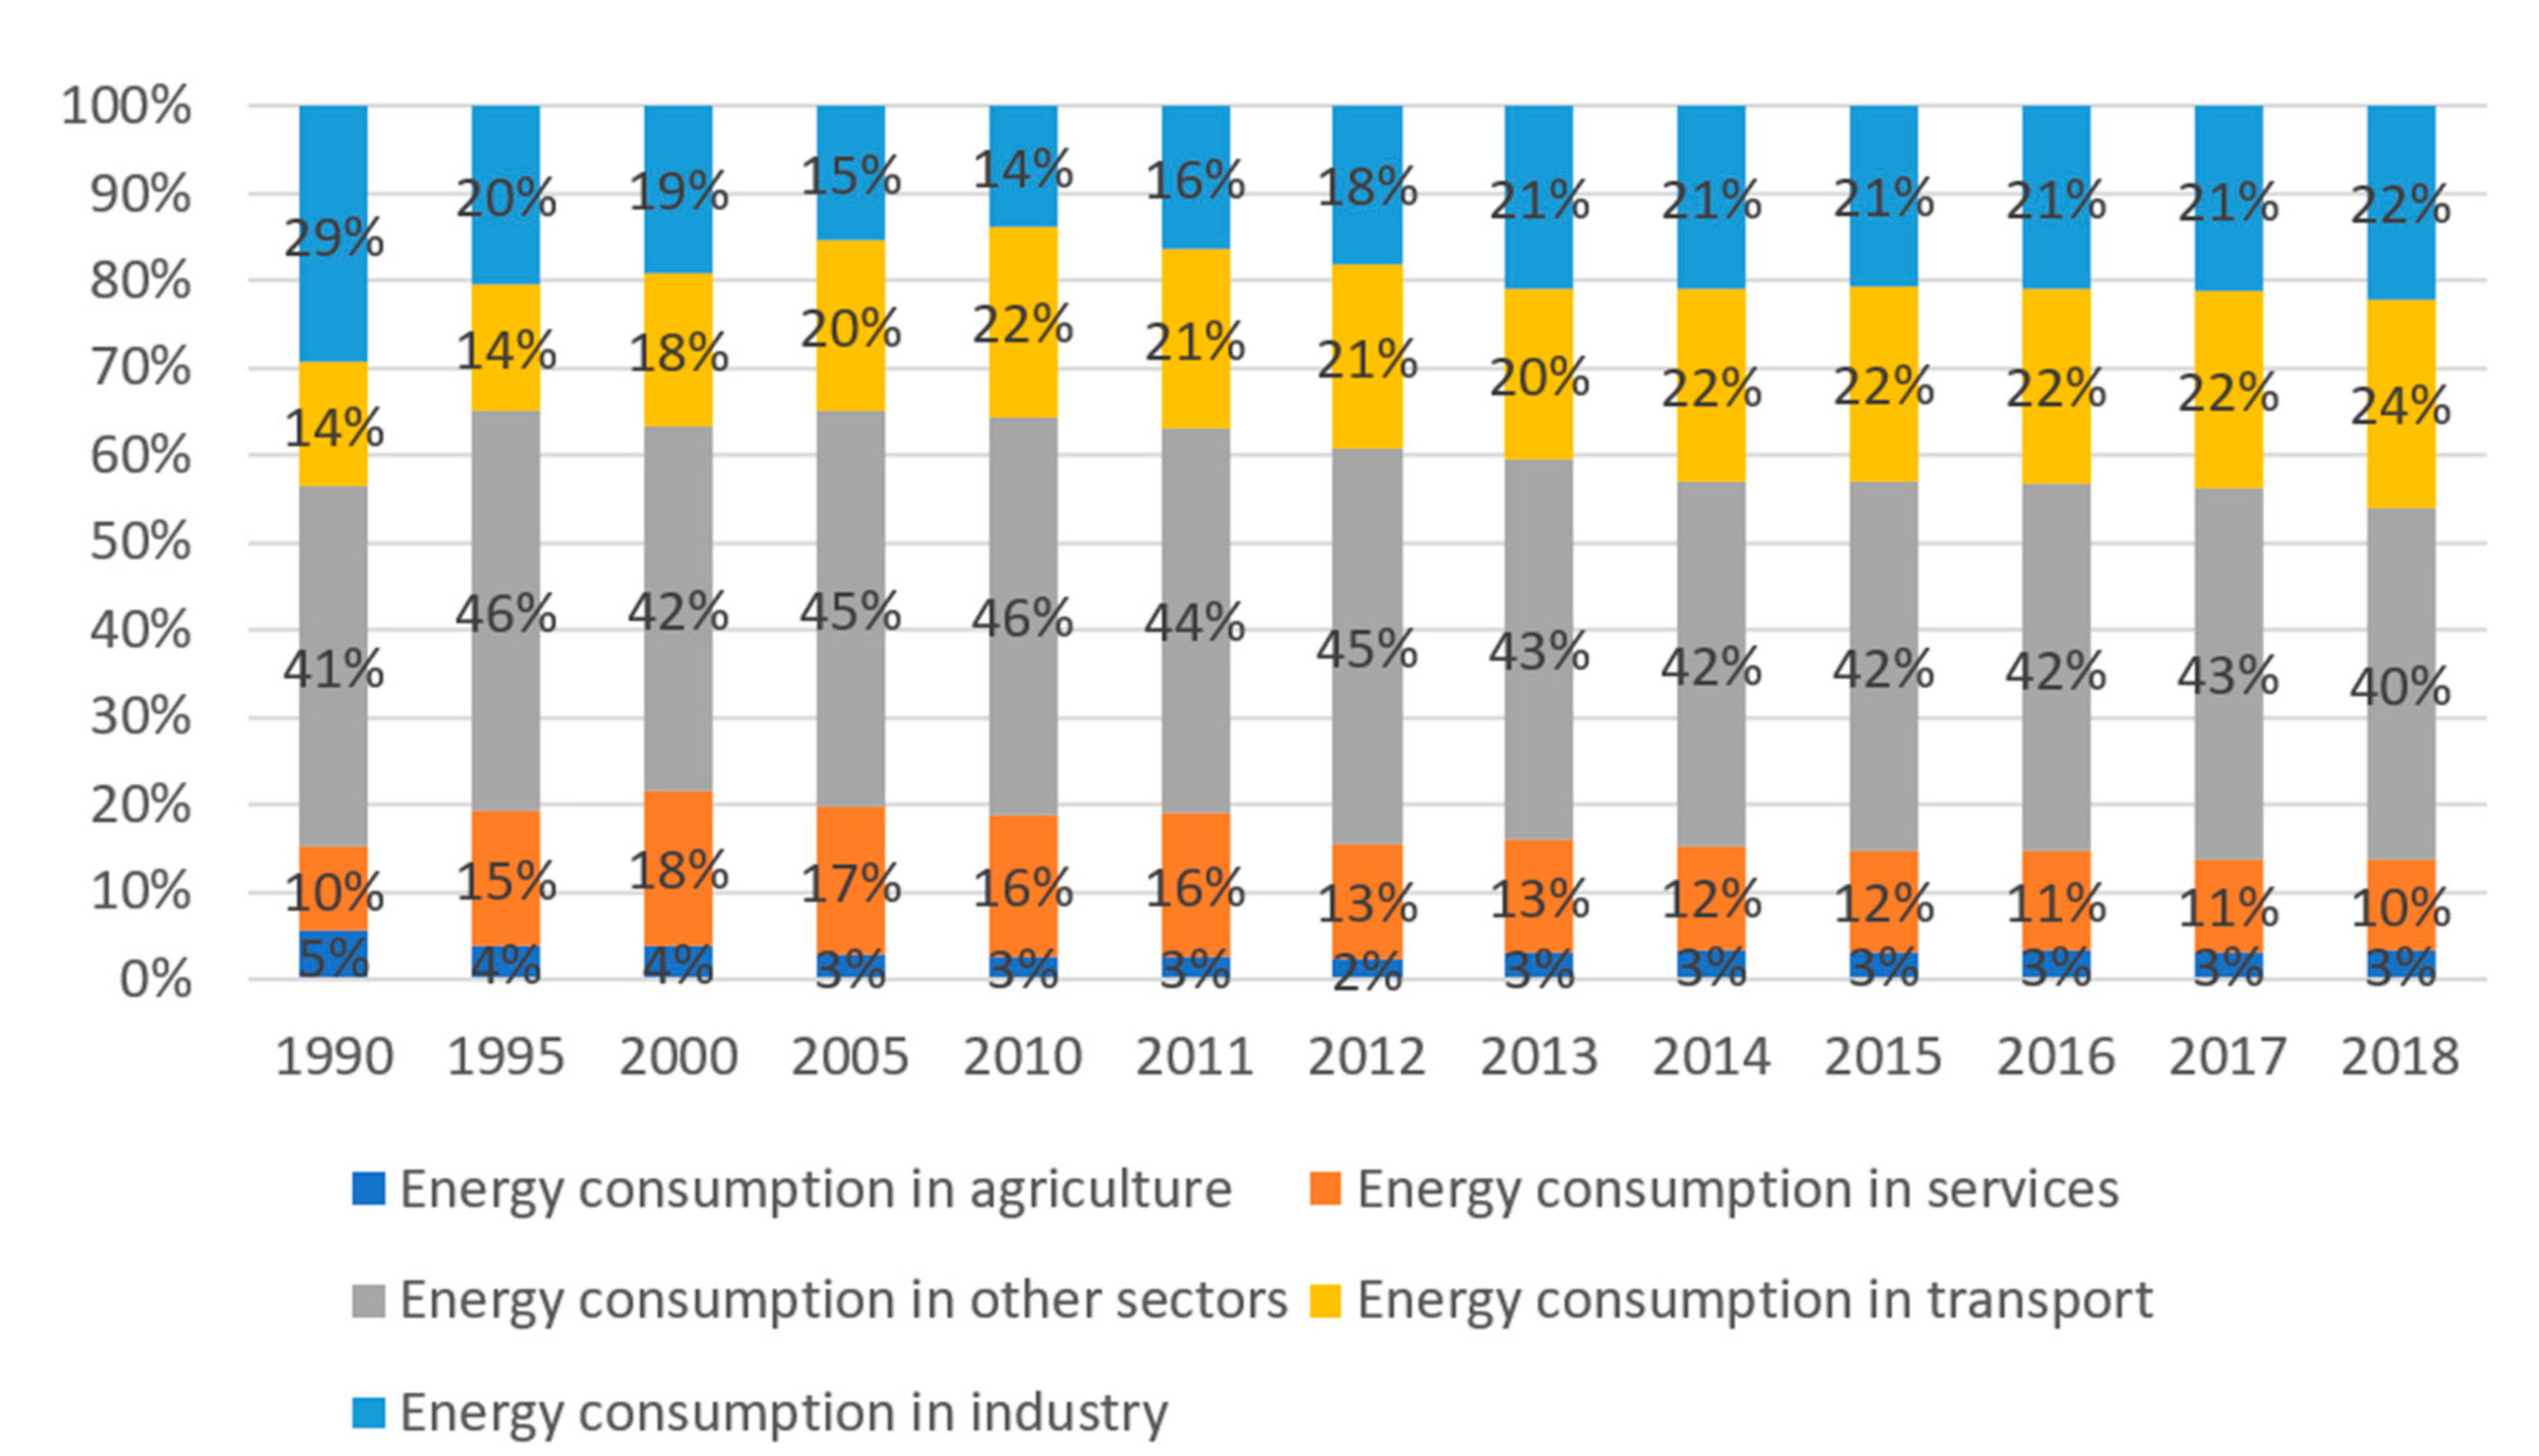
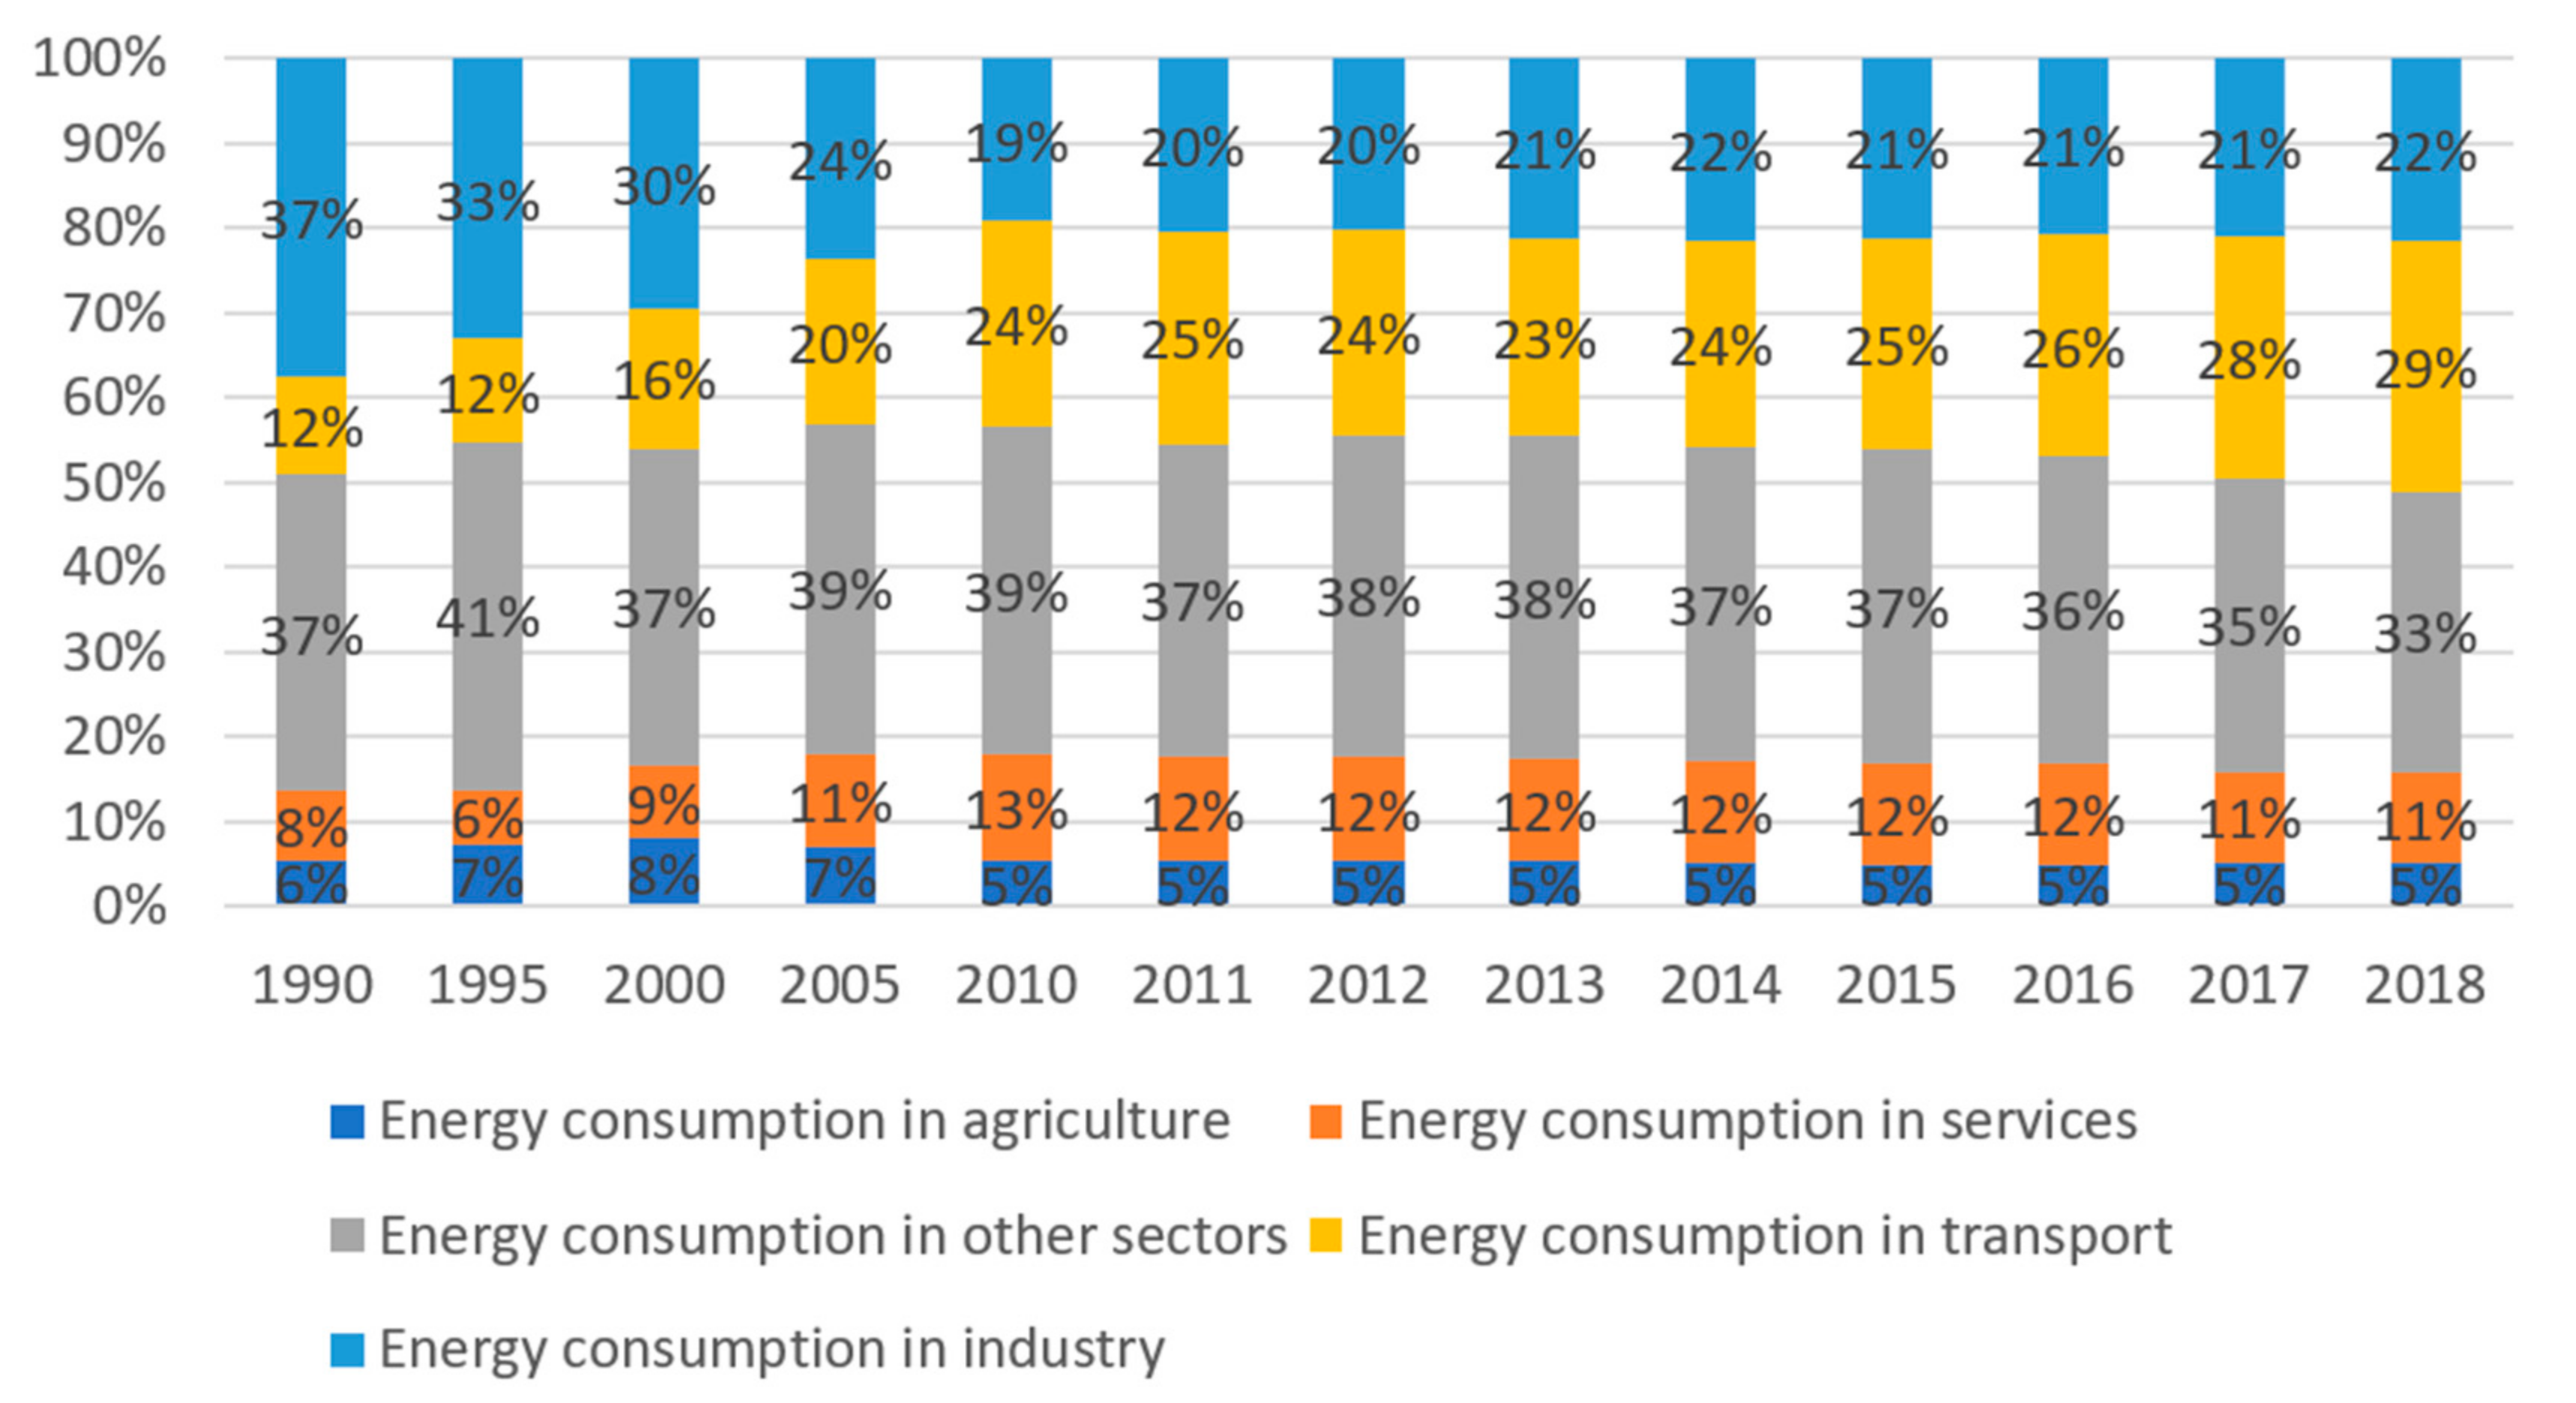
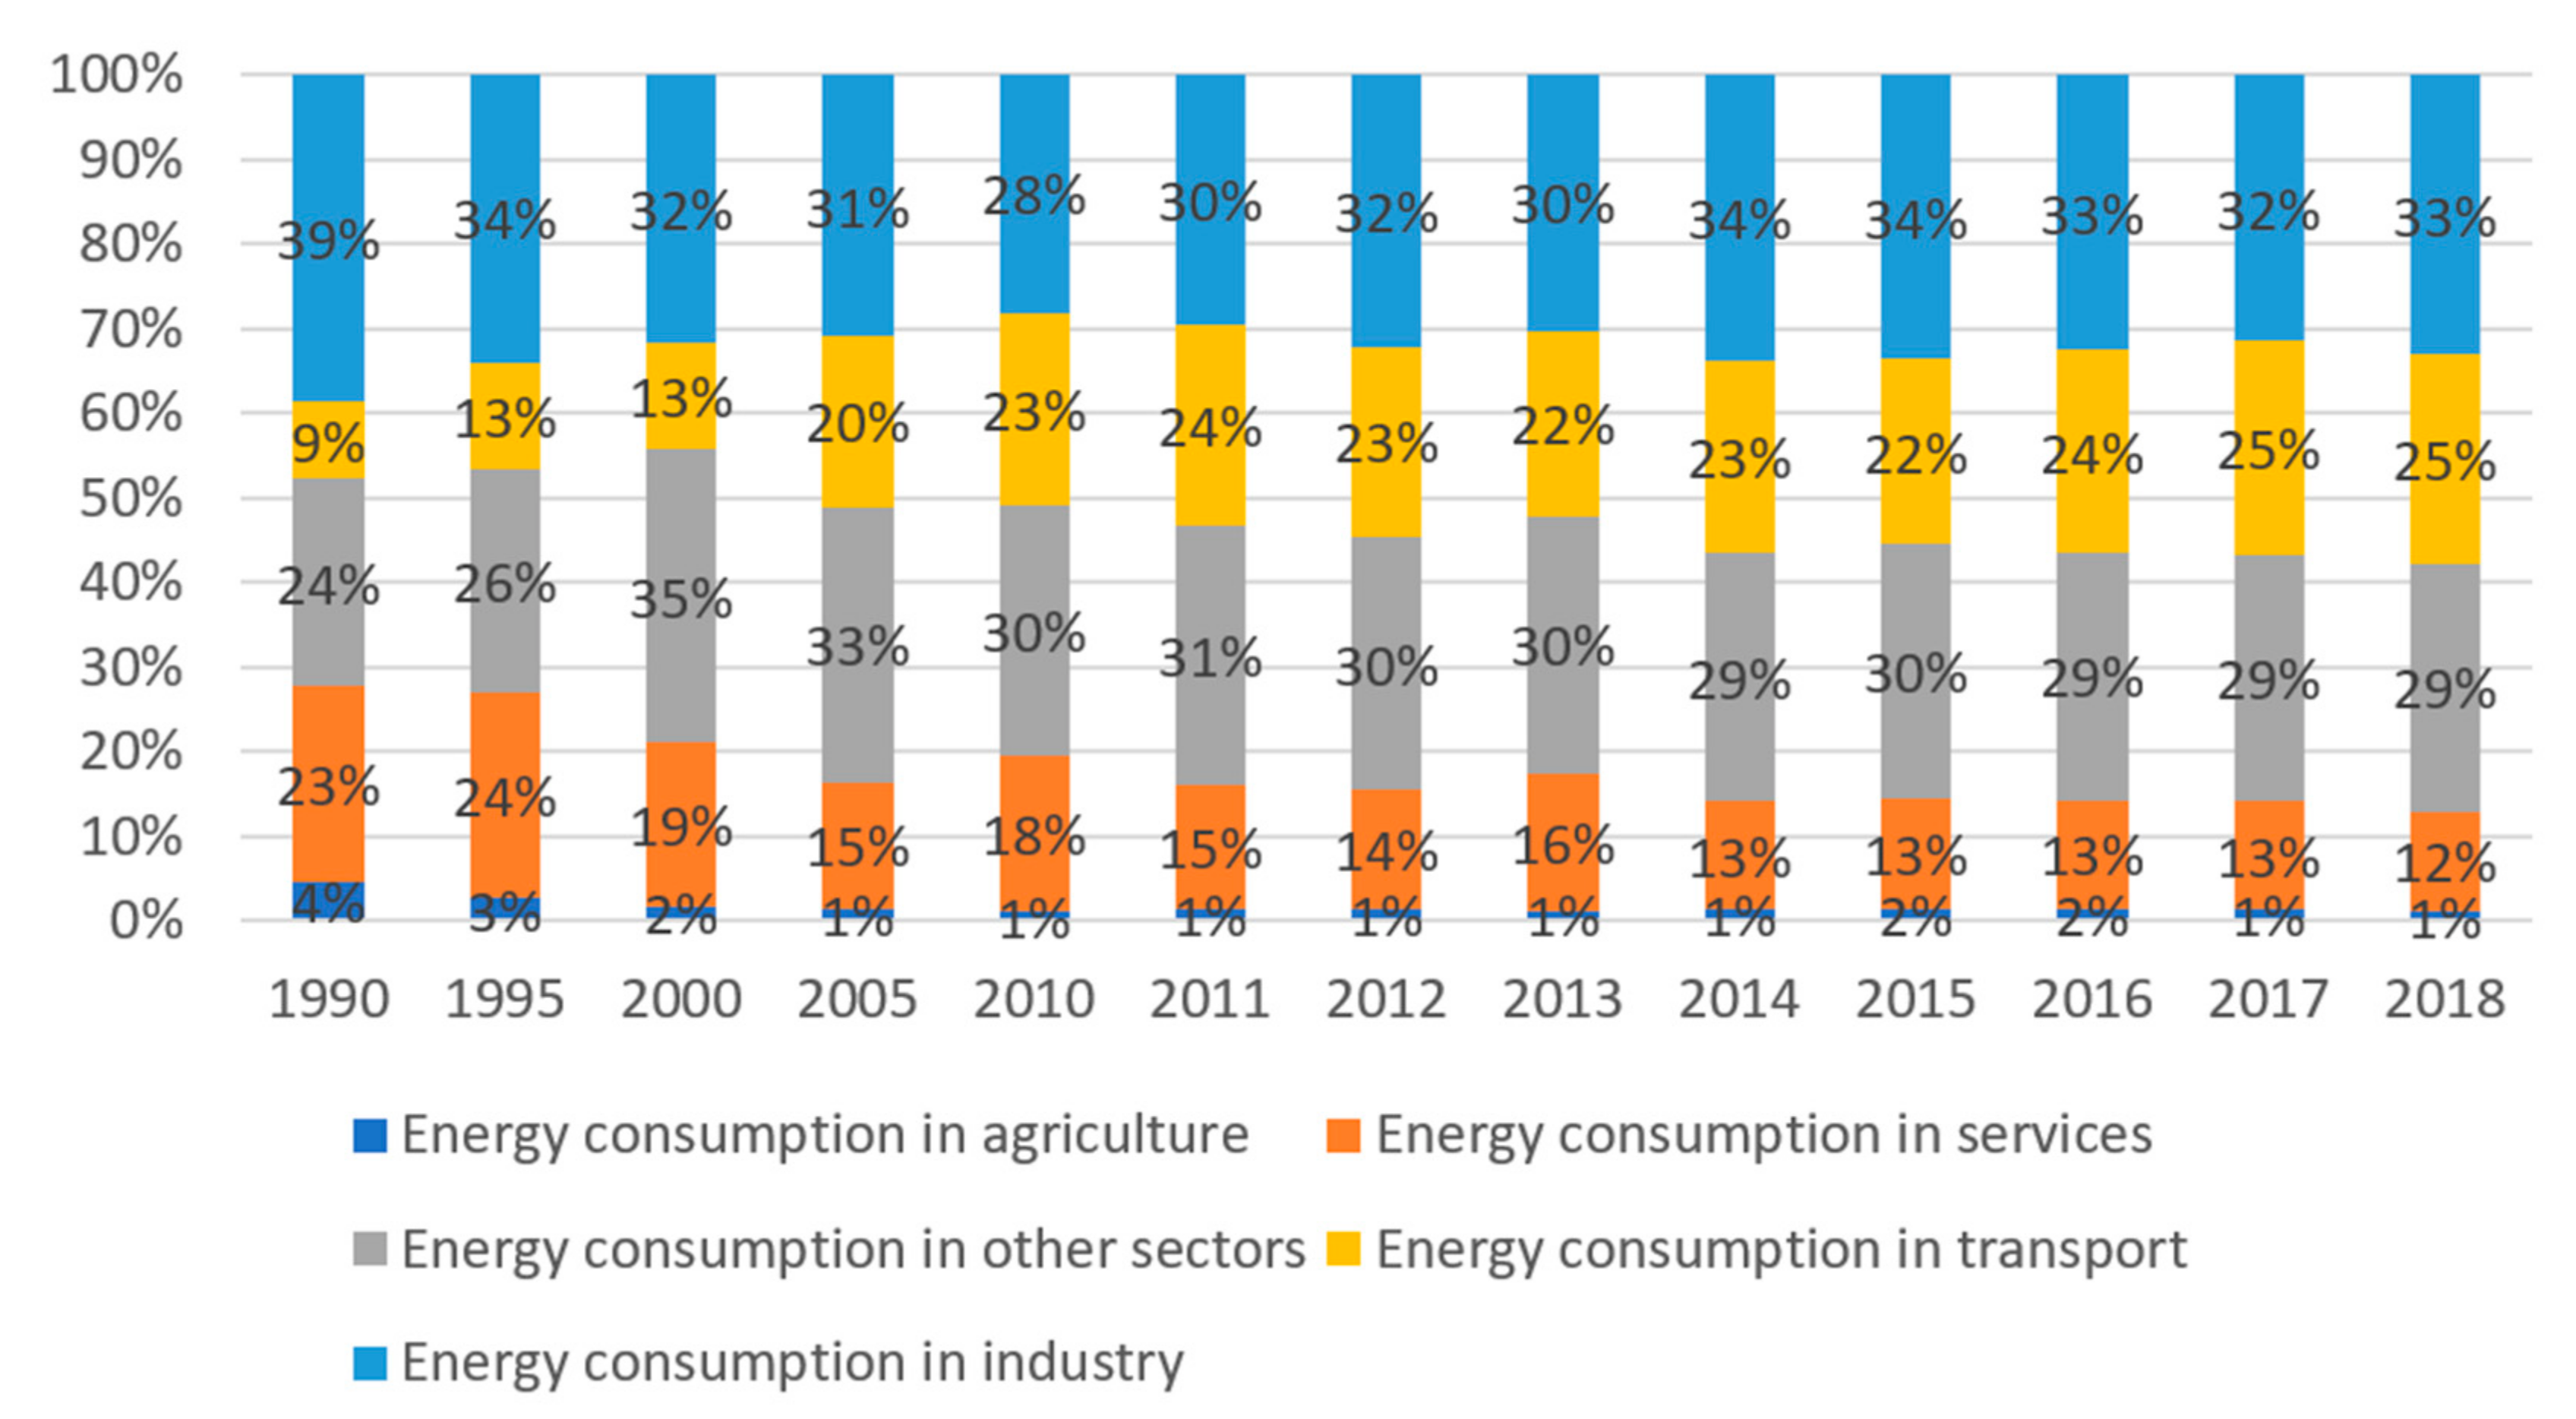
3.2. Energy Consumption in Sectors of the Economy in the Countries of the Visegrad Group
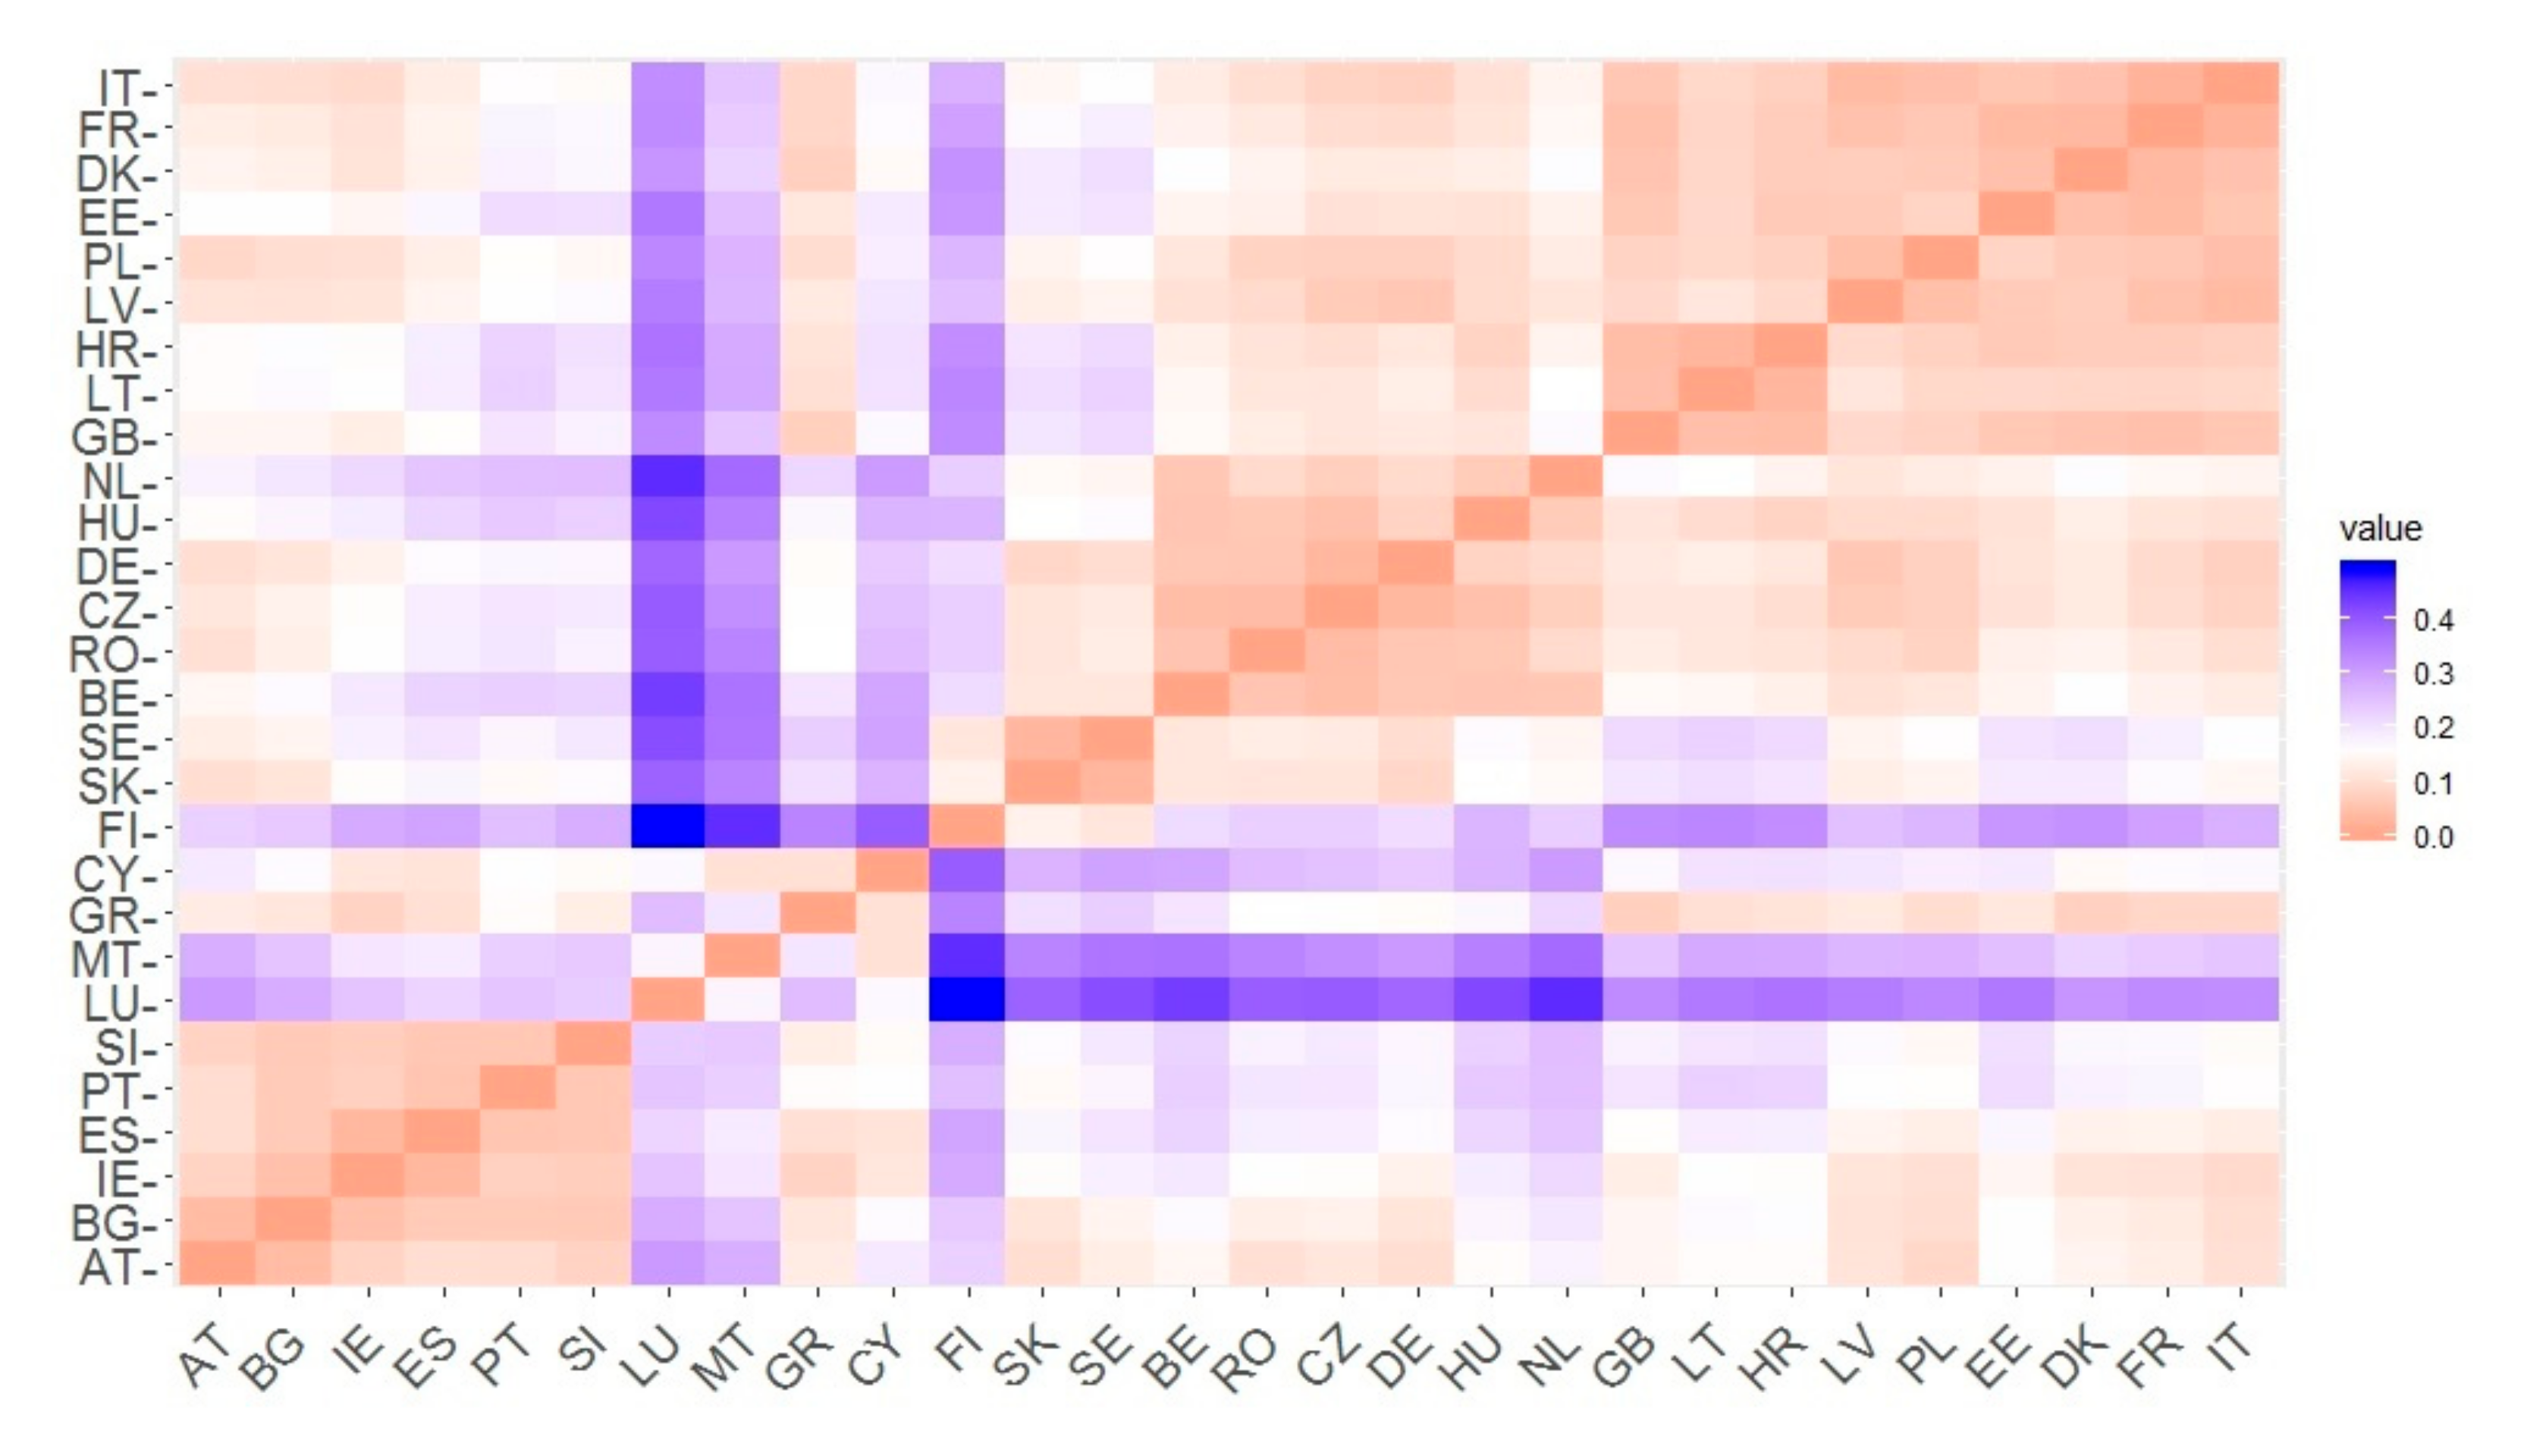
3.3. Cluster Analysis in the Field of Energy Consumption for EU Countries
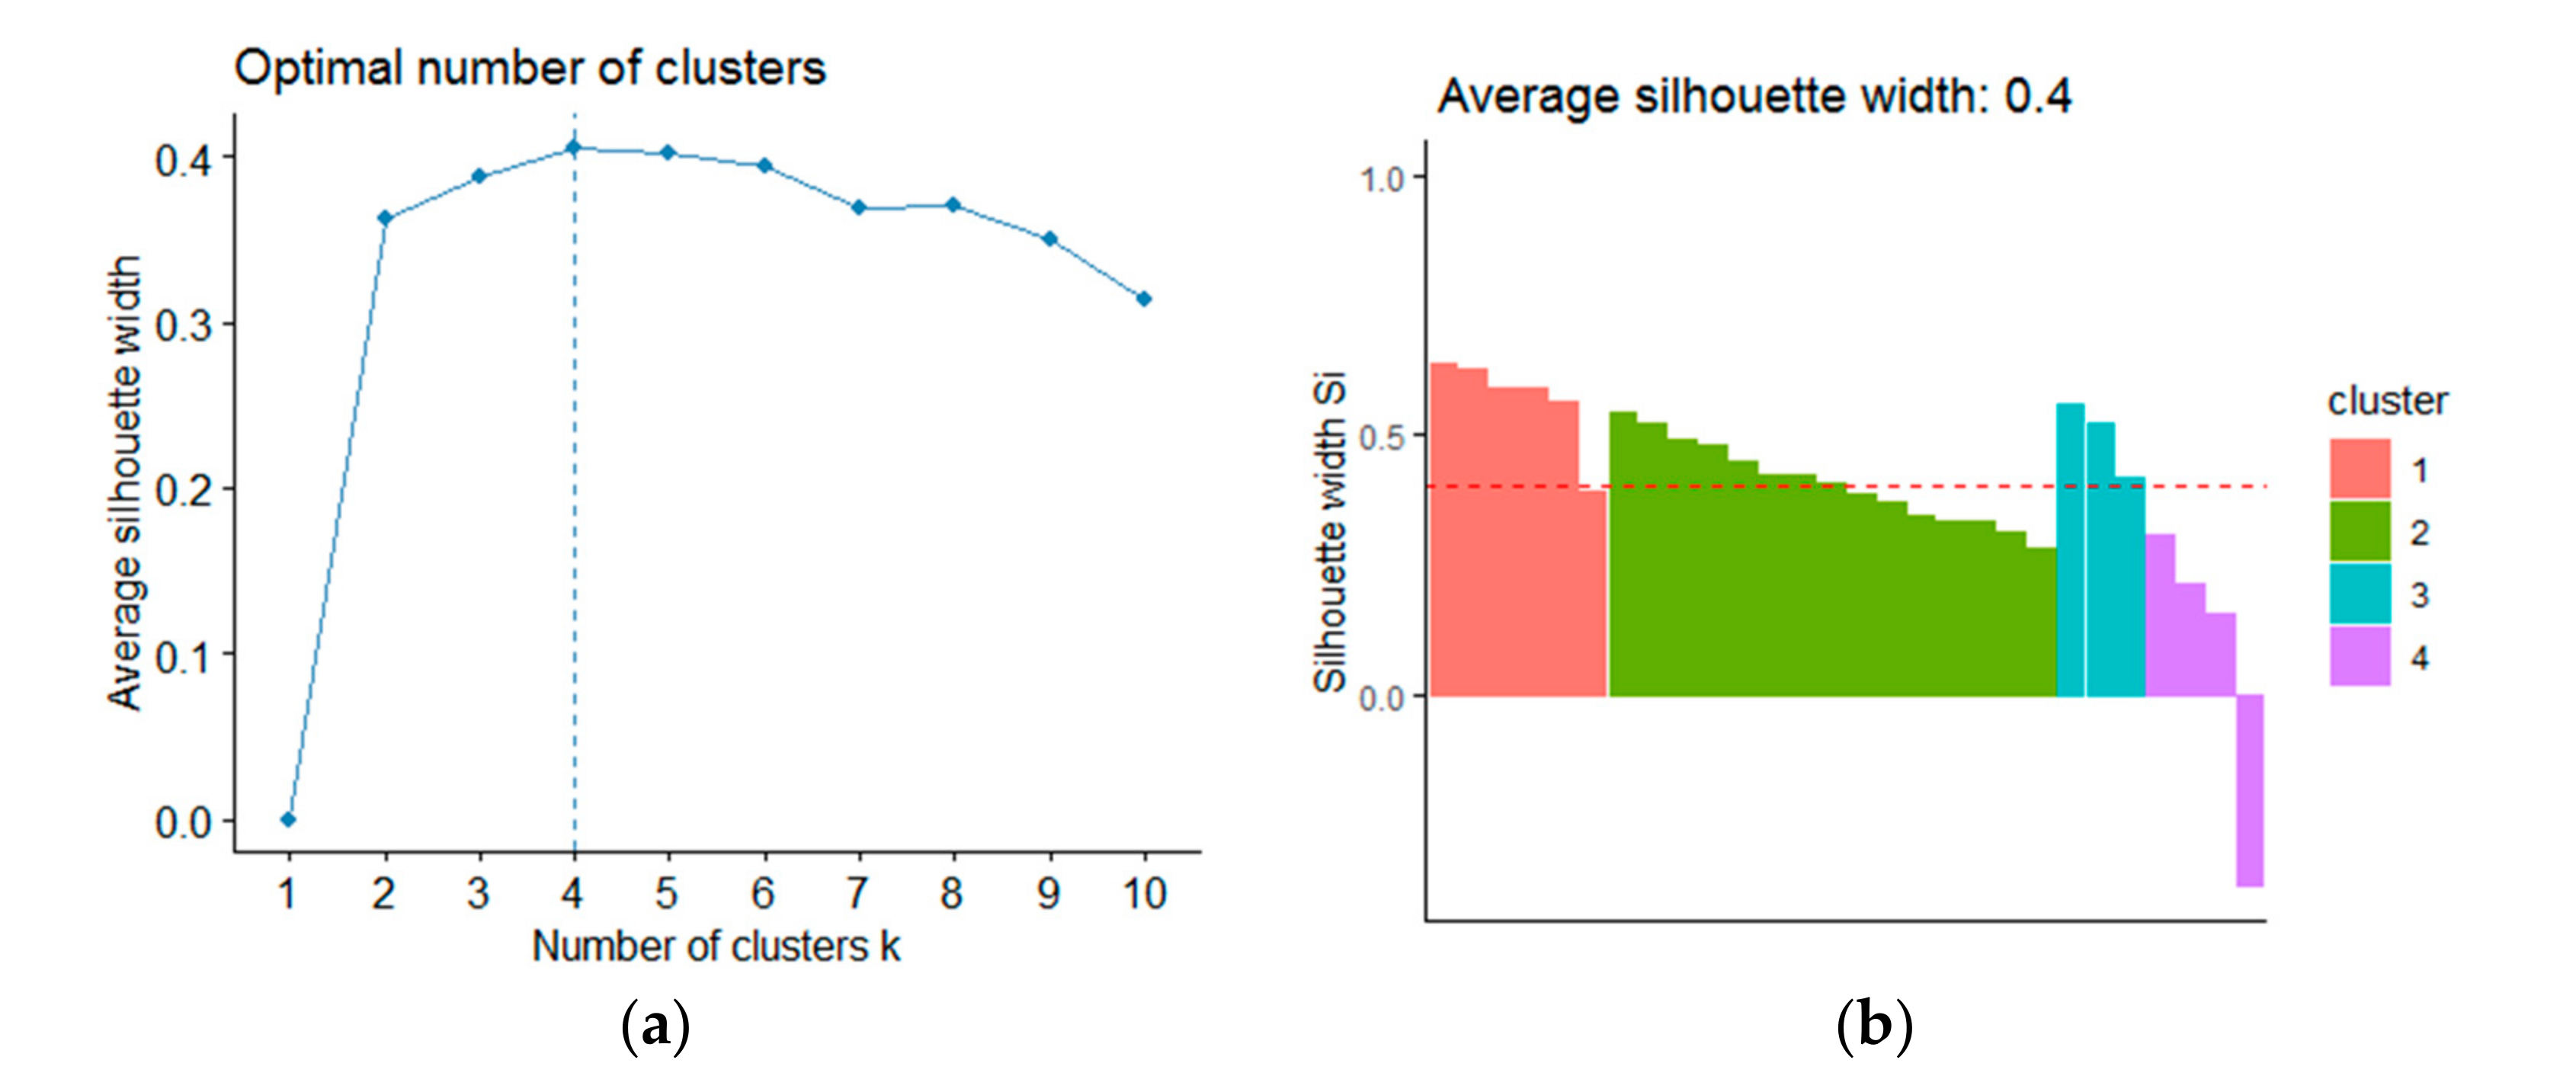
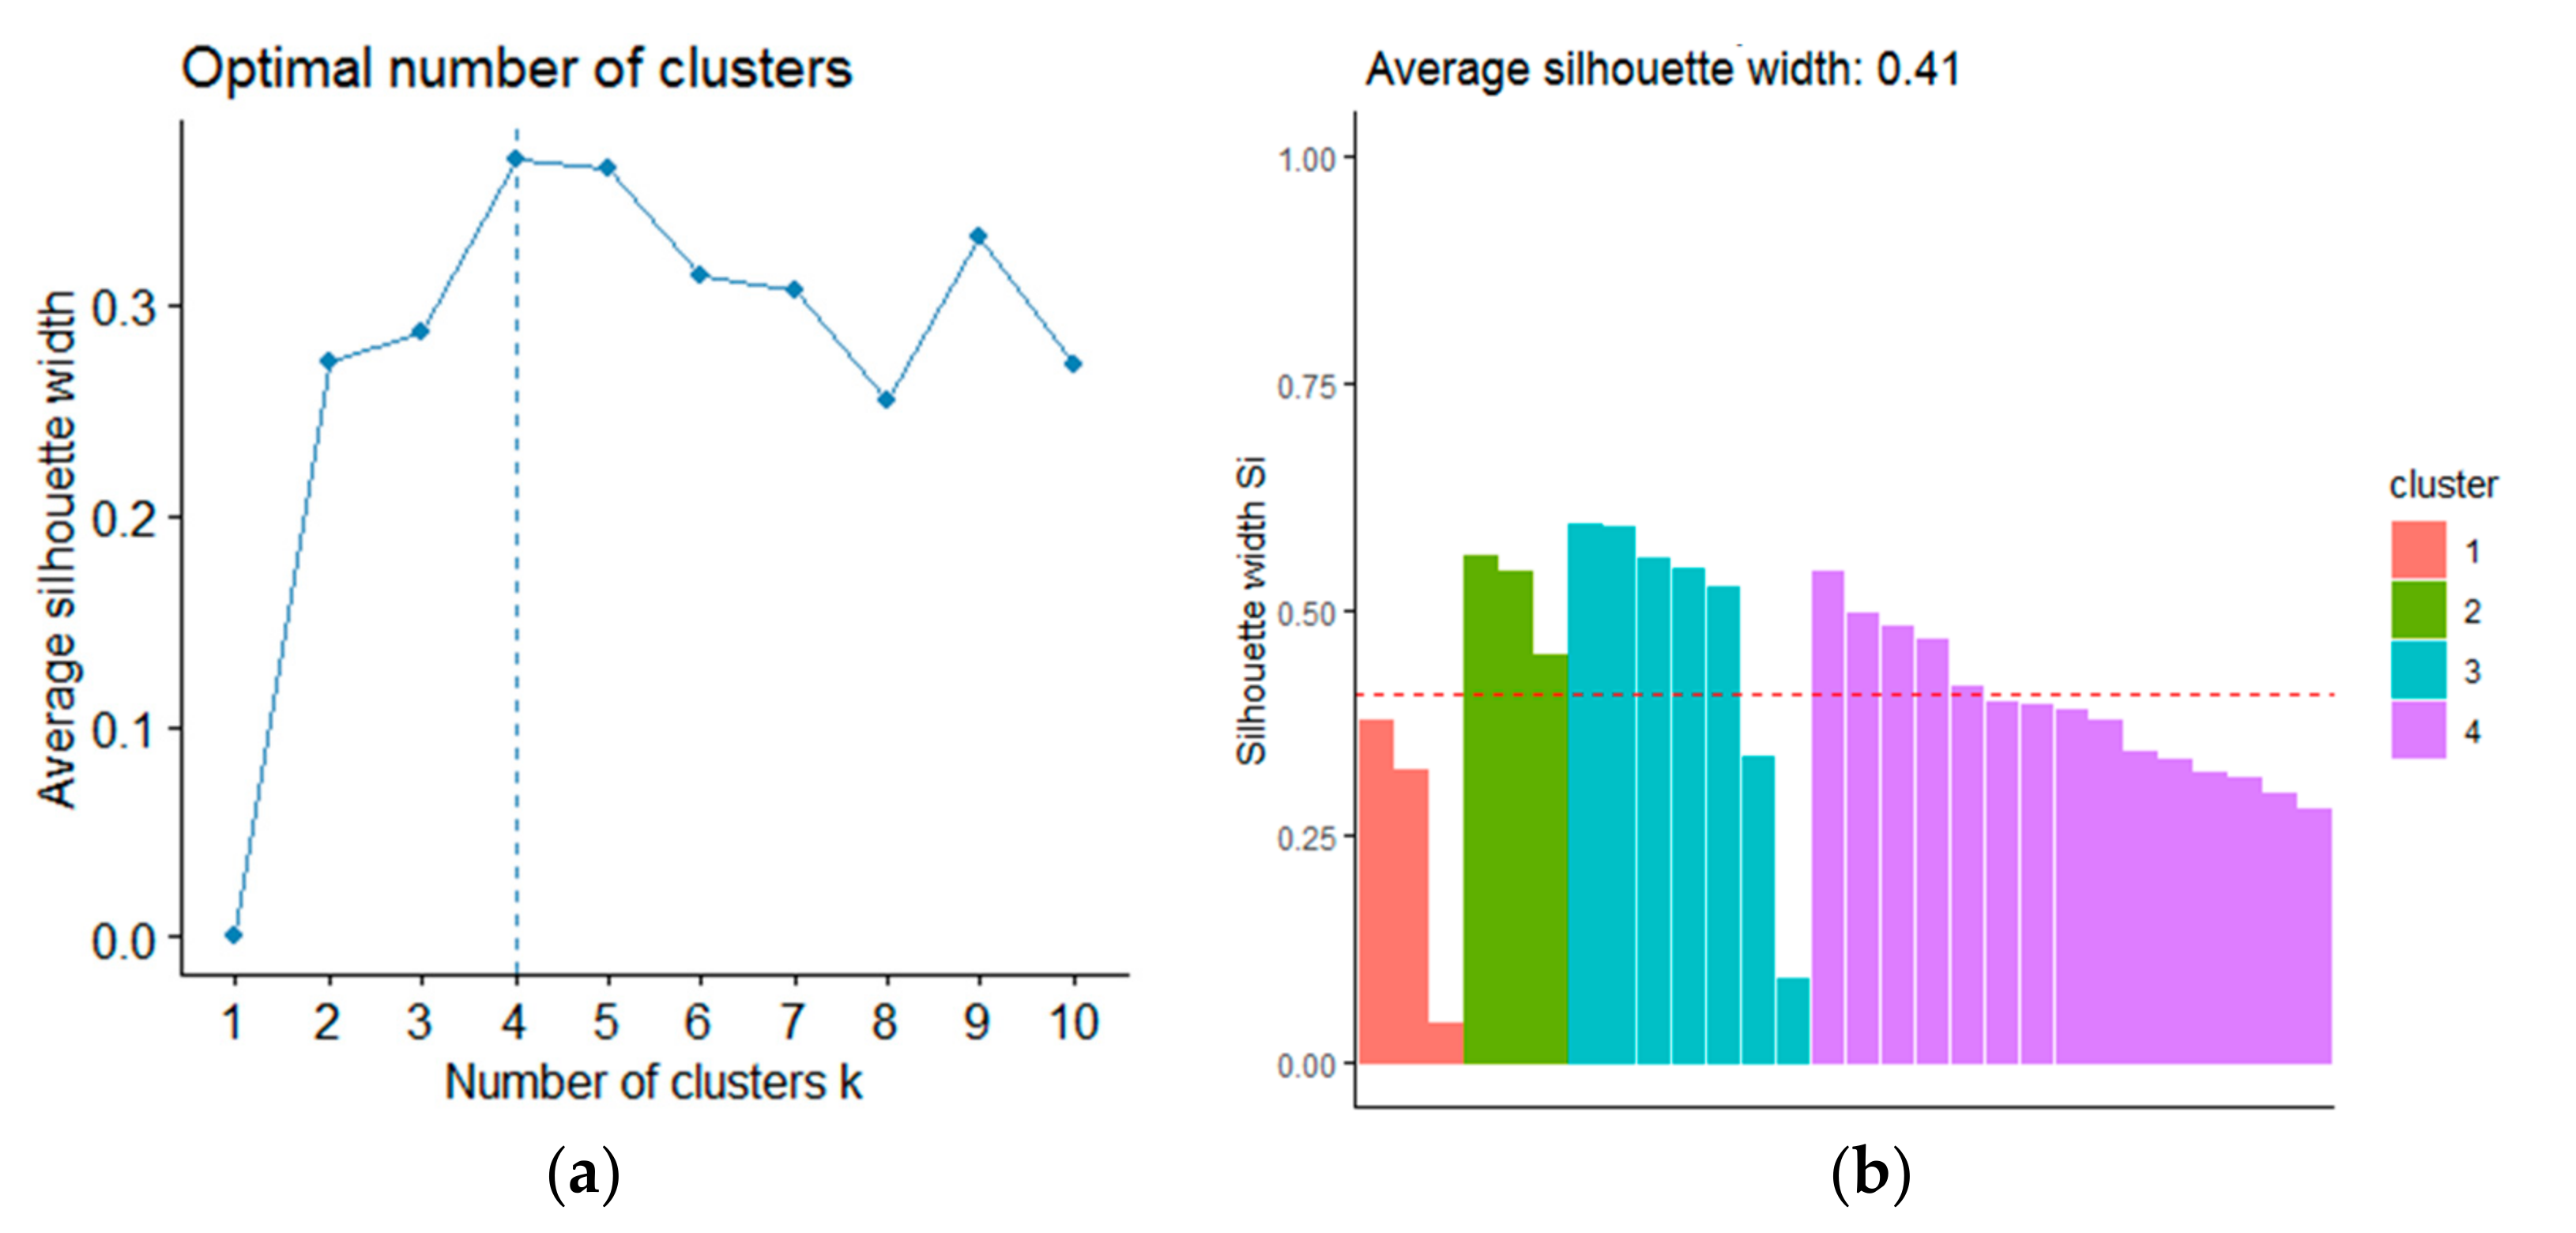
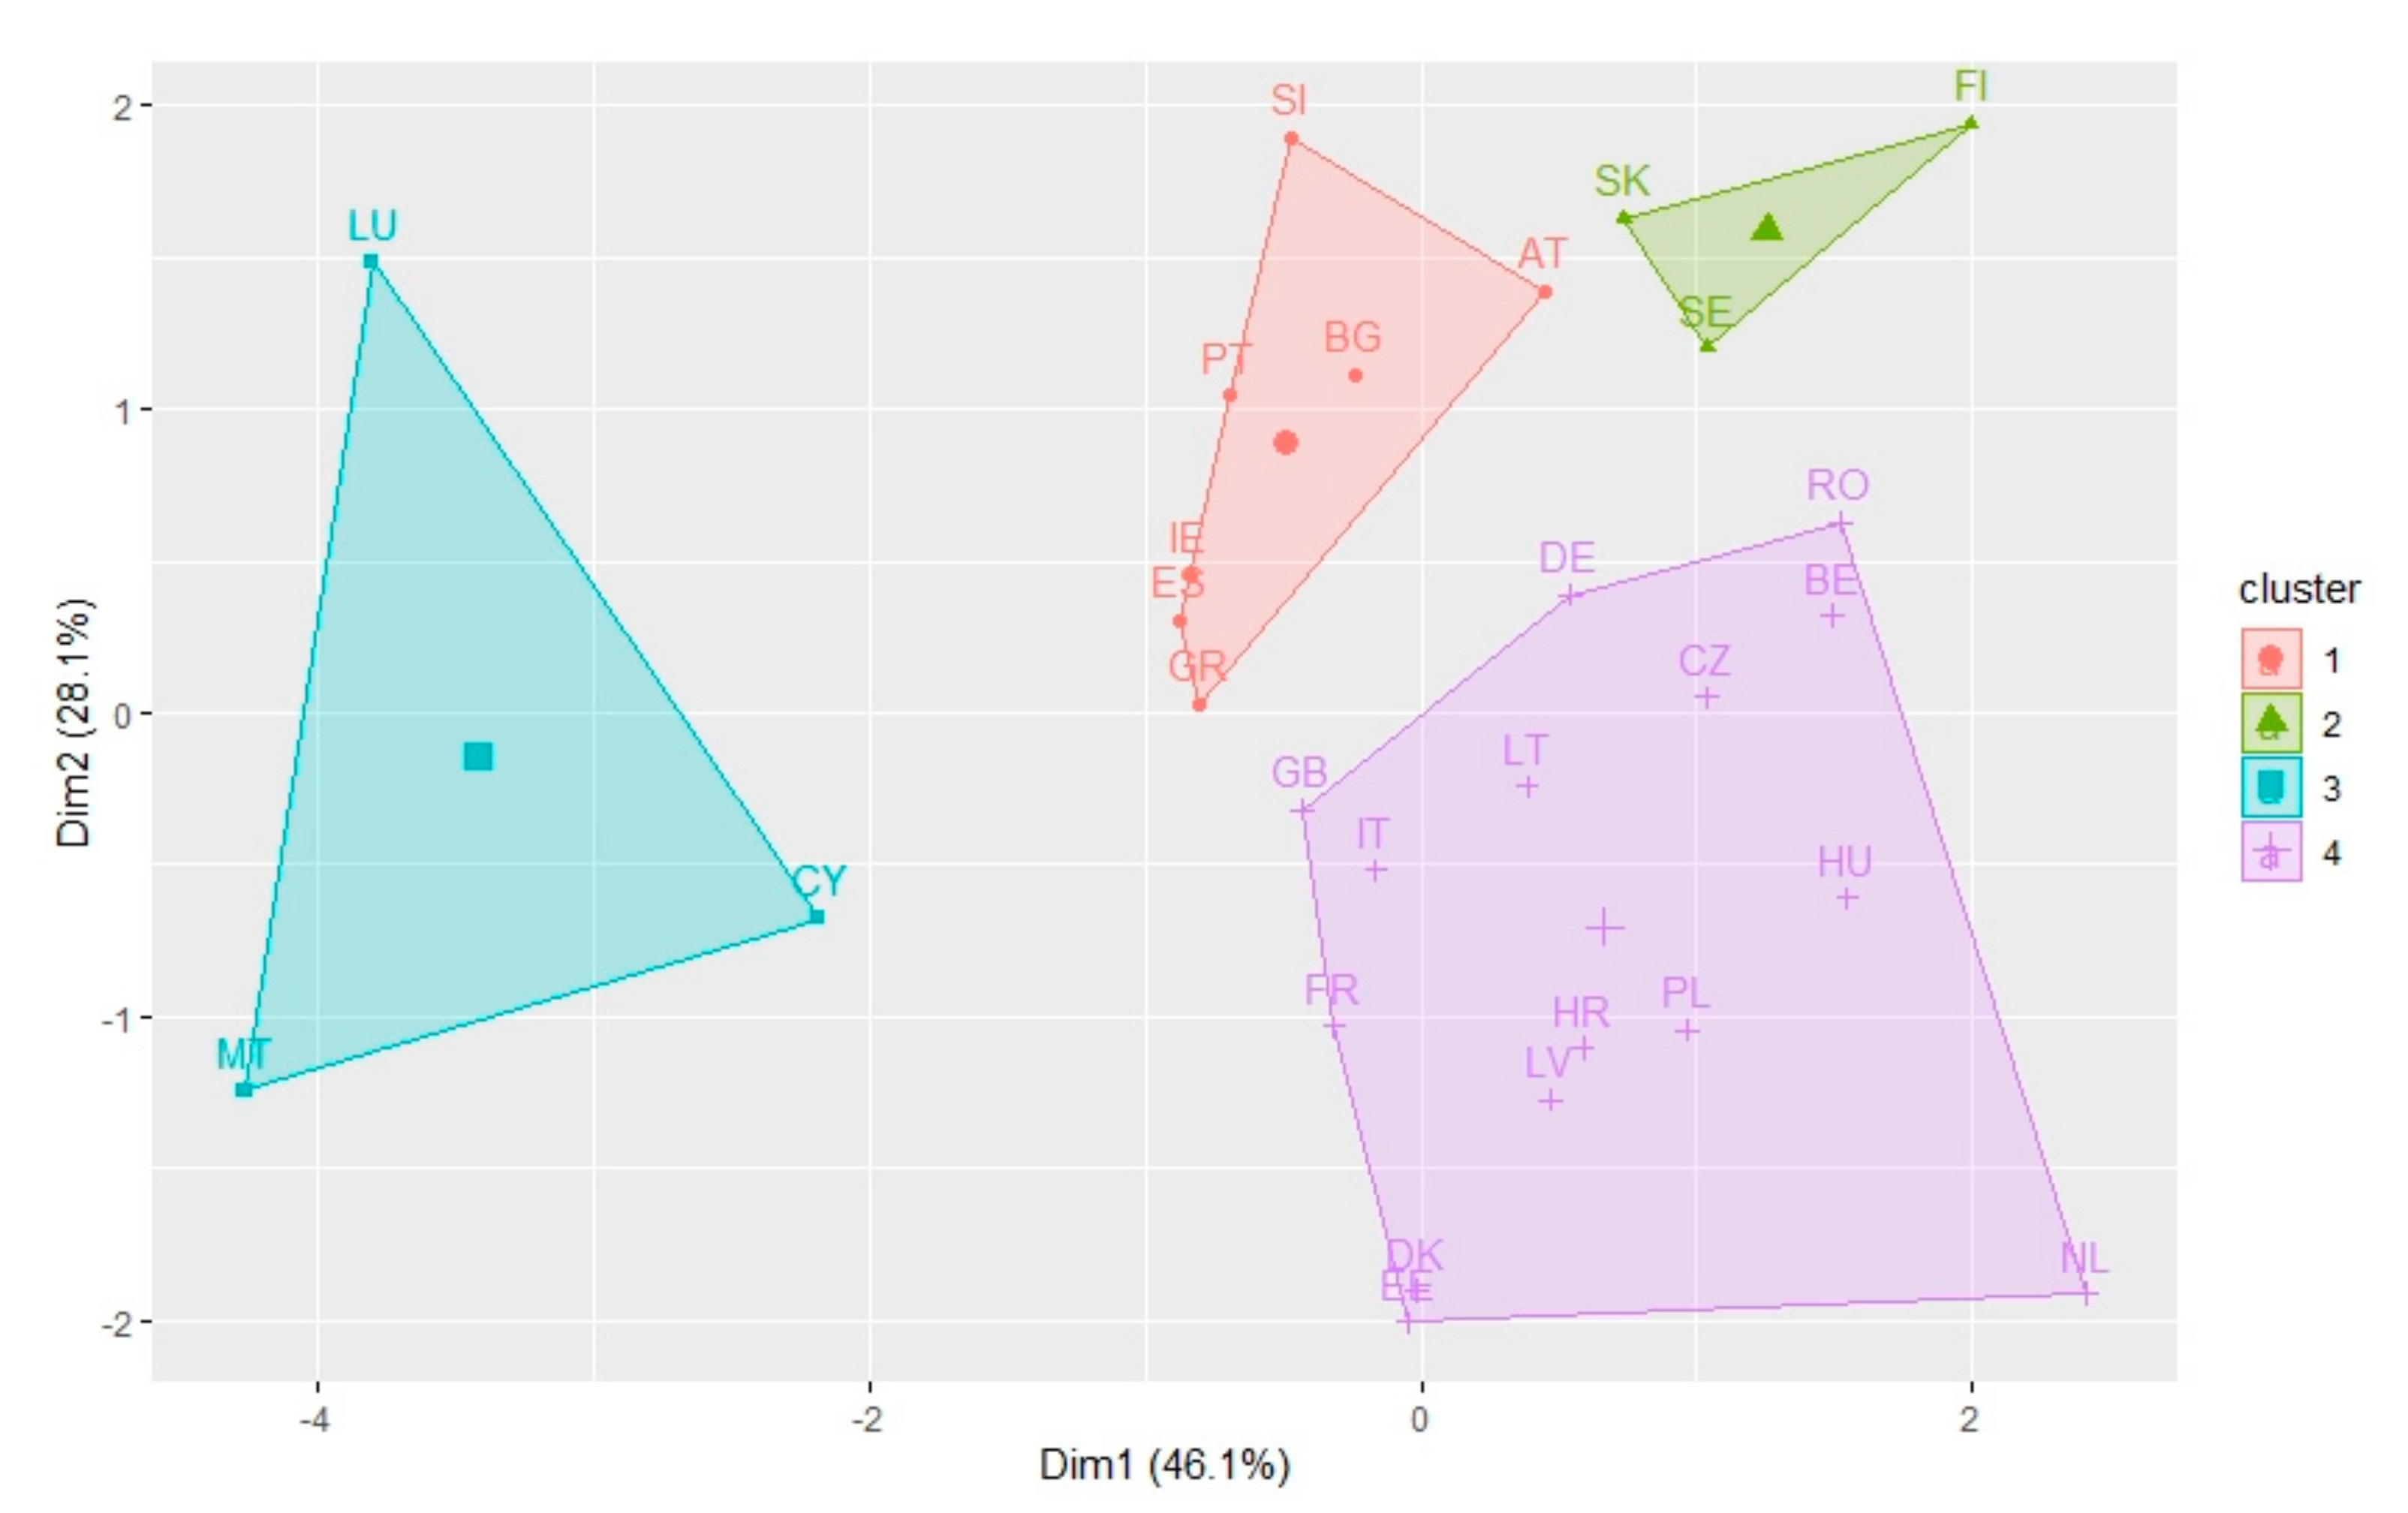
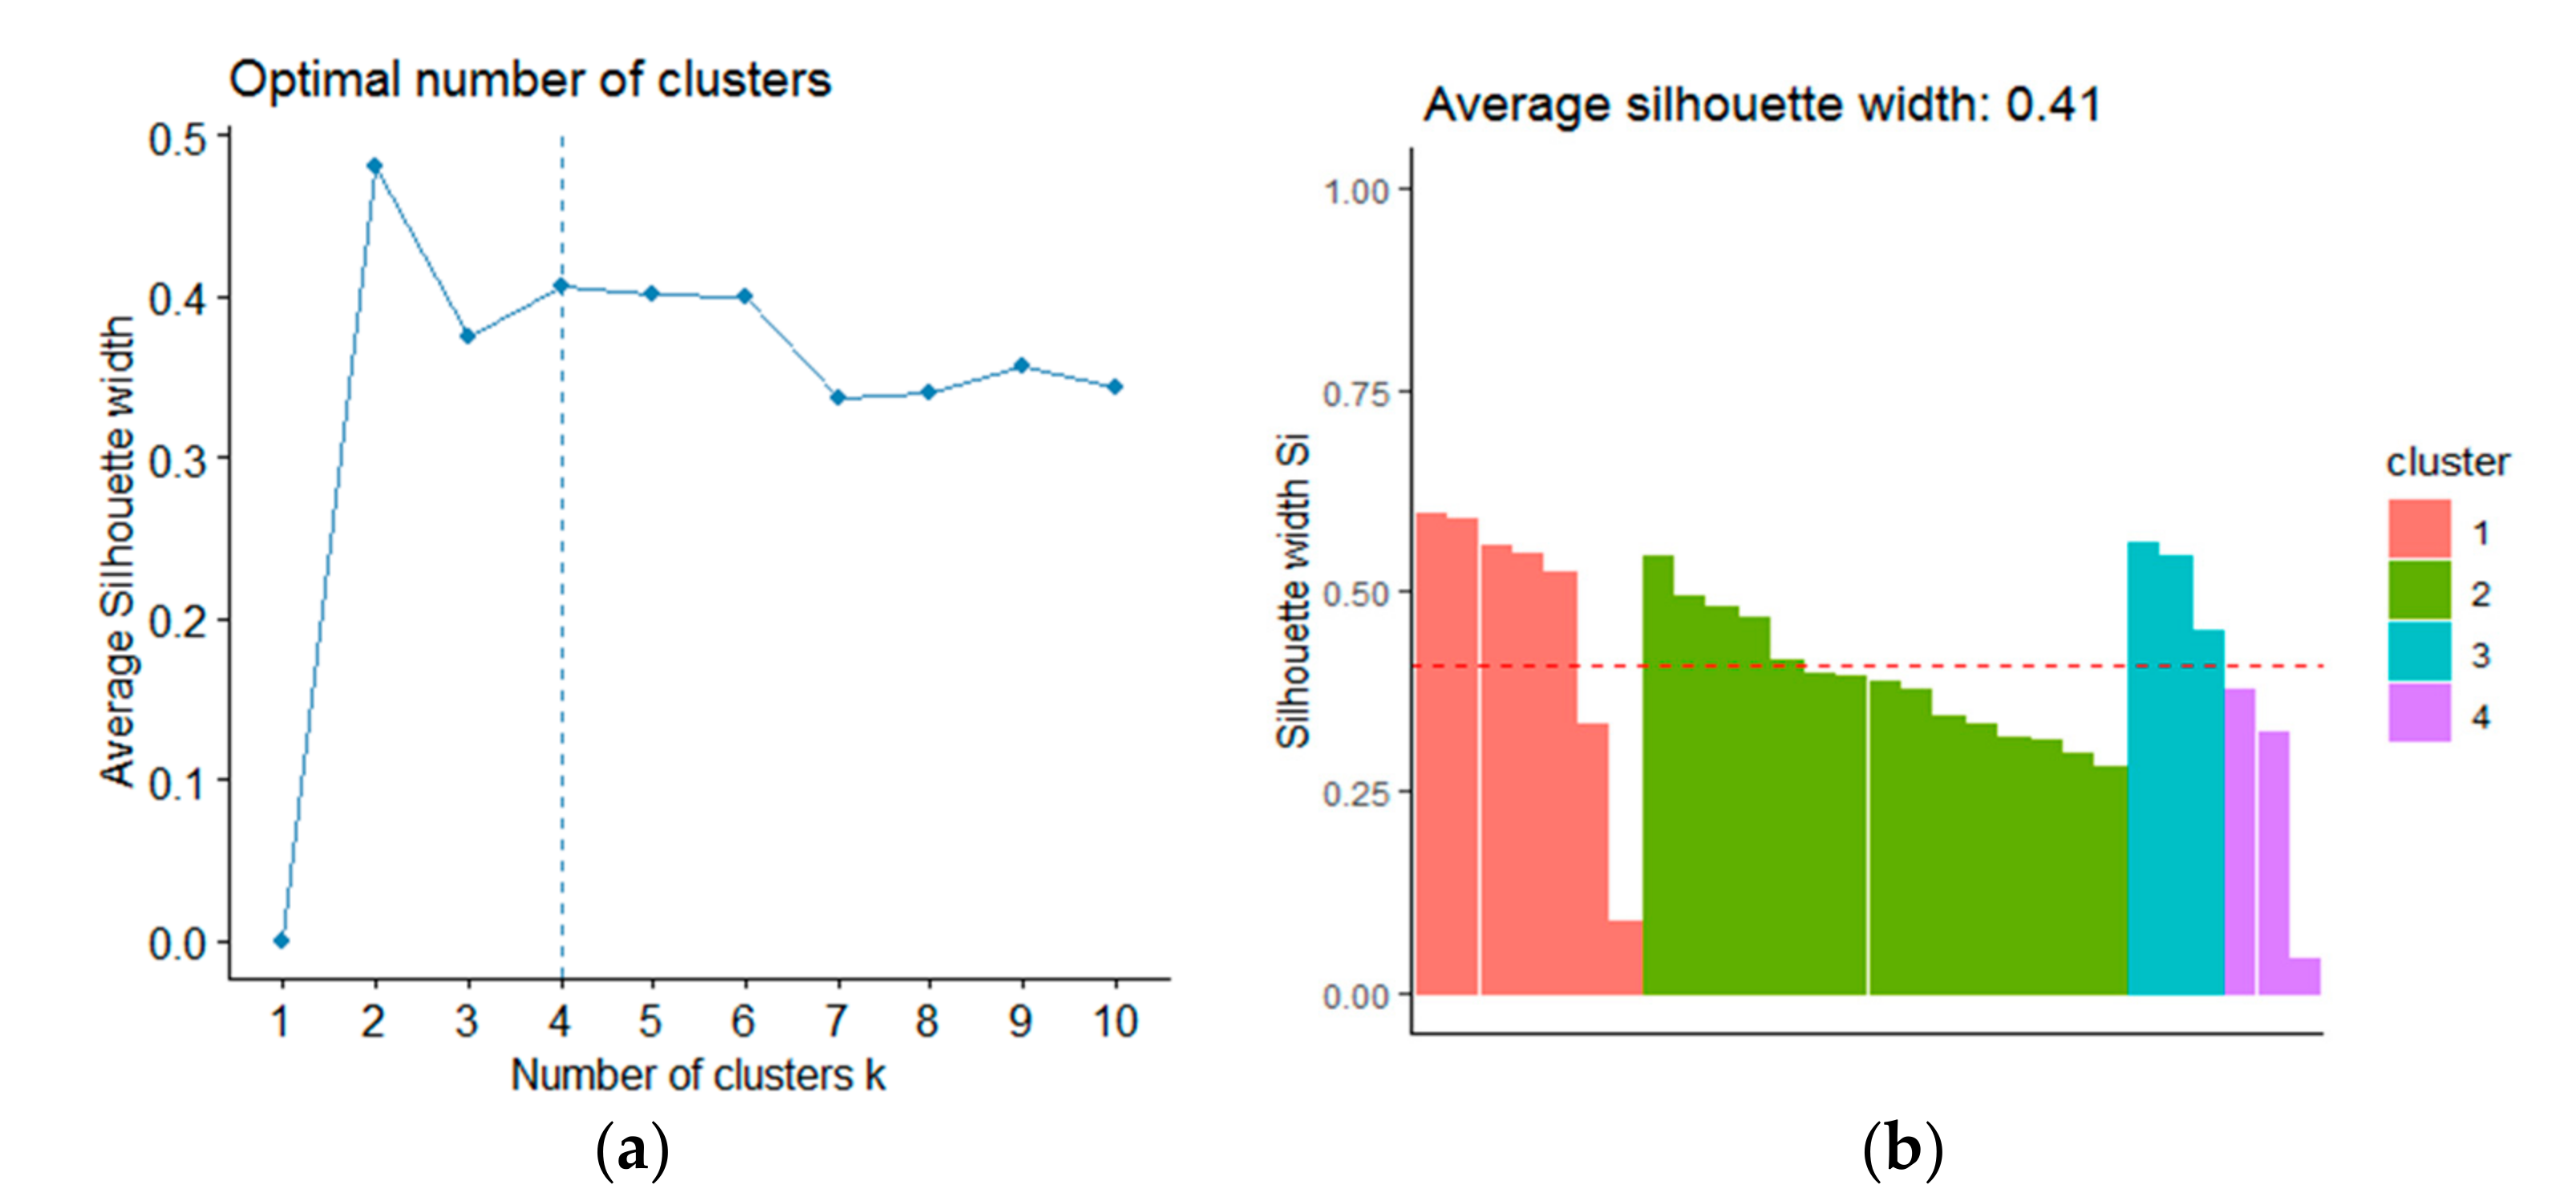
3.3.1. The Results of K-means Clustering
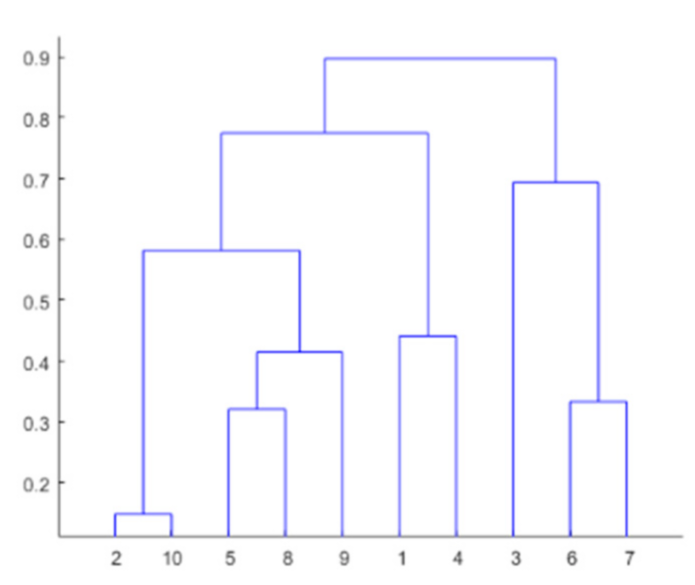
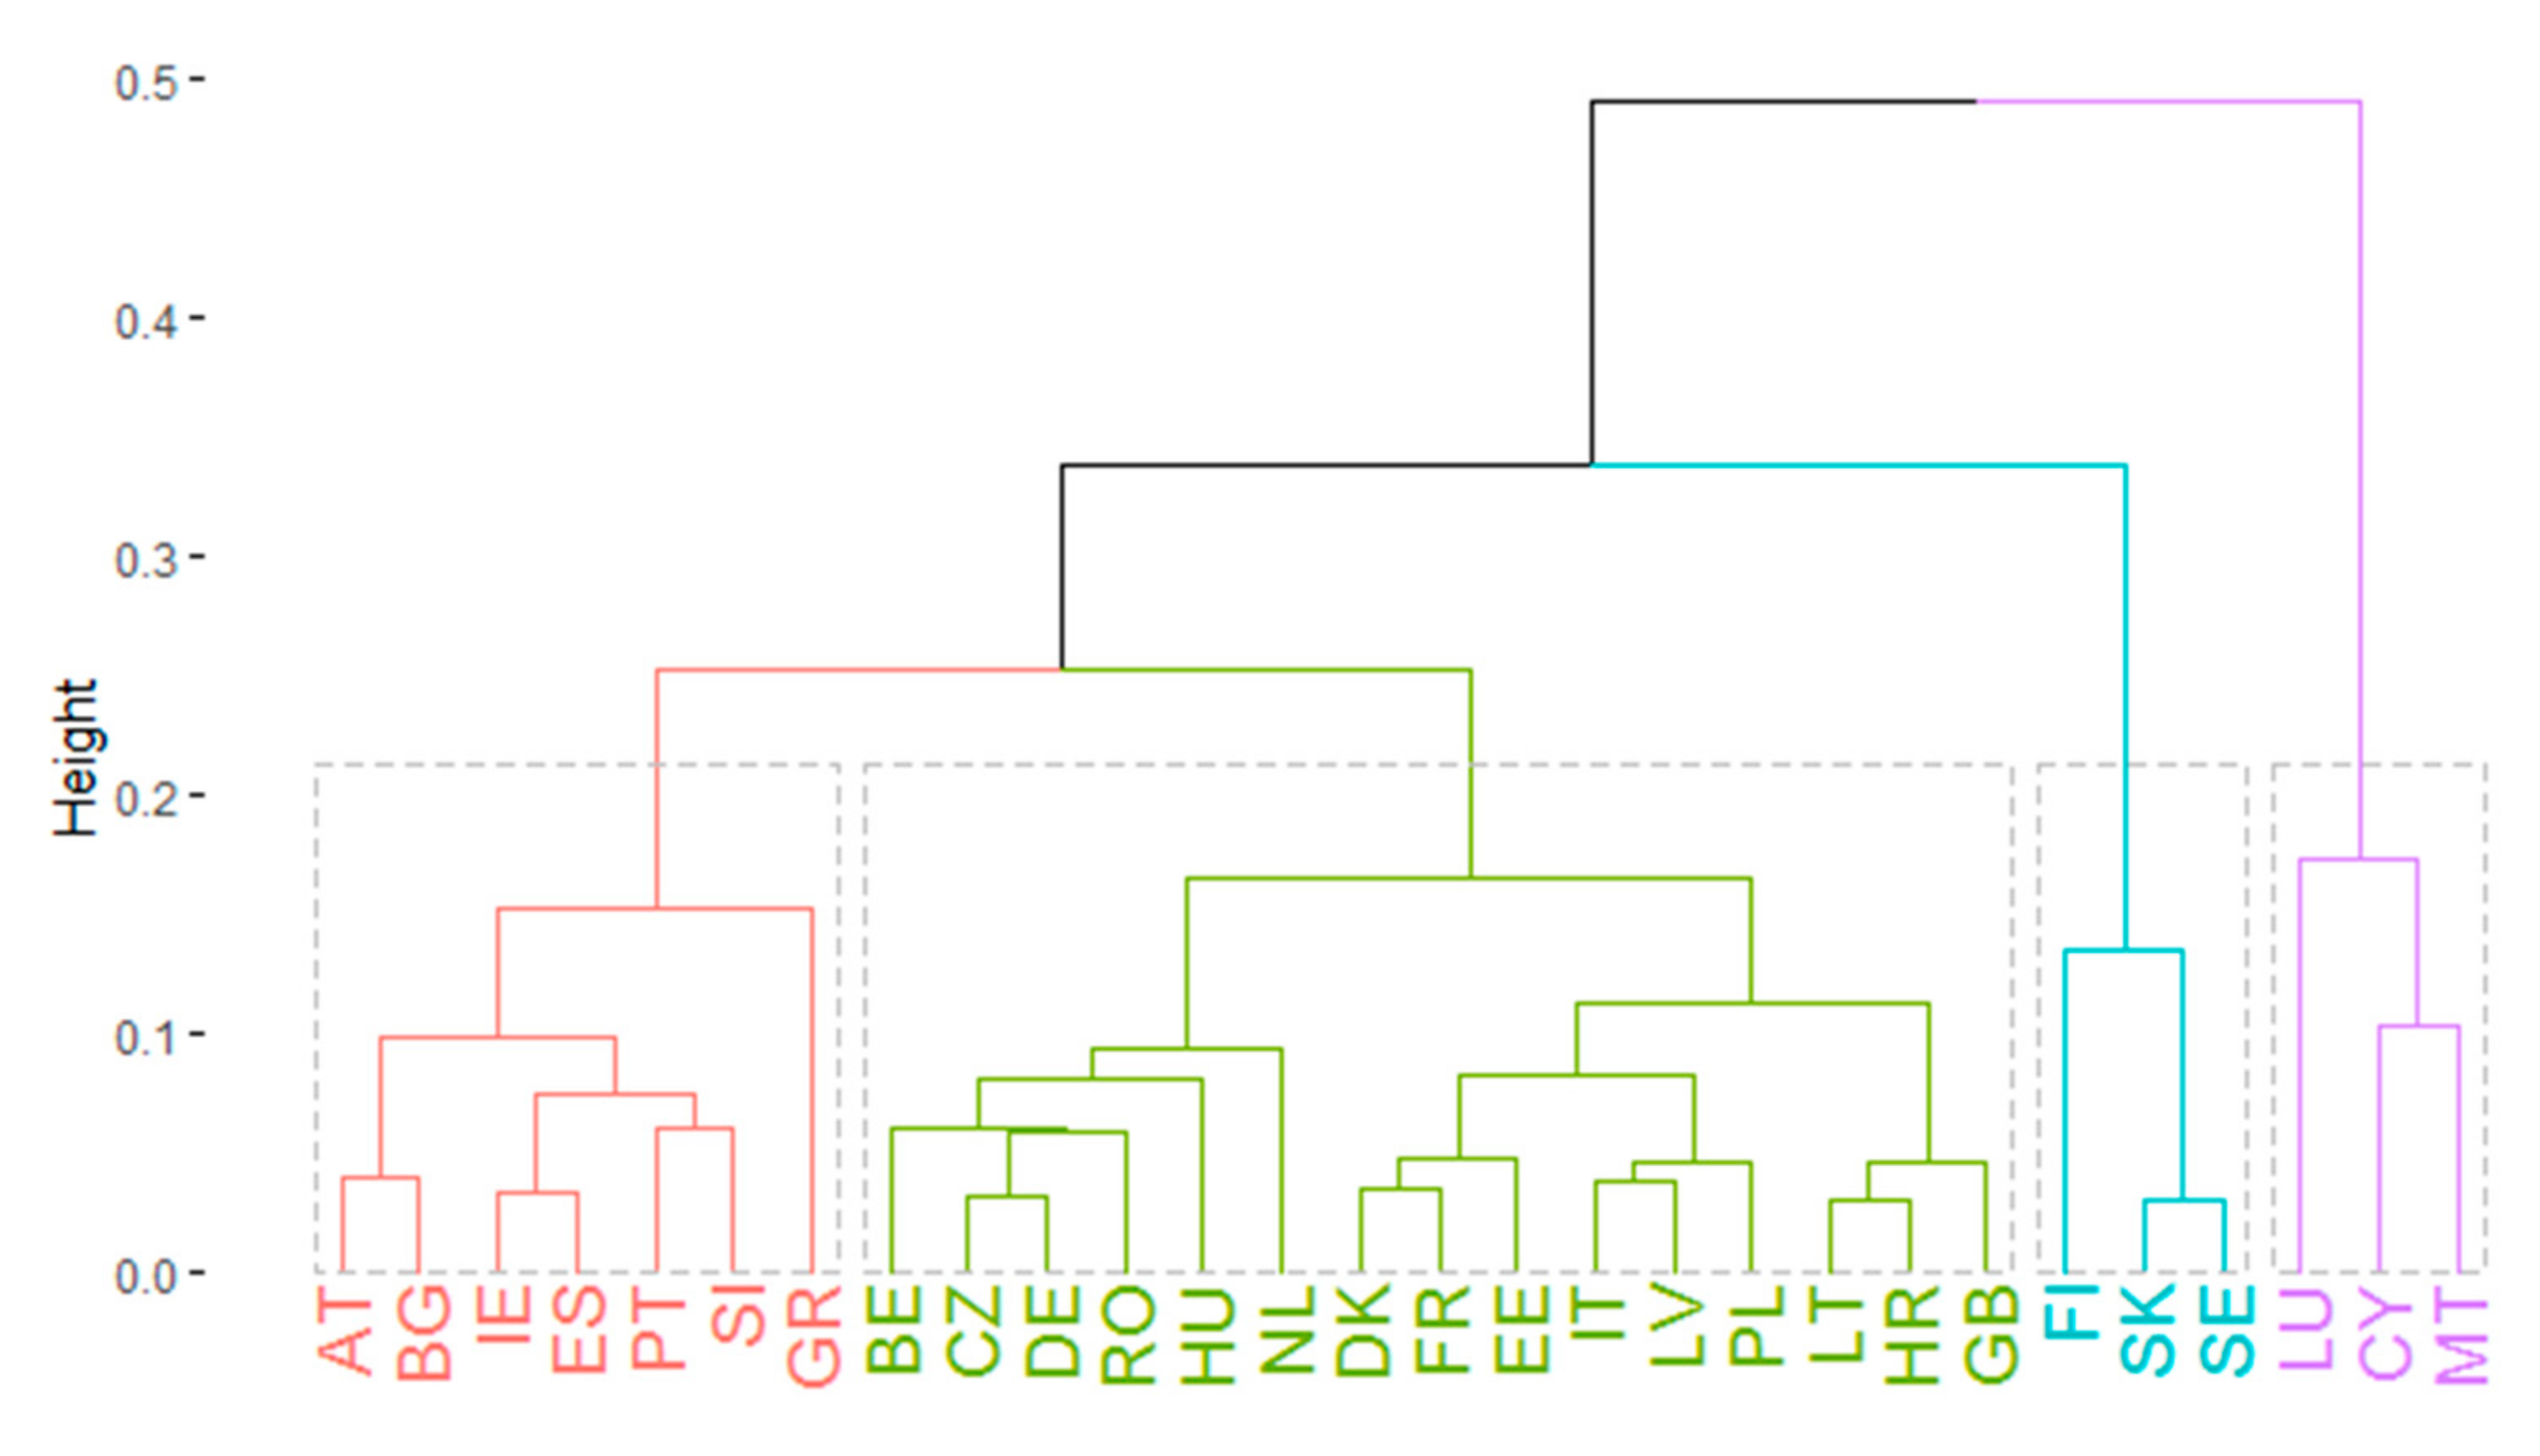
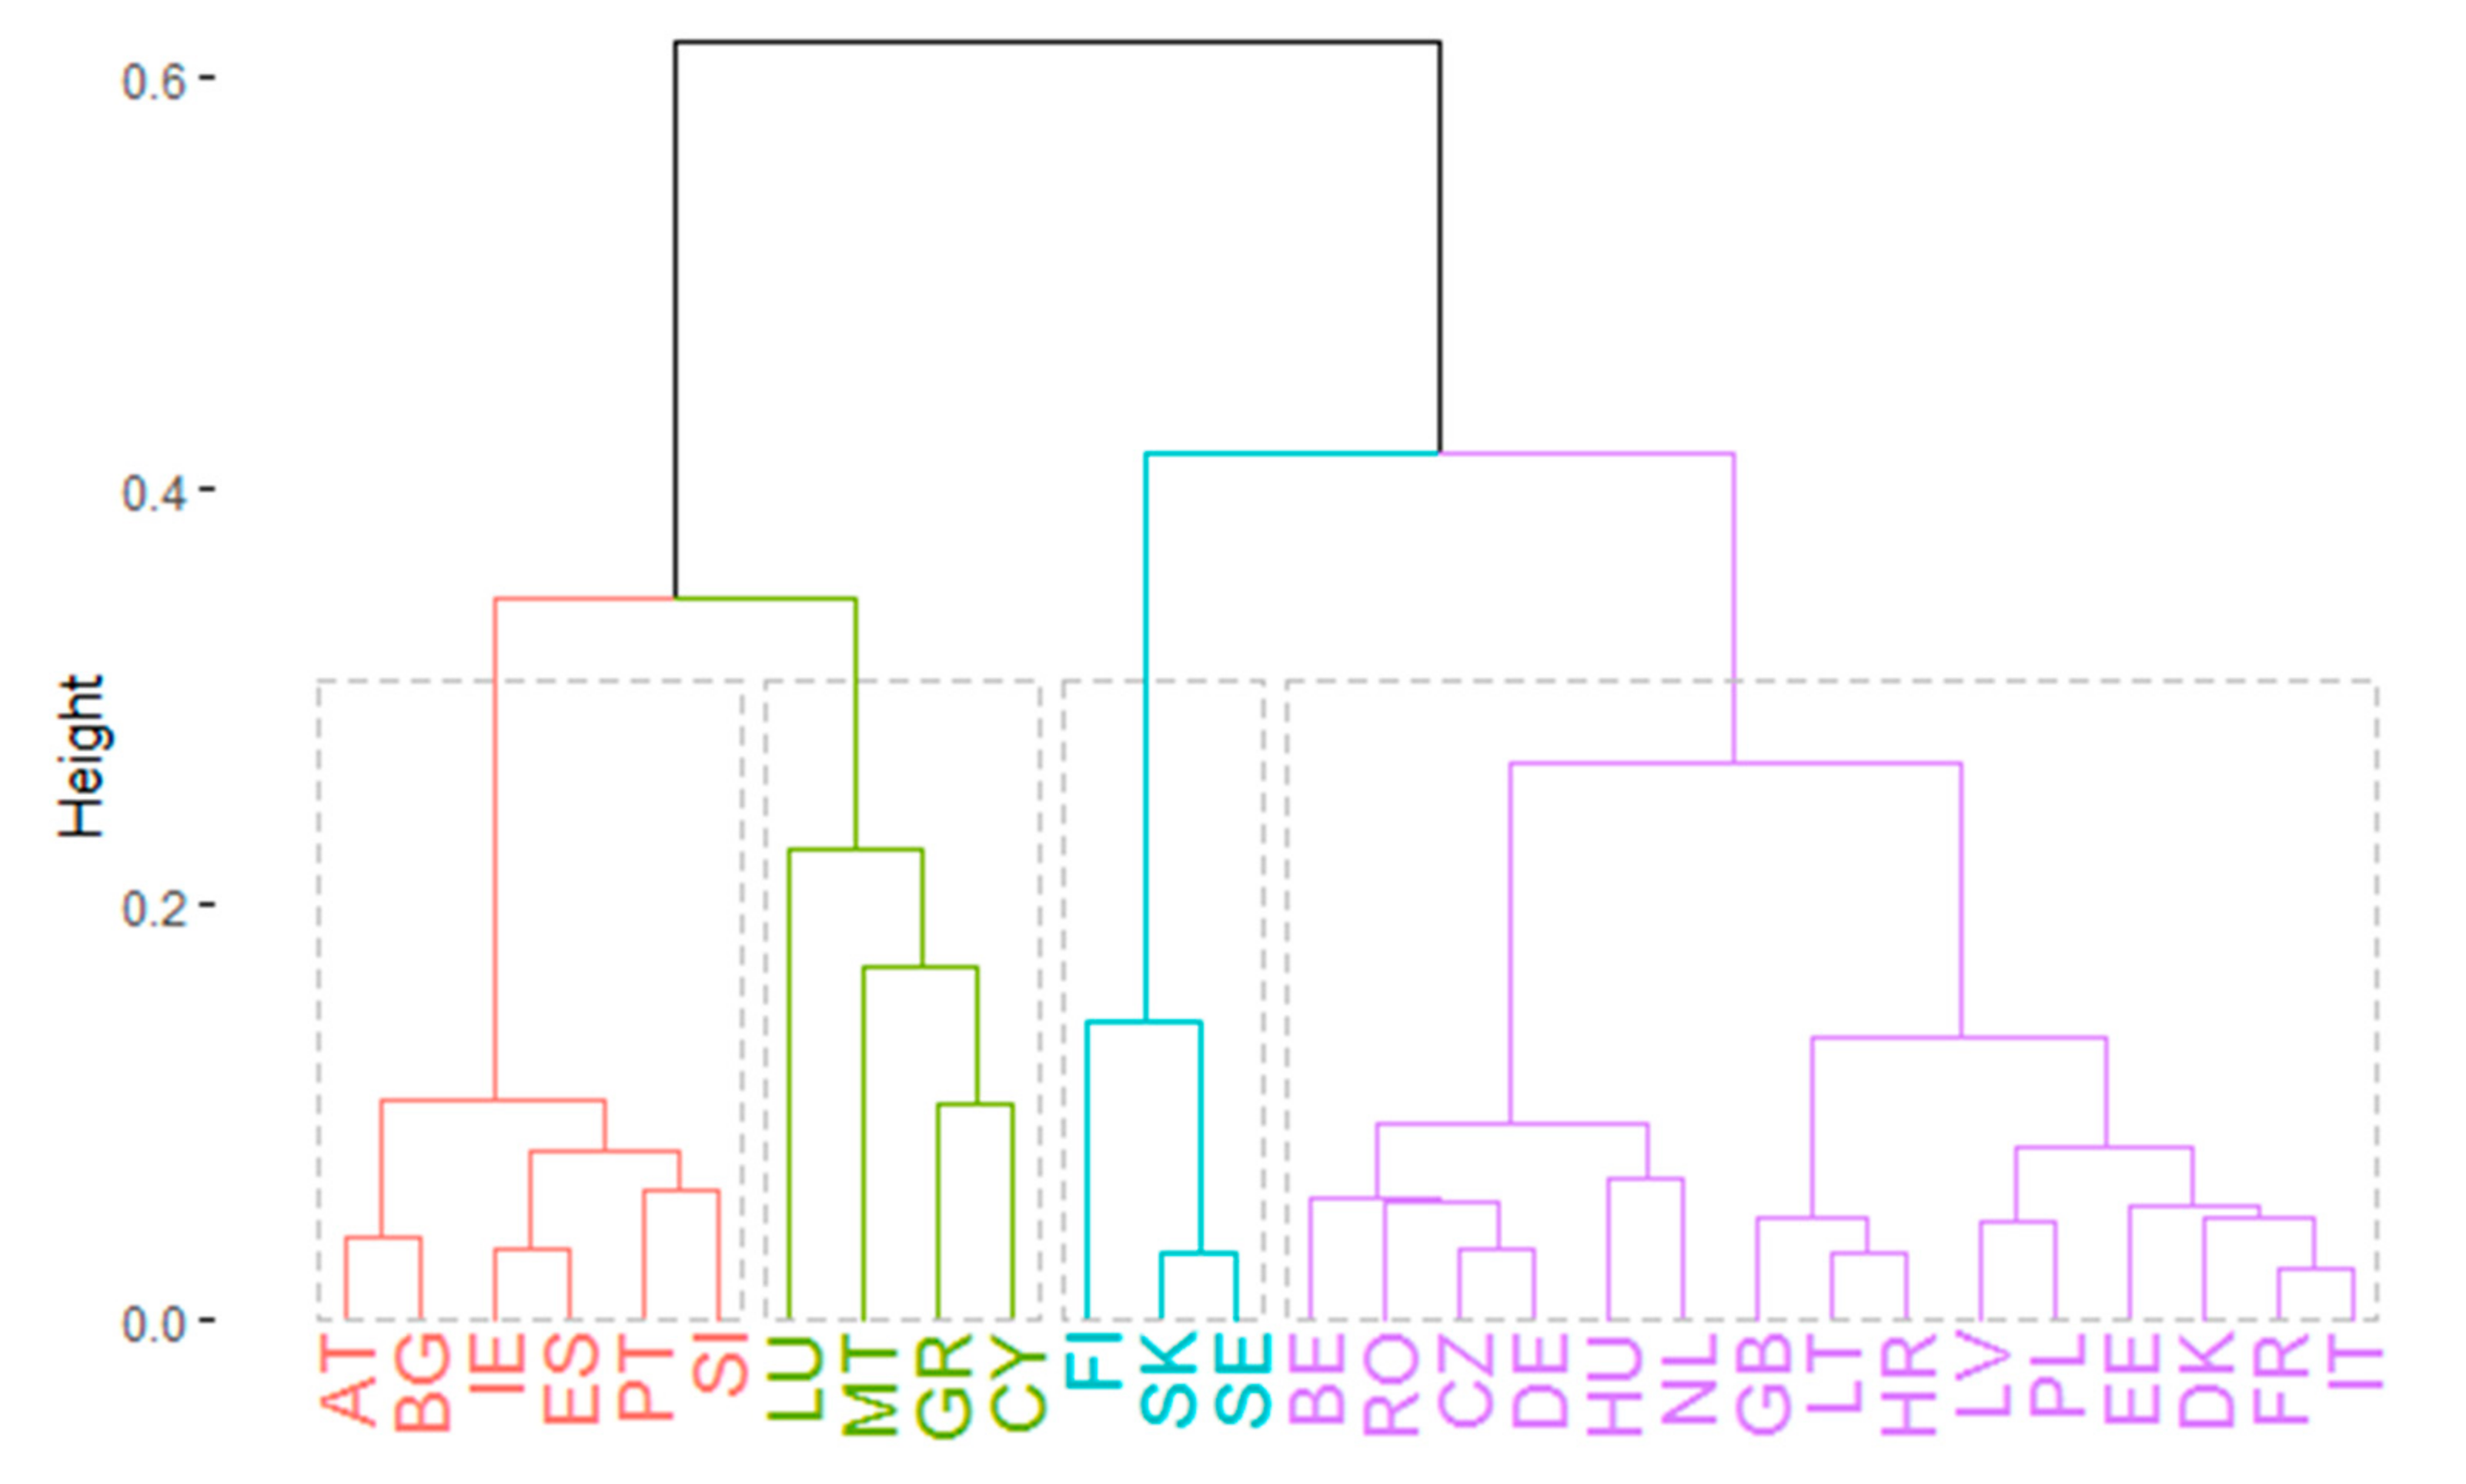
3.3.2. The Results of Hierarchical Agglomerative Clustering
3.3.3. The Results of DIANA
3.3.4. Assessment of Clustering Techniques
3.3.5. Energy Consumption Analysis
4. Discussion
5. Conclusions
Author Contributions
Funding
Institutional Review Board Statement
Informed Consent Statement
Data Availability Statement
Conflicts of Interest
Abbreviations
| Abbreviation | Meaning |
| level of the phenomenon in t period | |
| level of the phenomenon t−1 period | |
| chain dynamic indicators | |
| variable i | |
| cluster j | |
| binary coefficient with a value equal to one or zero depending on cluster assignment | |
| Euclidean distance between the assigned point and cluster center | |
| average dissimilarity of object i and all other objects in the same cluster | |
| the smallest average dissimilarity of object i to all other clusters, of which i is not a member | |
| Silhouette index | |
| number of observation pairs where both observations are comembers in both clusterings | |
| number of observation pairs where the observations are comembers in the first clustering but not the second | |
| number of observation pairs where the observations are comembers in the second clustering but not the first | |
| number of observation pairs where neither pair are comembers in either clustering |
References
- Malinauskaite, J.; Jouhara, H.; Ahmad, L.; Milani, M.; Montorsi, L.; Venturelli, M. Energy efficiency in industry: EU and national policies in Italy and the UK. Energy 2019, 172, 255–269. [Google Scholar] [CrossRef]
- Rokicki, T.; Perkowska, A.; Klepacki, B.; Bórawski, P.; Bełdycka-Bórawska, A.; Michalski, K. Changes in Energy Consumption in Agriculture in the EU Countries. Energies 2021, 14, 1570. [Google Scholar] [CrossRef]
- Rokicki, T.; Ratajczak, M.; Bórawski, P.; Bełdycka-Bórawska, A.; Gradziuk, B.; Gradziuk, P.; Siedlecka, A. Energy Self-Subsistence of Agriculture in EU Countries. Energies 2021, 14, 3014. [Google Scholar] [CrossRef]
- Alcantara, V.; Duro, J.A. Inequality of energy intensities across OECD countries: A note. Energy Policy 2004, 32, 1257–1260. [Google Scholar] [CrossRef]
- Rokicki, T.; Perkowska, A. Diversity and Changes in the Energy Balance in EU Countries. Energies 2021, 14, 1098. [Google Scholar] [CrossRef]
- Rokicki, T.; Perkowska, A. Changes in Energy Supplies in the Countries of the Visegrad Group. Sustainability 2020, 12, 7916. [Google Scholar] [CrossRef]
- Le Pen, Y.; Sévi, B. On the non-convergence of energy intensities: Evidence from a pair-wise econometric approach. Ecol. Econ. 2010, 69, 641–650. [Google Scholar] [CrossRef] [Green Version]
- Markandya, A.; Pedroso-Galinato, S.; Streimikiene, D. Energy intensity in transition economies: Is there convergence towards the EU average? Energy Econ. 2006, 28, 121–145. [Google Scholar] [CrossRef]
- Liddle, B. Revisiting world energy intensity convergence for regional differences. Appl. Energy 2010, 87, 3218–3225. [Google Scholar] [CrossRef]
- Jakob, M.; Haller, M.; Marschinski, R. Will history repeat itself? Economic convergence and convergence in energy use patterns. Energy Econ. 2012, 34, 95–104. [Google Scholar] [CrossRef]
- Mulder, P.; De Groot, H.L. Structural change and convergence of energy intensity across OECD countries, 1970–2005. Energy Econ. 2012, 34, 1910–1921. [Google Scholar] [CrossRef] [Green Version]
- Mishra, V.; Smyth, R. Convergence in energy consumption per capita among ASEAN countries. Energy Policy 2014, 73, 180–185. [Google Scholar] [CrossRef]
- Payne, J.E.; Vizek, M.; Lee, J. Stochastic convergence in per capita fossil fuel consumption in US states. Energy Econ. 2017, 62, 382–395. [Google Scholar] [CrossRef]
- Le, T.H.; Chang, Y.; Park, D. Energy demand convergence in APEC: An empirical analysis. Energy Econ. 2017, 65, 32–41. [Google Scholar] [CrossRef]
- Chen, Y.; Lee, C.C. Does technological innovation reduce CO2 emissions? Cross-country evidence. J. Clean. Prod. 2020, 263, 121550. [Google Scholar] [CrossRef]
- Herrerias, M.J. World energy intensity convergence revisited: A weighted distribution dynamics approach. Energy Policy 2012, 49, 383–399. [Google Scholar] [CrossRef]
- Cheong, T.S.; Li, V.J.; Shi, X. Regional disparity and convergence of electricity consumption in China: A distribution dynamics approach. China Econ. Rev. 2019, 58, 101154. [Google Scholar] [CrossRef]
- Parker, S.; Liddle, B. Economy-wide and manufacturing energy productivity transition paths and club convergence for OECD and non-OECD countries. Energy Econ. 2017, 62, 338–346. [Google Scholar] [CrossRef]
- Rokicki, T.; Perkowska, A.; Klepacki, B.; Szczepaniuk, H.; Szczepaniuk, E.K.; Bereziński, S.; Ziółkowska, P. The Importance of Higher Education in the EU Countries in Achieving the Objectives of the Circular Economy in the Energy Sector. Energies 2020, 13, 4407. [Google Scholar] [CrossRef]
- Lee, C.C.; Chang, C.P. Energy consumption and economic growth in Asian economies: A more comprehensive analysis using panel data. Resour. Energy Econ. 2008, 30, 50–65. [Google Scholar] [CrossRef]
- Wen, H.; Lee, C.C. Impact of environmental labeling certification on firm performance: Empirical evidence from China. J. Clean. Prod. 2020, 255, 120201. [Google Scholar] [CrossRef]
- Zhao, C.P.; Gukasyan, G.; Bezpalov, V.; Prasolov, V. Development of modern standards for energy efficiency of industrial enterprises within the European Union policy. Int. J. Energy Econ. Policy 2020, 10, 451. [Google Scholar] [CrossRef]
- Hassan, Y.A.; Isiaka, M.A. Convergence in electricity consumption among selected West African Countries. Colombo Bus. J. 2019, 10, 1–18. [Google Scholar] [CrossRef]
- Steckel, J.C.; Brecha, R.J.; Jakob, M.; Strefler, J.; Luderer, G. Development without energy? Assessing future scenarios of energy consumption in developing countries. Ecol. Econ. 2013, 90, 53–67. [Google Scholar] [CrossRef]
- Arto, I.; Capellán-Pérez, I.; Lago, R.; Bueno, G.; Bermejo, R. The energy requirements of a developed world. Energy Sustain. Dev. 2016, 33, 1–13. [Google Scholar] [CrossRef] [Green Version]
- Hao, Y.; Liao, H.; Wei, Y.M. Is China’s carbon reduction target allocation reasonable? An analysis based on carbon intensity convergence. Appl. Energy 2015, 142, 229–239. [Google Scholar] [CrossRef]
- Kim, Y.S. Electricity consumption and economic development: Are countries converging to a common trend? Energy Econ. 2015, 49, 192–202. [Google Scholar] [CrossRef]
- Cheshmehzangi, A. Low carbon transition at the township level: Feasibility study of environmental pollutants and sustainable energy planning. Int. J. Sustain. Energy 2021, 40, 670–696. [Google Scholar] [CrossRef]
- Mahmood, T.; Ahmad, E. The relationship of energy intensity with economic growth: Evidence for European economies. Energy Strategy Rev. 2018, 20, 90–98. [Google Scholar] [CrossRef]
- Acaravci, A.; Ozturk, I. On the relationship between energy consumption, CO2 emissions and economic growth in Europe. Energy 2010, 35, 5412–5420. [Google Scholar] [CrossRef]
- Judson, R.A.; Schmalensee, R.; Stoker, T.M. Economic development and the structure of the demand for commercial energy. Energy J. 1999, 20, 29–57. [Google Scholar] [CrossRef] [Green Version]
- Medlock III, K.B.; Soligo, R. Economic development and end-use energy demand. Energy J. 2001, 22, 77–105. [Google Scholar] [CrossRef]
- Ma, C.; Stern, D.I. China’s changing energy intensity trend: A decomposition analysis. Energy Econ. 2008, 30, 1037–1053. [Google Scholar] [CrossRef] [Green Version]
- Voigt, S.; De Cian, E.; Schymura, M.; Verdolini, E. Energy intensity developments in 40 major economies: Structural change or technology improvement? Energy Econ. 2014, 41, 47–62. [Google Scholar] [CrossRef] [Green Version]
- Gostkowski, M.; Gajowniczek, K. Weighted Quantile Regression Forests for Bimodal Distribution Modeling: A Loss Given Default Case. Entropy 2020, 22, 545. [Google Scholar] [CrossRef]
- Nafkha, R.; Gajowniczek, K.; Ząbkowski, T. Do Customers Choose Proper Tariff? Empirical Analysis Based on Polish Data Using Unsupervised Techniques. Energies 2018, 11, 514. [Google Scholar] [CrossRef] [Green Version]
- Konstantinos, K.T.; Chorianopoulos, A. Data Mining Techniques in CRM: Inside Customer Segmentation; Wiley: Hoboken, NJ, USA, 2010; ISBN 978-0-470-74397-3. [Google Scholar]
- Ward, J.H., Jr. Hierarchical grouping to optimize an objective function. J. Am. Statist. Assoc. 1963, 58, 236–244. [Google Scholar] [CrossRef]
- Kaufman, L.; Rousseeuw, P.J. Finding Groups in Data: An Introduction to Cluster Analysis; John Wiley & Sons: Hoboken, NJ, USA, 2009; Volume 344. [Google Scholar]
- Rousseeuw, P.J. Silhouettes: A graphical aid to the interpretation and validation of cluster analysis. J. Comput. Appl. Math. 1987, 20, 53–65. [Google Scholar] [CrossRef] [Green Version]
- Metcalf, G.E. An empirical analysis of energy intensity and its determinants at the state level. Energy J. 2008, 29, 1–26. [Google Scholar] [CrossRef]
- Löschel, A.; Pothen, F.; Schymura, M. Peeling the onion: Analyzing aggregate, national and sectoral energy intensity in the European Union. Energy Econ. 2015, 52, S63–S75. [Google Scholar] [CrossRef] [Green Version]
- Pothen, F.; Schymura, M. Bigger cakes with fewer ingredients? A comparison of material use of the world economy. Ecol. Econ. 2015, 109, 109–121. [Google Scholar] [CrossRef]
- Gutiérrez-Pedrero, M.J.; Tarancón, M.Á.; del Río, P.; Alcántara, V. Analysing the drivers of the intensity of electricity consumption of non-residential sectors in Europe. Appl. Energy 2018, 211, 743–754. [Google Scholar] [CrossRef]
- Chen, Z.; Huang, W.; Zheng, X. The decline in energy intensity: Does financial development matter? Energy Policy 2019, 134, 110945. [Google Scholar] [CrossRef]
- Parker, S.; Liddle, B. Analysing energy productivity dynamics in the OECD manufacturing sector. Energy Econ. 2017, 67, 91–97. [Google Scholar] [CrossRef]
- Gallo, L. Electricity Intensity in the Developed Countries: Global Divergence, Club Convergence and the Role of the Structure of the Economy. 2019. Available online: https://fsr.eui.eu/wp-content/uploads/2020/03/Gallo-FSR-CLIMATE-2019-Electricityintensity-convergence.pdf (accessed on 14 July 2021).
- van Benthem, A.A. Energy leapfrogging. J. Assoc. Environ. Resour. Econ. 2015, 2, 93–132. [Google Scholar] [CrossRef]
- Mulder, P. International specialization, structural change and the evolution of manufacturing energy intensity in OECD countries. Energy J. 2015, 36. [Google Scholar] [CrossRef]
- Pappas, D.; Chalvatzis, K.J.; Guan, D.; Ioannidis, A. Energy and carbon intensity: A study on the cross-country industrial shift from China to India and SE Asia. Appl. Energy 2018, 225, 183–194. [Google Scholar] [CrossRef] [Green Version]
- Duan, R.; Shen, T.; Li, C.; Fatima, N.; Anser, M.K. Estimating the determinants and spatial effects of electricity intensity in China. Energy Strategy Rev. 2021, 35, 100651. [Google Scholar] [CrossRef]
- Han, X.; Lakshmanan, T.K. Structural changes and energy consumption in the Japanese economy 1975-95: An input-output analysis. Energy J. 1994, 15, 165–187. [Google Scholar] [CrossRef]
- Kahrl, F.; Roland-Holst, D. Growth and structural change in China’s energy economy. Energy 2009, 34, 894–903. [Google Scholar] [CrossRef]
- Zhang, H.; Lahr, M.L. China’s energy consumption change from 1987 to 2007: A multi-regional structural decomposition analysis. Energy Policy 2014, 67, 682–693. [Google Scholar] [CrossRef]
- González, P.F.; Landajo, M.; Presno, M.J. The Divisia real energy intensity indices: Evolution and attribution of percent changes in 20 European countries from 1995 to 2010. Energy 2013, 58, 340–349. [Google Scholar] [CrossRef]
- González, P.F. Exploring energy efficiency in several European countries. An attribution analysis of the Divisia structural change index. Appl. Energy 2015, 137, 364–374. [Google Scholar] [CrossRef]


| Variable | Description | Unit of Measure |
|---|---|---|
| X1 | Energy consumption in agriculture, % total energy consumption | Percentage |
| X2 | Energy consumption in services, % total energy consumption | Percentage |
| X3 | Energy consumption in industry, % total energy consumption | Percentage |
| X4 | Energy consumption in transport, % total energy consumption | Percentage |
| X5 | Energy consumption in other sectors, % total energy consumption | Percentage |
| X6 | Total primary energy supply | Tonnes of oil equivalent (toe), Millions |
| X7 | Energy productivity, GDP per unit of TPES | US Dollar, 2015 |
| X8 | Energy intensity | TPES per capita |
| Year | Chain Dynamic Indicators for Energy Productivity in Countries in Years (Previous Year = 100) | ||||
|---|---|---|---|---|---|
| Czech Republic | Hungary | Poland | Slovakia | EU | |
| 2011 | 106 | 104 | 104 | 106 | 106 |
| 2012 | 100 | 104 | 105 | 106 | 100 |
| 2013 | 100 | 105 | 101 | 99 | 101 |
| 2014 | 105 | 105 | 107 | 109 | 106 |
| 2015 | 105 | 98 | 103 | 102 | 101 |
| 2016 | 104 | 101 | 99 | 101 | 102 |
| 2017 | 101 | 100 | 100 | 098 | 101 |
| 2018 | 103 | 105 | 103 | 104 | 103 |
| 2018–2010 | 126 | 124 | 124 | 127 | 122 |
| Country | Energy Consumption in Sector | Average | Median | Minimal | Maximal | Range | Standard Deviation | Coefficient of Variation | Skewedness | Kurtosis |
|---|---|---|---|---|---|---|---|---|---|---|
| Czech Republic | agriculture | 2.64 | 2.37 | 1.98 | 4.66 | 2.67 | 0.88 | 0.33 | 2.00 | 2.80 |
| services | 11.30 | 11.66 | 8.81 | 12.17 | 3.36 | 1.06 | 0.09 | −1.89 | 2.61 | |
| other sectors | 36.07 | 36.70 | 30.04 | 38.64 | 8.60 | 2.27 | 0.06 | −1.57 | 3.49 | |
| transport | 20.43 | 22.24 | 7.86 | 25.21 | 17.36 | 5.64 | 0.28 | −1.61 | 1.46 | |
| industry | 29.57 | 25.66 | 24.73 | 48.26 | 23.53 | 7.59 | 0.26 | 1.75 | 2.20 | |
| Hungary | agriculture | 3.26 | 3.09 | 2.26 | 5.47 | 3.20 | 0.81 | 0.25 | 1.73 | 4.12 |
| services | 13.42 | 13.08 | 9.75 | 17.56 | 7.81 | 2.72 | 0.20 | 0.27 | −1.53 | |
| other sectors | 43.21 | 42.55 | 40.42 | 46.07 | 5.65 | 1.91 | 0.04 | 0.26 | −1.48 | |
| transport | 20.12 | 20.95 | 14.17 | 23.81 | 9.64 | 3.05 | 0.15 | −1.10 | 0.32 | |
| industry | 20.00 | 20.71 | 13.86 | 29.40 | 15.54 | 3.82 | 0.19 | 0.82 | 2.53 | |
| Poland | agriculture | 5.76 | 5.31 | 4.98 | 7.99 | 3.01 | 1.02 | 0.18 | 1.50 | 0.72 |
| services | 10.78 | 11.77 | 6.41 | 12.61 | 6.20 | 1.93 | 0.18 | −1.30 | 0.77 | |
| other sectors | 37.24 | 37.36 | 33.25 | 40.86 | 7.61 | 1.91 | 0.05 | −0.42 | 1.19 | |
| transport | 22.29 | 24.20 | 11.61 | 29.49 | 17.88 | 5.68 | 0.25 | −0.92 | −0.11 | |
| industry | 23.93 | 21.25 | 19.28 | 37.45 | 18.17 | 5.70 | 0.24 | 1.65 | 1.63 | |
| Slovakia | agriculture | 1.74 | 1.42 | 1.17 | 4.48 | 3.31 | 0.92 | 0.53 | 2.66 | 7.29 |
| services | 16.00 | 14.61 | 11.71 | 24.21 | 12.50 | 4.09 | 0.26 | 1.09 | 0.08 | |
| other sectors | 29.66 | 29.62 | 24.48 | 34.58 | 10.10 | 2.46 | 0.08 | −0.18 | 1.70 | |
| transport | 20.25 | 22.58 | 9.18 | 25.29 | 16.11 | 5.26 | 0.26 | −1.31 | 0.30 | |
| industry | 32.35 | 32.11 | 28.20 | 38.64 | 10.43 | 2.56 | 0.08 | 0.92 | 2.32 | |
| EU | agriculture | 2.49 | 2.41 | 2.30 | 3.04 | 0.74 | 0.22 | 0.09 | 1.74 | 2.29 |
| services | 12.08 | 12.70 | 9.74 | 13.00 | 3.26 | 1.20 | 0.10 | −1.20 | −0.26 | |
| other sectors | 34.43 | 34.16 | 33.06 | 35.76 | 2.70 | 0.91 | 0.03 | 0.10 | −1.62 | |
| transport | 26.71 | 26.77 | 22.85 | 28.52 | 5.67 | 1.69 | 0.06 | −1.14 | 0.93 | |
| industry | 24.29 | 23.08 | 22.59 | 30.45 | 7.85 | 2.32 | 0.10 | 1.89 | 3.38 |
| Jaccard | |||
|---|---|---|---|
| K-Means | Hierarchical | DIANA | |
| K-Means | 1 | - | - |
| Hierarchical | 0.9333 | 1 | - |
| DIANA | 1 | 0.9333 | 1 |
| Rand | |||
| K-Means | Hierarchical | DIANA | |
| K-Means | 1 | - | - |
| Hierarchical | 0.9333 | 1 | - |
| DIANA | 1 | 0.9761 | 1 |
| Cluster | Agriculture | Services | Industry | Transport | Other |
|---|---|---|---|---|---|
| 1 | 2.16684 | 11.04803 | 24.83229 | 35.80938 | 26.14877 |
| 2 | 1.97379 | 11.99157 | 36.75460 | 20.91669 | 28.36490 |
| 3 | 1.60046 | 17.14773 | 14.03312 | 47.90229 | 19.37232 |
| 4 | 3.22294 | 12.34975 | 21.05390 | 27.27912 | 36.09582 |
| Cluster | Average Tempo of Change for GDP per Capita |
|---|---|
| 1 | 1.0165 |
| 2 | 1.0154 |
| 3 | 1.0199 |
| 4 | 1.0234 |
Publisher’s Note: MDPI stays neutral with regard to jurisdictional claims in published maps and institutional affiliations. |
© 2021 by the authors. Licensee MDPI, Basel, Switzerland. This article is an open access article distributed under the terms and conditions of the Creative Commons Attribution (CC BY) license (https://creativecommons.org/licenses/by/4.0/).
Share and Cite
Gostkowski, M.; Rokicki, T.; Ochnio, L.; Koszela, G.; Wojtczuk, K.; Ratajczak, M.; Szczepaniuk, H.; Bórawski, P.; Bełdycka-Bórawska, A. Clustering Analysis of Energy Consumption in the Countries of the Visegrad Group. Energies 2021, 14, 5612. https://doi.org/10.3390/en14185612
Gostkowski M, Rokicki T, Ochnio L, Koszela G, Wojtczuk K, Ratajczak M, Szczepaniuk H, Bórawski P, Bełdycka-Bórawska A. Clustering Analysis of Energy Consumption in the Countries of the Visegrad Group. Energies. 2021; 14(18):5612. https://doi.org/10.3390/en14185612
Chicago/Turabian StyleGostkowski, Michał, Tomasz Rokicki, Luiza Ochnio, Grzegorz Koszela, Kamil Wojtczuk, Marcin Ratajczak, Hubert Szczepaniuk, Piotr Bórawski, and Aneta Bełdycka-Bórawska. 2021. "Clustering Analysis of Energy Consumption in the Countries of the Visegrad Group" Energies 14, no. 18: 5612. https://doi.org/10.3390/en14185612
APA StyleGostkowski, M., Rokicki, T., Ochnio, L., Koszela, G., Wojtczuk, K., Ratajczak, M., Szczepaniuk, H., Bórawski, P., & Bełdycka-Bórawska, A. (2021). Clustering Analysis of Energy Consumption in the Countries of the Visegrad Group. Energies, 14(18), 5612. https://doi.org/10.3390/en14185612