Article

An In-Depth Life Cycle Assessment (LCA) of Lithium-Ion Battery for Climate Impact Mitigation Strategies

by
Jhuma Sadhukhan
1,* and
Mark Christensen
2
1
Centre for Environment and Sustainability, Arthur C Clarke Building, University of Surrey, Guildford GU2 7XH, UK
2
Reliagen Holdings Ltd., Home Farm, North Wootton BA4 4HB, UK
*
Author to whom correspondence should be addressed.
Energies 2021, 14(17), 5555; https://doi.org/10.3390/en14175555
Submission received: 12 August 2021 / Revised: 31 August 2021 / Accepted: 2 September 2021 / Published: 6 September 2021
(This article belongs to the Special Issue Energy Storage for Grid Integration of Renewable Energy)

Abstract

:
Battery energy storage systems (BESS) are an essential component of renewable electricity infrastructure to resolve the intermittency in the availability of renewable resources. To keep the global temperature rise below 1.5 °C, renewable electricity and electrification of the majority of the sectors are a key proposition of the national and international policies and strategies. Thus, the role of BESS in achieving the climate impact mitigation target is significant. There is an unmet need for a detailed life cycle assessment (LCA) of BESS with lithium-ion batteries being the most promising one. This study conducts a rigorous and comprehensive LCA of lithium-ion batteries to demonstrate the life cycle environmental impact hotspots and ways to improve the hotspots for the sustainable development of BESS and thus, renewable electricity infrastructure. The whole system LCA of lithium-ion batteries shows a global warming potential (GWP) of 1.7, 6.7 and 8.1 kg CO2 eq kg−1 in change-oriented (consequential) and present with and without recycling credit consideration, scenarios. The GWP hotspot is the lithium-ion cathode, which is due to lithium hexafluorophosphate that is ultimately due to the resource-intensive production system of phosphorous, white, liquid. To compete against the fossil economy, the GWP of BESS must be curbed by 13 folds. To be comparable with renewable energy systems, hydroelectric, wind, biomass, geothermal and solar (4–76 g CO2 eq kWh−1), 300 folds reduction in the GWP of BESS will be necessary. The areas of improvement to lower the GWP of BESS are as follows: reducing scopes 2–3 emissions from fossil resource use in the material production processes by phosphorous recycling, increasing energy density, increasing lifespan by effective services, increasing recyclability and number of lives, waste resource acquisition for the battery components and deploying multi-faceted integrated roles of BESS. Achieving the above can be translated into an overall avoided GWP of up to 82% by 2040.

1. Introduction

Battery energy storage systems (BESS) are used to shave off-peak electricity demands, stabilise grid electricity systems and increase the proportion of renewable energy that is intermittent in the energy mix. Their applications are manifold including enhanced stability, reliability, security and efficiency of whole energy system. BESS can be optimised for their multi-faceted integrated contributions to maximise savings in carbon footprint in the electricity sector. At present, there are a limited number of studies on environmental impact savings, global warming potential or climate change impact potential (GWP) being a critical one, by BESS. Carbon footprint saving by BESS needs to be accurately evaluated to justify investment particularly to mitigate climate change impact in the electricity sector.
Over the past two decades, considerable innovations have been made in cathode and anode materials including recyclability, power and energy densities and life of BESS. With now a standard acceptable life span of 8–15 years, BESS offer reliability, resilience, and cost-saving of renewable energy technologies. Amongst thirty-eight clean energy technologies identified in the International Energy Agency’s Sustainable Development Scenario in the World Energy Outlook to keep global temperature rise within 2 °C, hydropower, wind and solar photovoltaic (PV) seem to be dominating the renewable electricity mix [1]. In the UK, the proportion of renewable electricity mix in the grid electricity system is 10–30% by energy in recent years [2]. A main component of renewable energy infrastructure is energy storage systems that charge during times of excess renewable energy availability and discharge during peak demands when renewable energy resources may not be available. Coal, oil or natural gas (fossil resources) based electricity generation can be avoided during peak demands by bioenergy and BESS connected renewable systems.
Electricity is a ubiquitous driver for the economic growth of developing countries. It was observed that above 20% penetration of renewable electricity destabilises the grid or energy infrastructure system originally developed for a fossil-based generation [3]. BESS have an important role in optimising the whole electricity sector of both developing countries where inadequate infrastructure makes renewable electricity important to jump-start economic growth as well as the developed countries where fossil generations need to be avoided by renewable generations. Energy storage systems are critical to increasing the proportion of renewable electricity in a country’s electricity mix [4]. By decoupling electricity generation from usage, a storage system provides stability, reliability, security and efficiency of grid or energy systems [5]. Thus, the role of energy storage goes beyond peak shaving and grid balancing. Its critical role has been identified in ancillary, transmission, distribution and customer services, to optimise an overall energy network, however, only from an economic aspect [6]. However, the savings by energy storage or specifically BESS need to be holistically and rigorously defined for planning, scheduling, optimising and managing whole electricity systems in ancillary, transmission, distribution and customer services by taking account of all the attributes of BESS: stability, reliability, security and efficiency of a whole electricity system. A life cycle assessment (LCA) is an effective approach for benchmarking the environmental footprint of BESS, allocating environmental impacts to their various purposes and for identifying critical areas for improvement to mitigate the climate impact of BESS-connected systems to enhance their environmental feasibility to displace fossil-based energy systems. Lithium-ion batteries have been identified as the most environmentally benign amongst BESS [7]. However, there is little consensus on their life cycle GWP impacts requiring further LCA study as this paper offers.

2. Literature Review for the Technical and Environmental Performances of BESS

Over the past two decades, considerable innovations are seen in cathode and anode materials including 2D planar carbon haeckelite structures with lithium intercalation, recyclability, power and energy densities and lifespan of BESS [8]. The types of BESS reported are Li-ion, Li metal polymer, Ni metal hybrid, Na metal chloride, sodium-sulphur, nickel-cadmium, lead acid and V redox flow battery with energy (kWh kg−1) and power (kW kg−1) densities of 0.12–0.18 and 0.2–0.3; 0.11–0.14 and 0.12–0.2; 0.06–0.1 and 0.07–0.21; 0.05–0.1 and 0.02–0.18; 0.06–0.13 and 0.01–0.1; 0.04–0.06 and 0.03–0.11; 0.025–0.045 and 0.05–0.12; and <0.025 and <0.02, respectively [9]. Compared to electrochemical technologies for storage, compressed air energy storage and pumped hydro storage are mature large scale low-cost options, more suited for fossil-based conventional grid energy systems [10]. However, fossil energy systems (coal, oil and natural gas) have higher global warming potential 0.475–1.3 kg CO2 eq kWh−1 compared to renewable energy systems (hydro, wind, solar, bioenergy and nuclear) 0.01–0.1 kg CO2 eq kWh−1 [10]. A net zero carbon future neutralising greenhouse gas emissions by balancing between carbon sources and sinks is only achievable if electricity generation is entirely from renewable resources and the majority energy demand is met by electricity. Thus, there is increasing pressure on the sustainable development of BESS that allows renewables integration into infrastructure.
The GWP of BESS varies widely and exceeds that of fossil-based energy systems, which may not need storage. There is no consensus on the GWP of BESS for future targets. Amongst the lithium-ion batteries, lithium iron phosphate, lithium nickel cobalt manganese, lithium manganese oxide, lithium cobalt oxide, lithium nickel cobalt aluminium, lithium cobalt phosphate, lithium iron manganese phosphate, lithium metal polymer and lithium cobalt nickel have been studied for chemistries and LCA performances [11]. An LCA study of lithium cobalt phosphate cathode based battery shows a GWP of 70.7 kg CO2 eq kWh−1 and the cathode as the hotspot incurring 75% of the total GWP [12]. Another study reports a GWP of 185–440 kg CO2 eq MWh−1 [13]. Thus, there could be a difference in GWP of several hundred manifolds between the published studies. This calls for a benchmarking LCA study based on a globally standard database. The functional unit of an LCA study of lithium-ion batteries also varies between per unit mass and unit energy stored of BESS. Some studies chose to report the LCA results per kg batteries. For example, an LCA study gives 12.5 and 4.4 kg CO2 eq kg−1 battery production for n-methyl-2-pyrrolidone solvent and water solvent-based lithium-ion batteries [14]. The LCA results vary widely depending on the choice of the functional unit for the LCA, energy or mass unit due to varying energy density [15]. Their study has shown a GWP of 22.97 kg CO2 eq kg−1 lithium-ion battery with 55% resulting from the cathode [15]. In addition to energy density, the lifespan of BESS is another key variable. It is desired to achieve both the increased lifespan in each life and the number of times BESS can be recycled. A cascaded life cycle analysis of Li-ion battery, first applied in electric vehicle (8 years lifetime), followed by repurposing to store energy for the grid (10 years lifetime), gives a global warming potential of 0.25 kg CO2 eq kWh−1 [16]. It is expected that after the first life in the electric vehicle (about 10–20 years), which causes 20–30% decay in capacity, BESS can be reused for connection to a grid system (5–10 years) [17]. Another study identifies that the main difference in LCA of BESS is due to the way they are disposed of and recycled [18]. Although treatment and recycling incur only 10–20% of overall life cycle impacts, these vary from one type to another type of BESS [18]. High energy density and long life expectancy would drive the technology development in BES [19]. Research has been conducted on the analysis of life cycle climate impact mitigation by BESS in the UK and made available as an industrial report in 2019 [20]. Another similar study has been published that analyses the avoided GWP and natural gas consumption by BESS integrated renewable electricity systems in the UK [21]. The overall results obtained are very similar in these two studies [20,21]. Both have shown 87–90% avoided GWP by BESS integration to the UK grid electricity system. However, the study in [21] does not show all plausible ways to improve the GWP of BESS necessary to compete against natural gas. In addition, the core cause of the GWP impact hotspot has remained unrevealed in these studies demanding an in-depth rigorous and comprehensive LCA of BESS that this study offers using lithium manganese oxide cathode in lithium-ion batteries as an example. Without the improved GWP of BESS, renewables can’t triumph fossil-based electricity systems. This study systematically shows a global BESS life cycle inventory model, all plausible ways to improve the life cycle GWP of BESS, the maximum life cycle GWP limit for BESS to transcend fossil counterparts and thereby the avoided GWP by BESS-connected renewable electricity systems. The paper is structured as follows. The following sections discuss the LCA methodology adopted in this study and the results of the LCA of BESS and BESS-connected renewable electricity systems. The final section concludes the main results of this research.

3. Materials and Methods

LCA is a standardised methodology for holistic whole system environmental impact assessment [22,23,24,25,26]. The approach this study takes is a holistic, systematic and rigorous LCA to establish overall environmental impact savings by BESS in the context of the UK renewable energy system. Amongst numerous life cycle impact categories, the most important one that should be included for energy-saving services is GWP impact or climate change impact potential. The other important atmospheric impacts include urban smog (local), acidification potential (regional) and ozone depletion potential (global). Important aquatic impact potentials include freshwater depletion, aquatic ecotoxicity potential and eutrophication potential. Terrestrial ecotoxicity potential is a land emission impact indicator. In addition, life cycle impact assessment methods provide several human health-related impact potentials. Many life cycle impact assessment methods have been developed with differing characterisation factors of pollutants and impact categories with distinctive units depending upon demography, e.g., ILCD and Impact 2002+ for Europe, TRACI for the USA and CML from Leiden University Netherlands. The ReCiPe is a popular choice giving a comprehensive representative range of environmental impact characterisations. The life cycle impact assessment methodologies and the selection rationale are discussed in earlier work [27]. For this study, the primary environmental impact category selected is the GWP over 100 years according to the Intergovernmental Panel on Climate Change (IPCC). For consistency check in the in-depth hotspot analysis of BESS by LCA, the ReCiPe, CML and ILCD methods have been applied. Also, the other important life cycle environmental impact potentials, acidification potential (AP), eutrophication potential (EP) and fossil depletion potential (FDP) using the CML characterisation factors and photochemical oxidant creation potential or urban smog (POCP) using the ILCD characterisation factors are shown for the various UK electricity generation systems [28].
LCA is a standardised holistic and rigorous methodology for the assessment of environmental impacts of cradle-to-grave or cradle-to-cradle supply chain systems in temporal and spatial scales. The methodology has been discussed in the ISO14040-44 (International Organization for Standardization) [22,23,24,25,26]. According to the methodology, all stages of the life cycle of a product or service should be considered for a comprehensive assessment of environmental impacts. The life cycle stages of a product or service include raw material acquisition, manufacturing, logistics, use and resource circulation [28]. According to the waste disposal hierarchy, future systems should be developed to avoid the bottom of pyramid options, i.e., landfill, disposal. This emphasises the importance of embedding a circular economy for the sustainable development of systems. The circular economy should be an embedded ethos in the development of BESS that considers resource circulation for the indefinite life of BESS.
According to the ISO14040-44, LCA comprises four interactive stages: goal and scope definition, inventory analysis, impact assessment and interpretation. In the goal and scope definition, objectives and system boundary and definition should be included. Demography of the supply chains of the products or services under consideration should be defined, alongside functional unit and configuration of the system. Impact characterisations that are relevant and important for the system under consideration should also be discussed at this stage of LCA. To establish the role of BESS by LCA, not only the LCA of BESS should be considered, but also the LCA of resources and technologies for electricity supply should also be conducted, discussed in the following sections.
Inventory analysis is about the acquisition of input and output material and energy flows (quality and quantity) of various unit blocks within the system boundary under consideration and between the various unit blocks and the environment. This is followed by assigning detailed resource and emission inventories to each flow and involves the acquisition of a fundamental inventory database for each material or energy flow from a robust inventory database provision, i.e., Ecoinvent. The Ecoinvent 3.0 life cycle inventory databases are extracted and SimaPro 9.2.0.1 is used for analysing the life cycle impacts of lithium-ion batteries. Impact assessment is about assigning and applying impact characterisation factors as applicable to each resource or emission inventory and then aggregating for total impact value in each category. Thus far, the LCA of the system may be focused on a stand-alone basis. Interpretation allows investigation of the present, attributional and consequential or change-oriented scenarios. In this study, plausible scenario bases and results are included for transparency and transferability to other studies. Only a limited number of studies exist on LCA of energy storage systems but focused on the systems only, without in-depth hotspot analysis and linking the results to all the problems that energy storage systems can tackle, leaving a gap in research that needs closing by rigorous LCA of BESS. The multi-faceted role of BESS has been identified in ancillary, transmission, distribution and customer services as shown in Figure 1. Thus, this study offers the following objectives.
Estimation of life cycle GWP impact of BESS. Life cycle GWP hotspot analysis of BESS.
ReCiPe, CML and ILCD impact characterisations of BESS for consistency in outcomes.
Target improvement areas to lower the life cycle GWP impacts of BESS.
Assigning GWP to the UK electricity mix from 2016 through to 2040.
Estimation of avoided GWP by BESS including in the consequential scenario, where fossil energy systems could be eliminated from the UK electricity sector.

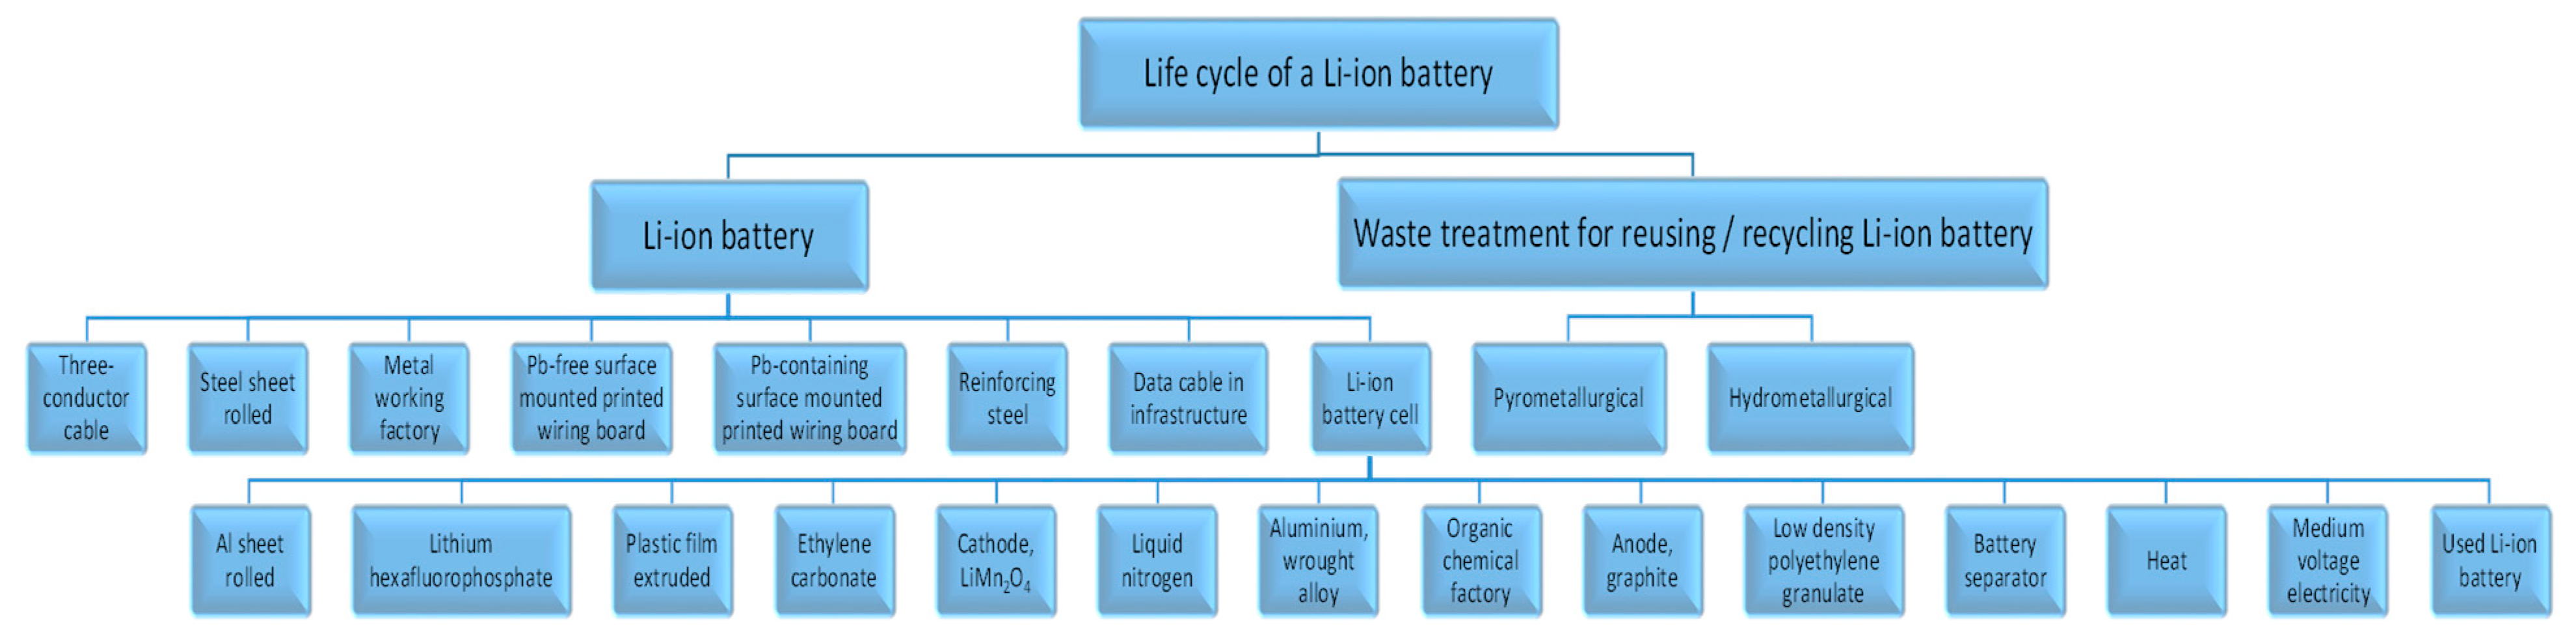
4. System Boundary and Life Cycle Inventory Analysis of BESS

Following the principles of ISO 14040-44, the LCA of BESS has been conducted as follows. The system boundary included for BESS and fossil and renewable energy resource options are cradle-to-cradle, from raw material acquisition through manufacturing, logistics and use to reuse and recycle.
A Li-ion battery is chosen to represent BESS to target life cycle GWP impact reductions. This is because Li-ion batteries have the lowest GWP amongst BESS [7]. They have a major share amongst the battery technologies and are suitable for storing large scale renewable electricity makes them appropriate for the UK renewable energy systems. The life cycle of a Li-ion battery consists of the battery manufacturing, operation, reuse and waste treatment for recycling the battery constituents. In simple terms, further, the manufacturing stage that contributes to more than 45% of the total GWP (11 kg CO2 eq per kg of battery), consists of materials, cathode/anode/parts, cell manufacturing and pack manufacturing. BESS have thus other components, such as steel, cable and printed wiring board. For the construction phase of BESS, metal working factories also need to be considered. Within a cell, the major components are cathode, anode and electrolytes. Also, the cell contains aluminium and polymers as other constituents. The manufacturing and operation phases of the cell consume heat and electricity. Furthermore, separation and reuse of used batteries should be considered in a new battery for recyclability and sustainability. Now that more sophisticated techniques for recycling Li-ion batteries exist, the disposal option must be omitted. Two main Li-ion battery treatment technologies exist for the parts not being reused, hydrometallurgy and pyrometallurgy. In system boundary terms for LCA, these activities described could be represented by a block flow diagram, as shown in Figure 2. Table 1 shows their in-depth inventory flows making up the Li-ion battery (Ecoinvent 3.0: Battery, Li-ion, rechargeable, prismatic {GLO} production).
Each system could be further scrutinised for hotspot analysis for the chosen impact categories, in this case primarily, GWP 100 years in the quantity of carbon dioxide equivalent (CO2 eq). For life cycle inventory analysis, Ecoinvent 3.0 databases relevant to the UK electricity system have been assimilated. The databases exist in the form of activities or services, i.e., materials and energy. Relevant ones are plugged in to construct a system. As discussed, each hotspot activity is expanded for assimilation of life cycle inventory databases from Ecoinvent 3.0 specific to the activity. This way, a top-down approach is followed to conduct the LCA of BESS.

5. Results of LCA of BESS and BESS-Connected Renewable Energy Systems

This section first discusses the overall GWP analysis results of BESS (benchmarking exercise), then the hotspot or contribution analysis of activities making up the BESS (benchmarking exercise), and finally, climate impact mitigation analysis of BESS-connected renewable energy systems (consequential analysis).

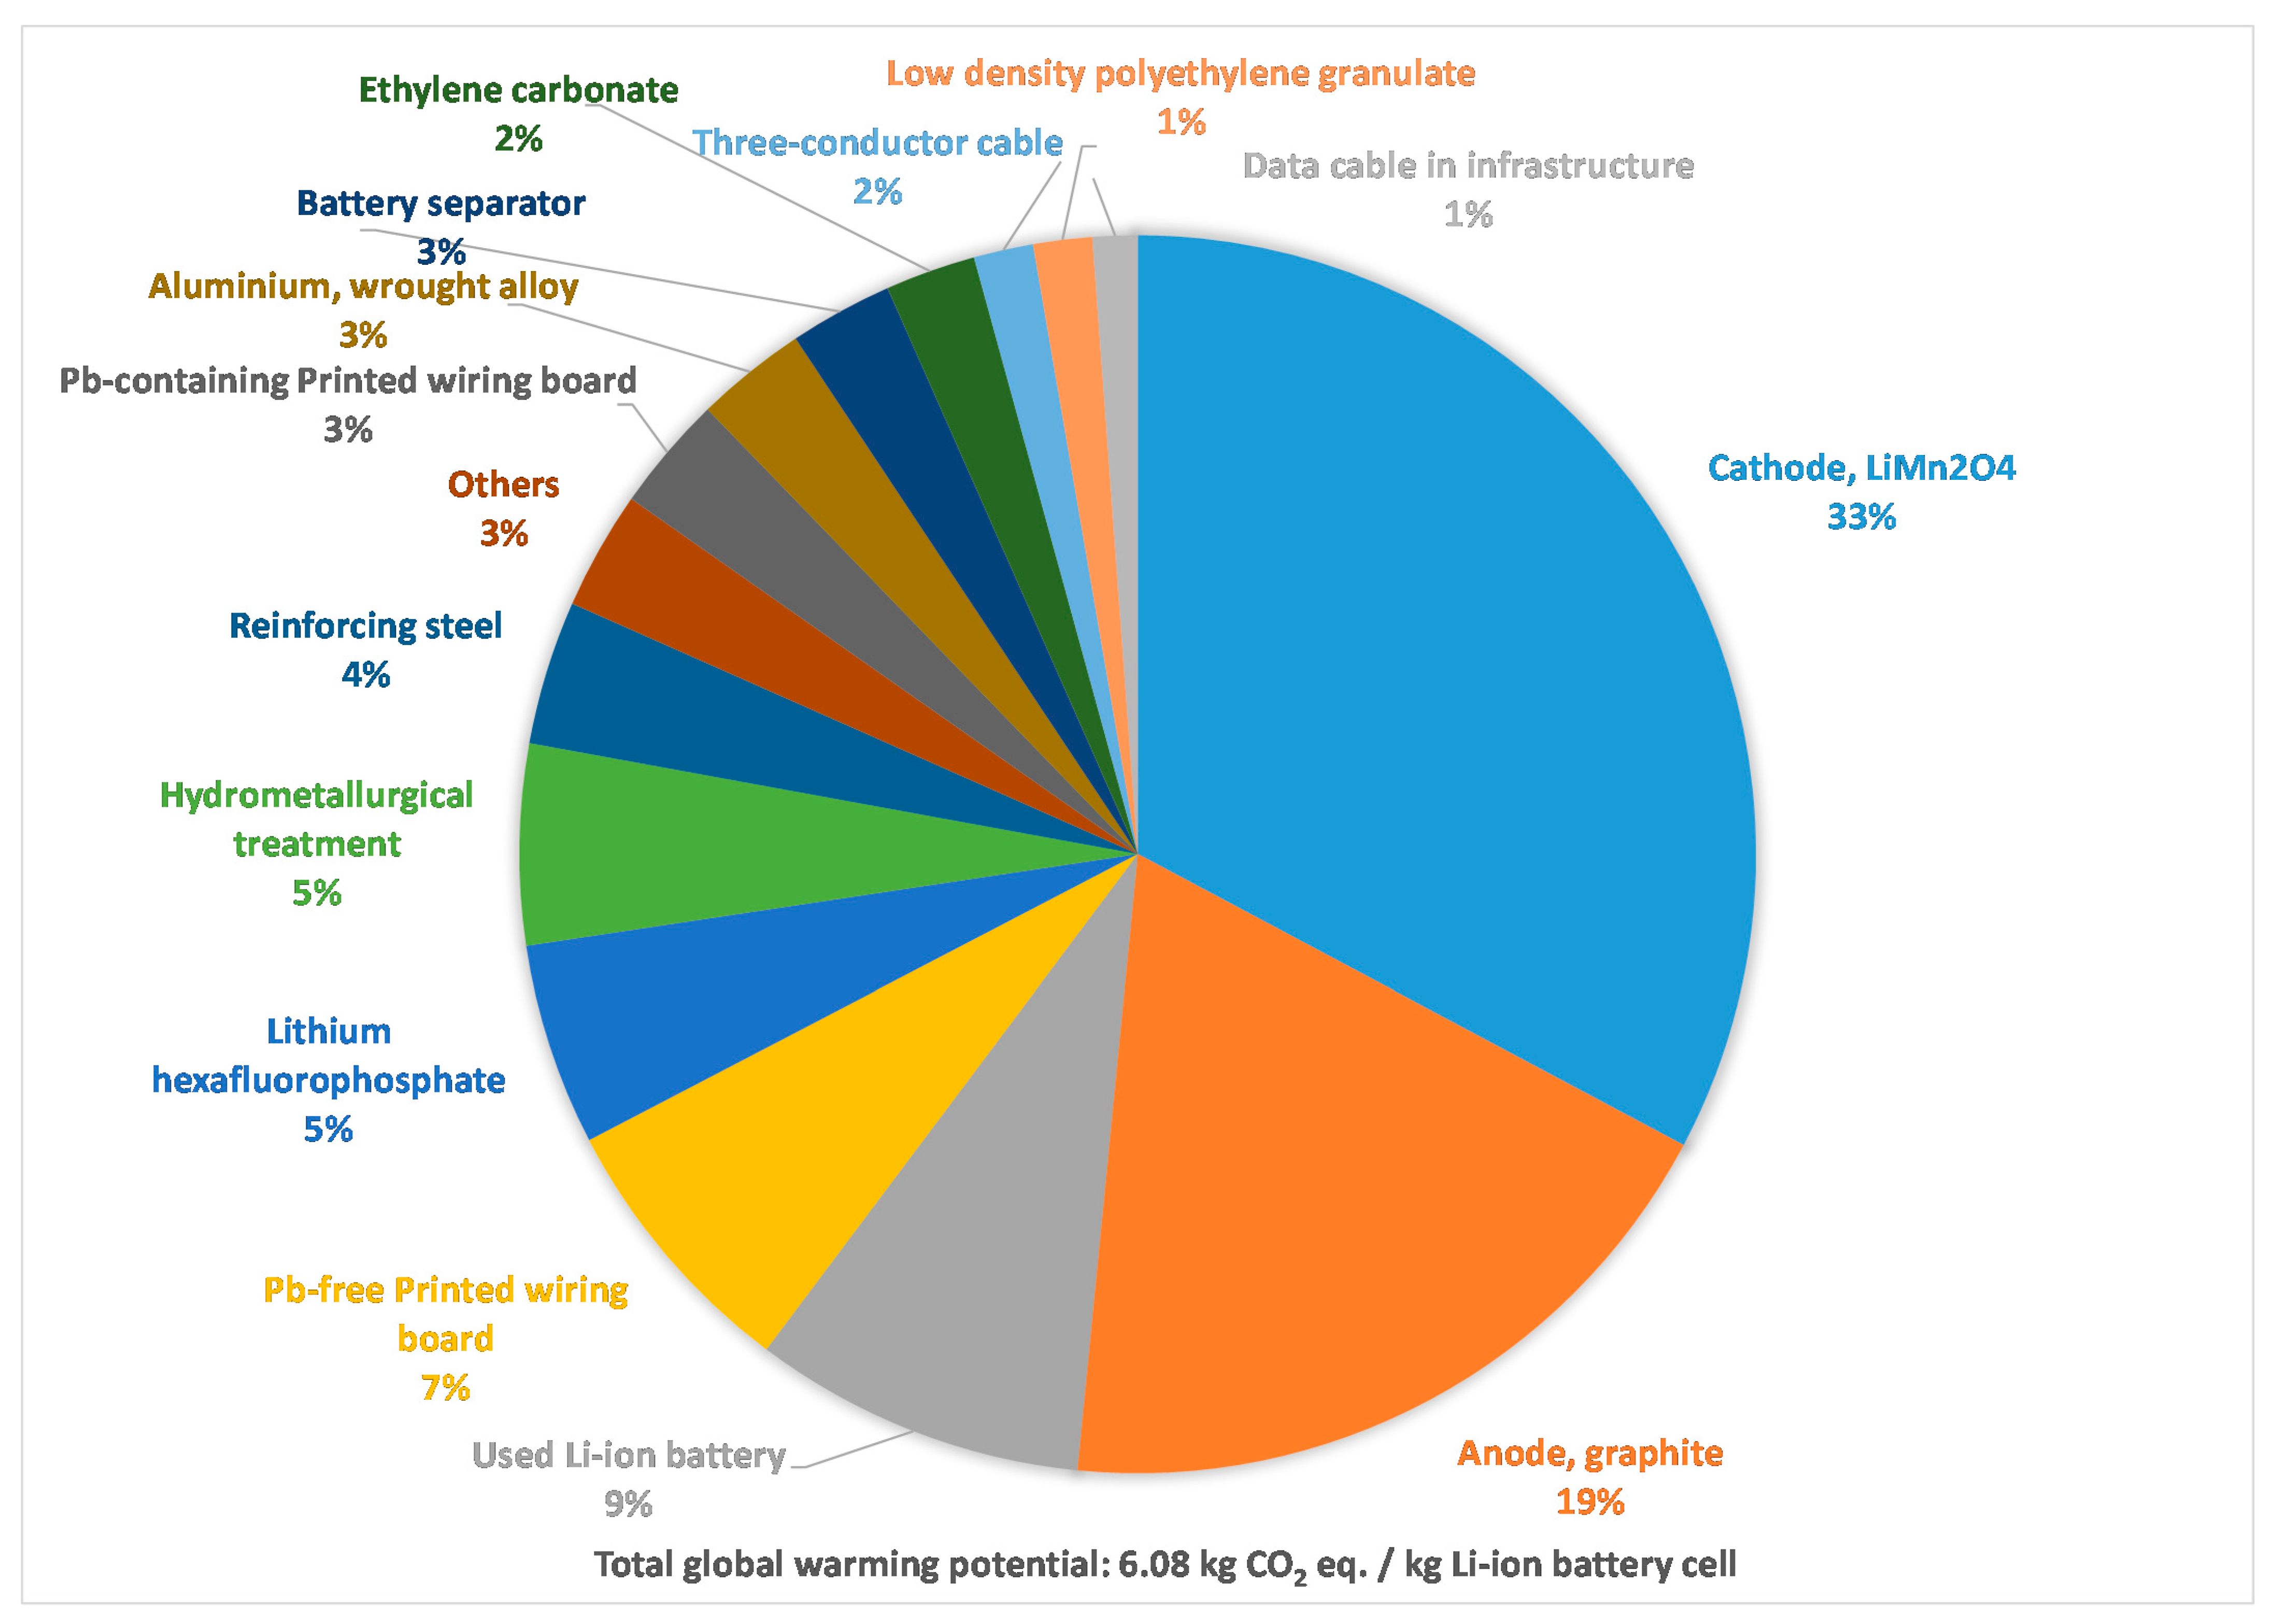
5.1. Overall GWP Analysis of BESS

An overall BESS GWP analysis (IPCC 100 years) is conducted using the Ecoinvent 3.0 database (Table 1) and the LCA software SimaPro 9.2.0.1. The results in the three conditions of Ecoinvent 3.0 are as follows.
  • Allocation at the point of substitution: 6.7 kg CO2 eq per kg of lithium-ion battery
  • Cut-off: 8.1 kg CO2 eq per kg of lithium-ion battery
  • Consequential: 1.7 kg CO2 eq per kg of lithium-ion battery
The ‘allocation at the point of substitution’ method of Ecoinvent 3.0 considers burdens or credits being carried through recycled materials across the supply chains. The ‘cut-off’ method of Ecoinvent 3.0 takes burden or credit free recycled materials across the supply chains. The ‘consequential’ method of Ecoinvent 3.0 considers the consequences of a change in supply chains connected or not connected by mass or energy flows considering rebound effects.
The provision of service from all the systems under consideration, BESS and fossil and renewable energy resources, is electricity. Thus, the functional unit should be 1 kWh energy storage by the battery. However, for the battery systems, Ecoinvent 3.0 inventory databases are available for 1 kg of the battery system. A conversion factor in kWh kg−1 is needed for presenting the inventory values based on per kWh electricity storage. This value is 11.6 kWh per kg Li (wiki: lithium-ion battery). Cathode only constitutes 17.5% by mass of a battery pack according to the database source in Ecoinvent 3.0. Thus, when other components would be added to construct a whole battery system, energy density (kWh kg−1) would be lower, ~0.26 kWh kg−1 reported widely. The other kWh kg−1 value for BESS reported in Ecoinvent 3 is 2.1 kWh kg−1 (Ecoinvent 3.0 database name: Battery, Li-ion, rechargeable, prismatic {GLO}| production). The battery pack consists of 14 single cells providing 2.1 kWh kg−1 energy density and a voltage of 48 V.
By dividing the total GWP impact by the energy density range (0.26 kWh kg−1) discussed earlier, a GWP impact factor of 6.5, 25.8 and 31 kg CO2 eq per kWh electricity provision of BESS is obtained for the three conditions, consequential, allocation at the point of substitution and cut-off, respectively. Further improvement in the GWP impact factor is essential. For example, increasing the life of the battery from 8 years to 20 years would lower the GWP to 2.6 kg CO2 eq per kWh in the change-oriented scenario. Another demonstratable strategy to lower the GWP from life cycle energy storage of BESS is to acquire organic material deploying green chemistry from the family of oxocarbons or carboxylates, alongside lowering of Li-ion in electrodes [9].
Given intermittent supplies of renewable systems, BESS will be essential to store electricity or charge during the time of renewable generations or resource availability and supply electricity or discharge during the time of high electricity demand. If the BESS integration is explored in the wider context of the whole energy service system as shown in Figure 1, its GWP impact factor can be shared across the whole system lowering this factor further. For example, by allocating the total GWP impact of BESS to their five different services, the GWP impact of BESS for the renewable electricity provision would be 0.5 kg CO2 eq per kWh, comparable to the GWP of gas [28]. Based on the literature survey [6], percentage contributions of BESS in life cycle energy storage and saving in various services, energy resources, transmission, distribution, customer and ancillary, are shown in Figure 3. The data analyses are split based on mean, maximum and 25th and 75th percentile values of life cycle energy capacities and saving by BESS. The total GWP impact of BESS can be distributed to their various service offerings in the decreasing order, customer (19–34%) > ancillary (24–29%) > energy resources (14–26%) > transmission (14–25%) > distribution. This approach would allocate a certain fraction of the total GWP impact of BESS for the service under consideration.

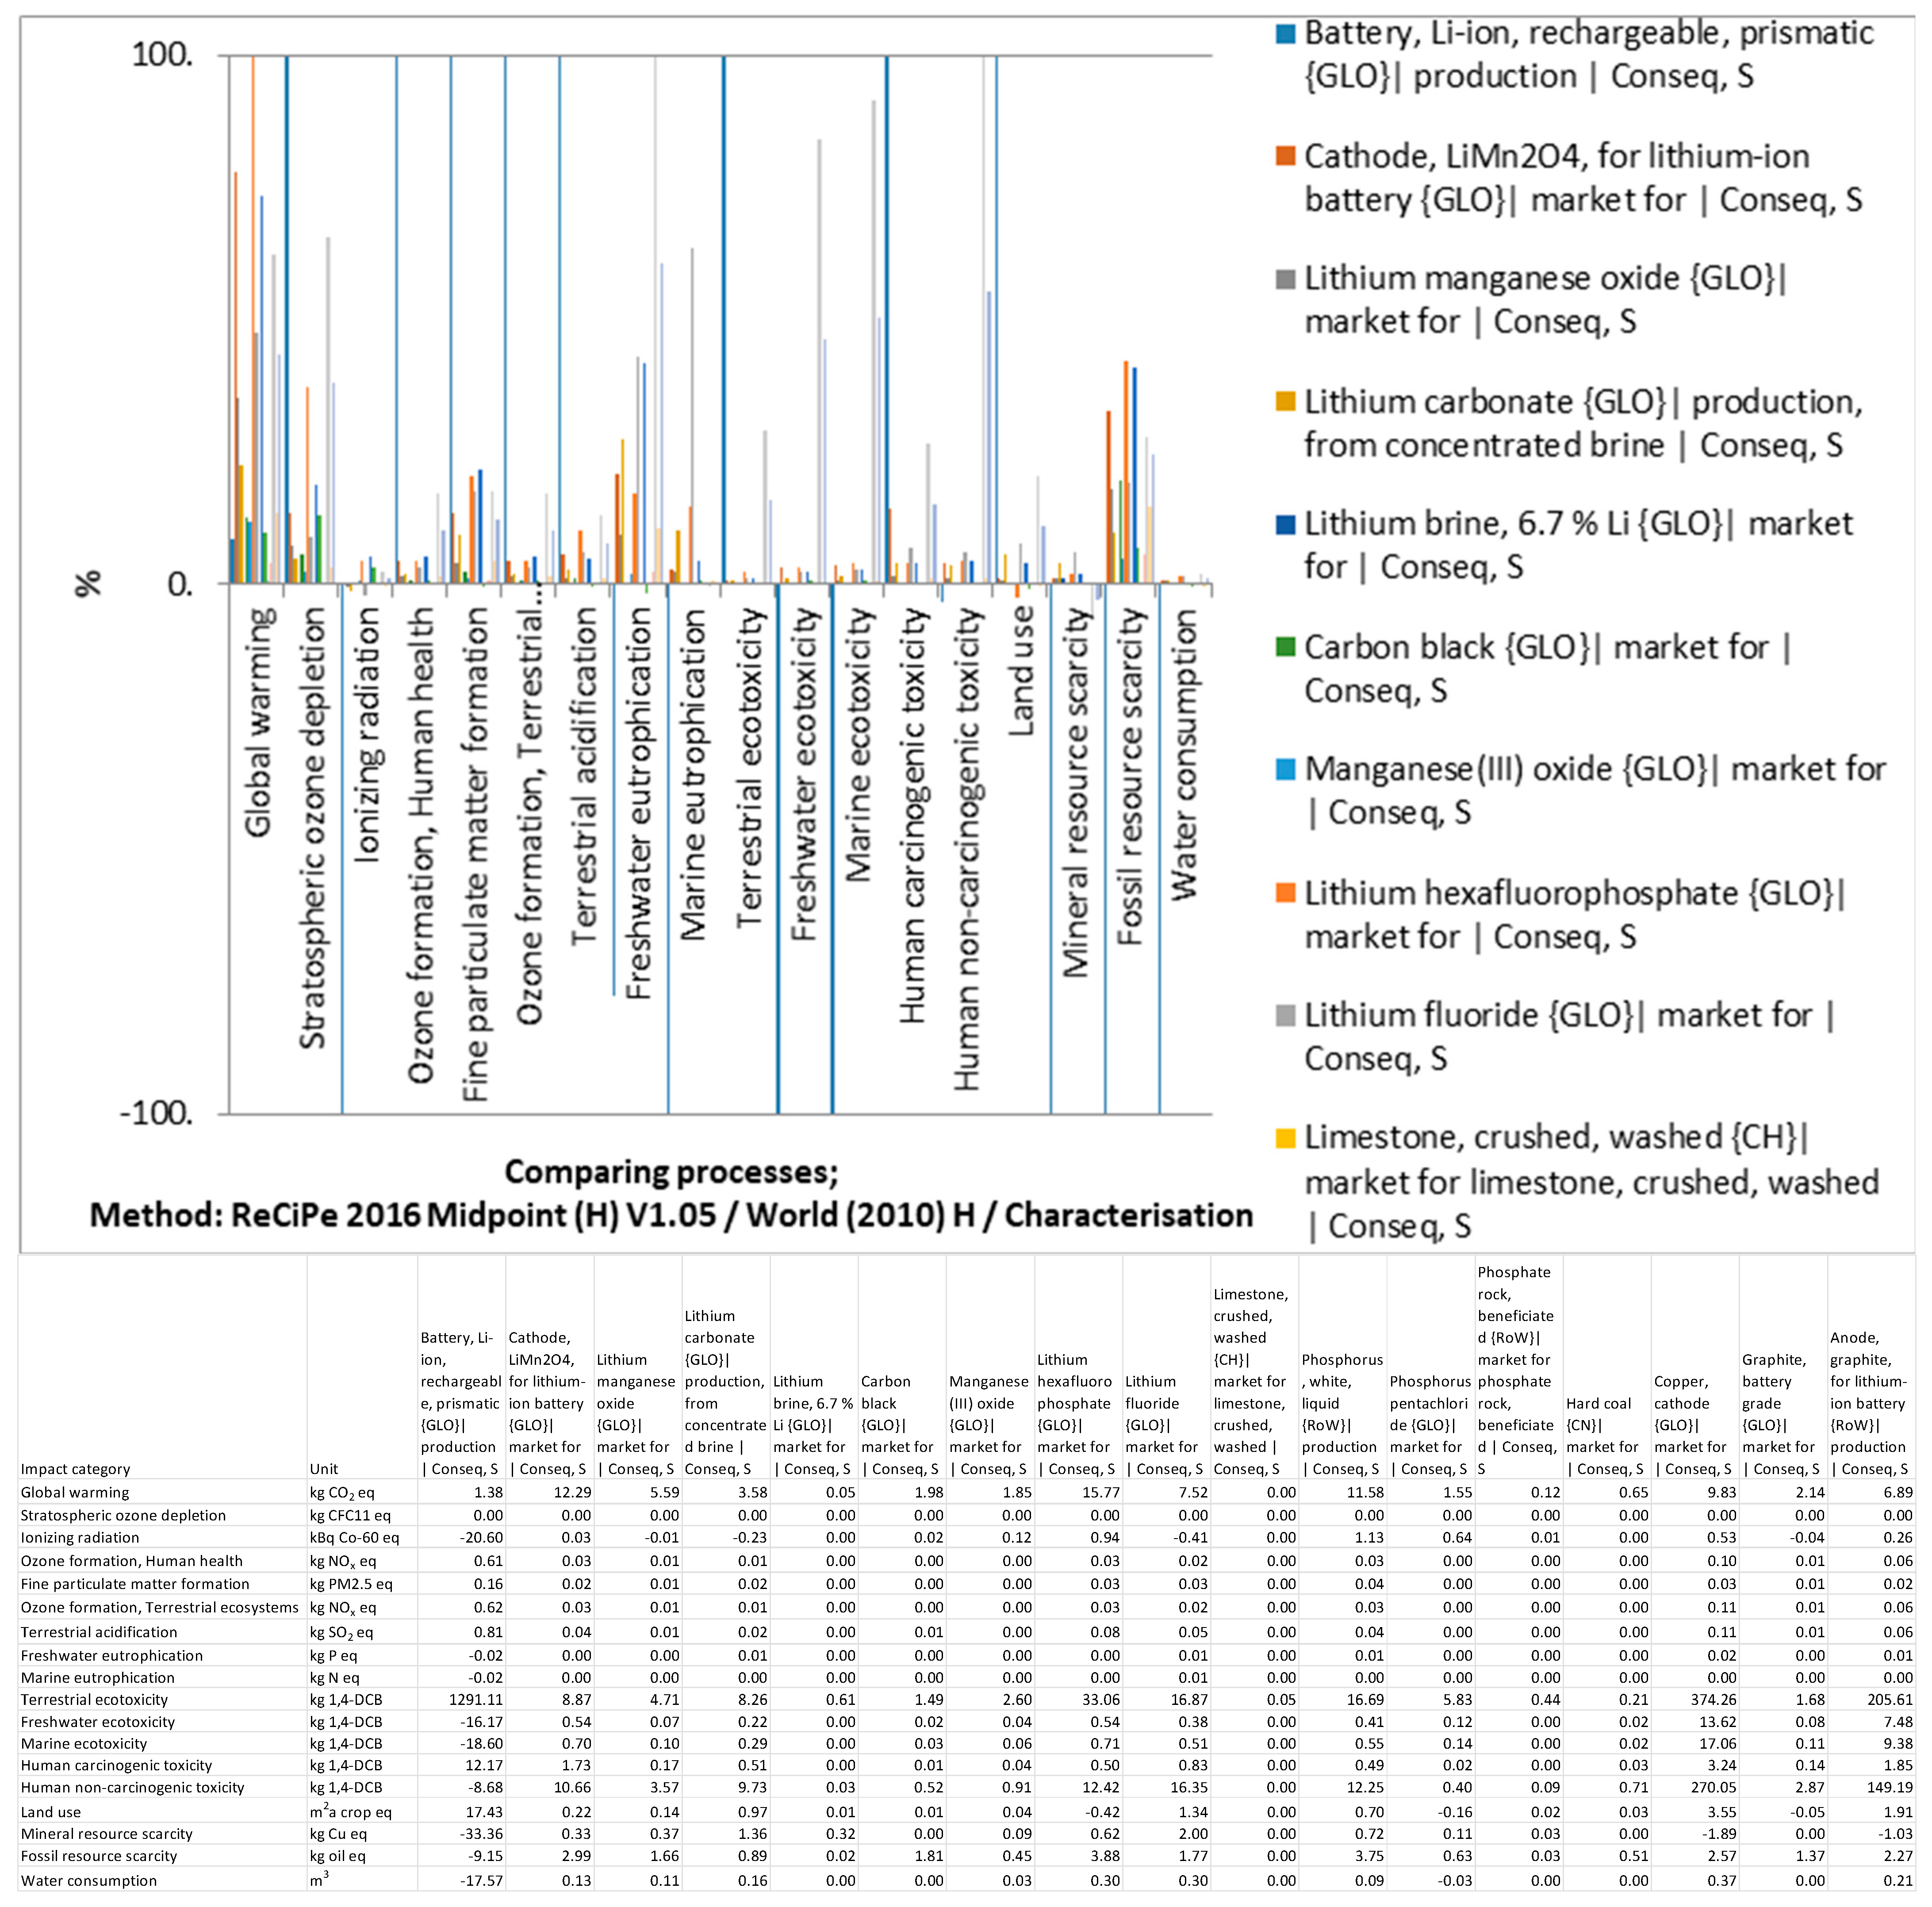
5.2. Hotspot Analysis of BESS Components

An overall BESS hotspot analysis of GWP shows cathode (LiMn2O4) and anode (graphite) carry the major impacts, half the total GWP impact of BESS that is resulted from the LCA conducted using Ecoinvent 3.0 database and the LCA software SimaPro 9.2.0.1. Figure 4 shows the contribution analysis of the various activities illustrated in Figure 2 constitutes the life cycle of a Li-ion battery system. In terms of hotspot analysis, the contributions by the various activities shown in Figure 4 does not change between the three methods or conditions applied in Ecoinvent 3.0, allocation at the point of substitution, cut-off and consequential. Furthermore, following the life cycle inventory analysis of BESS in Table 1, the hotspots deep-down at the fundamental resource level are analysed. The results surprisingly show that the apparent high impact is actually due to the phosphorous white liquid production and is not due to the sourcing of lithium (lithium brine, 6.7% Li). The production of phosphorous white liquid is resource-intensive causing 13 kWh kg−1 electricity consumption and 1.25 kg kg−1 hard coal consumption (Wöhler process). The latter consumption also raises the question of sustainability given the dwindling supply of coal, increasing concerns over climate emergency due to fossil consumption and rising demand for lithium-ion batteries. This stresses the importance of nutrient circulation for a sustainable earth system for mankind—this not only supports the food system, influences biodiversity but also the sustainability of renewable electricity infrastructure, a key determinant to the 1.5 °C future.
To ensure that the life cycle environmental impacts of BESS are consistent, the ReCiPe Midpoint Hierarchical (M) (H), CML and ILCD methodologies are applied. The results are shown for the consequential scenario. Figure 5, Figure 6 and Figure 7 show the scaled ReCiPe (M) (H), CML and ILCD impact characterisations between −100 and 100 of the various life cycle inventories shown in Table 1. The impact characterisations are given per kg of the material concerned. The inset table shows the actual values of the impact characterisations in the respective given units.
Furthermore, the GWP (w/w) over 100 years following the IPCC characterisation method is shown in Figure 8 for the key material productions in Table 1 to identify the hotspots in the entire system. Within the Li-ion battery, the battery cell, Li-ion carries most of the GWP burdens. Lithium hexafluorophosphate rather than lithium-ion cathode is the GWP hotspot. The GWP impacts of lithium hexafluorophosphate are primarily due to the impacts of phosphorus, white, liquid via phosphorous chloride. The next level of GWP impacts is due to the lithium-ion cathode, which is due to lithium manganese oxide, which is further due to lithium carbonate and manganese (III) oxide. Lithium carbonate’s GWP is due to lithium brine, 6.7% Li. The anode, graphite has then the next level of GWP, which is due to the copper cathode and graphite anode, respectively, to make the anode, graphite product.
The ReCiPe (M) (H) life cycle impact assessment method gives eighteen mid-point characterisations. The negative impacts imply environmental credits due to recycling and displacement of fossil resources where applicable. Thus, there are savings in fossil, mineral and water resources. The GWP impact is high due to phosphorous, white, liquid production.
There are eleven life cycle impact categories assessed in the CML method. Credits in fossil resources and toxicity impacts can be observed from the CML-based life cycle impact characterisations of the system. The climate impact hotspots are phosphorous white liquid > copper cathode > anode graphite. Amongst the various materials making up the cathode LiMn2O4, carbon black > manganese (III) oxide > lithium brine, 6.7%, lithium, incur GWP in decreasing order, respectively. Fossil resource saving by the battery is due to the recycling of the battery. To mitigate the climate impact potential of the battery, phosphorous recycling is needed. Microbial electrosynthesis [29,30,31] is a potential process for the recovery of phosphorous from wastewater sludge. Alternative organic solvents can be investigated that can be sourced from waste resources applying the circular economy principle [32,33].
There are sixteen impact categories analysed in the ILCD method. Similar to the ReCiPe (M) (H) method, the credit-bearing impact characterisations are related to fossil and water resource use. Consistent with the other two impact characterisation methods, the impact hotspots in the whole system are due to the productions of phosphorous, white, liquid > copper cathode > anode graphite. Carbon black and manganese (III) oxide productions are the next levels of GWP impact bearing processes. The in-depth life cycle hotspot analysis from life cycle inventory data collection (Table 1) through to life cycle impact assessment (Figure 5, Figure 6 and Figure 7) stresses the importance of consideration of life cycle stages, i.e., fundamental resource acquisition, beyond the manufacturing, use and recycling stages of LCA.

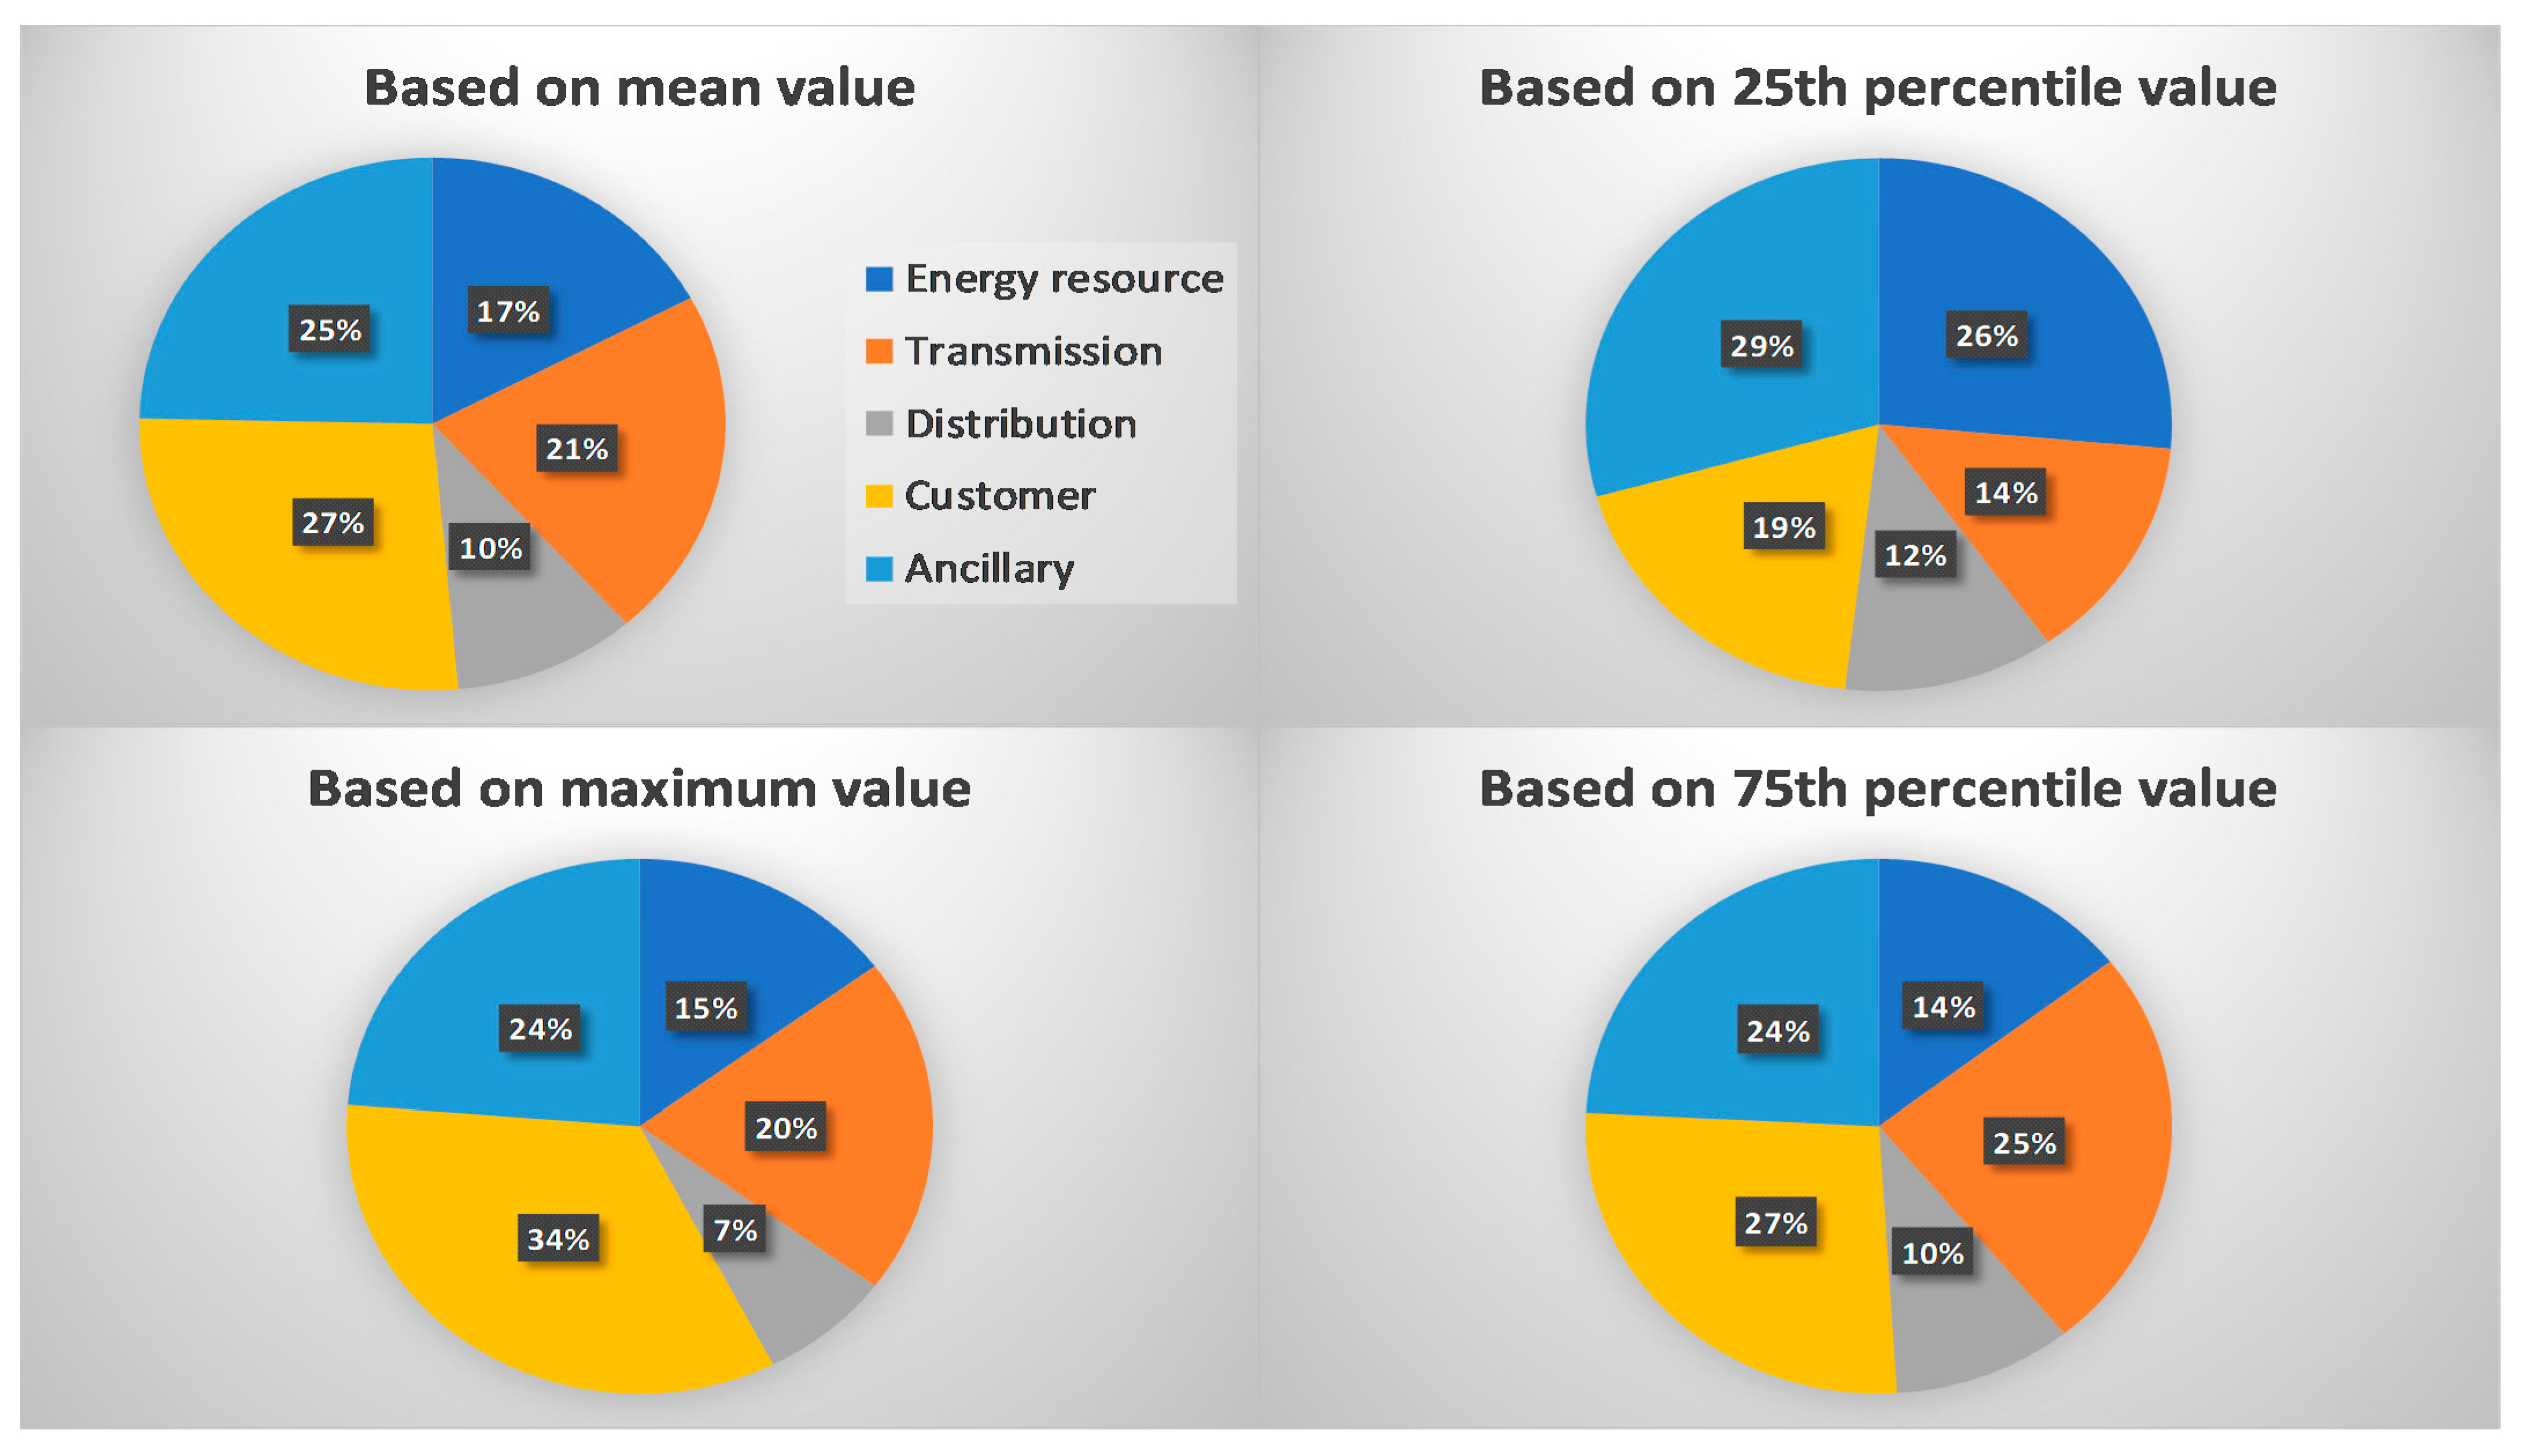
5.3. GWP Analysis of BESS-Connected Renewable Energy Systems

LCA of the UK renewable electricity system before and after BESS integration must be conducted to comprehend the role of BESS. BESS allow more than 20% (by energy) renewable electricity mix in a grid mix [3]. Up until 2020, energy storage has been driven by pumped storage in the UK. However, with an increasing proportion of renewable energies in the UK electricity sector, integration of BESS is imperative. Wind, solar and hydro electricity is expected to play a key role, eventually taking over from gas in the UK electricity sector. To calculate the avoided GWP by BESS integration into the UK renewable electricity system, the following data are presented and analysed.
(1)
The UK electricity generation by alternative resource (both TWh and percentage per annum) from 2016 through to 2020 (Figure 9) [2].
(2)
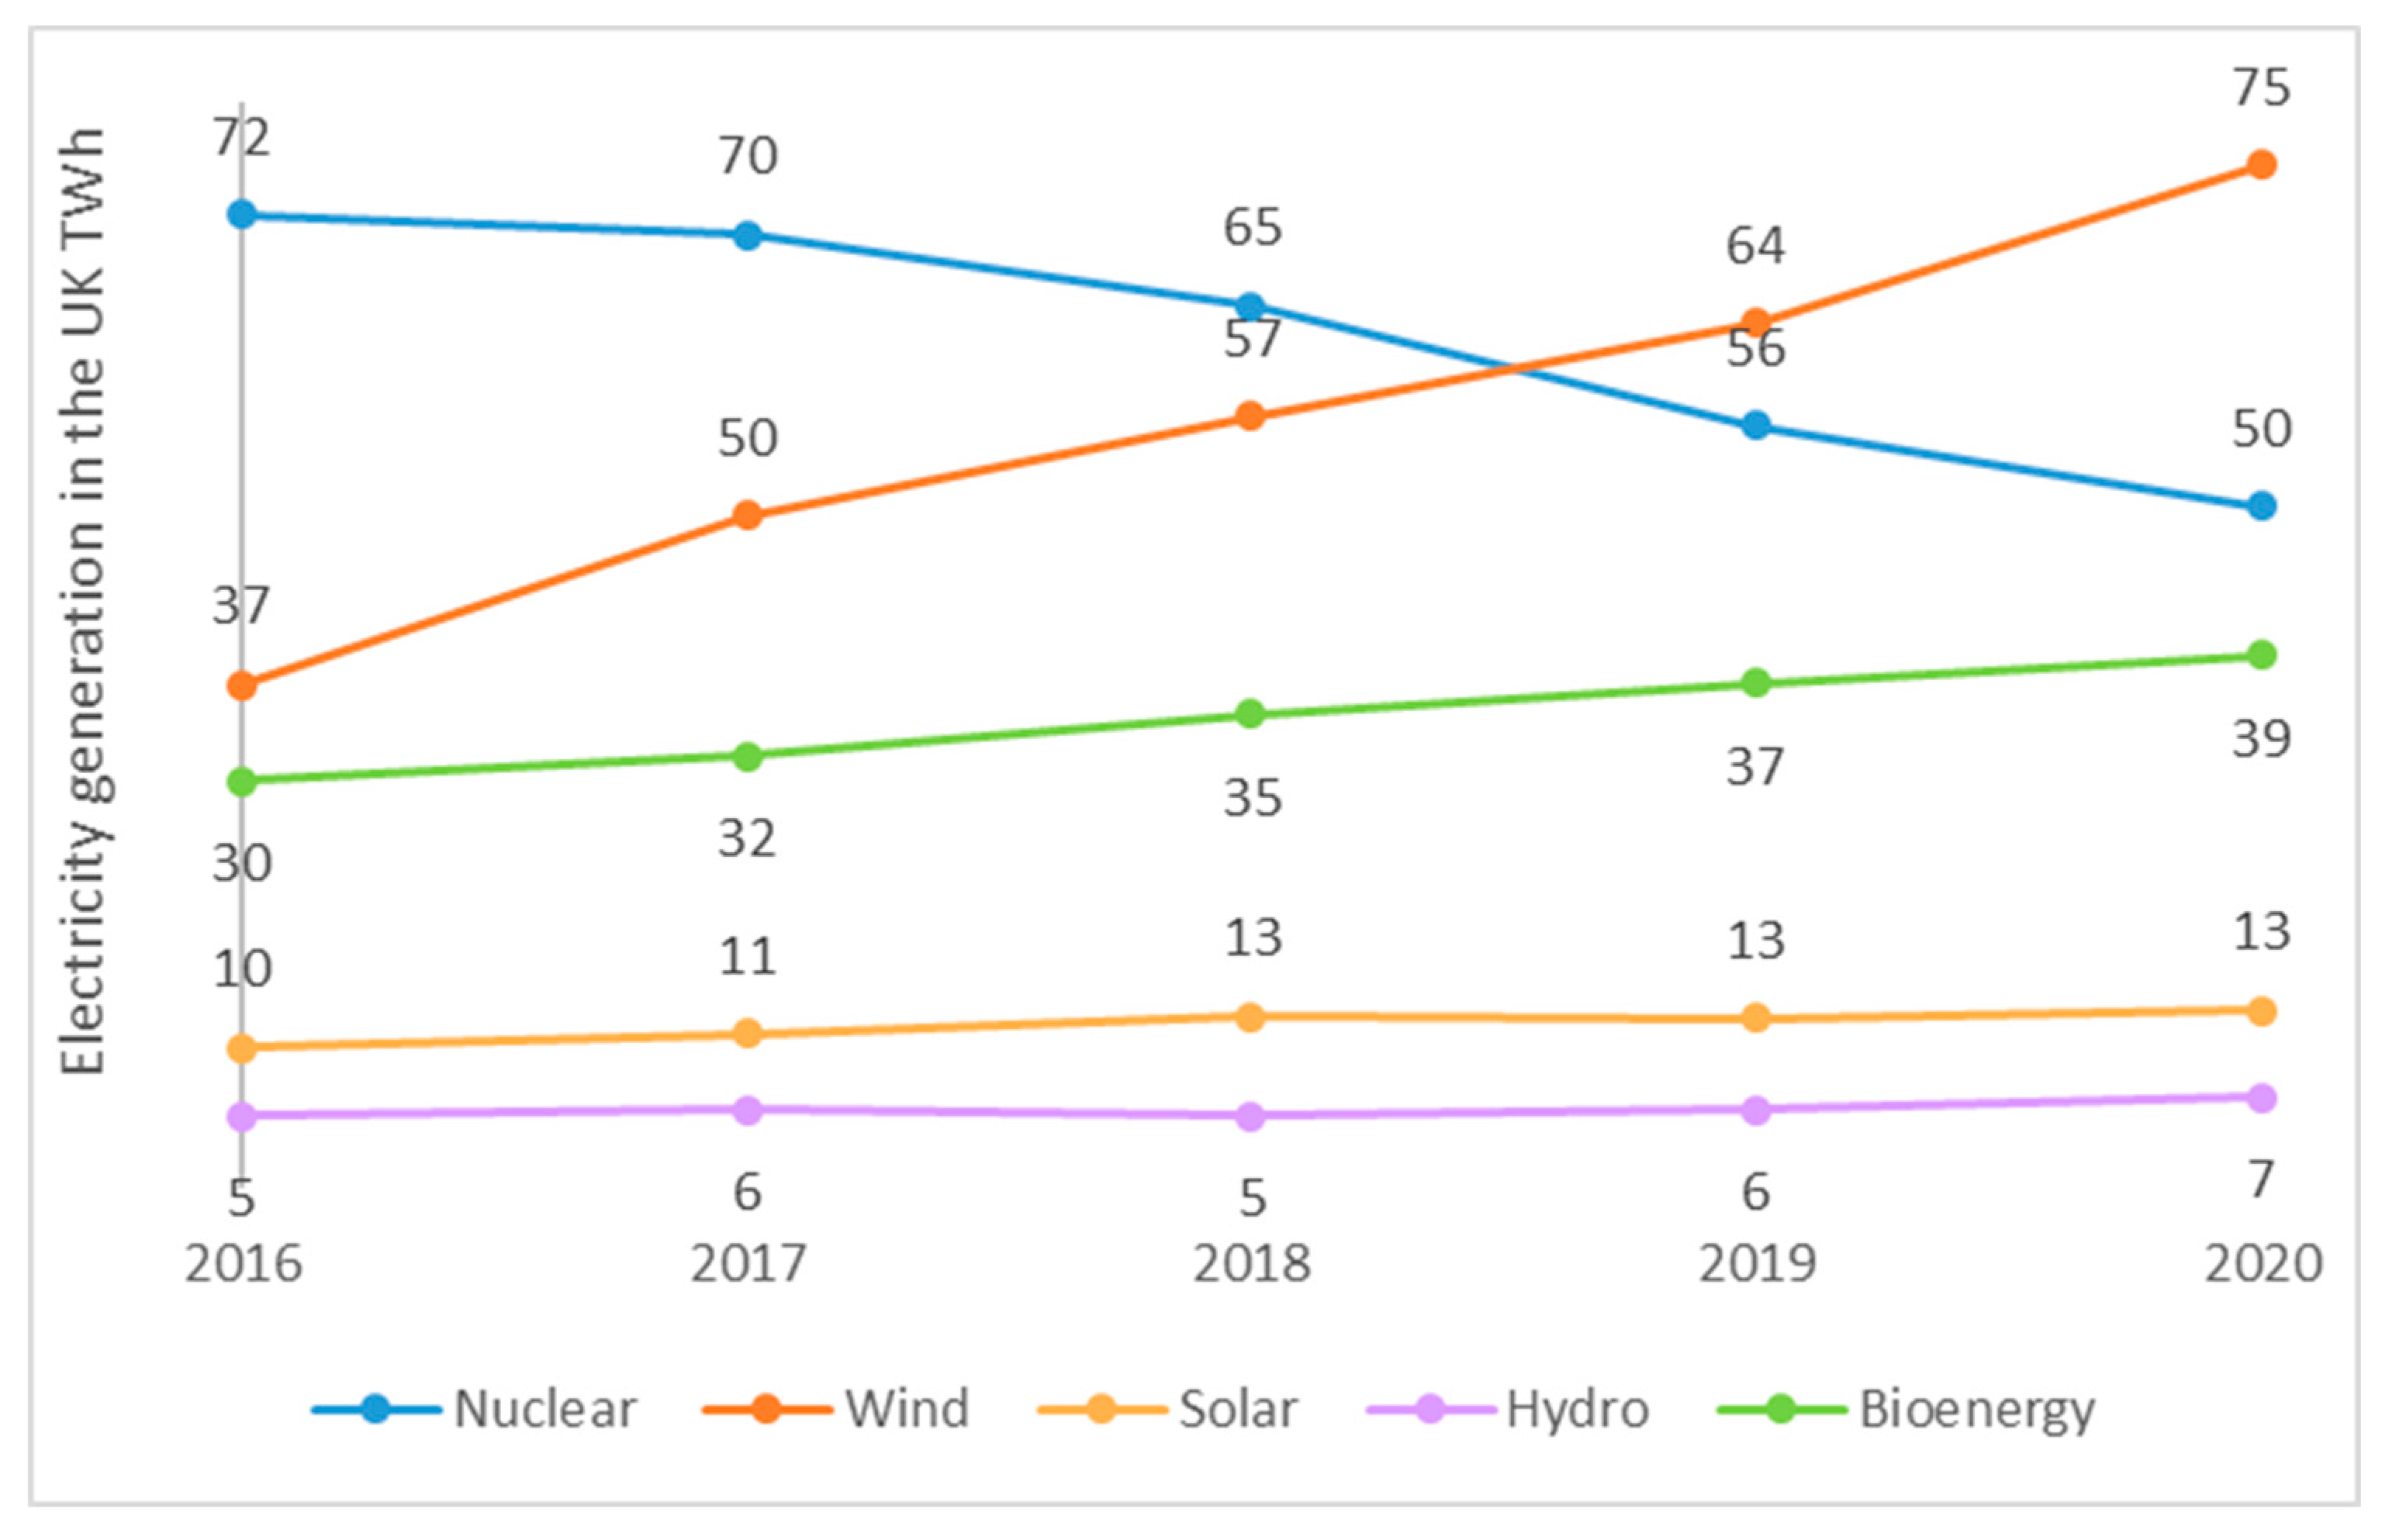
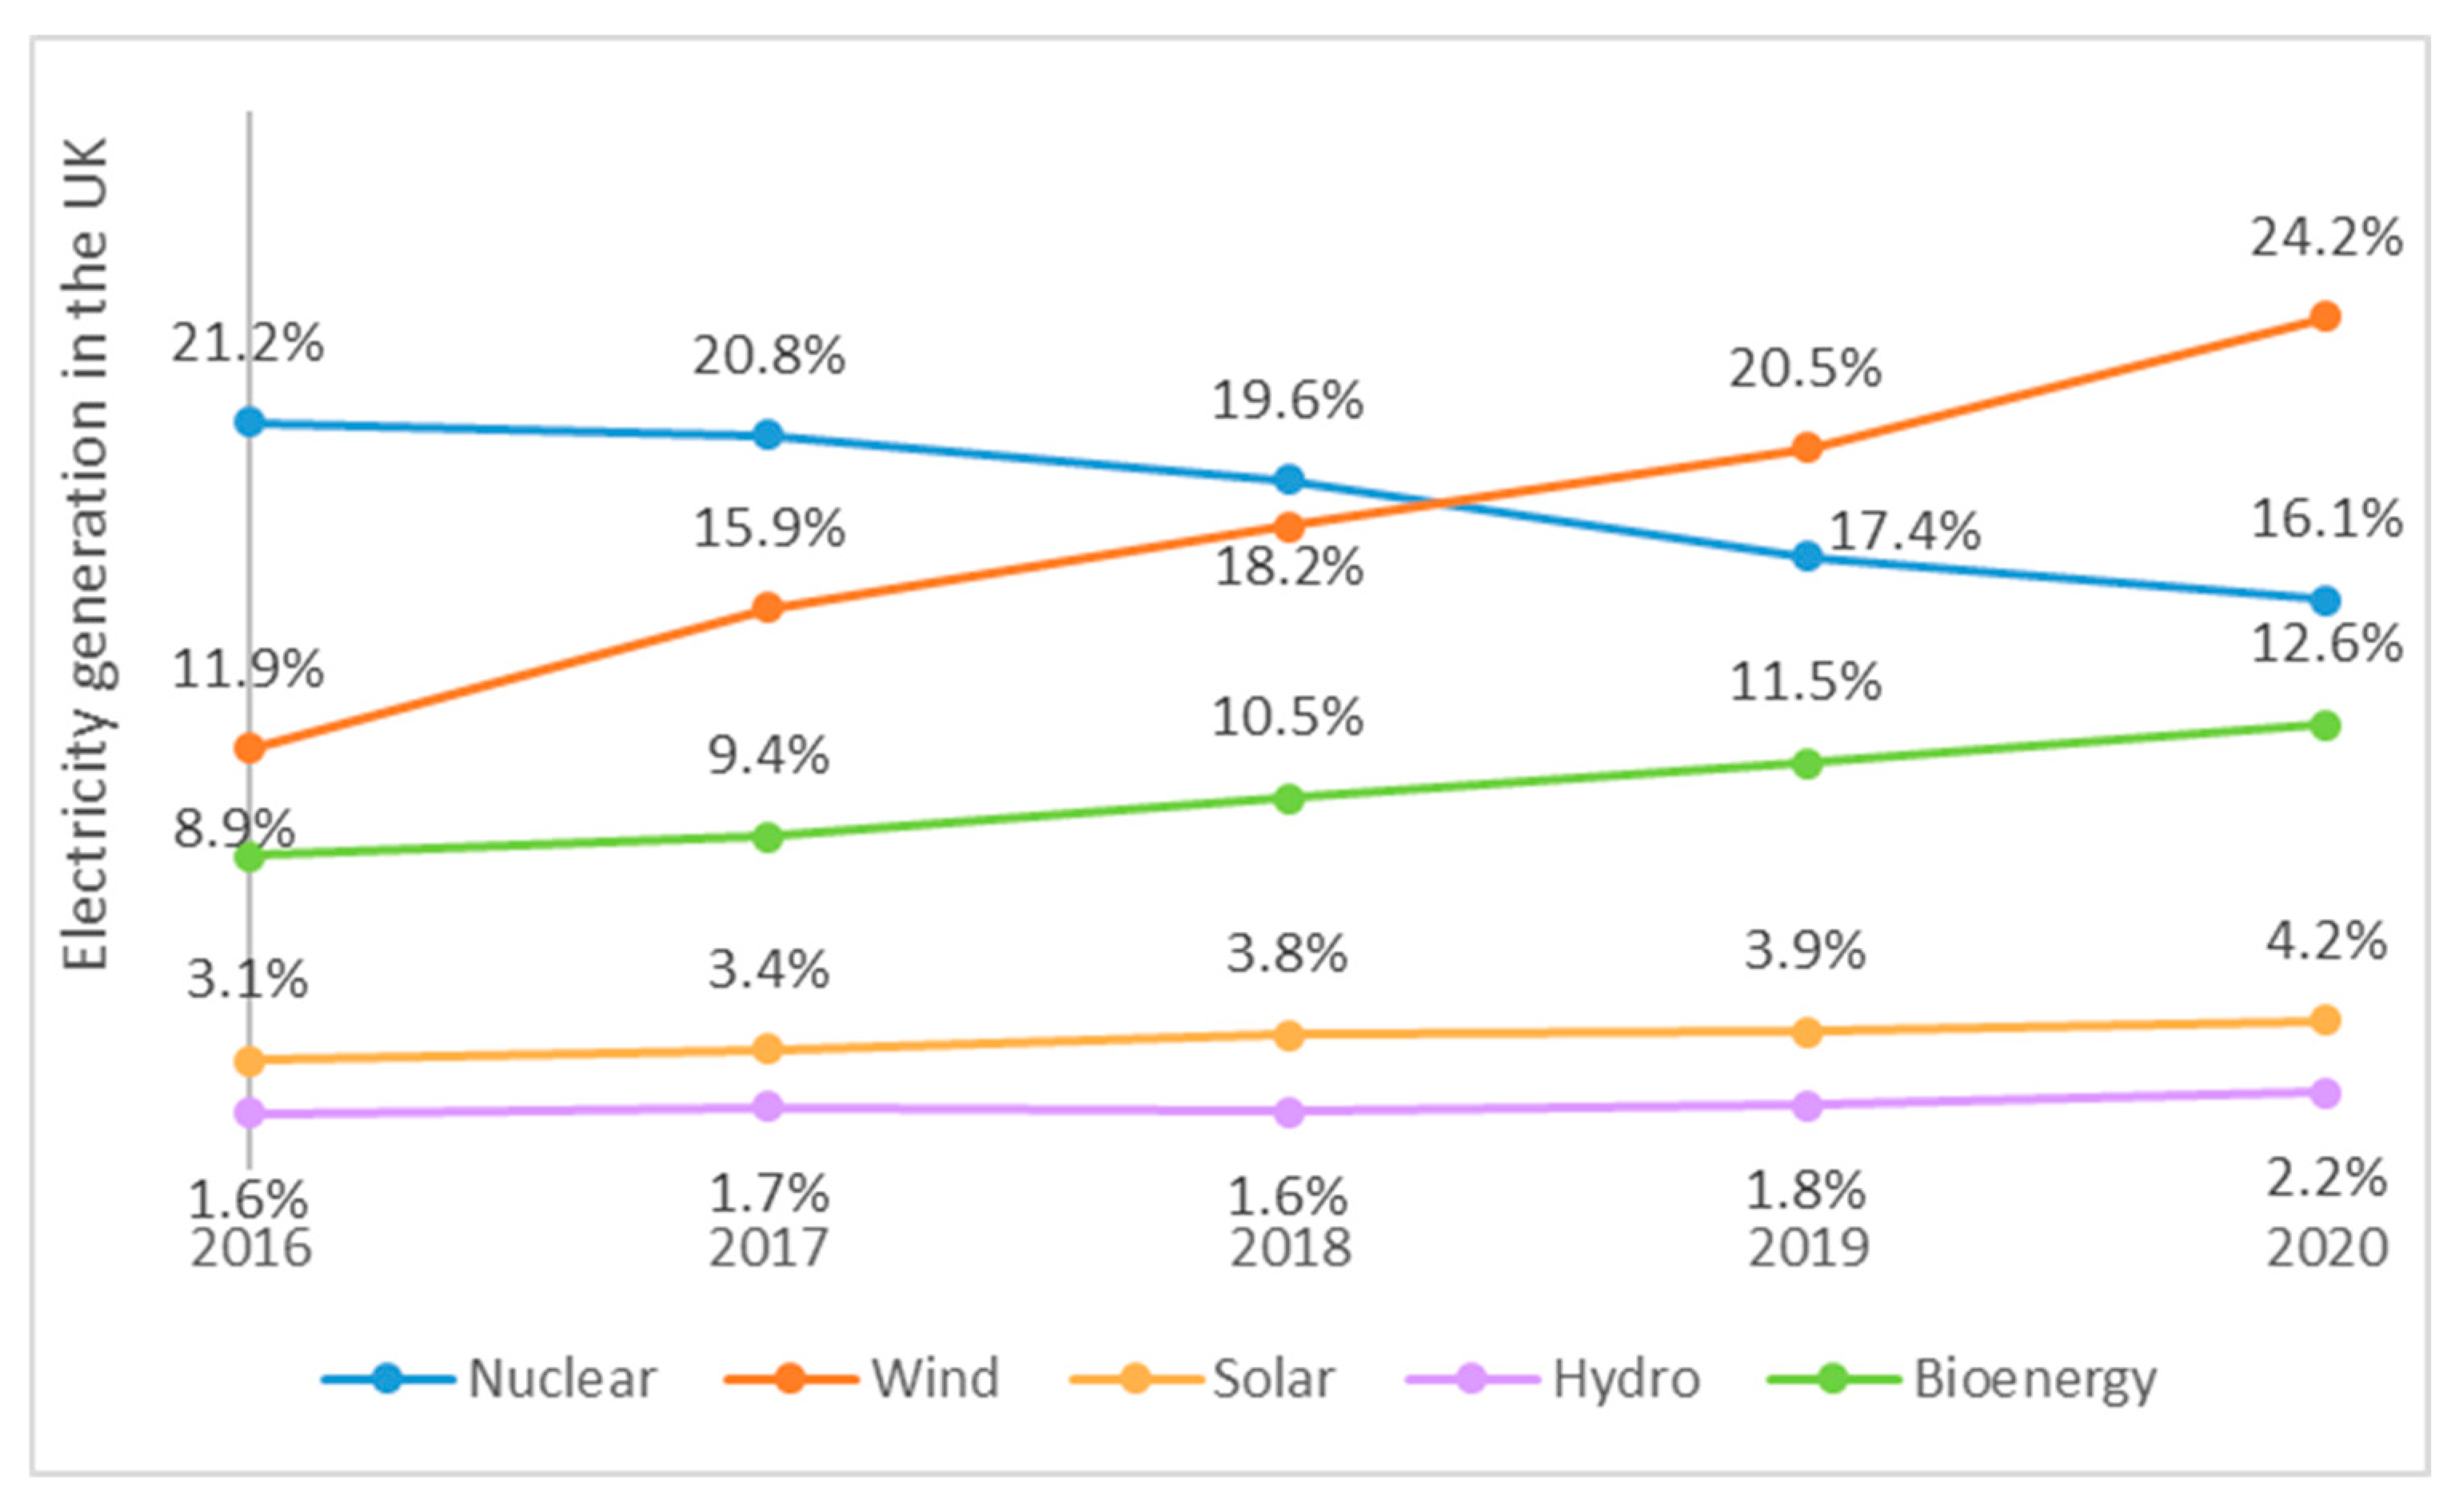
The proportion of the UK electricity generation, present and forecasted, by resource (Table 2). In this case, the proportion of renewables (wind, solar and hydro) would increase to 56% and the proportion of gas would decrease to 18% by 2040 [34]. The contributions shown in Figure 9, are the actual values of the main resources. Thus, the total annual electricity generation in the UK can be obtained from the ratio between TWh and fractional contribution from a resource. Oil, other fossil resources and pumped storage with their aggregated contributions of less than 3% are not presented. The totals in Table 2 do not include their contributions.
(3)
The proportion of gas by the energy of the UK electricity generation is forecasted for the years 2025, 2030, 2035 and 2040 for a non-fossil electricity generation scenario by 2040 (Table 3). In this case, all other resource energy contributions are kept the same [34] thus reducing the totals to as shown in Table 3. The demand reduction is necessary in this case.
(4)
The GWP using the IPCC characterisation factors of coal, gas, solar, bioenergy, wind, nuclear and hydro electricity in the UK (Table 4) [28].
(5)
The other life cycle environmental impact potentials, acidification potential (AP), eutrophication potential (EP) and fossil depletion potential (FDP) using the CML characterisation factors and photochemical oxidant creation potential or urban smog (POCP) using the ILCD characterisation factors of the above technologies in the UK (Table 4) [28].
Table 5 shows the overall avoided GWP by year compared to the year 2000. The GWP is calculated for the various resource energy contributions from the year 2016 through to the year 2020 and for the forecasted years, 2025, 2030, 2035 and 2040. The calculations apply the GWP factors of the various electricity generation systems in Table 4. These GWP factors are multiplied with the proportion of the UK electricity generation, present and forecasted, by resource (Table 2) for their resulting GWP as shown in Table 5. The GWP intensity of the UK electricity system decreases from 336 kt CO2 eq TWh−1 in 2016 to 110 kt CO2 eq TWh−1 in 2040. The percentage of GWP reduction compared to the year 2000 (204,228 kt CO2 eq) varies 46–78% between the years 2016 and 2040. Compared to the GWP in the year 2020, the percentage GWP reduction is 29–34% through to the year 2040. The percentage GWP reduction in the final two rows in Table 5 is calculated for the zero-fossil resource electricity generation scenario in Table 3. The percentage GWP reduction in this scenario (Table 3) is 76–94% and 29–82% compared to the years 2000 and 2020.
The total GWP for the years 2025, 2030, 2035 and 2040 in Table 5 account for a GWP of 20 kt CO2 eq TWh−1 from BESS in addition to the GWP from the electricity generation systems. From Table 4, the GWP of BESS must be less than 0.5 kg CO2 eq kWh−1 (for gas) to achieve an acceptable avoided GWP from defossilization. Also, in the analysis, it must be noted that in zero or non-fossil or defossilization scenarios, only the scope 1 emission from direct fossil burning to generate electricity in the fossil power plant is avoided. The remaining GWP results from other indirect emissions across the systems’ life cycle supply chains (scopes 2–3), which can be from fossil resources. These must be eliminated to hit the net zero target. For example, phosphorous, white, liquid carries the main GWP burden, which if eliminated by recycling phosphorous, can result in an acceptable GWP (4–76 g CO2 eq kWh−1 for renewable energy generation systems) applied in the analysis shown in Table 5.

6. Discussion

This research conducts a rigorous comprehensive life cycle assessment (LCA) of BESS following the ISO14040-44 by taking lithium-ion batteries as an example. The study is to benchmark the global warming potential (GWP) of BESS using a globally standardised life cycle inventory database for lithium-ion batteries using lithium manganese oxide cathode. A literature review of GWP of BESS identifies a lack of consensus approach and standard GWP to target. The literature shows widely varying GWP per kg or kWh energy storage of BESS, by several hundred times. There are some breakthrough results obtained from this benchmarking study. An overall BESS GWP analysis (IPCC 100 years) using the Ecoinvent 3.0 life cycle inventory database and the LCA software SimaPro 9.2.0.1 shows the following transferable results.
  • Allocation at the point of substitution: 6.7 kg CO2 eq per kg of lithium-ion battery
  • Cut-off: 8.1 kg CO2 eq per kg of lithium-ion battery
  • Consequential: 1.7 kg CO2 eq per kg of lithium-ion battery
The ‘allocation at the point of substitution’ method of Ecoinvent 3.0 considers burdens being carried through recycled materials across the supply chains. The ‘cut-off’ method of Ecoinvent 3.0 takes burden-free recycled materials across the supply chains. The ‘consequential’ method of Ecoinvent 3.0 considers the consequences of a change prospectively, hence, in this case, recycling of BESS in futuristic scenarios, where fossil resources may be unavailable or highly constrained. Strikingly, the life cycle hotspot is not due to lithium acquisition but is due to the way phosphorous, white, liquid is produced, which is highly resource-intensive consuming hard coal (1.25 kg kg−1) and electricity (13 kWh kg−1). The intertwined material flows are analysed in-depth to generate insights into the reduction of GWP of BESS. Lithium hexafluorophosphate rather than lithium-ion cathode is the GWP hotspot. The GWP impacts of lithium hexafluorophosphate are primarily due to the impacts of phosphorus, white, liquid via phosphorous chloride. The next level of GWP impacts is due to the lithium-ion cathode, which is due to lithium manganese oxide, which is further due to lithium carbonate and manganese (III) oxide. Lithium carbonate’s GWP is due to lithium brine, 6.7% Li. The anode, graphite has then the next level of GWP, which is due to the copper cathode and graphite anode, respectively, to make the anode, graphite product. The target area of improvement is the phosphorus, white, liquid production (based on the Wöhler process), which is resource-intensive consumes both hard coal and electricity by the highest amounts amongst all materials used up to make the lithium-ion battery. Further areas of improvement include increasing energy density, servicing and recycling of BESS. The other area is the integration of BESS in the context of whole renewable energy systems (both stationary and electric vehicle applications). It is accepted that recycling BESS into grid electricity systems is viable after their life in electric vehicles. Increasing biogenic waste resource recoveries can avoid the issues with lithium resource availability and depletion and phosphate, copper and graphite productions, etc. Phosphate can be recycled/produced from wastewater sludge by microbial electrosynthesis. The UK grid electricity mix data are collected for the years 2016 through to 2020 and forecasted for the years 2025, 2030, 2035 and 2040 to analyse the role of BESS. BESS will be essential for increased renewables in electricity systems. If the above improvement targets for BESS are achieved to lower the GWP of BESS to 0.02 kg CO2 eq kWh−1, the GWP intensity of the UK electricity system could decrease from 336 kt CO2 eq TWh−1 in 2016 to 110 kt CO2 eq TWh−1 in 2040. The percentage of GWP reduction compared to the year 2000 (204,228 kt CO2 eq) varies 46–78% between the years 2016 and 2040. Compared to the GWP in the year 2020, the percentage GWP reduction is 29–34% through to the year 2040. The percentage GWP reduction in the scenario with only renewables in the UK electricity system is 76–94% and 29–82% from 2000 and 2020.

Author Contributions

Conceptualization, methodology, software, validation, formal analysis, investigation, resources, data curation, writing—original draft preparation, J.S.; Project initialization, M.C. Both authors have read and agreed to the published version of the manuscript.

Funding

This research was funded by the University of Surrey SME Voucher UKRI CoA RN0450 and the Newton Fund Impact Scheme 540821111.

Institutional Review Board Statement

Not applicable.

Informed Consent Statement

Not applicable.

Data Availability Statement

Not applicable.

Conflicts of Interest

The authors declare no conflict of interest.

References

  1. World Energy Outlook. 2018. Available online: https://www.iea.org/weo/ (accessed on 10 August 2021).
  2. Available online: https://assets.publishing.service.gov.uk/government/uploads/system/uploads/attachment_data/file/1006712/DUKES_5.6.xls (accessed on 10 August 2021).
  3. Gür, T.M. Review of electrical energy storage technologies, materials and systems: Challenges and prospects for large-scale grid storage. Energy Environ. Sci. 2018, 11, 2696–2767. [Google Scholar] [CrossRef]
  4. Mohamad, F.; Teh, J.; Lai, C.M.; Chen, L.R. Development of energy storage systems for power network reliability: A review. Energies 2018, 11, 2278. [Google Scholar] [CrossRef] [Green Version]
  5. Sabishchenko, O.; Rębilas, R.; Sczygiol, N.; Urbański, M. Ukraine energy sector management using hybrid renewable energy systems. Energies 2020, 13, 1776. [Google Scholar] [CrossRef] [Green Version]
  6. Balducci, P.J.; Alam, M.J.E.; Hardy, T.D.; Wu, D. Assigning value to energy storage systems at multiple points in an electrical grid. Energy Environ. Sci. 2018, 11, 1926–1944. [Google Scholar] [CrossRef] [Green Version]
  7. Hammond, G.P.; Hazeldine, T. Indicative energy technology assessment of advanced rechargeable batteries. Appl. Energy 2015, 138, 559–571. [Google Scholar] [CrossRef] [Green Version]
  8. Thomas, S.; Jung, H.; Kim, S.; Jun, B.; Lee, C.H.; Lee, S.U. Two-dimensional haeckelite h567: A promising high capacity and fast Li diffusion anode material for lithium-ion batteries. Carbon 2019, 148, 344–353. [Google Scholar] [CrossRef]
  9. Dunn, B.; Kamath, H.; Tarascon, J.M. Electrical energy storage for the grid: A battery of choices. Science 2011, 334, 928–935. [Google Scholar] [CrossRef] [Green Version]
  10. Denholm, P.; Kulcinski, G.L. Life cycle energy requirements and greenhouse gas emissions from large scale energy storage systems. Energy Conv. Manag. 2004, 45, 2153–2172. [Google Scholar] [CrossRef]
  11. Tolomeo, R.; De Feo, G.; Adami, R.; Sesti Osséo, L. Application of life cycle assessment to lithium ion batteries in the automotive sector. Sustainability 2020, 12, 4628. [Google Scholar] [CrossRef]
  12. Raugei, M.; Winfield, P. Prospective LCA of the production and EoL recycling of a novel type of Li-ion battery for electric vehicles. J. Clean. Prod. 2019, 213, 926–932. [Google Scholar] [CrossRef] [Green Version]
  13. Jones, C.; Gilbert, P.; Stamford, L. Assessing the climate change mitigation potential of stationary energy storage for electricity grid services. Environ. Sci. Technol. 2019, 54, 67–75. [Google Scholar] [CrossRef]
  14. McManus, M.C. Environmental consequences of the use of batteries in low carbon systems: The impact of battery production. Appl. Energy 2012, 93, 288–295. [Google Scholar] [CrossRef] [Green Version]
  15. Smith, L.; Ibn-Mohammed, T.; Astudillo, D.; Brown, S.; Reaney, I.M.; Koh, S.L. The Role of Cycle Life on the Environmental Impact of Li6.4La3Zr1.4Ta0.6O12 based Solid-State Batteries. Adv. Sustain. Syst. 2021, 5, 2000241. [Google Scholar] [CrossRef]
  16. Ahmadi, L.; Young, S.B.; Fowler, M.; Fraser, R.A.; Achachlouei, M.A. A cascaded life cycle: Reuse of electric vehicle lithium-ion battery packs in energy storage systems. Int. J. Life Cycle Assess. 2017, 22, 111–124. [Google Scholar] [CrossRef]
  17. Kamran, M.; Raugei, M.; Hutchinson, A. A dynamic material flow analysis of lithium-ion battery metals for electric vehicles and grid storage in the UK: Assessing the impact of shared mobility and end-of-life strategies. Resour. Conserv. Recycl. 2021, 167, 105412. [Google Scholar] [CrossRef]
  18. Zhao, S.; You, F. Comparative life-cycle assessment of Li-ion batteries through process-based and integrated hybrid approaches. ACS Sustain. Chem. Eng. 2019, 7, 5082–5094. [Google Scholar] [CrossRef]
  19. Yu, Y.; Chen, B.; Huang, K.; Wang, X.; Wang, D. Environmental impact assessment and end-of-life treatment policy analysis for Li-ion batteries and Ni-MH batteries. Int. J. Environ. Res. Pub. Health 2014, 11, 3185–3198. [Google Scholar] [CrossRef] [PubMed]
  20. Sadhukhan, J. Analysing Life Cycle Climate Change Impact Savings by Battery Energy Storage Systems in The UK. SME Voucher Project Thesis, The University of Surrey, Surrey, UK, 2019. [Google Scholar]
  21. Chowdhury, J.I.; Balta-Ozkan, N.; Goglio, P.; Hu, Y.; Varga, L.; McCabe, L. Techno-environmental analysis of battery storage for grid level energy services. Ren. Sustain. Energy Rev. 2020, 131, 110018. [Google Scholar] [CrossRef]
  22. ISO 14040: Environmental Management–Life Cycle Assessment–Principles and Framework; International Standard Organization: Geneva, Switzerland, 2006.
  23. ISO 14041: Environmental Management–Life Cycle Assessment–Goal and Scope Definition and Inventory Analysis; International Standard Organization: Geneva, Switzerland, 1998.
  24. ISO 14042: Environmental Management–Life Cycle Assessment–Life Cycle Impact Assessment; International Standard Organization: Geneva, Switzerland, 2000.
  25. ISO 14043: Environmental Management–Life Cycle Assessment–Life Cycle Interpretation; International Standard Organization: Geneva, Switzerland, 2000.
  26. ISO 14044: Environmental Management–Life Cycle Assessment–Requirements and Guidelines; International Standard Organization: Geneva, Switzerland, 2006.
  27. Sadhukhan, J.; Ng, K.S.; Martinez-Hernandez, E. Biorefineries and Chemical Processes: Design, Integration and Sustainability Analysis; Wiley: Chichester, UK, 2014; Available online: https://onlinelibrary.wiley.com/doi/book/10.1002/9781118698129 (accessed on 10 August 2021).
  28. Sadhukhan, J.; Sen, S.; Gadkari, S. The Mathematics of life cycle sustainability assessment. J. Clean. Prod. 2021, 309, 127457. [Google Scholar] [CrossRef]
  29. Shemfe, M.B.; Gadkari, S.; Sadhukhan, J. Social hotspot analysis and trade policy implications of the use of bioelectrochemical systems for resource recovery from wastewater. Sustainability 2018, 10, 3193. [Google Scholar] [CrossRef] [Green Version]
  30. Gadkari, S.; Beigi, B.H.M.; Aryal, N.; Sadhukhan, J. Microbial electrosynthesis: Is it sustainable for bioproduction of acetic acid? RSC Adv. 2021, 11, 9921–9932. [Google Scholar] [CrossRef]
  31. Gadkari, S.; Gu, S.; Sadhukhan, J. Two-dimensional mathematical model of an air-cathode microbial fuel cell with graphite fiber brush anode. J. Power Sourc. 2019, 441, 227145. [Google Scholar] [CrossRef]
  32. Sadhukhan, J.; Dugmore, T.I.; Matharu, A.; Martinez-Hernandez, E.; Aburto, J.; Rahman, P.K.; Lynch, J. Perspectives on “game changer” global challenges for sustainable 21st century: Plant-based diet, unavoidable food waste biorefining, and circular economy. Sustainability 2020, 12, 1976. [Google Scholar] [CrossRef] [Green Version]
  33. Sadhukhan, J.; Gadkari, S.; Martinez-Hernandez, E.; Ng, K.S.; Mobolaji, S.; Torres-Garcia, E.; Lynch, J. Novel macroalgae (seaweed) biorefinery systems for integrated chemical, protein, salt, nutrient and mineral extractions and environmental protection by green synthesis and life cycle sustainability assessments. Green Chem. 2019, 21, 2635–2655. [Google Scholar] [CrossRef]
  34. Available online: https://assets.publishing.service.gov.uk/government/uploads/system/uploads/attachment_data/file/931323/updated-energy-and-emissions-projections-2019.pdf (accessed on 10 August 2021).
Figure 1. Service provisions of energy storage systems.
Energies 14 05555 g001
Figure 2. Activities and materials involved in the life cycle of BESS.
Energies 14 05555 g002
Figure 3. Percentage life cycle energy storage and saving by BESS in various services in a whole distributed energy system.
Energies 14 05555 g003
Figure 4. Results of GWP hotspot analysis of BESS.
Energies 14 05555 g004
Figure 5. ReCiPe (M) (H) life cycle impact characterisations of 1 kg of each key material shown in Table 1. 1,4 DCB: 1,4-dichlorobenzene. CFC11: chlorofluorocarbon. GLO: global. RoW, rest of the world and CH: Switzerland in Ecoinvent.
Energies 14 05555 g005
Figure 6. CML life cycle impact characterisations of 1 kg of each key material shown in Table 1.
Energies 14 05555 g006
Figure 7. ILCD life cycle impact characterisations of 1 kg of each key material shown in Table 1. CTU: comparative toxic units. NMVOC: non-methane volatile organic compound.
Energies 14 05555 g007
Figure 8. GWP of material productions in the entire system to show the contributing materials.
Energies 14 05555 g008
Figure 9. The UK electricity generation by alternative resource (both TWh (top) and percentage (bottom) per annum) from 2016 through to 2020 [2].
Energies 14 05555 g009aEnergies 14 05555 g009b
Table 1. Life cycle inventory of Li-ion battery (Ecoinvent 3.0: Battery, Li-ion, rechargeable, prismatic {GLO}| production). * shows which system is further expanded for the life cycle inventory—these systems are chosen to show the life cycle impact hotspot later on.
Basis: Li-Ion Battery1kg
* Battery cell, Li-ion0.8kg
Cable (data cable in infrastructure)0.37m
Cable (three-conductor cable)0.025m
Printed wiring board (Pb)0.001kg
Printed wiring board (Pb-free)0.002kg
Reinforcing steel0.15kg
Sheet rolling0.15kg
Electricity0.108kWh
Battery recycling (pyrometallurgical)0.5kg
Battery recycling (hydrometallurgical)0.5kg
Basis: Battery cell, Li-ion1kg
Aluminium, wrought alloy 0.016kg
* Graphite anode0.4kg
Battery separator0.054kg
* Lithium-ion cathode0.33kg
Ethylene carbonate0.16kg
Plastic film extruded0.07kg
* Lithium hexafluorophosphate 0.019kg
Liquid nitrogen0.01kg
Low density polyethylene0.07kg
Sheet rolling0.016kg
Electricity0.106kWh
Heat0.065MJ
Basis: Graphite anode1kg
Carbon black0.015855kg
Copper0.52414kg
Graphite0.49414kg
Latex0.018497kg
Sheet rolling0.52414kg
Sulfuric acid0.080763kg
Deionised water0.42369kg
Electricity0.002kWh
Heat1.2163MJ
Basis: Lithium-ion cathode1kg
Aluminium0.39kg
Carbon black0.026kg
* Lithium manganese oxide0.62kg
Sheet rolling0.39kg
Sodium hydroxide0.13kg
Deionised water0.2kg
Electricity0.002kWh
Heat0.65MJ
Basis: Lithium manganese oxide1kg
* Lithium carbonate0.21kg
Manganese(III) oxide0.92kg
Liquid nitrogen0.79kg
Liquid oxygen0.7kg
Deionised water3.4kg
Electricity0.005kWh
Heat15.3MJ
Basis: Lithium carbonate1kg
Activated bentonite0.014kg
Hydrochloric acid0.04kg
* Lithium brine, 6.7% Li4.2kg
Quicklime0.07kg
Soda ash2.12kg
Sodium hydroxide0.0002kg
Sulfuric acid 0.025kg
Electricity0.6kWh
Heat2.96MJ
Basis: Lithium brine, 6.7% Li1kg
* Lithium0.0667kg
Heat0.1407MJ
Electricity0.00714kWh
Basis: Lithium hexafluorophosphate1kg
Hydrogen fluoride4.04kg
Hydrated lime7.44kg
Lithium fluoride0.2kg
Liquid nitrogen0.001kg
* Phosphorus pentachloride2kg
Water4.3kg
Electricity0.5kWh
Basis: Phosphorus pentachloride1kg
Liquid chlorine0.36kg
* Phosphorous chloride0.7kg
Electricity0.002kWh
Heat0.087MJ
Basis: Phosphorous chloride1kg
Liquid chlorine0.79kg
* Phosphorus, white, liquid0.226kg
Electricity0.333kWh
Basis: Phosphorus, white, liquid1kg
Hard coal1.25kg
Phosphate26.2931kg
Electricity13kWh
Table 2. The proportion of the UK electricity generation, present and forecasted, by resource [34].
TWh Electricity Generation201620172018201920202025203020352040
Coal312317760000
Gas14313713113211180736865
Nuclear727065565056657080
Hydro565677777
Wind3750576475116156175200
Solar101113131316202325
Bioenergy303235373939393939
Total329328323315301315360382416
Table 3. The proportion of gas by the energy of the UK electricity generation forecasted for the years 2025, 2030, 2035 and 2040 for defossilised electricity by 2040.
TWh Electricity Generation2025203020352040
Gas804490
Total315331323351
Table 4. The GWP (IPCC characterisation factors), acidification potential (AP), eutrophication potential (EP) and fossil depletion potential (FDP) (CML characterisation factors) and photochemical oxidant creation potential or urban smog (POCP) (ILCD characterisation factors) of coal, gas, solar, bioenergy, wind, nuclear and hydro electricity in the UK extracted from [28].
Basis: 1 TWh Electricity GenerationCoalGasSolarBioenergyWindNuclearHydro
GWPIPCC kt CO2 eq1057514766221124
APCML kt SO2 eq7.130.30.441.340.230.060.02
POCPILCD kt NMVOC eq3.130.590.31.750.110.050.02
EPCML kt phosphate eq2.190.080.180.460.110.050.01
FDPCML TWh3.322.120.240.210.060.040.01
Table 5. GWP and avoided GWP by year of the UK electricity system.
kt CO2 eq201620172018201920202025203020352040
Coal32,41723,81517,791735058180000
Gas73,68570,28767,58667,81357,27641,12037,52234,95233,410
Bioenergy186419772168231324372418241824182418
Wind78010421195134015832443328236754200
Solar79087196395610001250149117331900
Nuclear861844781674603672780840960
Hydro212422232728282828
Total110,41898,86090,50580,46968,74448,82147,27445,83645,650
kt CO2 eq TWh−1336301280256228155131120110
% GWP reduction based on the year 2000465256616676777878
% GWP reduction based on the year 2020 29313334
% GWP reduction for zero-fossil electricity by 2040 based on 2000 76849294
% GWP reduction for zero-fossil electricity by 2040 based on 2020 29537782
Publisher’s Note: MDPI stays neutral with regard to jurisdictional claims in published maps and institutional affiliations.

