Article

Self-Oscillating Boost Converter of Wiegand Pulse Voltage for Self-Powered Modules

1
Electrical and Computer Engineering, Yokohama National University, Yokohama 240-8501, Japan
2
Department of Electrical, Management and Mechanical Engineering, University of Udine, 33100 Udine, Italy
*
Author to whom correspondence should be addressed.
Energies 2021, 14(17), 5373; https://doi.org/10.3390/en14175373
Submission received: 2 July 2021 / Revised: 18 August 2021 / Accepted: 25 August 2021 / Published: 29 August 2021
(This article belongs to the Special Issue Advanced Energy Harvesting Technologies)

Abstract

:
This paper introduces a new method of electricity generation using a Wiegand sensor. The Wiegand sensor consists of a magnetic wire and a pickup coil wound around it. This sensor generates a pulse voltage of approximately 5 V and 20 µs width as an induced voltage in the pickup coil. The aim of this study is to generate a DC voltage of 5 V from the sensor, which is expected to be used as a power source in self-powered devices and battery-less modules. We report on the design and verification of a self-oscillating boost converter circuit in this paper. A DC voltage obtained by rectifying and smoothing the pulse voltage generated from the Wiegand sensor was boosted by the circuit. A stable DC output voltage in the order of 5 V for use as a power supply in electronics modules was successfully obtained. A quantitative analysis of the power generated by the Wiegand sensor revealed a suitable voltage-current range for application in self-powered devices and battery-less modules.

1. Introduction

In the Internet of Things (IoT) society, electronic devices and modules can be connected to the internet and exchange information through various sensors [1]. These are generally called IoT devices. The number of IoT devices is increasing rapidly and is expected to reach 80–120 billion by 2025 [2]. A significant number of batteries that need expensive and time-consuming maintenance are required for these devices, which also cause environmental pollution. Energy harvesting, such as collecting small amounts of energy from the surroundings and converting them into electrical energy, is expected to solve this problem [3,4]. Energy from the surrounding environment, if available, can continuously supply electrical power, and thus, be used as an independent power source for long periods of time, without replacing the power harness and battery. With developments in miniaturization and energy-saving approaches, low-power power supplies can gradually satisfy the many requirements of IoT devices [5]. This research introduces the use of a self-oscillating boost converter circuit for electricity generation using a Wiegand sensor [6,7] as an energy-harvesting element.
The Wiegand sensor generates pulse voltages that do not depend on the frequency of the external magnetic field [8]. These pulse voltages are generated with a constant intensity, even under ultra-slow changes in the magnetic field. Therefore, the Wiegand sensor has attracted significant attention as a power supply for the battery-less operation of electronic devices and for energy harvesting [9]. The contribution of this research involves the development of a DC power supply for electronic devices and modules using the Wiegand sensor. It is essential to build a DC power supply of 5 V because it can be used for multiple IoT devices. The power generated by the Wiegand sensor is in the order of 1 mW, even when the frequency of the applied magnetic field is as low as 1 kHz [8]. In this study, we designed and verified a self-oscillating boost converter circuit [10,11,12] connected to the Wiegand sensor as a power generator. DC power generation of 5 V was realized using the Wiegand sensor; this may not be achievable using other methods under an excitation frequency of 1 kHz.
The remainder of this paper is organized as follows: Following the introduction of the Wiegand sensor and its pulse generation in Section 2, the circuits for DC conversion of the pulse voltage and the self-oscillating boost converter are presented in Section 3. In Section 4, we present the circuit properties of the self-oscillating boost converter connected to the Wiegand sensor, derived both experimentally and through simulations. Finally, the conclusions of this study are presented in Section 5.

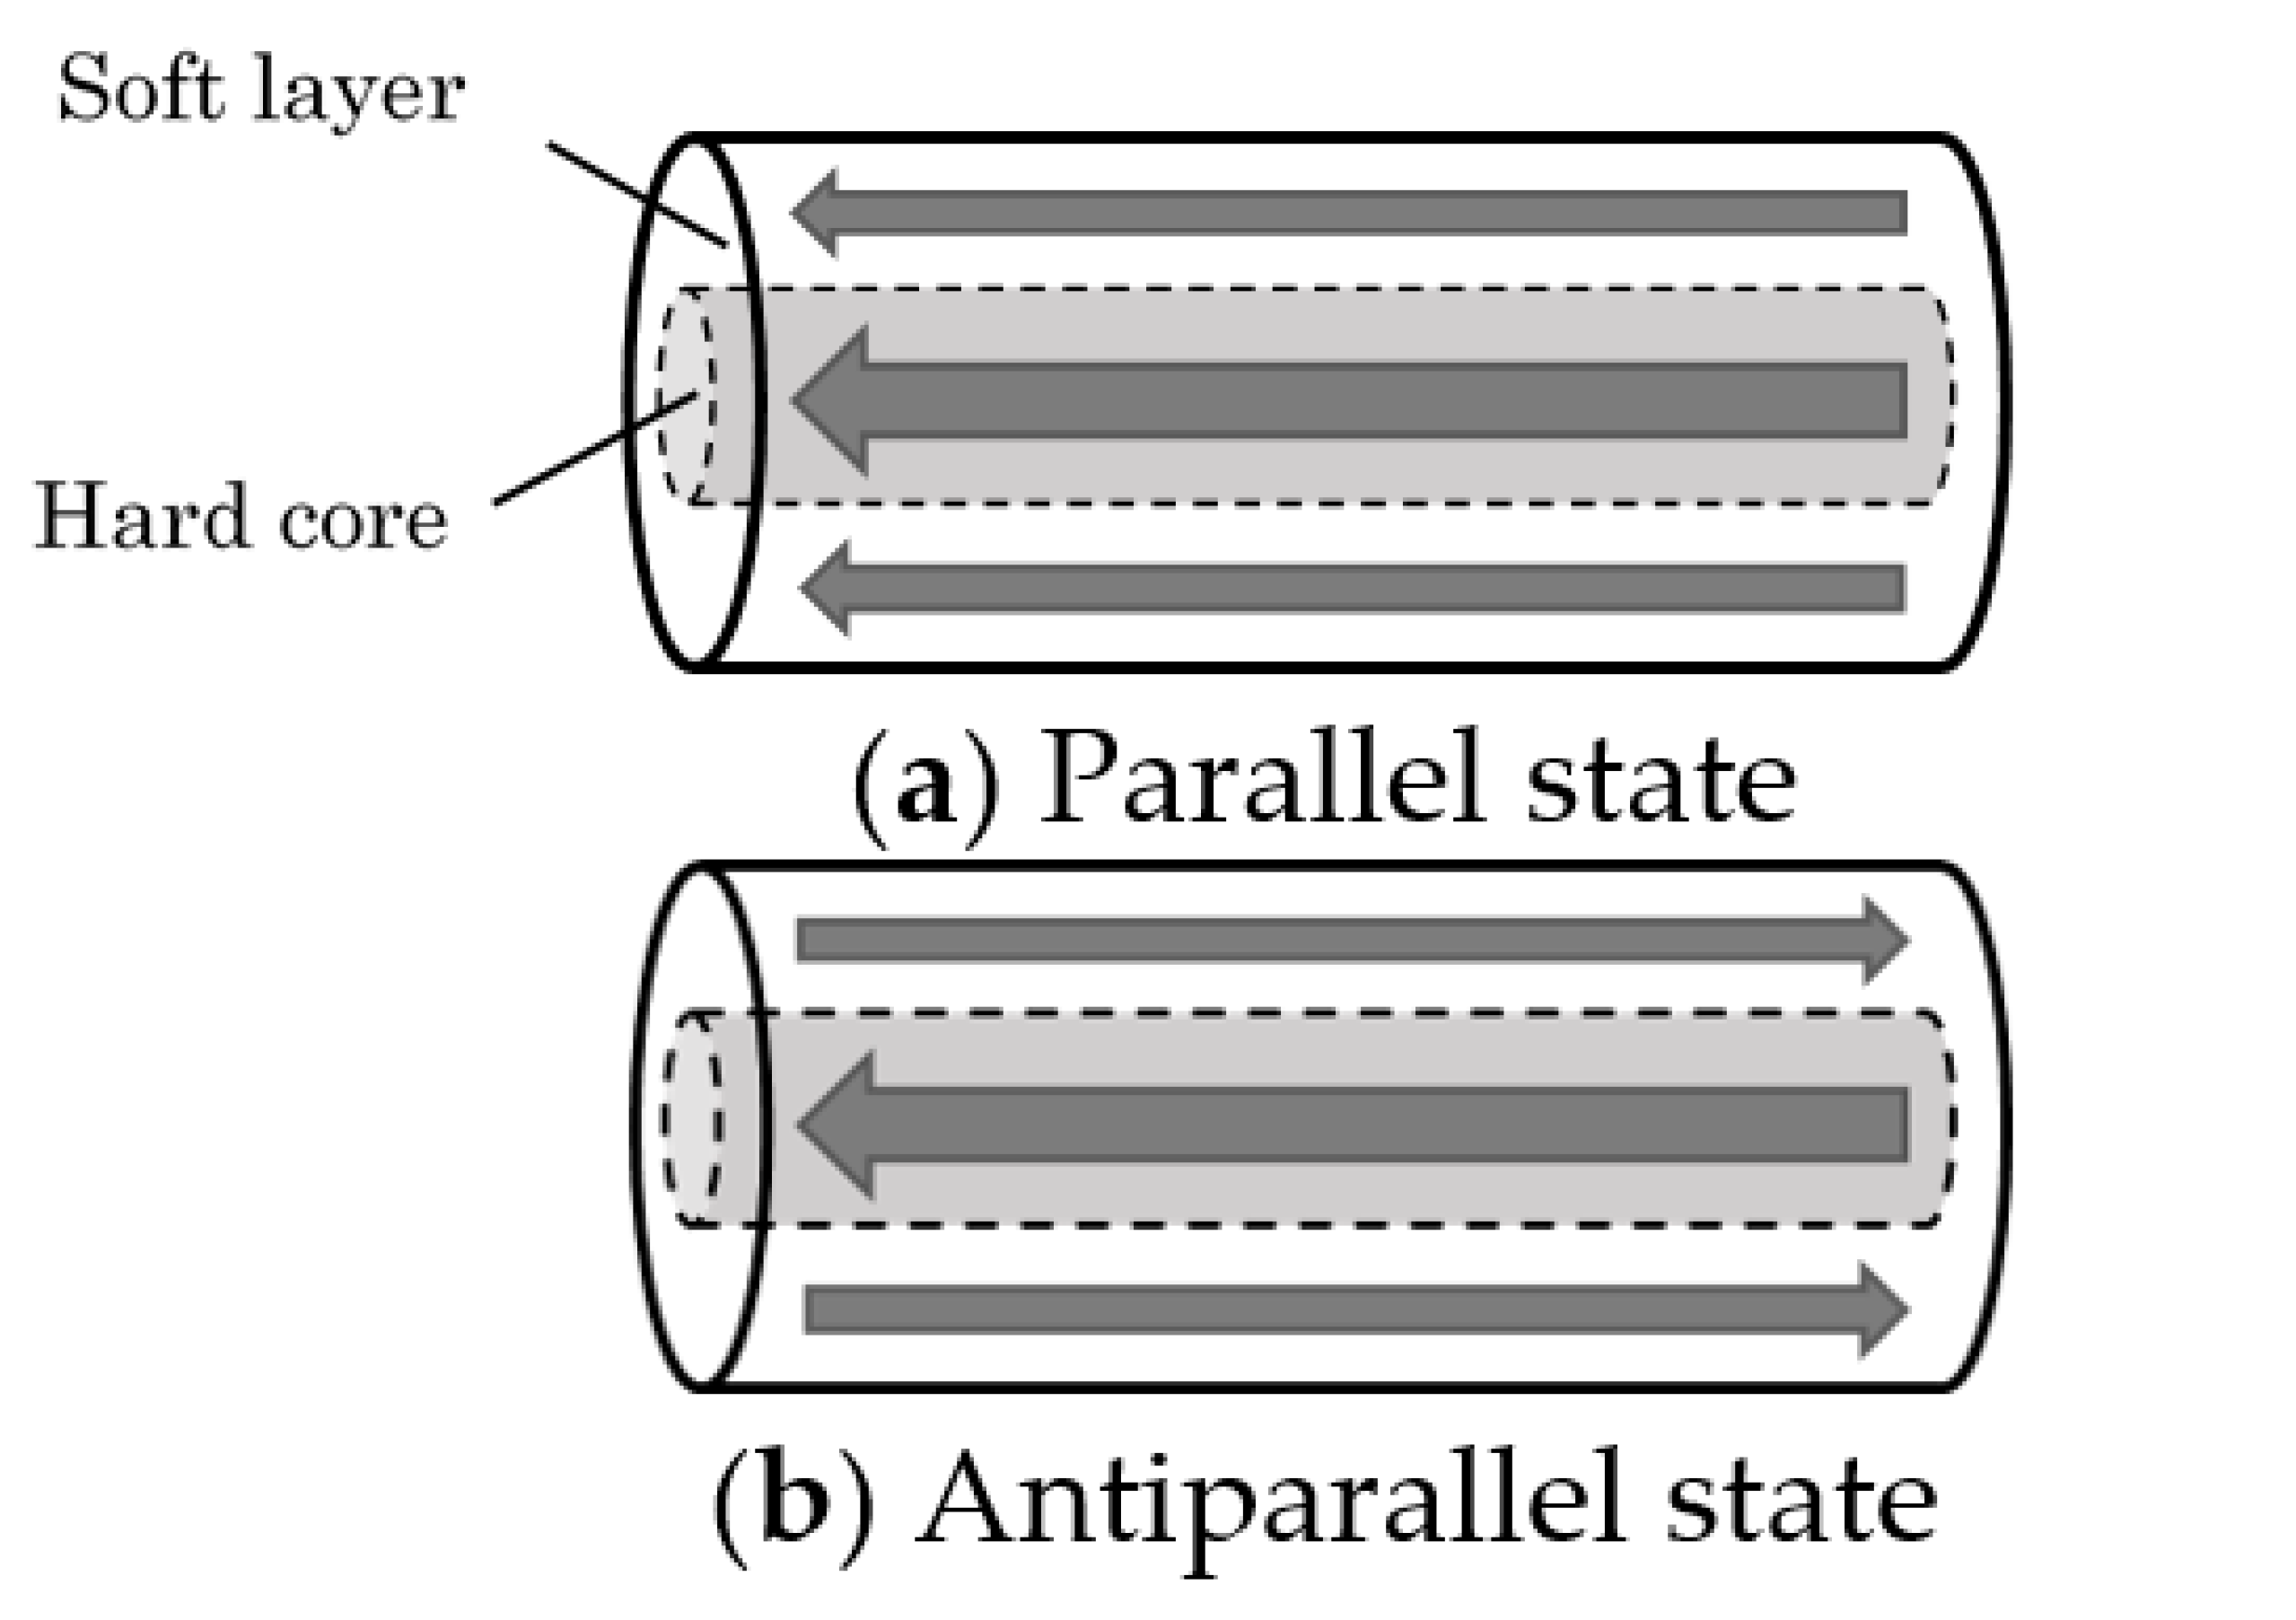
2. Wiegand Sensor as a Voltage Source

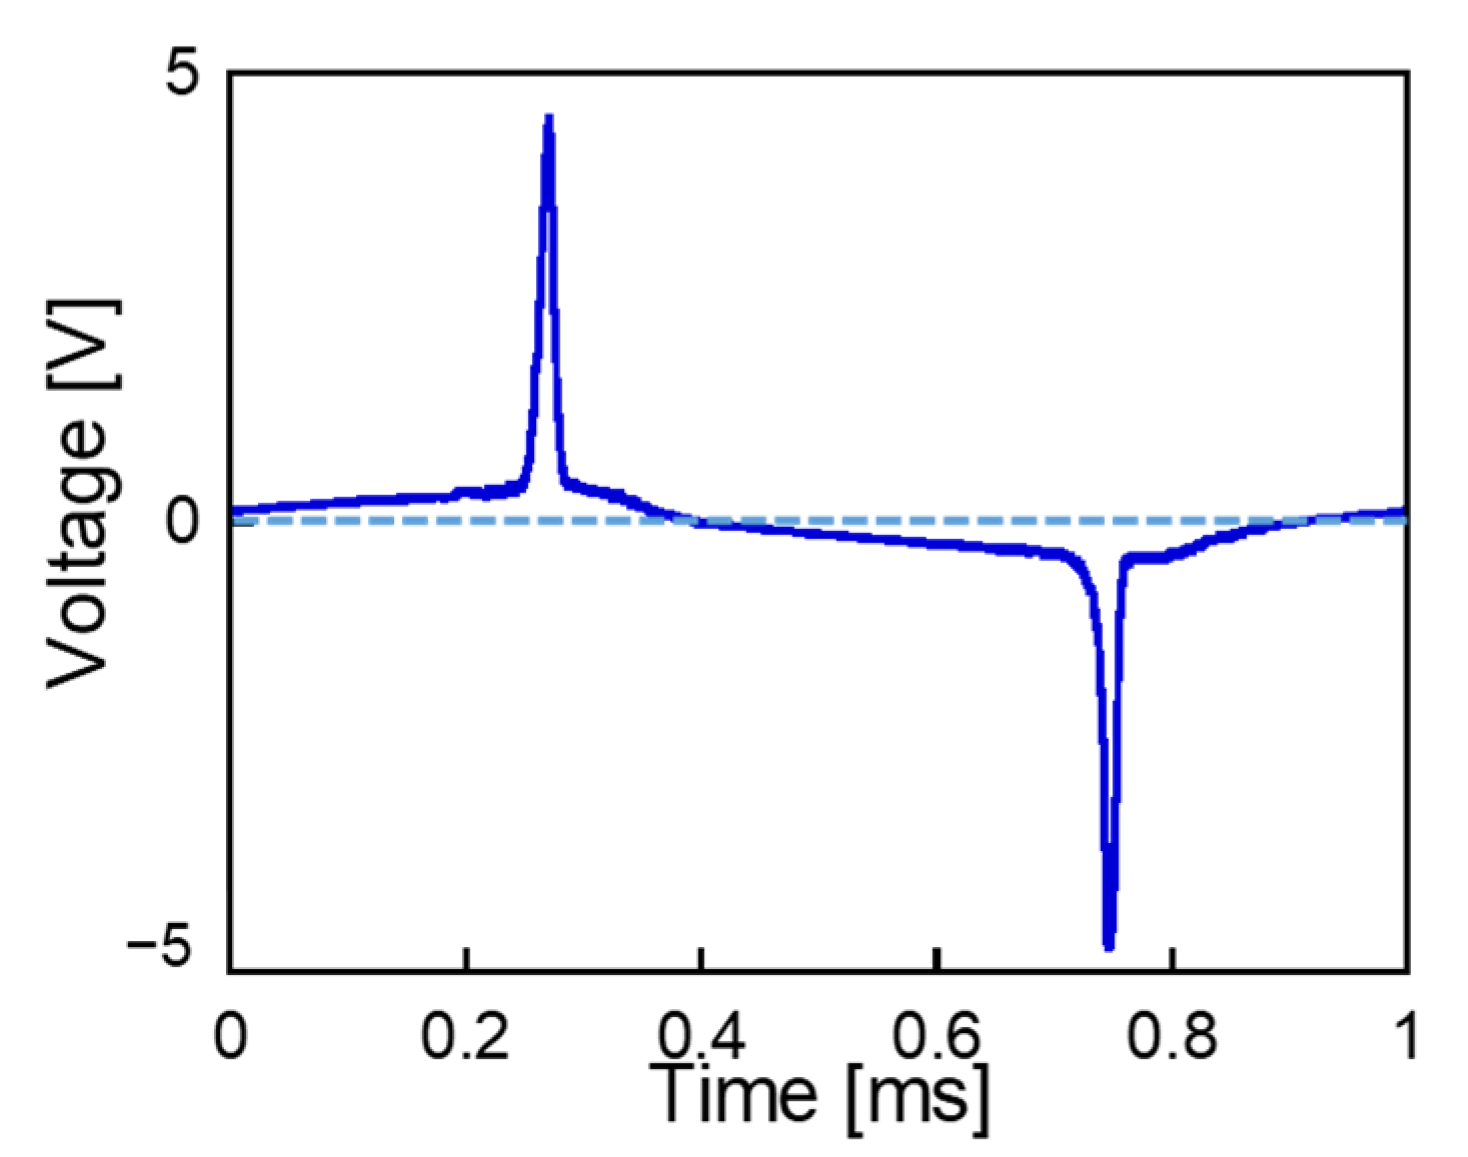
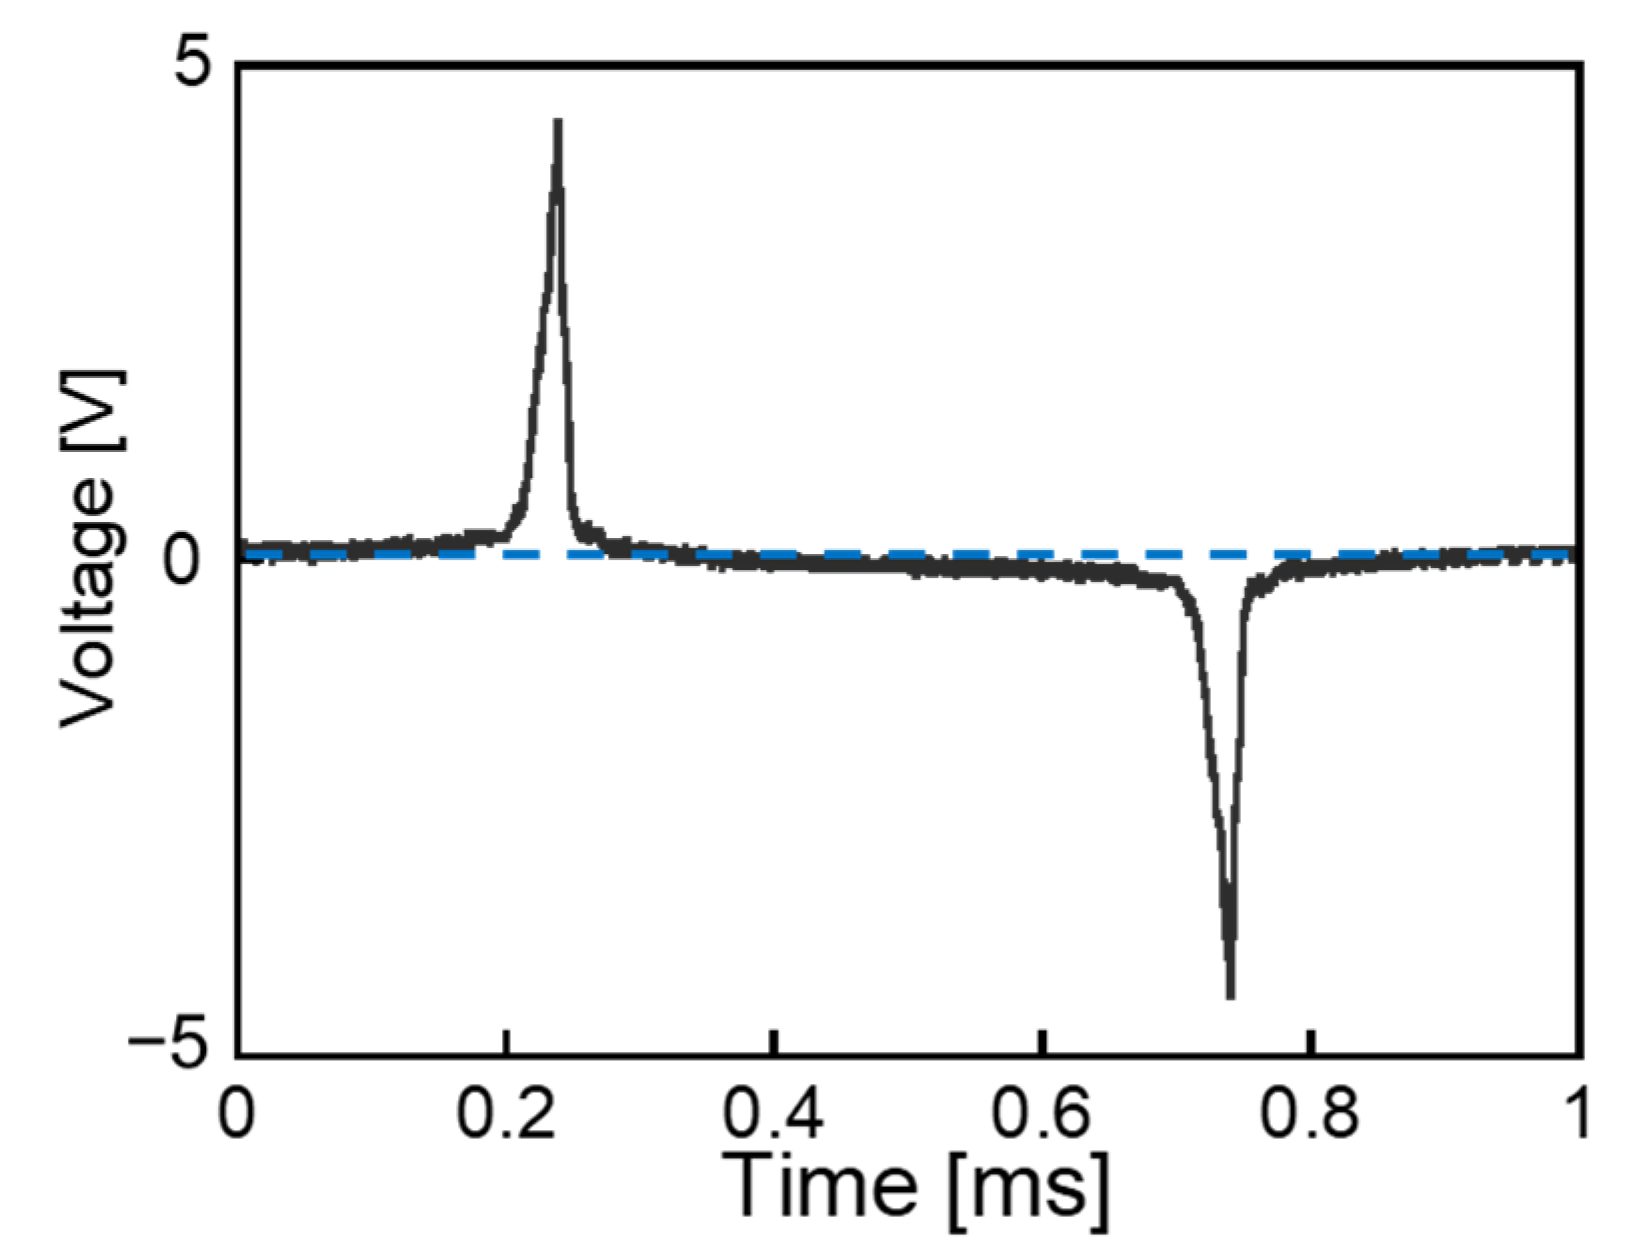
2.1. Measurement of Pulse Voltage from the Wiegand Sensor

We used a magnet wire composed of iron–cobalt–vanadium (FeCoV) with a diameter of 0.25 mm and a length of 11 mm. The Wiegand sensor used in this study consisted of a wire and a pickup coil with 3000 turns wound around it. The magnetic properties of this wire are essentially the same as those we have previously reported in detail [13]. Its magnetic structure is shown in Figure 1. The outer layer and inner core exhibit soft and hard magnetic properties with lower (1.6 kA/m) and higher (6.4 kA/m) coercive forces, respectively. The direction of magnetization of these layers can be either in parallel or antiparallel configurations, as shown in Figure 1—a specific feature of the Wiegand wire.
When a magnetic field exceeds the coercive force of the soft layer, the latter exhibits a fast magnetization reversal, which is called the Wiegand effect [6]. A pulse voltage is induced in the pickup coil wound around the wire [8,14]. The Wiegand sensor consists of a Wiegand wire and a pickup coil. As fast magnetization reversal is initiated independently from the changing ratio of the applied magnetic field, the intensity and width of the pulse are constant [15]. Figure 2 shows the measured waveform of the pulse voltage generated from the Wiegand sensor. We measured the waveform of the open-circuit voltage across both ends of the pickup coil using an oscilloscope [8,9]. The intensity and frequency of the alternating applied magnetic field were 3.2 kA/m and 1 kHz, respectively. An excitation coil with 25 mm length, 22 mm diameter, and 90 turns was used. An alternating magnetic field was applied to the Wiegand sensor by using the excitation coil, a signal generator, and a bipolar amplifier. Positive and negative pulses with widths of 20 μs were alternatingly induced in the pickup within 1 ms. These were attributed to electromagnetic induction caused by the change in magnetic flux corresponding to the alternating magnetization reversal of the soft layer.

2.2. Pulse Voltage from the Wiegand Sensor Used as a Voltage Source in Simulation

As previously reported, we can determine the equivalent circuit model of the Wiegand sensor [16]. The intrinsic pulse voltage, Vin, of the Wiegand sensor was defined to evaluate the application circuits of the Wiegand sensor through MATLAB®/Simulink® simulations. Figure 3 shows the waveform of the intrinsic pulse voltage, Vin, generated from the Wiegand sensor. The performances of the simulated and experimental circuits were in agreement when employing the equivalent circuit model of the Wiegand sensor, which consisted of Vin as a voltage source, an internal resistance of 180 Ω, and an inductance of 17 mH [16].

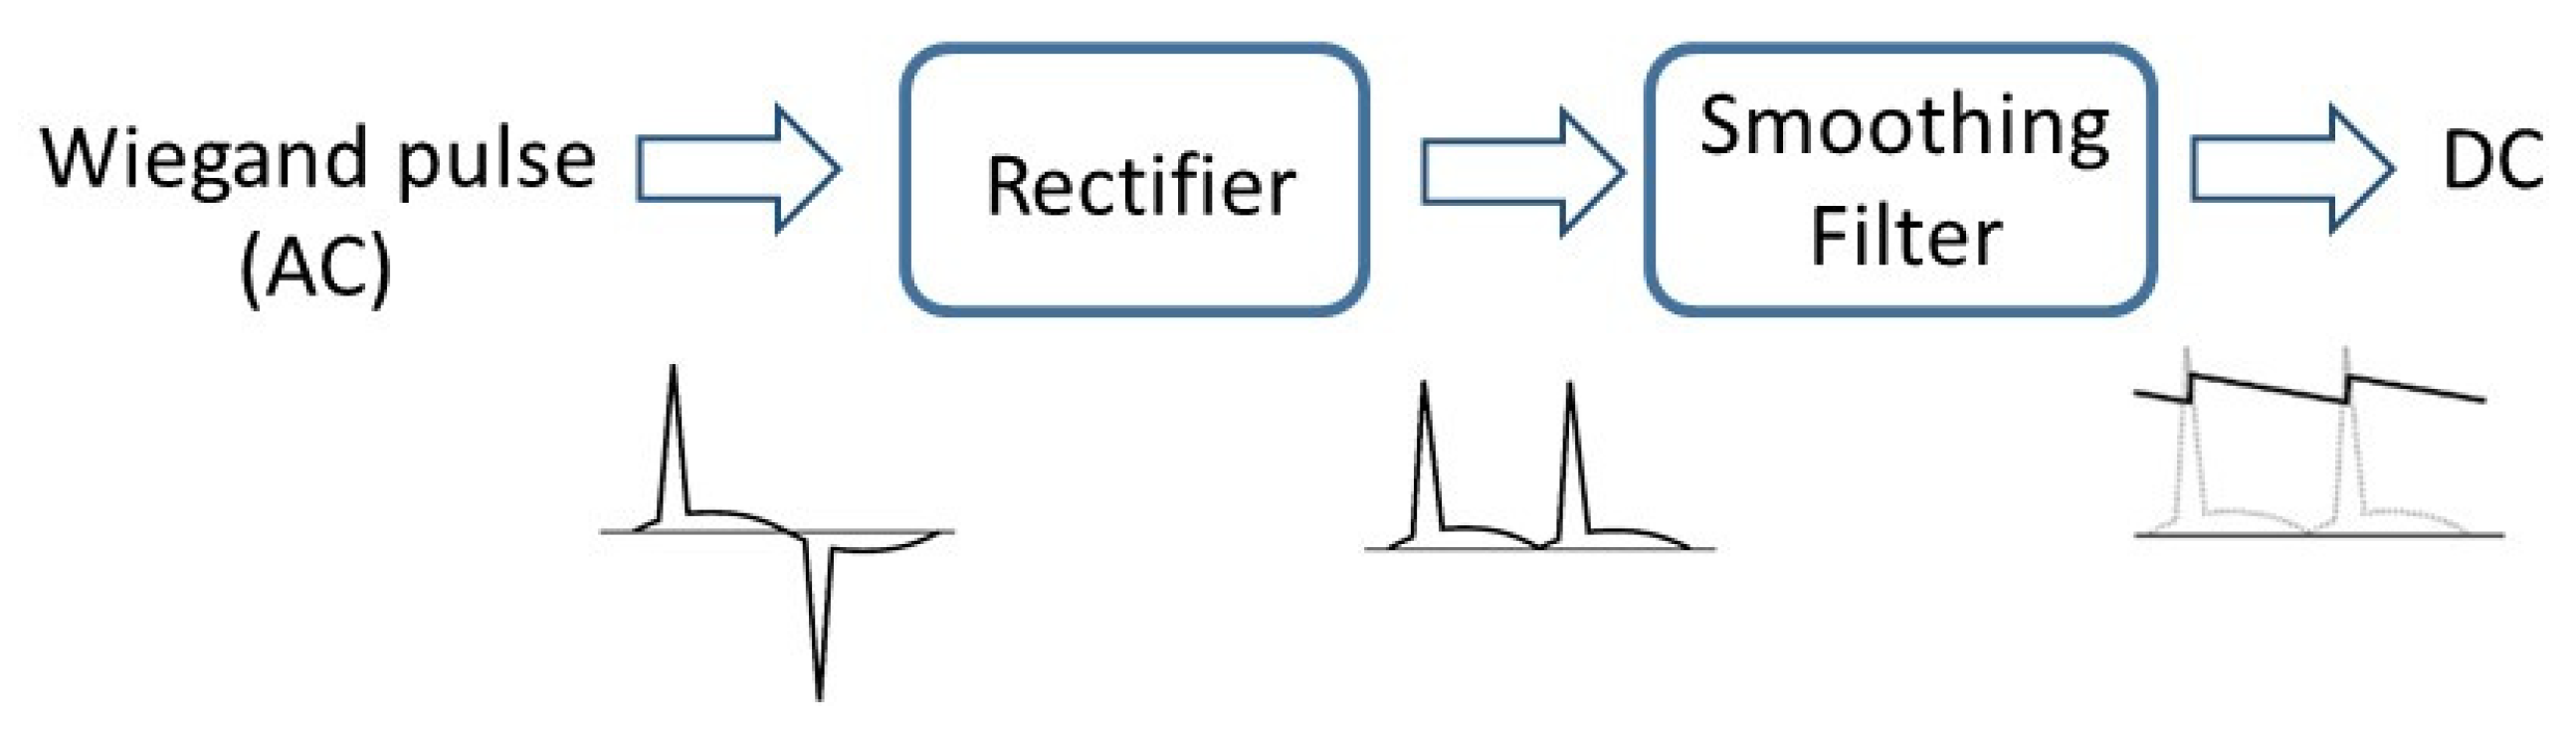
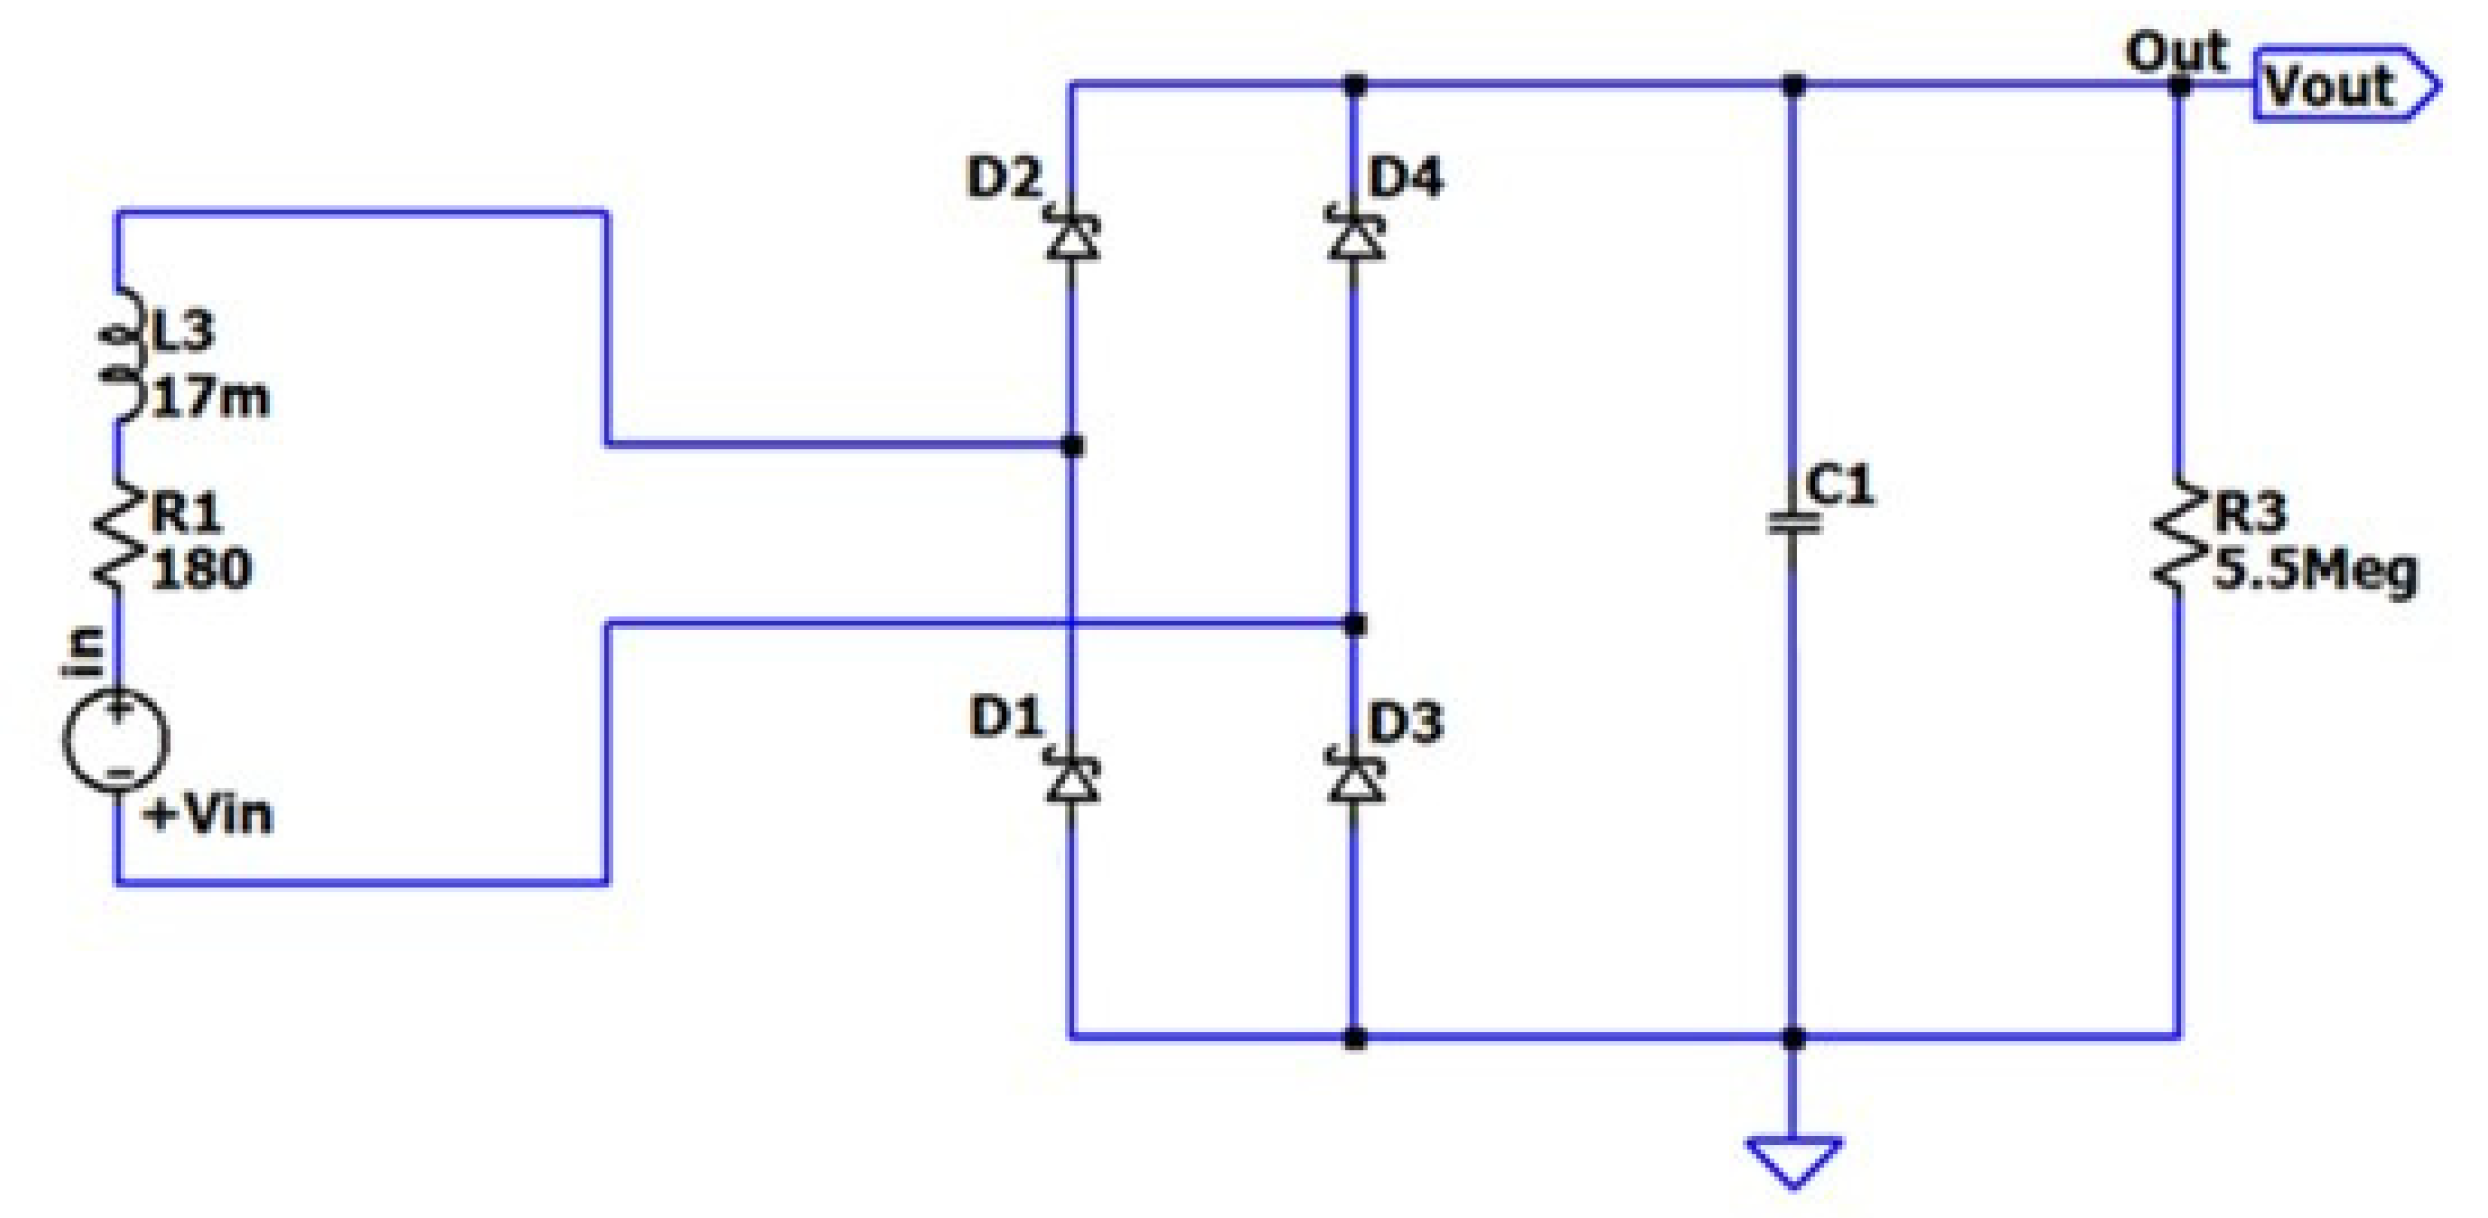
2.3. DC Conversion of Wiegand Pulse Voltage

AC–DC conversion is used to obtain a DC voltage from the Wiegand pulse voltage, as shown in Figure 4. The alternatingly positive and negative pulse voltages are rectified by the rectifier circuit using diodes. A smoothing filter circuit using a capacitor converts the pulse voltages to DC. Figure 5 shows the DC conversion circuit, diode parameters, capacitor, and resistor used in our experiments and simulations. D1–D4, indicated in Figure 5, represent the diodes (RBR3MM30A) for rectification. RLoad is a 5.5 MΩ load resister. C1 was used as a smoothing capacitor in the range of 1–220 nF to analyze a processed and constant DC voltage. C1 = 1, 10, 20, 50, 100, or 220 nF was connected to the full-wave bridge rectifier, and waveforms of the output voltage, Vout, were measured. Figure 6a shows that Vout saturates at 2.77 V, regardless of the capacitance of C1. The relaxation time of the saturation is longer for a smaller C1. Figure 6b shows the simulated waveforms of the output voltage, which agree with the experimental results. LTspice® was used for the circuit simulation [16].
The frequency of the ripple was 2 kHz, i.e., twice the excitation frequency, because of the full-wave rectifier. The output voltage ripple is high for C1 ≤ 20 nF, and it is very low for C1 > 20 nF. The ripple rate, Ripple, was calculated using the following equation:
R i p p l e = V max V min V average × 100   [ % ]
where Vmax, Vmin, and Vaverage are the maximum, minimum, and average voltages, respectively, applied for 1 ms during one cycle of excitation. The ripple rates calculated from the experimental and simulated output voltages are shown in Figure 7.

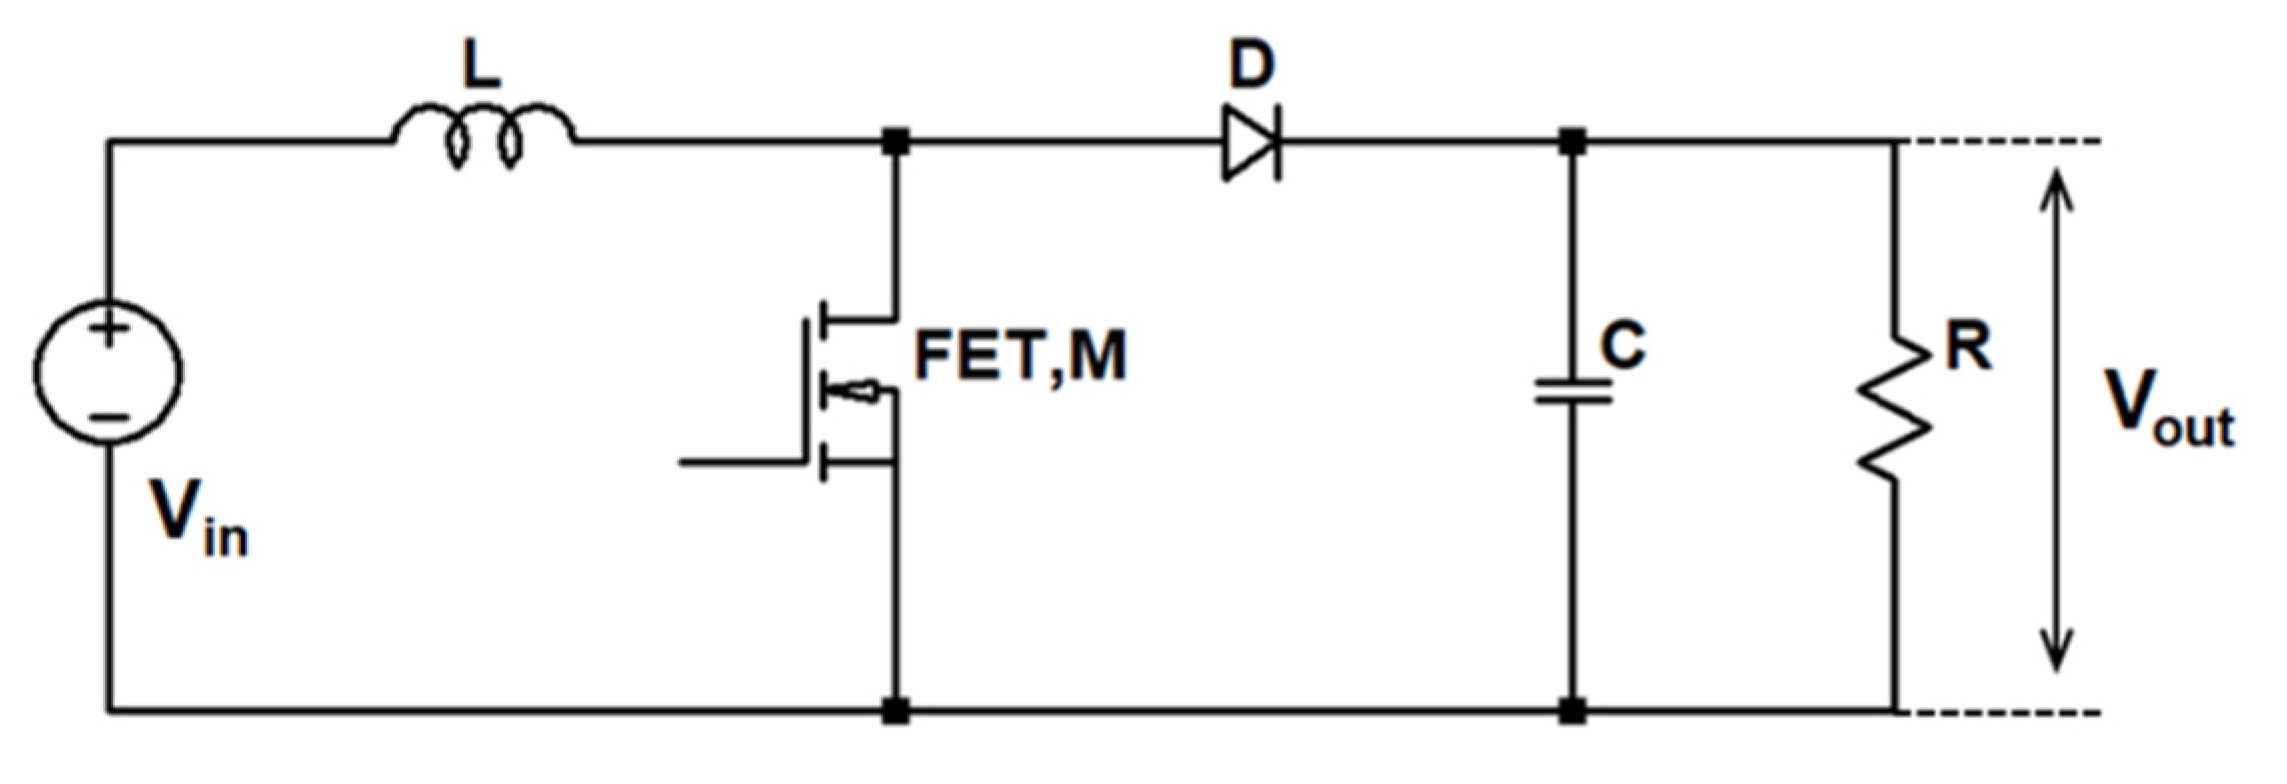
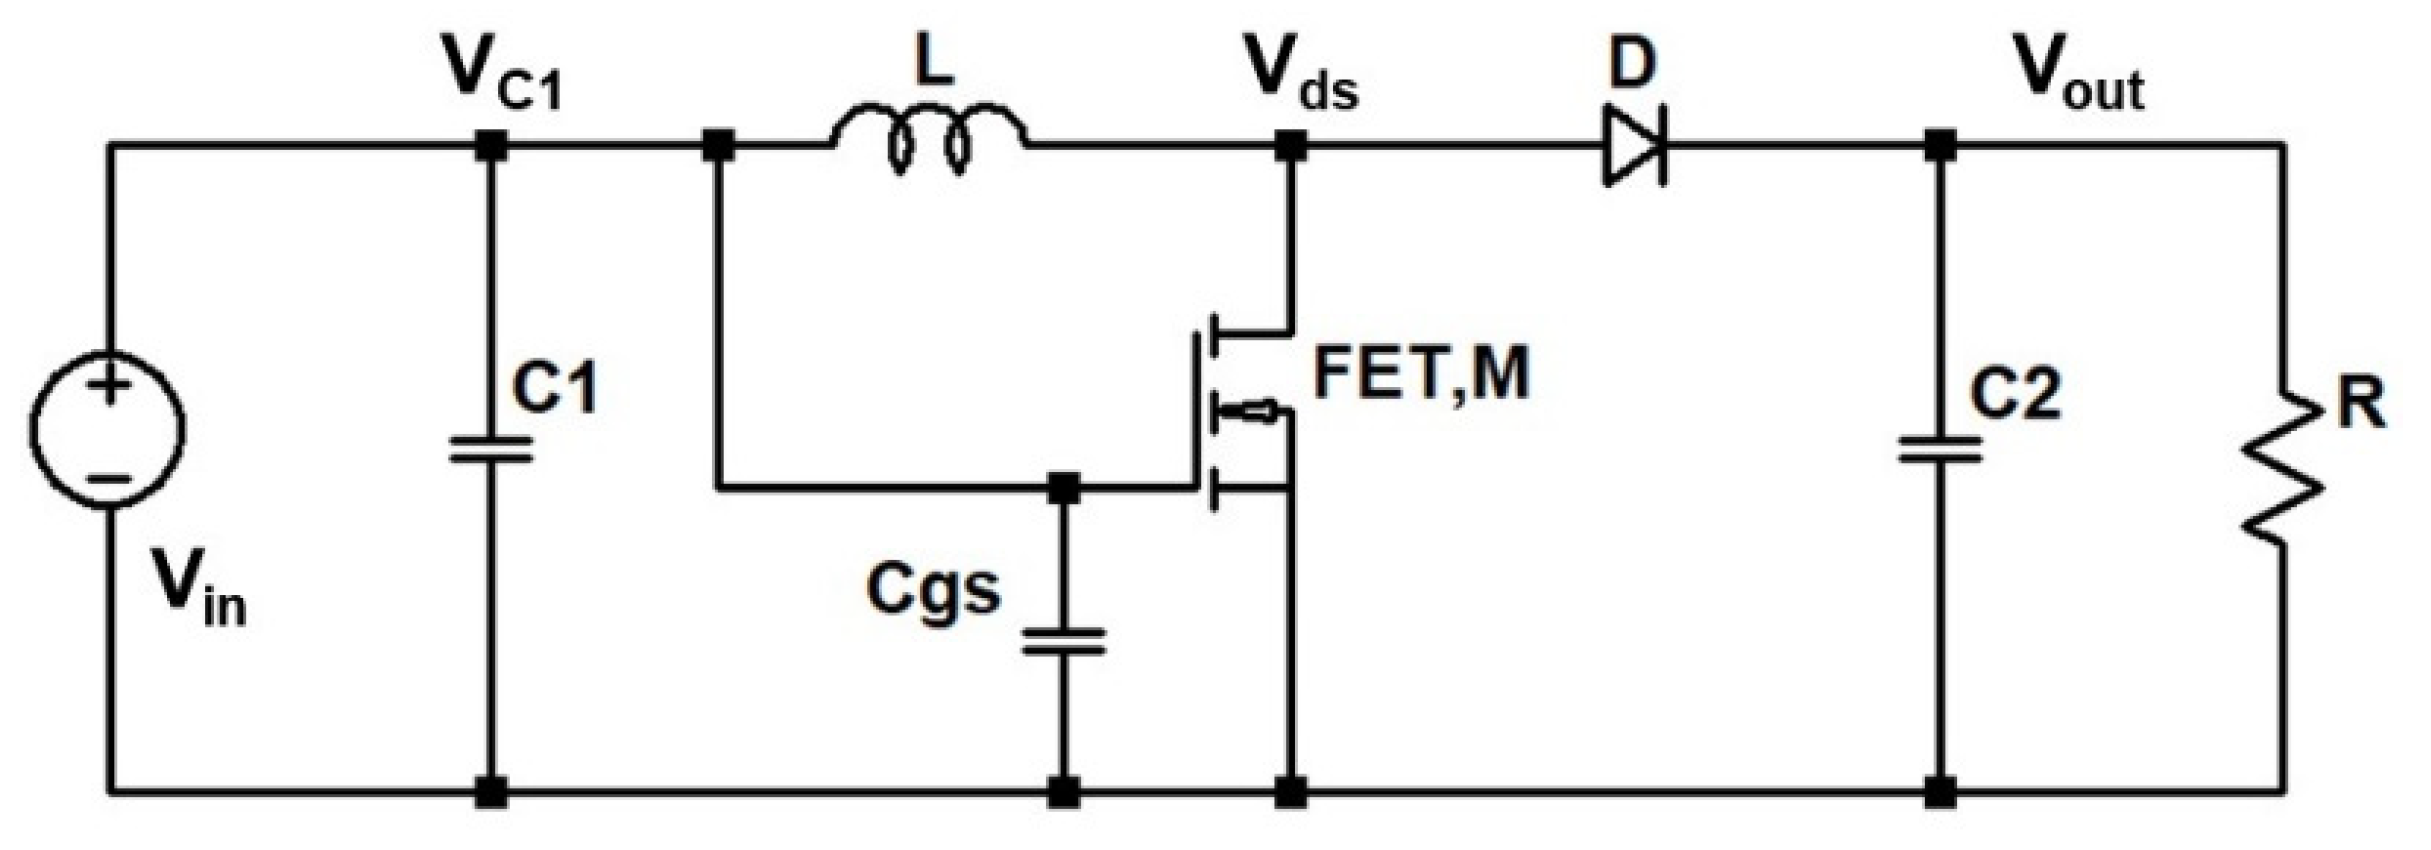
3. Self-Oscillating Boost Converter Circuit

As mentioned in Section 2.2, the maximum voltage obtained at the smoothing capacitor after DC conversion of the Wiegand pulse voltage is 2.77 V. It is fundamental to obtain a DC voltage of 5 V for operating several electronics modules. In this study, we apply a self-oscillating boost converter circuit for a Wiegand pulse voltage. The feature of the booster converter is that the energy stored in an inductor increases the output voltage, which then exceeds the input voltage. Figure 8 shows the typical circuit of a boost converter. The alternating sequence of storing energy in the inductor and transmitting it back to the circuit boosts the voltage. The energy is stored in inductor L when M, a field-effect transistor (FET), is in the ON state, whereas the stored energy is transferred from L to capacitor C when M is in the OFF state. As a result, Vout higher than Vin is obtained. Generally, the switching ON/OFF of M, controlled by an external signal, is used to apply this alternating sequence [10]. As this study aims to develop self-powered electronic modules, the external signal for an alternating sequence cannot be used. Therefore, a self-oscillating boost converter is employed. Figure 9 shows the self-oscillating boost converter circuit used in this study for a Wiegand pulse voltage. The input voltage, Vin, of a 20-μs-wide pulse used as the power source generates an oscillating voltage at VC1. The frequency of these oscillations corresponds to a resonant frequency determined by the inductor L and capacitors C1 and Cgs [11,12]. This oscillation voltage at VC1 switches the consecutive ON and OFF states of M, as shown in Figure 9.
  • ON state of M
    When the oscillating pulse voltage at VC1 exceeds the gate threshold voltage, Vth, of the FET, the FET is turned ON, and Vds drops to the ground level. This allows current IL to flow in L, where the energy is stored. The current flows through the diode, D, and supplies the output voltage, Vout.
  • OFF state of M
    When the oscillating pulse voltage at VC1 is below Vth, the FET is turned OFF. The energy stored in L during the FET is transmitted to the capacitor of the output, C2, through diode D.
D prevents a backflow current to L. By repeating the ON/OFF switching sequence of the FET, a DC output voltage exceeding Vin is obtained.

4. Experimental Results and Discussion

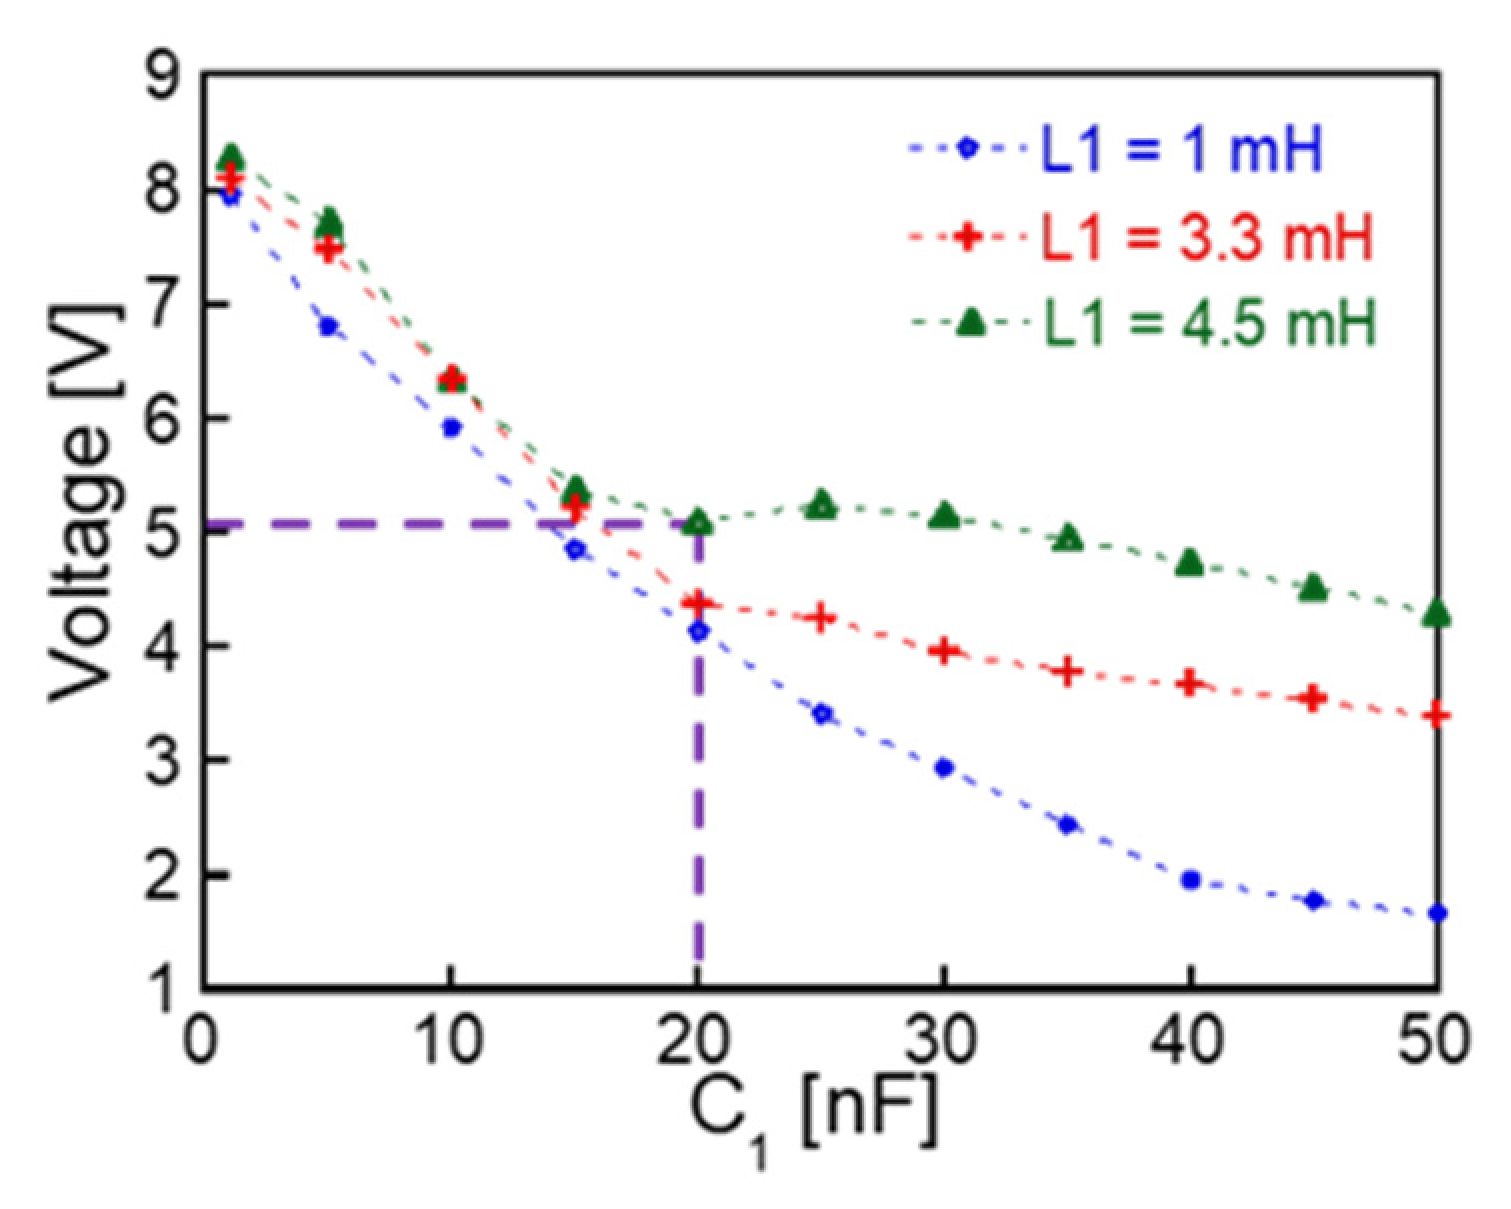
4.1. Design of a Self-Oscillating Boost Converter for Wiegand Pulse

In this study, we designed and fabricated a rectifying and boosting circuit for the Wiegand pulse voltage in Figure 10. The circuit consists of a bridge rectifier with diodes and self-oscillating boost converter components, such as inductors, capacitors, n-channel FET, and diodes, as described in the previous section and in Figure 8 and Figure 9. Details of the parameters of the circuit elements are indicated in Figure 10 and Table 1. The input voltage is supplied from a Wiegand sensor. An alternating magnetic field of 3.2 kA/m was applied to the wire. The frequency of this field was 1 kHz. The Wiegand sensor is advantageous in terms of its efficient power generation at low frequency ranges below 1 kHz [8].
Figure 11 shows the simulated waveforms of the voltages and currents in the self-oscillating boost converter. The rectified voltage of the Wiegand pulse is oscillated by a resonance of C1 and L1. This oscillated voltage, VC1, switches the FET ON/OFF. Vds confirms the ON/OFF status of the FET. As a result of the oscillated IL1 and ID5 and the smoothing capacitor C2, a constant DC voltage is obtained as the output. Vout is 5.1 V, which is higher than the input voltage of VC1, and a DC voltage of 2.77 V is obtained without the booster circuit, as shown in Figure 6.
Vout depends on the circuit parameters of L1 and C1, as shown in Figure 12. Vout increases as C1 decreases. The combination of L1 = 4.5 mH and C1 = 20 nF is optimum for producing a DC voltage of approximately 5.1 V, thus meeting the aim of this study to generate a DC voltage of 5 V that can be used as a power source for various electronic modules. The dependency of the output voltage ripple on capacitor C2 was also studied. As shown in Figure 13, Vout is not dependent on C2, and is stable with fewer ripples when C2 > 60 nF.

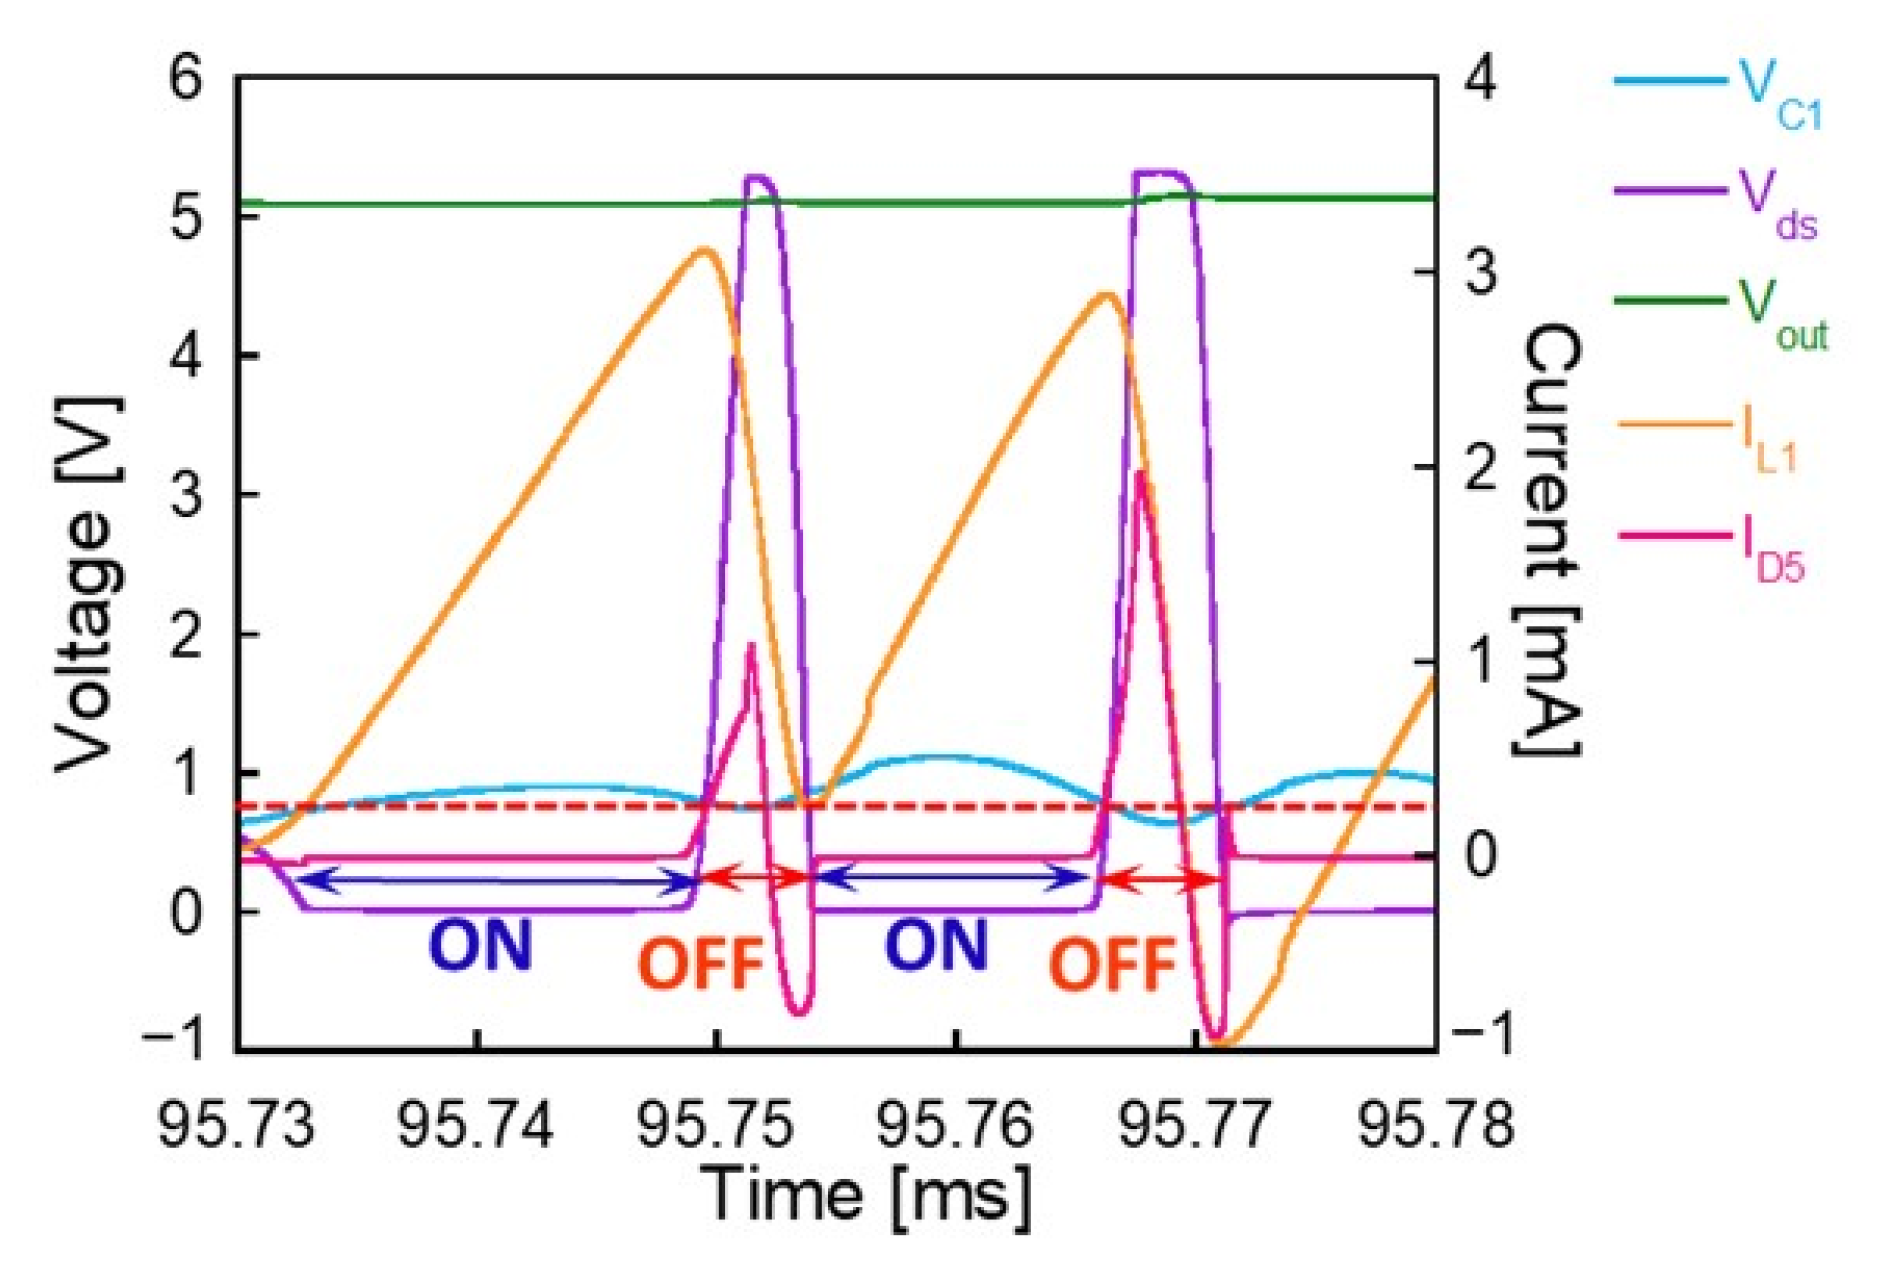
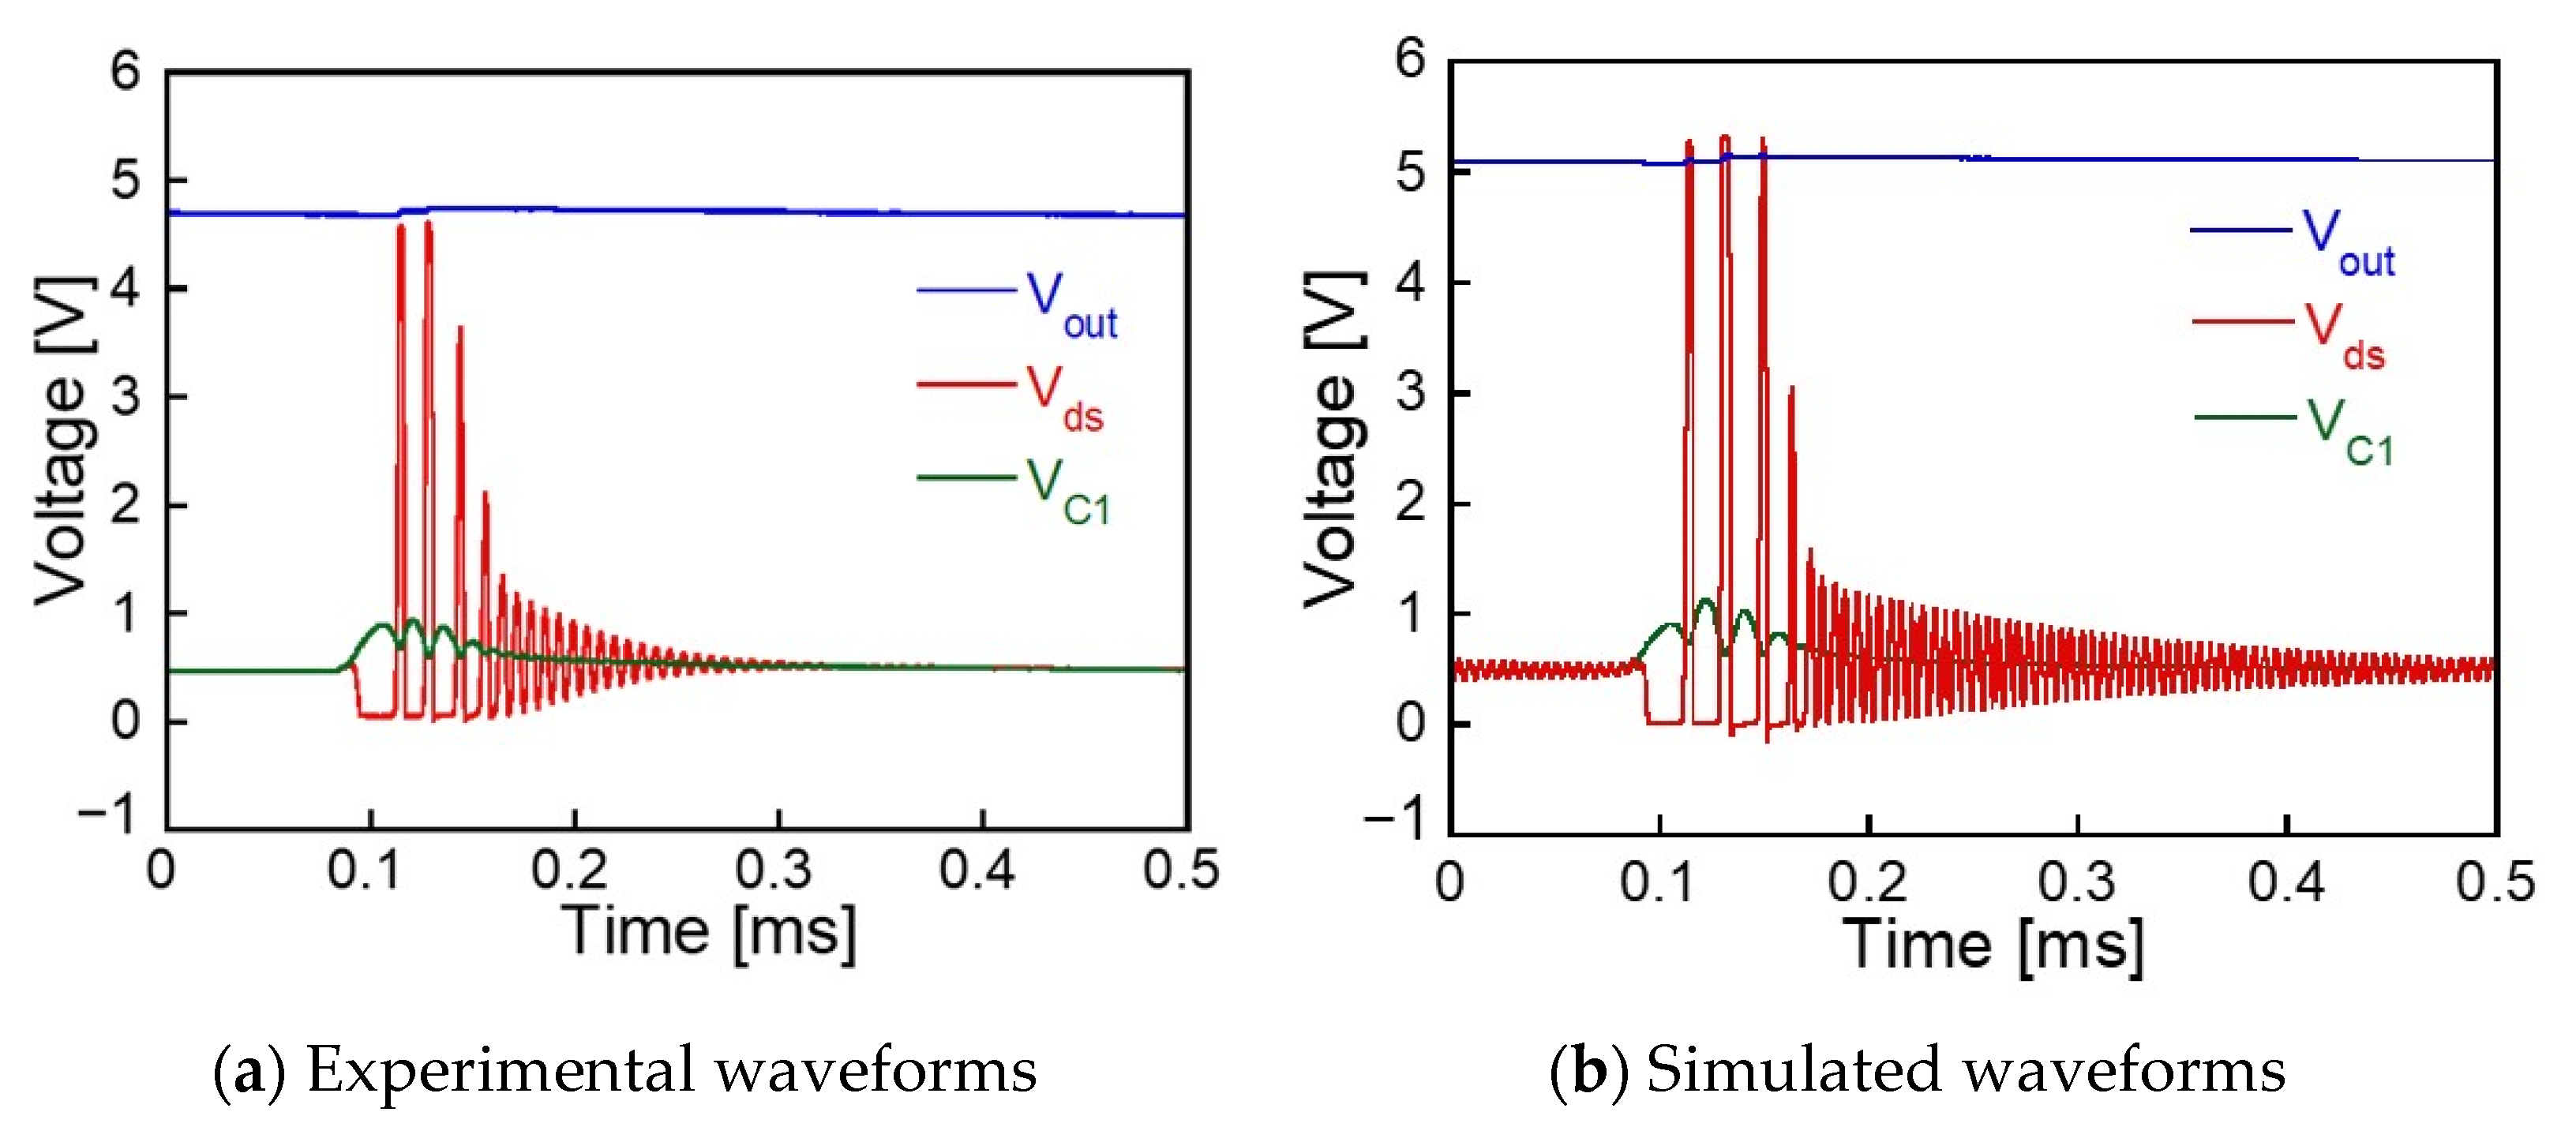
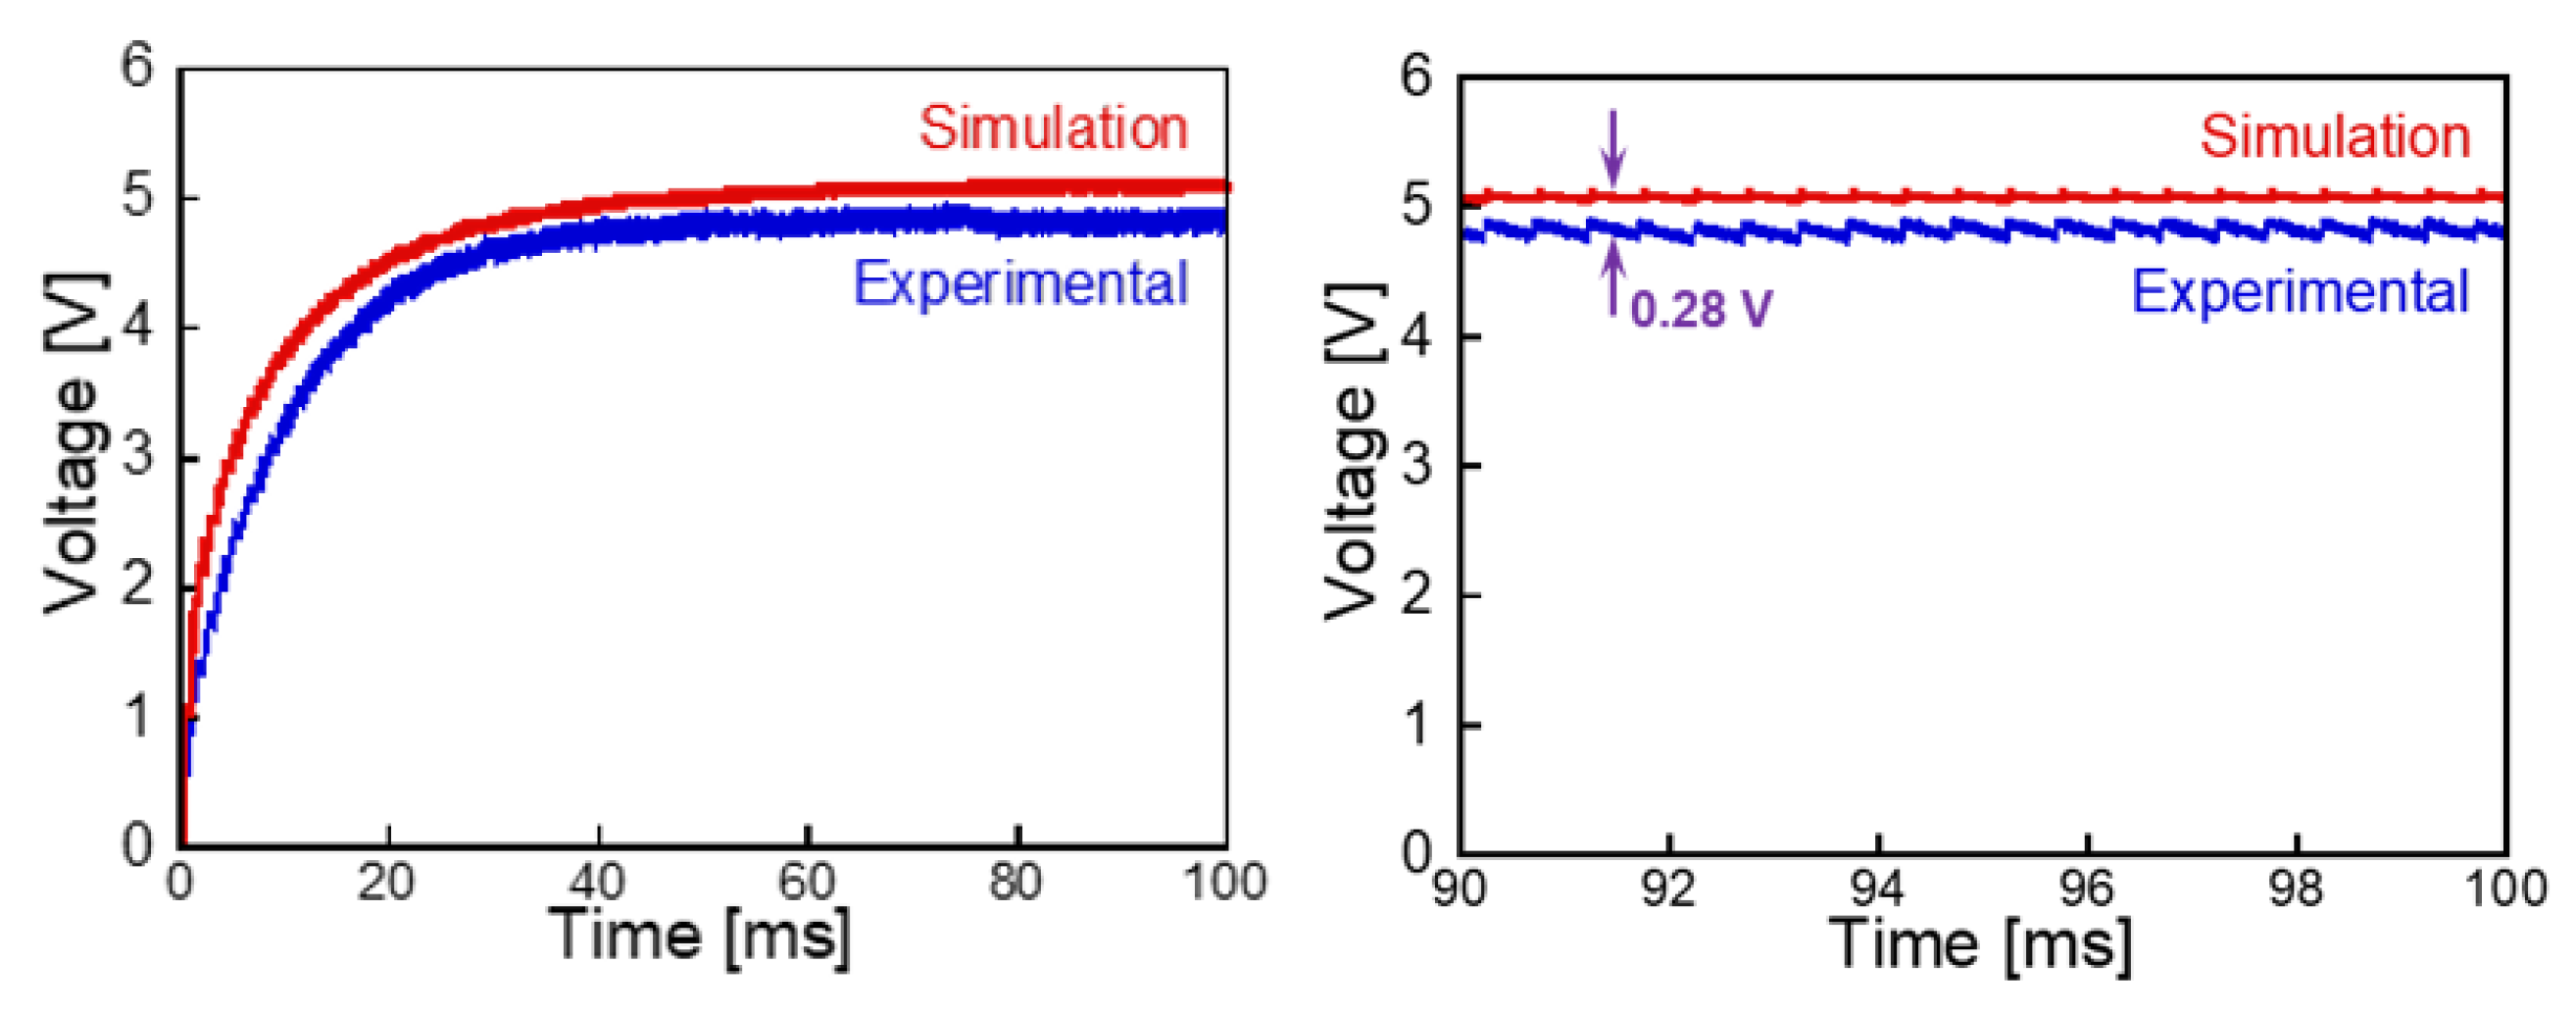
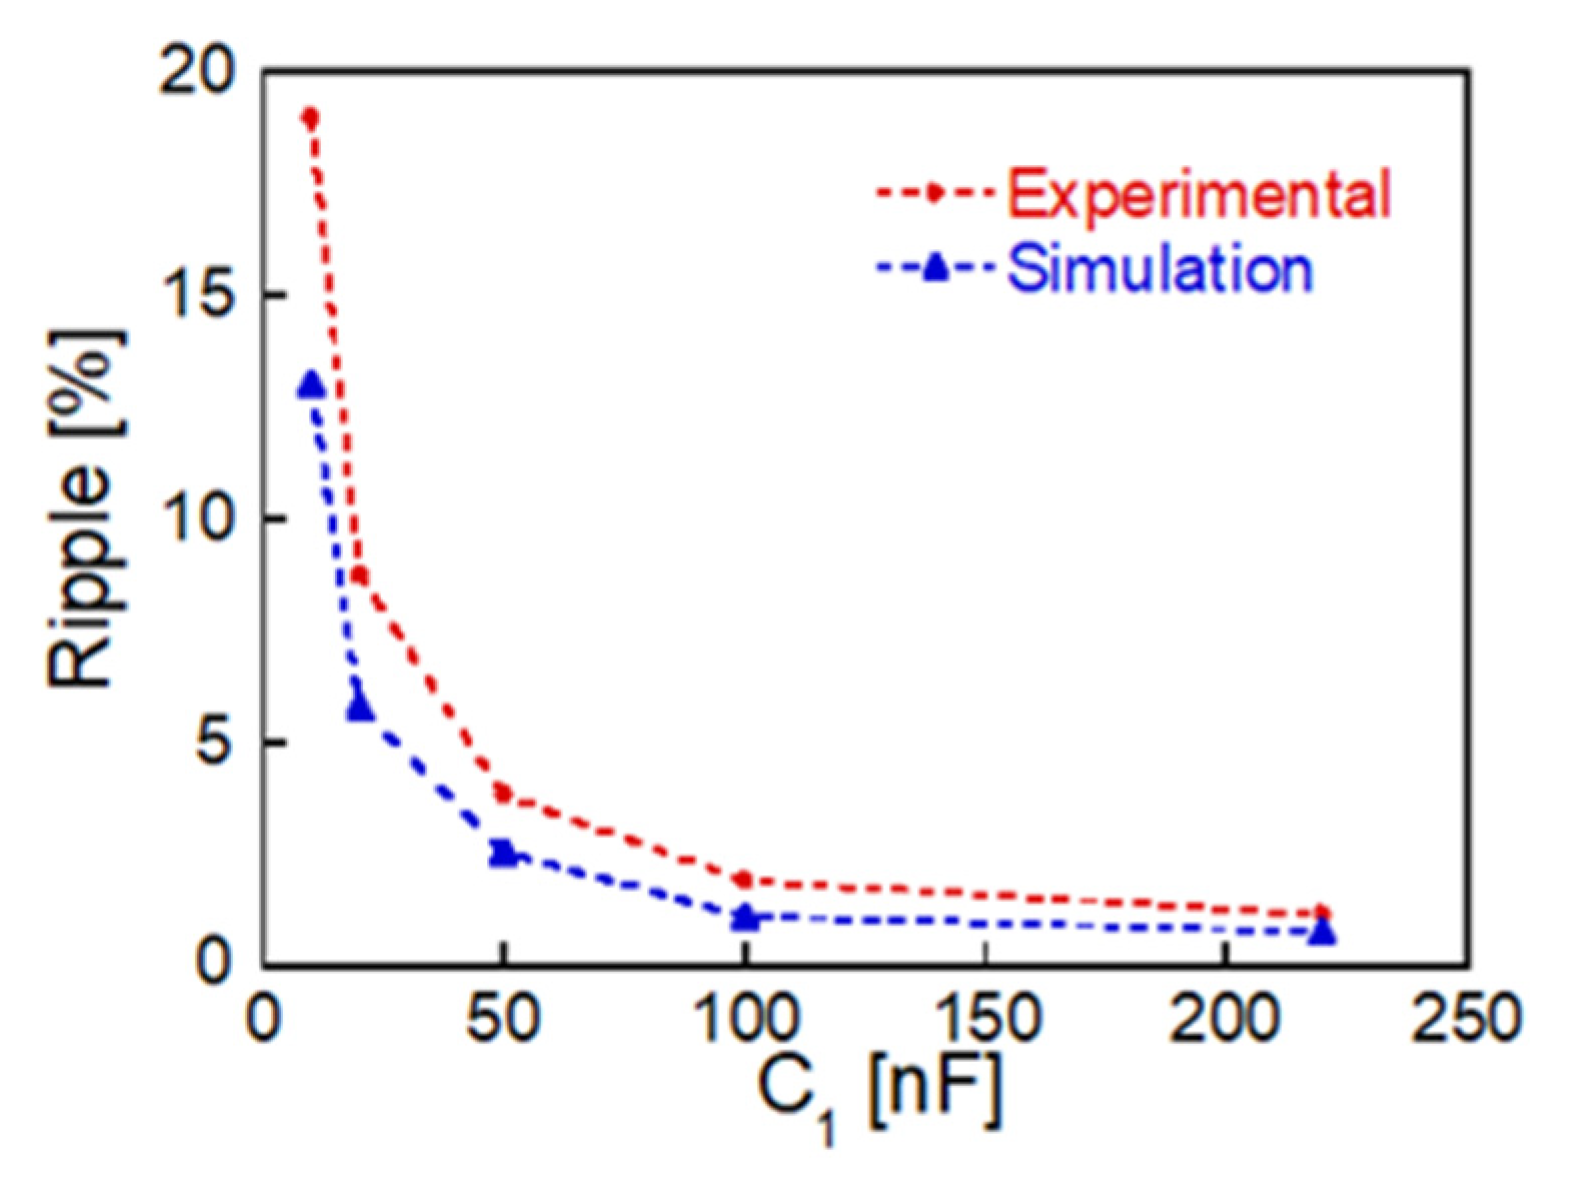
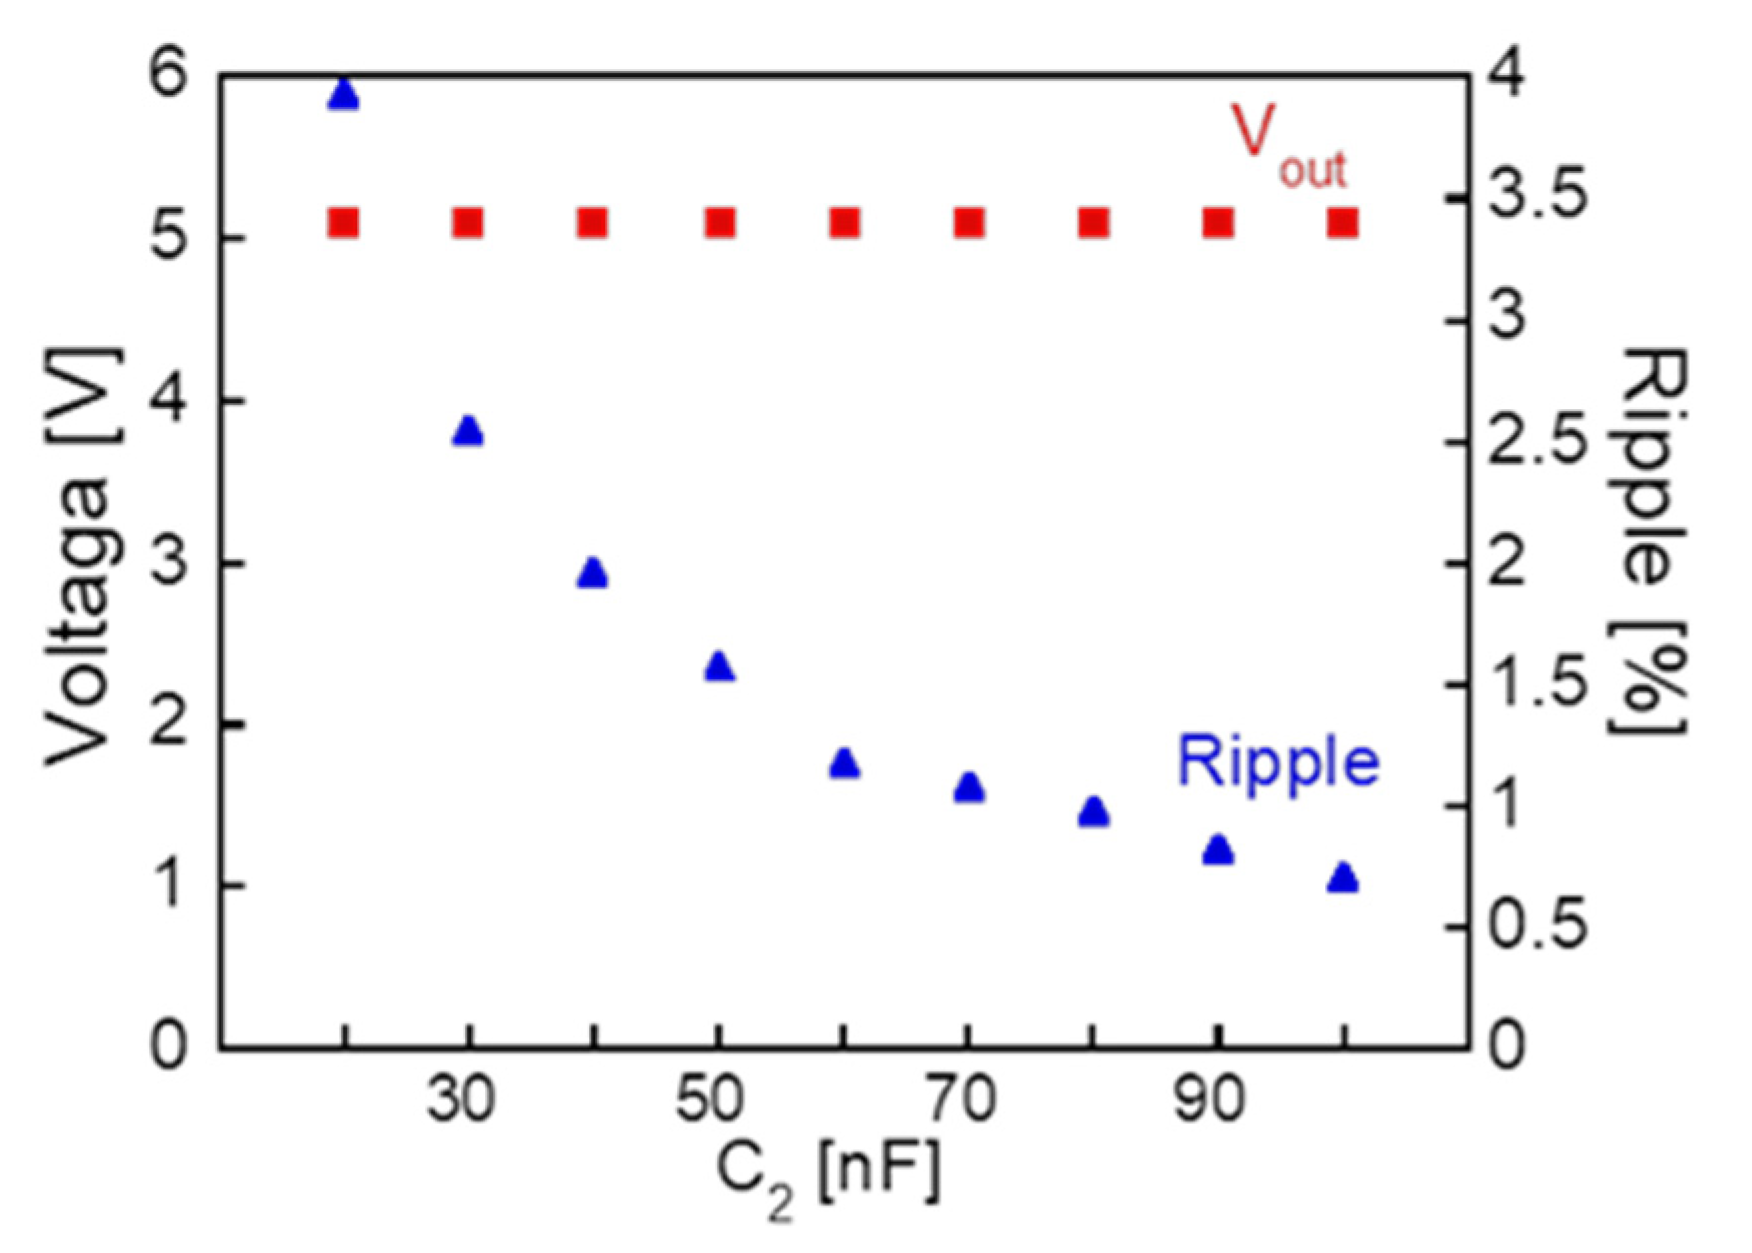
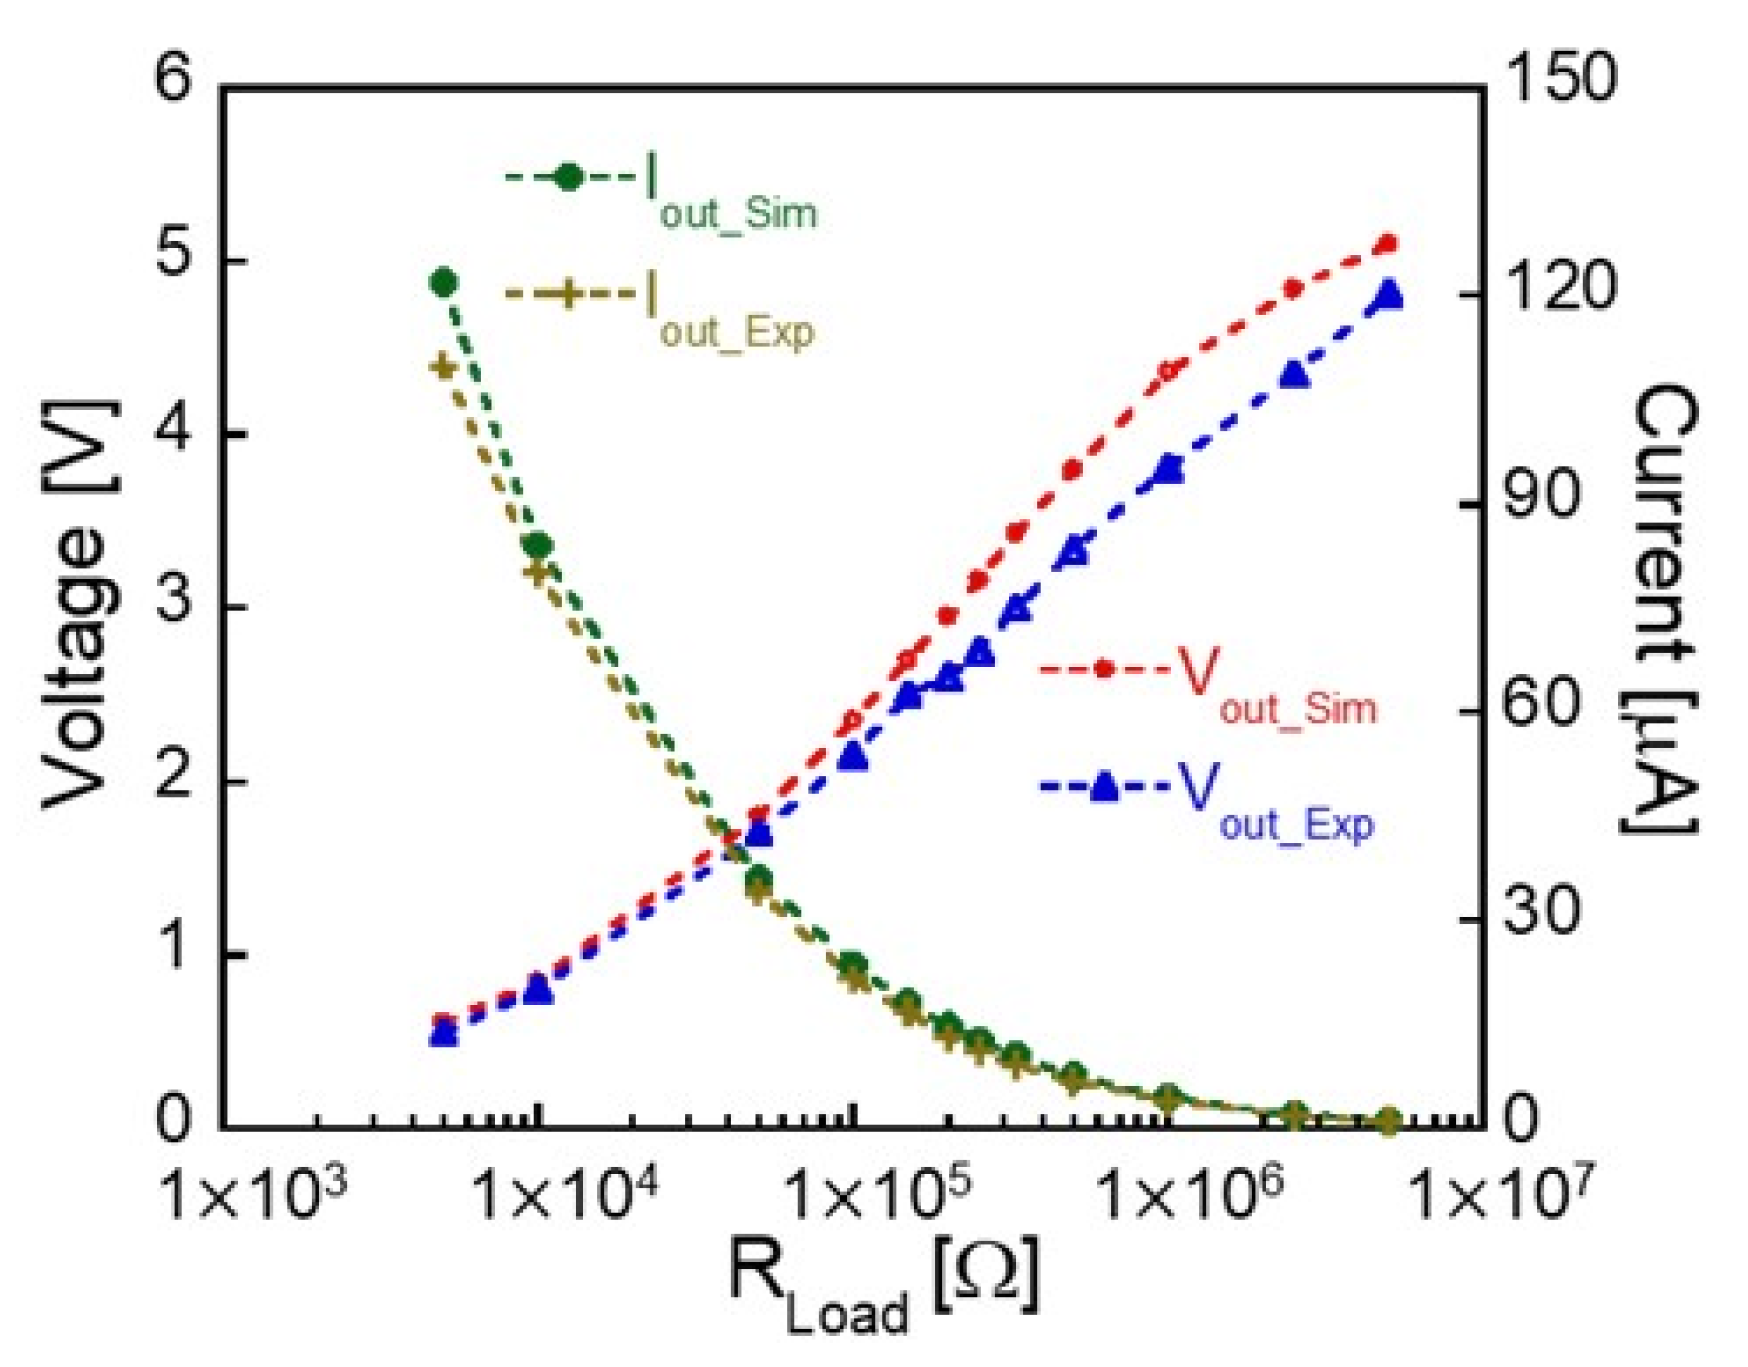
4.2. Experimental and Simulated Results of the Self-Oscillating Boost Converter

Figure 14 shows the experimental and simulated waveforms for the output and other voltages of the self-oscillating boost converter circuit presented in Figure 10 and Table 1. We measured the waveforms of voltages at Vout, Vds, and VC1, as indicated in the circuit diagram in Figure 10, by using an oscilloscope. Since the applied field frequency was 1 kHz, the full-time scale of 0.5 ms in Figure 14 corresponds to one cycle of the generated Wiegand pulse. The observed oscillations of Vds, VC1, and Vout agreed with the corresponding simulated values.
Figure 15 shows the time dependency of Vout. The simulated and observed saturated voltages are almost equivalent. We have discussed the experimental and simulated results of the circuit shown in Figure 10. The load resistance RLoad = 5 MΩ was used, corresponding to an almost “open circuit condition” for the output. Figure 16 shows the dependence of Iout and Vout on the load resistance RLoad. Vout decreases as RLoad increases. Figure 12 shows that Vout changes with C1, reaching 5 V on adjusting C1. However, the ripple of Vout degrades at C1 < 10 nF.
Figure 17 shows the electric power Pout utilized at RLoad. A maximum power of 63 µW was experimentally obtained at RLoad = 10 kΩ, which does not match with the resistance of the pickup coil, such as 180 Ω for the Wiegand sensor [9]. This mismatch is attributed to the elements and operation of the self-oscillating boost circuit. In fact, we have reported that the maximum power was obtained at a load resistance of 2 kΩ, higher than the DC coil resistance for the Wiegand sensor connected with rectifying and smoothing circuits [8].
In this study, an alternating magnetic field is externally applied to the Wiegand sensor as excitation energy, leading to the generation of the Wiegand pulse voltage. An attractive feature of the Wiegand sensor is that the generated pulse voltage is independent of the frequency of the applied alternating magnetic field. Figure 18 shows the measured Vout and its ripple rate function under an excitation frequency of 1 kHz and lower; Vout decreases with the frequency. However, Vout of approximately 5 V and a low ripple rate are obtained at a frequency range of up to 0.6 kHz. When the frequency is 0.4 kHz, the output voltage still reaches 3.3 V with a ripple rate lower than 5%. This result indicates that the self-oscillating boost converter can be used in practical applications as a power source for electronic modules.

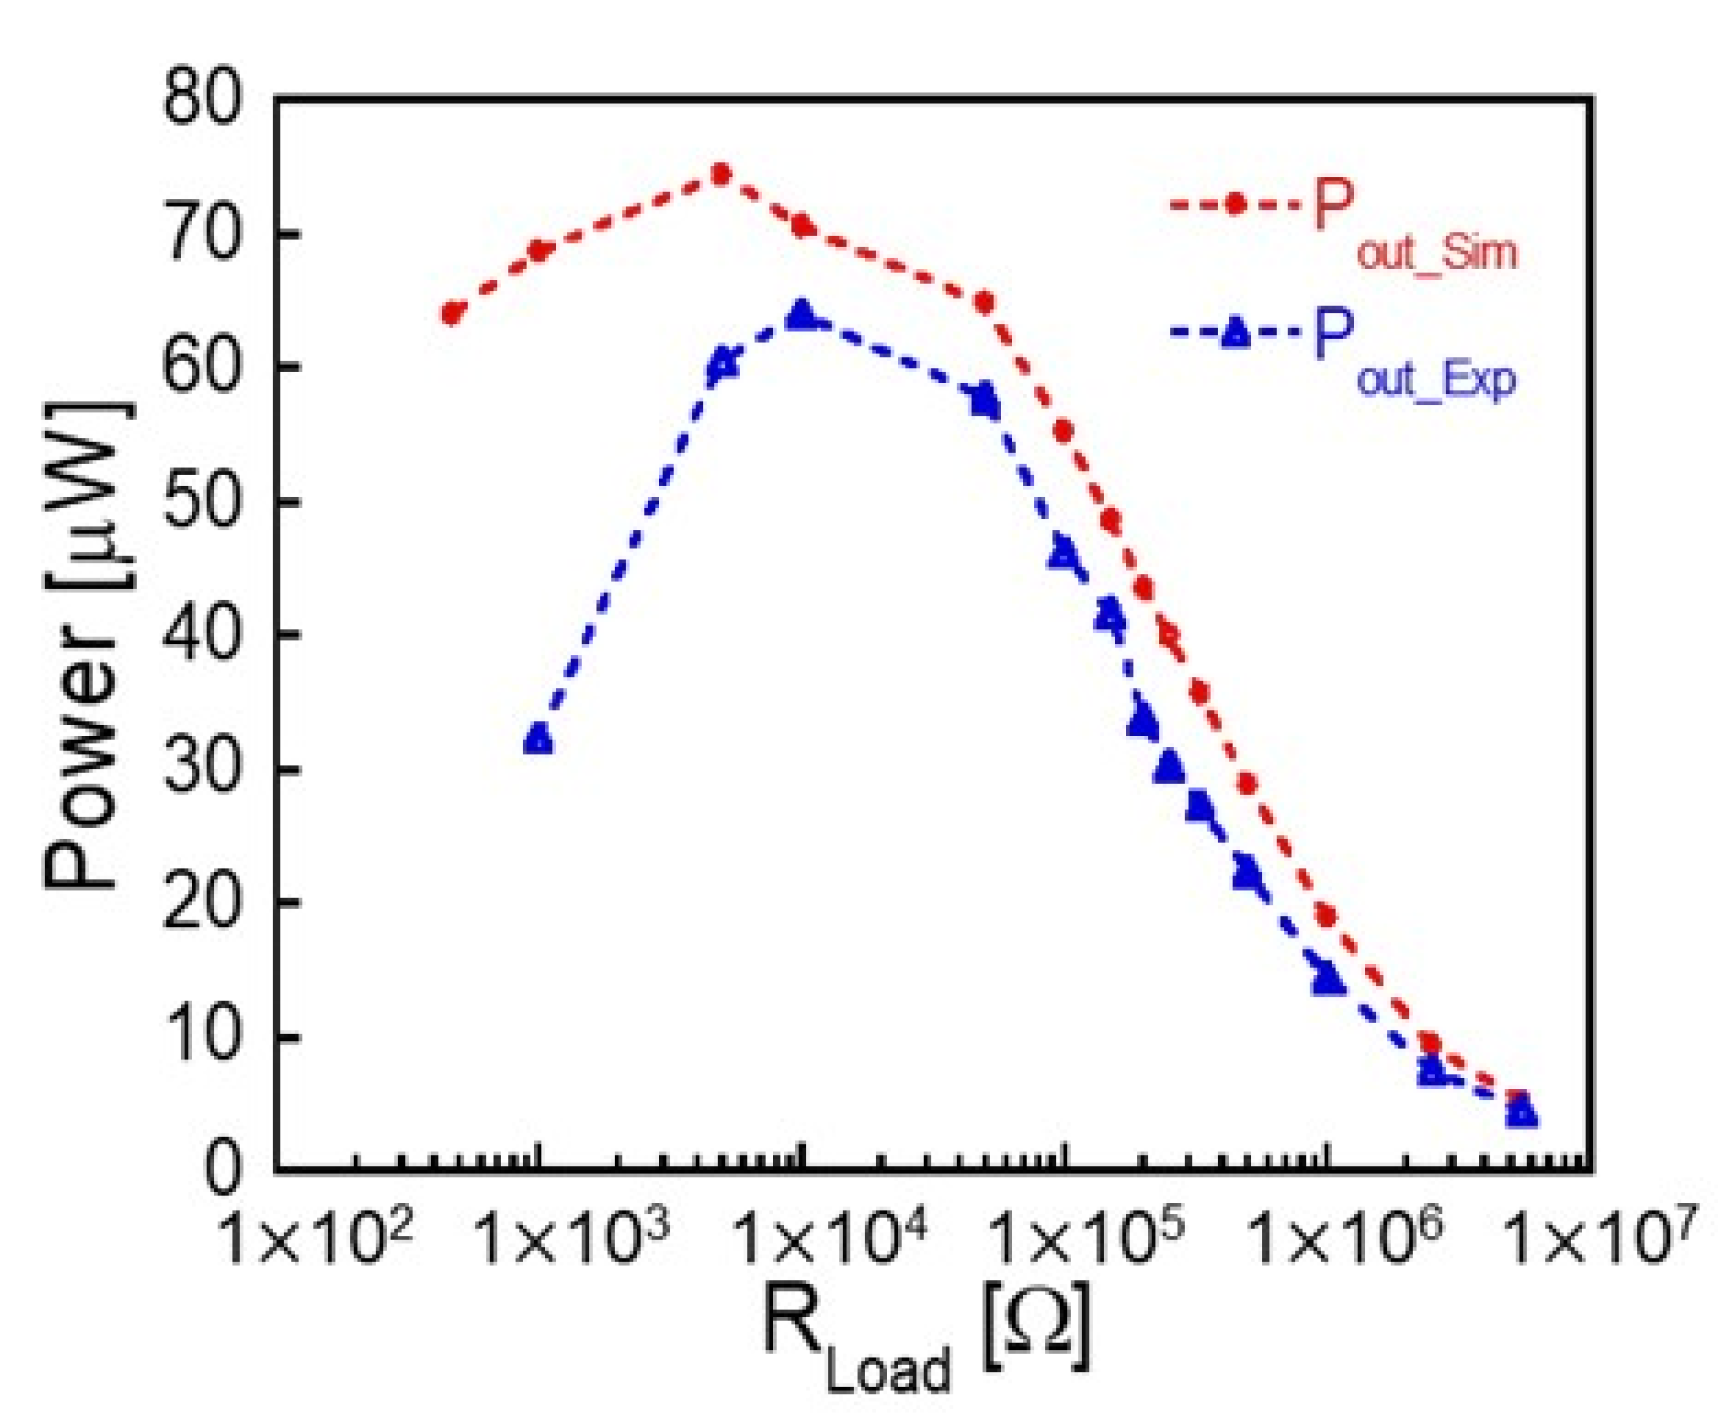
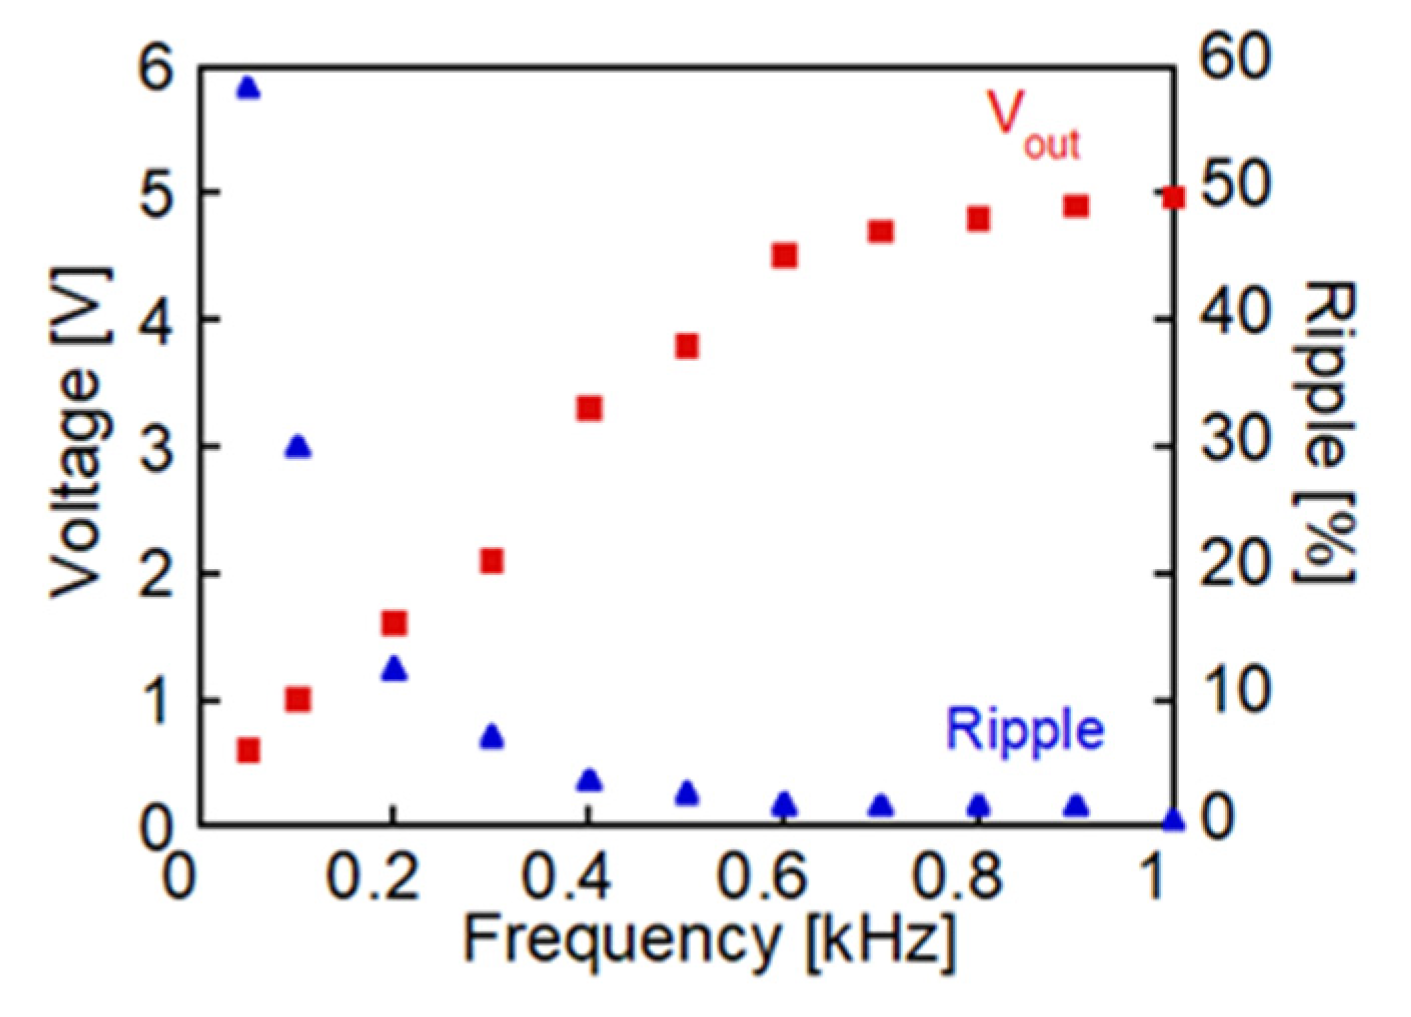
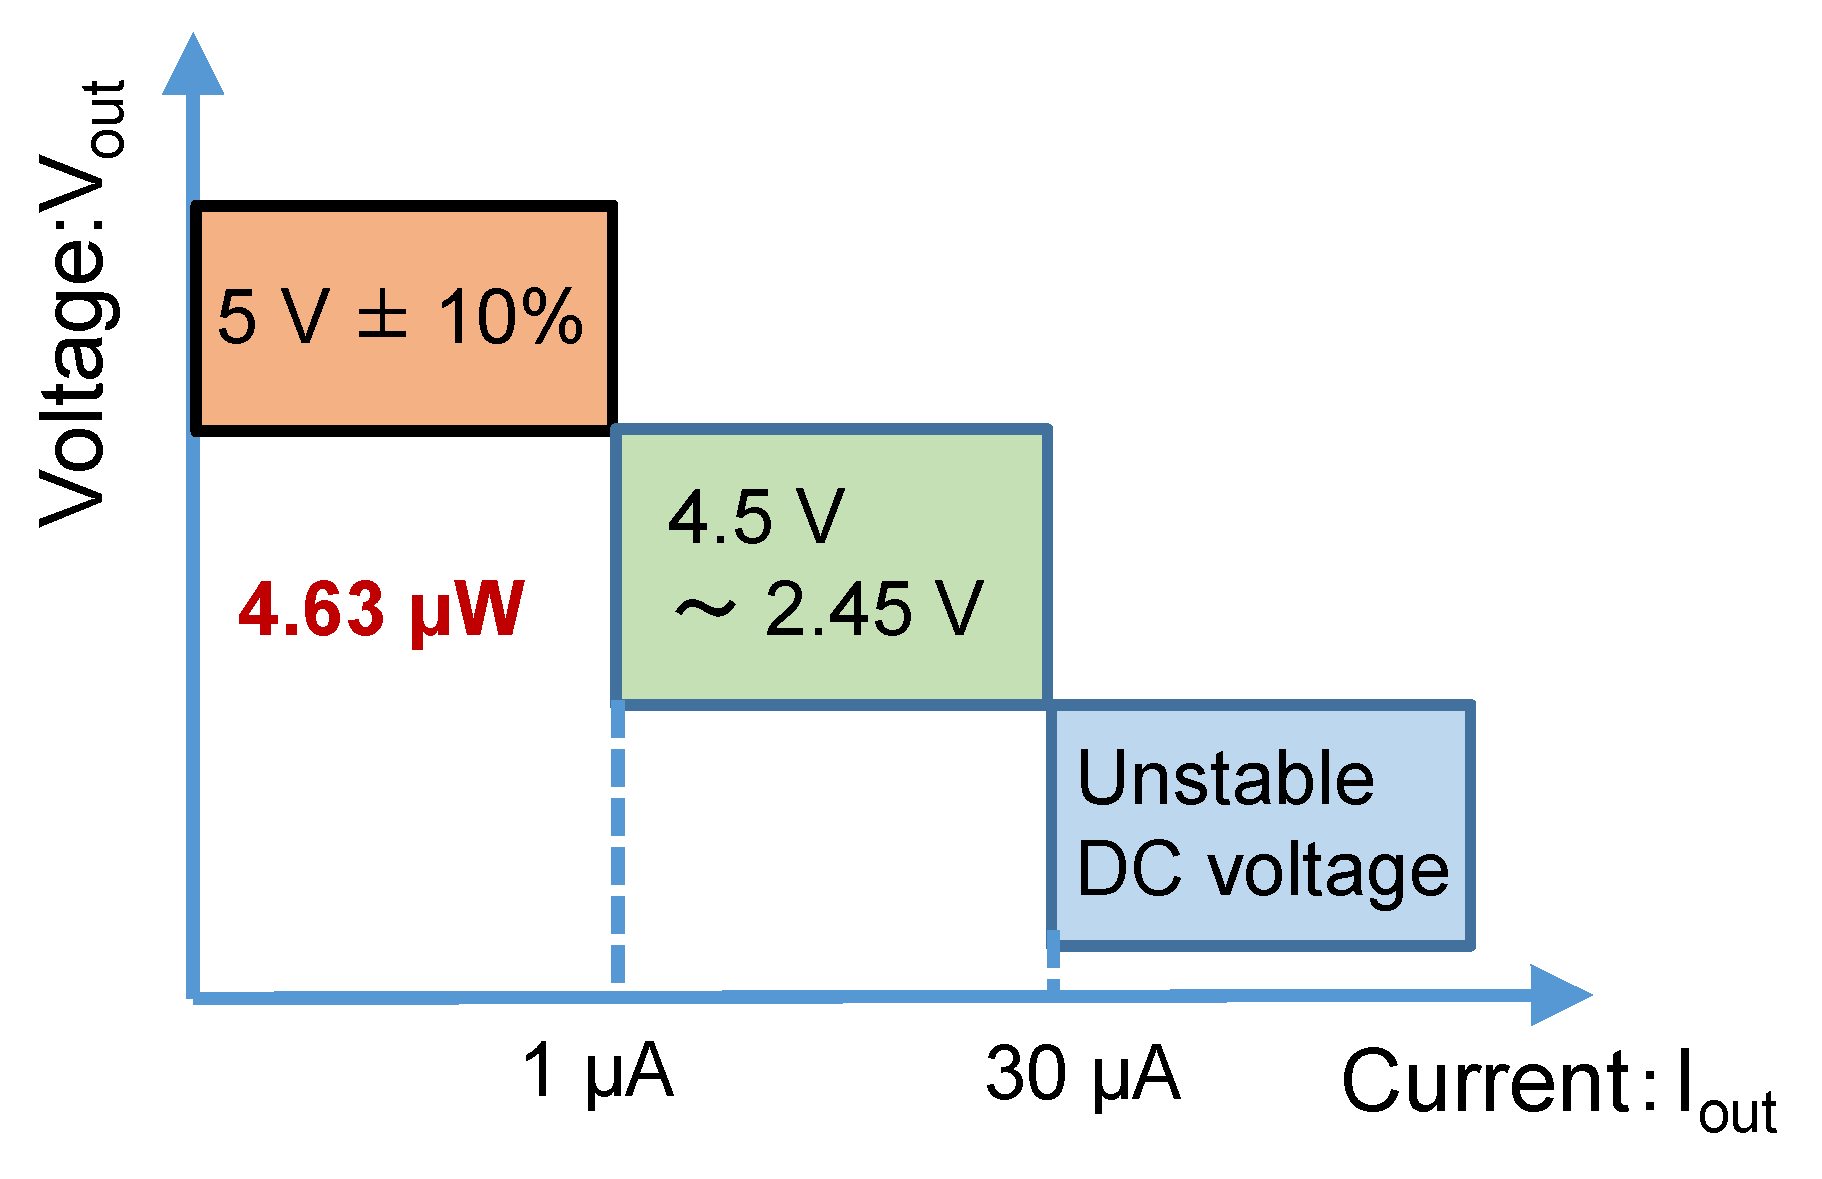
4.3. Application of the Wiegand Sensor as a Power Source

Figure 19 summarizes the relationship between Vout and Iout, obtained using the Wiegand sensor with a self-oscillating boost converter. It shows the voltage and current range functions for the load resistance used for practical application as a power source. A stable output of 5 V is maintained for currents up to 1 μA. This voltage/current range is used in low-energy IoT devices [17]. Furthermore, it is compatible with the existing energy-harvesting IC, such as power-storing buck DC–DC converters used for photovoltaic and vibration power generation elements [18]. Typically, a DC–DC converter is used in combination with storage batteries to ensure high efficiency and a maximized current supply in the order of 1 mA [19]. Therefore, the developed circuit system with the Wiegand sensor can be used with a storage battery; it allows for a higher capability of current consumption and can be used as a power supply for IoT devices.

5. Conclusions

We designed a self-oscillating boost converter circuit connected to the Wiegand sensor. The Wiegand sensor consists of an FeCoV magnetic wire with a diameter of 0.25 mm, length of 11 mm, and pickup coil with 3000 turns wound around the wire. This magnetic wire, i.e., the Wiegand wire, generates a peak pulse voltage of 4.62 V and 20 µs width during the magnetization reversal of its outer layer under a lower coercive field. An alternating magnetic field of 3.2 kA/m at 1 kHz was applied to the Wiegand sensor and alternating positive and negative pulse voltages were induced in the pickup coil. A DC voltage of 2.77 V was obtained by a bridge rectifier and a smoothing capacitor connected to the Wiegand sensor. This DC voltage could be intensified to approximately 5 V through a self-oscillating boost converter circuit. The experimental results of the voltage/current and ripple characteristics agreed with the simulation results. This study represents a significant development pertaining to the use of the Wiegand sensor as a power source for battery-less devices and modules.

Author Contributions

Conceptualization, Y.T.; Methodology, Y.T. and S.S.; Investigation, X.S. and H.I.; Writing—Original Draft Preparation, X.S.; Writing—Review and Editing, Y.T. All authors have read and agreed to the published version of the manuscript.

Funding

This research was partially funded by the JSPS KAKENHI, grant number 19K21965.

Conflicts of Interest

The authors declare no conflict of interest.

References

  1. Dhananjay, S.; Gaurav, T.; Antonio, J. A survey of Internet-of-Things: Future vision, architecture, challenges and services. In Proceedings of the IEEE World Forum on Internet of Things, Seoul, Korea, 6–8 March 2014; pp. 287–292. [Google Scholar]
  2. Balakrishna, S.; Thirumaran, M.; Solanki, V.K. A framework for IoT sensor data acquisition and analysis. EAI Endorsed Trans. Internet Things 2018, 4, 1–13. [Google Scholar] [CrossRef]
  3. Citroni, R.; Di Paolo, F.; Livreri, P. Evaluation of an optical energy harvester for SHM application. Int. J. Electr. Comm. 2019, 111, 152918. [Google Scholar] [CrossRef]
  4. Sharpes, N.; Vučković, D.; Priya, S. Floor tile energy harvester for self-powered wireless occupancy sensing. Energy Harvest. Syst. 2016, 3, 43–60. [Google Scholar] [CrossRef]
  5. Morimura, H.; Oshima, S.; Matsunaga, K.; Shimamura, T.; Harada, M. Ultra-low-power circuit techniques for mm-size wireless sensor nodes with energy harvesting. IEICE Electron Express 2014, 11, 1–12. [Google Scholar] [CrossRef] [Green Version]
  6. Wiegand, J.R.; Velinsky, M. Bistable Magnetic Device. U.S. Patent 3820090, 25 April 1972. [Google Scholar]
  7. Dlugos, D.J.; Small, D.; Siefer, D.A. Wiegand Effect Energy Generator. U.S. Patent 6191687, 24 September 1998. [Google Scholar]
  8. Takahashi, K.; Takebuchi, A.; Yamada, T.; Takemura, Y. Power supply for medical implants by Wiegand pulse generated from a magnetic wire. J. Mag. Soc. Jpn. 2018, 42, 49–54. [Google Scholar] [CrossRef] [Green Version]
  9. Takemura, Y.; Fujinaga, N.; Takebuchi, A.; Yamada, T. Battery-less Hall sensor operated by energy harvesting from a single Wiegand pulse. IEEE Trans. Magn. 2017, 53, 4002706. [Google Scholar] [CrossRef] [Green Version]
  10. Erickson, R.W.; Maksimovic, D. Fundamentals of Power Electronics; Springer: Boston, MA, USA, 1997. [Google Scholar]
  11. Liu, K.H.; Lee, F. Zero-voltage switching technique in DC/DC converters. IEEE Trans. Power Electron. 1990, 5, 293–304. [Google Scholar] [CrossRef]
  12. Saggini, S.; Ongaro, F.; Corradini, L.; Affanni, A. Low-power energy harvesting solutions for Wiegand transducers. IEEE J. Emerg. Sel. Top. Power Electron. 2015, 3, 766–779. [Google Scholar] [CrossRef]
  13. Yang, C.; Sakai, T.; Yamada, T.; Song, Z.; Takemura, Y. Improvement of pulse voltage generated by Wiegand sensor through magnetic-flux guidance. Sensors 2020, 20, 1408. [Google Scholar] [CrossRef] [Green Version]
  14. Chang, C.-C.; Chang, J.-Y. Novel Wiegand-effect based energy harvesting device for linear magnetic positioning system. Microsyst. Technol. 2020, 26, 3421. [Google Scholar] [CrossRef]
  15. Tanaka, H.; Takemura, Y.; Abe, S.; Kohno, S.; Nakamura, H. Constant velocity of domain wall propagation independent of applied field strength in Vicalloy wire. IEEE Trans. Magn. 2007, 43, 2397–2399. [Google Scholar] [CrossRef]
  16. Sun, X.; Yamada, T.; Takemura, Y. Output characteristics and circuit modeling of Wiegand sensor. Sensors 2019, 19, 2991. [Google Scholar] [CrossRef] [Green Version]
  17. Newell, D.; Duffy, M. Review of power conversion and energy management for low-power, low-voltage energy harvesting powered wireless sensors. IEEE Trans. Power Electron. 2019, 34, 9794–9805. [Google Scholar] [CrossRef]
  18. R1801K. Available online: https://www.mouser.co.uk/datasheet/2/792/r1801k001a_eev-1917814.pdf (accessed on 6 May 2021).
  19. Drew, J. Powering a Dust Mote from a Piezoelectric Transducer. Available online: https://www.analog.com/jp/technical-articles/powering-a-dust-mote-from-a-piezoelectric-transducer.html (accessed on 6 May 2021).
Figure 1. Two states of magnetization direction of the Wiegand wire: (a) parallel and (b) antiparallel states of the soft layer and hard core.
Energies 14 05373 g001
Figure 2. Measured waveform of the pulse voltage generated by the Wiegand sensor. The frequency of the applied magnetic field was 1 kHz.
Energies 14 05373 g002
Figure 3. Waveform of the intrinsic pulse voltage, Vin, generated from the Wiegand sensor, used to simulate the circuit through MATLAB®/Simulink®. The excitation frequency is 1 kHz.
Energies 14 05373 g003
Figure 4. Block diagram for DC conversion of the Wiegand pulse voltage.
Energies 14 05373 g004
Figure 5. DC conversion circuit connected to the equivalent circuit model of the Wiegand sensor.
Energies 14 05373 g005
Figure 6. (a) Measured and (b) simulated output voltages after DC conversion of the Wiegand pulse voltage.
Energies 14 05373 g006
Figure 7. Ripple of the output voltage.
Energies 14 05373 g007
Figure 8. Boost converter circuit.
Energies 14 05373 g008
Figure 9. Self-oscillating boost converter circuit.
Energies 14 05373 g009
Figure 10. Experimental design of the circuit for the Wiegand sensor with a self-oscillating boost converter.
Energies 14 05373 g010
Figure 11. Simulated waveforms of voltages and currents in the self-oscillating boost converter.
Energies 14 05373 g011
Figure 12. Dependence of the output voltage, Vout, on parameters L1 and C1.
Energies 14 05373 g012
Figure 13. Dependence of the output voltage, Vout, on parameter C2 and its ripple rate.
Energies 14 05373 g013
Figure 14. Waveforms of Vout, Vds, and VC1 in the self-oscillating boost converter.
Energies 14 05373 g014
Figure 15. Simulated and experimental DC output voltage, Vout.
Energies 14 05373 g015
Figure 16. Dependence of simulated and measured Vout and Iout on load resistance, RLoad.
Energies 14 05373 g016
Figure 17. Dependence of the output power, Pout, on load resistance, RLoad.
Energies 14 05373 g017
Figure 18. Dependence of measured Vout on the frequency and its ripple rate.
Energies 14 05373 g018
Figure 19. Mapping of Vout–Iout for practical applications of the Wiegand sensor with a self-oscillating boost converter.
Energies 14 05373 g019
Table 1. Parameters of the circuit elements for the Wiegand pulse voltage with a self-oscillating boost converter.
ComponentValue/Type (Model Name)
Capacitance: C120 nF
Capacitance: C260 nF
Inductance: L14.5 mH
Resistance: R4800 Ω
Diode: D1–D5low VF, Schottky (RBR3MM30A)
MOSFET: M1n-channel (RE1C002UN)
Resistance: RLOAD1 kΩ–5 MΩ
Publisher’s Note: MDPI stays neutral with regard to jurisdictional claims in published maps and institutional affiliations.

