Article

Geospatial Analysis and Environmental Impact Assessment of a Holistic and Interdisciplinary Approach to the Biogas Sector

1
Faculty of Mechanical Engineering and Naval Architecture, University of Zagreb, Ul. Ivana Lučića 5, 10000 Zagreb, Croatia
2
Faculty of Chemistry and Chemical Technology, University of Maribor, Smetanova ul. 17, 2000 Maribor, Slovenia
*
Author to whom correspondence should be addressed.
Energies 2021, 14(17), 5374; https://doi.org/10.3390/en14175374
Submission received: 27 July 2021 / Revised: 18 August 2021 / Accepted: 26 August 2021 / Published: 29 August 2021

Abstract

:
Crop-based biogas energy production, in combination with electricity generation under subsidy schemes, is no longer considered a favourable business model for biogas plants. Switching to low-cost or gate fee feedstocks and utilising biogas via alternative pathways could contribute to making existing plants fit for future operations and could open up new space for further expansion of the biogas sector. The aim of this study was to combine a holistic and interdisciplinary approach for both the biogas production side and the utilisation side to evaluate the impact of integrating the biogas sector with waste management systems and energy systems operating with a high share of renewable energy sources. The geospatial availability of residue materials from agriculture, industry and municipalities was assessed using QGIS software for the case of Northern Croatia with the goal of replacing maize silage in the operation of existing biogas plants. Furthermore, the analysis included positioning new biogas plants, which would produce renewable gas. The overall approach was evaluated through life cycle assessment using SimaPro software to quantify the environmental benefits and identify the bottlenecks of the implemented actions. The results showed that the given feedstocks could replace 212 GWh of biogas from maize silage in the relevant region and create an additional 191 GWh of biomethane in new plants. The LCA revealed that the proposed measures would contribute to the decarbonisation of natural gas by creating environmental benefits that are 36 times greater compared to a business-as-usual concept. The presented approach could be of interest to stakeholders in the biogas sector anywhere in the world to encourage further integration of biogas technologies into energy and environmental transitions.

1. Introduction

The paradigm of development for the European biogas sector has changed significantly in recent years owing to higher sustainability requirements and cost production reduction as the main drivers of new trends in biogas production and utilisation [1]. Most biogas plants (especially in less mature biogas systems) still use cultivated energy crops (primarily maize silage), which increase the inefficient use of arable land and compete with food production [2]. Since such a practice is not in line with the principles of sustainable development, the biogas sectors among the European countries limited the utilisation of maize silage and corn to a share of 30–50% of the total input feedstock [3,4], and a further decrease in the use of maize silage is expected.
In 2018, the European Commission adopted a revised version of the Renewable Energy Directive (RED II), which stated that the biomass fraction of municipal waste, biowaste and streams from industry and agriculture [5] should play a greater role in future biogas production since they have a low indirect land-use change impact to produce biofuel [6]. In addition, the RED II determined that wastes and residues from agricultural activities and processing shall be considered to have zero life cycle greenhouse gas (GHG) emissions up to the process of the collection of those materials. This opens a space for these materials to enter the biogas sector and contribute to the transition towards more sustainable and efficient waste management systems [7].
In addition to facing the feedstock-changing policy, biogas plant owners and operators also look towards alternative biogas utilisation pathways compared with producing heat and electricity under subsidy models [8]. The biogas sector in the EU28 recorded a rapid increase in the number and capacity of installed plants in the period 2009–2012 [9]. The earliest of these biogas plants are near the completion of their subsidised operation, as these subsidies were granted for 12–20 years, depending on the country [10]. In the post-subsidy era, the operation of biogas plants on the day-ahead market could only be viable in the case of low-cost feedstocks or by implementing the feedstock gate fee business model [11]. Among the most likely alternatives after the expiry of subsidies are biogas upgrading, the production of biomethane [12] and/or the integration of the power-to-gas (P2G) concept using variable electricity from wind and solar to produce e-methane [13]. Renewable methane with natural gas quality (ca. >96% CH4 [14]) can be directly injected into the gas grid or stored on location as compressed or liquified gas [15].
A geographical information system (GIS) was recognised as a valuable tool for the detailed mapping and planning of new energy projects [16] and in assessing the environmental and economic benefits of renewable energy source (RES) integration [17]. In the context of bioenergy, geospatial investigation contributes to the assessment of the physico-chemical properties of biomass, facilitating the choice of the best technologies for application in the studied region [18]. The geospatial assessment of the energy potential of crop residues and manure for biogas production in the EU showed the yearly availability of 0.7 EJ (ca. 195 TWh) [19], which was ca. double the EU production of biogas from agricultural feedstocks in 2016. The bottom-up GIS model applied in the assessment of biomass potential from grasslands in Northwest Europe showed that ca. 45% of the sustainable grass could be utilised for energy production purposes in the model region [20]. Another bottom-up analysis of using animal manure from various husbandry operations in East Croatia showed the potential of feedstock to produce 6.5 GWh of biogas, which could generate double the yearly electricity consumption of that municipality [21]. The top-down mapping of agricultural residues in Croatia using Quantum GIS (QGIS) software [22] showed that stover, straw and stalk could generate biogas potential up to 3000 MWh/(km2∙a) in the extensive agricultural regions of Croatia. ArcGIS software was applied to reveal the potential of renewable electricity generation from municipal solid waste, including organic and dry material in Iran [23]. The results showed that the studied region could produce ca. 2% of the total household electricity consumption, while achieving the avoidance of 6.7 thousand tons of CO2eq/year due to the proposed measures. Integrated tools in GIS software allow users to determine important factors when assessing the availability of feedstocks for biogas production, such as the length of transportation routes from the biomass harvesting location to the biogas plant and the optimal location for setting up a new biogas plant. [24]. In this sense, QGIS was successfully applied when determining the optimum area for establishing the biogas hub in Karditsa, Greece [25]. The results showed that the optimal distance between the available biomass sources and the planned hub was ca. 20 km in order to maintain a feasible hub operation. ArcGIS was applied when finding an optimal biogas plant sited on the territory of Ohio in the United States for the case of corn stover and wheat straw [26]. It was found that the average biomass availability radius for that case ranged between 22 and 34 km in the case of 10 newly examined biogas plants. The same software was applied to the case of Southern Finland with the goal of quantifying the relationship between the length of transportation distances to deliver feedstocks to existing biogas plants and an increase in their production capacity [27]. Increasing the radius of biomass collection from 10 to 40 km could increase biogas plant production capacity by ca. 10–127%. However, the study did not reveal the impact of a capacity extension on the environmental performance of plants.
From environmental and economic points of view, the penetration of bioenergy into energy production systems (especially the ones based on fossil fuels) could bring multiple contributions and benefits [28]. As the price of the carbon tax increases, so will the switch to carbon-neutral and carbon-sink resources. In the context of this research, the application of a life cycle assessment (LCA) can reveal the actual environmental impact of feedstock-changing policies in biogas production and utilisation related to future energy systems [29]. It was shown that sugar beet generates ecological effects that are similar to those of maize crops in bioenergy production [30], while intercropping forage sorghum with maize contributes to a lower environmental impact than a maize monoculture [30]. Examining the environmental impact assessment of replacing maize silage with marine macroalgal biomass using SimaPro (an LCA software) showed a reduction in the environmental burden in almost all the impact categories that were examined. However, the significantly longer transport route for algae (150 km) compared to maize silage (12 km) resulted in higher values in the global warming potential (GWP) category, from 140 g CO2-eq/kg(energy crops), to 160 g CO2-eq/kg(macroalgae). A similar observation was also found by the authors of the present study in the case of applying residue grass from landscape management as a replacement for maize silage in existing biogas production [31]. Biogas plants that are fed with agro-industry by-products and waste, such as distiller’s waste, rapeseed cake, cheese whey, pulp, seeds, peel, and fruit and vegetable residues, yielded better environmental performances than those fed with cereal silage [32]. Nevertheless, the overall environmental performance also depends on the variability in terms of the total solids/volatile solids (TS/VS) content, specific biogas yield, origins and other factors [32]. A comparison of the LCA performance for a biogas plant fed with animal manure and energy crops for various biogas utilisation pathways [33] showed that biogas for electricity generation saves around 300 kg CO2/MWh(electricity), while upgrading biogas to biomethane and its injection into the gas grid saves 191 kg CO2-eq/MWh(biomethane). Another study of LCA claimed that using biogas in cogeneration achieved better overall environmental results compared to biogas upgrading [34]. In both studies, the details about the considered electricity mix in the study were not provided, and the results were not presented using the same reference point. Projections from the Joint Research Centre (JRC) of the European Commission (EC) showed that by 2030, the further penetration of renewable energy sources (primarily wind and solar photovoltaic) will decrease the overall GHG emissions of the electricity generation sector [35]. The integration of P2G and methanation in a biogas plant to fully exploit biogenic CO2 potential yielded better environmental performance, with a projected European electricity mix for 2030 compared to 2016 [36]. In the case of Ireland, an LCA of a biogas upgrade with P2G integration showed that using an electricity mix with an 85% share of renewables could satisfy the GHG savings of 70% compared to fossil fuels [37]. Future development of P2G efficiency and the integration of renewable credits from CO2 valorisation could increase the competitiveness of the biogas sector in future energy systems [38].
Based on the detailed literature review, there is no reported research that integrally analyses the geospatial availability of novel feedstocks in the replacement of maize silage in biogas production, combined with the environmental impact assessment of feedstock replacement and alternative biogas utilisation pathways in future energy systems operating with a high share of RES. To address this gap in the scientific literature, the research objectives were as follows:
  • To assess the energy potential for biogas production using lignocellulosic residues, agri-food industry streams and the biodegradable fraction of municipal waste;
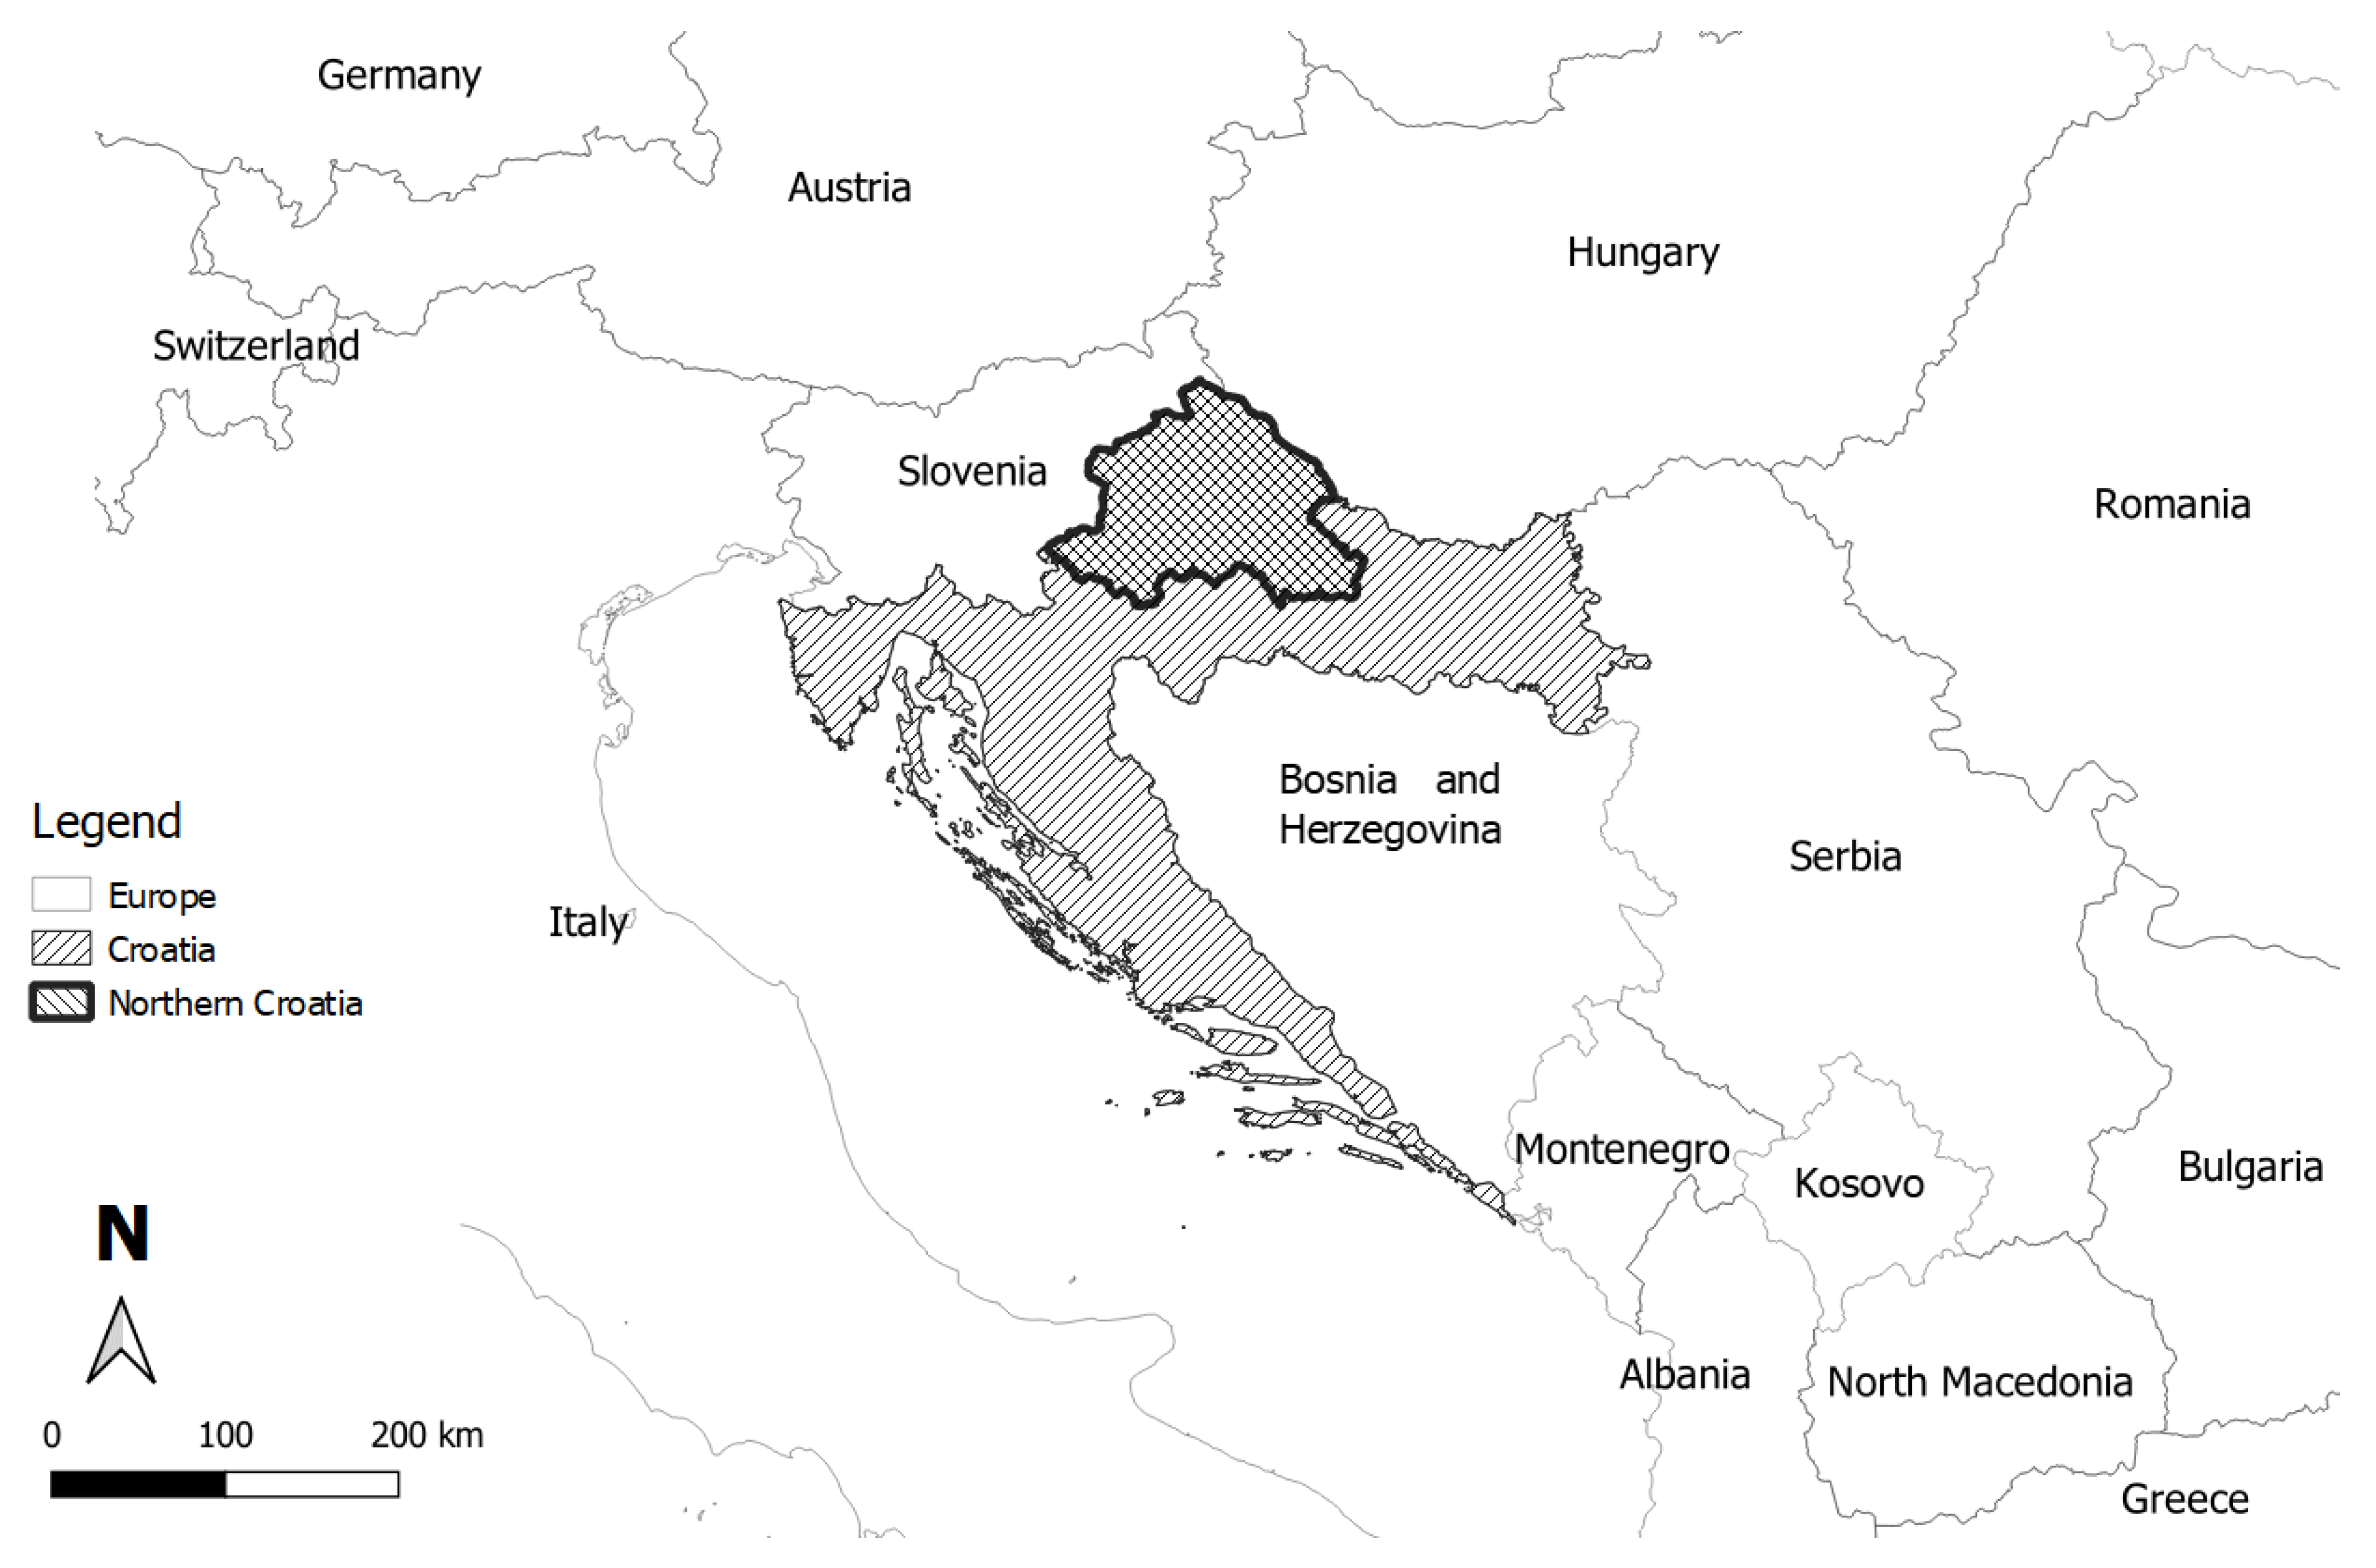
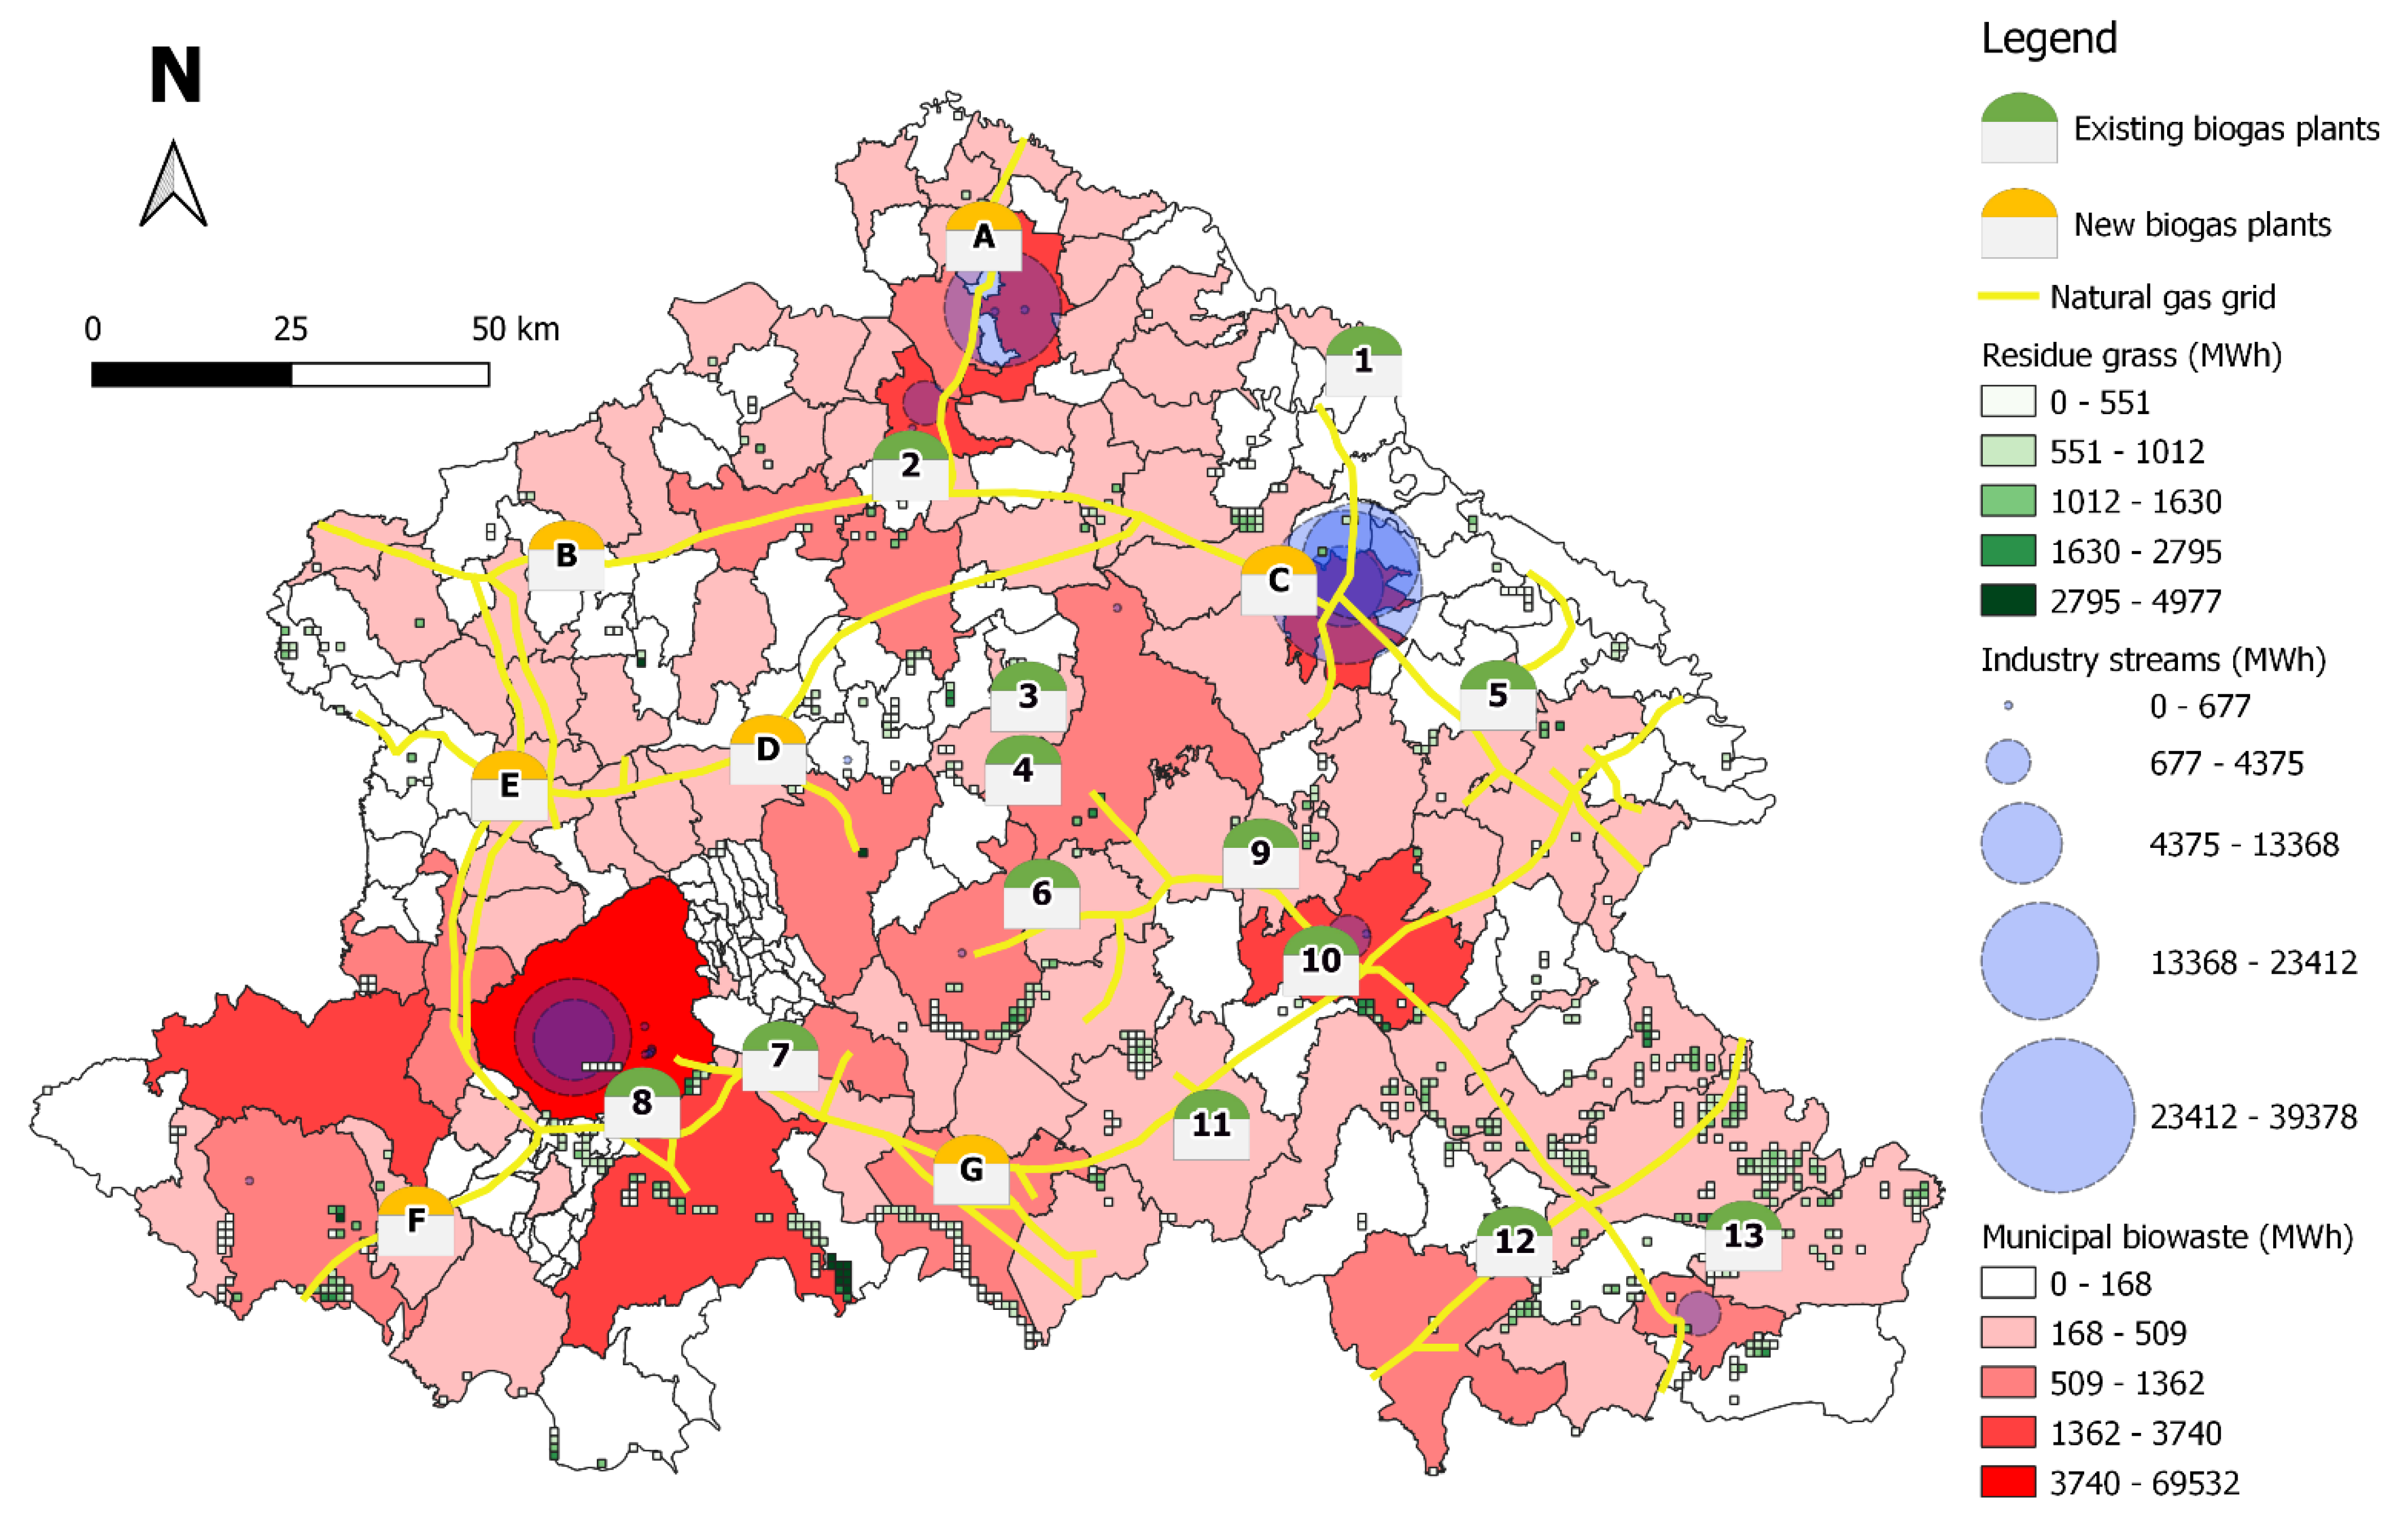
  • To present the geospatial distribution of the energy potential of novel feedstocks using a GIS mapping approach and to determine which existing and newly added biogas plants are suitable to contribute to natural gas decarbonisation;
  • To estimate the environmental impact via using an LCA of novel operational measures on the biogas production side and the utilisation side, while using actual biogas plants as test cases.
The hypothesis of this research was that applying a holistic approach to biogas plants, on both the production and utilisation sides, can increase environmental benefits over the current operation based on maize silage utilisation and baseload electricity production.

2. Materials and Methods

This section presents the materials and methods that were applied in this research. The first step was to determine the quantity of alternative feedstocks for biogas production and their energy potential. The second step included the mapping and data processing in QGIS software to present the geospatial availability. The final step was the assessment of the environmental impact of the proposed measures on the biogas sector using SimaPro software.

2.1. Alternative Feedstocks to Maize Silage

The target feedstocks in this research were divided into three specific types by place of origin and approach when estimating their potential for biogas production. Their selection was based on previous studies conducted by the authors and on the objective of using waste material sources in biogas production that are not competitive with food production.
The technical potential of biodegradable municipal waste (Ptech,biowaste) in tonnes was estimated at the municipality level (i) using the following relation:
Ptech,biowaste(i) = Dpop(i) × Area(i) × Sbiowaste(i)
where
Dpop(i) is the population density (cap/km2);
Area(i) is the area of the municipality (km2);
Sbiowaste(i) is the specific biowaste generation per person (t/cap) living in the studied municipality.
The second group of feedstocks included residue grass (RG) originating from landscape management and generated on uncultivated land, riverbanks and highway verges [31]. The technical potential of residue grass (Ptech,RG) in tonnes on the examined grasslands (j) was assessed using Equation (2):
Ptech,RG(j) = Ncut(j) × Area(j) × SRG(j)
where
Ncut(j) is the number of cuts per year, usually between 2 and 4 [20];
Area(j) is the area of the pasture (km2);
SRG(j) is the specific yield of grass on the grassland (t/km2).
The third group of feedstocks included industry waste, co-products and by-products from crop and animal processing, as well as food and beverage manufacturing. These included wastewater sludge, fat, oil and grease, spent materials, the biodegradable fraction of industry waste and co- and by-products that cannot be used as animal feed [39]. The authors sought actual data on waste generation in the processing plants. This was done using technical annual reports, recent environmental impact studies, master’s theses and the national registry for environmental pollution. In several cases, these sources were unavailable; instead, the authors estimated the amount of generated waste using the yearly production capacity and specific ratios of generated waste per unit of processed raw material [40]. All details regarding the assessed biogas potential and the relevant literature sources are given in Supplementary Material.
To assess the biogas potential using the above-mentioned feedstocks in an anaerobic digestion process (Efeedstock), the following relation was used:
Efeedstock = Ptech,feedstock × Yfeedstock × LHVmethane
where
Yfeedstock is the methane potential of the studied feedstock expressed over fresh material (FM) (m3/tFM);
LHVmethane is the lower heating value of methane (kWh/m3).

2.2. GIS Mapping and Data Processing

Georeferenced data on settlement boundaries and land-use maps were used to perform GIS mapping of the biogas potential. An open-source QGIS software, version 3.10.4-A Coruña [41], was used to conduct this stage. This included the use and creation of raster and vector layers, as well as the application of the integrated tools, which are elaborated further in the article. The advantages of using QGIS over some other software for GIS mapping are its free availability, stability during data processing and numerous accessible plugins and modules that allow users to create added value for the project [42]. Data on the yearly availability of biogas potential that was calculated in the previous stage was joined to the georeferenced layer of the case layer. The CORINE Land Cover inventory [43] was used to perform a spatial distribution of biogas potential from residue grass in the given region. The category 2.3.1 Pastures was selected for the mapping of residue grass potential since it presents the data on permanent grassland (pastures and meadows) [20]. The analysis included uncultivated land, riverbanks and highway verges, while other pastures were not considered. To present the distribution of the biogas potential of yearly residue grass biomass, the following equation was used:
ERG(m) = Area(j)/Area(tot) × ERG(j)
where
ERG(m) is the biogas potential for the examined area that uses the grid (MWh);
Area(j) is the area of specific grassland (1 km2);
Area(tot) is the total grassland area (km2);
ERG(j) is the biogas potential for the relevant grassland (MWh).
In the case of biodegradable industry waste, the point source layer was used, while municipal biowaste was presented at the level of the municipality. To determine which of the existing biogas plants would be suitable to switch from electricity production towards renewable methane production alone (as proposed in our previous research [13]), the position of the natural gas grid was determined. More details on how the natural gas grid was extracted are presented in Section 3.2. To estimate the distance between the feedstock position and the biogas plant, an Online Routing Mapper tool was used, while to find the shortest path to connect the biogas plant to the natural gas grid, a Measure Line tool in QGIS was used. The Buffer tool and Join attributes by location (sum) were applied to estimate the area with the same energy potential of examined feedstock as the one with maize silage. In the end, an optimal location for setting up new biomethane-producing plants was determined based on the availability of feedstocks and the distance to the natural gas grid.

2.3. Life Cycle Assessment

The life cycle assessment was conducted according to International Standard Organization (ISO) 14040/14044 standards [44] using SimaPro software (v7.3.3, PRé Sustainability, Amersfoort, The Netherlands). The study aimed to estimate and compare the environmental effects of applying the proposed measures to both the biogas production side and the utilisation side using actual biogas plants as test cases. The system boundary included all the processes regarding feedstock collection and transportation, the production of biogas in the anaerobic digestion plant and biogas utilisation in a combined heat and power (CHP) unit or to produce renewable gas. The analysis did not include the environmental features of electricity, heat and renewable gas utilisation in any energy sector specifically. To be in line with the RED II, all pre-collection processes for waste and residues were considered to have zero emissions. The feedstock properties and the biogas production via anaerobic digestion were obtained from previous laboratory analyses and published articles. In addition, the calculated biogas potential and location features obtained by processing the data in QGIS software were taken as inputs. All other data were obtained from the Ecoinvent v2.2 [45] database.
The functional unit for this study was defined as the production of 1 m3 of CH4 during the anaerobic digestion of selected feedstocks, which would be further utilised in various pathways, as presented in the scenarios. The chosen impact assessment methods were Impact 2002+ [46], which is a method that evaluates several midpoint categories that re grouped as a single score and a global warming potential (GWP) that was calculated over a 100 y time horizon (GWP100). The results of the LCA analysis are shown in Section 4.2.

3. Case Study

The region of Northern Croatia [47] was selected for the case study and is shown in Figure 1.
In 2019, the region was home to 1,622,651 people (ca. 40% of the total population of Croatia) [48] living in an area of 11,309 km2 (ca. 20% of total Croatian land). The average population density in the region is 144.1 cap/km2, which is double the average population density of Croatia. Food processing, production of goods and agricultural activities are highly developed in the region. There are 13 biogas plants in the area, which operate mostly using maize silage.

3.1. Biogas Plants in Northern Croatia

The installed capacity of biogas plants operating under the subsidy mechanism (feed-in-tariff) in Northern Croatia was taken from the annual report of the Croatian Energy Market Operator Ltd. (HROTE) [49], as shown in Table 1. References related to the feedstocks in use and quantity were taken from publicly available data (only in Croatian), such as master’s theses, environmental management studies and reports and biogas plant webpages.
By applying Equation (3) to the data presented in Table 1 and their specific methane yield shown in Supplementary Material, the total energy potential of feedstocks in the given biogas plant was shown in Table 2. Furthermore, the contribution (share) of maize silage to the total biogas energy production of each biogas plant is presented.
Even though the overall share of maize silage in the biogas plants corresponded to ca. 40% of the input feedstock mass, it produced ca. 70% of the total energy in these biogas plants. Biogas plant no. 7 was the only one in this case that operated without using maize silage. The plant was designed to operate using biodegradable waste from canteens, restaurants and kitchens in a two-stage mesophilic process [39]. Landfill plant no. 8 [57] operated using mixed municipal waste from the city of Zagreb.

3.2. Input Data

The biogas yield of the given feedstocks is shown in Supplementary Material. For Equations (1)–(3), the input data was taken as follows:
  • Dpop(i) was taken from the Croatian Bureau of Statistics [59] (available only in Croatian);
  • Sbiowaste(i) was estimated using the data on the total generation of municipal waste per capita (kg/cap) (Table 9 in [60]), with the estimation that 32% of municipal waste is biodegradable [61];
  • Area—determined using QGIS;
  • Ncut(j)—in this study, this was considered to be 2 for a 1 km × 1 km grid;
  • Yfeedstock—assessed in previous studies (Supplementary Material);
  • LHVmethane—10 kWh/m3 [21].
The layer of the existing natural gas transportation grid in this region was created using the Georeferencer tool in QGIS [62] and the map was taken from the Environmental Justice Atlas [63].
The electricity generation mix was taken from the report by the Ministry of Economy and Sustainable Development of the Republic of Croatia and the Hrvoje Požar Energy Institute (available only in Croatian) [64]. The reference year was 2018, and the data on electricity mix projections were taken for 2030, 2040 and 2050, as shown in Table 3.

4. Results and Discussion

This section presents the main results and the related discussion in terms of this study and its research objectives. First, the assessment of biogas potential and a model of geospatial distribution are presented. The results of the data processing using integrated tools were disseminated in terms of a transition towards alternative solutions for both the biogas production and utilisation aspects. The assessment of environmental impact verified the hypothesis of the study.

4.1. Biogas Potential Assessment and GIS Map

Figure 2 presents a map of the biogas potential from the given yearly feedstocks for municipalities in Northern Croatia. Due to its size and complexity, the results for the city of Zagreb are presented at the settlement level.
The results shown in Figure 2 represent the assessed energy potential for biogas production from alternative substrates in the study region and the position of existing biogas plants for which the transition from maize silage is proposed. Next, the geospatial analysis of the biogas sector included finding a natural gas network that, together with the assessed biogas potential, identified the locations where new biogas plants should be installed. The analysis also included an assessment of the contribution of renewable gas production in new plants towards the decarbonisation of the natural gas sector. Overall, the results of this study demonstrated the scientific contribution in terms of an interlinked GIS model and LCA tool to investigate the role of the biogas sector in the future energy systems in more detail; the presented approach could also be of interest for stakeholders and the actual implementation of proposed measures. A comprehensive analysis of all results is given in the following subsections.

4.1.1. Biowaste from Municipalities

Biowaste from municipalities (household waste) can serve as a valuable source of biogas given the relatively high biogas yield of 100–150 m3/tFM [7,65,66] An experimental study by the authors of this research on using biodegradable waste from kitchens, canteens and restaurants (similar to the composition of municipal biowaste) showed the biogas yield of such material to be equal to 0.566 Nm3/kg TS (equal to ca. 110 m3/tFM), with an average methane share of 60 vol% [39]. Another previous study showed that the biogas potential of municipal biowaste in the relevant region was found to be 116 GWh [22]. In this study, using the data presented in Annex 1 and the methods described, the same potential was found to be 125 GWh, which is ca. 8% higher than in the previous report. The amount of separately collected biowaste (the organic fraction of municipal solid waste) from the municipality of Zagreb amounted to 59,136 t [61]. In this research, the authors found the overall amount of biowaste generation in Zagreb to be ca. 120,000 tones. The gap between the collected and amount of the assessed biowaste corresponded with the fact that not all organic waste generated by Zagreb households is separately collected and considered as biowaste. Namely, for materials like processed (cooked) food, meat left-overs, dairy products, oils and fats, it is not mandatory to separate these as biowaste under the present waste management system [67]. Moreover, based on these numbers, it can be concluded that the capital city of Croatia recovers only 50% of its total biowaste potential. To increase the exploitation of biowaste for biogas, companies that are responsible for biowaste collection should implement additional measures to increase the awareness of citizens regarding biowaste separation. Moreover, it is necessary to apply the proper infrastructure for biowaste collection (e.g., hermetically sealable containers, as in the case of Vienna [68]) in order to obtain the maximum amount of energy from biowaste. In this sense, the assessed potential was found to be 70 GWh of biogas from municipal biowaste in the city of Zagreb, which would be sufficient to run the existing cogeneration plant for the production of electricity [57]. In this sense, the installation of biogas fermenters would be required after closing the landfill. It was found that for the energy recovery of 120,000 tons of municipal biowaste per year, an installation of 13,200 m3 of fermenter equivalent capacity is required, using an average of 40 days of feedstock retention time [69].
In a previous study, the authors of this research investigated the integration of the P2G concept in the operation of a food-waste-based biogas plant (no. 7) with the goal of producing renewable methane [13]. The same biogas plant was studied in LCA by the current research to assess the environmental impact of replacing electricity generation with the production of renewable gas in an energy system operating with a high share of RES.

4.1.2. Lignocellulosic Biomass from Landscape Management

Lignocellulosic biomass in the form of residue grass showed a relatively high potential for biogas production. For the studied case, the potential was estimated to be ca. 505 GWh. In the same region, the biogas potential from lignocellulosic biomass leftovers (straw, stalk and stover) originating from the agricultural production of oat, barley, triticale, soya-beans, rapeseed, maize and wheat was found to be ca. 2000 GWh [22]. As presented in the results, the given region had a surplus of residue grass potential to be utilised for biogas. However, such values are probably not economically feasible, and collection would be logistically challenging [20].
For example, analysis of the map in Figure 1 shows that, for the production of 903 MWh of biogas using residue grass collected in the south-western area of the case study, the estimated length of the transport route to the nearest biogas plant (no. 7) is more than 100 km. On the other hand, to replace all maize silage with residue grass in biogas plant no. 12, the estimated radius of the available feedstock amounted to ca. 11 km, resulting in a maximum transportation path of ca. 14 km. As presented in Figure 1, the southern and south-eastern areas of the case study showed the highest potential to be considered for biogas production from residue grass. This was because these areas have many water surfaces and watercourses whose banks should be maintained by mowing and collecting the grass.
The latest economic and energetic evaluation of using maize silage (with a purchase price of 54 EUR/t) in anaerobic digestion showed that a transportation distance of up to 18 km is convenient to ensure feasible biogas plant operation in Italy [70]. In the Croatian case, the latest price of maize silage of 34 EUR/t determined that a transportation distance between 24 and 38 km is still feasible for those biogas plants operating under the feed-in tariff [71]. This study revealed that locally available residue material, such as grass, with no actual cost of materials (except harvesting and transport, which are in total estimated at ca. 16 EUR/t [11]), could replace maize silage in the actual biogas production within the same, and even lower, transportation distances. Therefore, biogas plant no.12 was selected to be further evaluated in the LCA by replacing maize silage with residue grass and utilising biogas for biomethane instead for electricity and heat generation.

4.1.3. Biodegradable Streams from the Food-Processing Industry

The total biogas potential of biodegradable waste originating from industry was found to be ca. 138 GWh, of which, ca. 9% was from meat processing, ca. 57% from food manufacturing and ca. 34% from the beverage and drinks industry.
The most common industrial waste appeared to be sludge from wastewater treatment plants, with about 44% of the mass share of the total amount of industrial waste. The methane yield for sludge was found to be between 20.6 ± 5.4 and 69.3 ± 22.3 m3(CH4)/tFM (more details are provided in Table S1, Supplementary Material). It is known that sewage sludge and sludge from industrial processes are usually poor in VS content since they have a long retention time, which gives them low biogas potential [72]. In the case of the food-processing industry in Northern Croatia, sludge contributes only ca. 30% to the overall biogas potential. Mixed industry biowaste, which is mainly composed of whey, fruit and vegetable waste, pomace, yeasts, etc., showed a yield of 22.0 ± 5.0 m3(CH4)/tFM. Since such material is not rich in total solids and volatile solids, the low biogas yield was expected [73]. For coffee pulp and spent brewery grains, the methane yields were found to be 59.2 ± 12.4 and 66.4 ± 23.3 m3(CH4)/tFM, respectively. Fat, oil and grease waste showed a relatively high range of biogas potential at 138.0 ± 43.8 m3(CH4)/tFM, while materials like husks, bran and pastry residues had a biogas potential of 138.4 ± 16.0 m3(CH4)/tFM.
The highest methane yield was found for meat and bone meal (272.6 ± 11.2 m3(CH4)/tFM). Since such a substrate was studied in previous research by the corresponding author [39], it was determined that in the present biogas production, MBM could not be used as a mono-substrate, owing to the high share of nitrogen, but rather as a co-substrate to municipal biowaste. In this sense, it was found that MBM did not interrupt the stability of the process if it added up to 5% of the TS share, which corresponded to 1% of the total FM share. Therefore, the assessment was made that only 1% of the available MBM could be used in onsite biogas production. On the other hand, in the present case, the MBM was entirely exported from the facility and used as fuel in thermal processes (pyrolysis and combustion) [74].

4.1.4. Replacement of Maize Silage in Biogas Production

To summarise the geospatial availability of the applied method, Table 4 presents the range of the radius from each biogas plant inside which there is an energy potential for the examined feedstocks that is equivalent to that for maize silage.
The maize silage that is used in biogas plant nos. 1, 4, 9 and 11 would be difficult to fully replace in energy content using alternative feedstocks. Either the local availability of feedstocks is poor (as for biogas plant nos. 1 and 9), or the installed capacity of the biogas plant is high (>2.0 MWel as for nos. 4 and 11), which requires an excessive biogas production rate. Most of the energy potential in the replacement of maize silage comes from municipal biowaste and residue grass, while only a small share of the total potential could be generated by industry streams. The reason for this was that the biogas plants were relatively far from industrial sites (>20 km), which calls into question the feasibility of transporting such feedstock over long distances.

4.1.5. Connecting Existing and New Biogas Plants to the Natural Gas Grid

The length of the natural gas transport system in this case was 1151 km, which corresponded to ca. 43% of the total length of the natural gas transport system (2693 km) [75].
The geospatial analysis of biogas plant positions showed that some were ready to integrate biogas upgrading technology and produce renewable gas since their distances to the natural gas grid were relatively low (less than 2 km). Table 5 shows the measured distance between the biogas plants and the nearest natural gas pipeline.
The distance of existing biogas plants to the natural gas grid could serve the operators of biogas plants in assessing the total investment costs of biomethane production. The distance determines the economic feasibility regarding whether biomethane would be injected into the natural gas grid or stored on-site as a compressed gas. Overall, it would determine the further utilisation of biomethane, as well as its price [11]. Biogas plants nos. 5, 7, 10 and 12 (current total installed capacity of 4.0 MWel) displayed the highest potential for connection to the natural gas grid. Based on the current biogas production in those plants, it was estimated that they could inject 19 GWh of biomethane into the grid.
Apart from connecting existing plants to the natural gas grid, the analysis included assessing the position of newly added biogas plants operations using the examined feedstocks (within the 15 km feedstock availability zone) in this region. In addition, new biogas plants were positioned directly on the natural gas transport grid. The position of new biogas plants was determined in accordance with the European Biogas Association, which assumes that future biogas plants will operate to produce renewable gas and contribute to the decarbonisation of the gas sector [76]. Table 6 presents the potential of biomethane production in newly added biogas plants.
The total potential for biomethane production in the relevant region (after replacing maize silage with the specified feedstocks in existing biogas plants) was found to be ca. 191 GWh. The highest potential for biomethane production was assessed for the new biogas plant C, which would be positioned near the highest availability of industry streams (ca. 50% of the total industry potential found in the case study). Therefore, biogas plant C was evaluated using an LCA as a replacement for natural gas imports with the goal of assessing the environmental impact of using these feedstocks combined with a biomethane pathway.
Adding the potential of 191 GWh for the new plants to 19 GWh of biomethane for existing ones, the region could integrate ca. 210 GWh of biomethane into the grid, which is, however, only ca. 0.7% of the natural gas consumption in Croatia (ca. 30 TWh) [77]. Based on the brief analysis, it can be concluded that the existing capacity of biogas plants in the region, together with the newly added ones, cannot make a significant contribution to the decarbonisation of natural gas.

4.2. Environmental Impact Assessment

Based on the analysis of actual biogas plants, three scenarios, each with two cases, were selected and evaluated using an LCA, as shown in Table 7.
Scenario I presented the feedstock transition from maize silage to residue grass and the switch from operation in cogeneration mode to biogas upgrading using pressure swing adsorption (PSA) technology and biomethane production. Scenario II demonstrated the impact of P2G integration into an existing food-waste-based biogas power plant. Scenario III aimed to investigate the environmental performance of replacing natural gas (in pipelines) using the biomethane produced from waste and residue materials in a newly established biogas plant.
The LCA yielded results that should be explained carefully given the complexity of the analysis and the quality and quantity of the data that were used. In general, alternative feedstocks showed lower methane yield compared to that for maize silage, which led to an increase in the required quantity of feedstock to produce the same amount of energy as when using maize silage. Digestate, as another product of anaerobic digestion, was considered for application as a fertiliser in all the scenarios and cases being examined. It should be noted that the benefits of using alternative feedstocks for biogas production instead of their decomposition on the field (landfilling), which results in avoiding GHG emissions, was not considered in this study, nor were GHG emissions related to land-use changes considered.
The overall results of the environmental performance analysis of the given scenarios are shown in Figure 3: (a) GWP and (b) single score, for the projected electricity mix.
The comparison of the LCA results for the GWP category showed that in all scenarios, the applied measures generated higher CO2eq emissions. The results for the GWP values for the referent cases ranged between 0.10 and 0.30 kg CO2eq, while those for the modified cases were between 0.51 and 2.4 kg CO2eq. Similar results and relations between the GWP values (for the functional unit of 1 m3 of biogas) were found for the comparison of biogas upgrading (1.09–1.27 kg CO2eq) and biogas cogeneration (0.57 kg CO2eq) [34]. Most emissions in the GWP category were carbon dioxide from fossil fuel combustion in the machinery and vehicles used for feedstock collection and transportation to biogas plants [31]. The referent cases were not impacted by the projected increase in RES share in the electricity mix, while in the modified cases, the GWP values decreased by ca. 17% in scenario I, ca. 44% in scenario II and ca. 18% in scenario III in 2050 compared to the referent year. These results were expected since all three modified cases used the electricity from the grid to produce renewable gas. In greater detail, the authors estimated that ca. 30% of the electricity demand for P2G integration in scenario II came from the grid [13]. The combination of grid assistance and installation of an electrolyser and a methanation unit [78] resulted in GWP values that were significantly higher than expected, which made scenario II barely acceptable if the GWP category was the only one analysed.
For the evaluation of overall environmental impact (not just GHG emissions), aggregation of the differing impacts of the category results should be done through normalisation and weighting the impact categories and then summing the results in the form of a single score. In this sense, the overall results showed that the measures applied to both biogas production and utilisation yielded significant environmental benefits over the existing operation of biogas plants, especially in scenarios I and III. The utilisation of alternative feedstocks for biomethane resulted in a process that was ca. 36 times more environmentally improved than natural gas and ca. 4 times better in terms of environmental performance than the production of heat and electricity in cogeneration mode. The results of this research can be related to a previous study by the authors in which the integration of a biogas upgrading unit into an existing biogas power plant was analysed to investigate a switch from maize silage to residue grass with the aim of mutually producing biomethane and electricity at peak power prices [11]. For that case, the thresholds for environmental benefits were determined to be −3.6 mPt and −14.0 mPt, for 1 m3 of produced and utilised CH4, respectively. The LCA of electricity production in biogas cogeneration plants in the case of the German electricity mix when using 1 tonne of feedstock as a functional unit gave a single score result of −1.4 Pt for maize silage and −4.6 Pt for food residues [79]. Even though the results of this study were significantly lower (owing to another functional unit having been selected), it is interesting that the single score results for scenario II were higher than zero, which indicates that the environmental burdens were greater than the generated benefits. This can be explained by the fact that the biowaste (in the form of food waste) considered for biogas production has zero emissions up to the point of its creation (defined by the RED II), while all other emissions and impacts on the environment came as a result of collecting the biowaste and transporting it to the site. Since a comparison with biowaste landfilling was not conducted in this study, the emissions that were avoided were not considered, which would have created additional environmental benefits. Regarding the integration of the P2G concept, it was revealed that the penetration of renewable electricity into the energy mix exerted a higher impact on the reduction of GHG emissions than on the overall environmental performance of the system.
In its present form, the studied concept lacked the integration of the social component in the analysis of the transition of the biogas sector and its role in future energy systems [80]. Therefore, the next step on this topic should include elaborating the achieved results to all stakeholders engaged in the existing sector, as well as to those that will come up in the future. To assess such a dynamic complexity in the future operation of biogas plants, causal loops were identified as a powerful tool that will open up additional perspectives on how to achieve a more sustainable and just transition of the biogas sector [81].

5. Study Limitations

The methods and materials presented here were applied to a case study of Northern Croatia. Therefore, the results of the study should be cautiously disseminated, bearing in mind the regionality factors and the case-specific nature of the data.
Analysis of the methane yield from feedstocks presented in Supplementary Material was done using previous studies and available literature sources. Based on that data, the range of values was set up and the average value used in biogas potential assessment calculations.
The injection of renewable gas was evaluated by considering the connection of biogas plants to the natural gas transport grid. The position and features of the distribution grid for this case were not considered.

6. Conclusions

The link between the use of maize silage and electricity generation under subsidy models in biogas plants is becoming weaker as the new sustainability requirements are raised. The holistic and comprehensive analysis carried out in this study showed the opportunities and challenges that existing biogas plants would face if alternative measures for both biogas production and its utilisation were implemented to contribute to EU climate and energy targets.
The geospatial availability of alternative feedstocks was shown to have a potential in Northern Croatia that was high enough to replace all maize silage in current biogas production, which is ca. 212 GWh. Moreover, after the expiration of support schemes and guaranteed prices for electricity, the analysis showed that most of the examined biogas plants were well positioned for the injection of renewable gas into the natural gas grid (<2 km of distance). Others would have to consider the installation of a storage system if applying the upgraded technology. The total potential of biomethane from newly planned biogas plants was found to be ca. 191 GWh, out of which, the plants located nearby to the source of biodegradable industry waste would produce ca. 58% of its quantity.
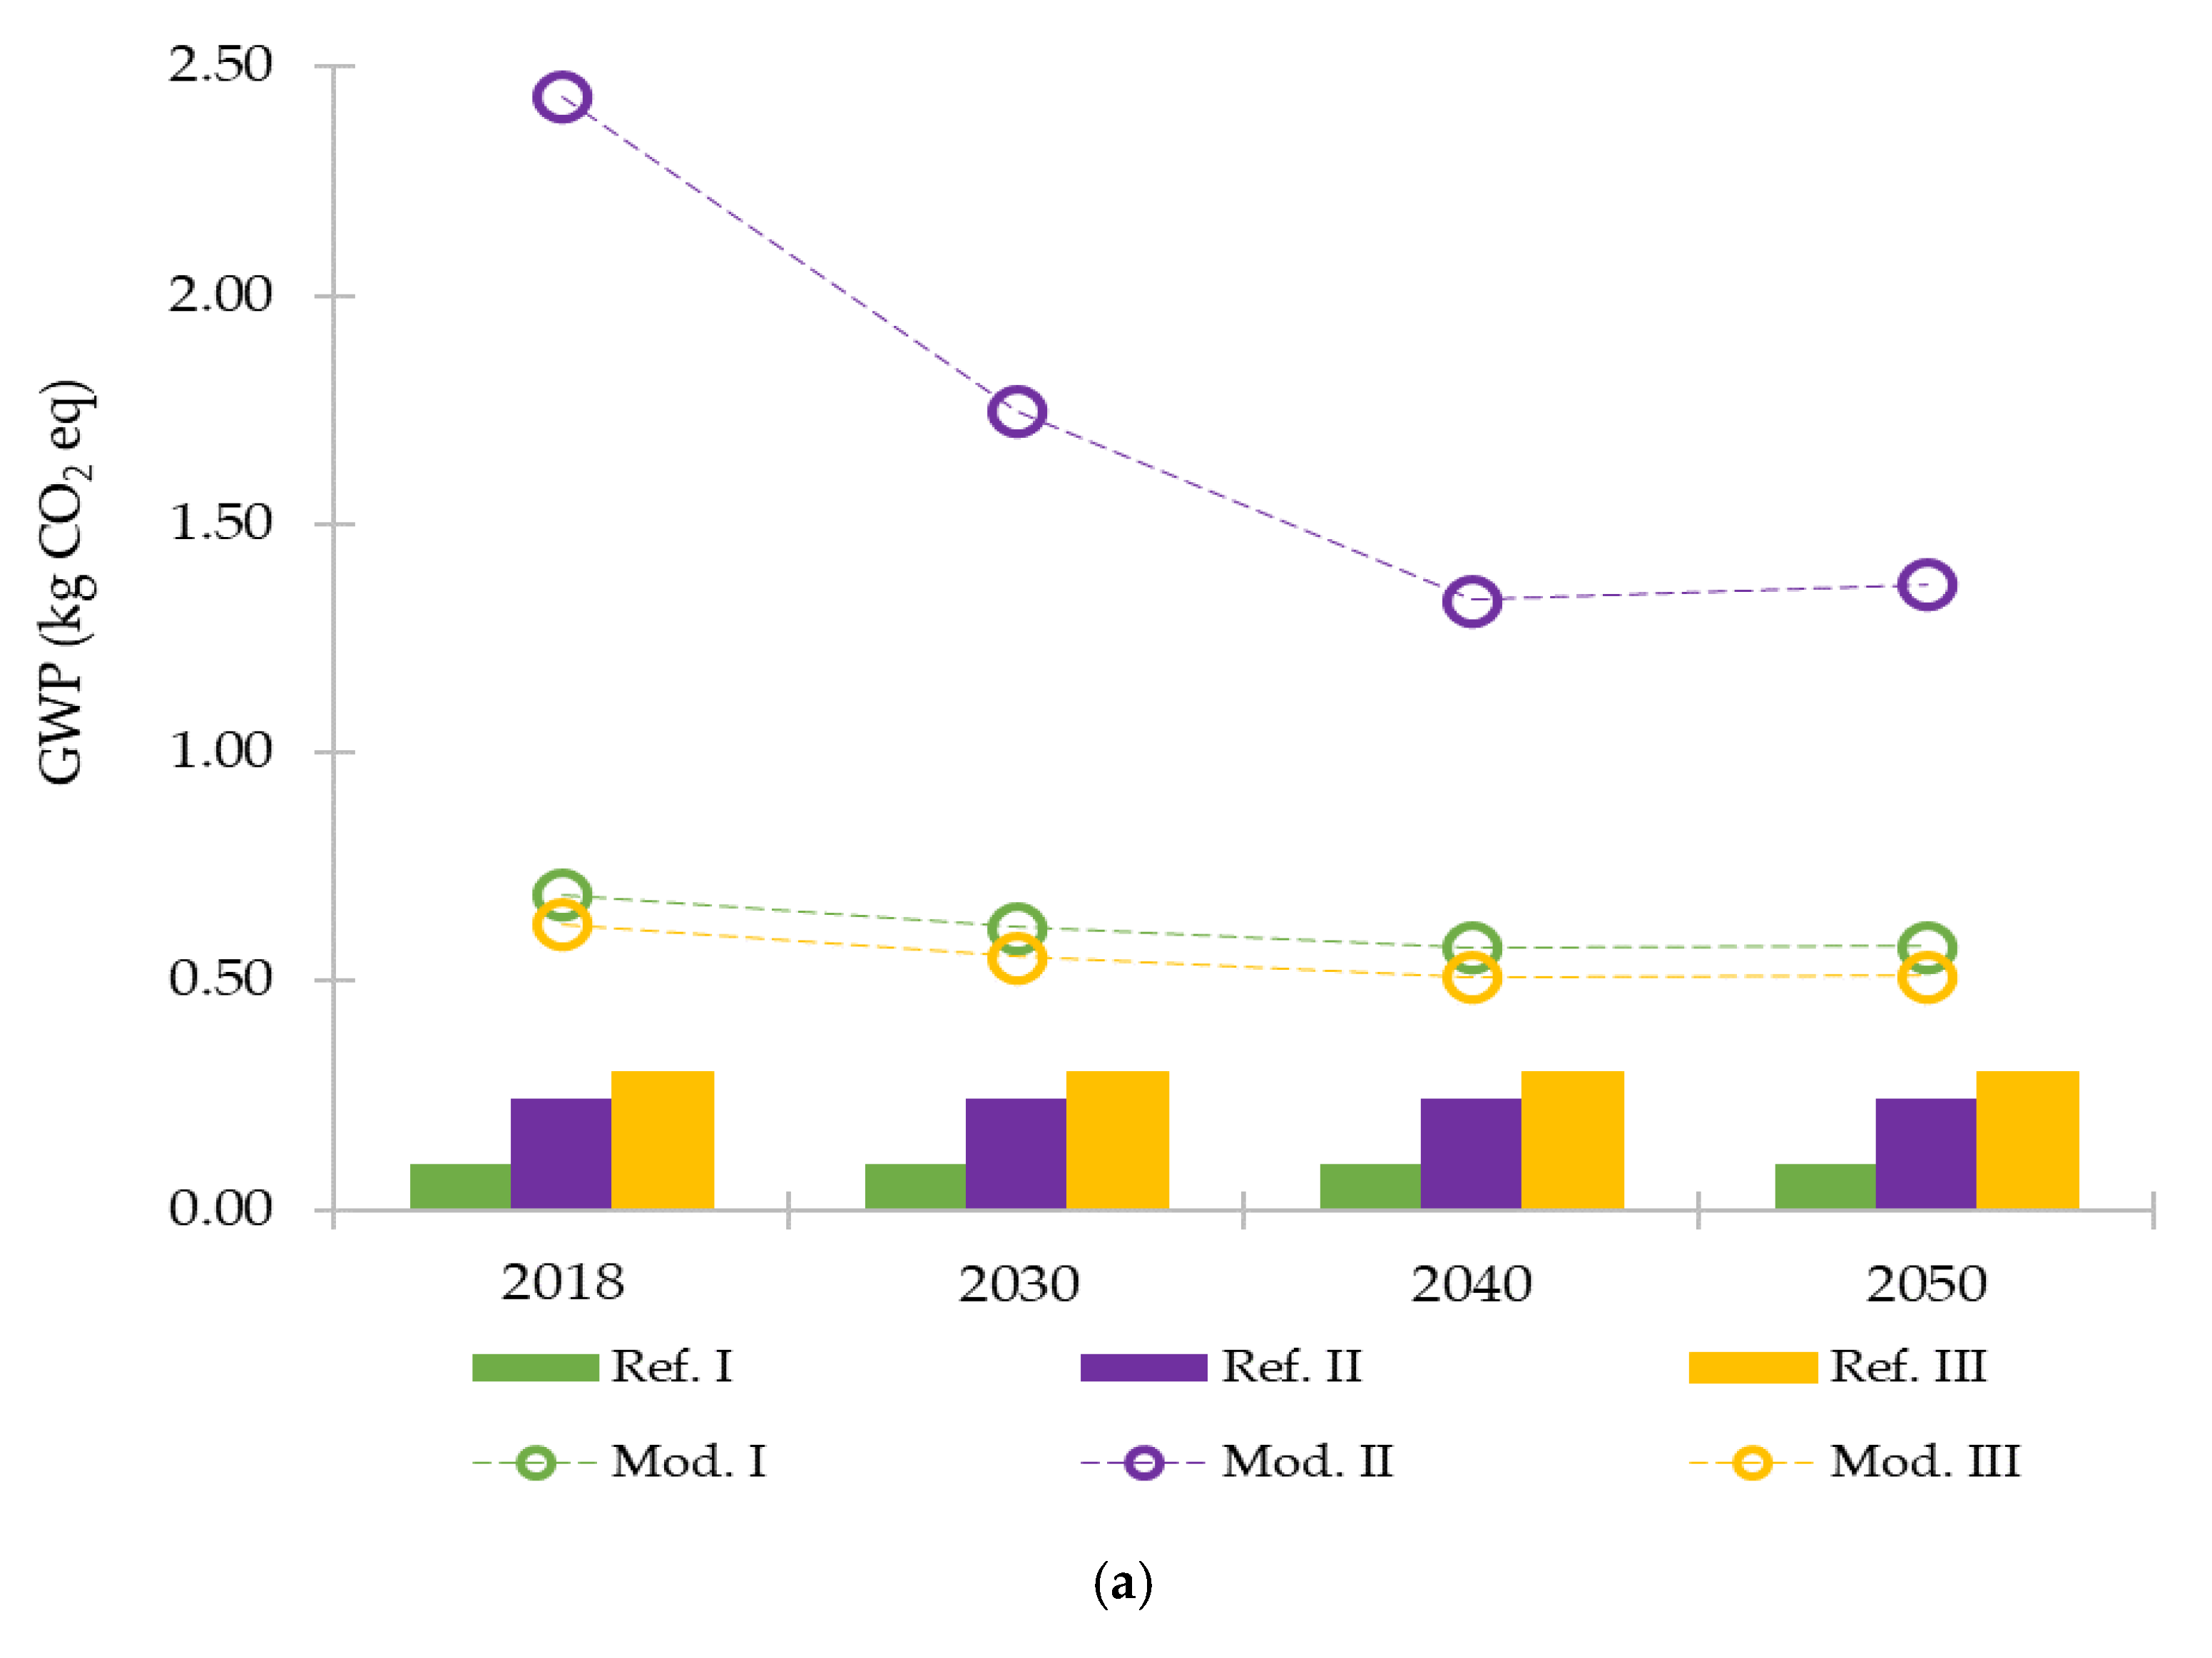
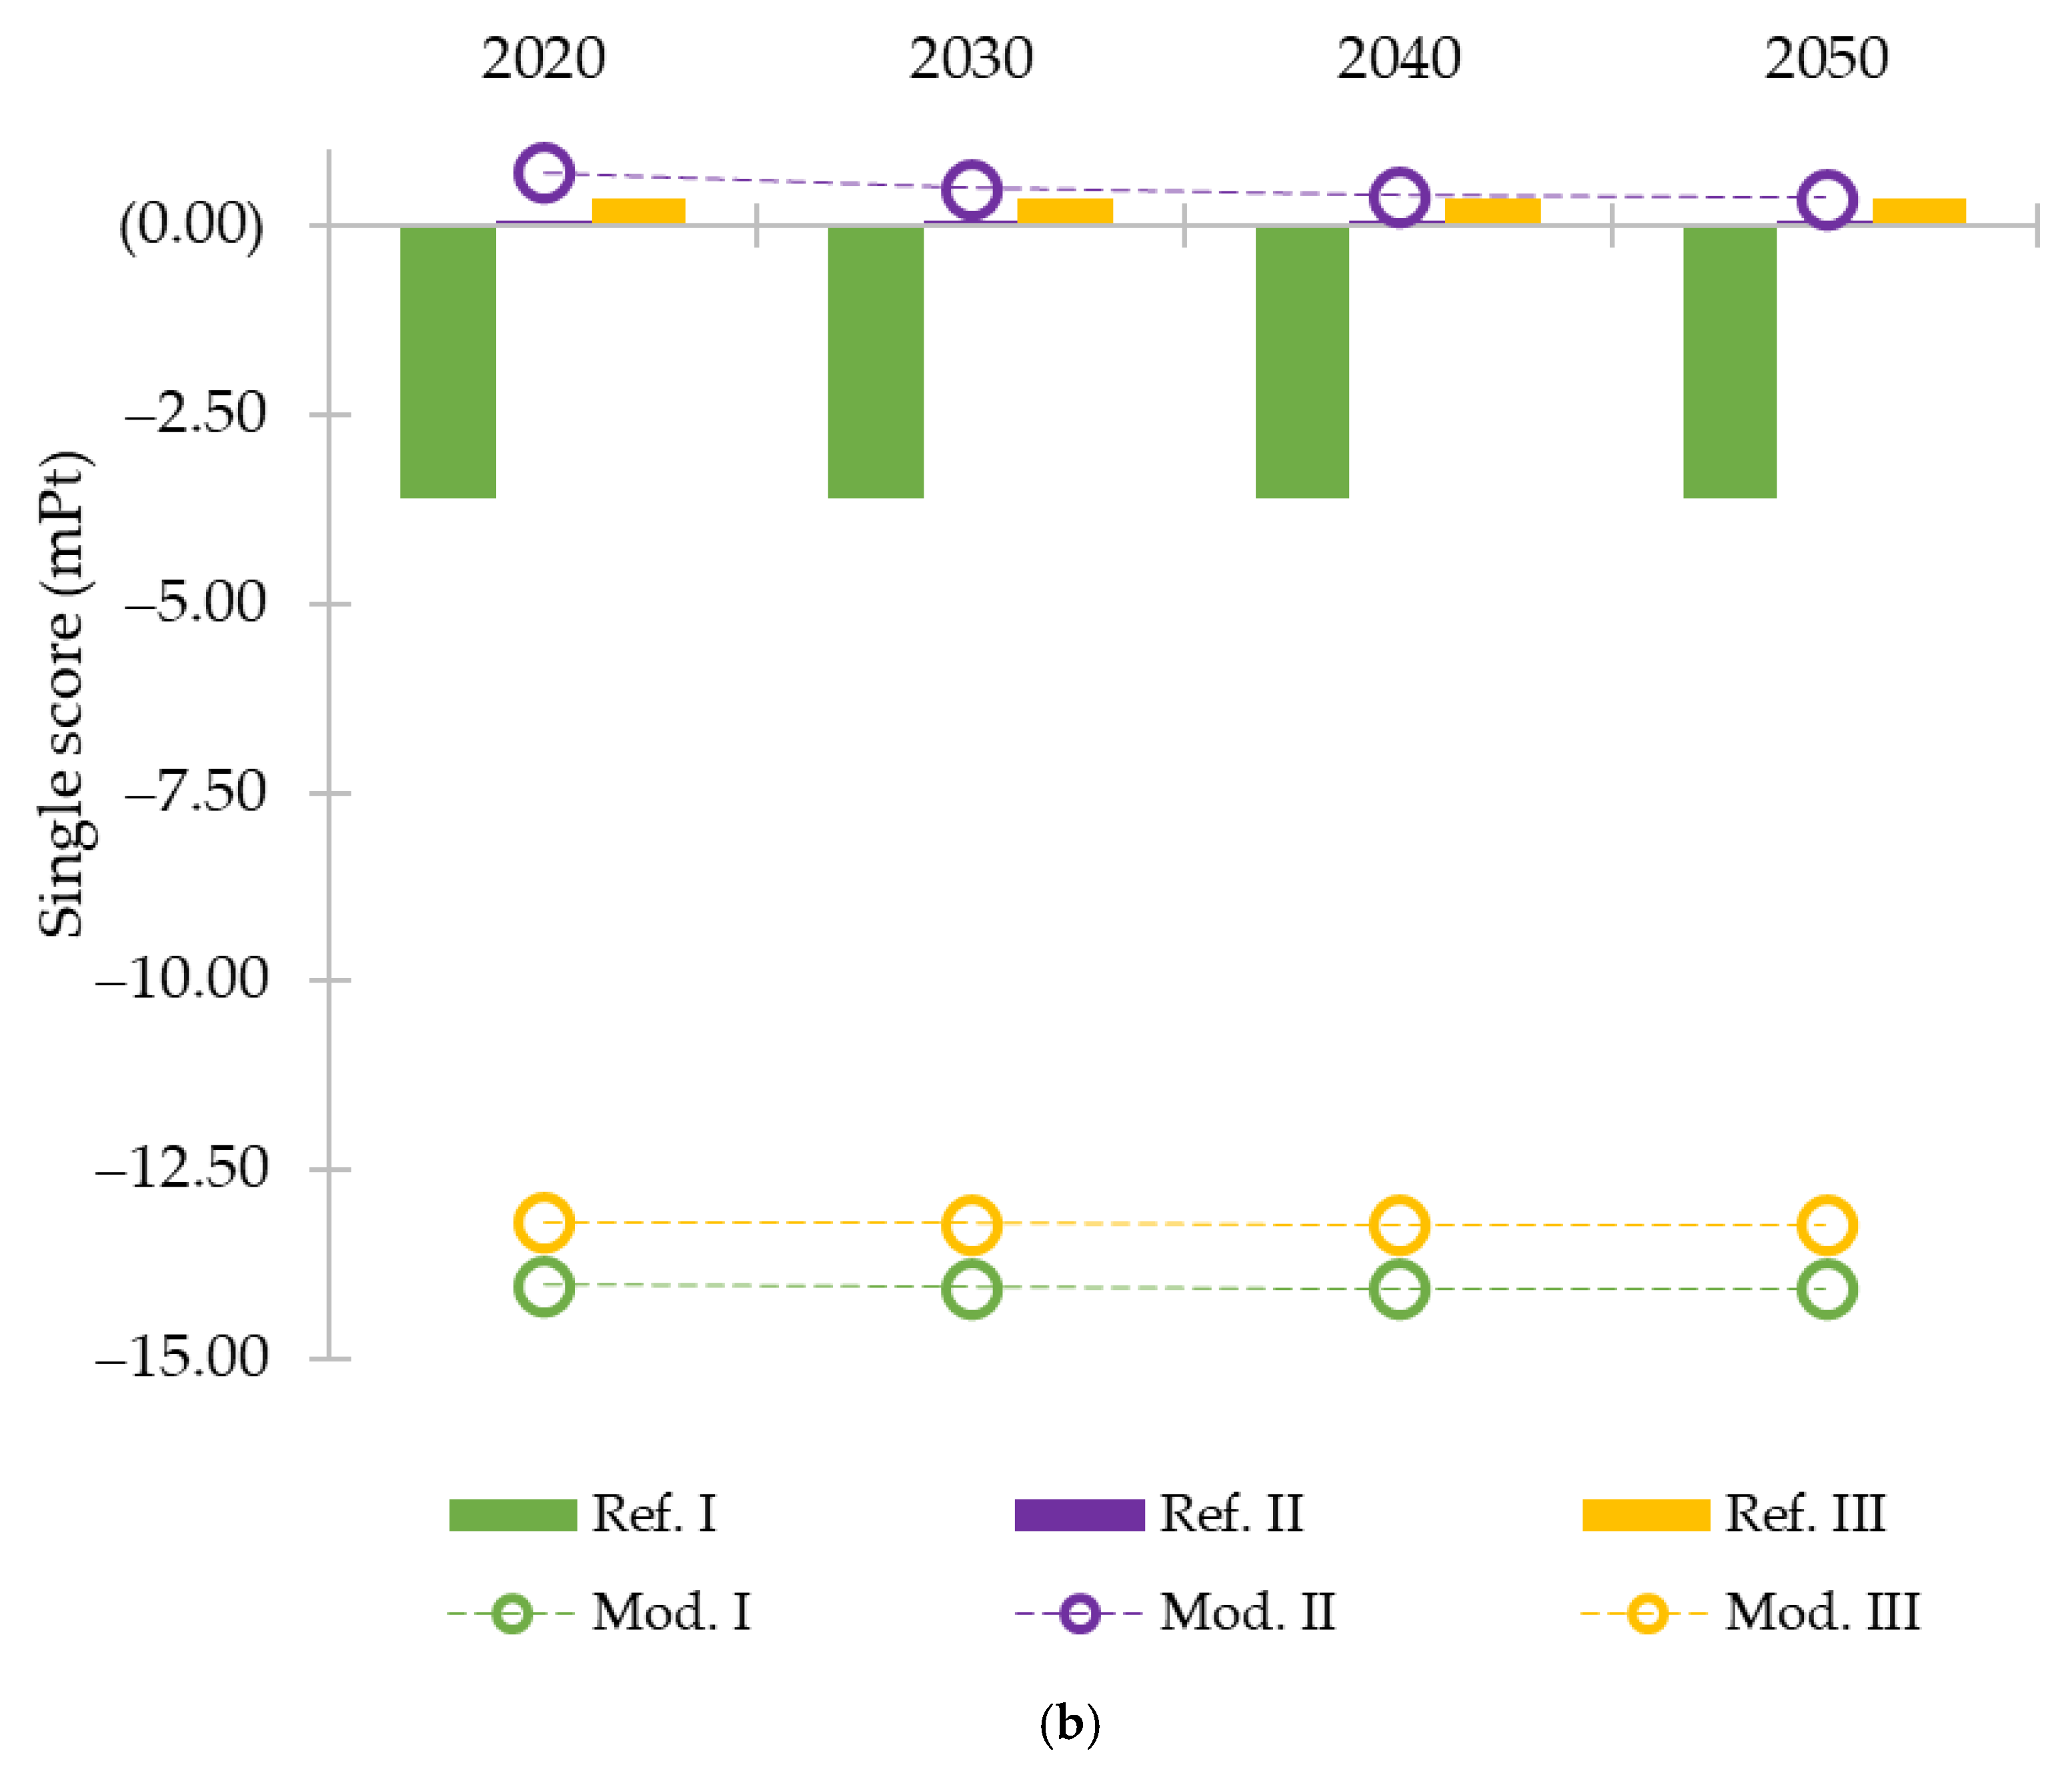
The environmental impact analysis of actual biogas plants showed that an integrated approach to both biogas production and utilisation created synergistic effects in terms of reduced environmental burdens, which directly verified the hypothesis of the study. Scenarios that included feedstock transition and production of renewable gas in the form of biomethane showed reduced environmental burdens by 4 and 36 times compared to baseline scenarios (current operation), respectively. The analysis also showed that the integration of the P2G concept is recognised as a complex process from both the economic and the environmental point of view.
The operation of biogas plants based on sustainable feedstocks in future energy systems with a high share of RES showed that the role of the biogas sector in the energy transition should receive greater emphasis since it generates multiple positive effects for energy and the environment. There is still considerable scope for the improvement of existing processes, applying other biological feedstocks and integrating biogas technologies further in all energy sectors.
Future work in the studied area will be pointed towards engaging important stakeholders of the existing and future biogas sector to the presented concept with the aim to cluster all key variables from technical, financial and social aspects. This would include setting up a dialogue and information exchange with biogas plant owners; feedstock producers; farmers; industry plants; waste management companies; natural gas grid operators; regulators; and local, regional and national policy and decision makers. In this sense, causal loops were recognised as an attractive tool for managing the complex relationships between stakeholders and maintaining biogas technologies as an important factor in energy and environmental transitions.

Supplementary Materials

The following are available online at https://www.mdpi.com/article/10.3390/en14175374/s1, Table S1: Biogas yield of feedstocks from food processing industry.

Author Contributions

R.B., as the main author, was responsible for conceptualising the research, conducting the investigation, collecting data, setting up the methodology, mapping biomass sources by QGIS, visualising the results and writing the original draft. G.S. and D.L. contributed to the research by performing the LCA. T.P. and L.Č. were responsible for supervising the research progress and administrating the project. N.D. was in charge of providing resources and fundraising. All authors read and agreed to the published version of the manuscript.

Funding

This research was financially supported by the University of Zagreb, Faculty of Mechanical Engineering and Naval Architecture (granted by Neven Duić) and the Slovenia-Croatia bilateral project Interdisciplinary Research on Variable Renewable Energy Source and Biomass in Clean and Circular Economy (BIOVARES).

Institutional Review Board Statement

Not applicable.

Informed Consent Statement

Not applicable.

Data Availability Statement

The data presented in this study are available in Supplementary Material.

Acknowledgments

This paper is a part of the project Interdisciplinary Research on Variable Renewable Energy Source and Biomass in Clean and Circular Economy (BIOVARES). Special acknowledgement goes to Ana Lovrak from the University of Zagreb, Faculty of Mechanical Engineering and Naval Architecture, for providing advice on mapping the biogas potential.

Conflicts of Interest

The authors declare no conflict of interest.

References

  1. Brémond, U.; Bertrandias, A.; Steyer, J.-P.; Bernet, N.; Carrere, H. A vision of European biogas sector development towards 2030: Trends and challenges. J. Clean. Prod. 2021, 287, 125065. [Google Scholar] [CrossRef]
  2. Battista, F.; Frison, N.; Bolzonella, D. Energy and Nutrients’ Recovery in Anaerobic Digestion of Agricultural Biomass: An Italian Perspective for Future Applications. Energies 2019, 12, 3287. [Google Scholar] [CrossRef] [Green Version]
  3. Members of IEA Bioenergy. IEA Bioenergy Task 37: Energy from Biogas—Country Report. 2020. Available online: https://task37.ieabioenergy.com/country-reports.html (accessed on 16 June 2021).
  4. Negri, M.; Bacenetti, J.; Manfredini, A.; Lovarelli, D.; Fiala, M.; Maggiore, T.M.; Bocchi, S. Evaluation of methane production from maize silage by harvest of different plant portions. Biomass Bioenergy 2014, 67, 339–346. [Google Scholar] [CrossRef]
  5. Hublin, A.; Schneider, D.R.; Džodan, J. Utilization of biogas produced by anaerobic digestion of agro-industrial waste: Energy, economic and environmental effects. Waste Manag. Res. 2014, 32, 626–633. [Google Scholar] [CrossRef]
  6. European Council. DIRECTIVE (EU) 2018/2001 of the european parliament and of the council of 11 December 2018 on the promotion of the use of energy from renewable sources (recast). Off. J. Eur. Union 2018, 2018, 23–123. [Google Scholar]
  7. Petravić-Tominac, V.; Nastav, N.; Buljubašić, M.; Šantek, B. Current state of biogas production in Croatia. Energy Sustain. Soc. 2020, 10, 8. [Google Scholar] [CrossRef]
  8. Scarlat, N.; Dallemand, J.-F.; Fahl, F. Biogas: Developments and perspectives in Europe. Renew. Energy 2018, 129, 457–472. [Google Scholar] [CrossRef]
  9. Benato, A.; Macor, A. Italian Biogas Plants: Trend, Subsidies, Cost, Biogas Composition and Engine Emissions. Energies 2019, 12, 979. [Google Scholar] [CrossRef] [Green Version]
  10. Banja, M.; Jégard, M.; Motola, V.; Sikkema, R. Support for biogas in the EU electricity sector—A comparative analysis. Biomass Bioenergy 2019, 128, 105313. [Google Scholar] [CrossRef]
  11. Bedoić, R.; Jurić, F.; Ćosić, B.; Pukšec, T.; Čuček, L.; Duić, N. Beyond energy crops and subsidised electricity—A study on sustainable biogas production and utilisation in advanced energy markets. Energy 2020, 201, 117651. [Google Scholar] [CrossRef]
  12. Weiss, R.; Saastamoinen, H.; Ikäheimo, J.; Abdurafikov, R.; Sihvonen, T.; Shemeikka, J. Decarbonised District Heat, Electricity and Synthetic Renewable Gas in Wind- and Solar-Based District Energy Systems. J. Sustain. Dev. Energy Water Environ. Syst. 2021, 9, 1–22. [Google Scholar] [CrossRef]
  13. Bedoić, R.; Dorotić, H.; Schneider, D.R.; Čuček, L.; Ćosić, B.; Pukšec, T.; Duić, N. Synergy between feedstock gate fee and power-to-gas: An energy and economic analysis of renewable methane production in a biogas plant. Renew. Energy 2021, 173, 12–23. [Google Scholar] [CrossRef]
  14. Corbellini, V.; Kougias, P.G.; Treu, L.; Bassani, I.; Malpei, F.; Angelidaki, I. Hybrid biogas upgrading in a two-stage thermophilic reactor. Energy Convers. Manag. 2018, 168, 1–10. [Google Scholar] [CrossRef]
  15. Backman, M.; Rogulska, M. Biomethane use in Sweden. Arch. Motoryz. 2016, 71, 7–19. [Google Scholar] [CrossRef]
  16. Meha, D.; Novosel, T.; Duić, N. Bottom-up and top-down heat demand mapping methods for small municipalities, case Gllogoc. Energy 2020, 199, 117429. [Google Scholar] [CrossRef]
  17. Doračić, B.; Novosel, T.; Pukšec, T.; Duić, N. Evaluation of Excess Heat Utilization in District Heating Systems by Implementing Levelized Cost of Excess Heat. Energies 2018, 11, 575. [Google Scholar] [CrossRef] [Green Version]
  18. Olatunji, O.O.; Akinlabi, S.; Madushele, N.; Adedeji, P.; Ndolomingo, M.J. Geospatial investigation of physicochemical properties and thermodynamic parameters of biomass residue for energy generation. Biomass Convers. Biorefinery 2020, 1–15. [Google Scholar] [CrossRef]
  19. Einarsson, R.; Persson, U.M. Analyzing key constraints to biogas production from crop residues and manure in the EU—A spatially explicit model. PLoS ONE 2017, 12, e0171001. [Google Scholar] [CrossRef] [PubMed] [Green Version]
  20. Ketzer, D.; Rösch, C.; Haase, M. Assessment of sustainable Grassland biomass potentials for energy supply in Northwest Europe. Biomass Bioenergy 2017, 100, 39–51. [Google Scholar] [CrossRef]
  21. Đukan, M.; Aralica, Z. Analysing a Bottom-up Methodology for Developing Communal Biogas Plants in Croatia. J. Sustain. Dev. Energy Water Environ. Syst. 2015, 3, 359–371. [Google Scholar] [CrossRef]
  22. Lovrak, A.; Pukšec, T.; Duić, N. A Geographical Information System (GIS) based approach for assessing the spatial distribution and seasonal variation of biogas production potential from agricultural residues and municipal biowaste. Appl. Energy 2020, 267, 115010. [Google Scholar] [CrossRef]
  23. Ardebili, S.M.S.; Asakereh, A.; Soleymani, M. An analysis of renewable electricity generation potential from municipal solid waste: A case study (Khuzestan Province, Iran). Biomass Convers. Biorefinery 2020, 1–9. Available online: https://link.springer.com/article/10.1007/s13399-020-01011-6#citeas (accessed on 10 August 2021).
  24. de Jesus, R.H.G.; Barros, M.V.; Salvador, R.; de Souza, J.T.; Piekarski, C.M.; de Francisco, A.C. Forming clusters based on strategic partnerships and circular economy for biogas production: A GIS analysis for optimal location. Biomass Bioenergy 2021, 150, 106097. [Google Scholar] [CrossRef]
  25. Nikas, E.; Sotiropoulos, A.; Xydis, G. Spatial planning of biogas processing facilities in Greece: The sunflower’s capabilities and the waste-to-bioproducts approach. Chem. Eng. Res. Des. 2018, 131, 234–244. [Google Scholar] [CrossRef]
  26. Sahoo, K.; Mani, S.; Das, L.; Bettinger, P. GIS-based assessment of sustainable crop residues for optimal siting of biogas plants. Biomass Bioenergy 2018, 110, 63–74. [Google Scholar] [CrossRef]
  27. Höhn, J.; Lehtonen, E.; Rasi, S.; Rintala, J. A Geographical Information System (GIS) based methodology for determination of potential biomasses and sites for biogas plants in southern Finland. Appl. Energy 2014, 113, 1–10. [Google Scholar] [CrossRef]
  28. Jeong, D.; Tyner, W.E.; Meilan, R.; Brown, T.R.; Doering, O.C. Stochastic techno-economic analysis of electricity produced from poplar plantations in Indiana. Renew. Energy 2020, 149, 189–197. [Google Scholar] [CrossRef]
  29. Lyng, K.-A.; Modahl, I.S.; Møller, H.; Saxegård, S. Comparison of Results from Life Cycle Assessment when Using Predicted and Real-life Data for an Anaerobic Digestion Plant. J. Sustain. Dev. Energy Water Environ. Syst. 2021, 9, 1–14. [Google Scholar] [CrossRef]
  30. Jacobs, A.; Auburger, S.; Bahrs, E.; Brauer-Siebrecht, W.; Christen, O.; Götze, P.; Koch, H.-J.; Mußhoff, O.; Rücknagel, J.; Märländer, B. Replacing silage maize for biogas production by sugar beet—A system analysis with ecological and economical approaches. Agric. Syst. 2017, 157, 270–278. [Google Scholar] [CrossRef]
  31. Bedoić, R.; Čuček, L.; Ćosić, B.; Krajnc, D.; Smoljanić, G.; Kravanja, Z.; Ljubas, D.; Pukšec, T.; Duić, N. Green biomass to biogas—A study on anaerobic digestion of residue grass. J. Clean. Prod. 2019, 213, 700–709. [Google Scholar] [CrossRef]
  32. Bacenetti, J.; Sala, C.; Fusi, A.; Fiala, M. Agricultural anaerobic digestion plants: What LCA studies pointed out and what can be done to make them more environmentally sustainable. Appl. Energy 2016, 179, 669–686. [Google Scholar] [CrossRef] [Green Version]
  33. Pérez-Camacho, M.N.; Curry, R.; Cromie, T. Life cycle environmental impacts of biogas production and utilisation substituting for grid electricity, natural gas grid and transport fuels. Waste Manag. 2019, 95, 90–101. [Google Scholar] [CrossRef] [PubMed]
  34. Florio, C.; Fiorentino, G.; Corcelli, F.; Ulgiati, S.; Dumontet, S.; Güsewell, J.; Eltrop, L. A Life Cycle Assessment of Biomethane Production from Waste Feedstock Through Different Upgrading Technologies. Energies 2019, 12, 718. [Google Scholar] [CrossRef] [Green Version]
  35. Banja, M.; Jégard, M. Renewable Technologies in the EU Electricity Sector: Trends and Projections—Analysis in the Framework of the EU 2030 Climate and Energy Strategy. 2017. Available online: https://ec.europa.eu/jrc/en/publication/eur-scientific-and-technical-research-reports/renewable-technologies-eu-electricity-sector-trends-and-projections-analysis-framework-eu (accessed on 14 June 2021).
  36. Ardolino, F.; Arena, U. Biowaste-to-Biomethane: An LCA study on biogas and syngas roads. Waste Manag. 2019, 87, 441–453. [Google Scholar] [CrossRef]
  37. Vo, T.T.; Rajendran, K.; Murphy, J.D. Can power to methane systems be sustainable and can they improve the carbon intensity of renewable methane when used to upgrade biogas produced from grass and slurry? Appl. Energy 2018, 228, 1046–1056. [Google Scholar] [CrossRef]
  38. Collet, P.; Flottes, E.; Favre, A.; Raynal, L.; Pierre, H.; Capela, S.; Peregrina, C. Techno-economic and Life Cycle Assessment of methane production via biogas upgrading and power to gas technology. Appl. Energy 2017, 192, 282–295. [Google Scholar] [CrossRef] [Green Version]
  39. Bedoić, R.; Špehar, A.; Puljko, J.; Čuček, L.; Ćosić, B.; Pukšec, T.; Duić, N. Opportunities and challenges: Experimental and kinetic analysis of anaerobic co-digestion of food waste and rendering industry streams for biogas production. Renew. Sustain. Energy Rev. 2020, 130, 109951. [Google Scholar] [CrossRef]
  40. Bedoić, R.; Ćosić, B.; Duić, N. Technical potential and geographic distribution of agricultural residues, co-products and by-products in the European Union. Sci. Total Environ. 2019, 686, 568–579. [Google Scholar] [CrossRef]
  41. Version 3.10 QGIS—A Free and Open Source Geographic Information System. Available online: https://qgis.org/en/site/ (accessed on 20 May 2021).
  42. Khan, S.; Mohiuddin, K. Evaluating the parameters of ArcGIS and QGIS for GIS Applications. Int. J. Adv. Res. Sci. Eng. 2018, 7, 582–589. [Google Scholar]
  43. CORINE Land Cover. Copernicus Land Monitoring Service; CORINE Land Cover: Copenhagen, Denmark, 2021; Available online: https://land.copernicus.eu/pan-european/corine-land-cover (accessed on 3 May 2021).
  44. International Standards Organization. ISO 14040:2006 Environmental Management—Life Cycle Assessment—Principles and Framework; International Standards Organization: Geneva, Switzerland, 2006; Available online: https://www.iso.org/standard/37456.html (accessed on 14 June 2021).
  45. Althaus, H.-J.; Doka, G.; Dones, R.; Heck, T.; Hellweg, S.; Hischier, R.; Nemecek, T.; Rebitzer, G.; Spielmann, M.; Wernetet, G. Overview and Methodology Ecoinvent Report No. 1: Data v2.0. 2007, pp. 1–77. Available online: https://www.ecoinvent.org/files/200712_frischknecht_jungbluth_overview_methodology_ecoinvent2.pdf (accessed on 14 June 2021).
  46. Jolliet, O.; Margni, M.; Charles, R.; Humbert, S.; Payet, J.; Rebitzer, G.; Rosenbaum, R. IMPACT 2002+: A new life cycle impact assessment methodology. Int. J. Life Cycle Assess. 2003, 8, 324–330. [Google Scholar] [CrossRef] [Green Version]
  47. Wikipedia. North Croatia. Available online: https://en.wikipedia.org/wiki/Northern_Croatia (accessed on 20 May 2021).
  48. Croatian Bureau of Statistics. Population Estimate of Republic of Croatia. 2019. Available online: https://www.dzs.hr/Hrv_Eng/publication/2020/07-01-03_01_2020.htm (accessed on 10 August 2021).
  49. HROTE. Annual Report. 2019. Available online: https://files.hrote.hr/files/PDF/Sklopljeni%20Ugovori/ARHIVA/Povlasteni_proizvodjaci_HR_2019.pdf (accessed on 28 May 2021).
  50. Fundak, S. Primjer iskorištavanja nusproizvoda peradarske farme u bioplinskom postrojenju “Eko Kotor”. Ph.D. Thesis, Polytechnic of Međimurje in Čakovec, Čakovec, Croatia, 2017. [Google Scholar]
  51. Žiljak, V. Elaborat Gospodarenja Otpadom—Clip Bio Plus. 2018. Available online: http://arhiva2.varazdinska-zupanija.hr/repository/public/2019/6-informacije/ozujak/8b-ego-clip-bio-plus.pdf (accessed on 14 June 2021).
  52. Bioen Bioplinska Elektrana Orehovec d.o.o. Available online: https://bioen.hr/bioplinska-elektrana-orehovec/ (accessed on 16 June 2021).
  53. Zemljak, D. Analiza Mogućnosti Bioplinskog Postrojenja BIOplinara Organica Kalnik 1 d.o.o. Ph.D. Thesis, Faculty of Geotechnical Engineering, University of Zagreb, Zagreb, Croatia, 2017. [Google Scholar]
  54. Jarak, M. Elaborat Gospodarenja Otpadom—Matvej. 2019. Available online: https://kckzz.hr/wp-content/uploads/2019/12/EGO-MATVEJ-konačno_za-objavu2019.pdf (accessed on 16 June 2021).
  55. Hrvatski Centar za Čistiju Proizvodnju. Stručna Podloga za Ishođenje Okolišne Dozvole—Energija Gradec. 2016. Available online: https://mingor.gov.hr/UserDocsImages/Okolišna%20dozvola/OD-postojeće/strucna_podloga_zahtjeva_za_ishodenje_okolisne_dozvole_(gradec).pdf (accessed on 16 June 2021).
  56. Zeba, T. Prikupljanje Otpada u Svrhu Iskorištenja Sirovine sa Ciljem Oporabe. Ph.D. Thesis, Faculty of Transport and Traffic Sciences, University of Zagreb, Zagreb, Croatia, 2017. [Google Scholar]
  57. Petrovic, I.; Hip, I.; Fredlund, M.D. Application of continuous normal–lognormal bivariate density functions in a sensitivity analysis of municipal solid waste landfill. Waste Manag. 2016, 55, 141–153. [Google Scholar] [CrossRef]
  58. Promo eko Studija o Utjecaju na Okoliš. 2021. Available online: https://mingor.gov.hr/UserDocsImages/UPRAVA-ZA-PROCJENU-UTJECAJA-NA-OKOLIS-ODRZIVO-GOSPODARENJE-OTPADOM/Puo/04_03_2021_Sazetak_Gradjevina_uzgoj_svinja_Bojana.pdf (accessed on 16 June 2021).
  59. Državni Zavod za Statistiku. Gustoća Naseljenosti po Gradovima/Općinama. Available online: https://www.dzs.hr/hrv/censuses/census2001/Popis/Graphs/gusposto_zupbody.html (accessed on 20 May 2021).
  60. The Ministry of Environment and Energy of the Republic of Croatia. Izvješće o Komunalnom Otpadu za 2018. Godinu. Available online: https://mingor.gov.hr/UserDocsImages/Pristup%20informacijama/OTP_Izvješće%20o%20komunalnom%20otpadu_2018.pdf (accessed on 20 May 2021).
  61. Voca, N.; Ribic, B. Biofuel production and utilization through smart and sustainable biowaste management. J. Clean. Prod. 2020, 259, 120742. [Google Scholar] [CrossRef]
  62. Lustenberger, P.; Schumacher, F.; Spada, M.; Burgherr, P.; Stojadinovic, B. Assessing the Performance of the European Natural Gas Network for Selected Supply Disruption Scenarios Using Open-Source Information. Energies 2019, 12, 4685. [Google Scholar] [CrossRef] [Green Version]
  63. Environmental Justice Atlas. Protests against Floating LNG Terminal, Krk Island, Croatia. Available online: https://www.ejatlas.org/conflict/protests-against-floating-lng-terminal-krk-island-croatia (accessed on 28 May 2021).
  64. Energy Institute Hrvoje Požar. Izrada Scenarija za Postizanje Većih Smanjenja Emisija do 2030. Godine i Klimatske Neutralnosti u Republici Hrvatskoj do 2050. Godine za Energetski Sektor. Available online: https://mingor.gov.hr/UserDocsImages/UPRAVA%20ZA%20ENERGETIKU/Strategije,%20planovi%20i%20programi/NULTI%20SCENARIJ%20za%20energetski%20sektor%20-%20nacrt%20za%20javnu%20raspravu.pdf (accessed on 12 July 2021).
  65. Achinas, S.; Achinas, V.; Euverink, G.J.W. A Technological Overview of Biogas Production from Biowaste. Engineering 2017, 3, 299–307. [Google Scholar] [CrossRef]
  66. Wu, L. Biogas Production from Presorted Biowaste and Municipal Solid Waste from Sweden; Ostfalia University of Applied Sciences: Wolfenbüttel, Germany, 2014. [Google Scholar]
  67. Zagrebački Holding—Čistoća. Separate Waste Collection-Biowaste. Available online: https://www.cistoca.hr/services/separate-waste-collection-1724/biowaste/1725 (accessed on 20 May 2021).
  68. Thon, J. Biowaste Management in Vienna. Available online: https://www.wien.gv.at/umwelt/ma48/service/publikationen/pdf/biokreislaufwirtschaft-en.pdf (accessed on 15 August 2021).
  69. Energypedia: Sizing of the Biogas Plant. Available online: https://energypedia.info/wiki/Sizing_of_the_Biogas_Plant (accessed on 7 June 2021).
  70. Manzone, M.; Airoldi, G.; Calvo, A. Transportation of maize silage to biogas plants. J. Agric. Eng. 2020, 51, 80–90. [Google Scholar] [CrossRef]
  71. Topić, D.; Barukčić, M.; Mandžukić, D.; Mezei, C. Optimization Model for Biogas Power Plant Feedstock Mixture Considering Feedstock and Transportation Costs Using a Differential Evolution Algorithm. Energies 2020, 13, 1610. [Google Scholar] [CrossRef] [Green Version]
  72. Grosser, A.; Neczaj, E. Enhancement of biogas production from sewage sludge by addition of grease trap sludge. Energy Convers. Manag. 2016, 125, 301–308. [Google Scholar] [CrossRef]
  73. Roati, C.; Fiore, S.; Ruffino, B.; Marchese, F.; Novarino, D.; Zanetti, M.C. Preliminary Evaluation of the Potential Biogas Production of Food-Processing Industrial Wastes. Am. J. Environ. Sci. 2012, 8, 291–296. [Google Scholar] [CrossRef] [Green Version]
  74. Kantorek, M.; Jesionek, K.; Polesek-Karczewska, S.; Ziółkowski, P.; Stajnke, M.; Badur, J. Thermal utilization of meat-and-bone meal using the rotary kiln pyrolyzer and the fluidized bed boiler—The performance of pilot-scale installation. Renew. Energy 2021, 164, 1447–1456. [Google Scholar] [CrossRef]
  75. Croatian Energy Regulatory Agency. Final Consultation Document in Accordance with Article 26 of Commission Regulation (EU) 2017/460 of 16 March 2017 Establishing a Network Code on Harmonised Transmission Tariff Structures for Gas. Available online: https://www.hera.hr/english/docs/2018/public-consultation-2018-16.pdf (accessed on 28 May 2021).
  76. European Biogas Association. EBA Statistical Report. 2020. Available online: https://www.europeanbiogas.eu/eba-statistical-report-2020-shows-significant-growth-and-potential-of-biomethane-to-decarbonise-the-gas-sector/ (accessed on 10 June 2021).
  77. Energy Institute Hrvoje Požar. Annual Energy Report: Energy in Croatia. Available online: http://www.eihp.hr/wp-content/uploads/2020/04/Energija2018.pdf (accessed on 7 June 2021).
  78. Zhang, X.; Witte, J.; Schildhauer, T.; Bauer, C. Life cycle assessment of power-to-gas with biogas as the carbon source. Sustain. Energy Fuels 2020, 4, 1427–1436. [Google Scholar] [CrossRef]
  79. Poeschl, M.; Ward, S.; Owende, P. Environmental impacts of biogas deployment—Part II: Life cycle assessment of multiple production and utilization pathways. J. Clean. Prod. 2012, 24, 184–201. [Google Scholar] [CrossRef]
  80. Cavicchi, B. Sustainability that backfires: The case of biogas in Emilia Romagna. Environ. Innov. Soc. Trans. 2016, 21, 13–27. [Google Scholar] [CrossRef]
  81. Roubík, H.; Mazancová, J.; Rydval, J.; Kvasnička, R. Uncovering the dynamic complexity of the development of small–scale biogas technology through causal loops. Renew. Energy 2020, 149, 235–243. [Google Scholar] [CrossRef]
Figure 1. Case study—Northern Croatia.
Energies 14 05374 g001
Figure 2. Geospatial analysis of the biogas sector in Northern Croatia.
Energies 14 05374 g002
Figure 3. Lifecycle impact assessment results for (a) GWP and (b) single score, for the functional unit of 1 m3 of produced and utilised CH4.
Energies 14 05374 g003aEnergies 14 05374 g003b
Table 1. Biogas plants in the case.
Biogas Plant No.Installed Capacity (MWel)Utilised Feedstocks and Quantity (t/a)Type of Process and TemperaturesReferences
11.0Chicken manure (5000), maize silage (8000), grain dust (3400)Single-stage at 40 °C[50]
20.3Cattle and swine manure (14,400), maize silage (3600)Single-stage at 40 °C[51]
31.2Cattle and swine manure (10,000), maize silage (13,000)Single-stage at 40 °C[52]
42.4Maize silage (28,400), animal manure (21,300), animal dung (21,300), chicken manure (1775), biodegradable waste (3550)Single-stage at 38 °C[53]
51.0Maize silage (6000), animal manure (30,000)Single-stage at 38 °C[54]
62.0Maize silage (29,750), animal manure (50,750), biowaste (35,000), animal by-products (14,000)Two-stage: pretreatment at 133 °C and AD at 37 °C[55]
71.0Biowaste from canteens and restaurants, expired food (25,000)Two-stage: pretreatment at 35 °C and AD at 40.5 °C[56]
83.7Landfill plantN/A[57]
91.0Animal manure (16,285), maize silage (24,700)Single-stage at 38 °CScaled using [58]
101.0Animal manure (16,285), maize silage (24,700)Single-stage at 38 °CScaled using [58]
112.0Animal manure (32,570), maize silage (49,400)Single-stage at 38 °C[58]
121.0Animal manure (16,285), maize silage (24,700)Single-stage at 38 °CScaled using [58]
131.0Animal manure (16,285), maize silage (24,700)Single-stage at 38 °CScaled using [58]
Table 2. Energy produced in the biogas plants.
Biogas Plant No.Biogas Produced (MWh)Energy Contribution of Maize Silage to Total Biogas Production (%)
116,91744.3
2535063.0
313,54389.8
443,08761.7
5974157.7
664,46943.2
715,1250.0
8N/AN/A
925,35891.2
1025,35891.2
1150,71791.2
1225,35891.2
1325,35891.2
Table 3. Electricity mix projections for Croatia.
Electricity SourceContribution to Electricity Mix (%)
2018 (Reference Year)203020402050
Net import28.32.62.67.2
Industrial cogeneration plants2.11.31.10.5
District heating plants13.614.88.92.9
Thermal power plants7.914.47.43.7
Geothermal power plants0.03.54.14.5
Solar power plants0.53.920.424.8
Wind power plants6.823.626.329.6
Hydropower plants40.835.829.326.7
Table 4. Range of the radius of equivalent energy potential to replace maize silage.
Biogas Plant No.Radius of Equivalent Energy Potential (km)
1>20
25–10
315–20
4>20
55–10
65–10
70
8N/A
9>20
1015–20
11>20
1210–15
135–10
Table 5. Distances between examined biogas plants and the natural gas grid.
Biogas Plant No.Distance to Natural Gas Grid (km)
17.98
23.51
314.85
49.44
51.65
64.37
71.93
83.62
93.86
101.91
114.23
121.06
1314.16
Table 6. Biomethane production potential in newly planned biogas plants in this case.
New Biogas PlantsBiomethane Potential (MWh)
A25,097
B8211
C85,228
D13,013
E6755
F33,652
G19,676
Table 7. Biomethane production potential in newly planned biogas plants in the case study.
Actual Biogas PlantScenarioCaseFeedstockUtilisation
No. 12IReferent IAnimal manure, maize silageCHP
Modified IAnimal manure, residue grassBiomethane
No. 7IIReferent IIBiowaste/food wasteCHP
Modified IIBiowaste/food wasteBiomethane + e-methane
New plant CIIIReferent IIIN/ANatural gas
Modified IIIResidue grass, biowaste, industry wasteBiomethane
Publisher’s Note: MDPI stays neutral with regard to jurisdictional claims in published maps and institutional affiliations.

