Article

Configuration Method and Multi-Functional Strategy for Embedding Energy Storage into Wind Turbine

1
College of Electrical and Information Engineering, Hunan University, Changsha 410082, China
2
College of Electrical and Information Engineering, Hunan City University, Yiyang 413000, China
*
Author to whom correspondence should be addressed.
Energies 2021, 14(17), 5354; https://doi.org/10.3390/en14175354
Submission received: 25 July 2021 / Revised: 21 August 2021 / Accepted: 24 August 2021 / Published: 28 August 2021
(This article belongs to the Special Issue Frontier in Special Power Conversion Systems and Control)

Abstract

:
This paper proposes a Configuration method for energy storage (ES), in which the ES inertia of ES is equal to an equal capacity synchronous generator. The purpose is to enhance the frequency modulation capability of double-fed induction generator (DFIG) and wind power consumption. Through the proposed method, the system inertia can remain unchanged after the DFIGs replacing the conventional turbines. During the DFIG rotor speed recovery, the ES releases energy to compensate for sudden changes in active power. On this basis, the DFIG and ES structure model is created, and the ES control strategy is optimized, thereby effectively improving the DFIG frequency modulation capability. Besides, in the non-frequency modulation period, the ES is used to suppress wind power fluctuations, thereby improving system wind power consumption and ES utilization. Simulation results indicate, in the ES-embedded wind turbine structure model, the combination of the ES Configuration method and multi-functional strategy significantly improves the frequency modulation ability and anti-interference performance of a single DFIG. Moreover, the wind power consumption and ES utilization are improved, and the ES achieves additional value.

1. Introduction

Due to the decoupling of mechanical and electrical parts, doubly-fed induction generators (DFIG) cannot respond to grid frequency changes in time through inertia controls. As a result, the system inertia decreases, and the frequency offset risk increases with large-scale wind farm integration [1,2]. The authority of some high-permeability countries pointed out that a grid-integrated wind farm should have the same primary frequency modulation capability as conventional generators [3]. Therefore, wind farm participation in FM becomes the focus of research.
After large-scale wind farms are connected to the system, the frequency support capacity decreases. In response to the issue, many scholars have conducted in-depth research on control strategies. Common control strategies include virtual inertia control [4,5], rotor overspeed and pitch angle control [6,7,8], droop control [9], and a combination of multiple strategies [10]. The virtual inertia control uses the DFIG rotor kinetic energy to provide inertial support for the system. The rotor overspeed and pitch angle control offset the maximum power point tracking (MPPT) to reserve a certain amount of active power. However, under the virtual inertia control, the rotor speed is relatively low at low wind speed, limiting the supporting capacity [11]. And many DFIGs simultaneously start the rotor speed recovery at the end of inertia, which easily leads to the secondary frequency drop [4]. The overspeed and pitch angle control make the DFIG offset the MPPT, which significantly reduces economy [12]. Although these control strategies achieved relatively good effects, there are still some problems within only relying on the DFIG frequency modulation.
Due to the characteristics of stable performance and fast response [13], ES has recently been widely used to smooth the output fluctuations of renewable energy sources [14], improve low-voltage penetration capabilities [15], etc. Also, ES helps DFIGs to improve the frequency supporting capacity [11]. The research connected the ES device to the wind farm output bus and designed a fuzzy-control-based strategy of using the ES to simulate the frequency modulation inertia of the wind farm. But this strategy did not consider the frequency supporting capacity of the wind turbines. The literature [16] presented an ES dispatching strategy to stabilize the grid frequency based on the wind speed prediction. It further proposed a power spectral density-based method for the power system scale estimation, which significantly improved the system frequency response capability. The literature [17] applied the ES to adjust the island system frequency integrated with renewable energy, providing short-term frequency support for the system. However, the studies [16,17] did not involve the coordination between the DFIG and ES, nor did they develop the ES multi-functional potential.
In ES assisting DFIG to Configuration frequency modulation capacity, the literature [18] optimized the ES control coefficient and determined the optimal capacity based on a simplified system frequency response model. However, the ES optimization Configuration strategy is too complicated for large-scale power systems. The literature [19,20,21] proposes to Configuration ES capacity according to the demand inertia. The methods adopted many simulations and optimization techniques. But they did not quantitatively analyze the ES impact on the system frequency support, nor did they fully exploit the ES multi-functional potential to improve the ES utilization.
Therefore, it is necessary to study the Configuration optimization and coordinated control for the ES on DFIG-side to improve the DFIG frequency modulation ability and develop the ES multi-functionality. This paper proposes an ES Configuration method based on the inertial response and optimizes the DFIG and ES structure model and coordinated control strategy. This study aims to improve the overall frequency modulation capability of the DFIG and ES system, the wind power consumption, and ES utilization.
Compared with the existing researches, three innovations are summarized as follows:
(1)
An ES Configuration method is proposed, which allows a small ES capacity to assist the DFIG to meet the demands of system inertia and speed recovery at different wind speeds; and
(2)
A coordinated control strategy between wind turbines with ES is proposed, where the ES assists the DFIG to provide better frequency support and speed recovery capabilities at different wind speeds. The strategy uses the ES to smooth the wind power ramp events in the non-frequency modulation period, improving the wind power consumption and ES utilization.
A component-level design option and an ES selection are given under the premise of the determined ES capacity. The design option satisfies the system safety and frequency modulation requirements, effectively improves the frequency modulation performance and anti-interference of a single DFIG, and therefore has practical value.

2. Frequency Modulation Response Characteristics of DFIG

The control principle of DFIG participating in system frequency modulation is shown in Figure 1 [22]. Here, PW represents the DFIG output electromagnetic power, ωref is the rotor speed corresponding to PW, ω denotes the rotor speed, Pref0 is the DFIG output power reference value before frequency modulation, and ΔPW is the DFIG active power increment of frequency modulation. When operating normally, the DFIG runs in the MPPT mode. When the frequency modulation is triggered, the selector switch changes from 1 to 2, and the DFIG enters the frequency modulation mode. TW is the response time constant of DFIG active power control, and PI represents the proportional–integral control. The limiting link can limit the electromagnetic power amplitude output by the DFIG.

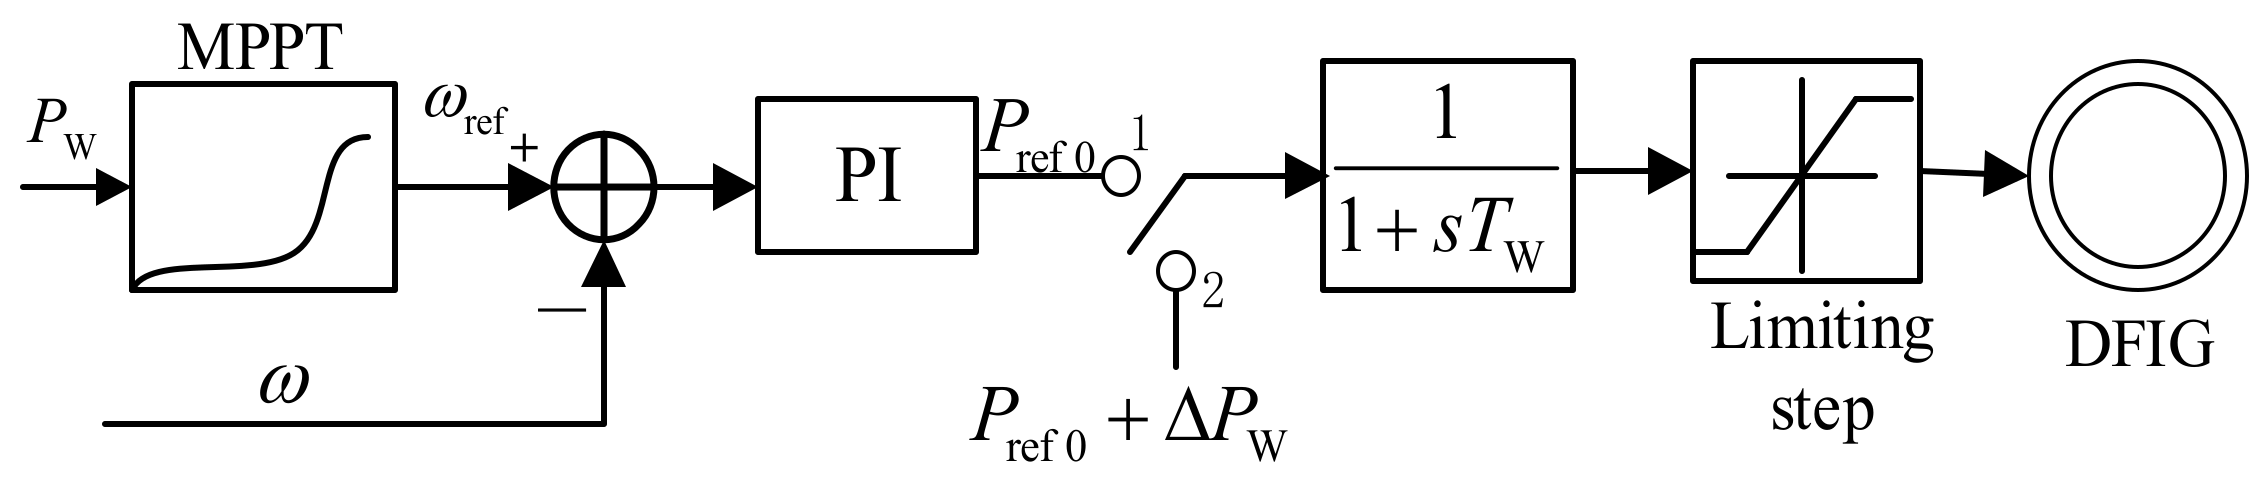
2.1. Dynamic Frequency Modulation Process of DFIG

The change process of DFIG speed and active power is divided into two stages in the frequency dynamic response process: inertia response and speed recovery [23], as shown in Figure 2. Although the DFIGs on a wind farm suffer the same frequency disturbance, the operating state and inertia response capability of each DFIG are different at different wind speeds. After the system disturbance is cleared, the rotor recovery power that needs to be compensated is different for each DFIG to restore to the MPPT state [24]. This paper divides wind speeds into three types: low wind speed (<8 m/s), medium wind speed (8~11.7 m/s), and high wind speed (>11.7 m/s) [25]. According to wind power operating statistics, the probability that the DFIG output power exceeds 80% of the rated value is usually less than 10%. Namely, the DFIGs generally operate at low and medium wind speeds [26]. Also, the pitch angle should not be adjusted to avoid damage to the wind turbines at the high wind speed. Thus, this paper mainly studies the frequency modulation performance of the DFIG and ES system at low and medium wind speeds.
As shown in Figure 2, the curve of A→B→C presents the inertia response stage. The DFIG normally runs at the A point on the MPPT curve. The dotted line of 0 B illustrates the limit torques at different speeds. When the load is disturbed increasingly, and the frequency deviation exceeds the dead zone of 0.033 Hz, the inertia response starts. Then, the electromagnetic power suddenly increases to the set value of PB. At this time, the output electromagnetic power is greater than the mechanical power captured by the DFIG. Next, the DFIG reduces the rotor speed to release the kinetic energy. As the speed decreases, the output electromagnetic power decreases along the ramp line of B→C, and the gap between the electromagnetic and mechanical power gradually decreases. When dω/dt = 0, the mechanical power is equal to the electromagnetic power, and a new equilibrium state is reached at the C point. In the inertia response stage, the rotor runs from the initial speed of ωA to the exit speed of ωC and releases kinetic energy. Part of the kinetic energy increases the output power (see the curve PAPBPCPD), and the other compensates the DFIG mechanical power loss (see the curve PAPC) due to speed drop. The process is expressed as
Δ E op = t on t off ( P e ( t ) P A ) d t = Δ E k Δ E loss
Δ E k = J ( ω A 2 ω C 2 ) 2
Δ E loss = t on t off ( P A P w ( t ) ) d t
In these equations: ΔEop denotes the total power on the DFIG rotor-side, PA represents the power at the tracking point before the frequency modulation, Pe(t) is the output electromagnetic power, Pw(t) is the input mechanical power, ΔEk is the total kinetic energy released by the rotor, J is the total moment of inertia of the generator, ΔEloss is the additional wind energy loss due to reduced rotor speed, and ton and toff, respectively, represent the start moment of frequency modulation and the exit moment of inertia.
The DFIG mechanical power is written as [27]
P W = 0.5 ρ π C P ( λ , β ) R 2 v 3
In these equations: ρ, R, v, CP, β, and λ are the air density, rotor radius, wind speed, power coefficient, pitch angle, and tip-speed ratio. Cp (λ, β) is expressed as
C p λ , β = 0.645 0.00912 λ + 5 0.4 ( 2.5 + β ) + 116 λ i e 21 λ i
λ i = 1 λ + 0.08 ( 2.5 + β ) 0.035 1 + ( 2.5 + β ) 3
When the rotor kinetic energy deviation satisfies |Δω| < 4 × 10⁻⁷(pu) [27] or the frequency deviation change rate meets df/dt = 0, the rotor speed converges to the suboptimal operating point of ωC. As a result, the inertia response stage is over, and the DFIG enters the speed recovery stage. To quickly restore the speed to the initial value, the DFIG electromagnetic active output is reduced to the D point, and the rotor speed is restored to the A point along the curve D→A. The speed recovery process corresponds to the curve C→D→A, as shown in Figure 2. Unfortunately, the excessive electromagnetic active power reduction can easily lead to the secondary frequency drop.

2.2. Frequency Modulation Response Capability of DFIG

Equations (1)–(6) show the DFIG output power. Changing Cp can adjust the DFIG output mechanical power. And Cp is a function of ω and β. Thus, the output power can be expressed as the function of the rotor speed, i.e., f (ω, β = 0). At a certain wind speed, the power derived from the rotor kinetic energy is constrained by the range of rotation speed ω. The wind speed curve in Figure 2 shows that the rotor kinetic energy gradually increases as the wind speed increases in the medium wind speed zone. In the low wind speed zone, ωAωmin. Namely, the allowable change in speed is almost zero, and the rotor does not release kinetic energy. Therefore, the wind turbine does not have the inertia response capability at the low wind speed. The frequency modulation response process of DFIG at the medium wind speed is shown in Figure 3.
When the system frequency is disturbed at the ton moment, the frequency modulation controller in the DFIG acts. As a result, the trajectory of the output power operating point is the curve A→B→C→E→F, and that of the input power operating point is the curve A→D→F. The meanings of the points A, B, C, and D in Figure 3 are the same as those in Figure 2. The curve E (D)→F is the speed recovery stage of the DFIG. The areas of ABCD, AHD are ΔEk and ΔEloss, respectively; the difference between the two areas is ΔEop; tend denotes the end moment of frequency modulation. The area of HE (D) F represents the power required for speed recovery.

3. Strategies of ES Configuration and DFIG and ES Coordinated Control

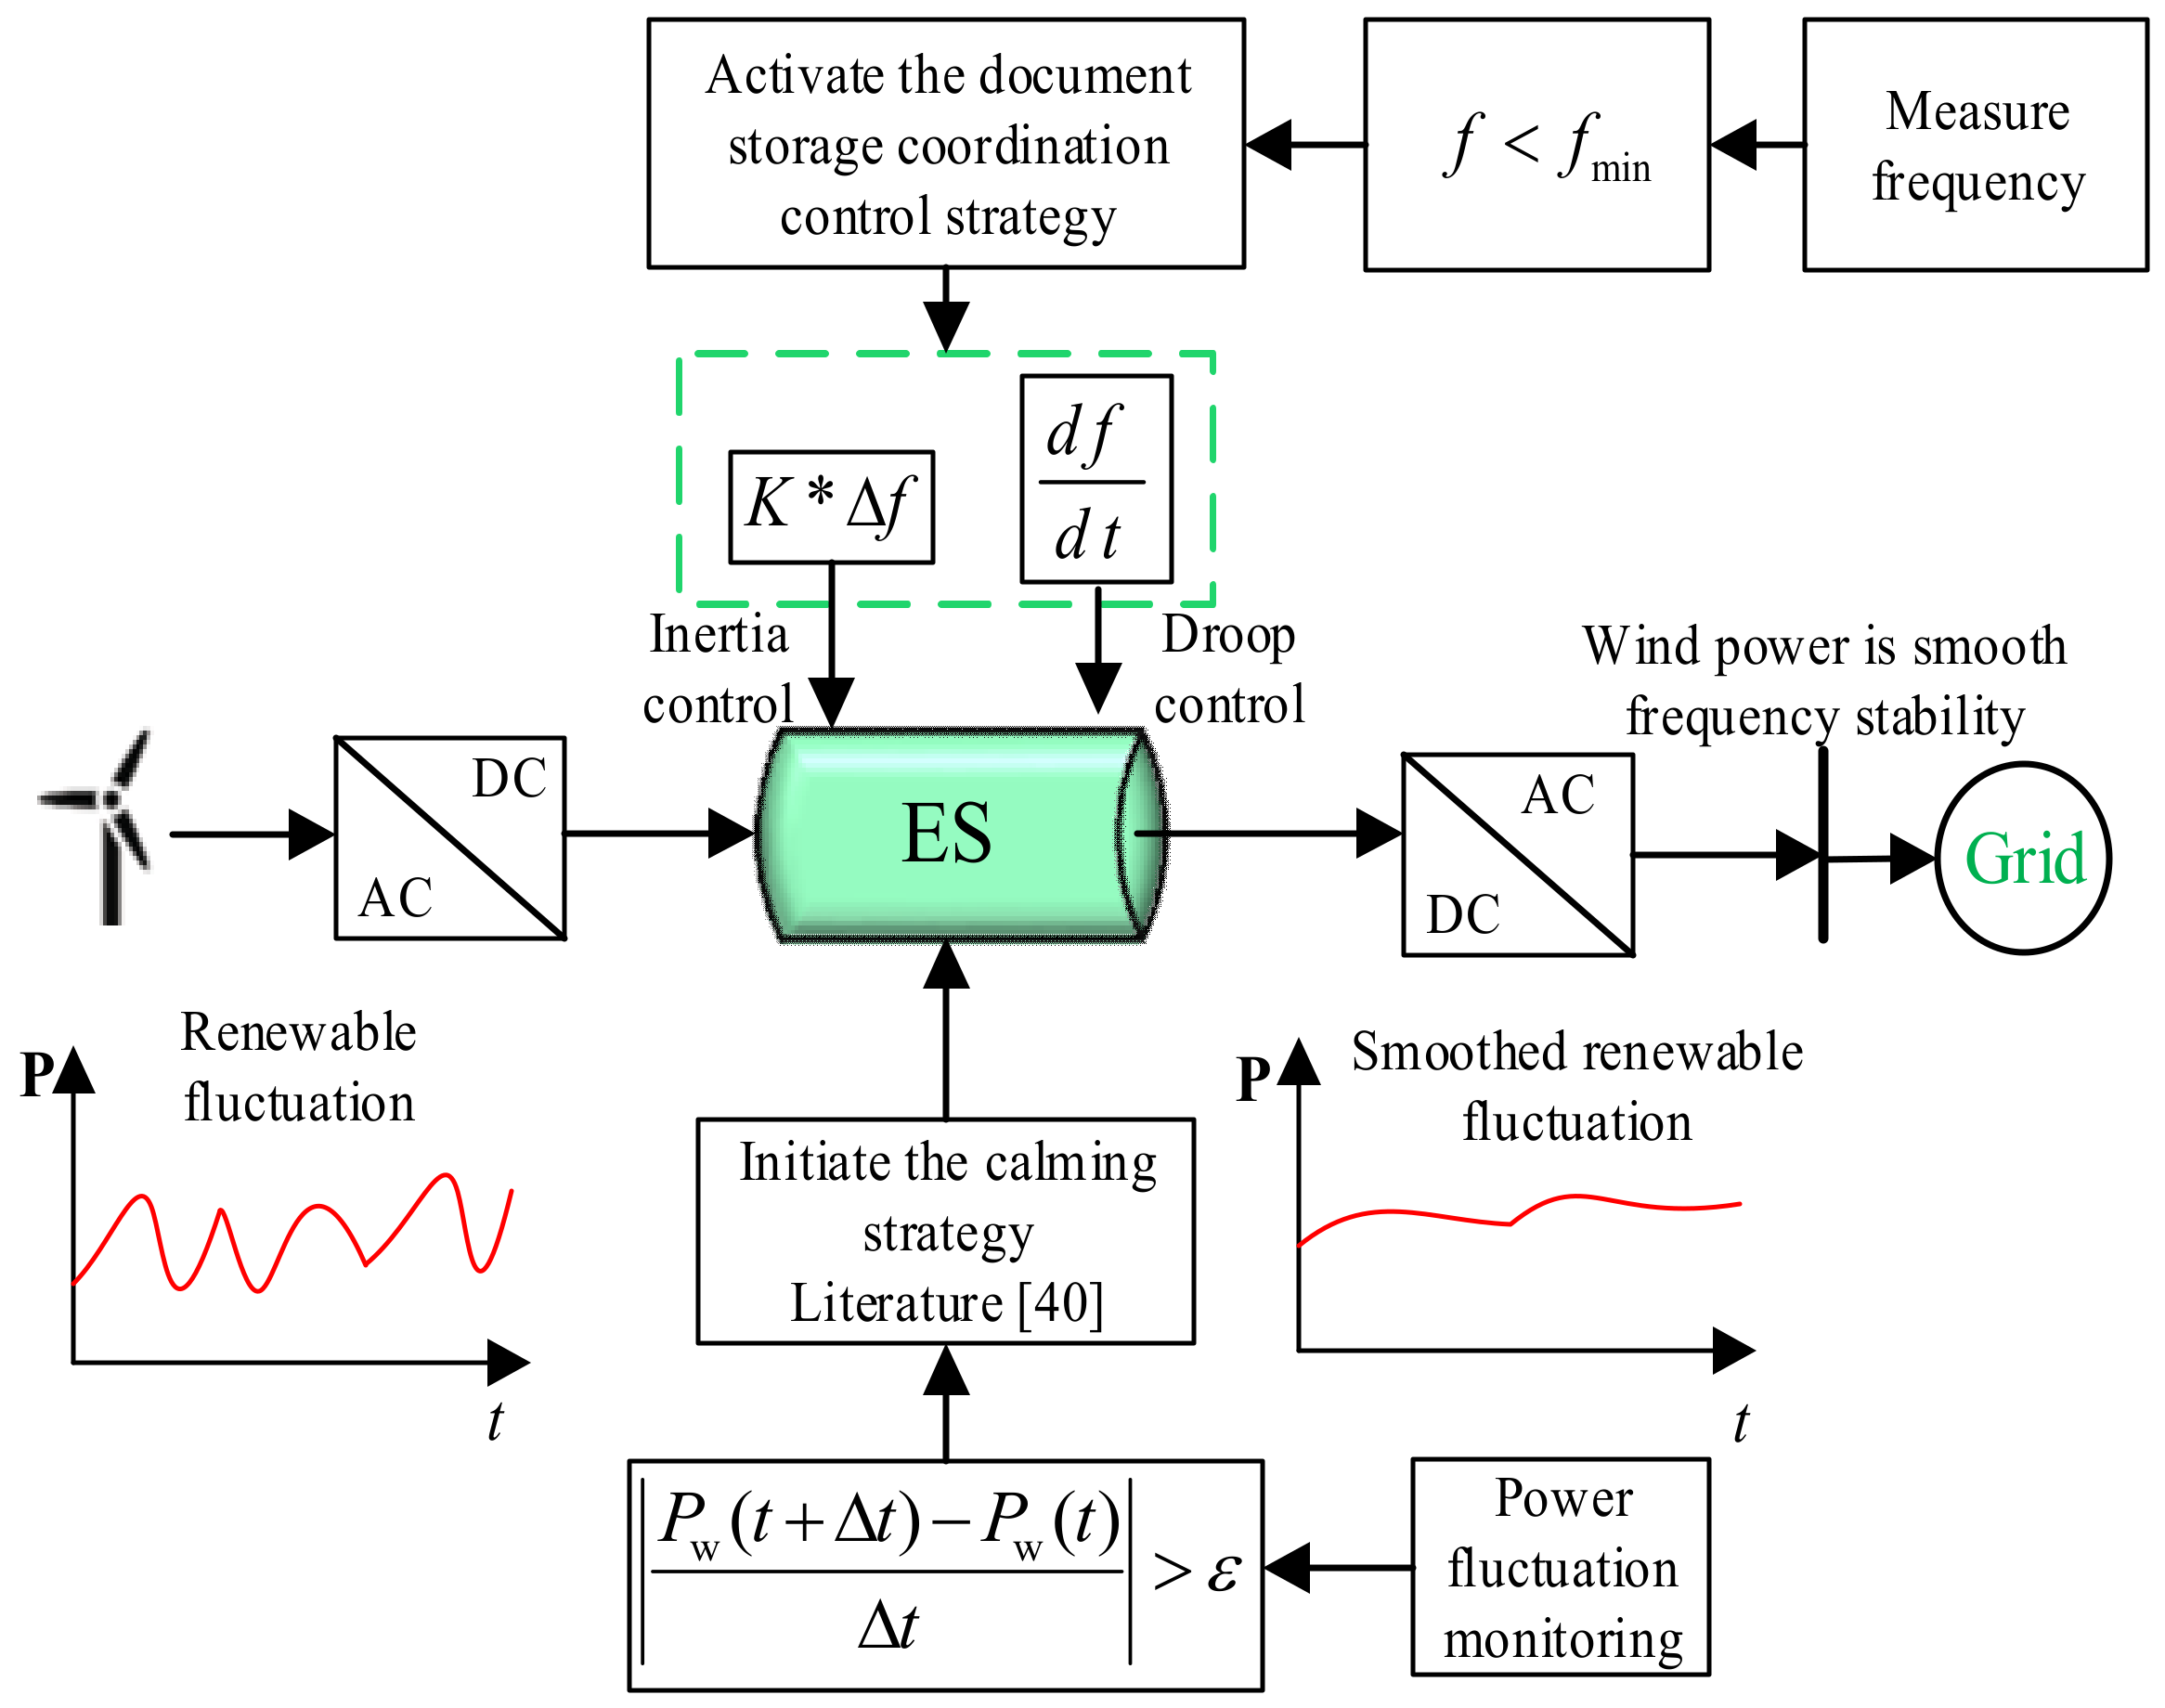
3.1. DFIG and ES Coordinated Control Strategy

The analysis in Section 1 shows that the DFIG frequency modulation response capability depends on the wind speed. At the low wind speed, the DFIG has no inertia frequency modulation capability. At the medium wind speed, the secondary frequency drop may occur after the DFIG inertial response. To deal with the issues, the DFIG and ES coordinated control strategy should achieve the two functions: (1) at the low wind speed, the ES provides inertia support for the DFIG and ES system; and (2) at the medium wind speed, the DFIG assists the rotor for speed recovery after providing the inertia support for the system, thereby avoiding the secondary frequency drop caused by many DFIG exiting simultaneously.
Since the characteristics are directly related to wind speed, the DFIG frequency modulation is divided into inertia response and speed recovery according to different wind speeds [13]. It is easier to decrease the output power than to increase it. This paper mainly discusses the situation of f > fmin, and f < fmin is similar, where f, fmin denotes the system frequency and its lower limit, respectively. The specific implementation process is shown in Figure 4.
(1)
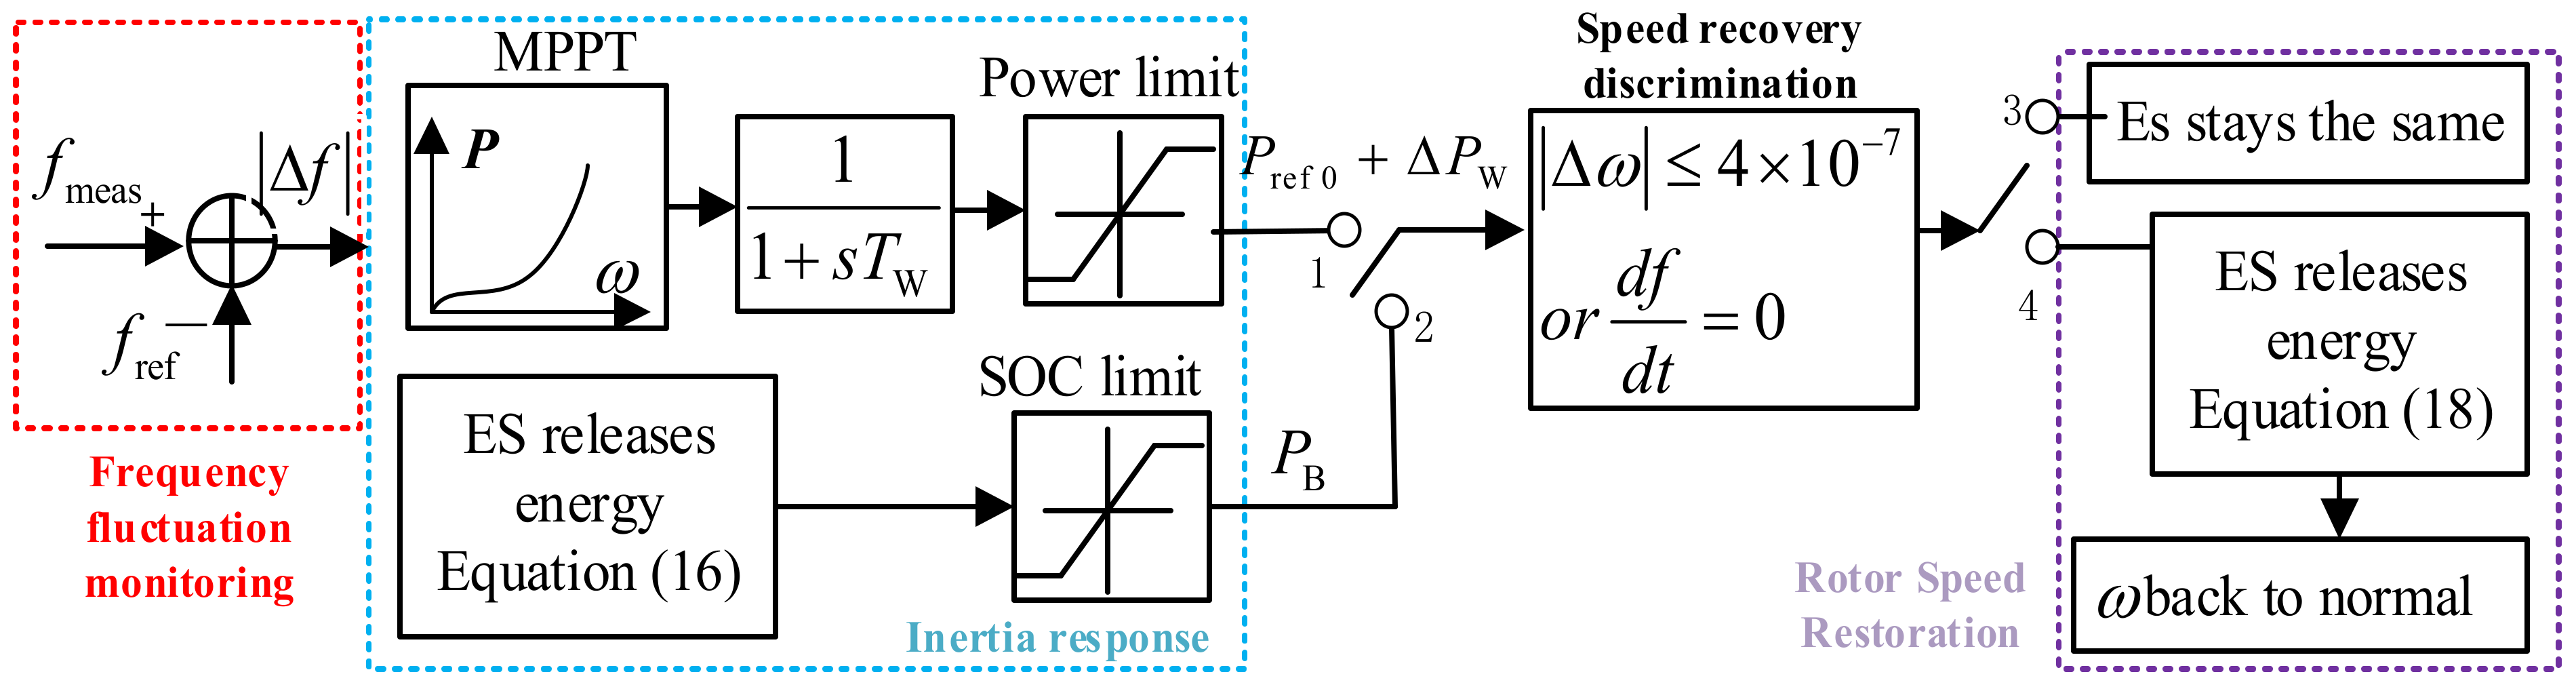
When monitoring that the system frequency deviation Δf is greater than the dead zone, the DFIG and ES frequency modulation system starts.
(2)
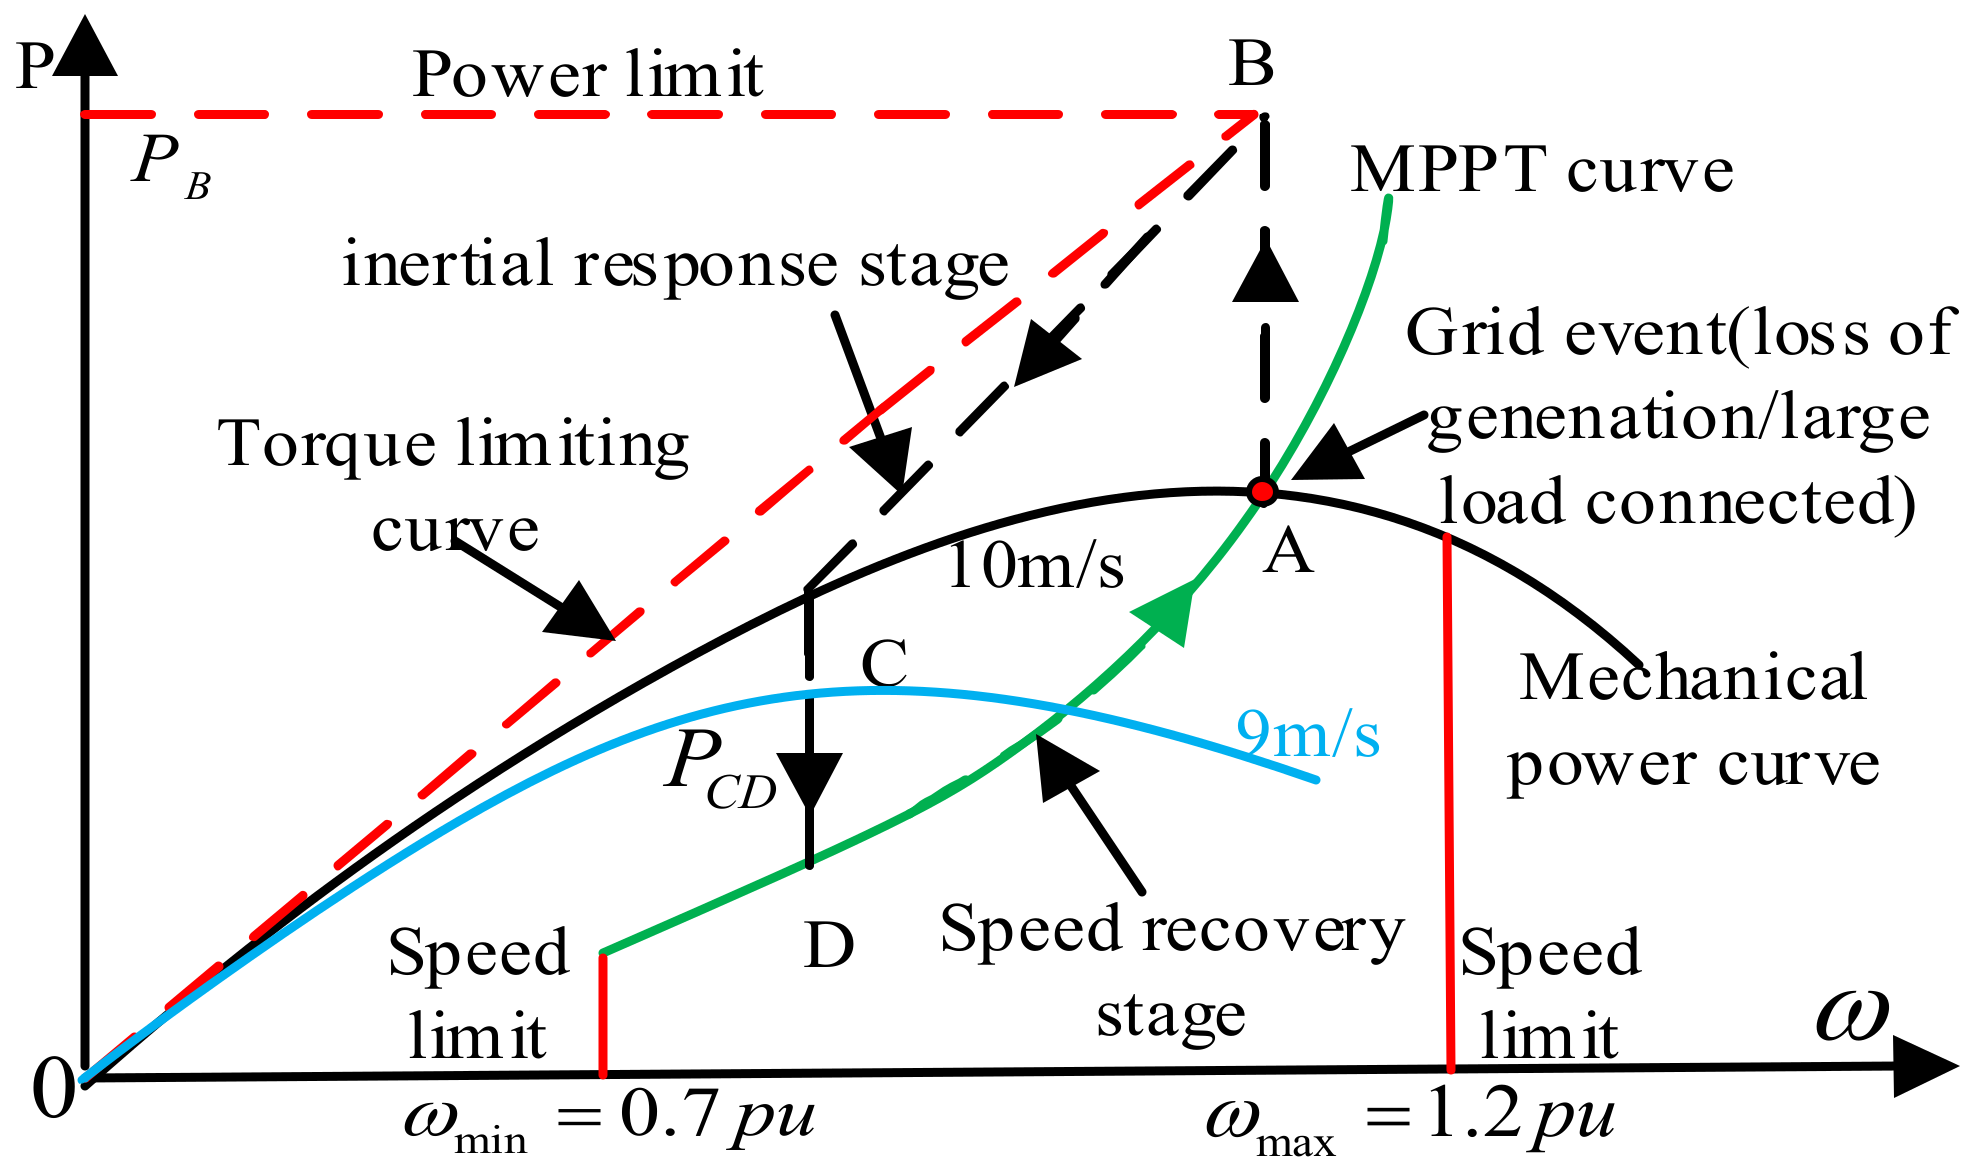
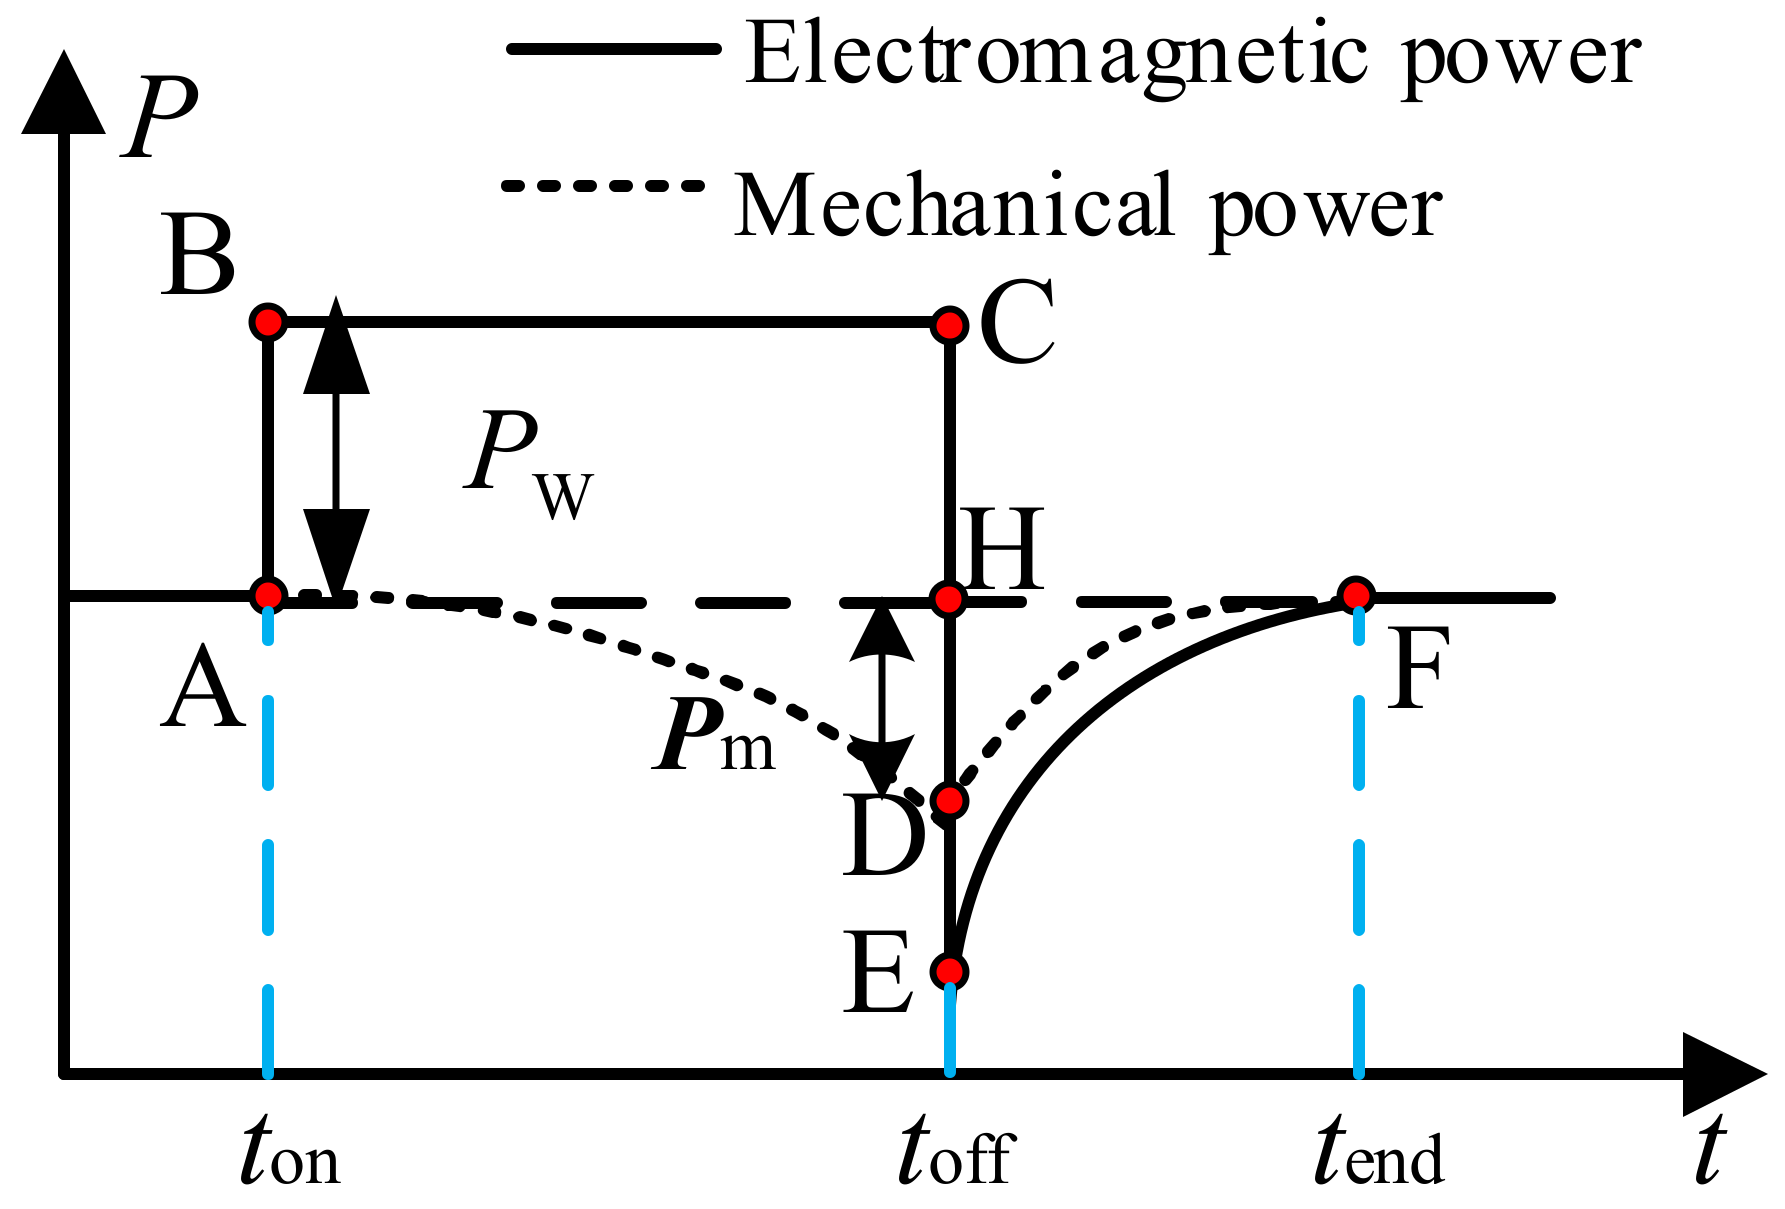
Inertia response stage: at the low wind speed, the DFIG maintains the original operating state, and the ES provides the DFIG and ES system inertia if its state of charge (SOC) meets the requirements; at the medium wind speed, the DFIG provides the inertia, and the ES state remains unchanged.
(3)
Speed recovery stage: at the low wind speed, the running status of DFIG will not change, no need to restore speed; at the medium wind speed, the ES provides additional active power PCD to quickly restore the MPPT state of the DFIG when its SOC is more than the minimum value.
Figure 4. The DFIG and ES coordinated control strategy.
Energies 14 05354 g004
At different wind speeds, the coordinated frequency control between DFIG and ES maintains the system inertia response ability, and avoids the secondary frequency drop. The frequency control process is shown in Figure 5. At the low wind speeds, the switches of 2, 3 are chosen; at the medium wind speed, the switches of 1, 4 are selected.

3.2. Frequency Modulation Demand Configuration of ES

The DFIG frequency modulation characteristics are directly related to wind speeds. To improve the overall frequency modulation stability of the DFIG and ES system, the ES capacity configuration should satisfy the following two requirements: (1) at the low wind speed, the frequency modulation response capability of the wind storage system remains unchanged after the ES replaces the conventional turbine of equal capacity because the DFIG cannot release the rotor kinetic energy; and (2) at the medium wind speed, the ES can provide the DFIG rotor with the power required for speed recovery to avoid the secondary frequency drop caused by DFIGs exiting simultaneously.

3.2.1. Inertia Response Configuration

The energy for short-term frequency response in the synchronous generator mainly comes from the rotational kinetic energy stored in the rotor [28]. The kinetic energy of EK is expressed as
E K = 1 2 J ω 2
The inertia time constant H is usually used to characterize the synchronous generator inertia, which is written as
H = E K S N = J ω 2 2 S N
where SN denotes the rated capacity the generator.
Similar to Equation (8), the virtual inertia HW_B of the DFIG and ES system is obtained as
H W _ B = i = 1 n Δ E op i + E B S N _ W B
where n is the number of DFIGs in the wind farm, ΔEopi is the rotational kinetic energy of the i-th DFIG, EB is the equivalent kinetic energy stored in the ES device at the rated frequency, SN_WB is the total rated capacity of the wind storage system.
Equations (1)–(3) are substituted into Equation (9) to obtain the relationship between the system inertia constant and the speed ω:
H W _ B = i = 1 n [ J ( ω A 2 ω C 2 ) 2 t on t off ( P A P w ( t ) ) d t ] + E B S N _ W B
When the DFIG runs at the low wind speed, ωAωmin and the change in speed is close to zero. And the DFIG rotor kinetic energy has almost no contribution to the system inertia, which is all provided by the ES. During the frequency modulation process, the speed change range of the synchronous generator is usually 0.96~1 pu [28]. Thus, the maximum kinetic energy released by the rotor is calculated as
E K max = 1 2 J ( 1 0.96 2 ) ω 2 0.0392 J ω 2
When the generator is running at the rated speed, the kinetic energy stored in the rotor is
E K = 1 2 J ω 2 = 1 2 P N T J
J ω 2 = P N T J
In the equation TJ represents the time of the inertia participating in the frequency modulation control and PN is the rated capacity of the synchronous generator.
In the constant power charging-discharging mode, the ES needs to release the inertia equal to the synchronous generator within the period of Δt, namely,
E B = E K max = P B × Δ t = 0.0392 P N T J
where PB denotes the ES capacity.
The literature [29] pointed out that the inertia participating in the frequency modulation control is about 10 s in most power systems. Assuming Δt = TJ,
P B = 0.0392 P N = 0.0392 ( P W + P B )
P B = 0.0408 P W
Equation (16) shows that the ES with 5% of the wind farm rated power can meet the inertia requirement considering the safety margin.

3.2.2. Speed Recovery Configuration

As shown in Figure 3, during the speed recovery of a single DFIG, the changes in rotor kinetic energy and input wind energy are
Δ E k = J ( ω C 2 ω A 2 ) 2
Δ E W = t off t end P W ( t ) d t
The relationship between the two is described as
Δ P = Δ E k + Δ E W
In the equation ΔP is the power change in the DFIG speed recovery process.
Using ES to assist DFIG in restoring MPPT operation and avoid secondary frequency disturbances, the DFIG and ES can be regarded as subsystems of the DFIG and ES system. The ES provides the additional active power ΔPE of frequency modulation to compensate the energy required for the DFIG speed recovery, the calculation of ΔPE is expressed as
Δ P E = i = 1 n 1 Δ P i = i = 1 n 1 J ( ω C 2 ω A 2 ) 2 + t off t end P W ( t ) d t
In the equation n1 is the number of DFIGs participating in the wind farm inertia response, and n1n. The ES capacity Configuration is written as
P E SS = min Δ P B , Δ P E
However, the uneven wind speed distribution leads to n1 < n in a large-scale wind farm. Although the DFIGs do not participate in the frequency modulation, the ES still engages in the speed recovery of the wind farm. As shown in Figure 2, the speed recovery sudden change power PCD of a single DFIG is less than the inertia response power PAC. Therefore, configuration the ES with 5% of the wind farm rated power can meet the system requirement for speed recovery.
In the SOC control of ES, the charging/discharging ability mainly depends on the remaining power at the previous moment and its charging/discharging efficiency. To prevent overcharge and over-discharge, the charging/discharging rate should be set according to the SOC. The closer to the SOC limit state, the slower the rate. The SOC correction formula is created as
S O C t + Δ t = S O C t + β P t η P E S S                     discharge ,   P t 0 S O C t + β η P t P E S S                         charge ,   P t 0
β = e S O C t 1
In the equation SOCt represents the SOC of ES at the t moment; η denotes the charging-discharging efficiency; Pt is the amount of charge and discharge, charging is positive and discharging is negative; and β is the control factor of charging-discharging rate.

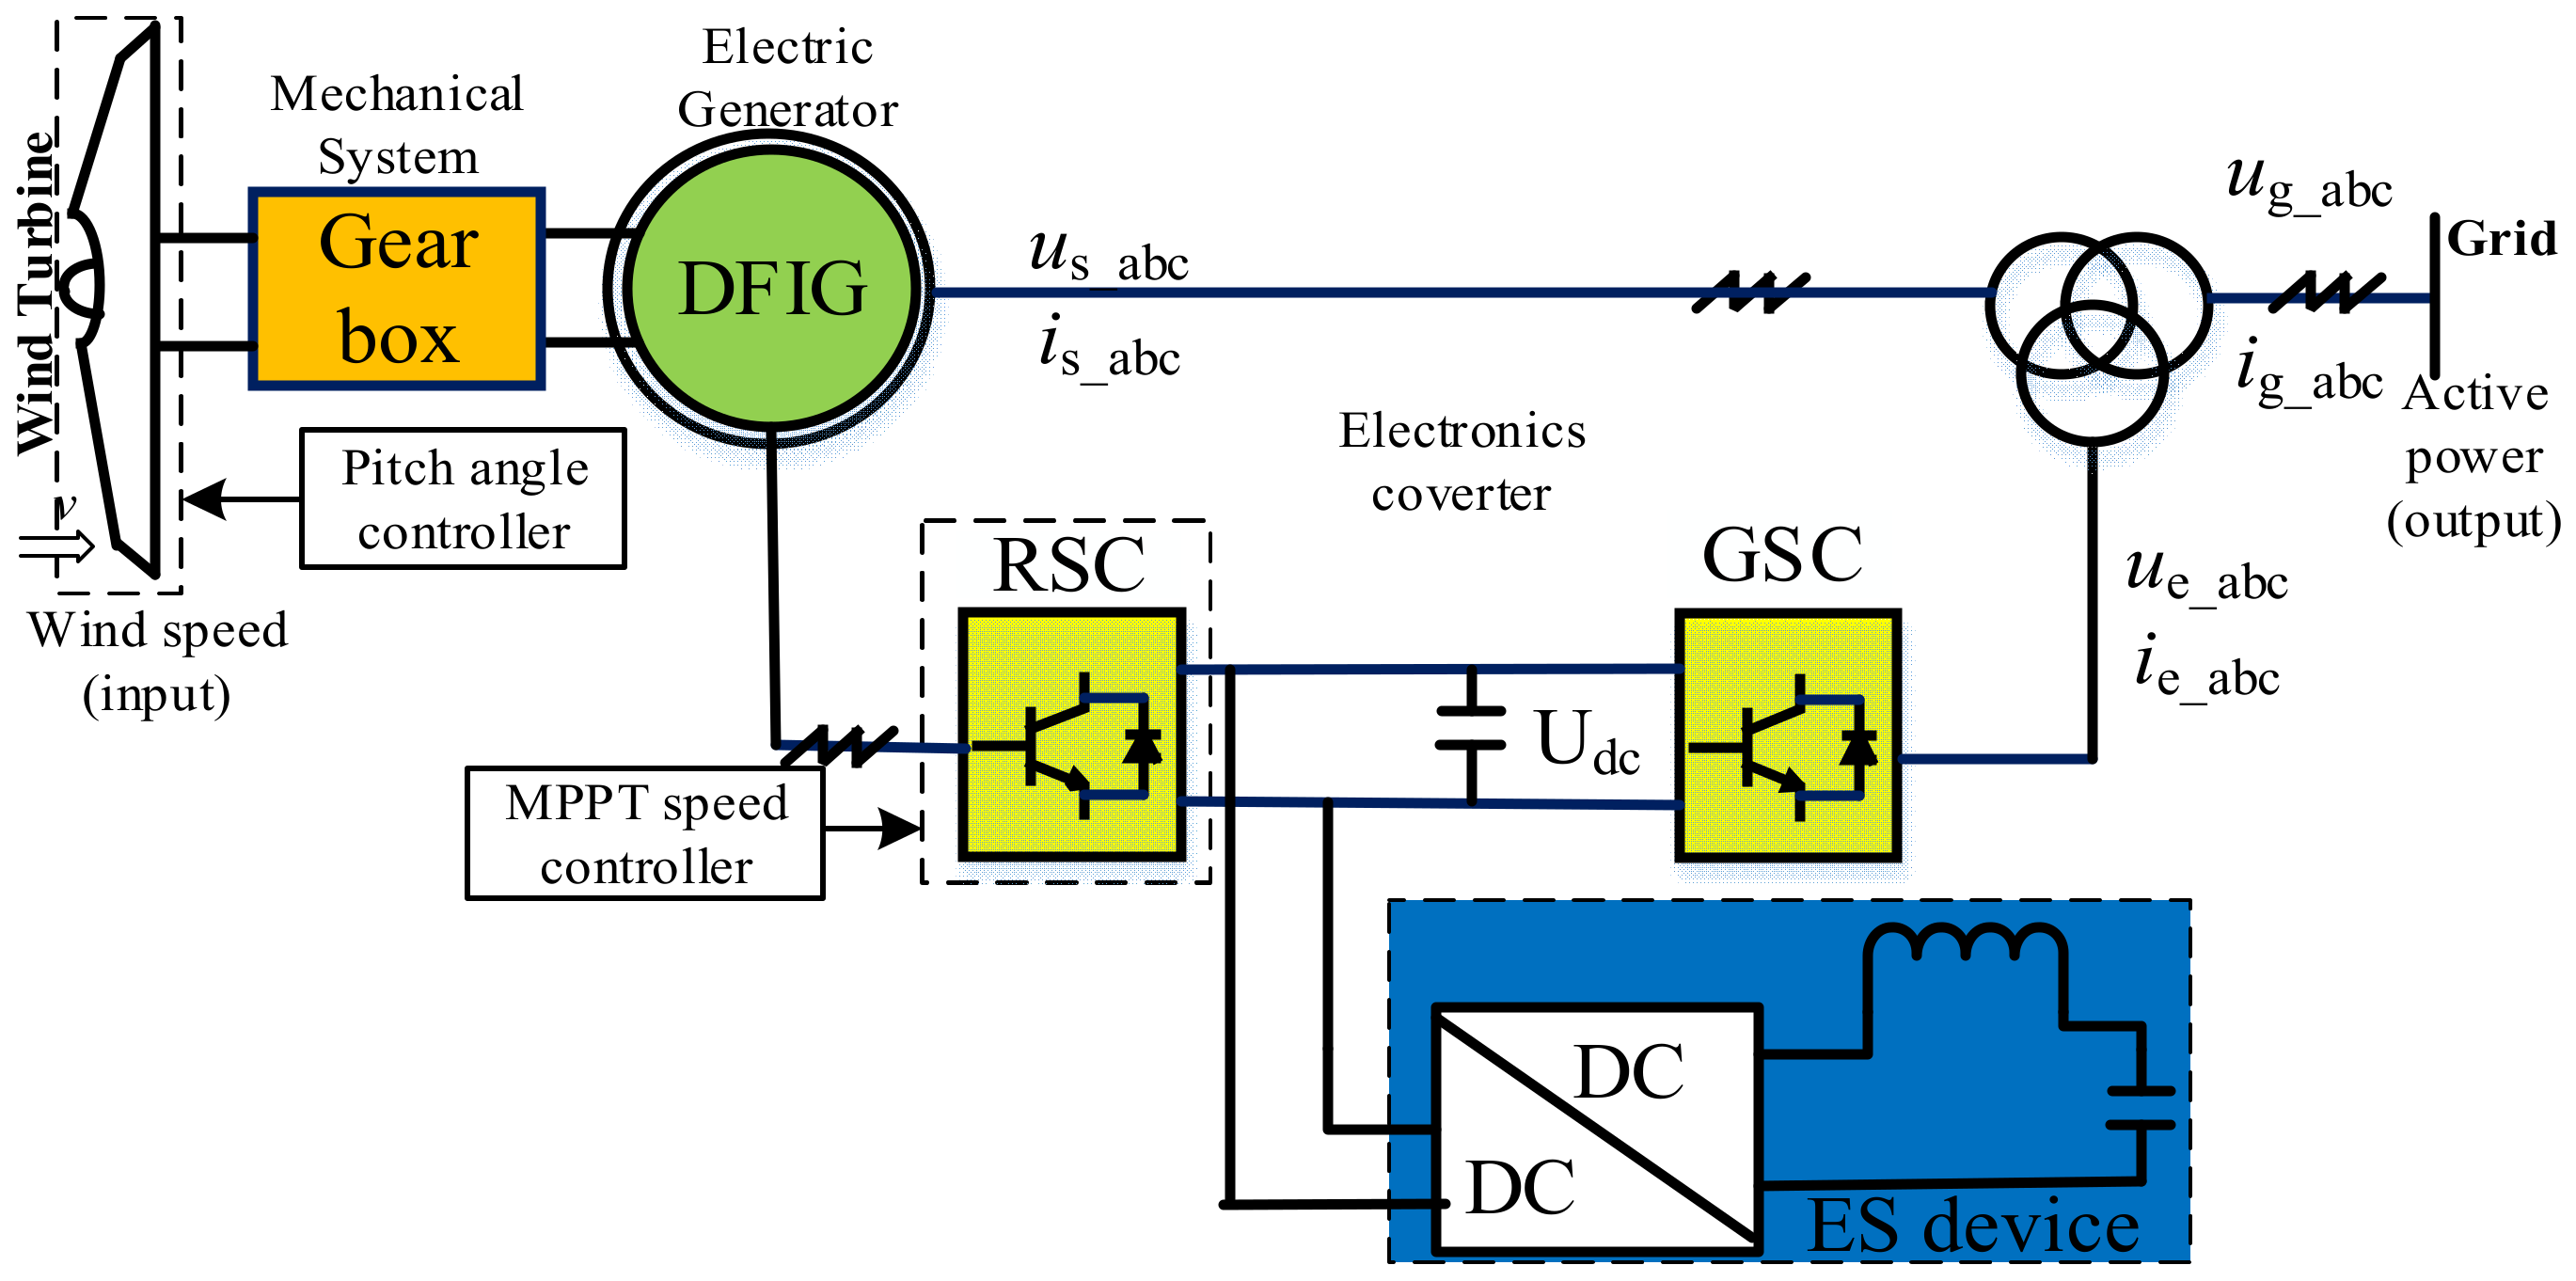
4. DFIG and ES System Structure Model

At present, the DFIG and ES structure is roughly divided into three types according to the different ES installation positions: ① the direct current (DC) bus on the DFIG-side, ② the DFIG output bus, and ③ the grid-connected outlet bus of the wind farm. However, the frequency fluctuations on the low-voltage side of the DFIG grid-connected transformer frequently exceed the action threshold of primary frequency modulation [30]. It is essential to improve the stability and anti-interference of the single DFIG. Therefore, this study connects the ES to the DC bus on the DFIG-side, as shown in Figure 6. RSC and GSC represent the rotor-side and grid-side converters, respectively. The ES device is connected to the DC-side bus capacitor through a bidirectional DC/DC converter, and its charging–discharging power flows directly to the load-side through the grid-side converter. This design integrates the DFIG and ES devices into a whole, and the reasonable control of the two devices enables the DFIG and ES system to have a frequency modulation capability similar to that of a synchronous generator. Besides, when the DFIG is in the non-frequency modulation period, the embedded ES can smooth wind power fluctuations for improving the wind power consumption. As a result, this design improves the ES utilization rate and fully taps the ES multi-functional potential.
In summary, the proposed DFIG and ES structure model can meet the specified functional requirements. Next, Section 4.1 and Section 4.2 analyze the economy and safety of the overall structure.

4.1. ES Selection

In terms of ES device selection, the scholar Yang Y. H. derived the economic benefit index of large-scale ES devices from the performance and economic indexes of ES devices:
y = R o u t R i n / η / C / ( N × d ) + C 0
In the equation Rout and Rin are the purchase price and selling price of ES electric energy, C and C0 are the initial investment and operating cost of output power per kWh, and the units are RMB/kWh; d is the charging-discharging depth of the ES device, N is the cycle life (times) under the corresponding d. The ES direct economic benefit is obtained from Equation (24). The profit rate of r is calculated by
r = ( y 1 ) × 100 %
where r > 0 means profit, otherwise loss. According to the data provided by the battery manufacturer, Rin = 0.15 RMB/kWh, and Rout = 0.15 RMB/kWh. The economic benefit evaluation [31] of various chemical energies is listed in Table 1.
Table 1 indicates that the super capacitor can meet the requirement of frequently charging–discharging due to a large number of cycles. And it has a profit rate of 247% in economic evaluation. Moreover, it has a high power density and can output high power instantaneously, which satisfies the primary frequency modulation requirements of the grid. Therefore, this paper selects super capacitors as ES devices.

4.2. Safety Inspection

As shown in Figure 7, the super capacitor is connected to the bus capacitor on the DFIG DC-side through the bidirectional DC-DC converter. The super capacitor ES device adopts the constant power charging-discharging mode. Figure 7a,b shows the super capacitor charging/discharging principle [32]. Here, R represents the resistance of the capacitor equivalent circuit, I denotes the current flowing through the resistor, PESS is the ES power, Uc is the voltage across the capacitor, U is the voltage across the super capacitor ES device, d = 1 − γ indicates the charging-discharging depth, γ = Umax/Umin is the voltage ratio, and Umax and Umin are the highest and lowest operating voltages of the capacitor.
During the t period, the energy of the supercapacitor ES device is all released. Its voltage is reduced from Umax to Umin. The energy released in this process is
E E S S = 0 t P E S S d t = γ 2 1 C U max 2 2 + R C P E S S ln d
The electric energy released by the super capacitor ES device is
E = 1 γ 2 C U max 2 2
Through Equations (26) and (27), the discharge efficiency is obtained as
η = E E S S E = 1 + 2 R P E S S ln γ 1 γ 2 U max 2
Considering the discharge efficiency, the ES capacity should be Configured as
P = P E S S η = P E S S 1 γ 2 U max 2 1 γ 2 U max 2 + 2 R P E S S ln γ
According to Equation (29), the premise of reducing the ES Configuration capacity is to increase the ES discharge efficiency. As Equation (28), the super capacitor voltage should be relatively large to maximize the ES efficiency. But the voltage of a single capacitor is usually about 2.5 V. Thus, super capacitors need to be connected in series and parallel for the ES high power requirement. If the ES device is composed of m groups of super capacitor modules in series and n groups in parallel, it is necessary to ensure that the super capacitor power state at the minimum voltage is full power output, which is expressed as
U min 2 R P E S S m n
The super capacitors meet Umin >> Id R. Ignoring the equivalent series resistance R in the capacitor, the ES capacity We under the capacitor capacity CF is
W e = 1 2 C F ( U max 2 U min 2 )
Equations (28), (30), and (31) are combined to calculate the operating voltage and efficiency of various combinations using the 144 V × 55 F supercapacitors, as listed in Table 2.
According to the data in Table 2, this paper chooses 10 groups of 144 V × 55 F supercapacitors with 5 groups in series and 2 groups in parallel to form the ES device. The ES lowest operating voltage Umin is 32 V. The highest operating voltage Umax is 720 V. The discharge efficiency is 96.9%. According to the output power limit of the grid-side converter, the output power of the converter in the ES device participating in the frequency modulation should meet the constraint:
P P pcs = P pcs P w
In the equation Ppcs is the transmission capacity of the DFIG grid-connected inverter, and Ppcs is the ES maximum transmission capacity.
We chose the DFIG of model CCWE-1500/70.DF. Its power is 1.5 MW, and its slip range is 0.8~1.2. When DFIG runs at the super-synchronous speed and the slip rate of s < 0, the stator and rotor both feed power to the grid. The output power of the stator side to the grid is Ps, and the output power of the grid-side inverter to the grid is Pw = (−s) × Ps. When the DFIG runs at the high wind speed and super-synchronous maximum speed, the rotor’s maximum output power across the grid-side converter is 250 kW. The ES maximum output power is 5%·PN = 75 kW, and the maximum transmission power of the grid-side converter is 325 kW. The rated power of the grid-side converter in the DFIG is 480 kW > 325 kW, which meets the output power requirements of the converter.
To sum up, it is feasible for the DFIG and ES structure, as Figure 6, selecting the 10 groups of 144 V × 55 F supercapacitors (5 groups in series, 2 groups in parallel) and the DFIG (CCWE-1500/70.DF model, 1.5 MW).

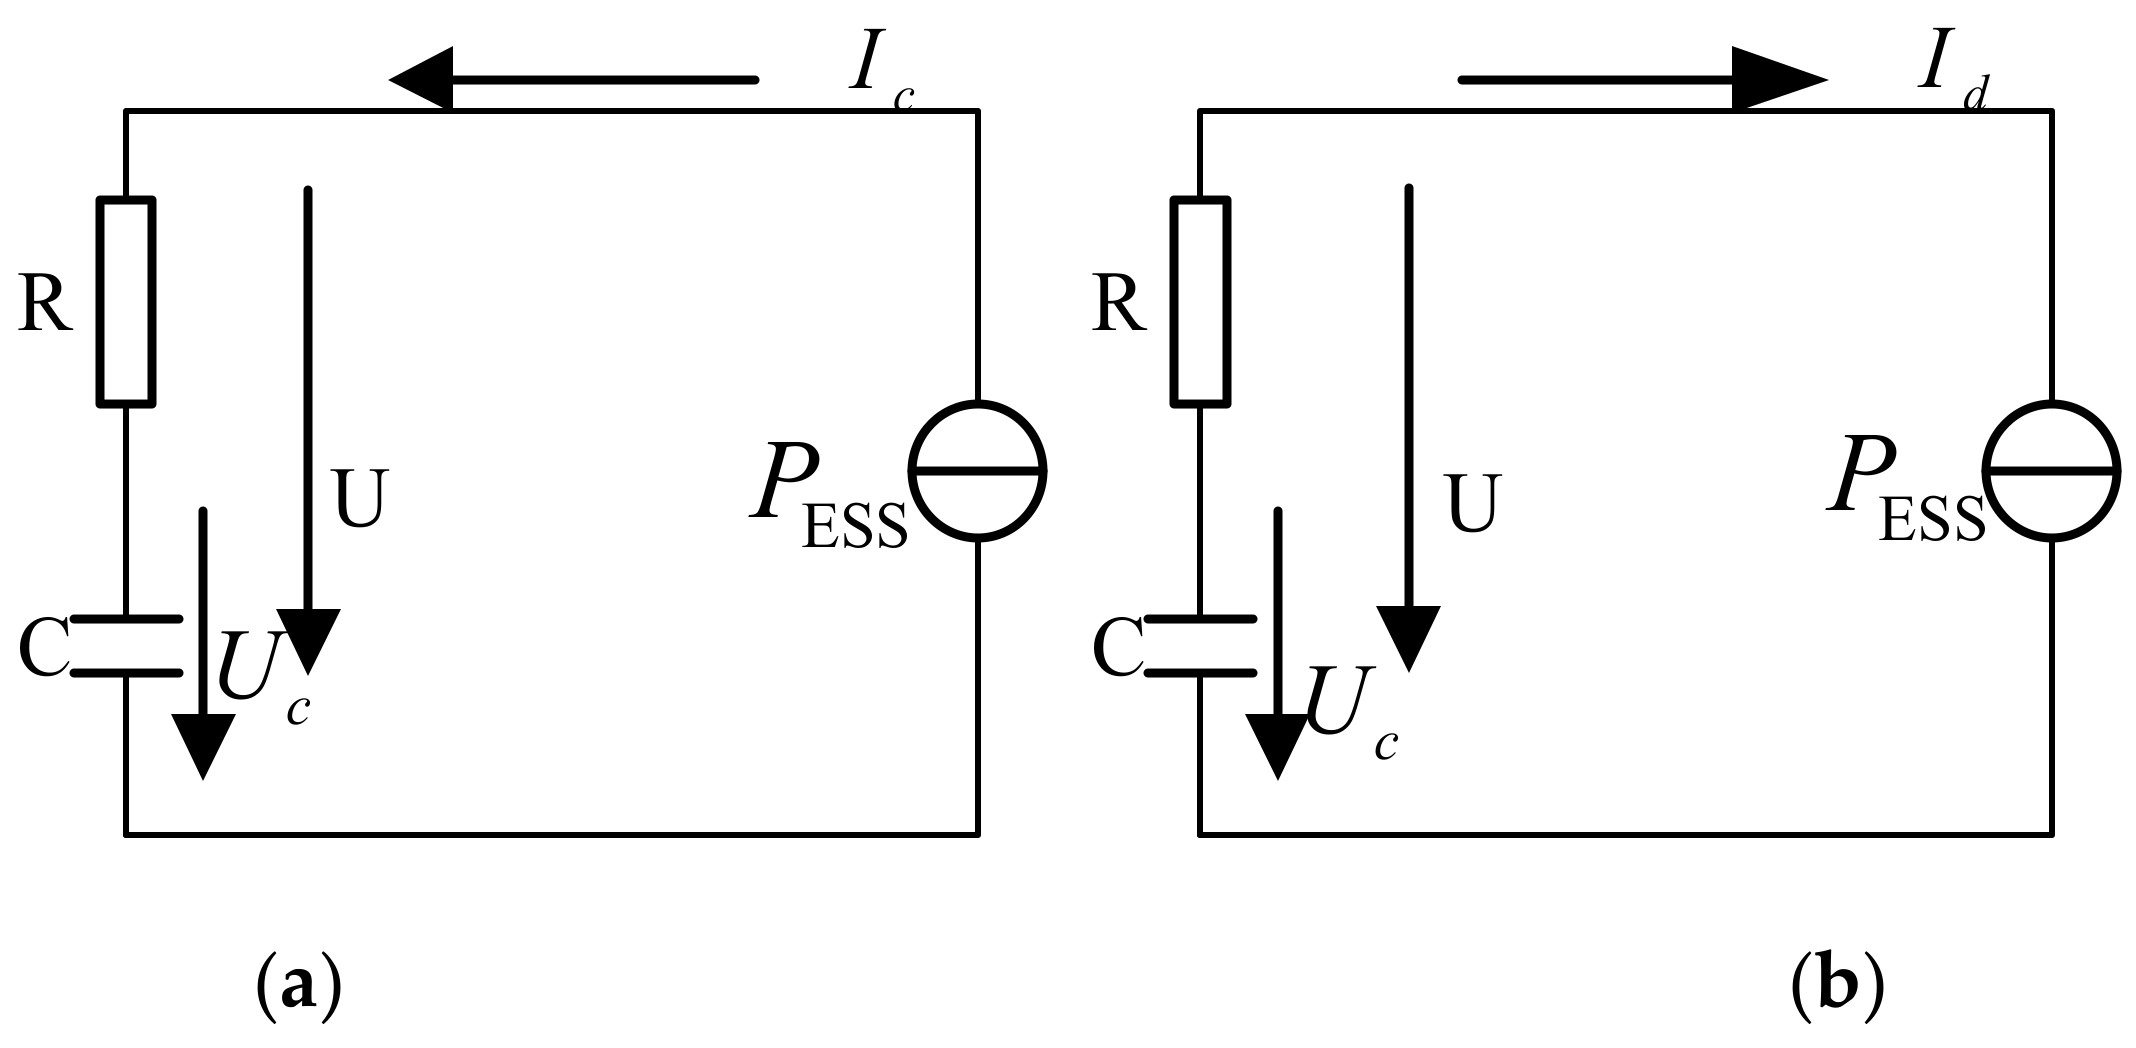
4.3. Multi-Functional Control Strategy of ES

If the ES in the DFIG and ES system only assists DFIG for frequency modulation, it cannot contribute to wind power consumption, resulting in low ES utilization. Under normal operating conditions, frequency fluctuations caused by load disturbances are low probability events. In contrast, the probability of ramp events is relatively high due to random wind speed. It seriously affects the wind power consumption and the grid frequency [33]. Therefore, smoothing wind power ramp events can further improve the frequency modulation effect. The wind power ramp event is defined as [34]
P w ( t + Δ t ) P w ( t ) Δ t > ε
In the equation PW(t + Δt), PW(t) are the wind power output power at the t + Δt and t moments, respectively; Δt is the sampling period, ε is the fluctuation rate.
To improve ES utilization, this paper proposes an ES multi-functional control strategy. That is, once the system frequency fluctuates, the frequency modulation control of the DFIG and ES system will be activated. Under normal operation, the primary function of ES is to smooth the wind power ramp events and improve wind power consumption. The specific smoothing strategy refers to the literature [35]. In the embedded generator structure model, the multi-function control strategy of ES is shown in Figure 8.

5. Simulation Analysis

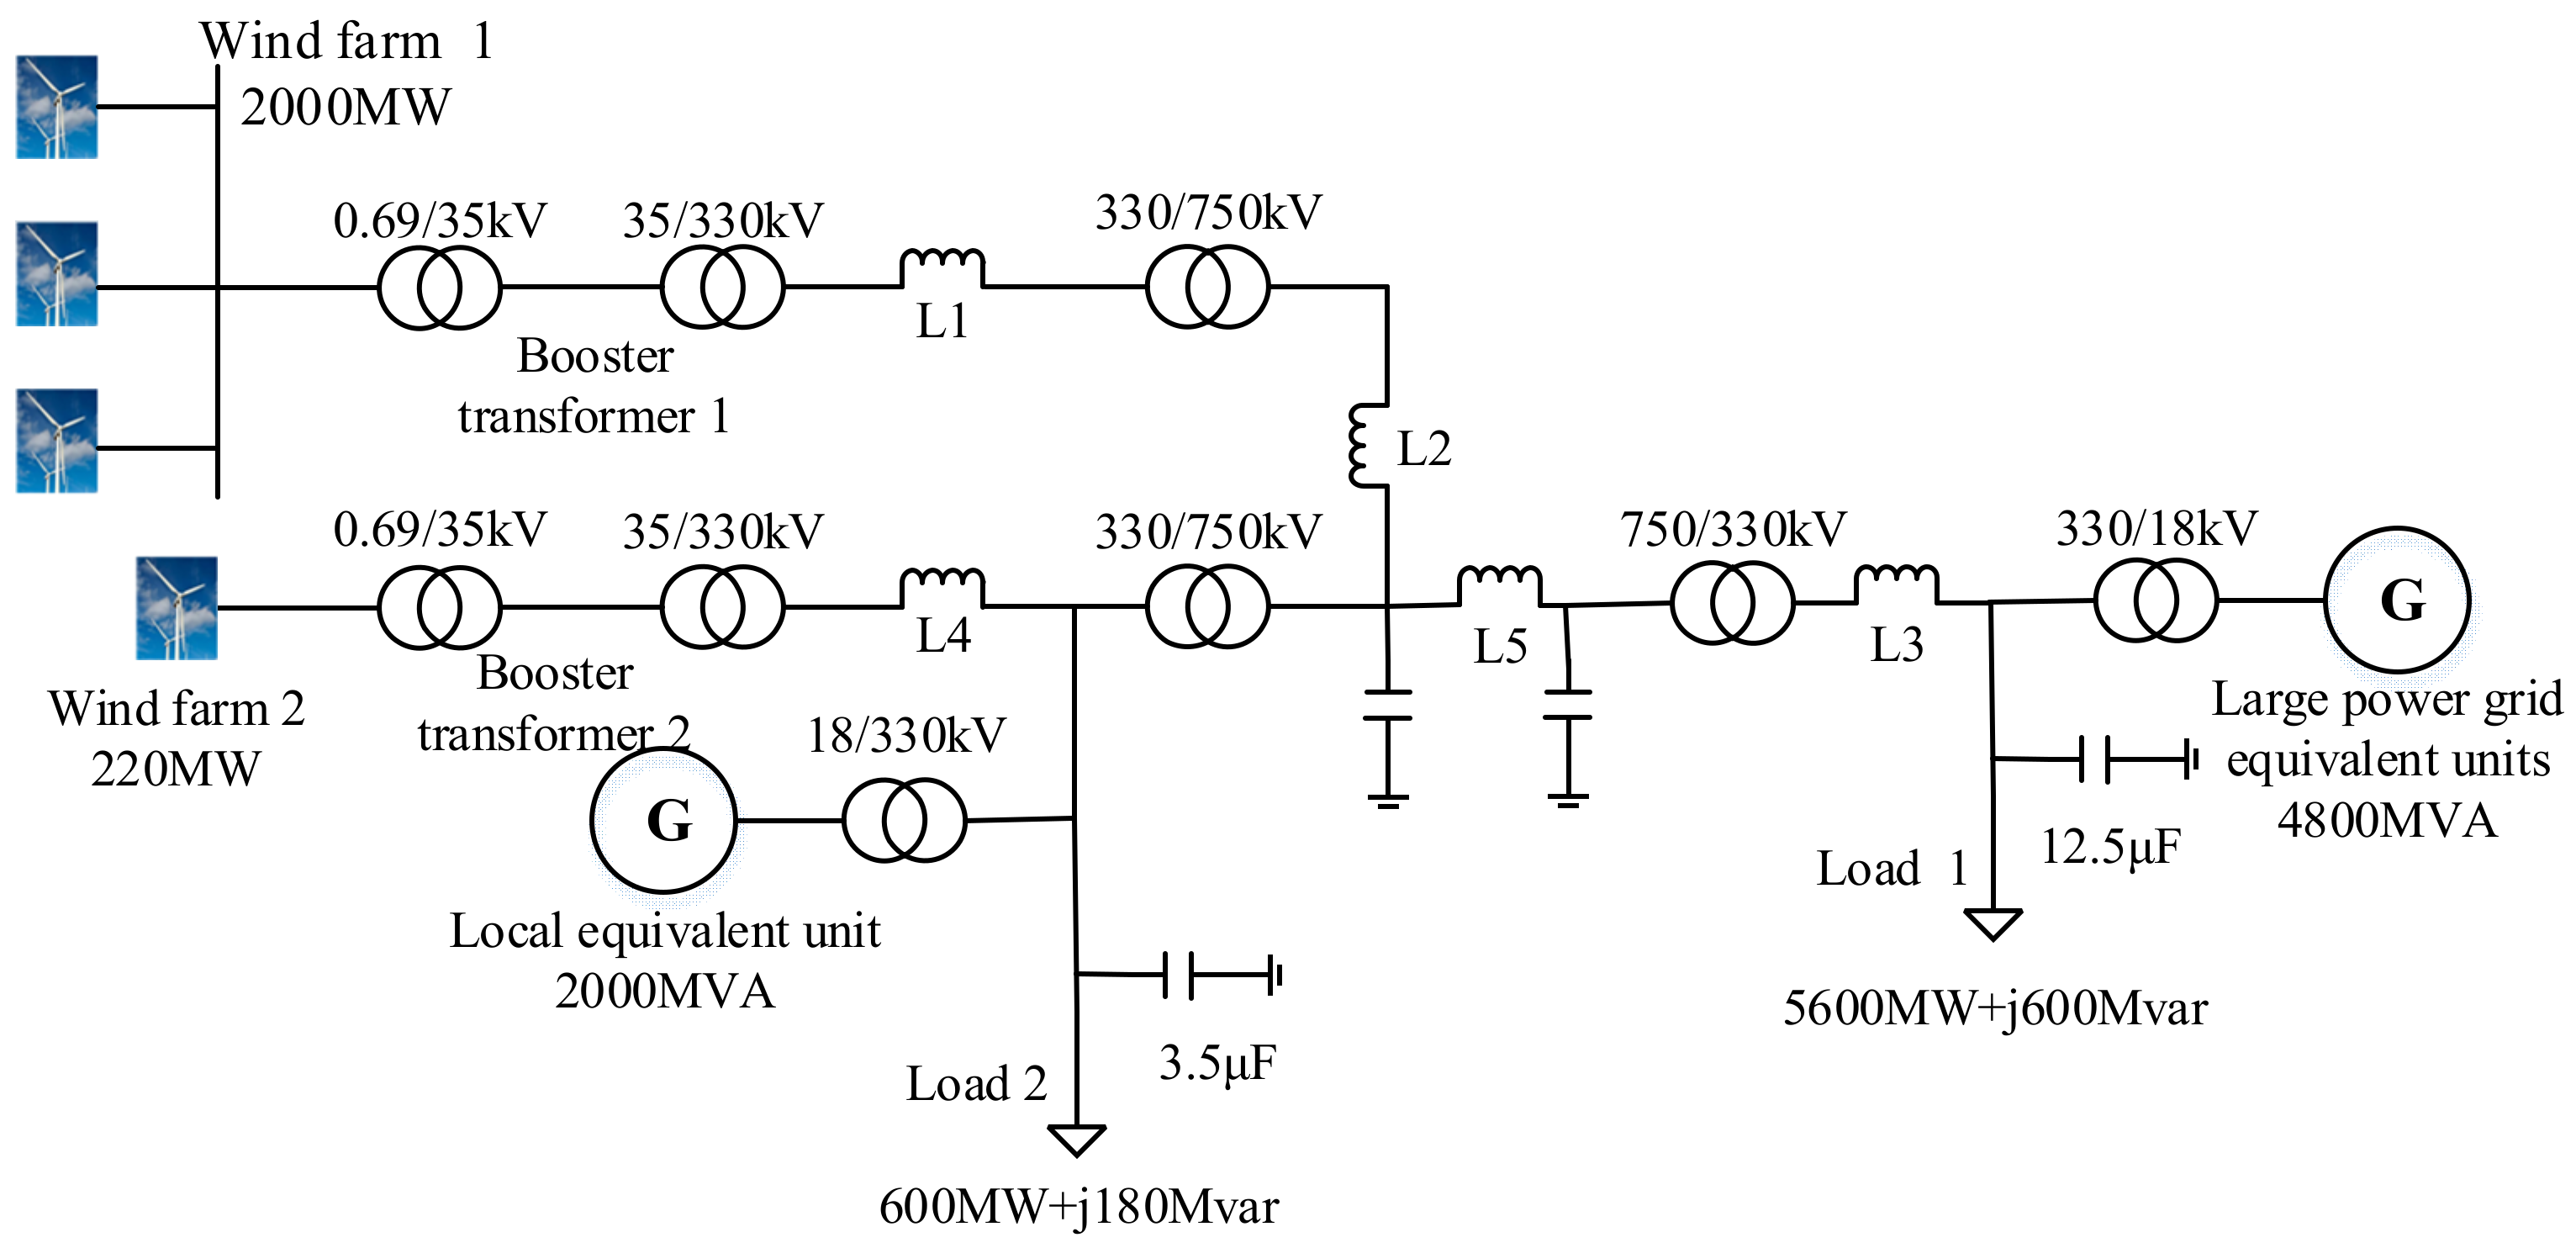
5.1. Simulation Parameters

To verify the effectiveness of the proposed ES Configuration method and coordinated control strategy, a wind farm in northwest China was taken as the research object, and the equivalent system was established on the MATLAB/Simulink software platform, as shown in Figure 9. The two equivalent wind farms in the system are gathered at the 330 kV bus bar through the two-stage boost of 0.69/35 kV and 35/330 kV, and then output electric energy after being boosted by a 330/750 kV transformer. The parameters of system transmission line, equivalent generator, equivalent DFIG, and DFIG and ES system power are listed in Table A1, Table A2, Table A3 and Table A4 of Appendix A. The rated power of the equivalent synchronous generator integrated into the grid is 4800 MVA, and its active load is 5600 MW. The rated power of the equivalent synchronous generator in the local power plant of wind farm_2 is 2000 MVA, and its active load is 600 MW. The upper and lower boundaries of the SOC are set to 0.8 and 0.2, and the initial value is set to 0.5.

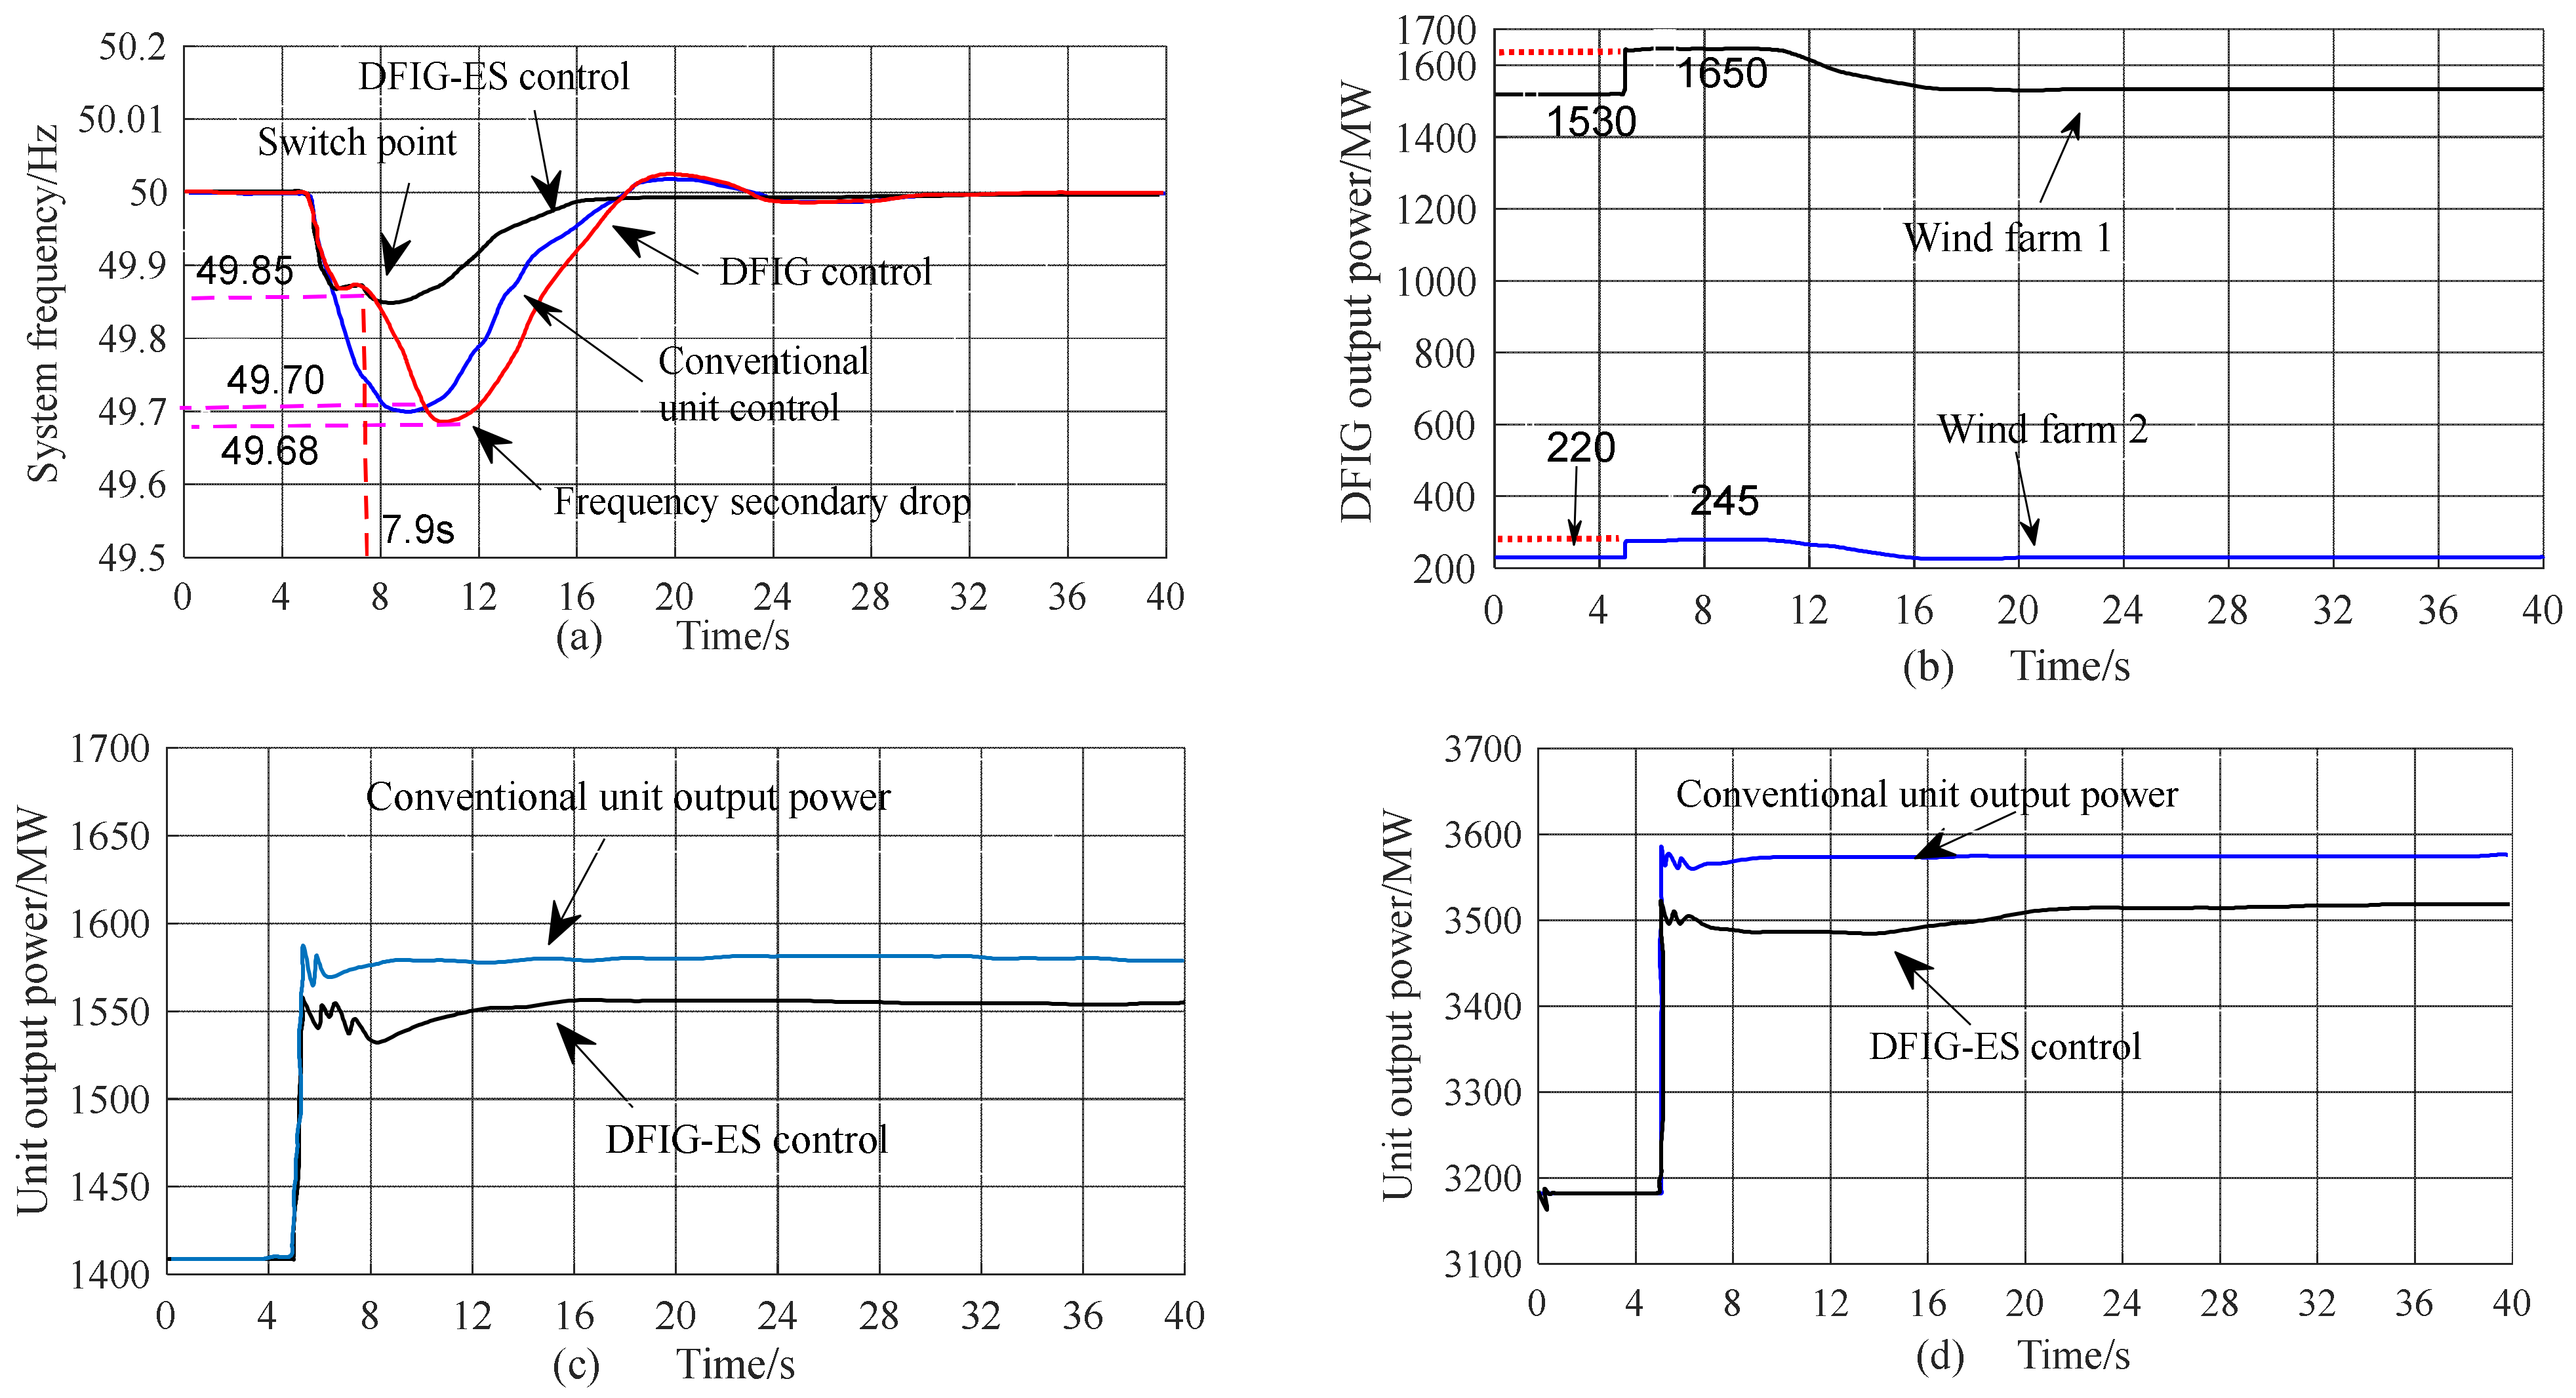
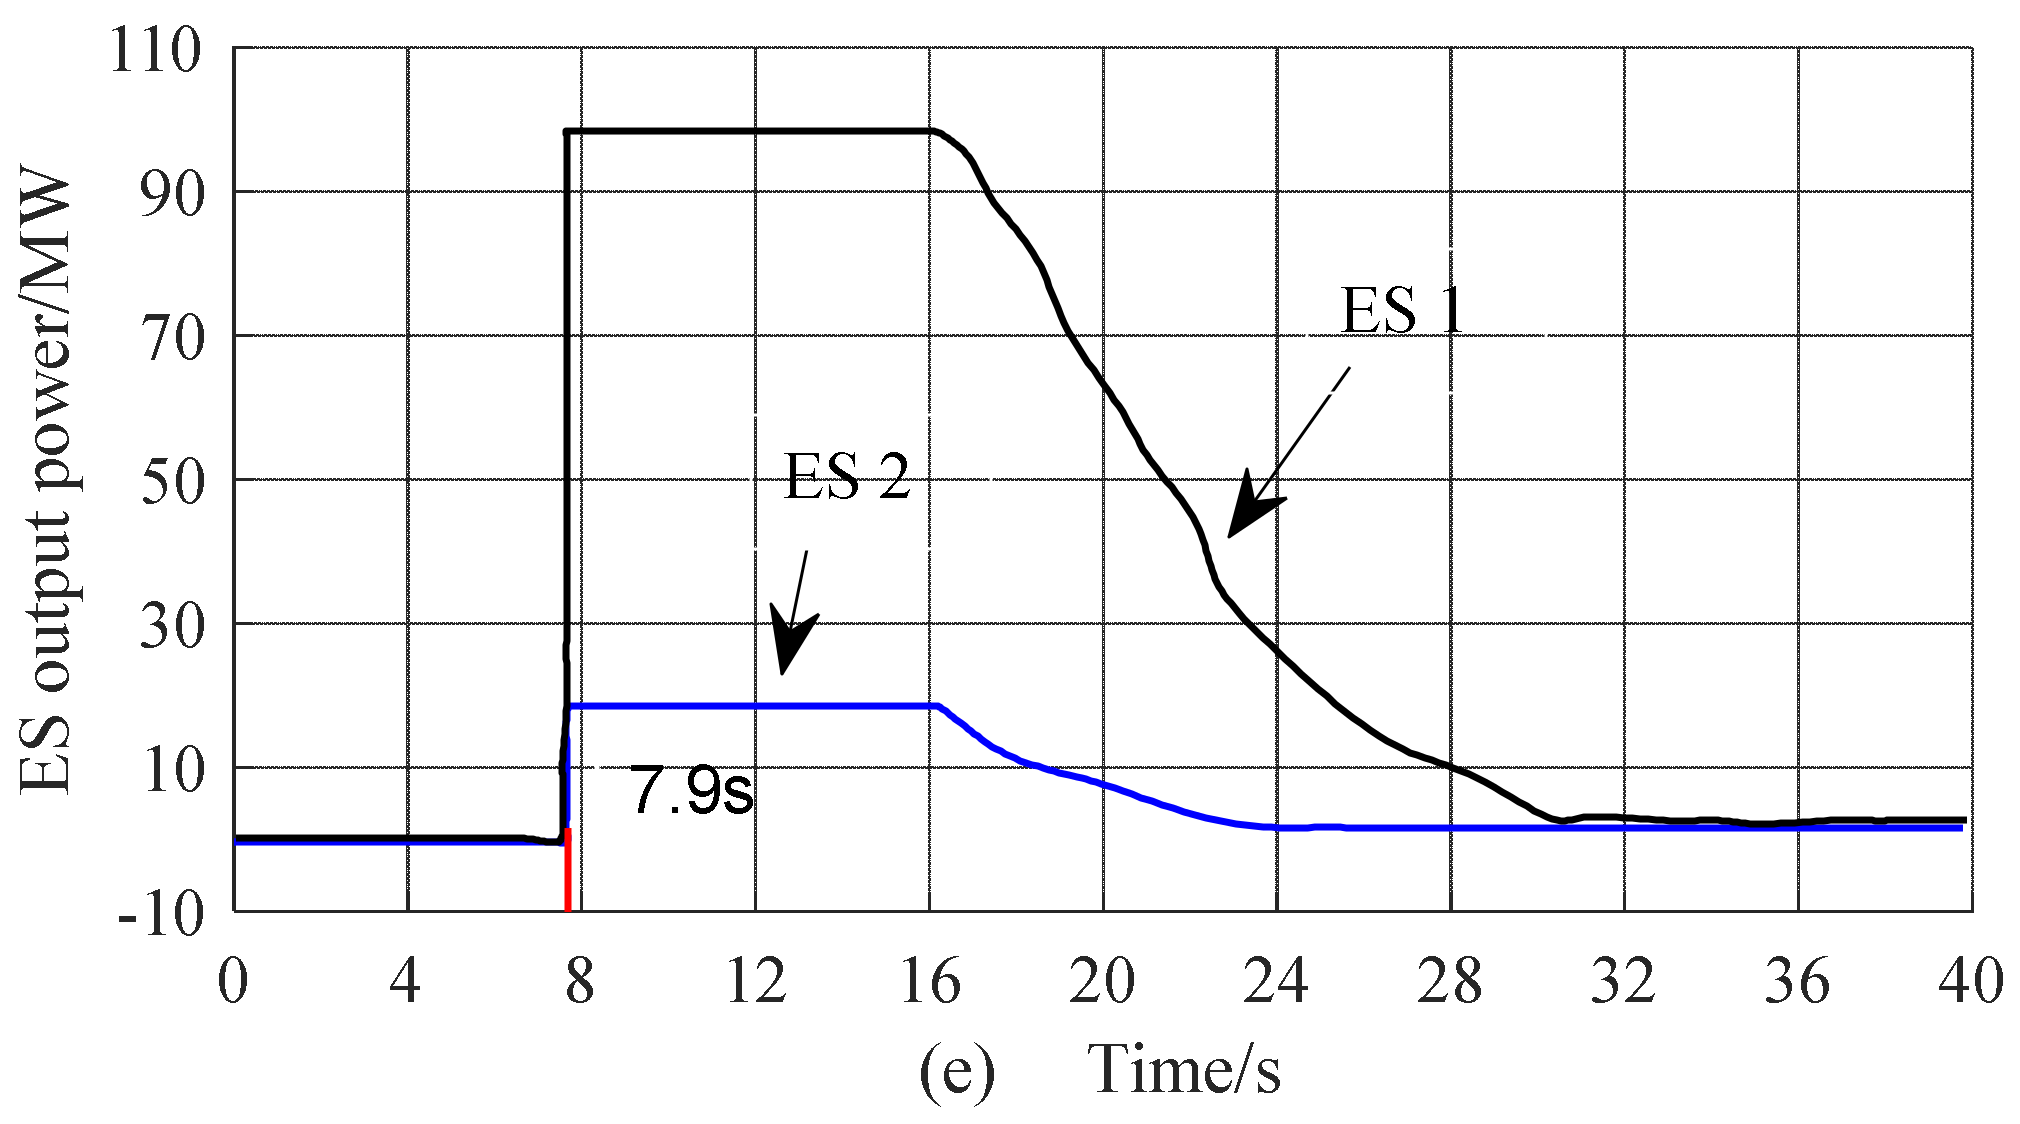
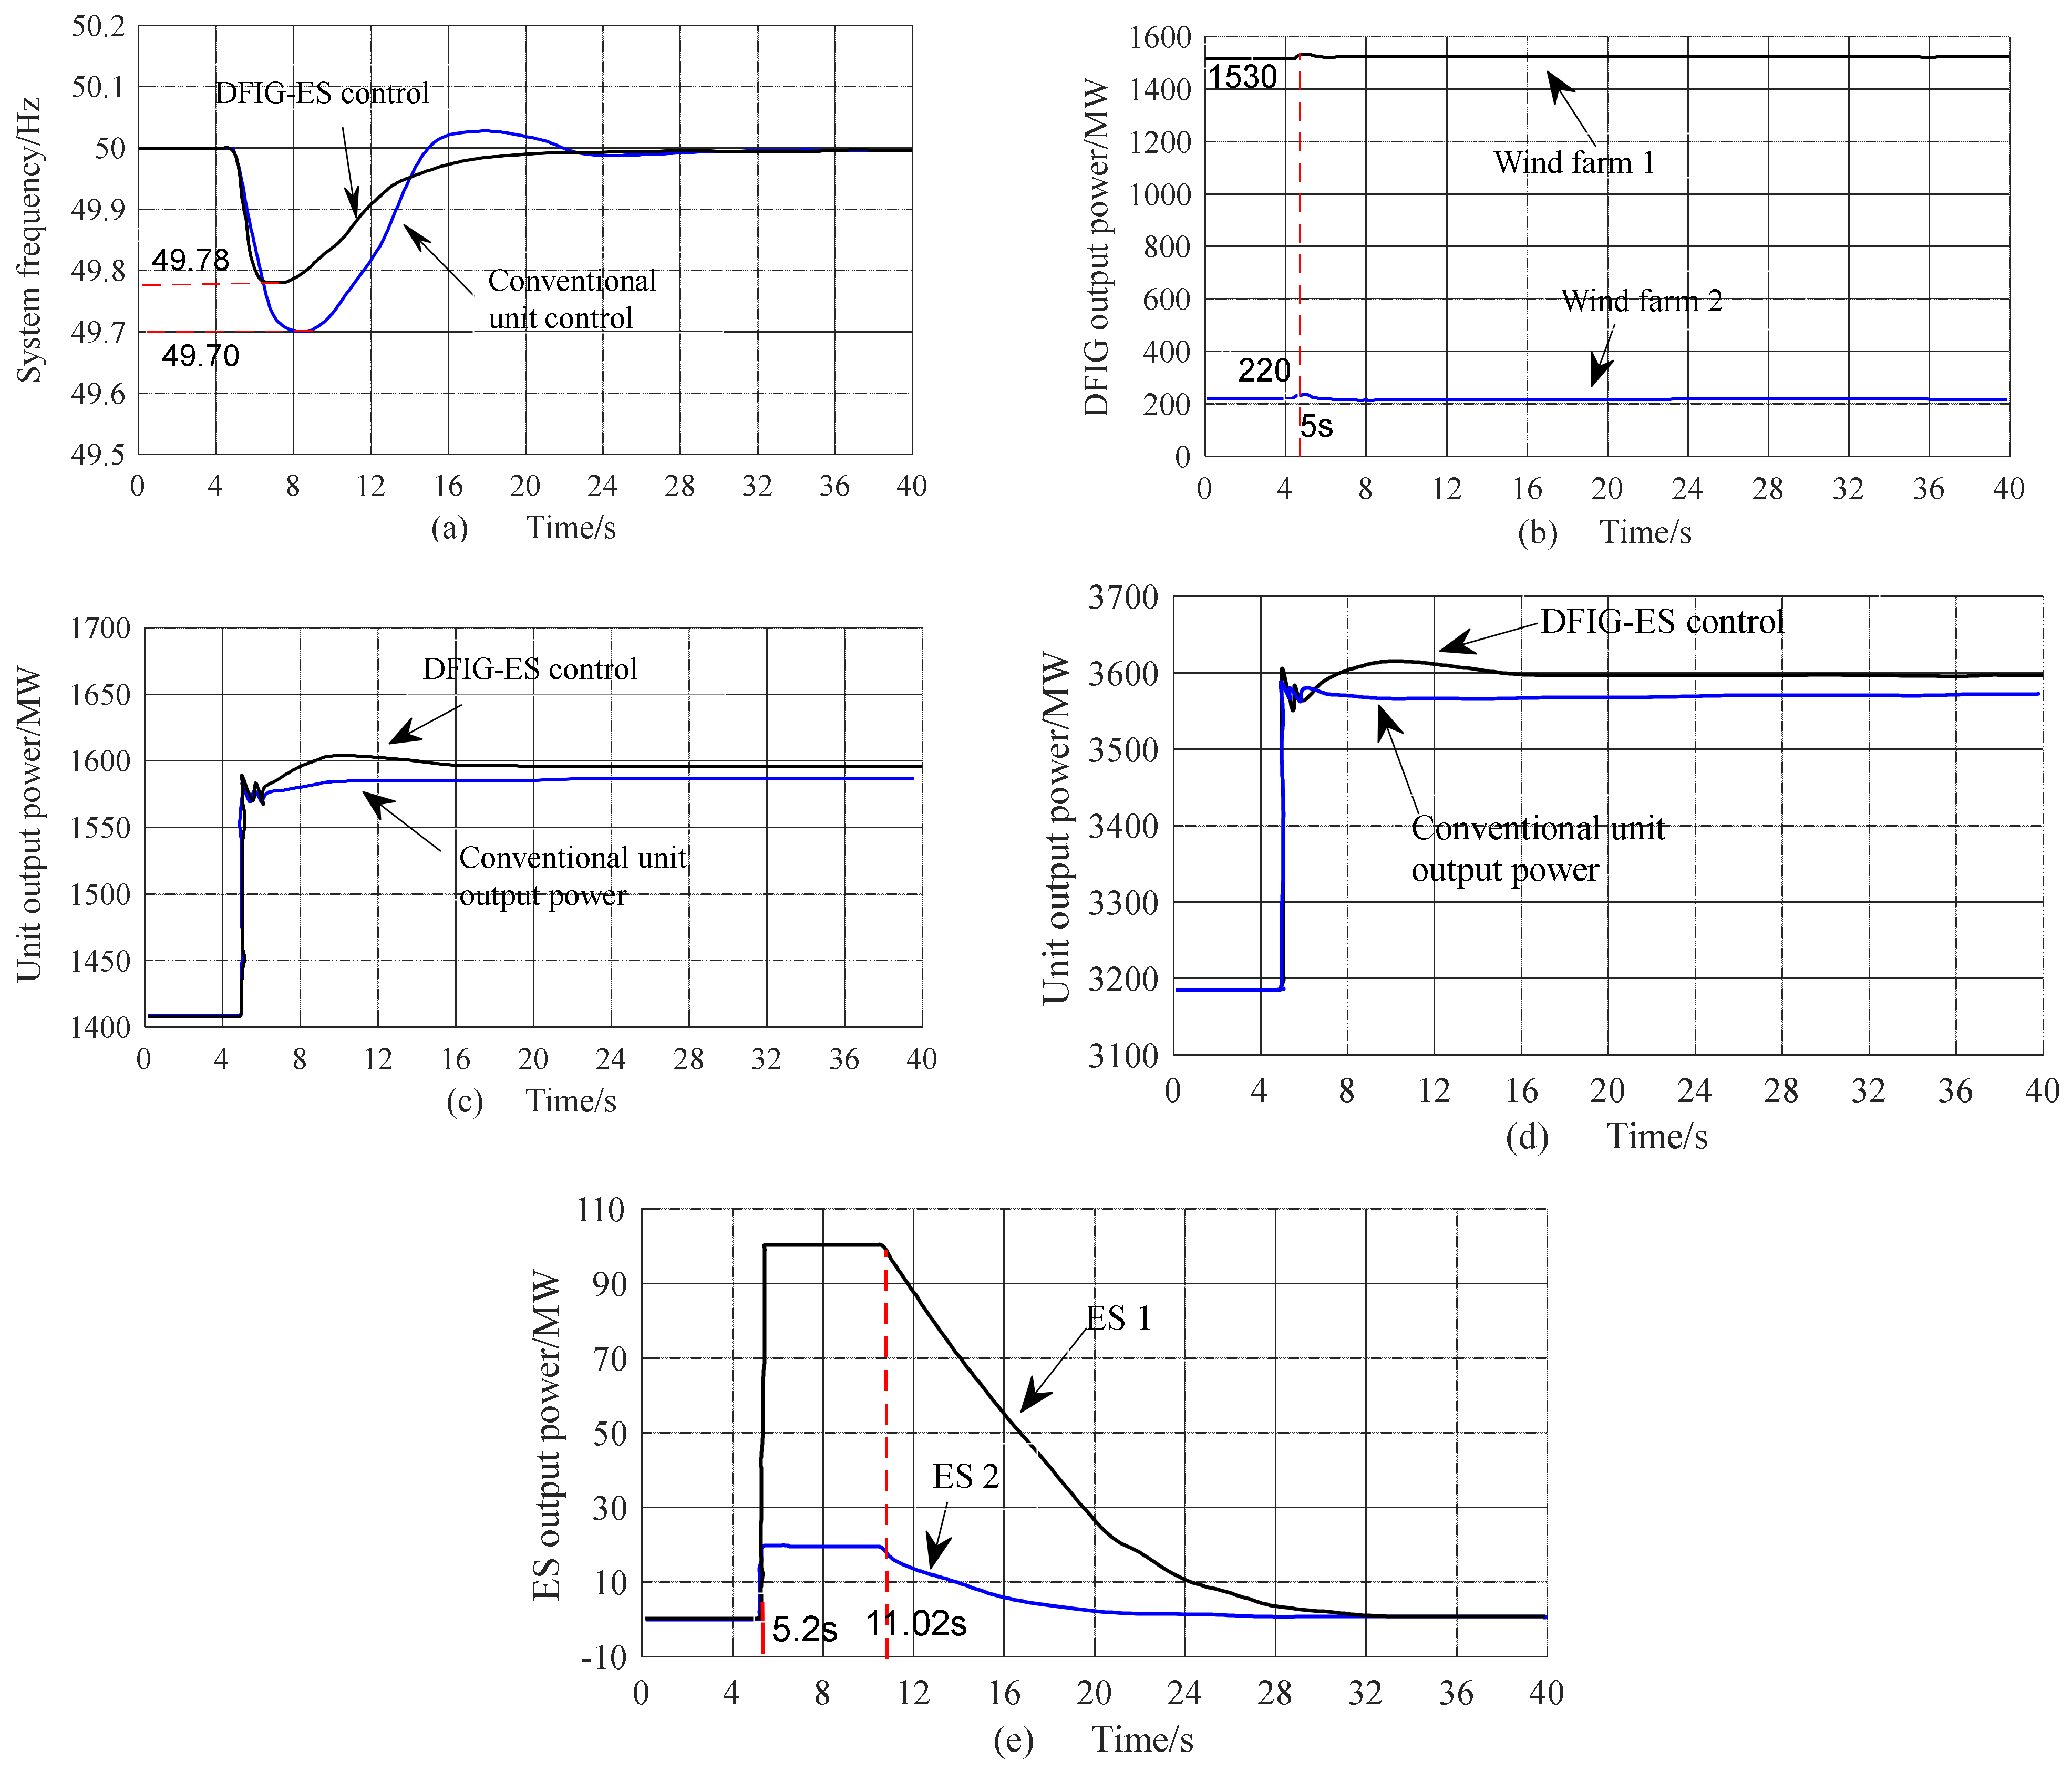
5.2. Load Step Disturbance at the Moderate Wind Speed

Under the above operating conditions, the DFIG operates in the MPPT state, where the medium wind speed is 10 m/s. Given a sudden increase of 450 MW in load_1 at the 5 s moment, three control strategies are comparatively analyzed to verify that the ES Configuration capacity can assist the DFIG speed recovery. The strategies include the DFIG individual control, DFIG and ES coordinated control, and equivalent conventional generator control (i.e., the synchronous generator with the equal capacity as DFIG). The frequency curve and frequency modulation power curve are shown in Figure 10.
As shown in Figure 10a, the lowest point of the primary frequency under the DFIG individual control is the same as that under the DFIG and ES coordinated control. However, when the rotor starts to recover speed, the DFIG individual control causes the secondary frequency drop. The lowest frequency of the drop is 49.68 Hz, which is smaller than 49.70 Hz of the equivalent conventional generator, thus aggravating the system frequency deterioration. The DFIG and ES coordinated control avoids this problem, and the lowest frequency is 49.85 Hz. As a result, the system frequency modulation performance is significantly improved. This is because the DFIG individual control does not provide additional power to balance the energy absorbed by the DFIG rotor during the inertia response stage. The DFIG and ES coordinated control uses the ES device to compensate for the energy required for the DFIG speed recovery. As shown in Figure 10e, the ES releases the energy for the DFIG speed recovery at the 7.9 s moment, thus avoiding the secondary frequency drop.
At the 5 s moment, the system load suddenly increases. The DFIG releases its energy to support the frequency by reducing the rotor speed, as shown in Figure 10c. Under the DFIG and ES coordinated control, the wind farm is assisted by the ES device, and its active output power continuously increases within a certain period. During this period, the unbalanced system power borne by the regional and the local equivalent generators is significantly reduced. During the ES gradually exiting the frequency modulation, conventional generators serve as power support after the ES withdrawing, and their output power increases, as shown in Figure 10c,d. Consequently, the system power balance is ensured, and the system frequency operating characteristics are effectively improved.

5.3. Load Step Disturbance at the Low Wind Speed

The DFIG and ES coordinated control and equivalent conventional generator control are comparatively analyzed to verify that the proposed ES Configuration can effectively provide inertia response. Given a sudden increase of 450 MW in load_1 at the 5 s moment. The frequency modulation simulation results at the low wind speed (8 m/s) are shown in Figure 11.
Figure 11a presents the system frequency response curve. The results show that the frequency response of the DFIG and ES coordinated control is much better than that of the equivalent conventional generator control. The maximum frequency deviation increases by 0.16% from 49.70 Hz to 49.78 Hz. The main reason is that the wind farm is assisted by the ES device under the DFIG and ES coordinated control, which can quickly respond to system frequency changes, reduce the frequency change rate, and improve the frequency deviation. Under the DFIG and ES control, however, the frequency response at the low speed is worse than that at the medium speed, as shown in Figure 10a and Figure 11a. It is because the inertia injected by the DFIG is greater than the ES maximum power. For example, when the DFIG speed is reduced from 1.2 pu to 0.7 pu (i.e., minimum speed), the kinetic energy of 0.95 PN is released, much greater than the ES energy of 0.05 PN.
Figure 11b shows the frequency modulation output power of the wind farm. When the load increases at the 5 s moment, the DFIGs in the wind farm run at the low wind speed. Consequently, the equivalent wind farms_1 and wind farms_2 cannot provide inertia support, and the active output power is almost unchanged. The system inertia is provided by the ES, which is put into operation at the 5.2 s moment, as shown in Figure 11e. When the ES inertia gradually withdraws from the frequency modulation, the conventional generator output increases to maintain the system power balance and frequency stability. Therefore, during the ES inertia period, the output power of conventional generator gradually increases under the DFIG and ES frequency modulation control. After the inertia control, the system frequency modulation power is mainly provided by the regional and local equivalent generators, as shown in Figure 11c,d.
Furthermore, Figure 11c,d shows that after the equivalent conventional generators replace the wind farms at the low wind speed, the active output increment of the regional and local equivalent generators is less than that of the DFIG and ES coordinated control. At the low wind speed, the DFIGs do not participate in the frequency modulation. Limited by the capacity, the ES also exits the frequency modulation after the inertia response. The later frequency modulation power is mainly provided by the conventional generators, which need to compensate for the wind farm frequency modulation power. Thus, the output power is greater than that of the equivalent conventional generators.
To sum up, at low and medium wind speeds, the DFIG does not need to reserve spare capacity and runs in the MPPT mode with the ES assistance, thereby reducing the wind abandonment. Moreover, the coordinated control of the two effectively avoids the secondary frequency drop when the wind power exiting frequency modulation. It helps to improve the dynamic frequency modulation capability.

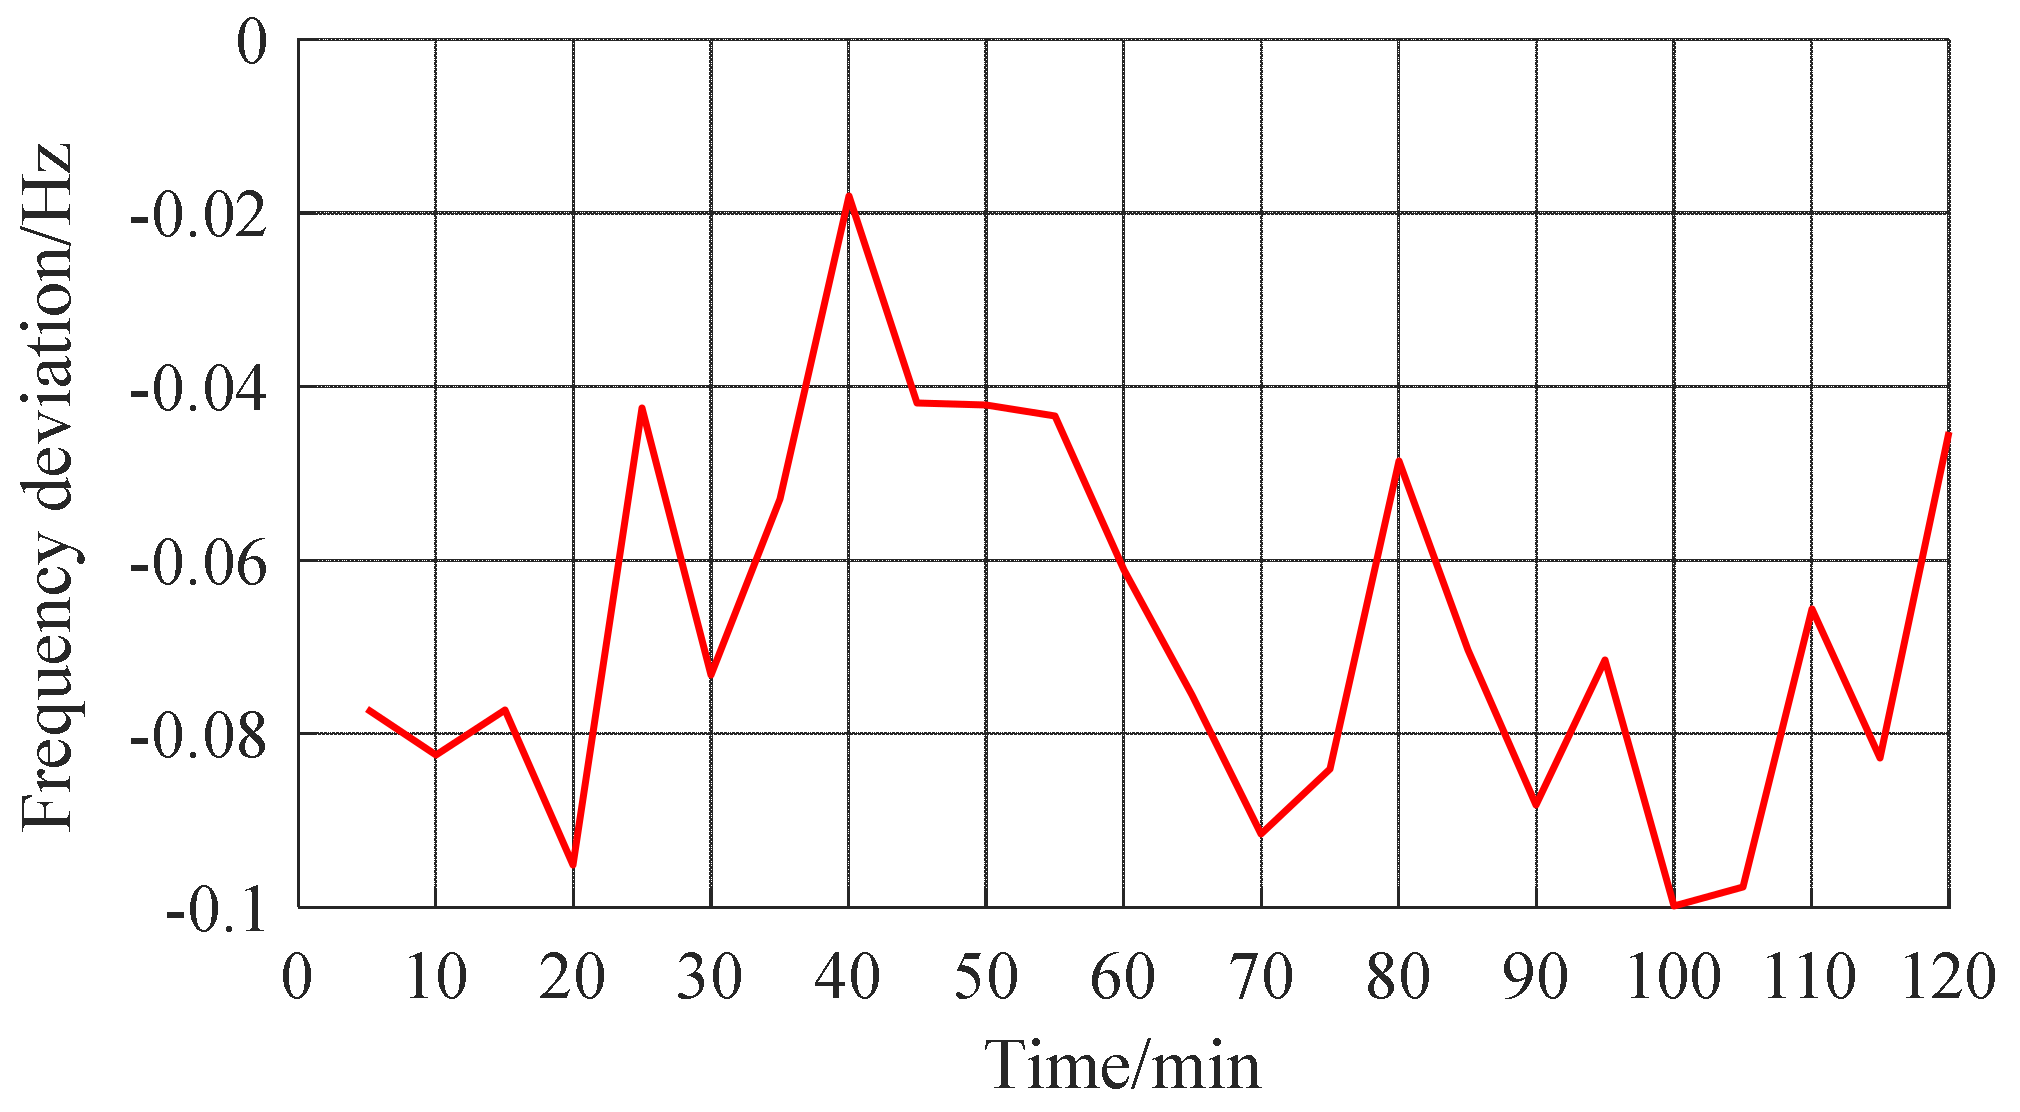
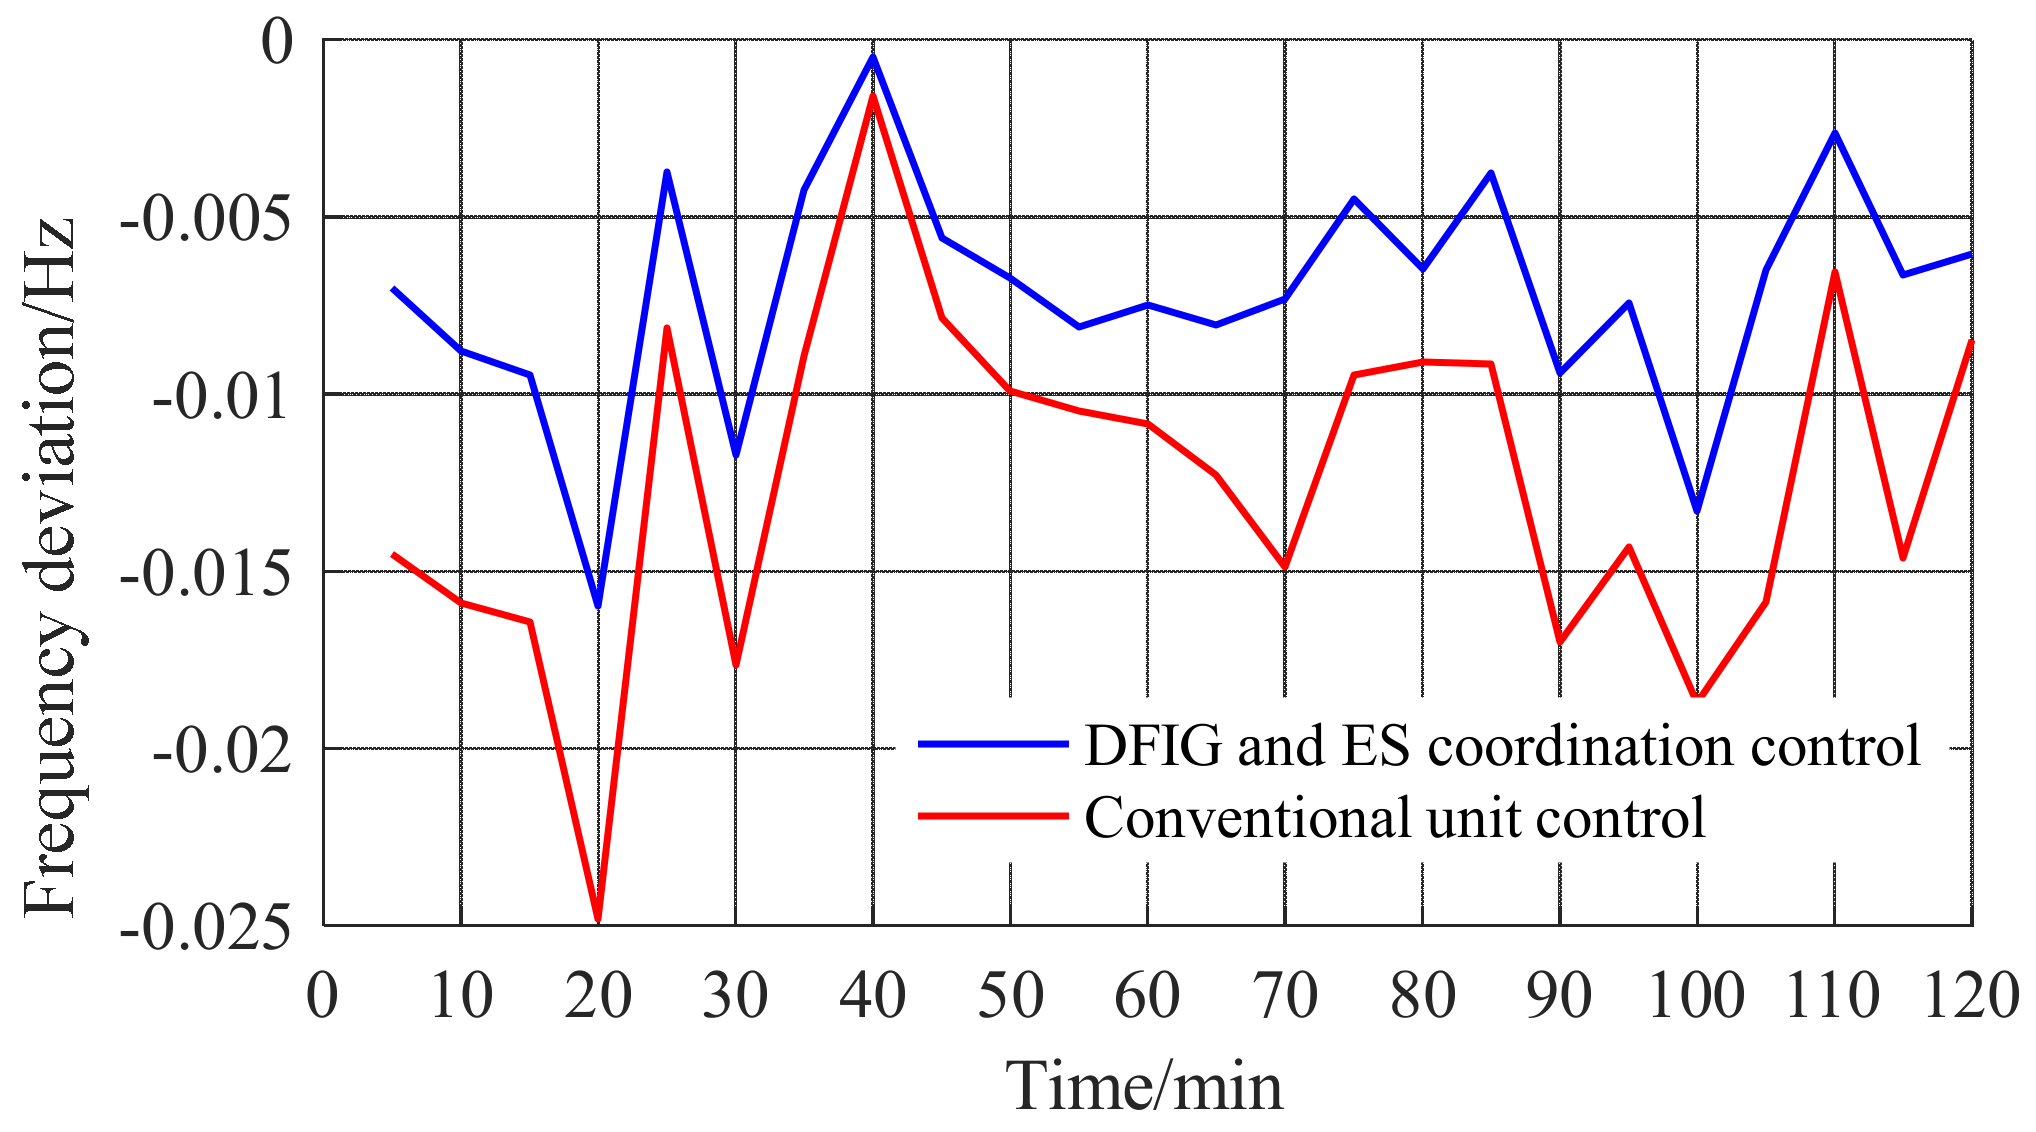
5.4. Continuous Load Disturbance

To verify the adaptability of the DFIG and ES coordinated control strategy under continuous load disturbances, a 2-h continuous load disturbance with the slight wind speed fluctuation and significant load fluctuation is introduced. The disturbance curve is shown in Figure 12, and the maximum load disturbance is 348 MW. Figure 13 presents the DFIG and ES frequency deviation curve without participating in frequency modulation. The frequency deviation curves of the DFIG and ES control and conventional generator control are shown in Figure 14. The maximum frequency deviation occurs at 19:35. Taking the deviation of non-frequency modulation DFIG and ES as the benchmark, the improvement effect of the other two control strategies is calculated. The frequency modulation effect under different control strategies is listed in Table 3.
Figure 13 and Figure 14 compare the DFIG and ES frequency dynamic response under three different frequency modulation controls with continuous load disturbances. Compared with non-frequency modulation control, the DFIG and ES control and conventional generator control both improve the system frequency effectively. Compared with the conventional generator control, the improvement effect of DFIG and ES control is more apparent. The improvement of the DFIG and ES control is 28.89% more than that of the conventional generator control. It shows that the DFIG and ES coordinated control improves the dynamic characteristics of the frequency recovery transition process. The results in Figure 14 indicate that under continuous load disturbances, the DFIG and ES coordinated control quickly responds to the frequency change, releases the rotor kinetic energy to provide virtual inertia support, and assists DFIG in recovering the MPPT operation. It is similar to the simulation result under the step disturbance.

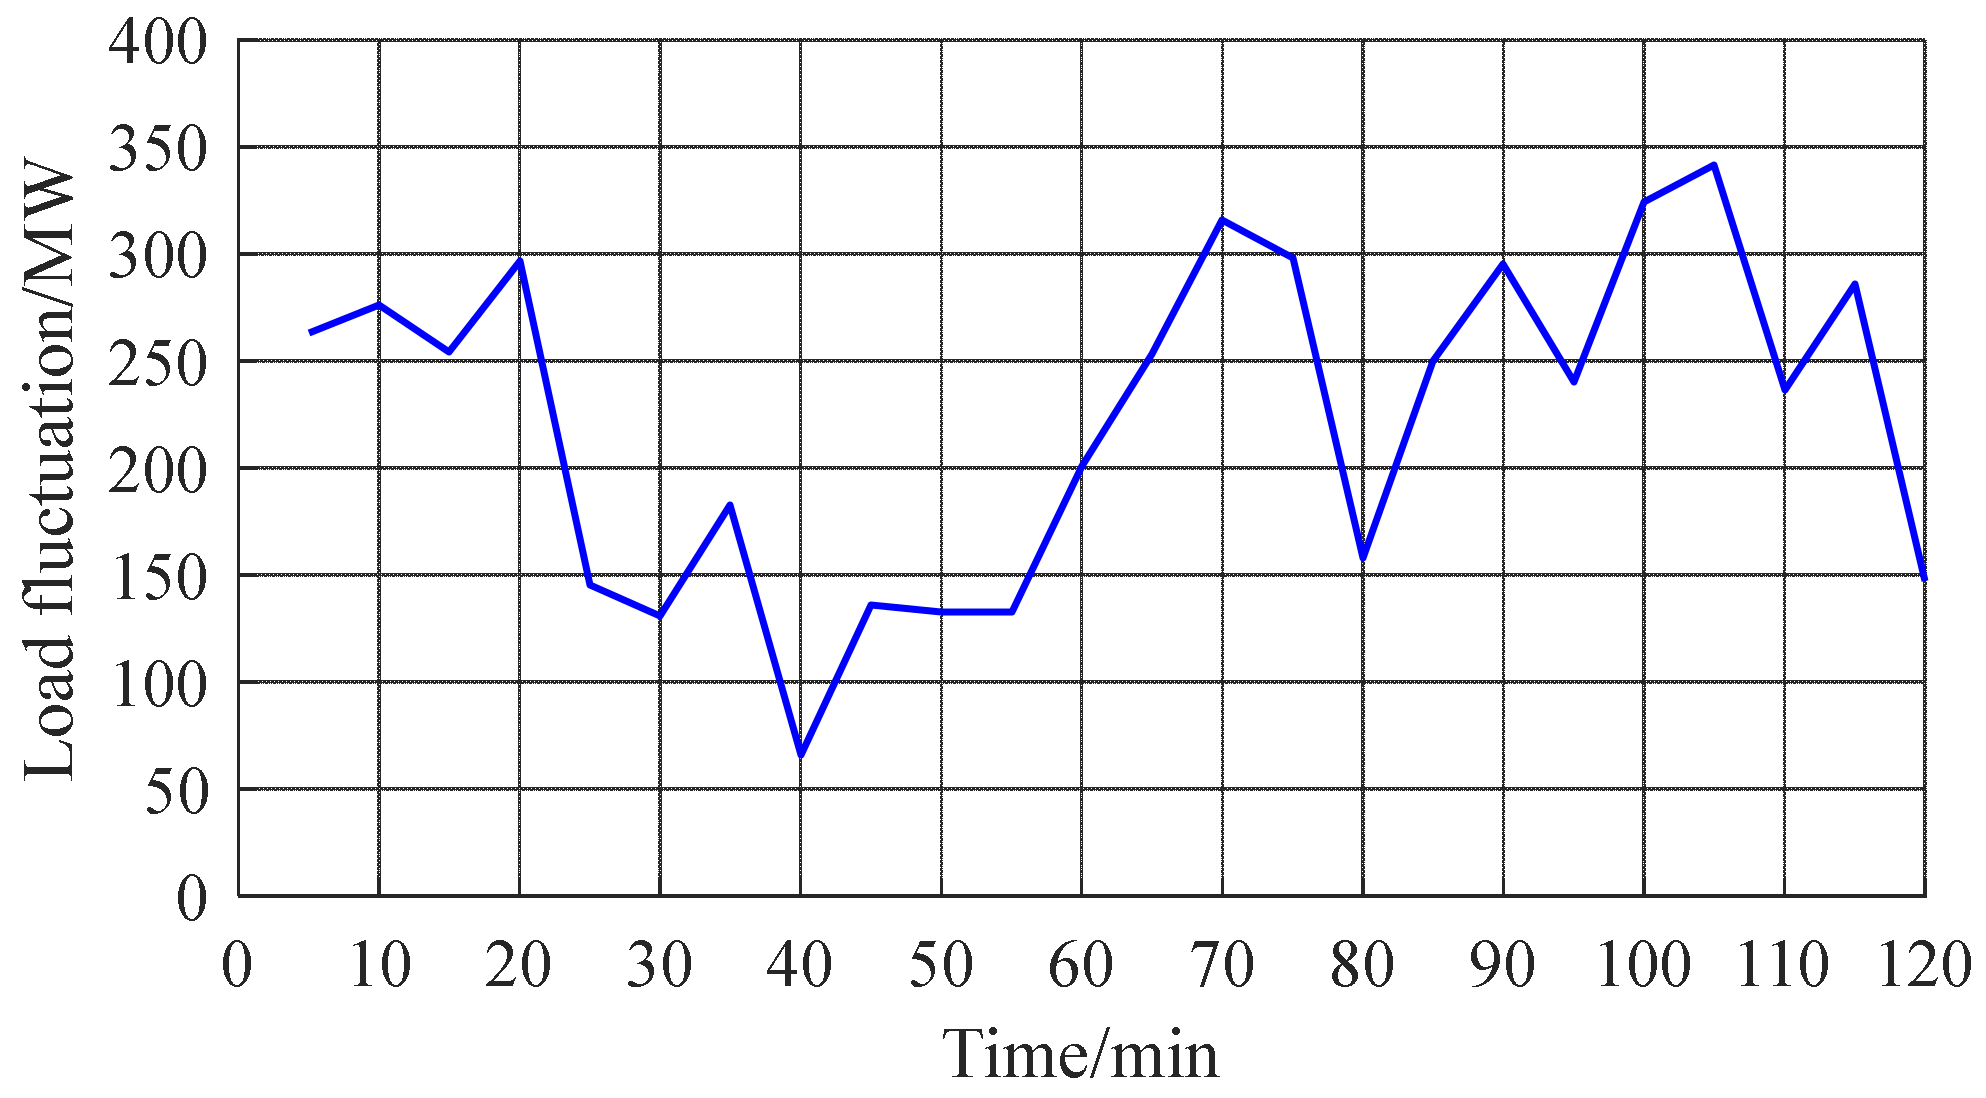
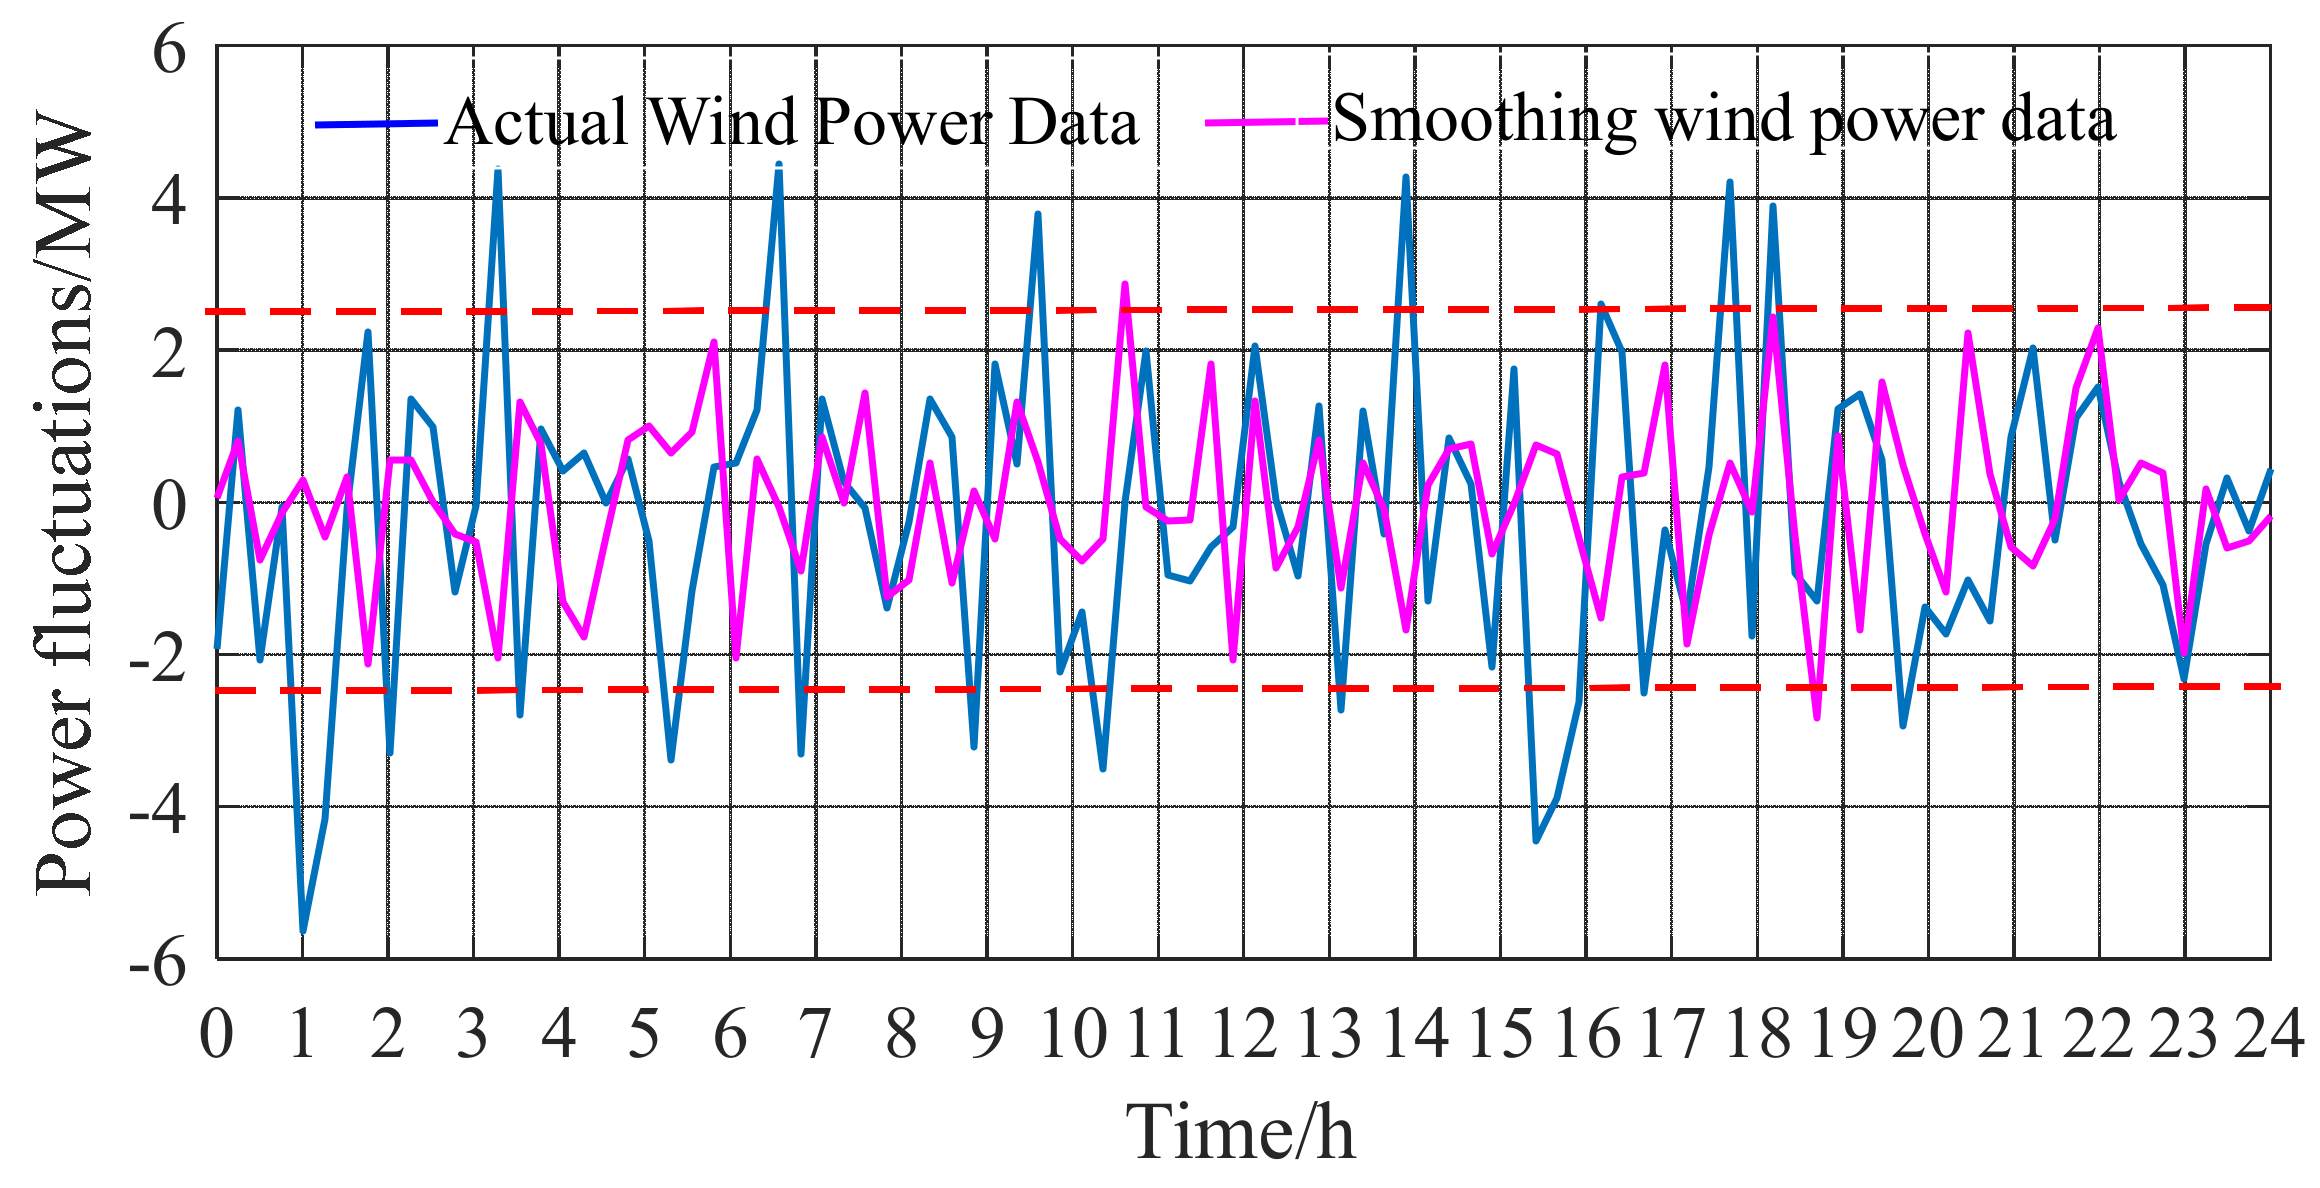
5.5. Smoothing Function of ES

To quantitatively indicate the ES smoothing effect on the wind farm output in the proposed DFIG and ES structure model, two evaluation indexes are defined. The smaller the two, the better the smoothing effect.
(1)
Sum of fluctuation over-limit amplitude ΔPk: the sum of the difference between the power fluctuation exceeding the target value at any two adjacent sampling moments in the operating period of T, which is expressed as
Δ P s = k = 1 T Δ t 1 Δ P k
In the equation: ΔPk is the over-limit power of the k-th climb.
(2)
Probability of fluctuation over-limit (r): the ratio of over-limit time to the total time in the operating period of T, which is written as
r = 1 T k = 0 T Δ t 1 Δ t
The combined output power fluctuation of the original wind power and DFIG and ES is shown in Figure 15. According to Equation (33), take ε = 2.4 MW/min. Figure 15 shows that the probability of fluctuation over-limit in original wind power is very high, and the maximum fluctuation reaches 5.8 MW/min. When the ES participates in the wind power smoothing, the over-limit probability significantly decreases, and the maximum fluctuation is reduced to 2.7 MW/min, a reduction of 36.2%. In the 24-h operating cycle, the ES charges and discharges 15 times, and the total charging-discharging capacity is 5.46 MW·h. The wind power smoothing effect is listed in Table 4.
The proposed strategy uses the embedded ES to stabilize wind power ramp events, thereby alleviating wind power fluctuations. Consequently, the wind power consumption and ES utilization are improved, and the ES achieves additional value.

6. Conclusions

Large-scale grid connection of wind power weakens the system inertia and brings challenges to the system frequency stability. This paper proposes an ES Configuration method of equivalent synchronous generator inertia. Furthermore, based on the proposed DFIG and ES structure model, the coordinated control strategy and an ES multi-functional control strategy are developed. The following conclusions are obtained through the simulation analysis.
(1)
An ES Configuration method is proposed, in which the ES inertia of ES is equal to an equal capacity synchronous generator. By configuration about 5% of the wind farm rated power for ES, the system inertia response ability can remain unchanged after the DFIGs are connected to the system for replacing the conventional generators. Through the DFIG and ES coordinated control strategy, the ES assists the DFIG speed recovery to avoid the secondary frequency drop and improve the frequency modulation stability of the DFIG and ES system at different wind speeds.
(2)
The component-level design option of the structural model is presented. The supercapacitor installation mode with a total of 10 groups of 5 in series and 2 in parallel is selected. It can meet the economic and safety requirements of the DFIG and ES system structure. An ES multi-functional strategy is proposed, which can smooth the ramp events, thereby improving the wind power consumption and ES utilization. Besides, the frequency modulation stability and anti-interference of the single DFIG are improved. This system structure has enormous application potential for future smart grids and microgrids.

Author Contributions

Conceptualization, C.C. and X.L.; methodology, C.C. and X.L.; software, C.C.; validation, C.C. and X.L.; formal analysis, C.C. and X.L.; investigation, C.C. and X.L.; resources, C.C. and X.L.; data curation, C.C.; writing—original draft preparation, C.C.; writing—review and editing, C.C.; visualization, X.L.; supervision, X.L.; project administration, X.L.; funding acquisition, X.L. Both authors have read and agreed to the published version of the manuscript.

Funding

This research received no external funding.

Institutional Review Board Statement

Not applicable.

Informed Consent Statement

Not applicable.

Data Availability Statement

Not applicable.

Conflicts of Interest

The authors declare no conflict of interest.

Appendix A

Table A1. The system transmission line parameters.
Transmission LineR/(Ω/km)X/(Ω/km)B/(10−6 S/km)Length/kmUN/kV
L10.0400.3213.5421.9330
L20.0130.1394.43279750
L30.0400.3213.04150330
L40.0460.3313.5010330
L50.0130.1394.43560750
Table A2. The equivalent generator parameters.
Generator NameXdX′dX″dXqX′qX″qXa
Northwest Generator1.6510.2320.1711.590.3320.1710.003
Jiuquan Generator1.8610.20.171.8140.3330.1670.002
Generator NameX1T′d0T″d0T′q0T″q0TJH
Northwest Generator0.1025.90.0330.9560.078106.5
Jiuquan Generator0.0730.470.0350.90.0686.5
Table A3. The DFIG parameters.
Generator NameRsLsRrLrLmTJ
Equivalent DFIG0.0690.0840.1260.1263.785.4
Table A4. The DFIG and ES power parameters.
Generator NameRated Power (MW)Maximum Output Power
Wind farm 1/ES12000/1001530/100
Wind farm 2/ES2400/20220/20

References

  1. Zhang, D.; Wu, Y.; Xiong, L.; Zhao, C. Analysis of inertia characteristics of direct-drive permanent-magnet synchronous generator in microgrid. Energies 2019, 12, 3141. [Google Scholar]
  2. Wu, Z.; Gao, W.; Gao, T.; Yan, W.; Zhang, H.; Yan, S.; Wang, X. State-of-the-art review on frequency response of wind power plants in power systems. J. Mod. Power Syst. Clean Energy 2018, 1, 1–16. [Google Scholar] [CrossRef] [Green Version]
  3. Wu, Y.K.; Chang, S.M.; Hu, Y.L.; Hsu, W.H.; Lan, B.R. Frequency regulation technologies from a single wind turbine or wind farm. In Proceedings of the IEEE International Conference on Applied System Innovation, Chiba, Japan, 13–17 April 2018; pp. 1240–1243. [Google Scholar]
  4. Van de Vyver, J.; De Kooning, J.D.; Meersman, B.; Vandevelde, L.; Vandoorn, T.L. Droop control as an alternative inertial response strategy for the synthetic inertia on wind turbines. IEEE Trans. Power Syst. 2016, 2, 1129–1138. [Google Scholar] [CrossRef]
  5. Ochoa, D.; Martinez, S. Fast-Frequency Response Provided by DFIG-Wind Turbines and its Impact on the Grid. IEEE Trans. Power Syst. 2017, 32, 4002–4011. [Google Scholar] [CrossRef]
  6. Phulpin, Y. Communication-free inertia and frequency control for wind generators connected by an HVDC-link. IEEE Trans. Power Syst. 2012, 2, 1136–1137. [Google Scholar] [CrossRef]
  7. Zhang, Z.; Sun, Y.; Lin, J.; Li, G. Coordinated frequency regulation by doubly fed induction generator-based wind power plants. IET Renew. Power Gener. 2012, 1, 38–47. [Google Scholar] [CrossRef]
  8. He, J.; Wu, K.; Huang, L.; Xin, H.; Lu, C.; Wang, H. A coordinated control scheme to realize frequency support of PMSG-based wind turbines in weak grid. In Proceedings of the 2018 IEEE Power & Energy Society General Meeting (PESGM), Portland, OR, USA, 5–10 August 2018; pp. 1–5. [Google Scholar]
  9. Wu, B.; Abuduwayiti, X.; Chen, Y.; Tian, Y. RoCoF Droop Control of PMSG-Based Wind Turbines for System Inertia Response Rapidly. IEEE Access 2020, 8, 181154–181162. [Google Scholar]
  10. Wu, Y.K.; Yang, W.H.; Hu, Y.L.; Dzung, P.Q. Frequency Regulation at a Wind Farm Using Time-Varying Inertia and Droop Controls. IEEE Trans. Ind. Appl. 2019, 55, 213–224. [Google Scholar] [CrossRef]
  11. Miao, L.; Wen, J.; Xie, H.; Yue, C.; Lee, W.J. Coordinated Control Strategy of Wind Turbine Generator and Energy Storage Equipment for Frequency Support. IEEE Trans. Ind. Appl. 2015, 4, 2732–2742. [Google Scholar] [CrossRef]
  12. Bhatt, P.; Roy, R.; Ghoshal, S.P. Dynamic active power support by doubly fed induction generator for frequency control. In Proceedings of the 2010 IEEE 11th International Conference on Probabilistic Methods Applied to Power Systems, Singapore, 14–17 June 2010. [Google Scholar]
  13. Yao, L.; Yang, B.; Cui, H.; Zhuang, J.; Ye, J.; Xue, J. Challenges and progresses of energy storage technology and its application in power systems. J. Mod. Power Syst. Clean Energy 2016, 4, 519–528. [Google Scholar] [CrossRef] [Green Version]
  14. Zhang, F.; Xu, Z.; Meng, K. Optimal sizing of substation scale energy storage station considering seasonal variations in wind energy. IET Gener. Transm. Distrib. 2016, 13, 3241–3250. [Google Scholar] [CrossRef]
  15. Ngamroo, I.; Karaipoom, T. Improving low-voltage ride-through performance and alleviating power fluctuation of DFIG wind turbine in dc microgrid by optimal SMES with fault current limiting function. IEEE Trans. Appl. Supercond. 2014, 24, 2333031. [Google Scholar] [CrossRef]
  16. Liu, Y.; Du, W.; Xiao, L.; Wang, H.; Bu, S. Sizing Energy Storage Based on a Life-Cycle Saving Dispatch Strategy to Support Frequency Stability of an Isolated System with Wind Farms. IEEE Access 2019, 2, 166329–166336. [Google Scholar] [CrossRef]
  17. Delille, G.; Francois, B.; Malarange, G. Dynamic frequency control support by energy storage to reduce the impact of wind and solar generation on isolated power system’s inertia. IEEE Trans. Sustain. Energy 2012, 4, 931–939. [Google Scholar] [CrossRef]
  18. Ye, H.; Tang, Y.; Liu, Y.; Li, Z.; Qi, Z. Transient frequency response model-based energy storage optimum size in power systems. In Proceedings of the 2017 IEEE International Conference on Energy Internet (ICEI), Beijing, China, 17–21 April 2017; pp. 65–71. [Google Scholar]
  19. Knap, V.; Chaudhary, S.K.; Stroe, D.I.; Swierczynski, M.; Craciun, B.I.; Teodorescu, R. Sizing of an energy storage system for grid inertial response and primary frequency reserve. IEEE Trans. Power Syst. 2016, 5, 3447–3456. [Google Scholar] [CrossRef] [Green Version]
  20. Yue, M.; Wang, X. Grid inertial response-based probabilistic determination of energy storage system capacity under high solar penetration. IEEE Trans. Sustain. Energy 2015, 3, 1039–1049. [Google Scholar] [CrossRef]
  21. Masuta, T.; Yokoyama, A. Supplementary load frequency control by use of a number of both electric vehicles and heat pump water heaters. IEEE Trans. Smart Grid 2012, 3, 1253–1262. [Google Scholar] [CrossRef]
  22. Ullah, R.N.; Thiringer, T.; Karlsson, D. Temporary primary frequency control support by variable speed wind turbines potential and applications. IEEE Trans Power Syst. 2008, 2, 601–612. [Google Scholar] [CrossRef]
  23. Kang, M.; Kim, K.; Muljadi, E.; Park, J.W.; Kang, Y.C. Frequency control support of a doubly-fed induction generator based on the torque limit. IEEE Trans. Power Syst. 2016, 6, 4574–4583. [Google Scholar] [CrossRef]
  24. Chang-Chien, L.R.; Yin, Y.C. Strategies for operating wind power in a similar manner of conventional power plant. IEEE Trans. Power Syst. 2009, 4, 926–933. [Google Scholar] [CrossRef]
  25. Han, X.; Chen, Y.; Wu, Z. Research on frequency regulation of power system containing wind farm. In Proceedings of the IEEE International Conference on Probabilistic Methods Applied to Power Systems (PMAPS), Taiyuan, China, 14–17 June 2010; pp. 14–17. [Google Scholar]
  26. Wu, Z.; Gao, W.; Wang, J.; Gu, S. A coordinated primary frequency regulation from permanent magnet synchronous wind turbine generation. In Proceedings of the 2012 IEEE in Power Electronics and Machines in Wind Applications (PEMWA), Denver, CO, USA, 16–18 July 2012; pp. 1–6. [Google Scholar]
  27. Yang, D.; Kim, J.; Kang, Y.C.; Muljadi, E.; Zhang, N.; Hong, J.; Song, S.H.; Zheng, T. Temporary Frequency Support of a DFIG for High Wind Power Penetration. IEEE Trans. Power Syst. 2018, 3, 3428–3437. [Google Scholar] [CrossRef]
  28. Kundur, P. Power System Stability and Control; McGraw-Hill Professional: New York, NY, USA, 1994; pp. 128–136. [Google Scholar]
  29. Australian Energy Market Operator. Black System South Australia 28 September 2016: Final Report. 28 March 2017. Available online: https://apo.org.au/node/74886 (accessed on 10 August 2021).
  30. Erinmez, I.A.; Bickers, D.O.; Wood, G.F.; Hung, W.W. NGC experience with frequency control in England and Wales-provision of frequency response by generators. In Proceedings of the IEEE Power Engineering Society 1999 Winter Meeting, New York, NY, USA, 31 January–4 February 1999; pp. 590–596. [Google Scholar]
  31. De Leon, C.P.; Frías-Ferrer, A.; González-García, J.; Szánto, D.A.; Walsh, F.C. Redox flow cells f or energy conversion. J. Power Sources 2006, 1, 716–732. [Google Scholar] [CrossRef] [Green Version]
  32. Datta, U.; Kalam, A.; Shi, J. Battery Energy Storage System Control for Mitigating PV Penetration Impact on Primary Frequency Control and State-of-Charge Recovery. IEEE Trans. Sustain. Energy 2020, 2, 746–757. [Google Scholar] [CrossRef] [Green Version]
  33. Banakar, H.; Luo, C.; Ooi, B.T. Impacts of wind power minute-to-minute variations on power system operation. IEEE Trans. Power Syst. 2008, 1, 150–160. [Google Scholar] [CrossRef]
  34. Ferreira, C.; Gama, J.; Matias, L.; Botterud, A.; Wang, J. A Survey on Wind Power Ramp Forecasting; Argonne National Laboratory (ANL): Argonne, IL, USA, 2011. [Google Scholar]
  35. Jiang, Q.; Wang, H. Two-time-scale coordination control for a battery energy storage system to mitigate wind power fluctuations. IEEE Trans Energy Convers. 2013, 1, 52–61. [Google Scholar] [CrossRef]
Figure 1. The control principle of DFIG participating in system frequency modulation.
Energies 14 05354 g001
Figure 2. Frequency characteristic curve.
Energies 14 05354 g002
Figure 3. The power change curve during the frequency modulation.
Energies 14 05354 g003
Figure 5. The frequency modulation control framework of the DFIG and ES system.
Energies 14 05354 g005
Figure 6. The DFIG and ES system structure.
Energies 14 05354 g006
Figure 7. The super capacitor charging–discharging principle (a) Charging schematic diagram, (b) Discharge schematic diagram.
Energies 14 05354 g007
Figure 8. The ES multi-functional control strategy.
Energies 14 05354 g008
Figure 9. An equivalent power grid in Northwest China.
Energies 14 05354 g009
Figure 10. The simulation result of DFIG operating at the medium wind speed. (a) System frequency. (b) DFIG output power. (c) Local generator output power. (d) Regional generator output power. (e) ES output power.
Energies 14 05354 g010aEnergies 14 05354 g010b
Figure 11. The simulation result of DFIG operating at a low wind speed. (a) System frequency. (b) DFIG output power. (c) Local generator output power. (d) Regional generator output power. (e) ES output power.
Energies 14 05354 g011
Figure 12. The continuous load disturbance curve.
Energies 14 05354 g012
Figure 13. The frequency deviation curve of DFIG and ES not participating in frequency modulation.
Energies 14 05354 g013
Figure 14. The frequency deviation curve under two control strategies.
Energies 14 05354 g014
Figure 15. The combined output power fluctuation of the original wind power and DFIG and ES.
Energies 14 05354 g015
Table 1. The performance and economic benefits of various chemical ES technologies.
ES TypeηDOD × NC (RMB/kWh)Maintenance Cost (RMB/kWh)r
Lead-acid batteries70~751 × 80010.05−54
Lithium-Ion battery90~951 × 10004.50.05−86
Full flow battery70~801 × 13,0005~100.1−30~26
Super capacitor80~951 × 200,000270.05247
Table 2. The operating voltage and efficiency under different combinations.
Group Numbers
in Series
Group Numbers
in Parallel
Umin/VUmax/VDischarge
Efficiency (%)
623086497.7
523272096.9
423657695.7
Table 3. The frequency modulation effect under different control strategies.
Control StrategyNon-Frequency Modulation DFIG and ESFrequency Modulation DFIG and ESConventional Generator
Maximum deviation/Hz−0.0998−0.0133−0.0187
Mean deviation/Hz−0.0678−0.0066−0.0119
Improvement (%)/86.6781.25
Table 4. The smoothing effect of wind power fluctuations.
Operation ModeΔPSR (%)
ES smoothing0.163.77
Original wind power0.5925.16
Publisher’s Note: MDPI stays neutral with regard to jurisdictional claims in published maps and institutional affiliations.

