Article

Experimental Study on the Initiation and Propagation of Multi-Cluster Hydraulic Fractures within One Stage in Horizontal Wells

1
State Key Laboratory of Geomechanics and Geotechnical Engineering, Institute of Rock and Soil Mechanics, Chinese Academy of Sciences, Wuhan 430071, China
2
State Key Laboratory for Coal Mine Disaster Dynamics and Control, Chongqing University, Chongqing 400044, China
3
Research Institute, China National Offshore Oil Corporation, Beijing 100028, China
*
Author to whom correspondence should be addressed.
Energies 2021, 14(17), 5357; https://doi.org/10.3390/en14175357
Submission received: 27 July 2021 / Revised: 23 August 2021 / Accepted: 23 August 2021 / Published: 28 August 2021
(This article belongs to the Topic Enhanced Oil Recovery Technologies)

Abstract

:
Competitive propagation of fractures initiated from multiple perforation clusters is universal in hydraulic fracturing of unconventional reservoirs, which largely influences stimulation. However, the propagation mechanism of multi-fractures has not been fully revealed for the lack of a targeted laboratory observation. In this study, a physical simulation experiment system was developed for investigating the initiation and propagation of multi-cluster hydraulic fractures. Different from the traditional hydro-fracking test system, the new one was equipped with a multi-channel shunting module and a strain monitoring system, which could guarantee the full fracture extension at each perforation clusters and measure the internal deformation of specimens, respectively. Several groups of true tri-axial fracturing tests were performed, considering the factors of in situ stress, cluster spacing, pumping rate, and bedding structures. The results showed that initiation of multi-cluster hydraulic fractures within one stage could be simultaneous or successive according to the difference of the breakdown pressure and fracturing fluid injection. For simultaneous initiation, the breakdown pressure of the subsequent fracture was lower than or equal to the value of the previous fracture. Multiple fractures tended to attract and merge. For successive initiation, the breakdown pressures of fractures were gradually increasing. The subsequent fracture tended to intersect with or deviated from the previous fracture. Multiple fractures interaction was aggravated by the decrease of horizontal stress difference, bedding number and cluster spacing, and weakened by the increase of pump rate. The propagation area of multiple fractures increased with the pump rate, decreased with the cluster spacing. The strain response characteristics corresponded with the initiation and propagation of fracture, which was conducive to understanding the process of the fracturing. The test results provide a basis for optimum design of hydraulic fracturing.

1. Introduction

Owing to the low porosity and permeability of shale gas reservoirs, hydraulic fracturing is regarded as a prominent technology for industrial gas production [1]. It has been proven by practice that multi-cluster fracturing of horizontal wells is the key technology for the successful development of shale gas reservoirs [2,3]. In the multi-cluster fracturing of a horizontal well, the fracturing fluid is pumped into the horizontal wellbore at high speed. Then, the fracturing fluid is sequentially injected into different stages to simultaneously activate multiple perforation clusters within one stage, thereby forming several closely spaced hydraulic fractures to maximize reservoir stimulation [4,5].
Multi-cluster fracturing of horizontal wells can significantly reduce operational costs. However, the performance of treatment wells often falls short of expectations. For instance, the production logs show that one-third of the perforation clusters in some basins contribute two-thirds of the production, while almost one-third of the clusters in all basins do not contribute to the production [6]. Other scholars [7,8,9,10] have reached similar conclusions.
The non-uniform propagation of multiple fractures restricts the stimulation effect of multi-cluster fracturing in horizontal wells. Reservoir physical heterogeneity and mutual stress interference between fractures (stress shadow) affect the process of multi-fracture propagation, but the physical mechanism of the occurrence of heterogeneous propagation phenomenon is not clear [11]. Therefore, it is vital to study the initiation and propagation of multiple clusters of hydraulic fractures in horizontal wells to understand the non-uniform propagation mechanism of multiple fractures.
Several numerical simulations were performed for the propagation of multiple clusters of fractures. Multiple fracture behaviors were used in an analytical Perkins–Kern–Nordgren model and coupled the fracture behaviors using a set of constraints describing the conservation of volume and continuity of pressure [12]. The displacement discontinuity method was used to completely couple the fracture deformation and injected fluid pressure under the condition of mass conservation and simulate multiple fracture propagation [13]. A 2D multi-fracture propagation model based on the displacement discontinuity method, which considered the effects of the stress shadow effect, wellbore friction, perforation friction, fracture friction, and fracturing fluid leakage [14]. The new fracture propagation model [15] based on the single non-plane fracture model of Olson and Wu [16] and the pseudo-three-dimensional displacement discontinuity method modified by Olson [17]. Cluster spacing and net pressure are two key factors for effective multi-cluster fracturing [18]. The propagation path of two-cluster fractures was performed, considering the factors of three-dimensional stress anisotropy, well deviation, and stress heterogeneity through a fully hydrodynamic coupling model [19]. Using Xsite software, a fracture propagation model based on the lattice method and studied the effects of stress anisotropy, cluster spacing, and natural fractures on the propagation of multi-cluster hydraulic fractures [20,21]. Based on a coupled thermo-hydro-mechanical model, multiple fractures geometries were investigated considering fracture spacing, perforation parameter, and thermal stress [22].
The conclusions of numerical simulations based on idealized assumptions should be verified by indoor experiments. However, owing to the limitations of the laboratory size effect, test equipment, and monitoring means, few laboratory experiments have been conducted on the initiation and propagation of multiple hydraulic fractures.
EI Rabaa [23] studied the phenomenon of non-uniform propagation of multiple hydraulic fractures via laboratory tests and found that only one fracture could be generated in a perforated section less than four times the outer diameter of the well. A concrete sample was fractured using two pumping systems to obtain two evenly and synchronously propagating fractures [24]. After improving the pumping system, multiple 300 mm × 600 mm × 300 mm shale samples were fractured to observe a single fracture could initiate and propagate in majority of cases [25]. Moreover, the stress shadow effect could not only inhibit the propagation of adjacent fractures but also lead to the bifurcation of adjacent fractures. The effect of pore pressure distribution on multiple fractures propagation was observed via experimental research and numerical simulations [26]. A new experimental method was performed to simulate the simultaneous and sequential propagation of multiple tightly spaced fractures [27]. The initiation and propagation of multiple fractures was studied by cyclic pumping [28]. The results show by cyclic pumping more perforation clusters produce fractures and form complex fracture network when compared with the single injection method. The cyclic pumping method is worth investigating in the initiation and propagation of multiple fractures. Other researchers [29,30,31] have also carried out experimental studies.
Presently, the difficulty in realizing indoor multi-cluster fracturing experiments is that the initiation of each simulated perforation cluster is random. If one or more perforation clusters initiate and propagate, the remaining perforation clusters will no longer initiate and expand. Therefore, it is impossible to simulate the relative balance of the initiation and propagation of each cluster of hydraulic fractures to effectively study the mutual interference mechanism during the propagation of multiple clusters of fractures.
In this study, we developed a physical simulation experimental system for the initiation and propagation of multi-cluster hydraulic fractures to solve the abovementioned problem. Additionally, the detailed technological principles of this system and the main performance parameters were also introduced. Several multi-cluster fracturing experiments were conducted using this system. This experimental study consists of three clusters of hydraulic fractures in a fractured stage, and additional cluster number simulations will be realized by improving the experimental method. Furthermore, the initiation and propagation characteristics of multiple clusters of hydraulic fractures, acoustic emission energy behavior, and strain response characteristics were compared and analyzed. The research accomplishments provided some understanding and guidance for research on multi-cluster hydraulic fracturing.

2. Experimental Apparatus and Scheme

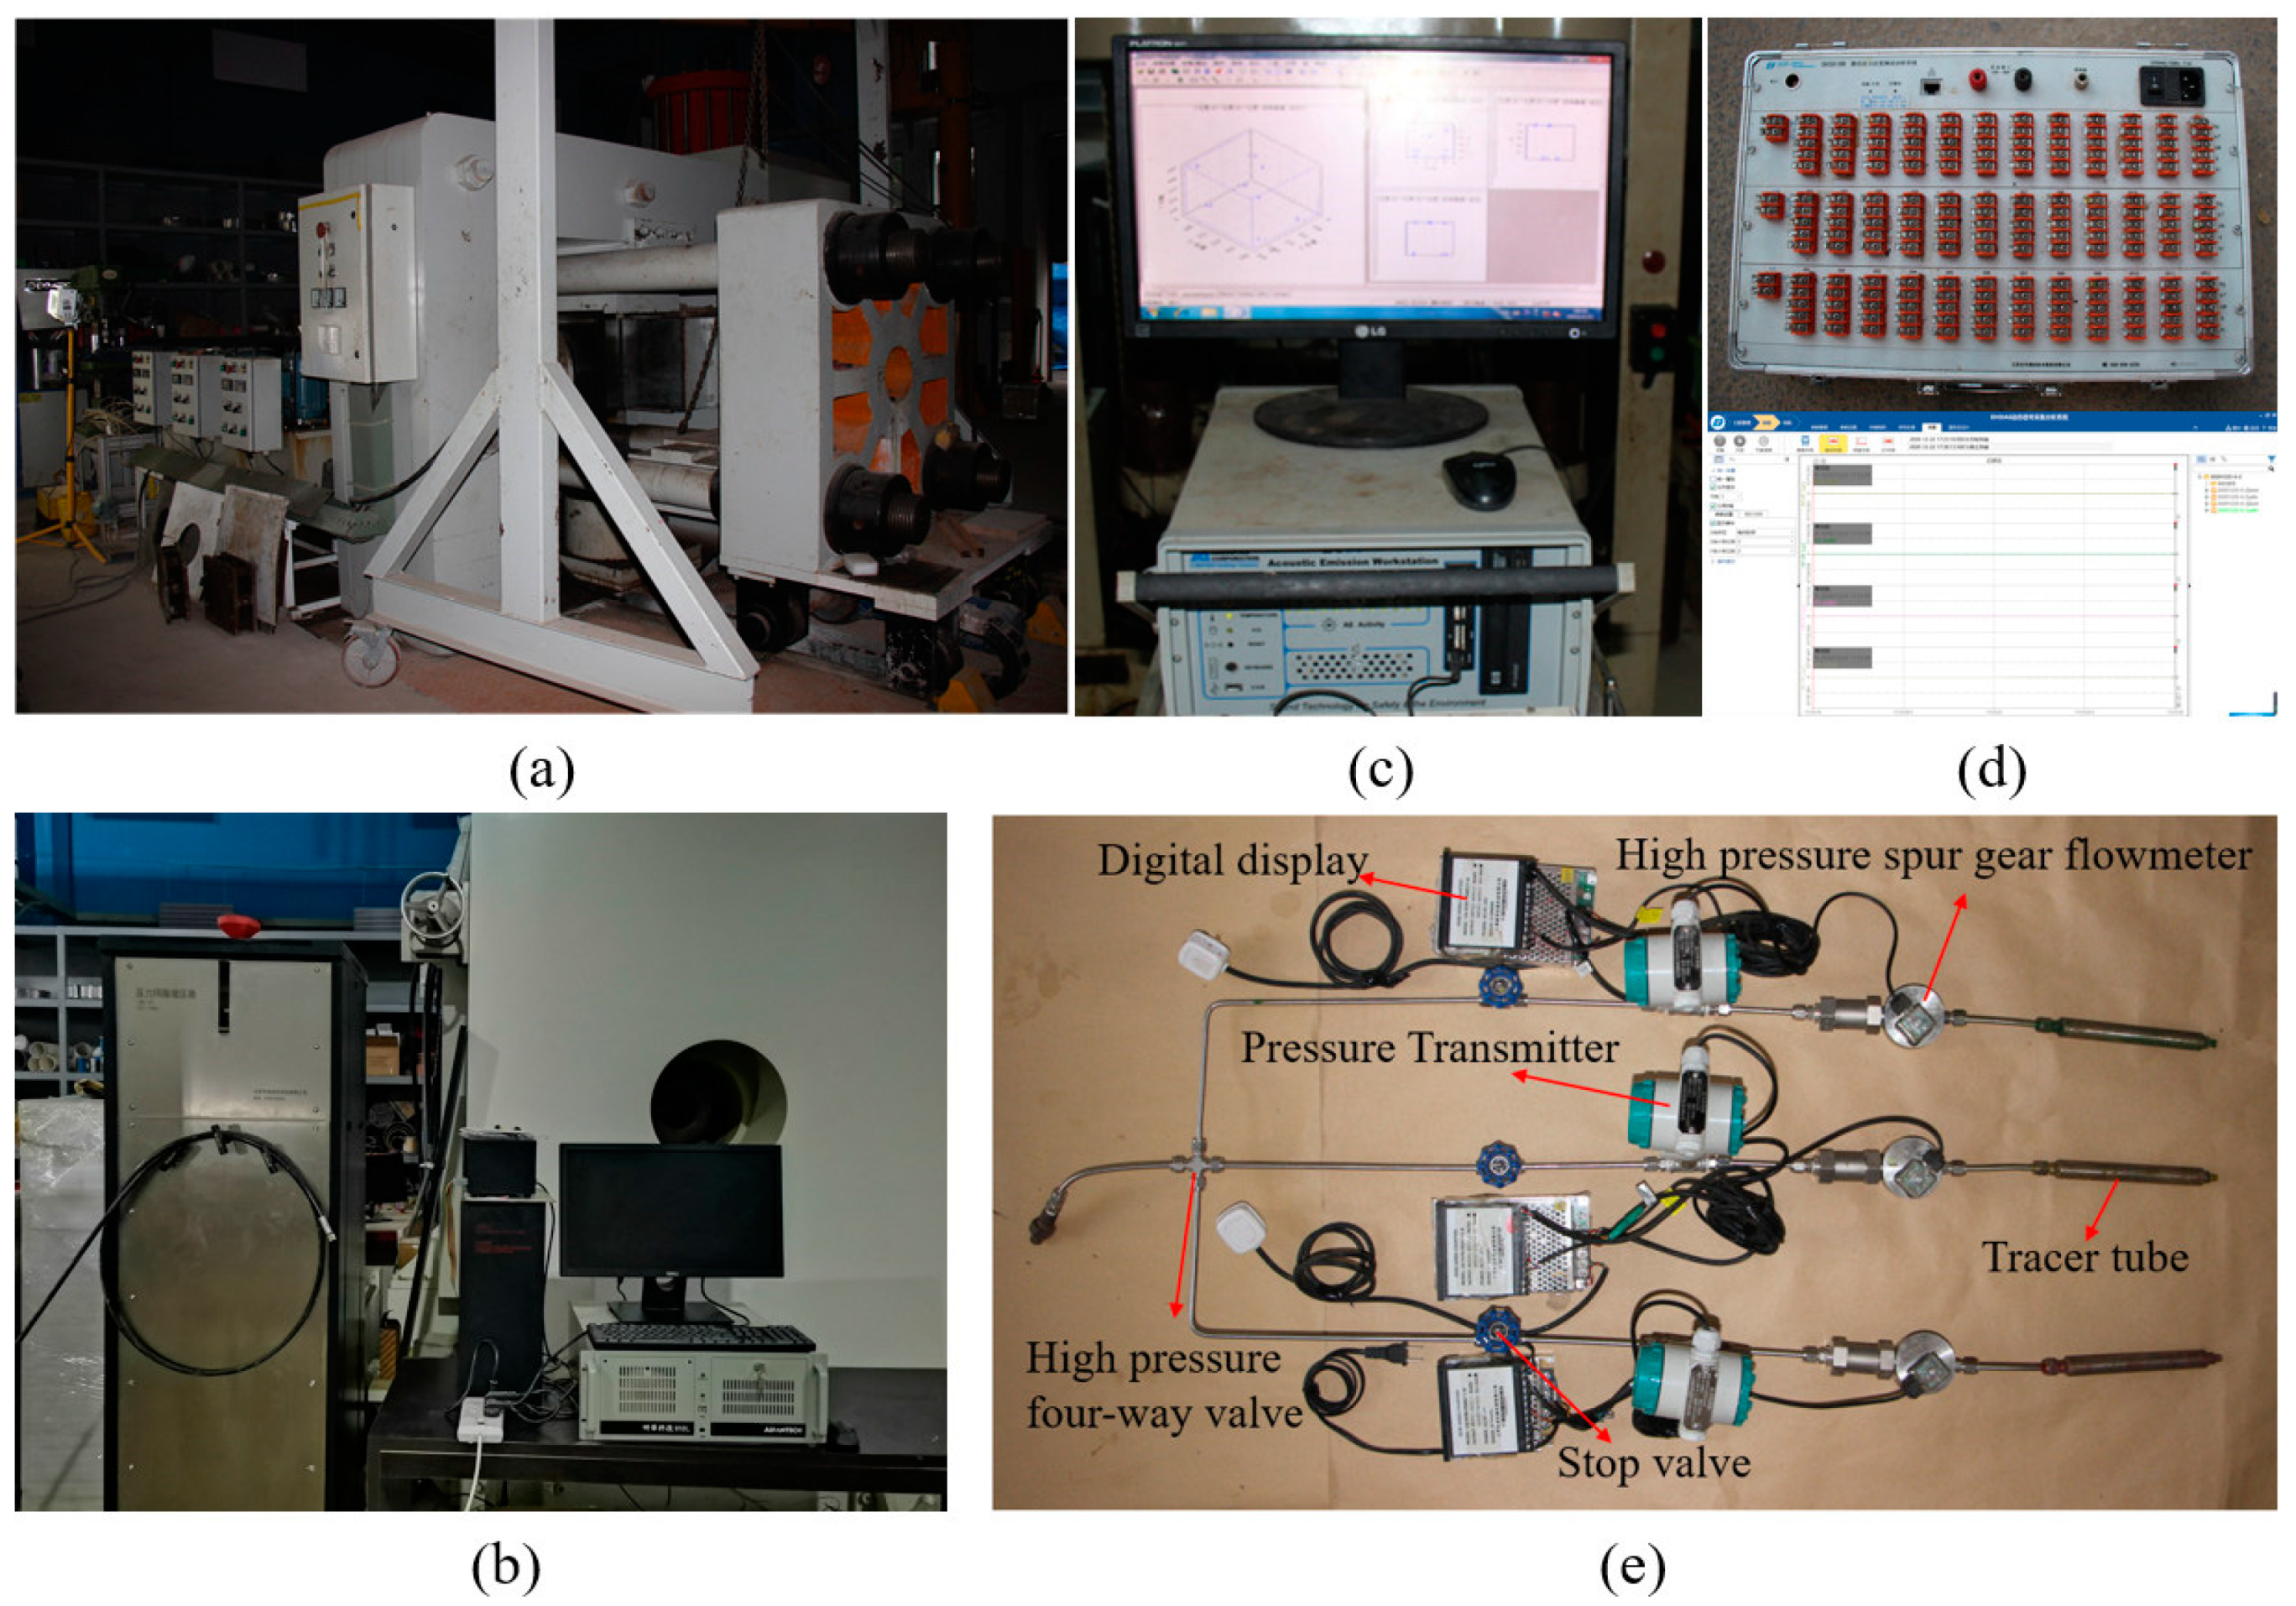
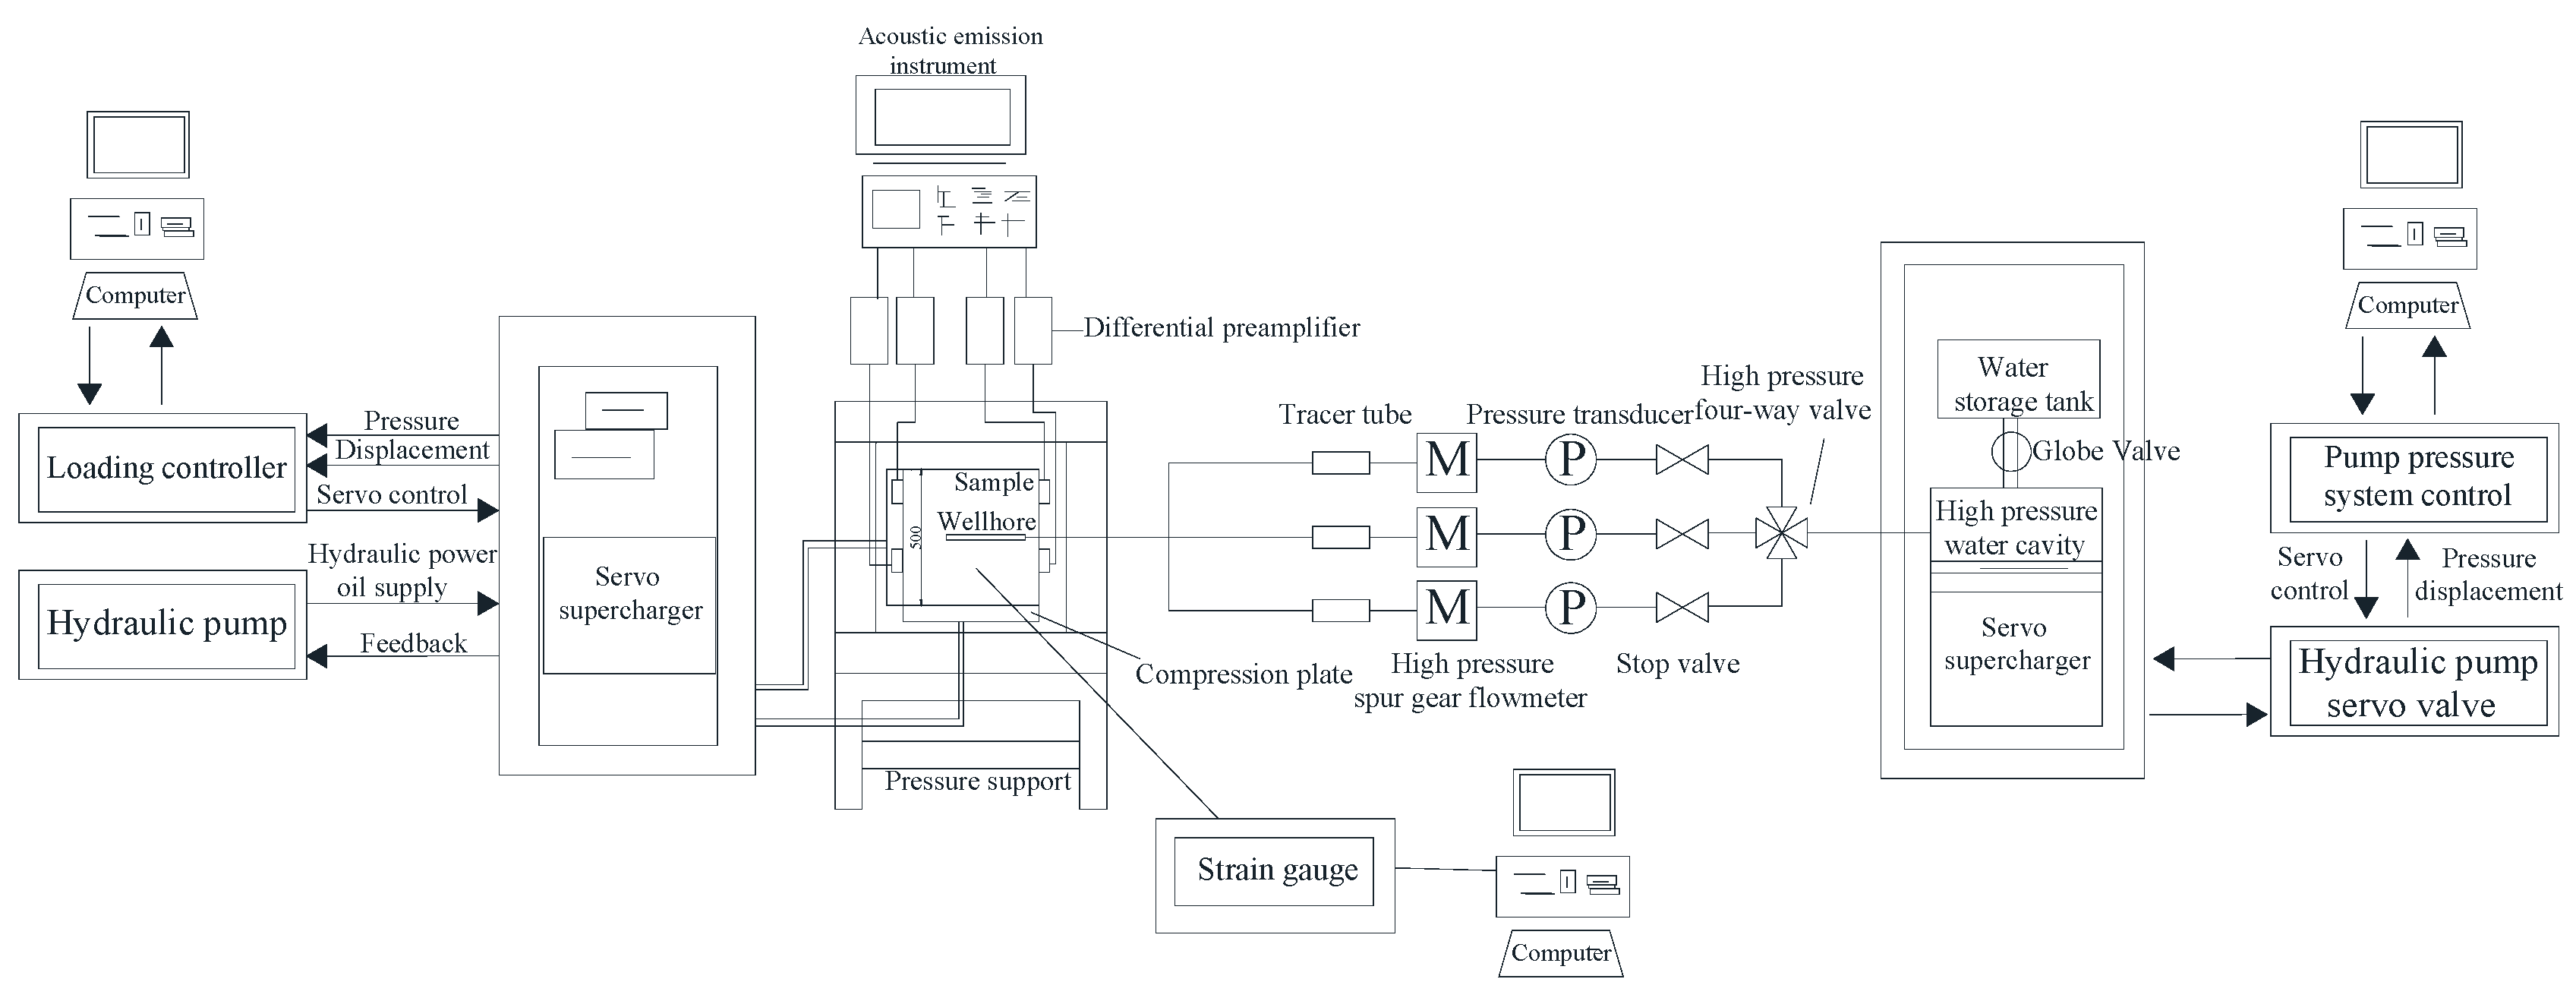
2.1. Experimental Apparatus

The experimental system for multi-cluster hydraulic fracturing is composed of five parts: a large-scale true triaxial testing machine, a hydraulic fracturing pumping system, an acoustic emission test system, a strain monitoring system, and a multi-channel shunting system (Figure 1). The functions and parameters of each part are described in the following sections [32].

2.1.1. Large-Scale True Triaxial Testing Machine

As shown in Figure 2a, the large-scale true triaxial testing machine can provide compressive stresses from three mutually perpendicular directions independently to simulate the real in situ stress of the formation. It is electro-hydraulic servo controlled with a maximum load of 8000 kN in each direction. The maximum allowable dimensions of the cubic sample are 500 mm × 500 mm × 500 mm.

2.1.2. Hydraulic Fracturing Pumping System

Figure 2b shows the hydraulic fracturing servo-pumping system. The pump rate during the test can be accurately controlled with a precision of 0.08 mm. Equipped with a booster piston, the maximum output pressure can reach 140 MPa with a resolution of 0.05 MPa. The maximum volume during a single pumping period is 800 mL. To improve the system response and stability, accumulators are installed on the oil inlet and outlet.

2.1.3. Acoustic Emission Test System

The 16-channel acoustic emission test system (Figure 2c) was developed by the American Physical Acoustics Company. It is widely used to monitor the fracture behavior in rock mass, metals, aerospace materials, pressure vessels, etc.
In the experiment, two acoustic emission probes were placed asymmetrically on the four selected surfaces of a sample, and the corresponding differential preamplifiers were added to monitor the information of internal crack initiation and expansion of the sample effectively.

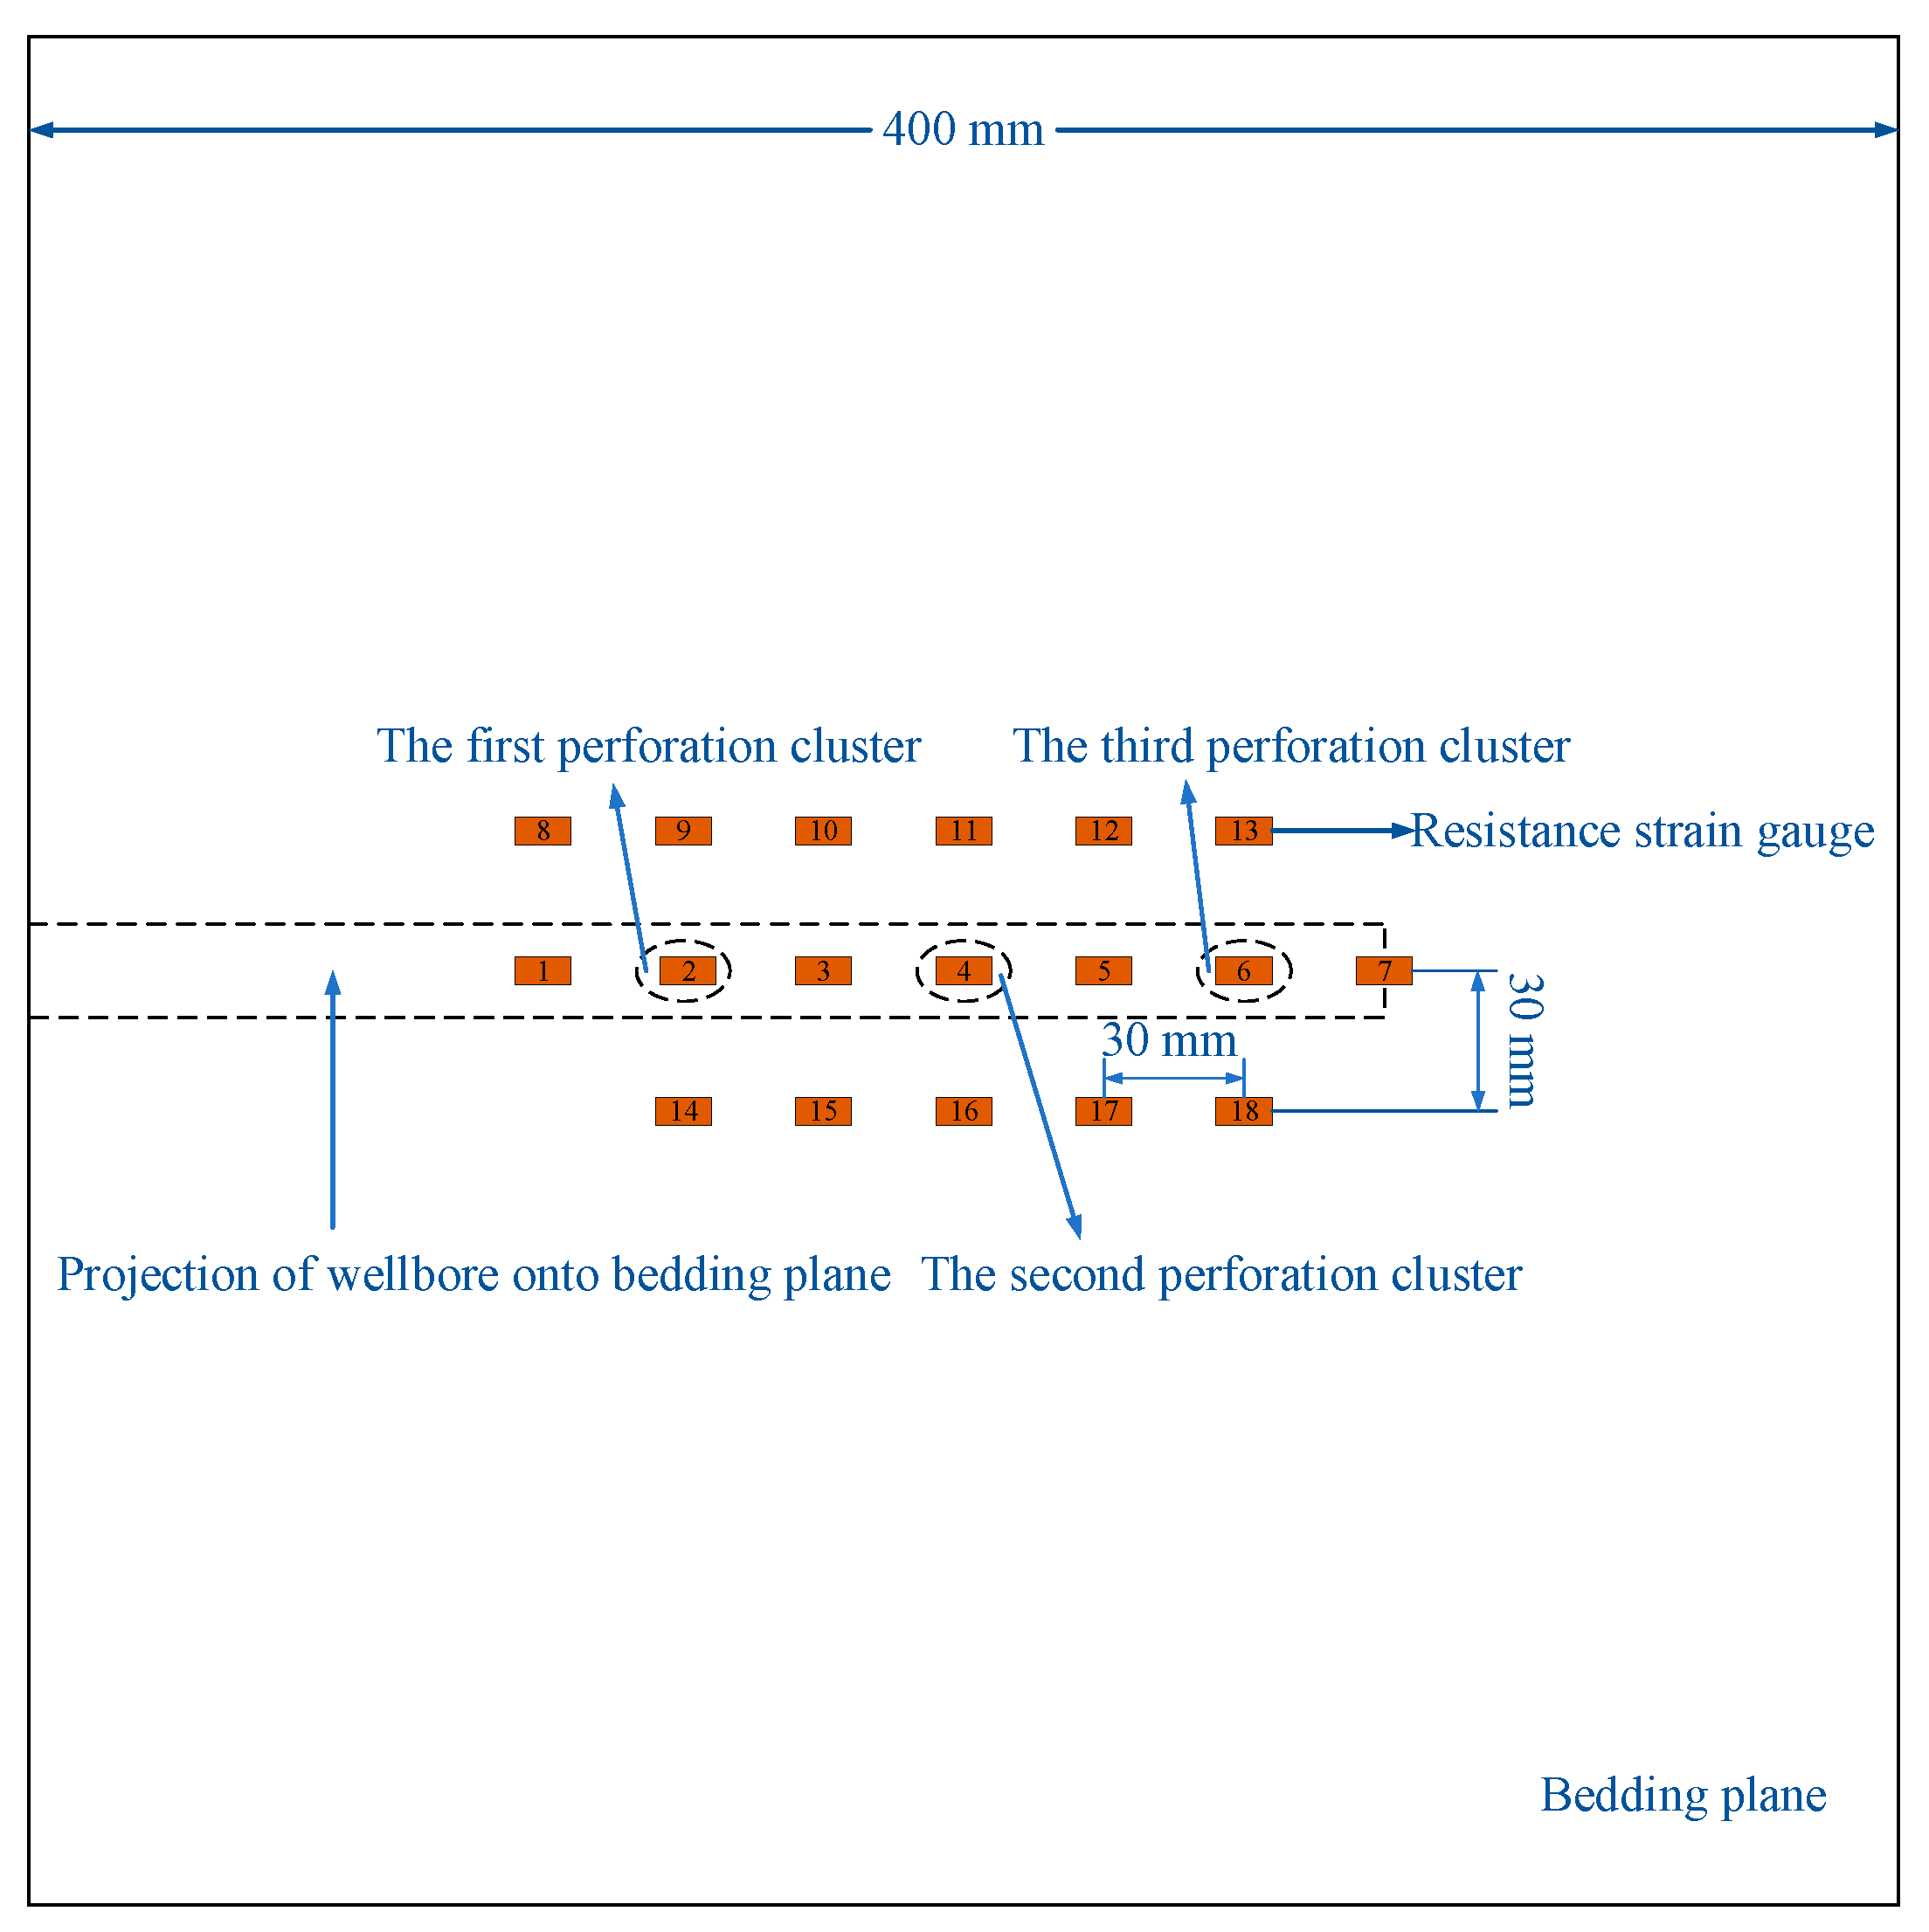
2.1.4. Strain Monitoring System

The strain monitoring system (Figure 2d) can record the deformation response of the rock mass to fracture propagation during the hydraulic fracturing. The system allows up to 36 channels to operate simultaneously. The measurement range of the strain monitoring system ±60,000 με is with a resolution of 0.1 με.

2.1.5. Multi-Channel Shunting System

A multi-channel shunting system was used to realize the simultaneous liquid intake and crack initiation and extension at each cluster. The flow and pressure data of each independent channel could be monitored and recorded in real time.
The system consists of a high-pressure four-way valve, three stop valves, three pressure transmitters, three high-pressure spur gear flowmeters, and three tracer tubes (Figure 2e).
One end of the high-pressure four-way valve is connected to the hydraulic fracturing servo pumping system, whereas the other three deliver the fracturing fluid to three independent channels. Each individual channel is equipped with a stop valve to control the fracturing fluid input. The pressure transmitters with a measuring range of −0.1~100 MPa were used to record the fluid pressure. High-pressure spur gear flowmeters are used to measure the instantaneous flow and accumulated volume of the liquid in each channel. The maximum pressure resistance is 60 MPa, and the flow measurement range is 0.004~2 L/min with a precision of 0.5%. Fracturing fluid mixed with tracers of different colors is pre-filled in the tracer tubes to distinguish the spreading range of each cluster of fractures.
Owing to the configuration of the stop valve in each channel, the system can not only simulate the simultaneous initiation and propagation of multiple clusters of fractures, but also selectively close certain channels (fractures are completely initiated and propagated) to simulate the process of temporary plugging and re-fracturing after the initial fracturing.

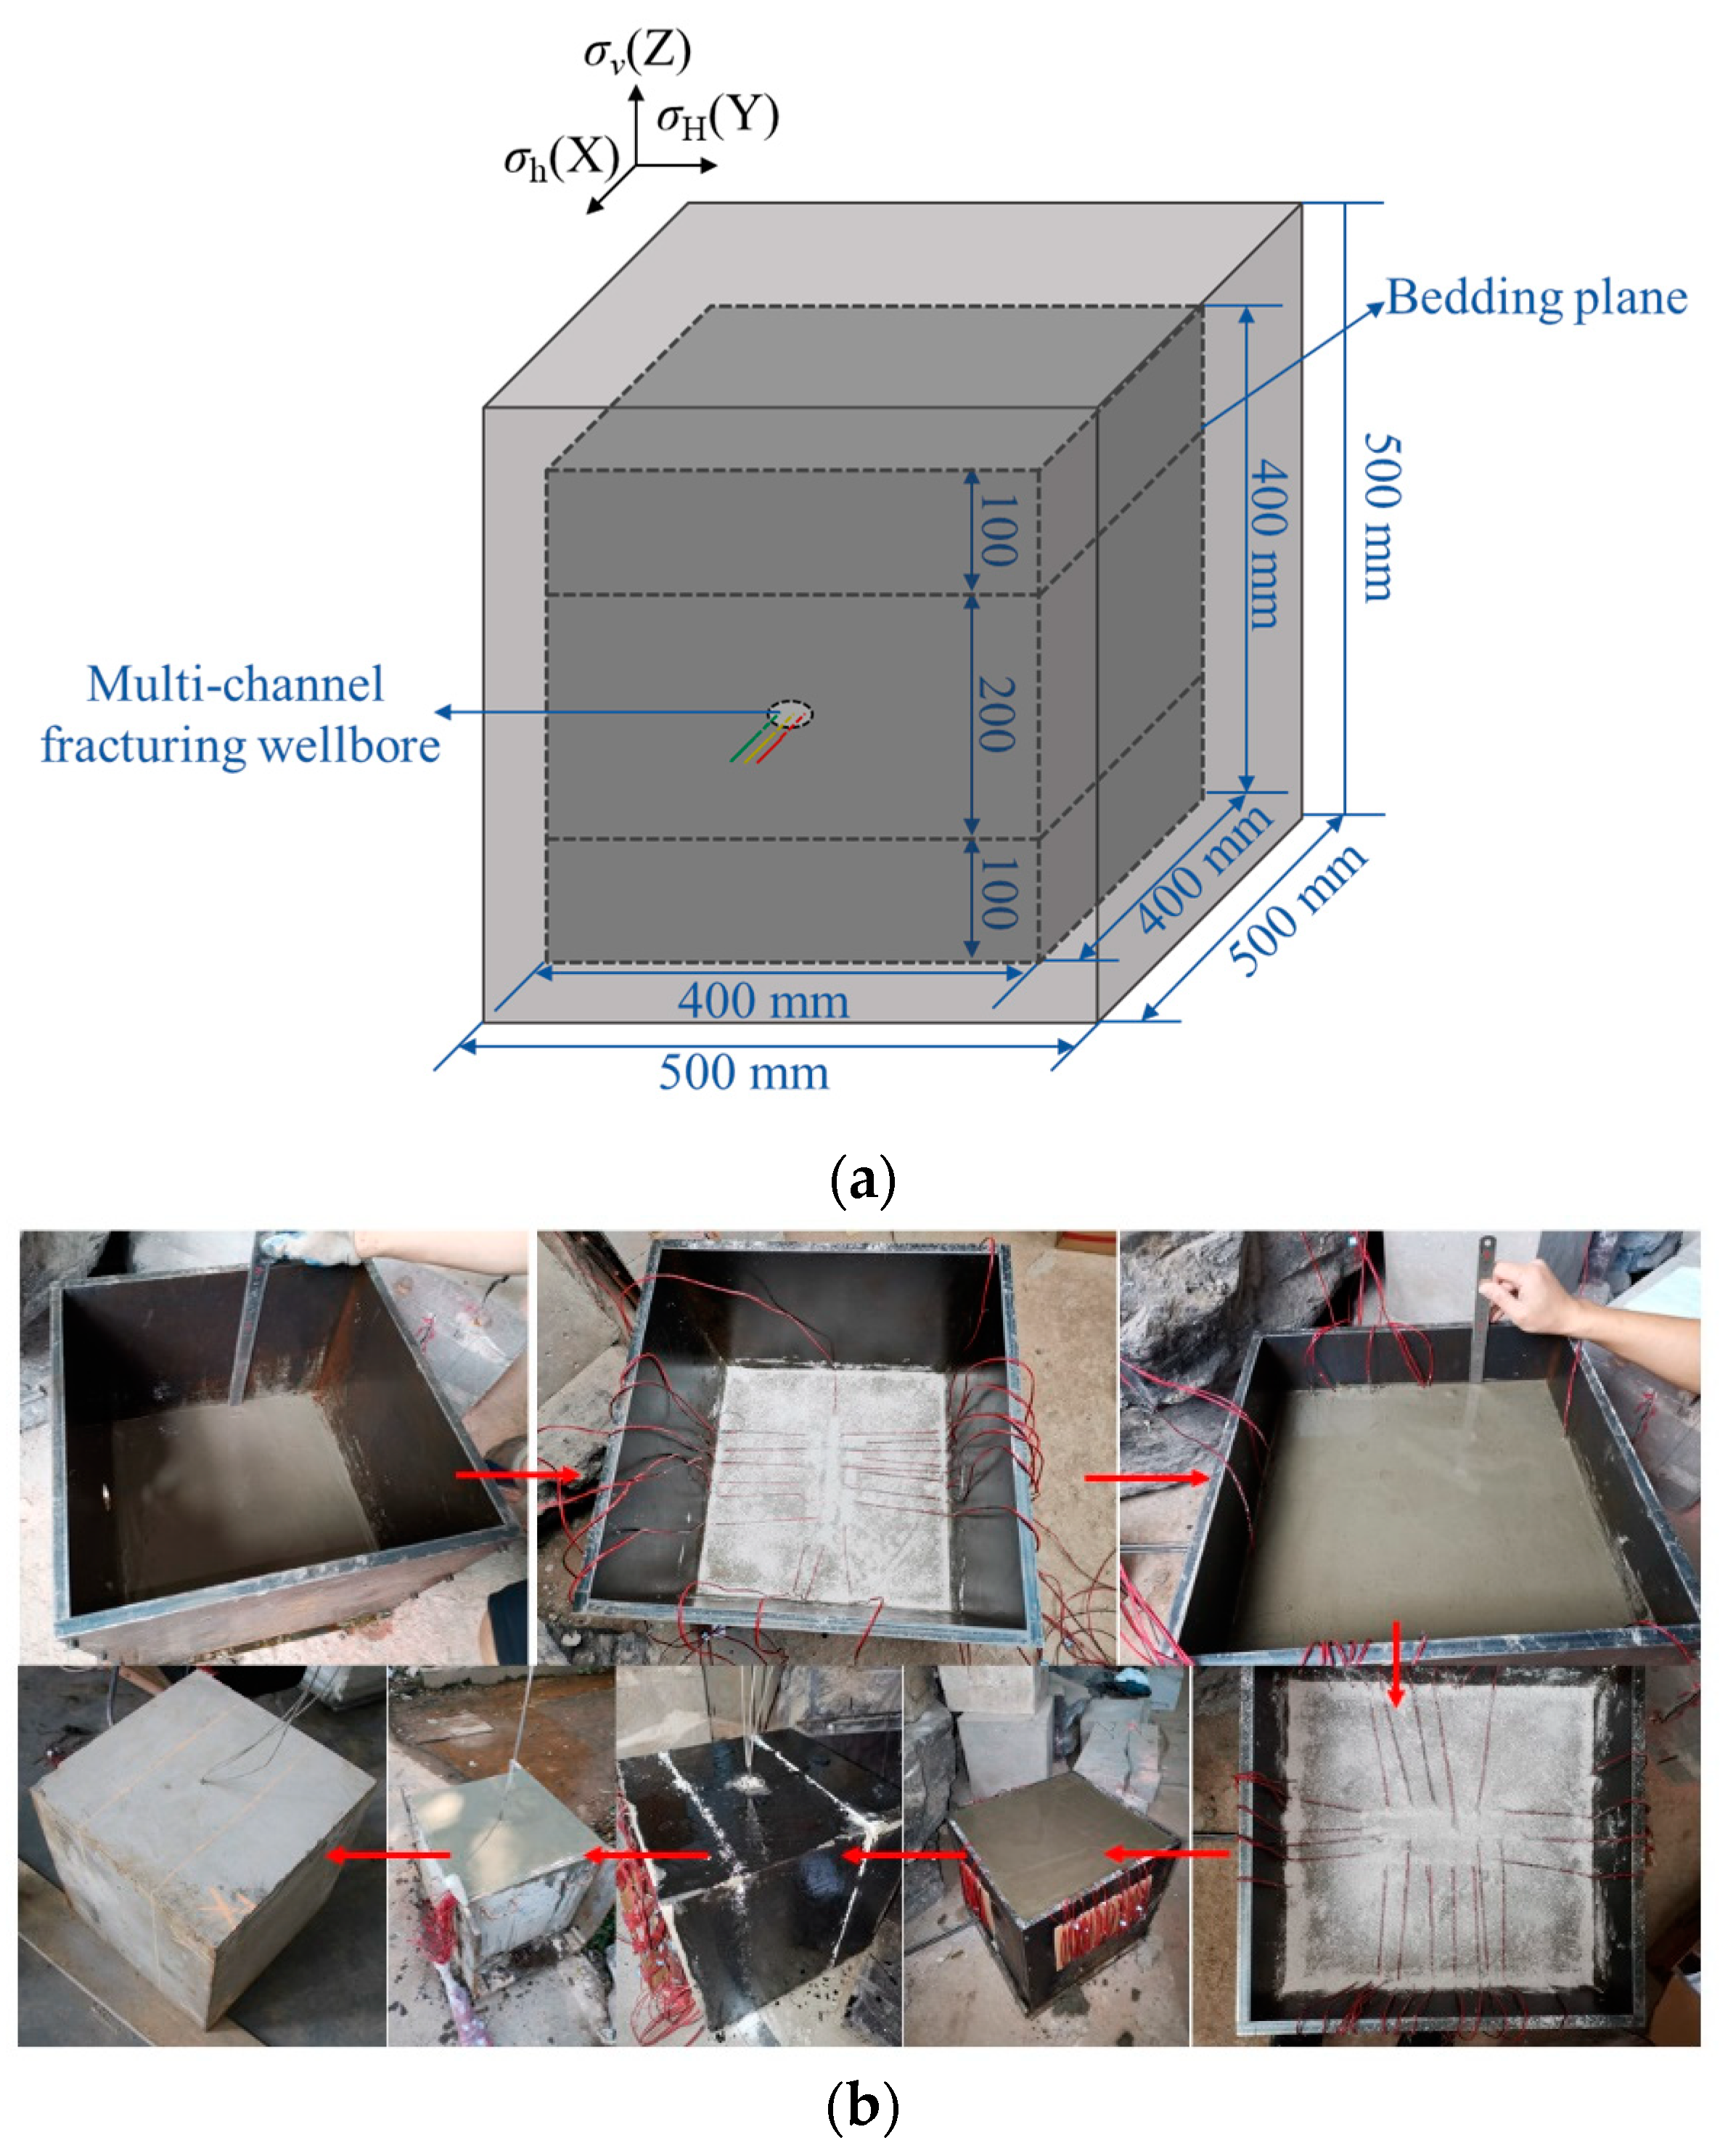
2.2. Sample Preparation

A composite wrapped layered artificial fracturing sample was prepared, considering factors, such as the maximum allowable sample size of the testing machine, maximizing of the crack propagation path, pressure retention after the crack initiation and propagation, and bedding structure. Portland cement (model 525) and quartz sand (40–80 mesh) were selected to prepare artificial samples, and the mass ratios of cement, quartz sand, and water were 1:1:0.5. The mechanical properties of the artificial samples and shale are listed in Table 1. The shale was collected from the outcrops of Longmaxi formation in Sichuan Basin of China [33].
As shown in Figure 3a, the shape of the sample was a cube with the side length of 500 mm. Inside it was a small cube (side length of 400 mm) at the central position. The small cube was cast in three layers, with the height of each layer setting 100 mm, 200 mm, and 100 mm, respectively. The multi-channel fracturing wellbore (detailed in Section 2.3) was placed in the center of the second layer. During the pouring process, two bedding surfaces were formed by spreading barite powder, and resistance strain gauges were arranged on the bedding surfaces and wrapped by waterproof silicone rubber to ensure their normal functioning. After being solidified, the small cubic sample was covered with a thin layer of epoxy resin to restrain the leakage of fracturing fluid and retard the pressure decline in the fractures. Then it was placed in the center of a cubic mold (inner side length of 500 mm), and cement slurry was poured in it. After curing, the composite wrapped cubic sample with side length of 500 mm was ready for test. The sample preparation process is illustrated in Figure 3b.

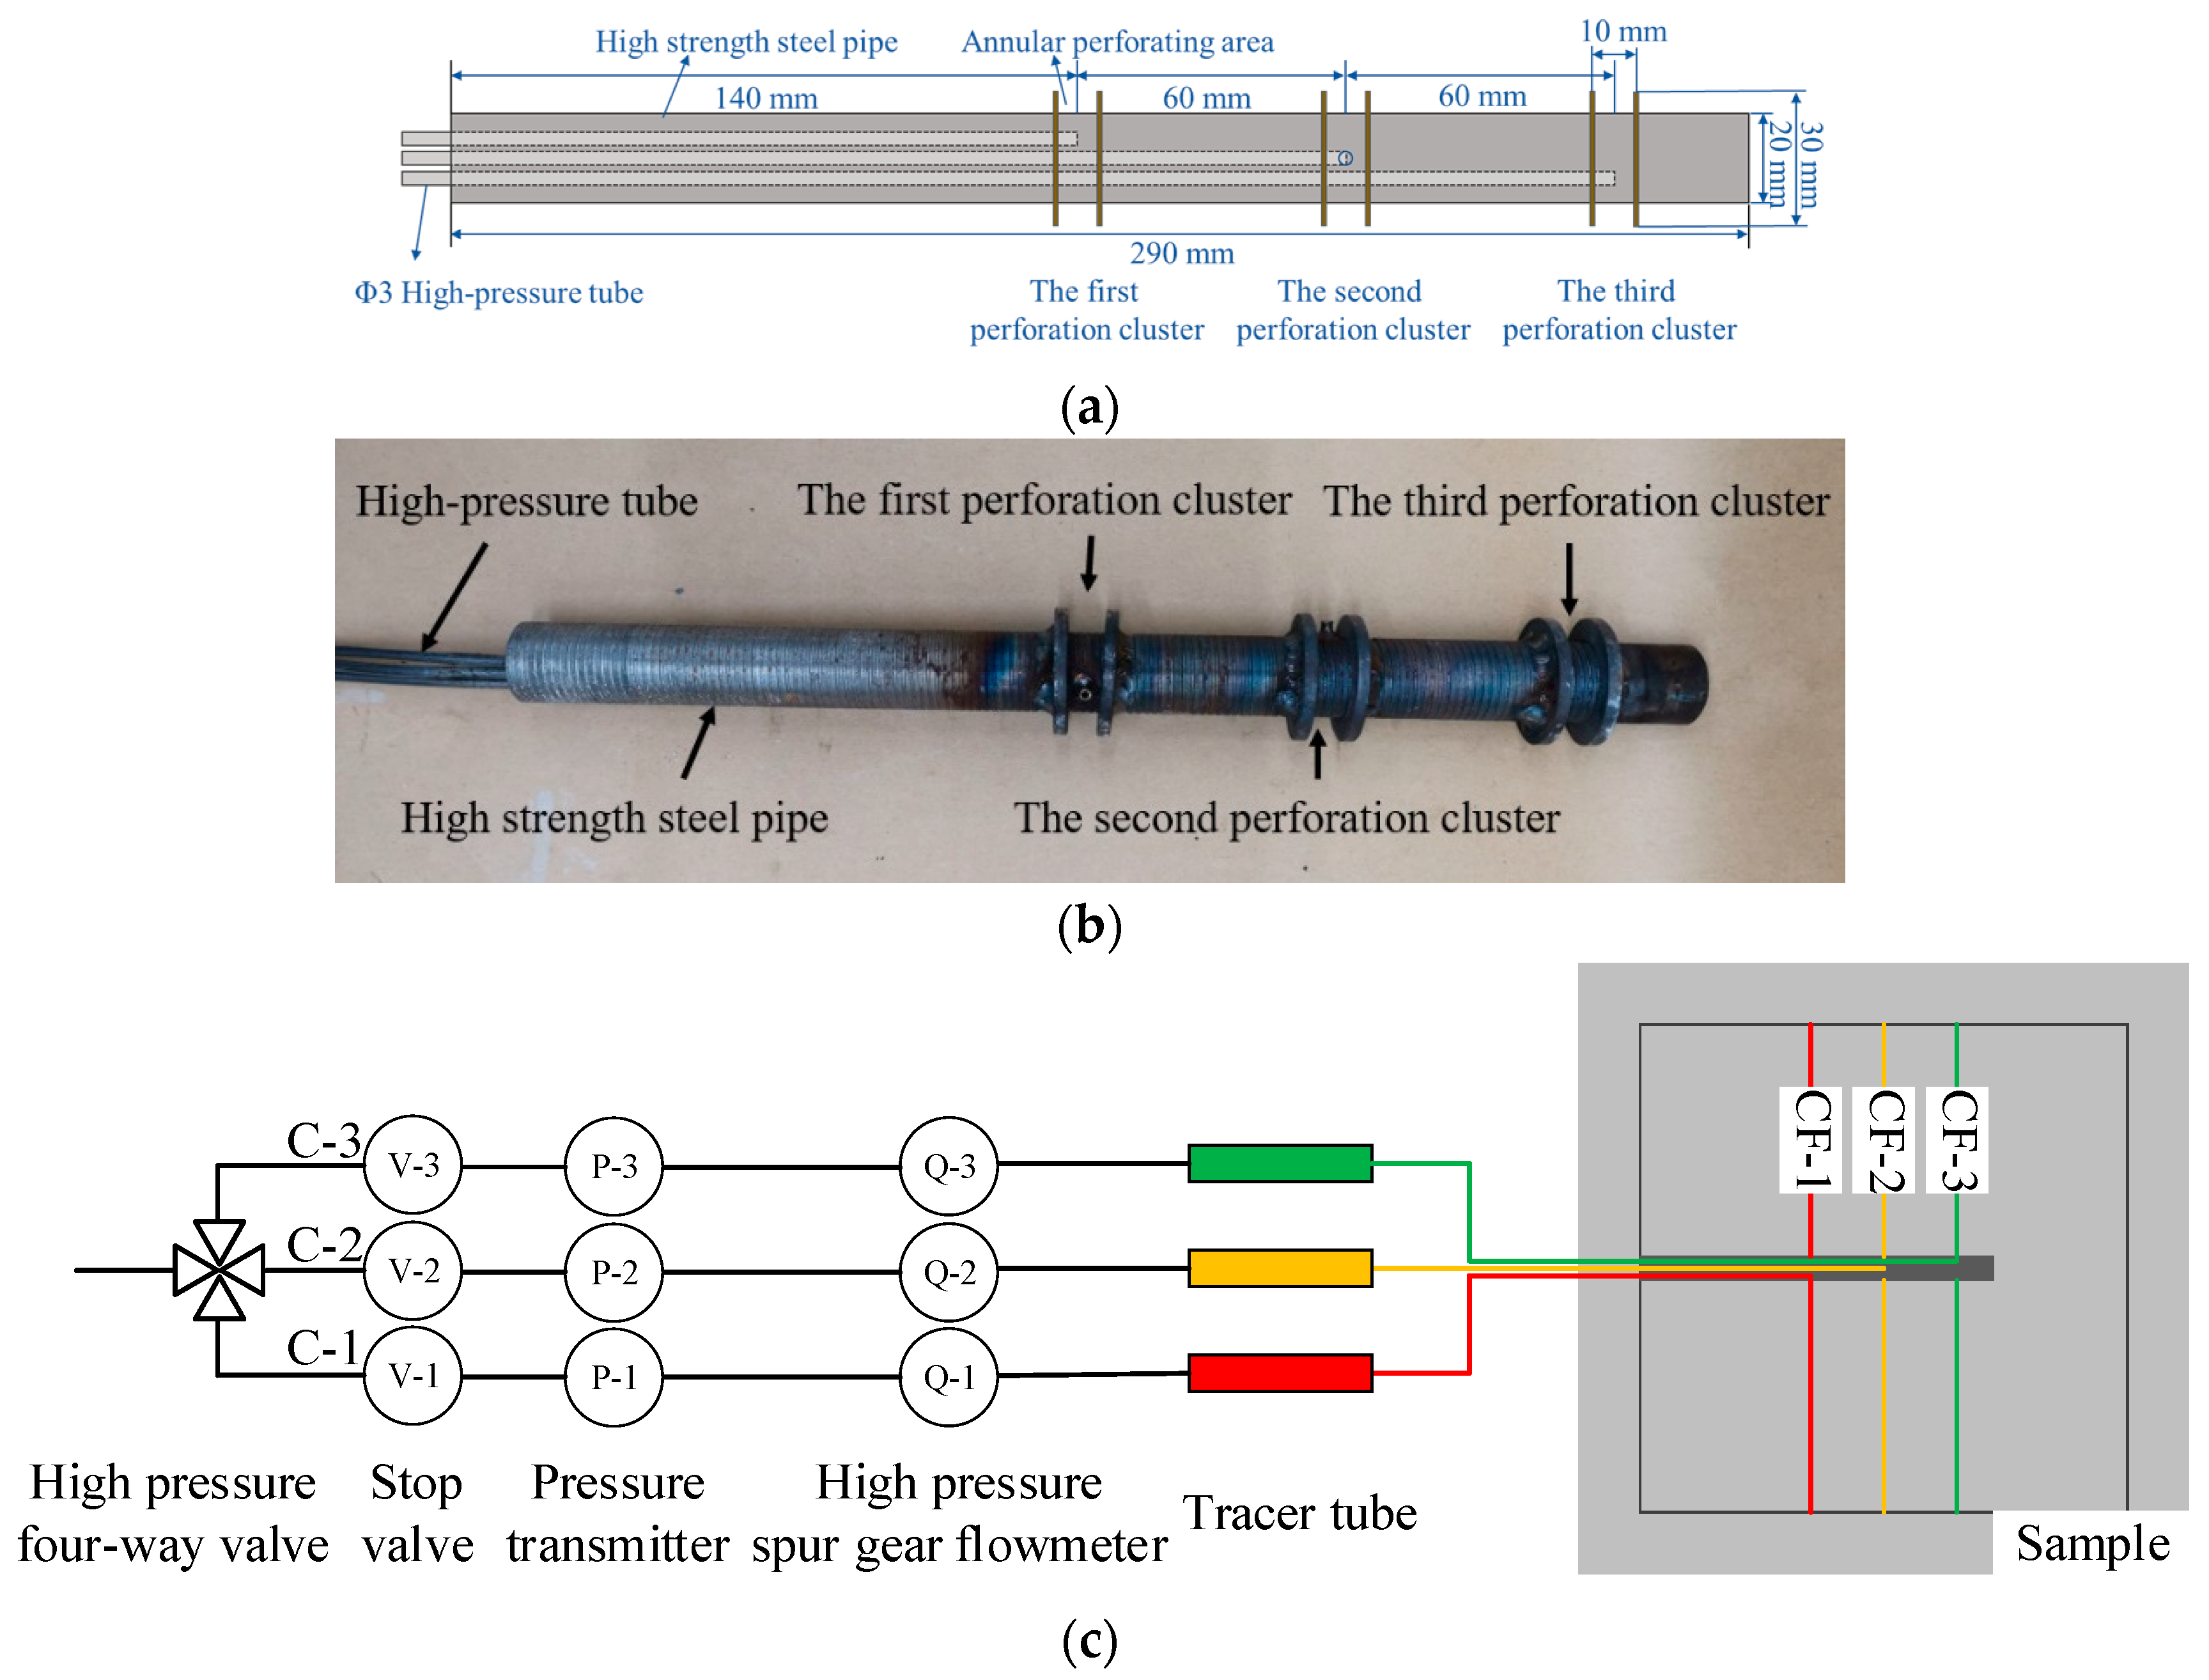
2.3. Multi-Channel Fracturing Wellbore

A multi-channel fracturing wellbore was designed and manufactured to realize a multi-cluster fracturing test of horizontal wells (three clusters were considered here). As shown in Figure 4a, the newly developed wellbore is divided into three parts: outer casing, injection pipeline, and annular perforation area. The outer casing is a high-strength steel pipe with an outer diameter of 20 mm, inner diameter of 15 mm, and length of 290 mm (cluster spacing of 60 mm) or 250 mm (cluster spacing of 30 mm). Three circular liquid outlets with diameter of 3 mm were drilled on the sidewall of the steel pipe at equal distance and phase angle of 120°. Three high-pressure tubes were introduced from the inside of the wellbore and welded to the liquid outlet to form three independent injection channels. Two annular iron sheets were welded on both sides of a liquid outlet to simulate a perforation cluster, at which hydraulic fracture could initiate. The interval distance between two adjacent outlets is defined as the cluster spacing. From the wellbore entrance, we defined the three perforation clusters as the first, second, and third. The channels corresponded were named C-1, C-2, and C-3. The fractures formed correspondingly were called cluster fracture 1, 2, and 3, and abbreviated CF-1~3, respectively. The bottom of the wellbore was closed, and its outer surface was covered with threads to increase adhesion to the sample. The prepared multi-channel wellbore is presented in Figure 4b, and the corresponding work diagram is shown in Figure 4c.

2.4. Experimental Scheme
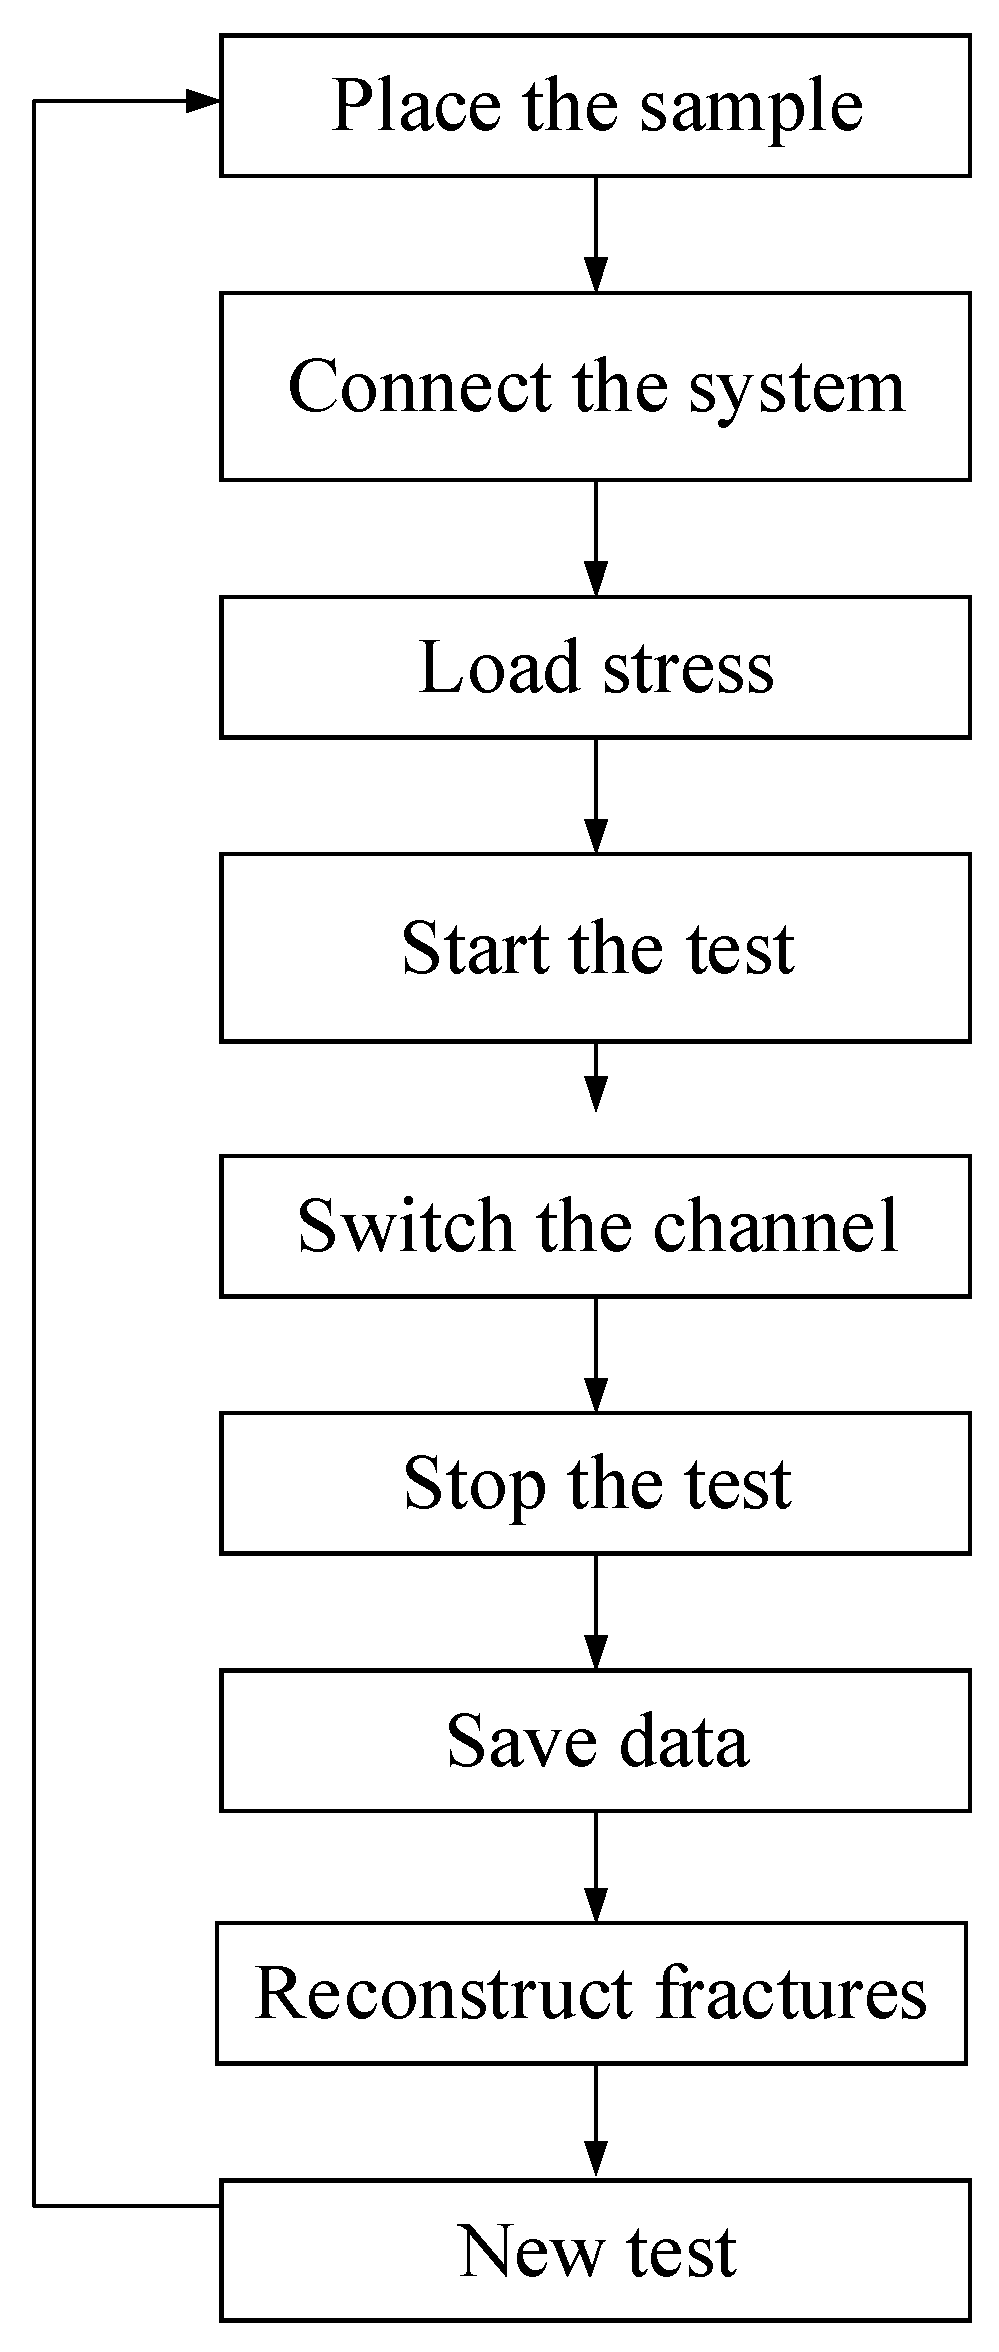
To investigate the geometry of multi-cluster hydraulic fractures during initiation and propagation, four factors (horizontal stress difference, pump rate, cluster spacing, and bedding structure) were considered in designing the experimental scheme. As listed in Table 2, the loading values of in situ stress were set based on the normal fault stress mechanism (σv (vertical stress) ≥ σH (maximum horizontal stress) > σh (minimum horizontal stress)). At Tests 1, 2, and 3, the horizontal stress differences were set to 3, 8, and 13 MPa, respectively. Additionally, Tests 4, 5, and 6 were conducted to investigate the variation of pump rates (30/60 mL/min), cluster spacing (30/60 mm), and bedding structures (Y/N) on the morphologies of multi-cluster fractures under the same horizontal stress difference of 13 MPa. The same fracturing fluid with viscosity of 100 mPa·s was used in all tests.

2.5. Test Procedure

As seen in Figure 5, the typical experimental procedures are as follows:
(1).
The sample was placed in the true triaxial loading chamber and acoustic emission probes were sticked at the preset positions of the four surfaces of the sample to effectively monitor the information of fracture initiation and propagation.
(2).
The minimum horizontal stress, maximum horizontal stress, and vertical stress were loaded along the X (wellbore direction), Y, and Z directions, respectively. During the loading process, the 3D stress should be loaded simultaneously. Therefore, the set minimum horizontal stress value is loaded first. Then, the maximum horizontal stress and maximum vertical stress are increased to the set maximum horizontal stress value. Finally, the vertical stress was gradually loaded to the set value. This loading method prevents unbalanced loading from causing mechanical shear damage to the specimen. After the tri-axial stress reached the predetermined value, it was held for more than 30 min to achieve a relatively steady stress state in the sample before hydraulic fracturing [34].
(3).
The fracturing fluid was injected into the wellbore via the hydraulic fracturing pumping system at a given pumping rate. Simultaneously, the acoustic emission test system, strain monitoring system, and multi-channel shunting system collected data. After the fracturing fluid had been injected synchronously into multiple clusters for a certain amount of time, stop valves were used to plug the channels that were fractured first and fully injected so that the remaining perforation clusters could fully fed. Eventually, all channels were fed completely, i.e., all hydraulic fractures at each perforation cluster could extended completely. Fracturing fluids mixed with tracers of different colors were pre-added to the tracer tubes of multi-channel shunting system to identify the spread range of each cluster fracture.
(4).
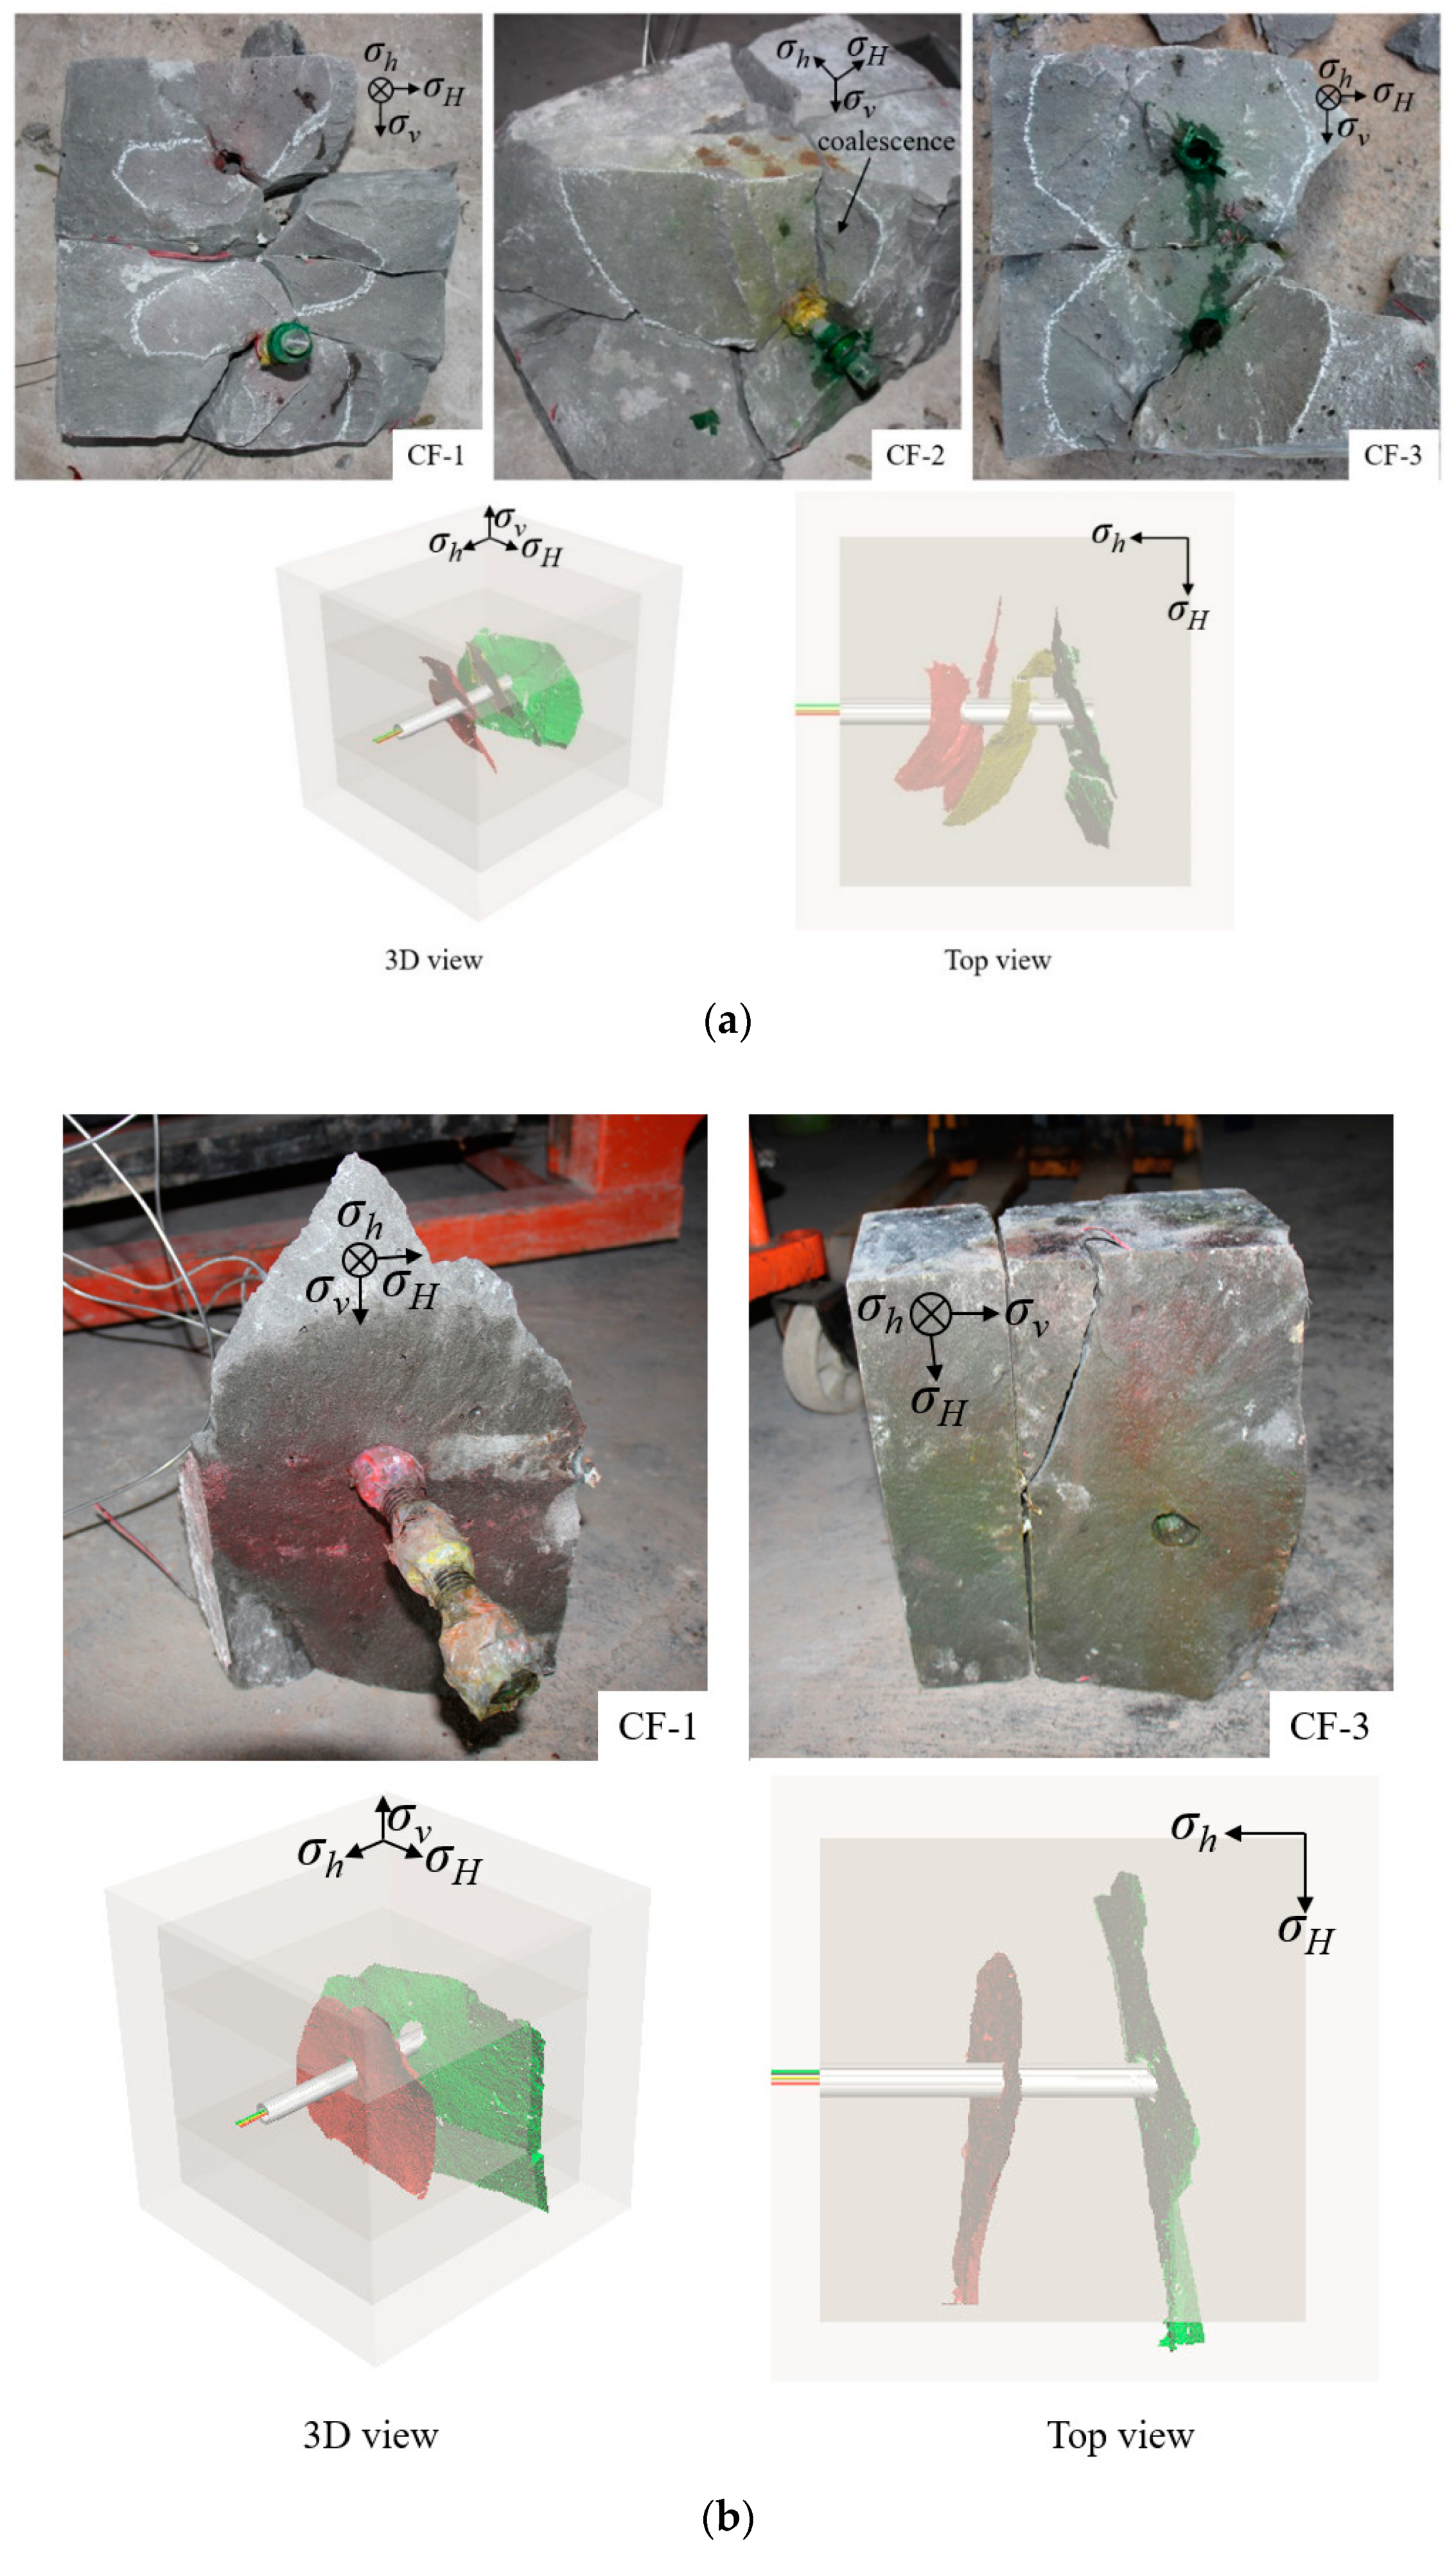
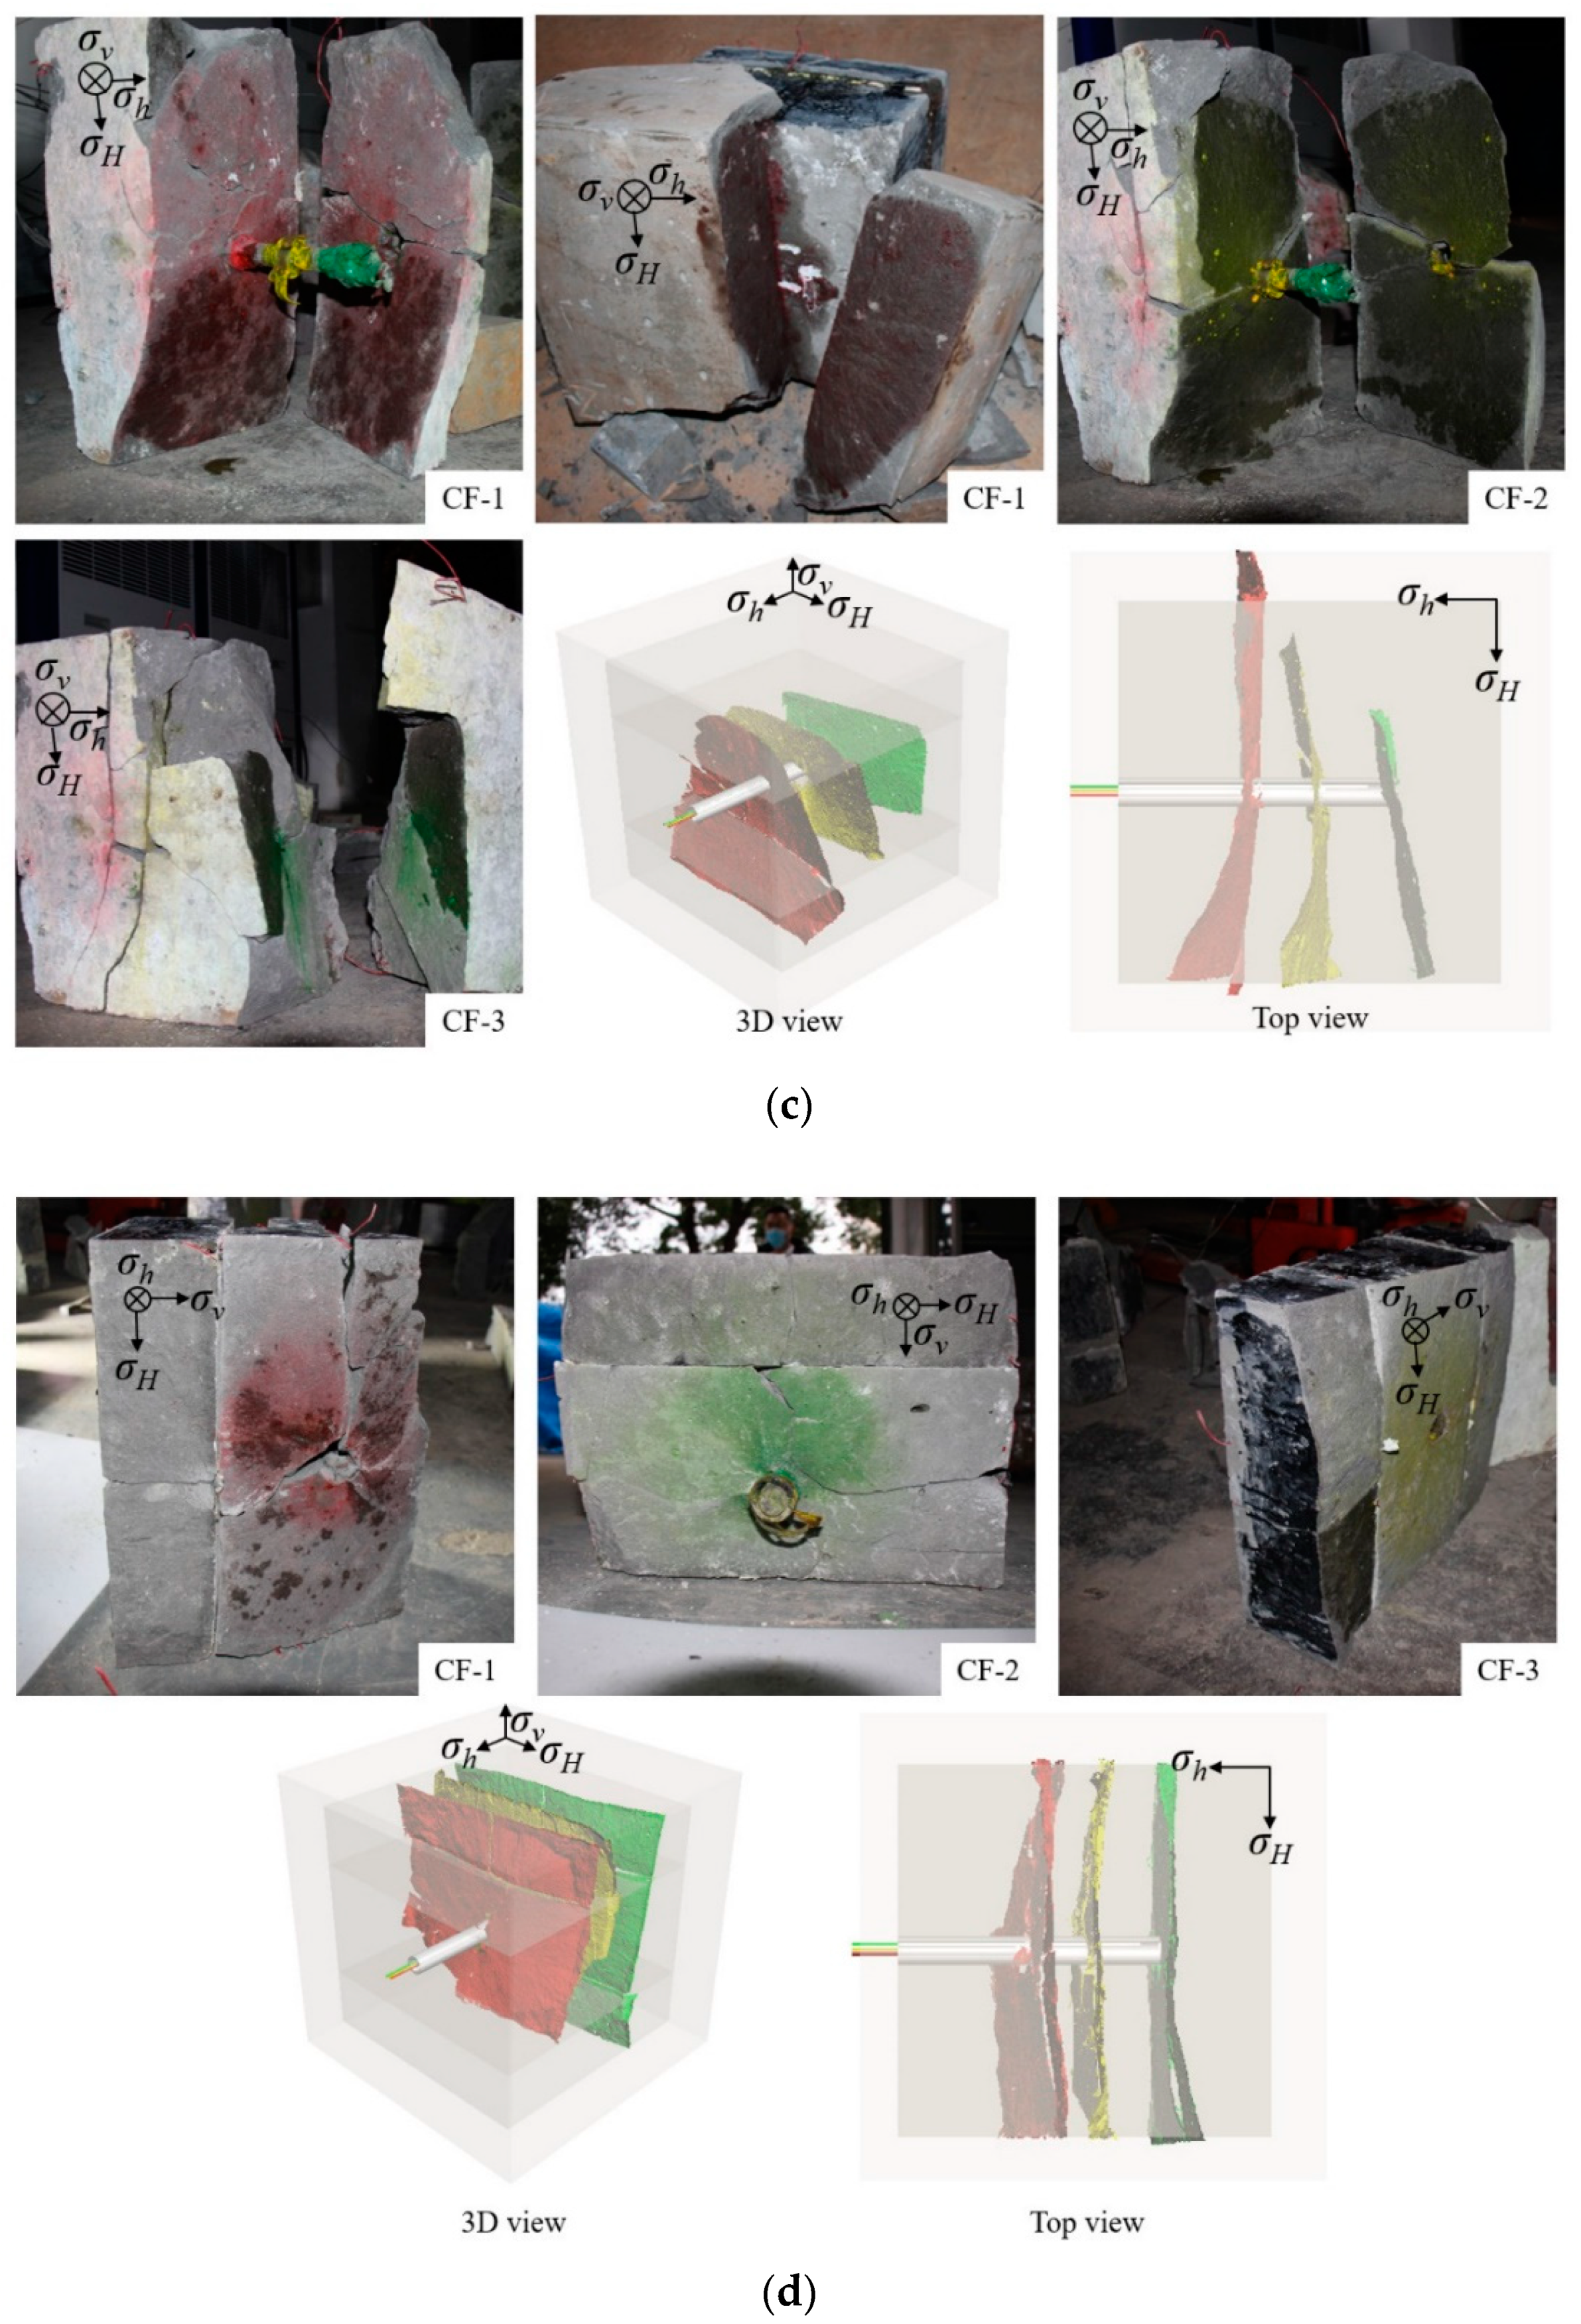
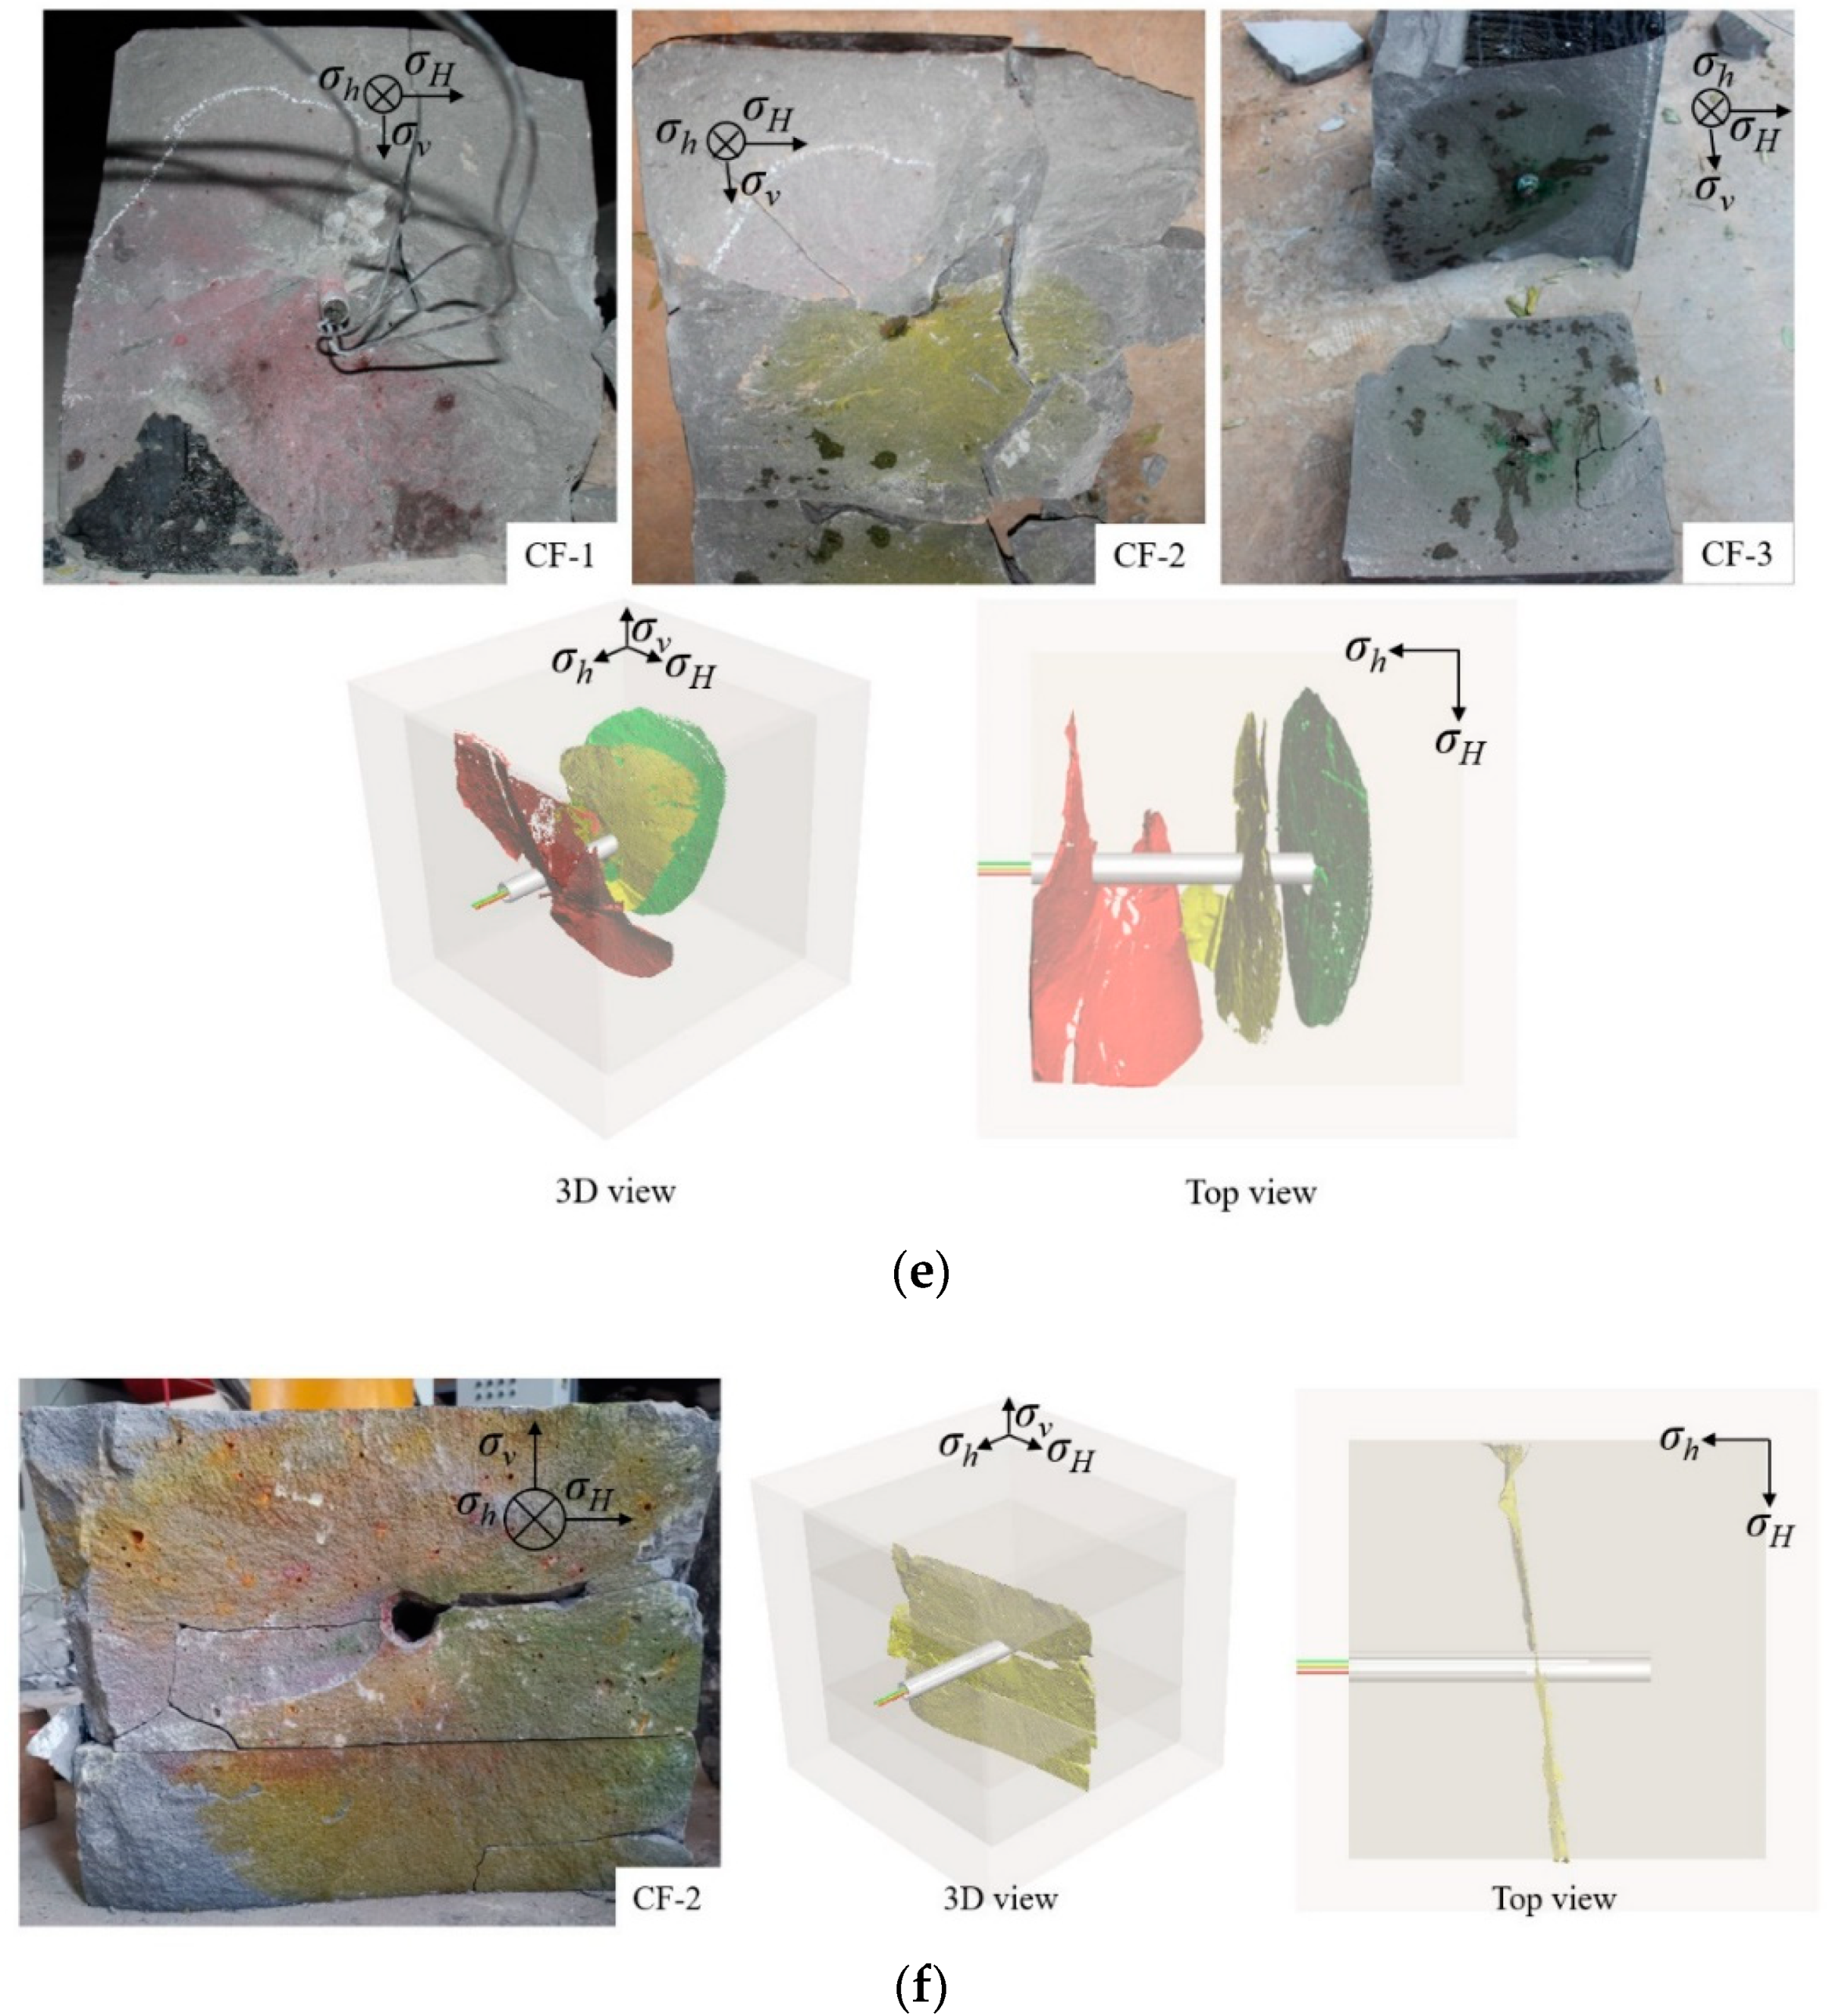
After test, the sample was split to describe the multi-cluster hydraulic fracture propagation morphology. The morphology of the multi-cluster fracture was reconstructed using a 3D scanner.

3. Results and Analysis

3.1. Analysis of Initiation Pattern

It is observed that there are two initiation patterns among multiple hydraulic fractures based on pump pressure curve, breakdown pressures of each fracture, and fracturing fluid injection in each channel. The first initiation pattern is simultaneous initiation. The breakdown pressure of the subsequent fracture was lower than or equal to the value of the previous fracture, and fracturing fluid was injected into multiple channels simultaneously, for examples, Test 2, Test 6, and CF-2 and CF-3 in Test 1. The other pattern is successive initiation. The breakdown pressure of the subsequent fracture was higher than the value of the previous fracture, and the fracturing fluid only entered a single channel, such as Tests 3, 4, and 5.

3.1.1. Analysis of Simultaneous Initiation

The pressure and cumulative injection volume curves for simultaneous initiation of multiple hydraulic fractures under different test conditions are presented in Figure 6. This section describes the result of Test 1 in detail as an example.
As shown in Figure 6a, the test process was divided into six stages:
(1).
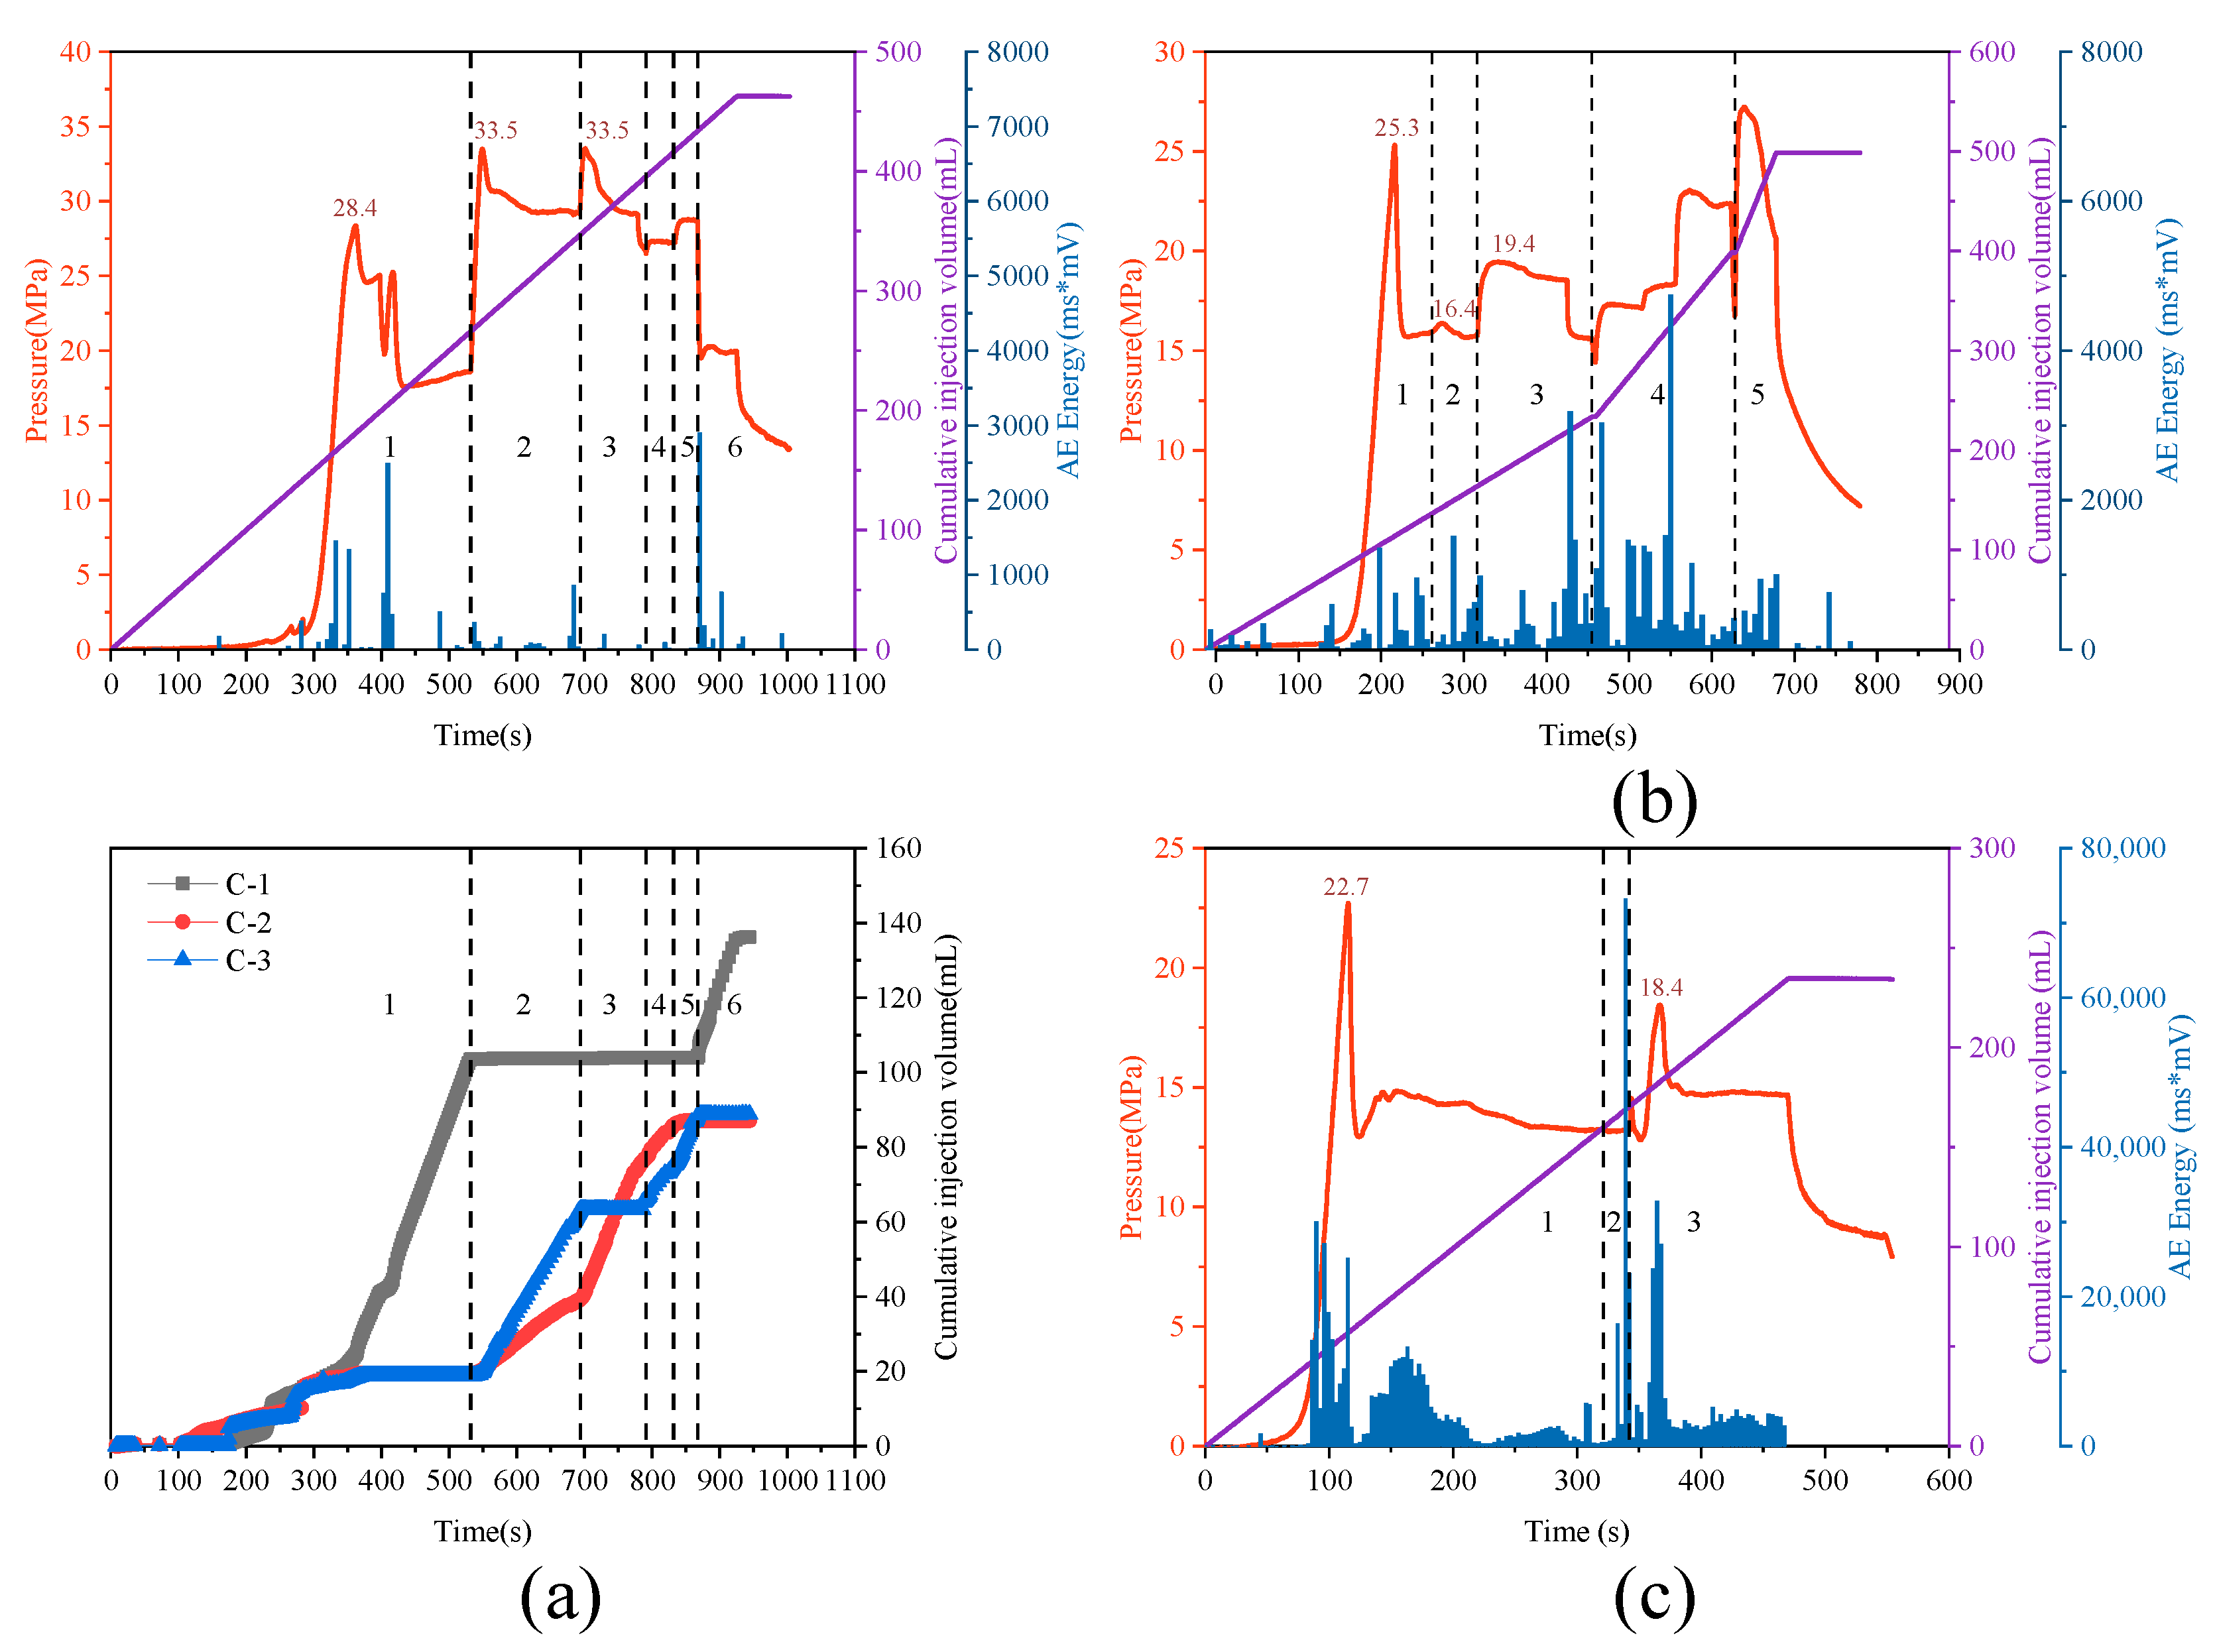
V-1 open, V-2 open, and V-3 open: With the three channels open, the pressure grew slowly before 290 s, and, then, rapidly increased to a breakdown pressure of approximately 28.4 MPa. After a dramatically decrease, it stabilized at 18.5 MPa. The difference of the cumulative injection volume of the three channels were not obvious before 360 s. Then, the cumulative injection volume of C-1 increased rapidly, and C-2 and C-3 stopped to inject, indicating that CF-1 initiated.
(2).
V-1 close, V-2 open, and V-3 open: When the C-1 inlet valve was closed at 531 s, the pressure increased to 33.5 MPa. After a slight drop, the pressure wandered in 29.4 MPa. The C-2 and C-3 entered liquid concurrently, and the inflow rate of C-2 was greater than C-3, which means that CF-2 and CF-3 initiated simultaneously, and CF-3 was the dominant hydraulic fracture.
(3).
V-1 close, V-2 open, and V-3 close: The C-3 inlet valve was closed at 694 s, the pressure increased to 33.5 MPa and then dropped, stabilized at 29.3 MPa. At this stage, only C-2 entered the liquid, and the pressure raised but did not exceed the previous breakdown pressure, indicating that the expansion of CF-2 in the previous stage was incomplete.
(4).
V-1 close, V-2 open, and V-3 open: When the C-3 reopened at 791 s, the pressure increased slightly, and stabilized at 27.3 MPa. At this stage, C-2 and C-3 were fed simultaneously.
(5).
V-1 close, V-2 close, and V-3 open: The C-2 was closed at 832 s, and the pressure was stable at 28.7 MPa which was equal to the extension pressure in the stage 2.
(6).
V-1 open, V-2 open, and V-3 open: When the C-1 and C-2 reopened at 867 s, the pressure dropped and stabilized at about 20 MPa. At 925 s, the liquid injection was stopped, and the pressure dropped slowly. At this stage, only the C-1 entered the liquid, indicating that the expansion of CF-1 was more complete.
In summary, the initiation sequence of each cluster in Test 1 was that CF-1 formed first, then CF-2 and CF-3 initiated concurrently. Similarly, three cluster of hydraulic fracture initiated simultaneous in Test 2 and Test 6.

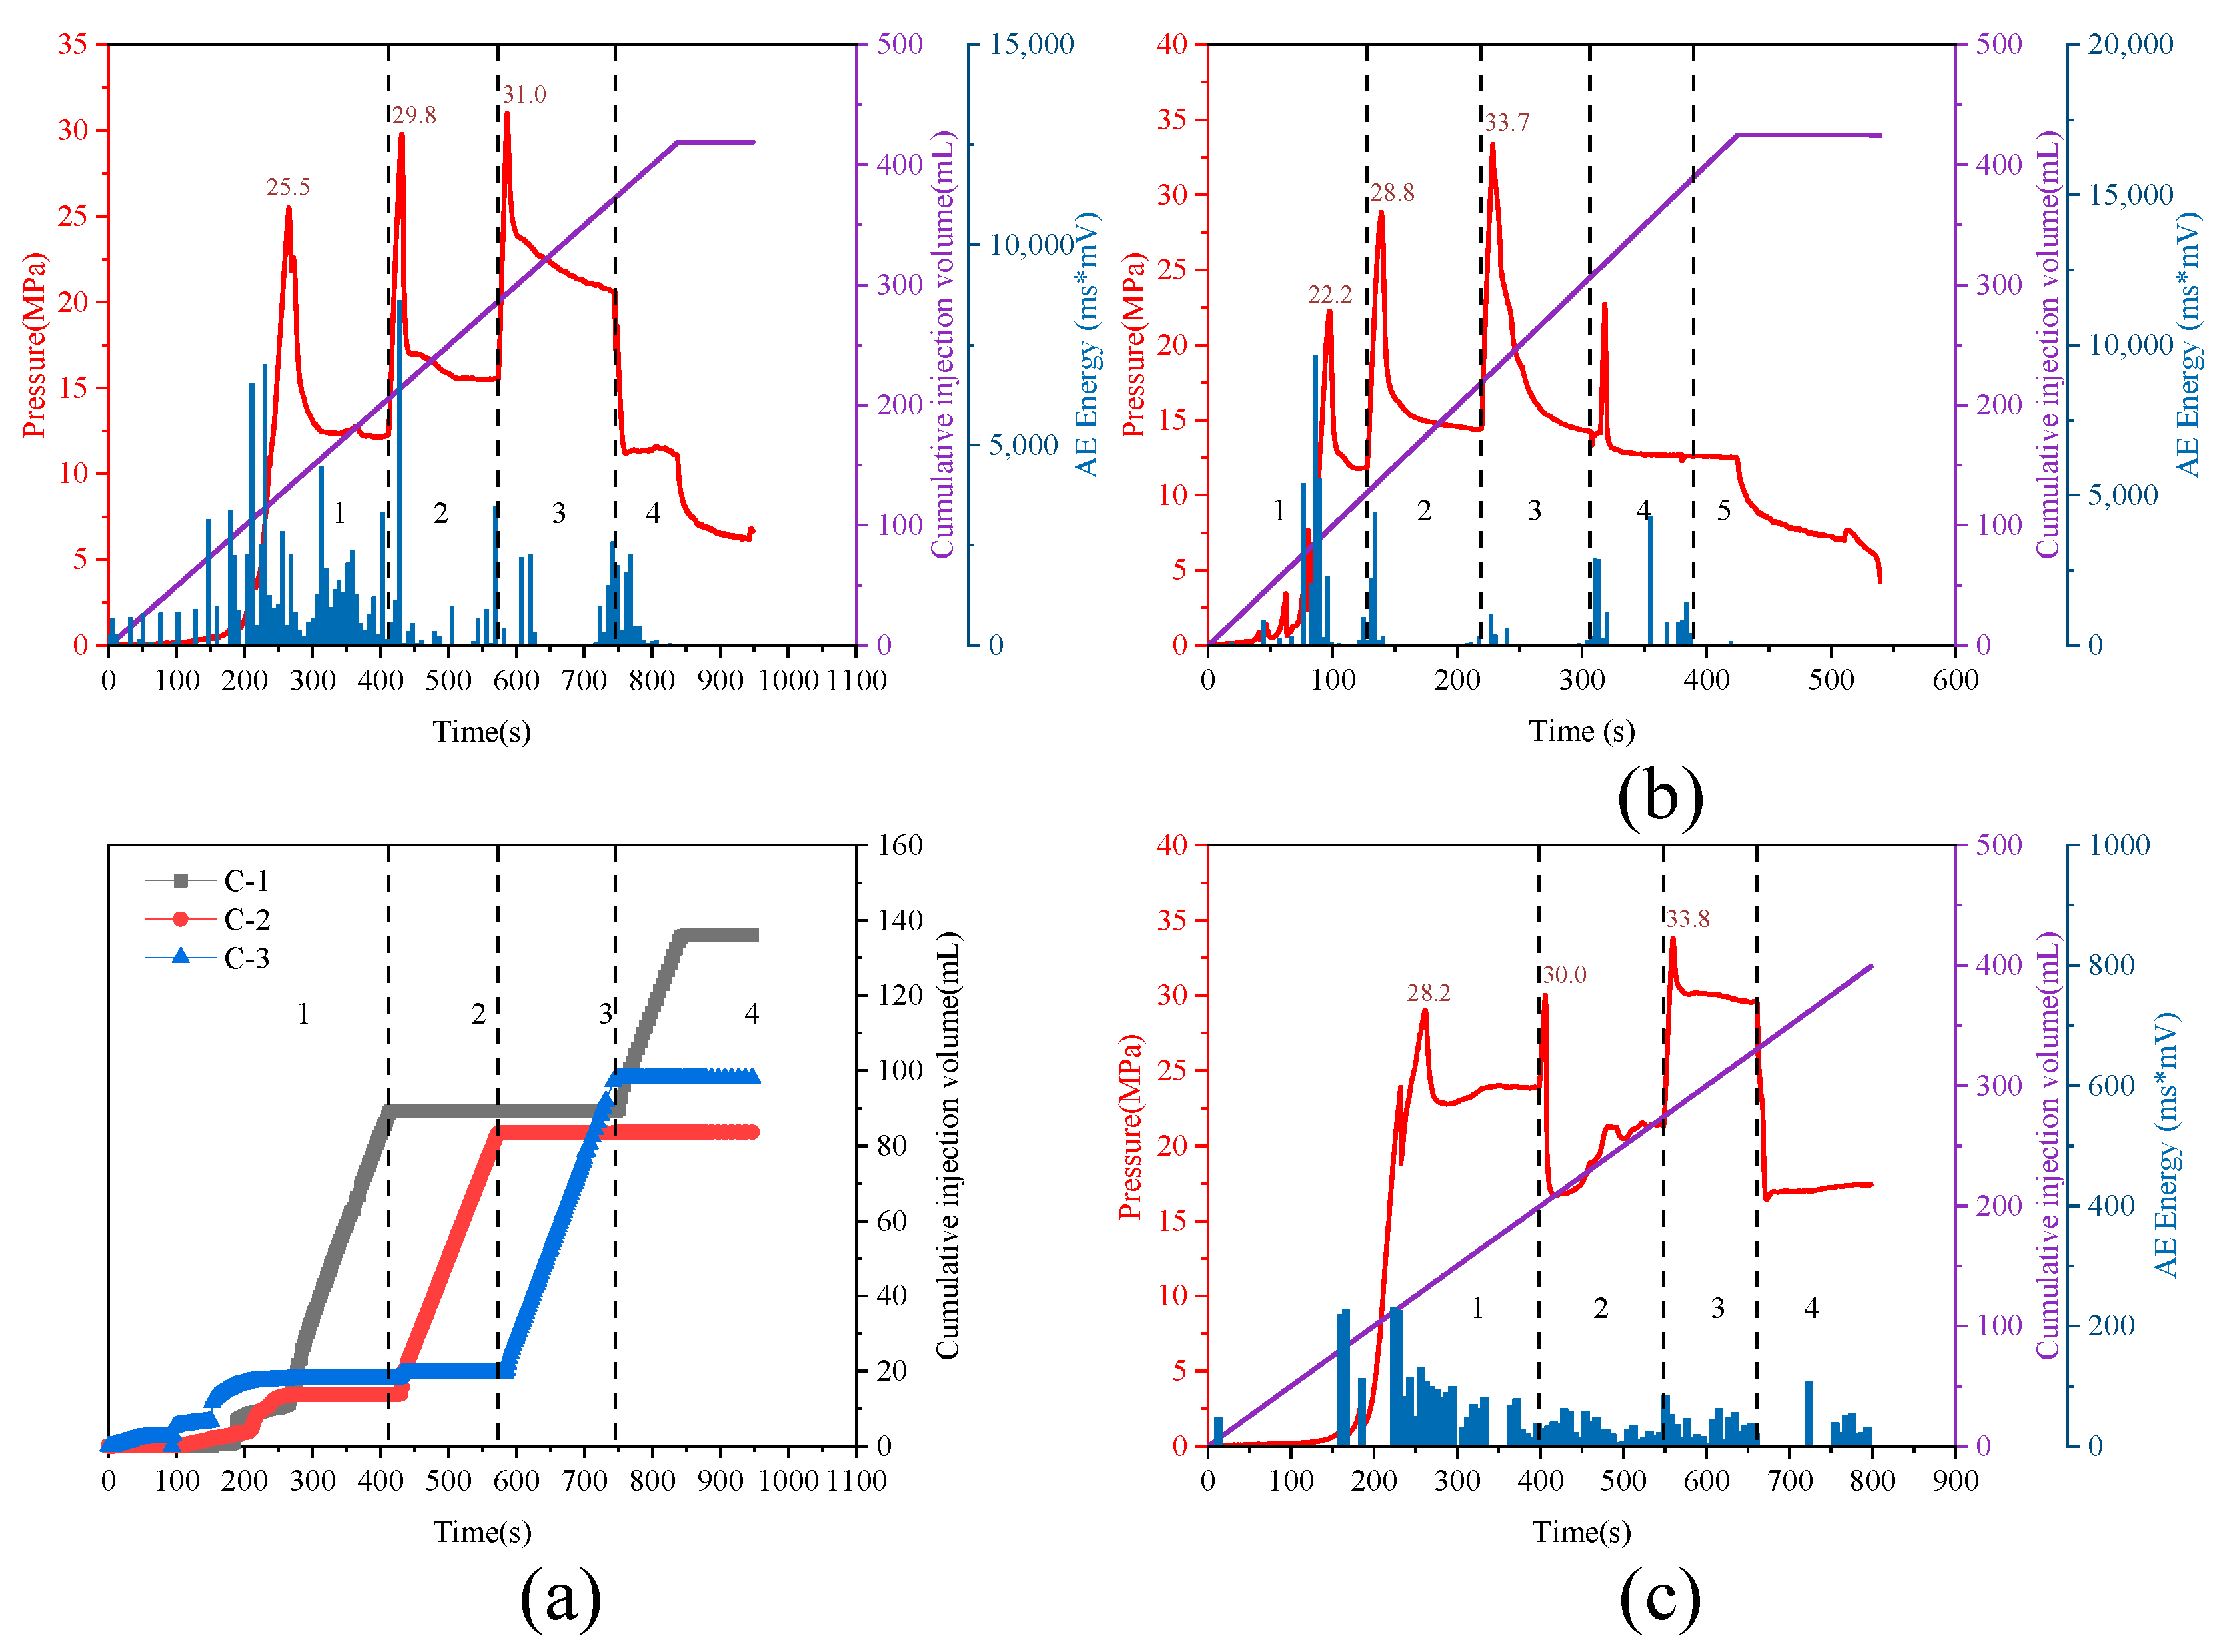
3.1.2. Analysis of Successive Initiation

For the case of sequential initiation, as shown in Figure 7a, Test 3 was divided into four stages:
(1).
V-1 open, V-2 open, and V-3 open: When three channels were open, the pressure increased to a lower breakdown pressure of approximately 25.5 MPa at 265 s. After a sharply decline, the pressure stabilized at 12.2 MPa. Before 265 s, three channels simultaneously injected fracturing fluid with a slow rate. Then, the fracturing fluid only injected into C-1, indicating the formation of CF-1.
(2).
V-1 close, V-2 open, and V-3 open: The C-1 inlet valve was closed at 412 s, the pressure increased to a middle breakdown pressure of 29.8 MPa at 431 s. Then the pressure sticked to 15.5 MPa, due to a drastic reduction. After 431 s, the cumulative injection volume of C-2 increased significantly, which means that the formation of CF-2. Compared with CF-1, the breakdown pressure increased by 16.86%.
(3).
V-1 close, V-2 close, and V-3 open: When the C-2 inlet valve was closed at 573 s, the pressure increased to a higher breakdown pressure of 31.0 MPa at 586 s. The pressure continued to drop with the increase of time. Meanwhile, the fracturing fluid was concentrated into C-3, which shows that CF-3 generated. Compared with CF-2, the breakdown pressure increased by 4.03%.
(4).
V-1 open, V-2 open, and V-3 open: When the C-1 and C-2 reopened at 747s, the pressure dropped rapidly. The pump was stopped at 837 s, and the pressure continued to decrease. At this stage, the fracturing fluid was only entered into C-1. This situation reveals that the extension of CF-1 was more advantageous than CF-2 and CF-3.
Due to the anisotropy of the reservoir and the induced stress field of the previous fractures, the initiation of the subsequent fractures becomes more difficult, resulting in the increase of the fracture breakdown pressures for the remaining perforation clusters.
The acoustic emission energy data can be seen in Figure 6 and Figure 7. Two patterns of acoustic emission energy are observed. On the one hand, the peak of acoustic emission energy corresponded to the culmination of pressure. On the other hand, the peak of acoustic emission energy appeared before the breakdown pressure, indicating that there were many microscopic cracks at this time. The breakdown pressure was a reflection of the sudden aggregation of microscopic cracks to form fracture.

3.2. Initiation and Propagation of Multiple Hydraulic Fractures

After the multi-cluster fracturing test, all samples were split to observe the multi-cluster fracture propagation behavior and final fracture morphology. Figure 8 displays the multi-cluster fracture morphologies in each test. Red, yellow, and green represented the spread ranges of CF-1, CF-2, and CF-3, respectively. The initiation sequence, breakdown pressure, and propagation area of each cluster are listed in Table 3.

3.2.1. Stress Differences

In Test 1 (σHσh = 3 MPa), as shown in Figure 8a, three clusters of hydraulic fractures were curved with a bigger deflection and were confined between two bedding planes. The CF-1 initiated first and propagated asymmetrically. Then, the CF-2 and CF-3 initiated simultaneously and coalesced near the well, which were away from the CF-1.
As illustrated in Figure 8b, two fractures (CF-2 and CF-3) initiated synchronously in Test 2 (σHσh = 8 MPa). CF-2 merged with CF-3 at the position of the perforation cluster. Due to the relatively far distance between CF-1 and CF-3, the stress interference was weakened so that the two hydraulic fractures were relatively straight. The CF-1 were slightly attracted from the CF-3. The CF-1 diverted to the bedding, whereas the CF-3 penetrated the lower bedding.
In Test 3 (σHσh = 13 MPa), fractures at the three perforation clusters initiated successively (Figure 8c). The CF-1 initiated first and propagated in an approximately planar manner. It penetrated the lower bedding and propagated to the boundary of the sample. Then, the CF-2 and CF-3 generated sequentially, deviated toward CF-1, and diverted to the bedding. The area of fracture propagation decreased with the order.
The mechanical interaction between multiple hydraulic fractures can affect the geometry of the fractures, whereas the interaction was intensified by the decrease of horizontal stress difference. For example, in Test 1 with a horizontal stress difference of 3 MPa, although three clusters of hydraulic fractures were generated, their expansion ranges were small. When the horizontal stress difference increased in Test 2 and 3, the expansion range of hydraulic fractures increased significantly. Therefore, in the reservoir with small in situ stress difference, measures should be taken to reduce the effect of in situ stress, which are the focus of the following research.

3.2.2. Pump Rates

After increasing the pump rate to 60 mL/min (Figure 8d), the subsequent fractures in Test 4 turned to the previous hydraulic fractures with a smaller deflection direction, which was like the Test 3. The expansion area of the fractures had increased significantly, which was different from the Test 3. Three clusters of hydraulic fractures all penetrated the upper bedding, and the CF-1 also penetrated the lower bedding. In Test 3, the total area of multiple fractures propagation was about 2.63 × 103 cm2, whereas the area increased by 60% to 4.21 × 103 cm2 in Test 4. Therefore, when the pump rate increased, it is beneficial to weaken the stress between fractures and enlarge the spread area of multiple fractures, which is conducive to reservoir stimulation.

3.2.3. Bedding Structures

In the case of a complete sample (not including bedding) (Test 5), the effect of stress interference between multiple fractures was significantly enhanced. As illustrated in Figure 8e, the CF-2, which cracked first, received the strongest stress interference due to its location in the middle, and its propagation range was the smallest. Then it was CF-3 that started, which toward to CF-2 during its expansion. The CF-1 which was the last one was away from the CF-2 and CF-3 with a bigger deflection angle. The results of this multi-fracture propagation are similar to the previous simulation results [15,35]. Considering that the sample was not completely isotropic, it aggravated the degree of curvature of the crack propagation.

3.2.4. Cluster Spacing

In Test 6, as illustrated in Figure 8f, CF-2 propagated along the horizontal maximum stress direction, whereas CF-1 and CF-3 were connected to CF-2 along the wellbore surface. This situation may be caused by the small cluster spacing. The decrease of cluster spacing (from 60 mm to 30 mm) increased the mechanical interaction between fractures, which may change the distribution of stress field around fractures, so that CF-1 and CF-3 propagated along the direction of horizontal minimum stress.

3.2.5. Multiple Fractures Interaction

The effect of the stress interference between fractures prevented multiple fractures with parallel propagation. In the multiple fractures’ propagation process with simultaneous initiation, the interaction between the fractures was usually attraction, which leaded to the merging of the fractures. For successive initiation, two behaviors between multiple fractures were observed. On the one hand, the subsequent fracture tended to intersect with the previous fracture. On the other hand, the subsequent fracture deviated from the previously created fracture. The interaction was aggravated by the decrease of horizontal stress difference and cluster spacing, and weaken by the increase of pumping rates. In the future work, weakening the interaction between multiple fractures will be the focus.
Multi-staged fracturing in shale can result in single or two unbalanced fractures in the laboratory [25]. However, the formation of multiple fractures is random. After improving the fracturing system, the formation of multiple fractures is so common that the interaction between fractures can be studied [27,30]. For multi-stage fracturing in the laboratory, the fracturing sequence is fixed. However, for multiple perforation clusters, the initiation sequence and flow distribution of multiple fractures is not clear, which is not conducive to understanding the initiation and propagation characteristics of multiple fractures. By the improvement of the test system in this paper, not only the initiation and propagation of multiple fractures can be realized, but also the liquid intake of different fractures can be understood. The initiation patterns and interactions of multiple fractures will be better understood.

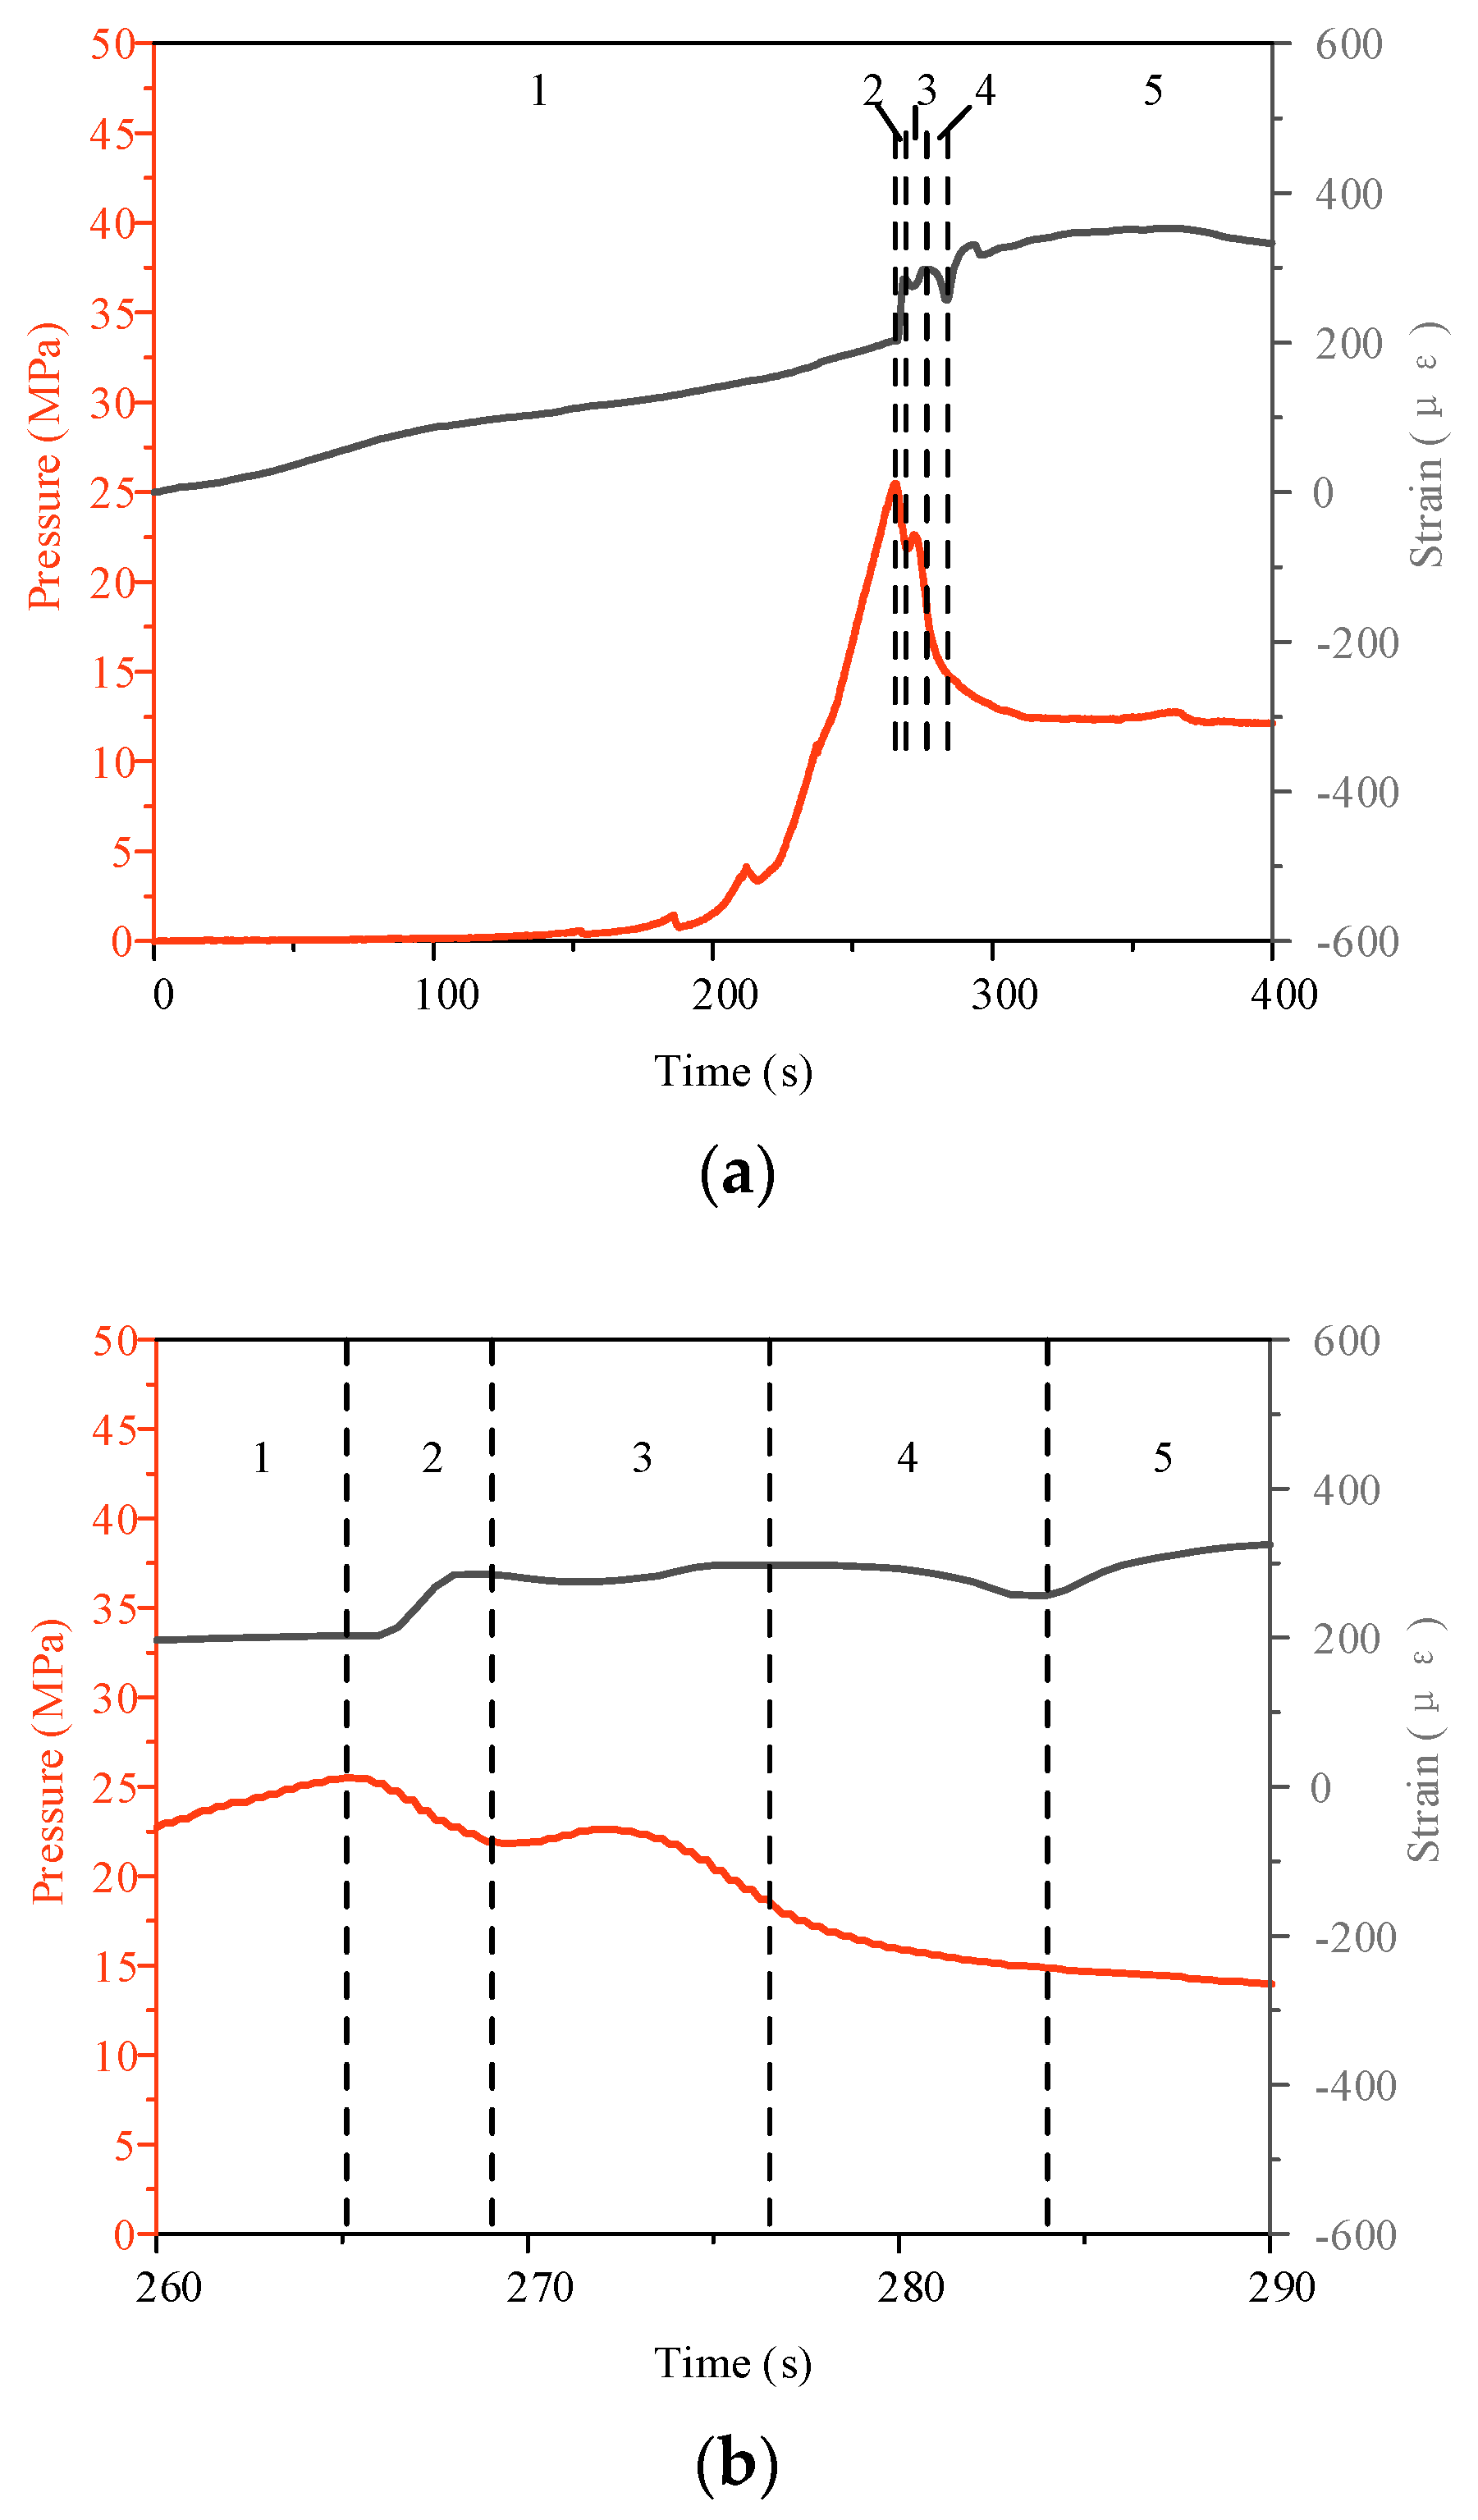
3.3. Strain Response Characteristics
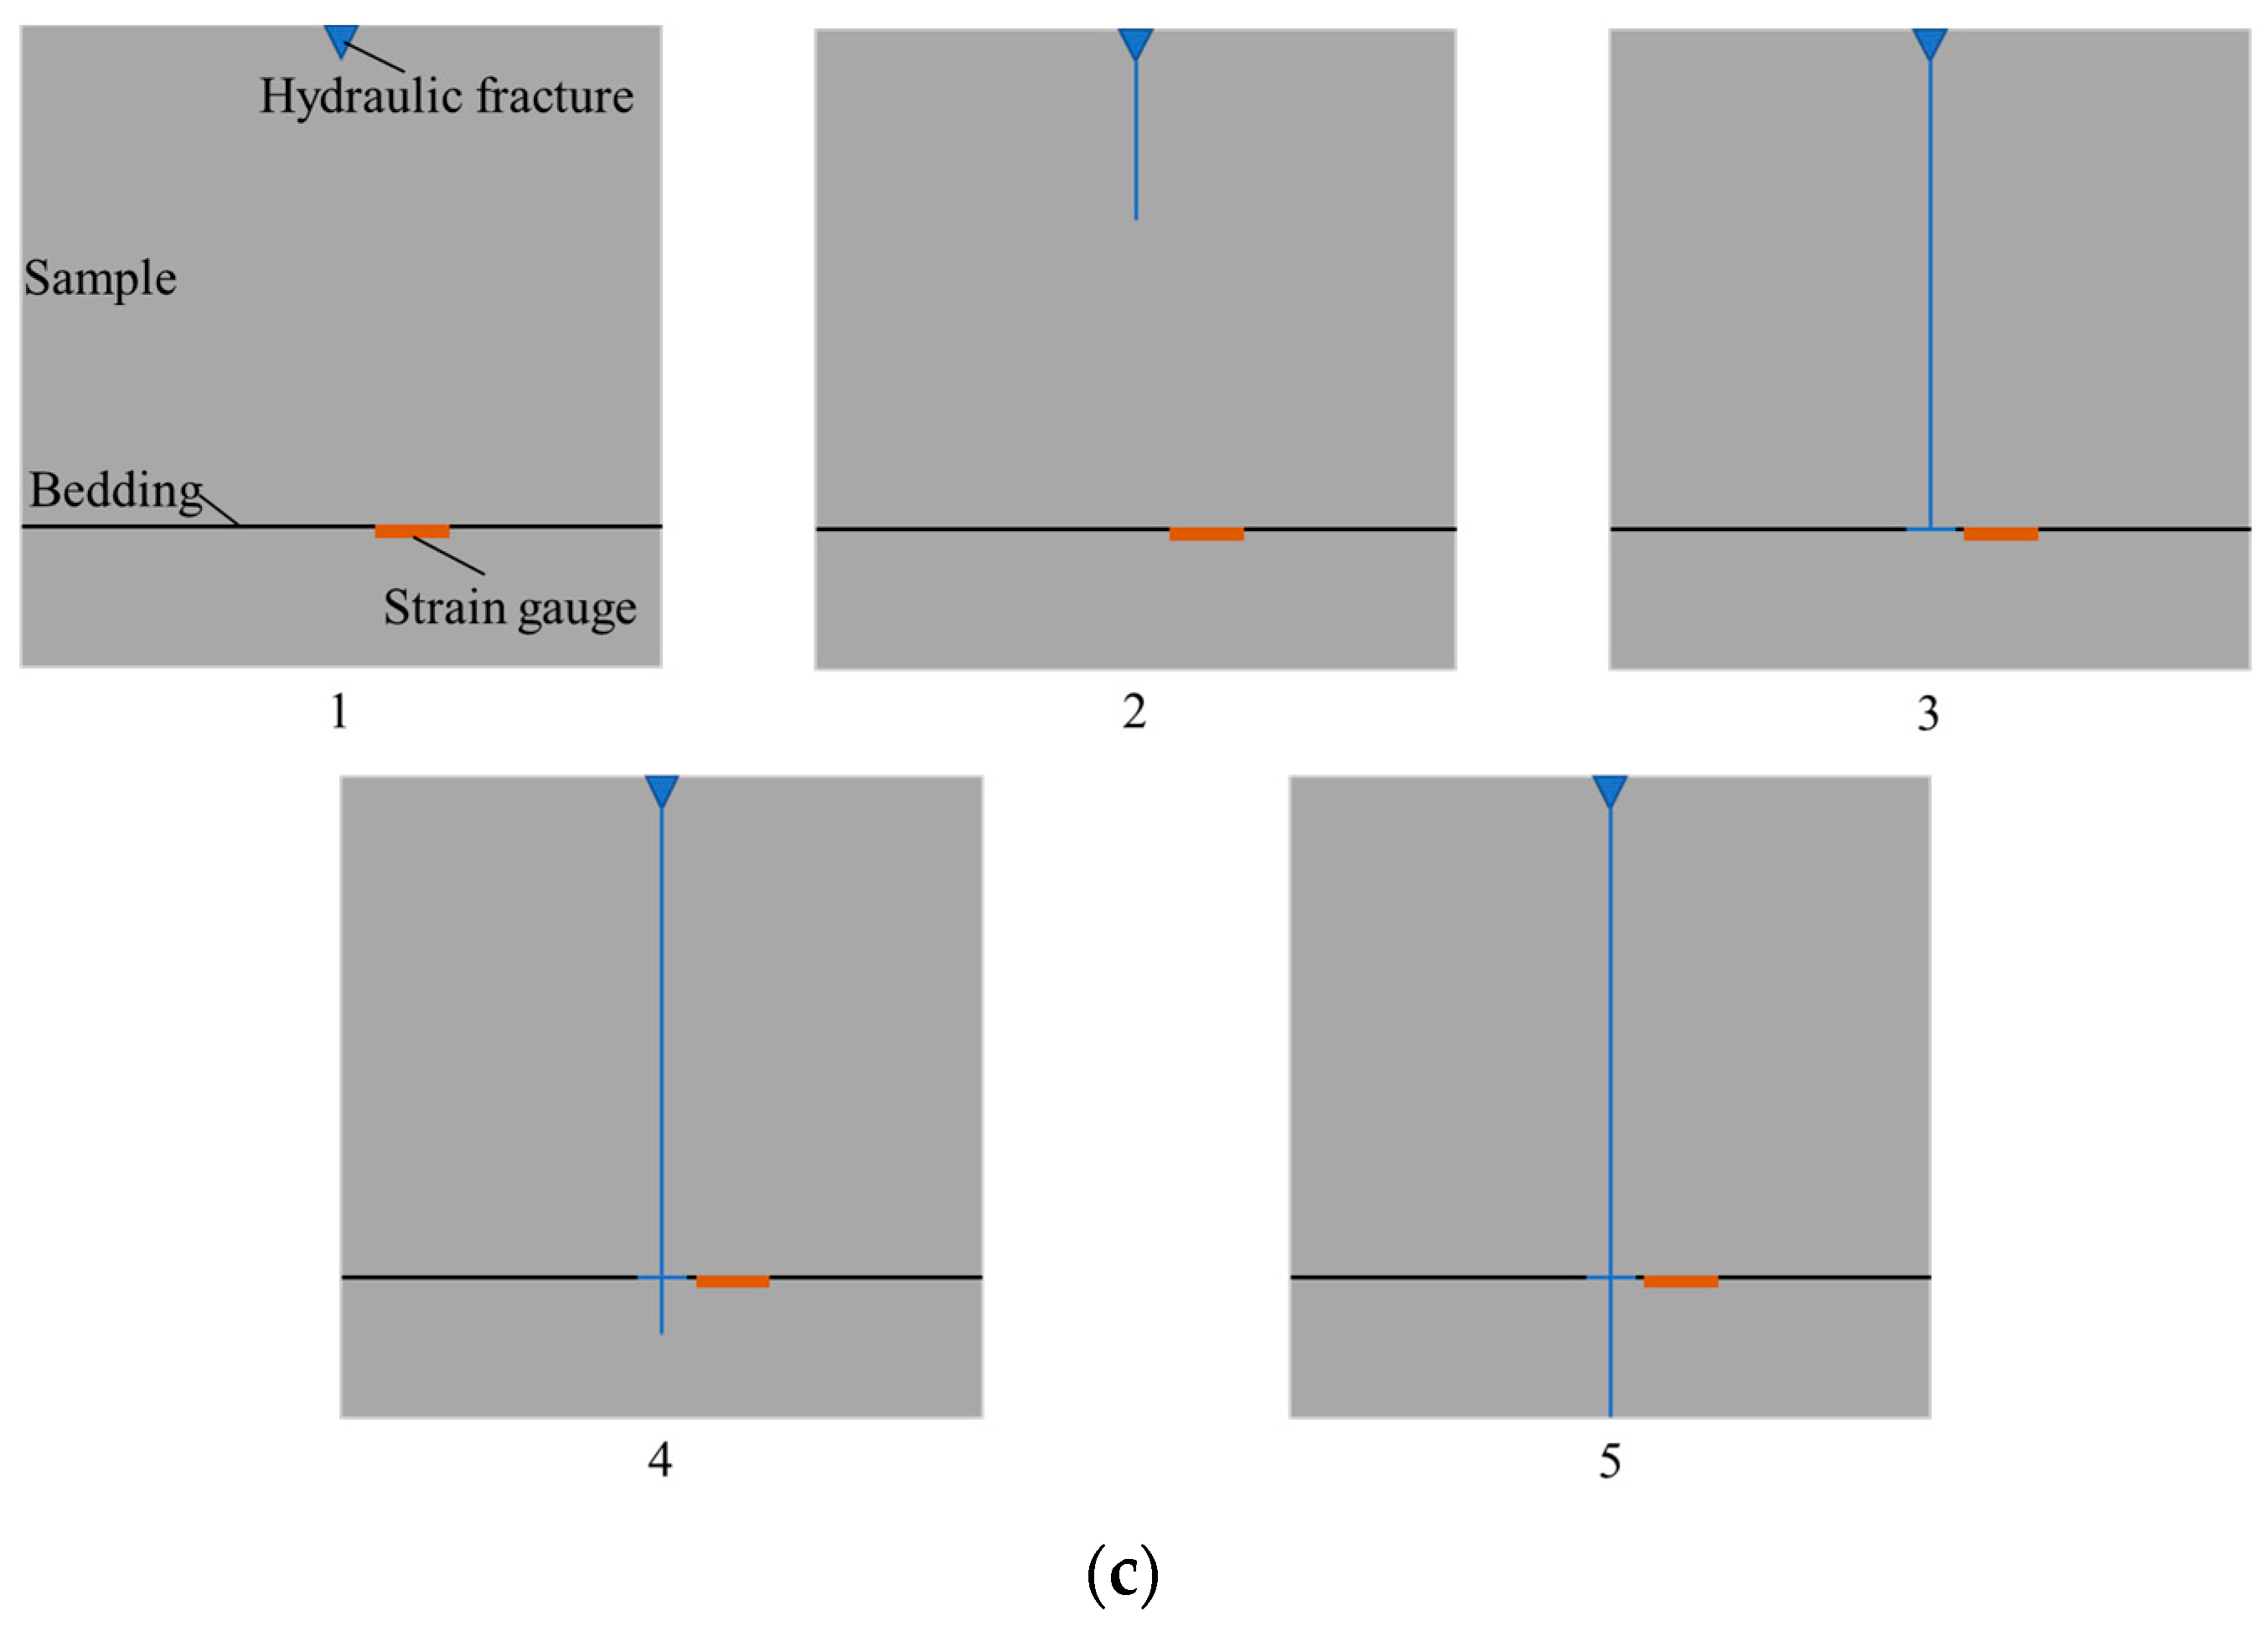
The resistance strain gauges were placed on the upper and lower bedding plane to monitor the deformation of the rock mass around the perforation and fracture propagation path during fracturing. The strain gauge arrangement pattern with cluster spacing of 60 mm is shown in Figure 9. A total of 18 strain gauges were arranged in three rows on each bedding surface with 30 mm between two adjacent ones. Similarly, a total of 15 strain gauges were placed after decreasing the cluster spacing to 30 mm.
In this section, the No. 3 strain gauge on the lower bedding plane in Test 3 is selected for analysis. The strain gauge was located on the right side of CF-1 after fracturing. The pressure curve, strain curve, and fracture propagation process are shown in Figure 10. The strain response characteristics corresponded with the initiation and propagation of CF-1, which are divided into five stages:
(1).
The strain curve raised slightly with the pressure increased. The reason is that the fracturing fluid was injected into the wellbore and gathered at the perforation cluster, causing the deformation of the rock mass and the strain gauge was in tension.
(2).
The hydraulic fracture initiated at the perforation cluster and propagated toward the bedding plane. The smaller the distance from the fracture to the bedding plane, the bigger the induced tensile stress on the bedding and the increased value of strain. When the fracture reached the bedding plane, a strain peak formed. If the peak point of the pressure curve is considered as the starting point of hydraulic fracture propagation, the culmination point of the strain curve is considered as the end point. It can be observed the time for CF-1 to extend from the perforation cluster position to the bedding plane was approximately 4 s.
(3).
The fracturing fluid collected and spread along both sides of the bedding surface. The strain gauges in the tensile state rebounded slightly and the strain value decreased due to the relative shear slip of the rock mass on both sides of the bedding plane. With the cumulative pressure, another pressure peak was appeared indicating the fracture penetrated the bedding to continue to expand.
(4).
After penetrating the bedding, the fracture propagated toward to the boundary of the sample. The strain value maintained a decreasing trend and finally formed a minimum value owing to the strain gauge was subjected to lateral compression by the opening hydraulic fracture. The time for CF-1 to propagate from the perforation cluster to the boundary of the specimen was about 19 s.
(5).
After the fracture propagated to the boundary of the sample, a stable fracture channel gradually formed. As a result, the pressure and the width of the fracture gradually decreased and stabilized. The strain value increased first and then stabilized due to the lateral compression of the strain gauge gradually weakened.
Liang et al. [36] arranged strain gauges in the hydraulic fracturing area of raw coal and briquette to obtain the borehole wall strain curve of the fracturing process which can effectively reflect the deformation and failure of the borehole wall. Their research suggested that the combination of acoustic emission and strain monitoring methods provides a choice for clarifying the mechanism of fracture initiation and instability near the hydraulic fracturing wellbore. One strain gauge was used in their experiments; however, multiple strain gauges were used in our experiments. Due to the preparation of the sample and the stress loading process, there is no guarantee that each strain gauge in the fracturing process can work normally. Therefore, improving the utilization rate of the strain gauge is a consideration. Furthermore, it is worth considering how to use strain gauges in natural samples to obtain additional fracturing information.

4. Conclusions

In this study, a physical simulation experimental system for the initiation and propagation of multi-cluster hydraulic fractures was developed. We also improved the experimental method by designing a multi-channel fracturing wellbore and a composite wrapped layered artificial sample. Several groups of true tri-axial fracturing tests were performed under different factors. The following conclusions were obtained:
(1).
Two initiation patterns among multiple hydraulic fractures were observed. For simultaneous initiation, the breakdown pressure of the subsequent fracture was lower than or equal to the value of the previous fracture, and the fracturing fluid was injected into multiple channels simultaneously but not evenly distributed. For successive initiation, the subsequent breakdown pressures were gradually increasing, and the fracturing fluid only entered a single channel due to a dominant fracture.
(2).
With the simultaneous initiation, the interaction between the fractures was usually attraction. For successive initiation, the subsequent fracture tended to intersect with or deviated from the previous fracture. The interaction was aggravated by the decrease of horizontal stress difference, bedding number and cluster spacing, and weakened by the increase of pumping rates.
(3).
As the horizontal stress difference increased, the total area of multiple fractures also increased. By increasing the pump rates, the total area of multiple fractures propagation increased 60%. With the decrease of cluster spacing, hydraulic fracture initiated and propagated at only one perforation clusters, suggesting that the reasonable pump rates and cluster spacing should be adopted on-site fracturing.
(4).
The strain response characteristics corresponded with the initiation and propagation of fracture, which was conducive to understanding the fracturing process. In Test 3, the time for hydraulic fracture to propagate from the perforation cluster position to the bedding plane was approximately 4 s. Similarly, the time for fracture to propagate from the perforation cluster position the boundary of the specimen was about 19 s in Test 3.
(5).
In this experiment, the simultaneous initiation of multiple fractures could not be observed every time due to the size of the sample. Although the artificial sample is similar to shale in brittleness, it is not as bedding rich as shale, so that the effect of the multiple bedding cannot be explored. The physical simulation test which is more suitable for the field will be carried out in the future. Simulating different cluster numbers and spacings in the real rock, the influencing factors of the unbalanced expansion of multiple fractures will be explored.

Author Contributions

Conceptualization, Z.B. and X.C.; methodology, Y.G.; software, H.Y.; validation, L.W., Y.G.; formal analysis, Z.B.; investigation, J.Z.; resources, X.C.; data curation, J.Z.; writing—original draft preparation, Z.B.; writing—review and editing, L.W. and Y.G.; visualization, H.Y.; supervision, L.W.; project administration, Y.G.; funding acquisition, L.W. All authors have read and agreed to the published version of the manuscript.

Funding

This work was sponsored by the ‘‘Project of Science and Technology Department of Sinopec’’ (No. P21056), the “National Natural Science Foundation of China” (No. 51809259), the “CAS Pioneer Hundred Talents Program” (Y826031C01).

Institutional Review Board Statement

Not applicable.

Informed Consent Statement

Not applicable.

Conflicts of Interest

The authors declare no conflict of interest.

References

  1. King, G.E. Thirty years of gas-shale fracturing: What have we learned? J. Pet. Technol. 2010, 62, 88–90. [Google Scholar] [CrossRef]
  2. King, G.E. 60 years of multi-fractured vertical, deviated and horizontal wells: What have we learned? In Proceedings of the SPE Annual Technical Conference and Exhibition, Amsterdam, The Netherlands, 27–29 October 2014; Volume 7, pp. 4894–4925. [Google Scholar]
  3. Lim, P.; Goddard, P.; Sink, J.; Abou-Sayed, I. Hydraulic fracturing: A marceiius case study of an engineered staging completion based on rock properties. SPE Can. Unconv. Resour. Conf. 2014, 1, 634–644. [Google Scholar] [CrossRef]
  4. Cheng, Y. Mechanical interaction of multiple fractures-exploring impacts of the selection of the spacing/number of perforation clusters on horizontal shale-gas wells. SPE J. 2012, 17, 992–1001. [Google Scholar] [CrossRef]
  5. Yew, C.H.; Weng, X. Stress shadow. Mech. Hydraul. Fract. 2015, 177–196. [Google Scholar] [CrossRef]
  6. Miller, C.; Waters, G.; Rylander, E. Evaluation of production log data from horizontal wells drilled in organic shales. In Proceedings of the North American Unconventional Gas Conference and Exhibition, The Woodlands, TX, USA, 14–16 June 2011; pp. 623–645. [Google Scholar] [CrossRef]
  7. Cipolla, C.; Lewis, R.; Maxwell, S.; Mack, M. Appraising unconventional resource plays: Separating reservoir quality from completion effectiveness. In Proceedings of the SPE Asia Pacific Oil & Gas Conference and Exhibition, Perth, Australia, 22–24 October 2012; pp. 1–27. [Google Scholar] [CrossRef]
  8. Gustavo, A.U.C.; Huckabee, P.T.; Molenaar, M.M.; Wyker, B.; Somanchi, K. Perforation cluster efficiency of cemented plug and perf limited entry completions; insights from fiber optics diagnostics. In Proceedings of the SPE Hydraulic Fracturing Technology Conference, The Woodlands, TC, USA, 9–11 February 2016. [Google Scholar]
  9. Somanchi, K.; Huckabee, P.; Ugueto, G. Insights and observations into limited entry perforation dynamics from fiber-optic diagnostics. In Proceedings of the Unconventional Resources Technology Conference, San Antonio, TX, USA, 1–3 August 2016. [Google Scholar] [CrossRef]
  10. Sookprasong, P.A.; Hurt, R.S.; Gill, C.C.; Lafollette, R.F. Fiber optic DAS and DTS in Multicluster, multistage horizontal well fracturing: Interpreting hydraulic fracture initiation and propagation through diagnostics. In Proceedings of the SPE Annual Technical Conference and Exhibition, Amsterdam, The Netherlands, 27–29 October 2014; Volume 3, pp. 1991–2005. [Google Scholar] [CrossRef]
  11. Lecampion, B.; Desroches, J.; Weng, X.; Burghardt, J.; Brown, J.E.E. Can we engineer better multistage horizontal completions? Evidence of the importance of near-wellbore fracture geometry from theory, lab and field experiments 2015. In Proceedings of the SPE Hydraulic Fracturing Technology Conference, The Woodlands, TX, USA, 3–5 February 2015. [Google Scholar]
  12. Elbel, J.L.; Piggott, A.R.; Mack, M.G. Numerical modeling of multilayer fracture treatments. In Proceedings of the Permian Basin Oil and Gas Recovery Conference, Midland, TX, USA, 18–20 March 1992; pp. 401–408. [Google Scholar] [CrossRef]
  13. Yamamoto, K.; Shimamoto, T.; Sukemura, S. Multiple fracture propagation model for a three-dimensional hydraulic fracturing simulator. Int. J. Geomech. 2004, 4, 46–57. [Google Scholar] [CrossRef]
  14. Olson, J.E. Multi-fracture propagation modeling: Applications to hydraulic fracturing in shales and tight gas sands. In Proceedings of the The 42nd U.S. Rock Mechanics Symposium (USRMS), San Francisco, CA, USA, 29 June–2 July 2008. [Google Scholar]
  15. Wu, K. Simultaneous multi-frac treatments: Fully coupled fluid flow and fracture mechanics for horizontal wells. In Proceedings of the SPE Annual Technical Conference and Exhibition, New Orleans, LA, USA, 30 September–2 October 2013; Volume 7, pp. 5444–5457. [Google Scholar] [CrossRef]
  16. Olson, J.E.; Wu, K. Sequential versus simultaneous multi-zone fracturing in horizontal wells: Insights from a non-planar, multi-frac numerical model. In Proceedings of the SPE Hydraulic Fracturing Technology Conference, The Woodlands, TX, USA, 6–8 February 2012; pp. 737–751. [Google Scholar] [CrossRef]
  17. Olson, J.E. Predicting fracture swarms—The influence of subcritical crack growth and the crack-tip process on joint spacing in rock. Geol. Soc. Spec. Publ. 2004, 231, 73–87. [Google Scholar] [CrossRef]
  18. Sun, Z.; Liu, C.; Huang, Z.; Zhang, R. Mechanical interaction of multiple 3D fractures propagation for network fracturing. In Proceedings of the SPE Asia Pacific Unconventional Resources Conference and Exhibition, Brisbane, Australia, 9–11 November 2015. [Google Scholar] [CrossRef]
  19. Ren, X.; Zhou, L.; Li, H.; Lu, Y. A three-dimensional numerical investigation of the propagation path of a two-cluster fracture system in horizontal wells. J. Pet. Sci. Eng. 2019, 173, 1222–1235. [Google Scholar] [CrossRef]
  20. Liu, X.; Qu, Z.; Guo, T.; Sun, Y.; Wang, Z.; Bakhshi, E. Numerical simulation of non-planar fracture propagation in multi-cluster fracturing with natural fractures based on lattice methods. Eng. Fract. Mech. 2019, 220, 106625. [Google Scholar] [CrossRef]
  21. Liu, X.; Rasouli, V.; Guo, T.; Qu, Z.; Sun, Y.; Damjanac, B. Numerical simulation of stress shadow in multiple cluster hydraulic fracturing in horizontal wells based on lattice modelling. Eng. Fract. Mech. 2020, 238, 107278. [Google Scholar] [CrossRef]
  22. Sun, T.; Zeng, Q.; Xing, H. A model for multiple hydraulic fracture propagation with thermo-hydro-mechanical coupling effects. Energies 2021, 14, 894. [Google Scholar] [CrossRef]
  23. El Rabaa, W. Experimental study of hydraulic fracture geometry initiated from horizontal wells. In Proceedings of the SPE Annual Technical Conference and Exhibition, San Antonio, TX, USA, 8–11 October 1998; pp. 166–173. [Google Scholar] [CrossRef]
  24. Crosby, D.G.; Rahman, M.M.; Rahman, M.K.; Rahman, S.S. Single and multiple transverse fracture initiation from horizontal wells. J. Pet. Sci. Eng. 2002, 35, 191–204. [Google Scholar] [CrossRef]
  25. Zhou, J.; Zeng, Y.; Jiang, T.; Zhang, B. Laboratory scale research on the impact of stress shadow and natural fractures on fracture geometry during horizontal multi-staged fracturing in shale. Int. J. Rock Mech. Min. Sci. 2018, 107, 282–287. [Google Scholar] [CrossRef]
  26. Zheng, H.; Pu, C.; Wang, Y.; Sun, C. Experimental and numerical investigation on influence of pore-pressure distribution on multi-fractures propagation in tight sandstone. Eng. Fract. Mech. 2020, 230, 106993. [Google Scholar] [CrossRef]
  27. Zhang, Z.; Zhang, S.; Zou, Y.; Ma, X.; Li, N.; Liu, L. Experimental investigation into simultaneous and sequential propagation of multiple closely spaced fractures in a horizontal well. J. Pet. Sci. Eng. 2021, 202, 108531. [Google Scholar] [CrossRef]
  28. Zhou, Z.L.; Zhang, G.Q.; Xing, Y.K.; Fan, Z.Y.; Zhang, X.; Kasperczyk, D. A laboratory study of multiple fracture initiation from perforation clusters by cyclic pumping. Rock Mech. Rock Eng. 2019, 52, 827–840. [Google Scholar] [CrossRef]
  29. Bunger, A.P.; Jeffrey, R.G.; Kear, J.; Zhang, X.; Morgan, M. Experimental investigation of the interaction among closely spaced hydraulic fractures. In Proceedings of the 45th US Rock Mechanics/Geomechanics Symposium, San Francisco, CA, USA, 26–29 June 2011. [Google Scholar]
  30. Liu, N.; Zhang, Z.; Zou, Y.; Ma, X.; Zhang, Y. Propagation law of hydraulic fractures during multi-staged horizontal well fracturing in a tight reservoir. Pet. Explor. Dev. 2018, 45, 1059–1068. [Google Scholar] [CrossRef]
  31. Wei, J.; Huang, S.; Hao, G.; Li, J.; Zhou, X.; Gong, T. A multi-perforation staged fracturing experimental study on hydraulic fracture initiation and propagation. Energy Explor. Exploit. 2020, 38, 2466–2484. [Google Scholar] [CrossRef]
  32. Bi, Z.; Wang, L.; Yang, H.; Guo, Y.; Zhou, J.; Chang, X.; Yang, C. Development and verification of physical simulation experiment system for initiation and propagation of multiple clusters of hydraulic fractures. Chin. J. Rock Mech. Eng. 2021, in press. [Google Scholar]
  33. Guo, Y.; Wang, L.; Chang, X.; Zhou, J.; Zhang, X. Study on fracture morphological characteristics of refracturing for longmaxi shale formation. Geofluids 2020, 2020, 1628431. [Google Scholar] [CrossRef]
  34. Kim, C.M.; Abass, H.H. Hydraulic fracture initiation from horizontal wellbores: Laboratory experiments. In Proceedings of the The 32nd U.S. Symposium on Rock Mechanics (USRMS), Norman, OK, USA, 10–12 July 1991. [Google Scholar]
  35. Yang, Z.Z.; Yi, L.P.; Li, X.G.; He, W. Pseudo-three-dimensional numerical model and investigation of multi-cluster fracturing within a stage in a horizontal well. J. Pet. Sci. Eng. 2018, 162, 190–213. [Google Scholar] [CrossRef]
  36. Liang, Y.; Cheng, Y.; Zou, Q.; Wang, W.; Ma, Y.; Li, Q. Response characteristics of coal subjected to hydraulic fracturing: An evaluation based on real-time monitoring of borehole strain and acoustic emission. J. Nat. Gas Sci. Eng. 2017, 38, 402–411. [Google Scholar] [CrossRef]
Figure 1. Schematic of experimental equipment.
Energies 14 05357 g001
Figure 2. Physical map of experimental equipment: (a) large-scale true triaxial testing machine; (b) hydraulic fracturing pumping system; (c) acoustic emission system; (d) strain monitoring system; (e) multi-channel shunting system.
Energies 14 05357 g002
Figure 3. Composite wrapped layered sample: (a) cutaway view of sample structure; (b) preparation process.
Energies 14 05357 g003
Figure 4. The design of multi-channel fracturing wellbore: (a) schematic diagram structure; (b) physical map; (c) working diagram.
Energies 14 05357 g004
Figure 5. Flowchart of the experimental step.
Energies 14 05357 g005
Figure 6. Pressure, cumulative injection volume, and acoustic emission energy curves: (a) Test 1 (top: pressure curve; bottom: cumulative injection volume of each channel); (b) Test 2; (c) Test 6.
Energies 14 05357 g006
Figure 7. Pressure, cumulative injection volume, and acoustic emission energy curves: (a) Test 3 (top: pressure curve; bottom: cumulative injection volume of each channel); (b) Test 4; (c) Test 5.
Energies 14 05357 g007
Figure 8. Hydraulic fracture morphology of each cluster for all specimens: (a) Test 1; (b) Test 2; (c) Test 3; (d) Test 4; (e) Test 5; (f) Test 6.
Energies 14 05357 g008aEnergies 14 05357 g008bEnergies 14 05357 g008c
Figure 9. Arrangement pattern of resistance strain gauges (cluster spacing of 60 mm).
Energies 14 05357 g009
Figure 10. Pressure curve, strain curve and propagation diagram of CF-1 in Test 3: (a) pressure and strain curves; (b) local magnification of pressure and strain curves; (c) diagram of fracture propagation process.
Energies 14 05357 g010aEnergies 14 05357 g010b
Table 1. Mechanical properties of the artificial sample and shale.
CategoryUnconfined Compressive Strength (MPa)Young’s Modulus (GPa)Poisson’s RatioTensile Strength (MPa)
Artificial sample64.0711.980.165.08
Shale109.1025.500.1859.50
Table 2. Summary of experimental parameters.
TestIn-Situ Stress σv/σH/σh (MPa)Pump Rate (mL/min)Fluid Viscosity (mPa·s)Cluster Spacing (mm)Bedding Structure Adding Yes (Y) or No (N)
126/25/223010060Y
226/25/173010060Y
326/25/123010060Y
426/25/126010060Y
526/25/123010060N
626/25/123010030Y
Table 3. Experimental results of each test.
TestClusterInitiation SequenceBreakdown Pressure (MPa)Fracture Propagation Area/cm2
Test 11128.4387.31
23 (simultaneous)33.5259.11
32 (simultaneous)33.5493.36
Test 213 (simultaneous)19.4547.08
21 (simultaneous)25.30
32 (simultaneous)16.41188.92
Test 31125.51478.14
2229.8716.63
3331.0435.97
Test 41228.81254.35
2333.71249.13
3122.21706.77
Test 51333.81055.88
2128.2572.79
3230.0812.09
Test 611 (simultaneous)22.70
22 (simultaneous)22.71245.49
33 (simultaneous)18.40
Publisher’s Note: MDPI stays neutral with regard to jurisdictional claims in published maps and institutional affiliations.

