
Influence of Torrefaction Temperature and Climatic Chamber Operation Time on Hydrophobic Properties of Agri-Food Biomass Investigated Using the EMC Method


Abstract
1. Introduction
2. Materials and Methods
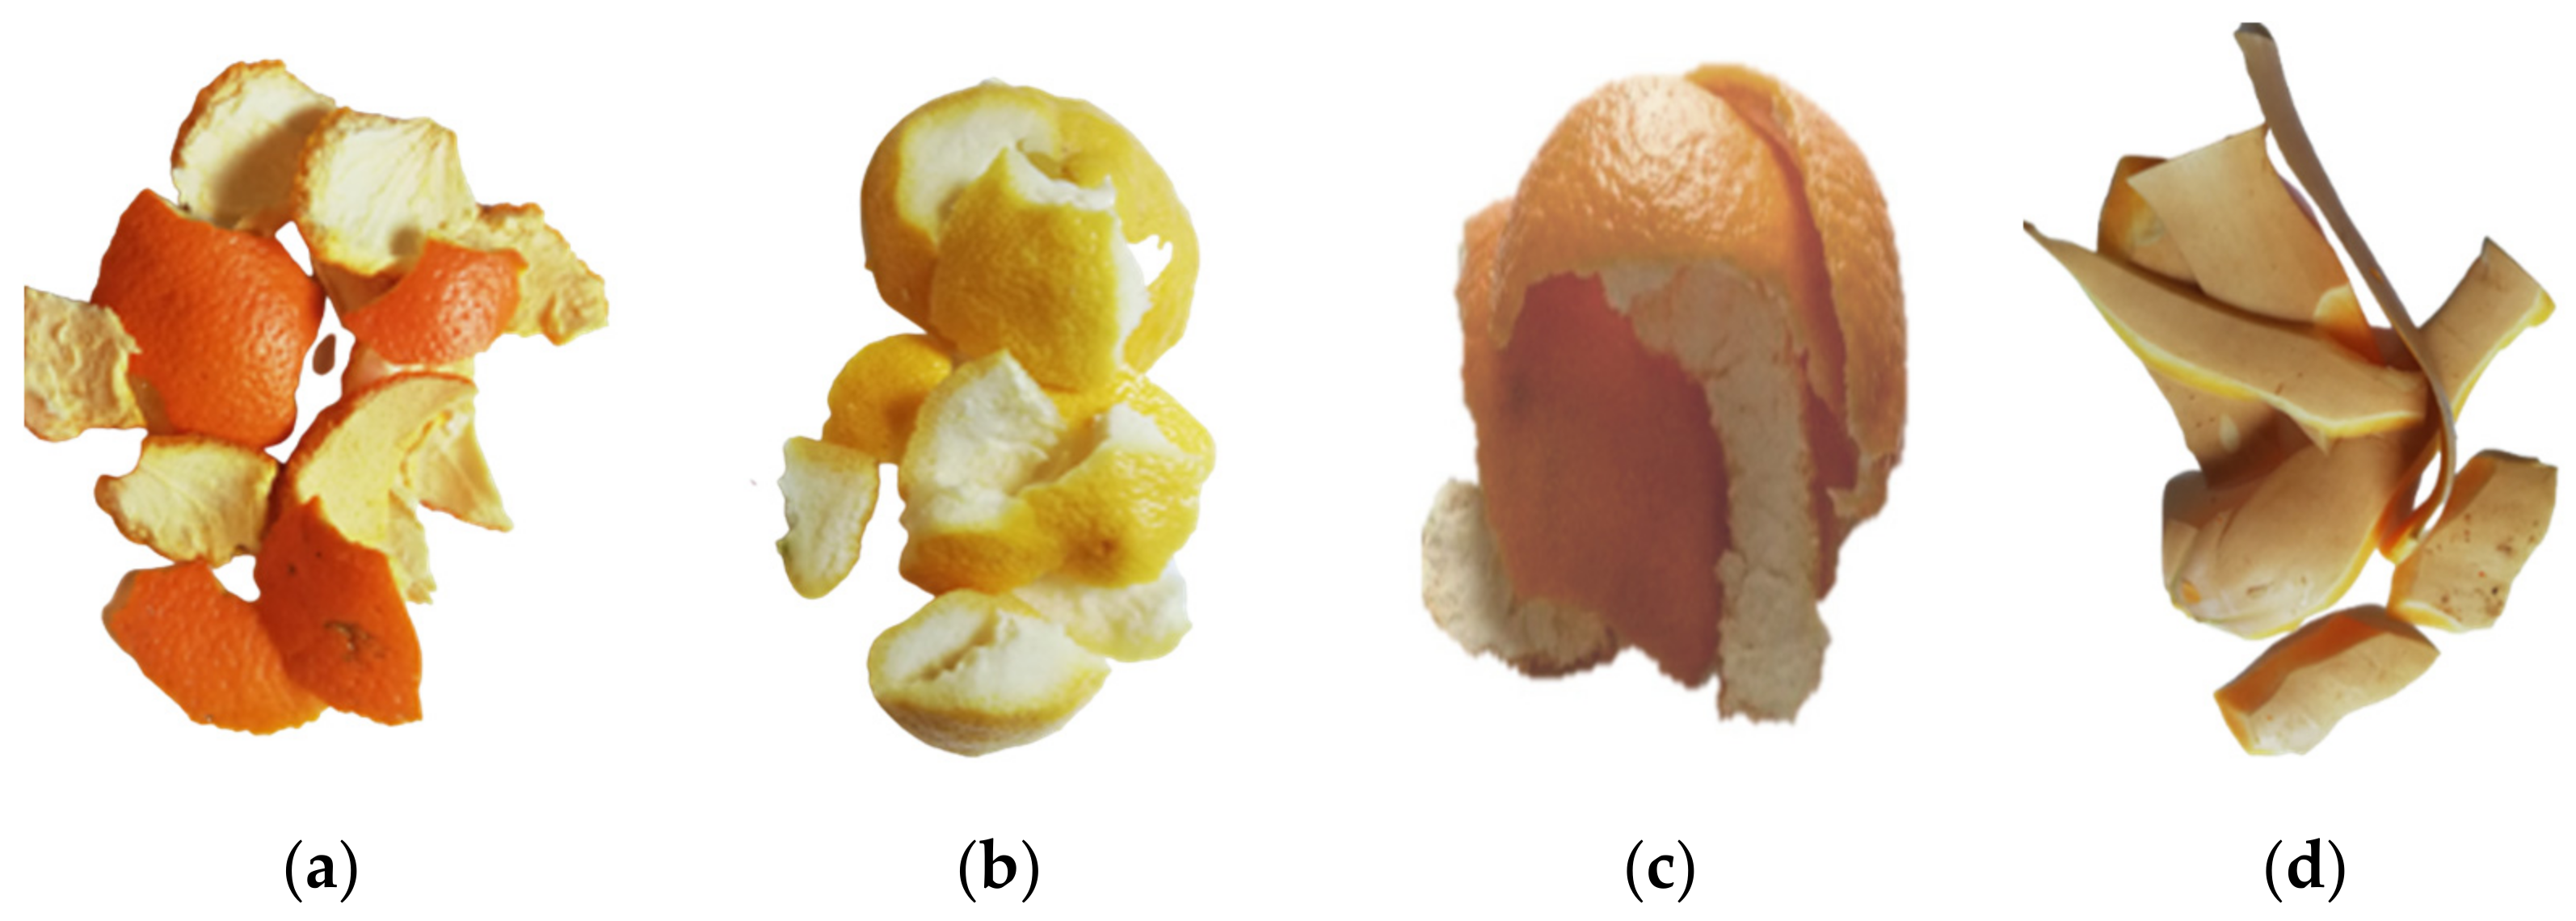
2.1. Materials
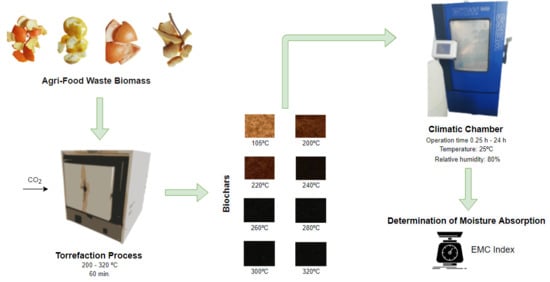
2.2. Samples Preparation and Torrefaction Procedure
2.3. Physical Properties Analysis
2.4. Hydrophobic Properties Analysis
2.5. Logarithmic Function Fitting (EMC Kinetics)
2.6. Statistical Analysis
3. Results and Discussion
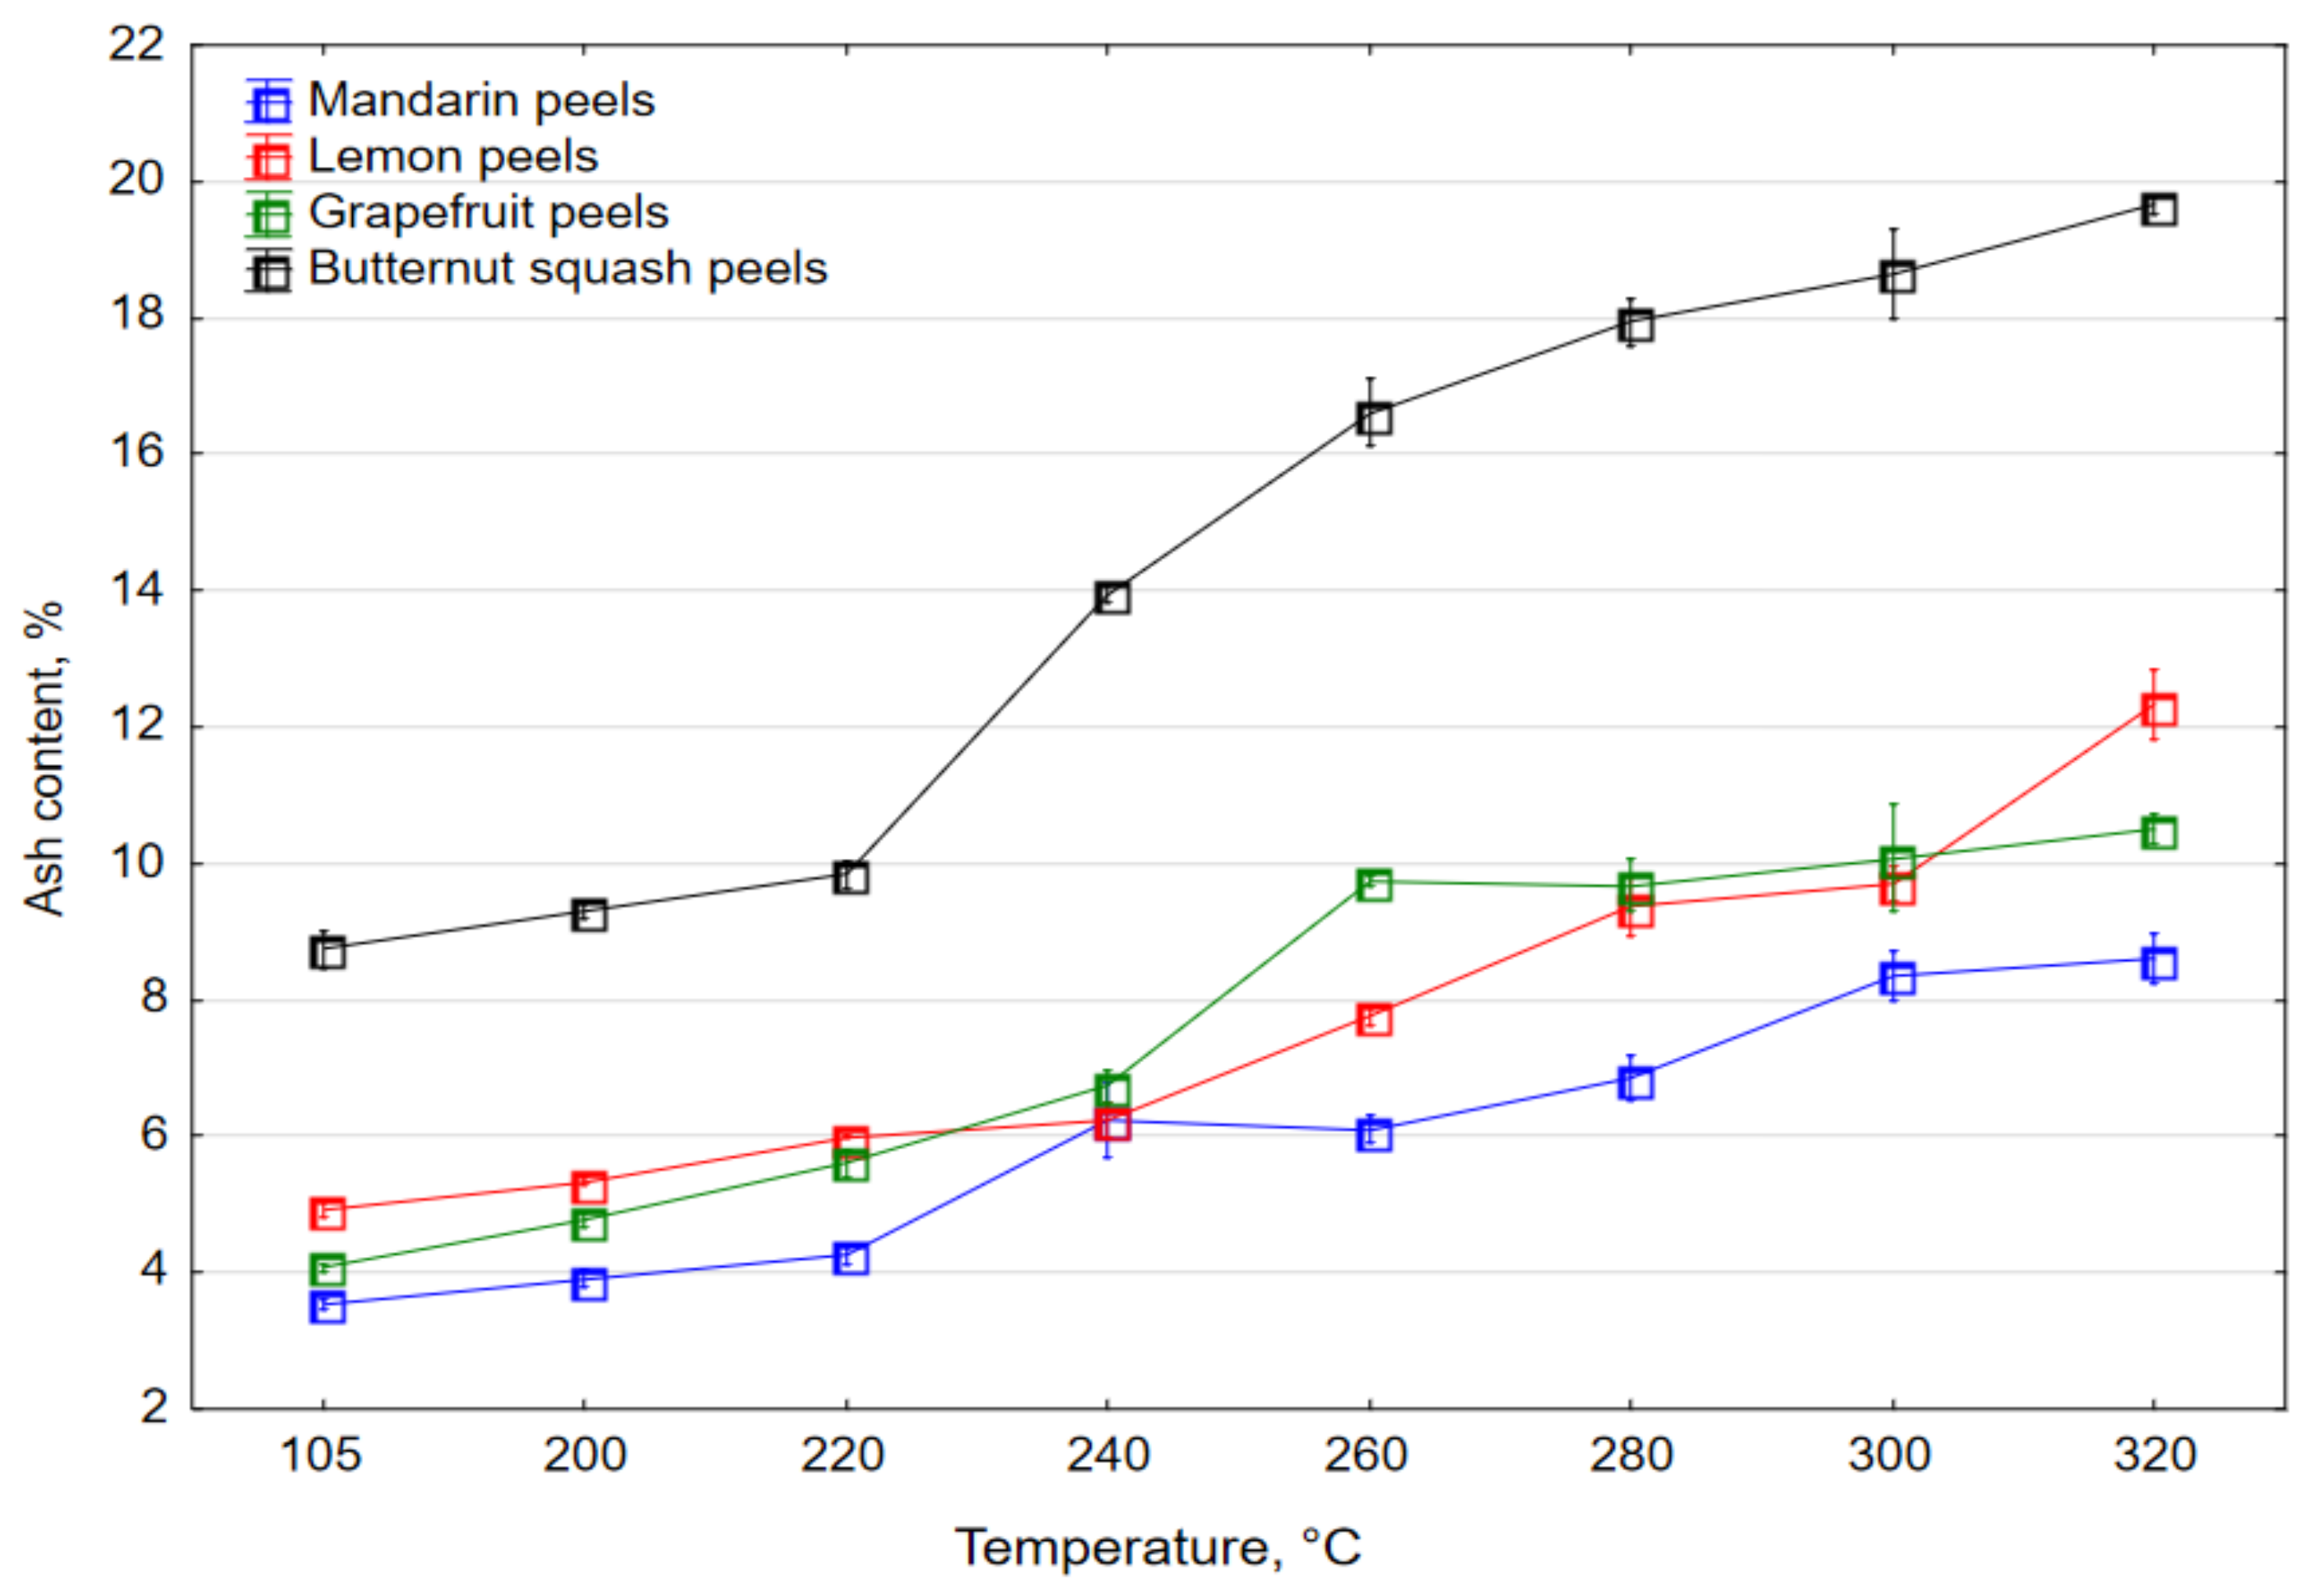
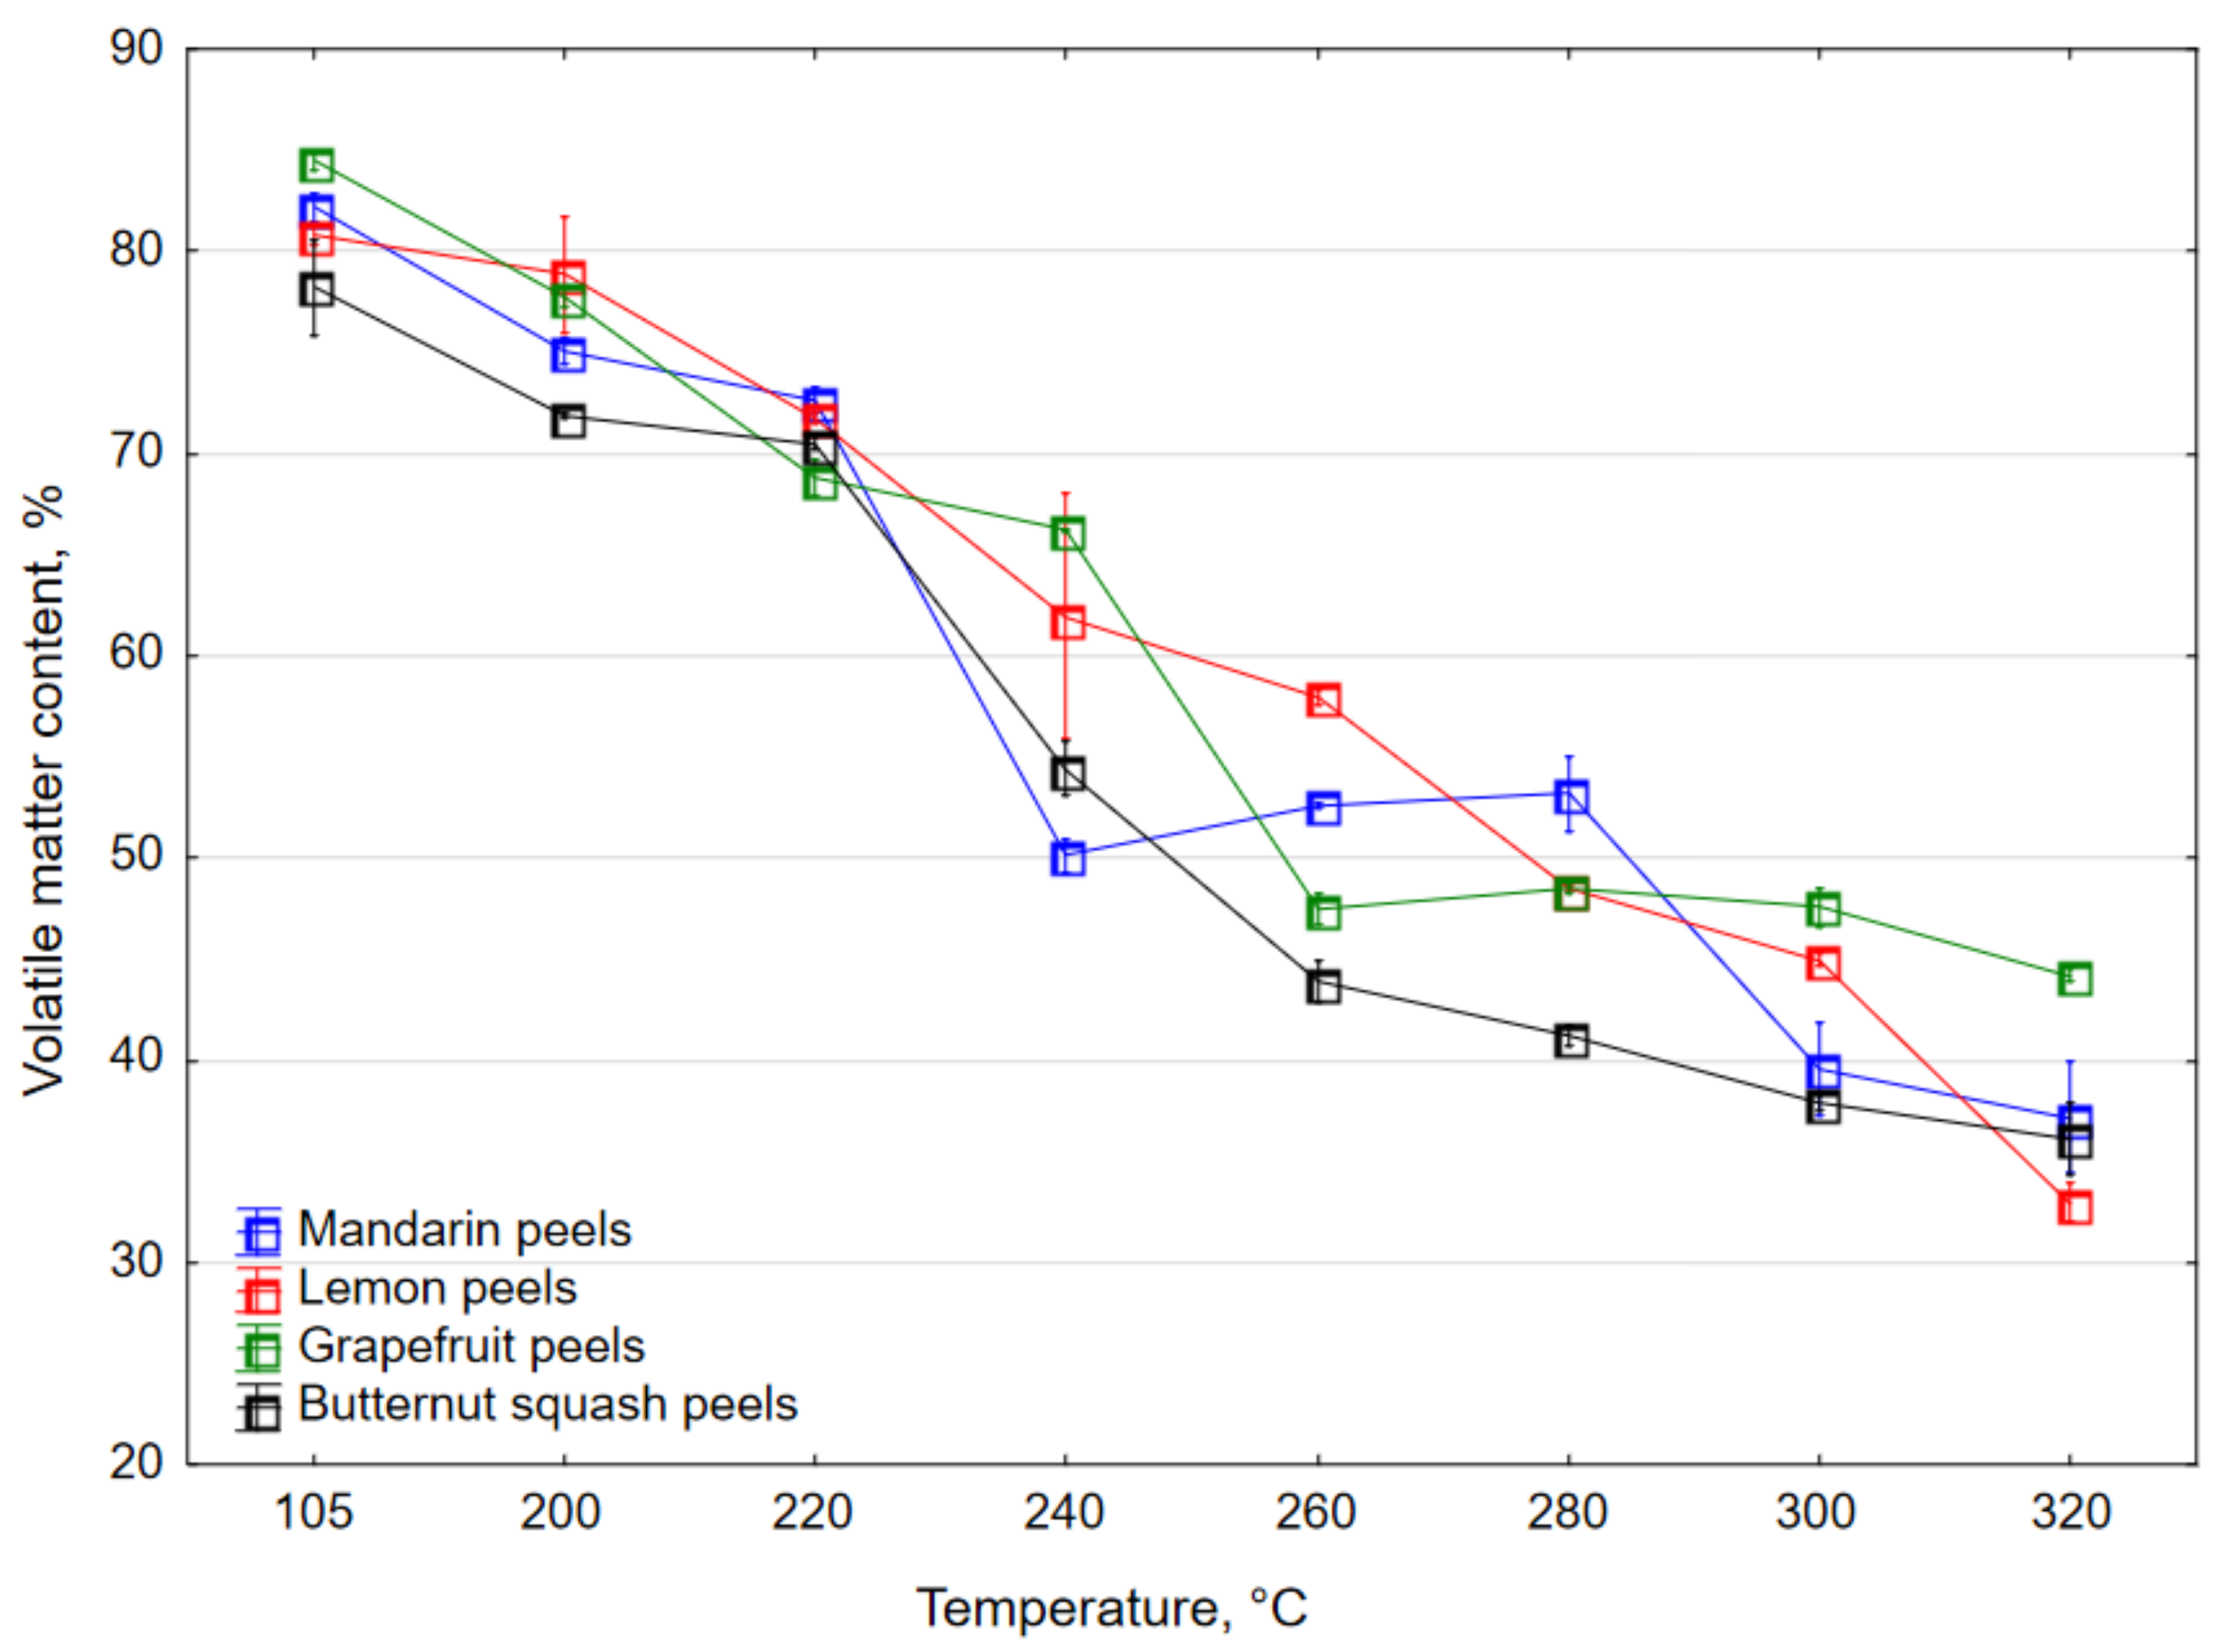
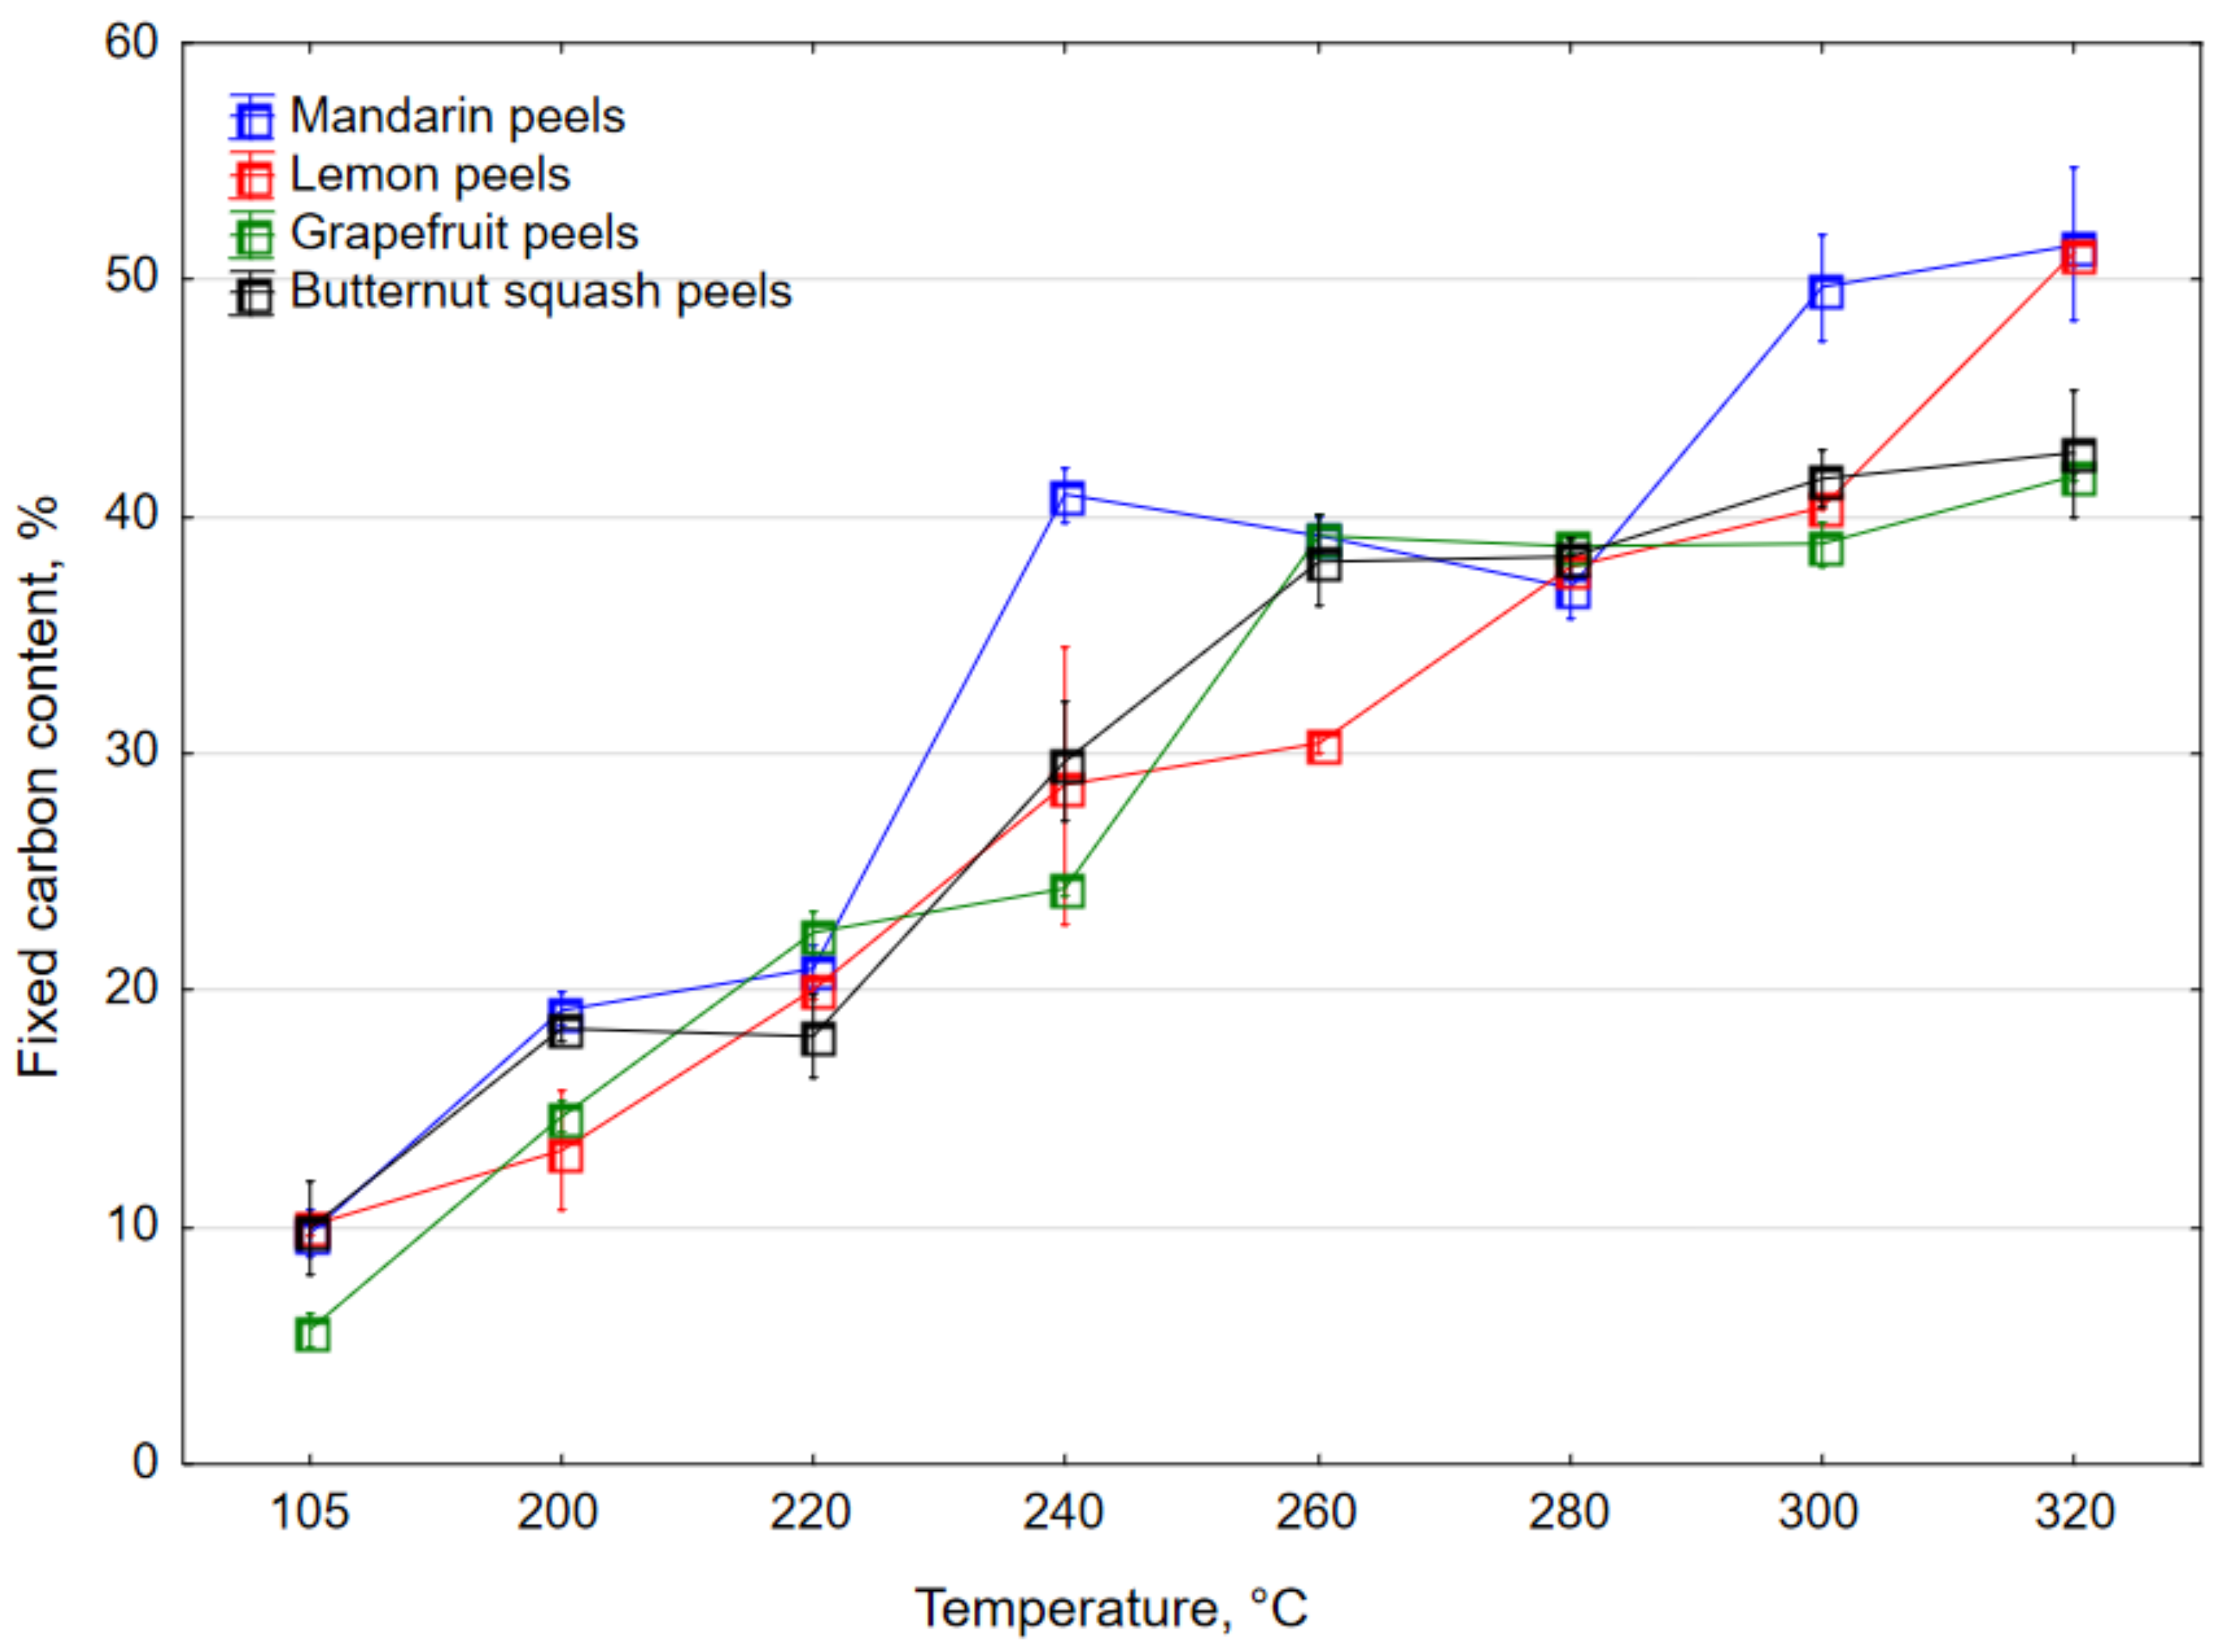
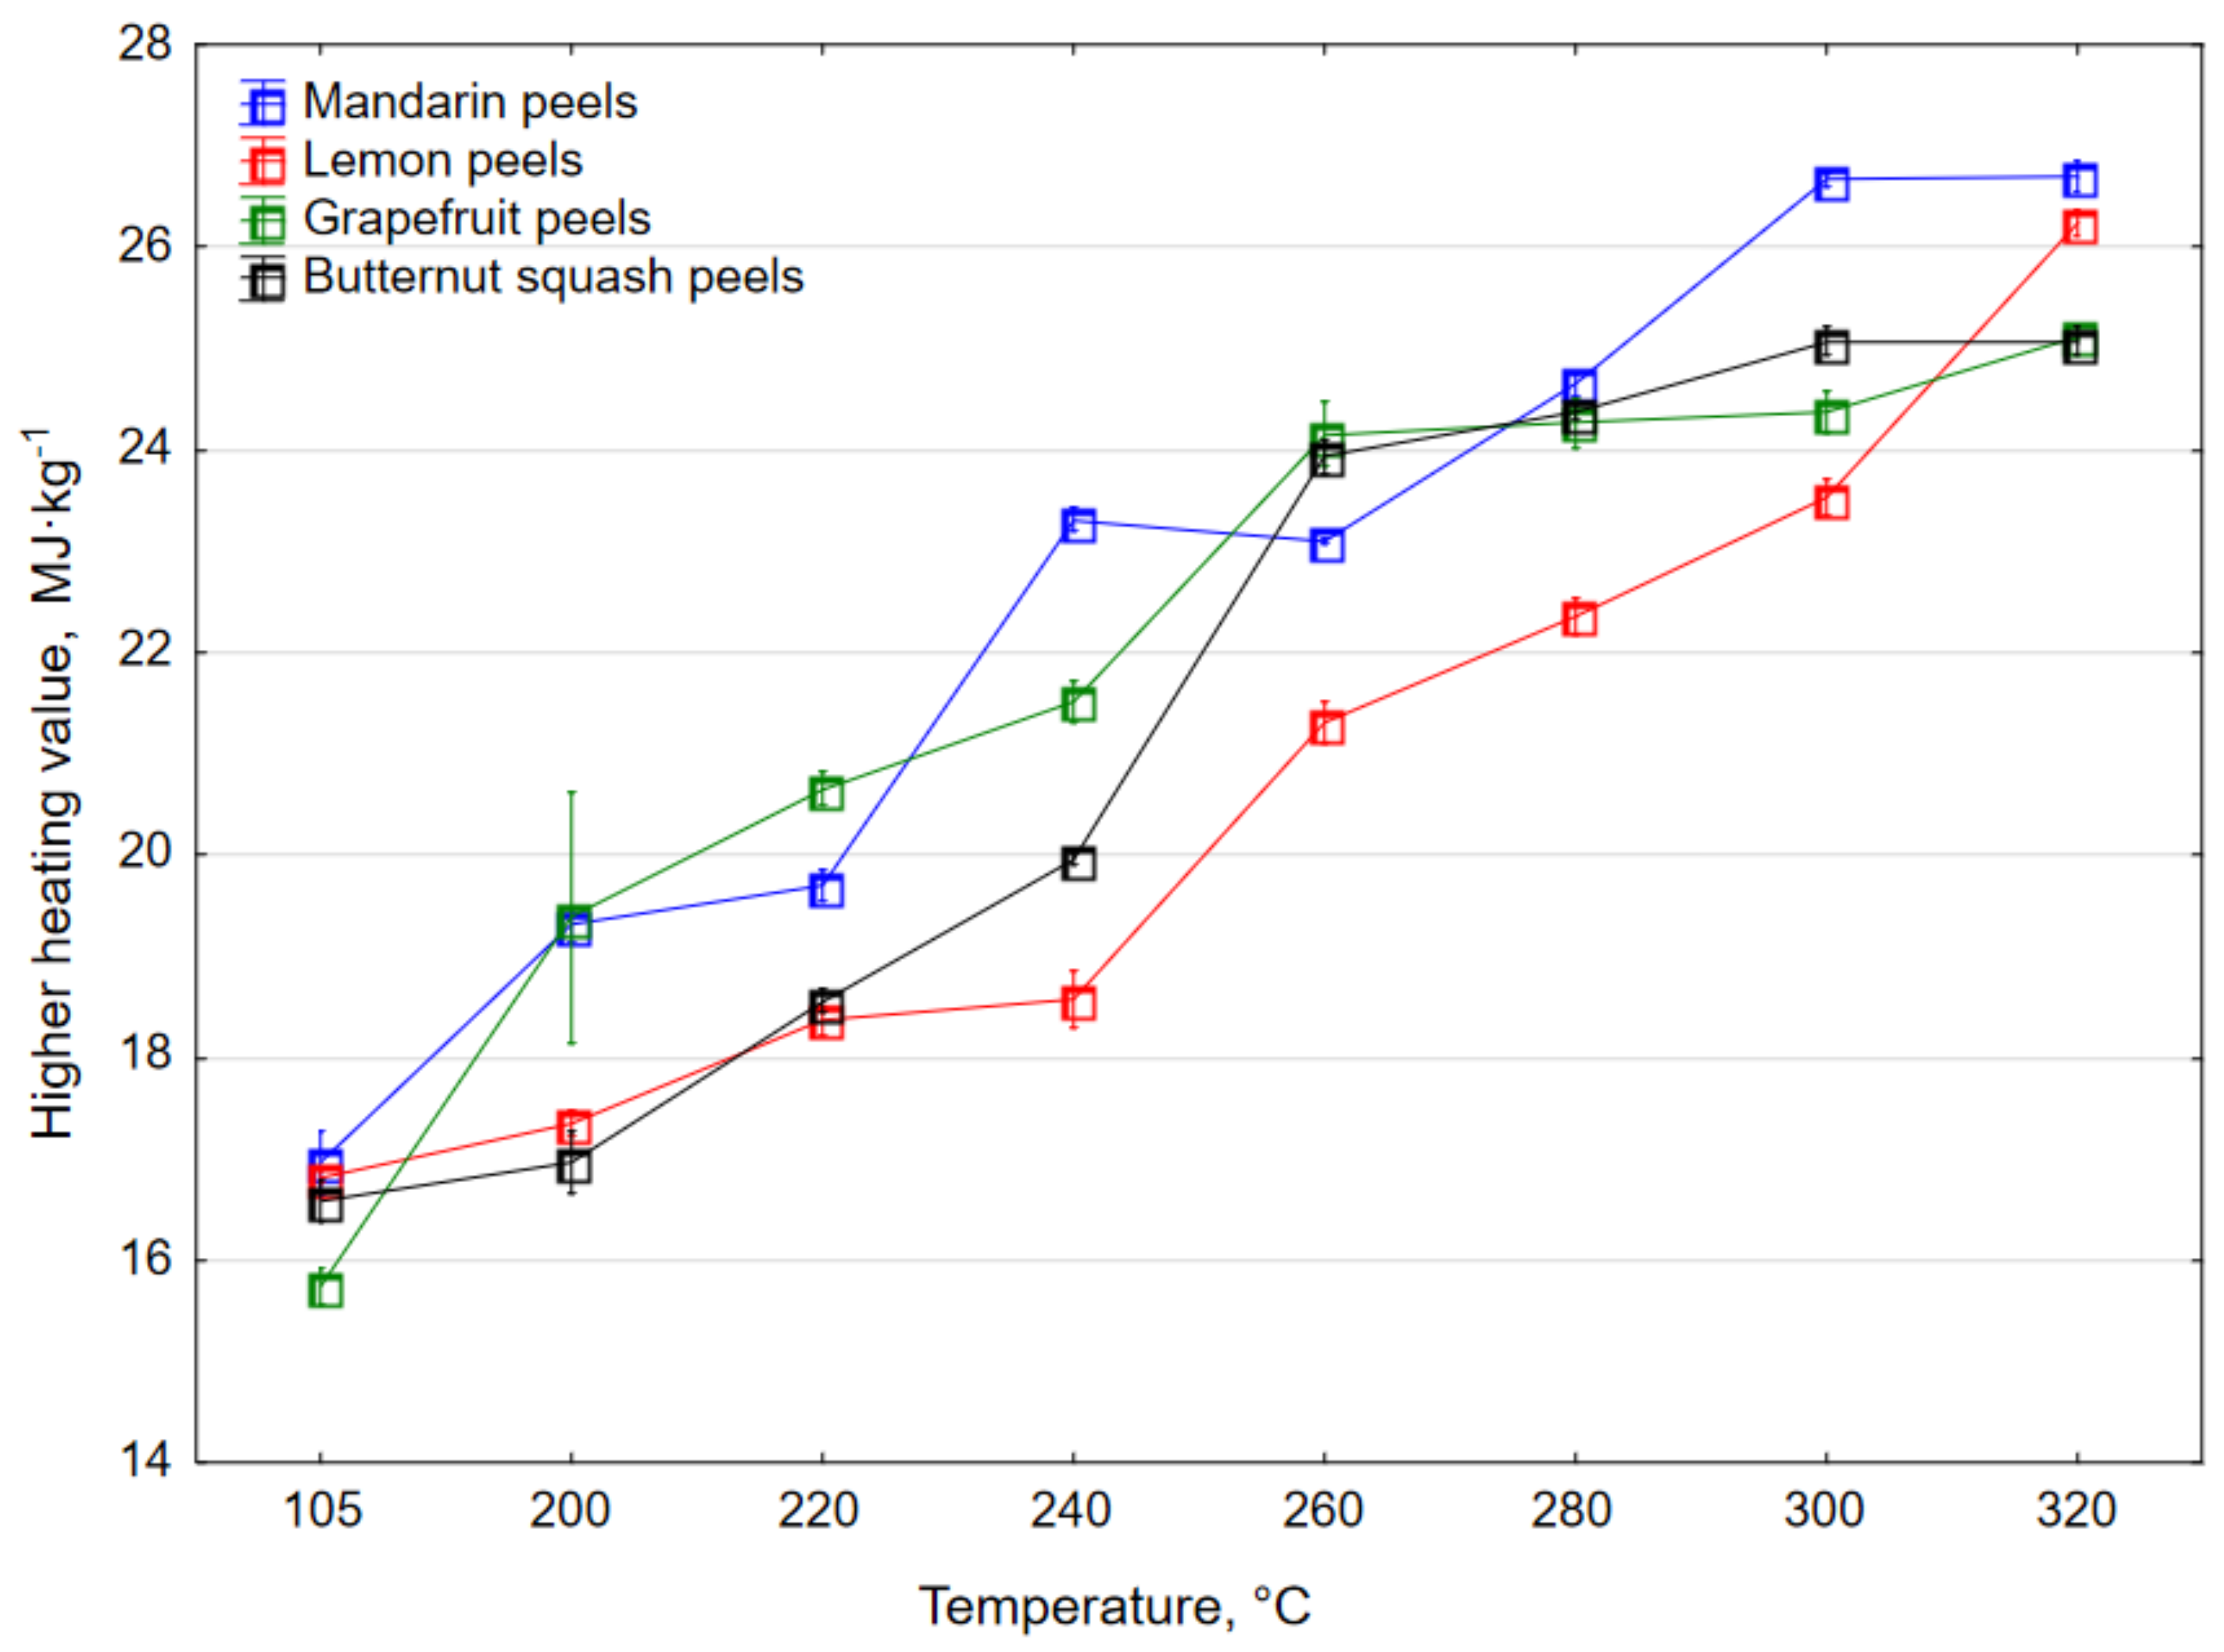
3.1. Proximate Analysis of the Torrefied Waste Biomass
3.2. Impact of the Torrefaction Temperature and Climatic Chamber Operation Time on Hydrophobic Properties
3.3. Trend Lines Parameters
3.4. Main Results of Statistical Analysis
4. Conclusions
Supplementary Materials
Author Contributions
Funding
Institutional Review Board Statement
Informed Consent Statement
Data Availability Statement
Conflicts of Interest
Appendix A

| 105 °C | 200 °C | 220 °C | 240 °C | 260 °C | 280 °C | 300 °C | 320 °C | |
|---|---|---|---|---|---|---|---|---|
| 105 °C | 0.000032 | 0.000032 | 0.000032 | 0.000032 | 0.000032 | 0.000032 | 0.000032 | |
| 200 °C | 0.000032 | 0.001419 | 0.000032 | 0.000032 | 0.000032 | 0.000032 | 0.000032 | |
| 220 °C | 0.000032 | 0.001419 | 0.000032 | 0.000032 | 0.000032 | 0.000032 | 0.000032 | |
| 240 °C | 0.000032 | 0.000032 | 0.000032 | 0.811593 | 0.000033 | 0.000071 | 0.056986 | |
| 260 °C | 0.000032 | 0.000032 | 0.000032 | 0.811593 | 0.001715 | 0.020818 | 0.811593 | |
| 280 °C | 0.000032 | 0.000032 | 0.000032 | 0.000033 | 0.001715 | 0.997598 | 0.196947 | |
| 300 °C | 0.000032 | 0.000032 | 0.000032 | 0.000071 | 0.020818 | 0.997598 | 0.606686 | |
| 320 °C | 0.000032 | 0.000032 | 0.000032 | 0.056986 | 0.811593 | 0.196947 | 0.606686 |
| 105 °C | 200 °C | 220 °C | 240 °C | 260 °C | 280 °C | 300 °C | 320 °C | |
|---|---|---|---|---|---|---|---|---|
| 105 °C | 0.000032 | 0.000032 | 0.000032 | 0.000032 | 0.000032 | 0.000032 | 0.000032 | |
| 200 °C | 0.000032 | 0.000032 | 0.000032 | 0.000032 | 0.000032 | 0.000032 | 0.028198 | |
| 220 °C | 0.000032 | 0.000032 | 0.019725 | 0.000032 | 0.538435 | 0.062399 | 0.000032 | |
| 240 °C | 0.000032 | 0.000032 | 0.019725 | 0.000032 | 0.000036 | 0.000032 | 0.000032 | |
| 260 °C | 0.000032 | 0.000032 | 0.000032 | 0.000032 | 0.000046 | 0.001866 | 0.000032 | |
| 280 °C | 0.000032 | 0.000032 | 0.538435 | 0.000036 | 0.000046 | 0.969003 | 0.000032 | |
| 300 °C | 0.000032 | 0.000032 | 0.062399 | 0.000032 | 0.001866 | 0.969003 | 0.000032 | |
| 320 °C | 0.000032 | 0.028198 | 0.000032 | 0.000032 | 0.000032 | 0.000032 | 0.000032 |
| 105 °C | 200 °C | 220 °C | 240 °C | 260 °C | 280 °C | 300 °C | 320 °C | |
|---|---|---|---|---|---|---|---|---|
| 105 °C | 0.000032 | 0.000032 | 0.000032 | 0.000032 | 0.000032 | 0.000032 | 0.000032 | |
| 200 °C | 0.000032 | 0.298847 | 0.320611 | 0.000032 | 0.000032 | 0.000032 | 0.027590 | |
| 220 °C | 0.000032 | 0.298847 | 0.000174 | 0.000032 | 0.000035 | 0.000038 | 0.982673 | |
| 240 °C | 0.000032 | 0.320611 | 0.000174 | 0.000032 | 0.000032 | 0.000032 | 0.000033 | |
| 260 °C | 0.000032 | 0.000032 | 0.000032 | 0.000032 | 0.326179 | 0.243517 | 0.000032 | |
| 280 °C | 0.000032 | 0.000032 | 0.000035 | 0.000032 | 0.326179 | 1.000000 | 0.000365 | |
| 300 °C | 0.000032 | 0.000032 | 0.000038 | 0.000032 | 0.243517 | 1.000000 | 0.000693 | |
| 320 °C | 0.000032 | 0.027590 | 0.982673 | 0.000033 | 0.000032 | 0.000365 | 0.000693 |
| 105 °C | 200 °C | 220 °C | 240 °C | 260 °C | 280 °C | 300 °C | 320 °C | |
|---|---|---|---|---|---|---|---|---|
| 105 °C | 0.000032 | 0.000032 | 0.000032 | 0.001633 | 0.000163 | 0.001633 | 0.000347 | |
| 200 °C | 0.000032 | 0.000236 | 0.066560 | 0.000084 | 0.000757 | 0.000032 | 0.000347 | |
| 220 °C | 0.000032 | 0.000236 | 0.000032 | 0.000032 | 0.000032 | 0.000032 | 0.000032 | |
| 240 °C | 0.000032 | 0.066560 | 0.000032 | 0.610168 | 0.914717 | 0.000032 | 0.837568 | |
| 260 °C | 0.001633 | 0.000084 | 0.000032 | 0.610168 | 0.999305 | 0.000032 | 0.999954 | |
| 280 °C | 0.000163 | 0.000757 | 0.000032 | 0.914717 | 0.999305 | 0.000032 | 1.000000 | |
| 300 °C | 0.001633 | 0.000032 | 0.000032 | 0.000032 | 0.000032 | 0.000032 | 0.000032 | |
| 320 °C | 0.000347 | 0.000347 | 0.000032 | 0.837568 | 0.999954 | 1.000000 | 0.000032 |
Appendix B
| 0.25 h | 0.5 h | 0.75 h | 1 h | 1.5 h | 2 h | 2.5 h | 3 h | 4 h | 5 h | 6 h | 7 h | 8 h | 24 h | |
|---|---|---|---|---|---|---|---|---|---|---|---|---|---|---|
| 0.25 h | 0.000023 | 0.000023 | 0.000023 | 0.000023 | 0.000023 | 0.000023 | 0.000023 | 0.000023 | 0.000023 | 0.000023 | 0.000023 | 0.000023 | 0.000023 | |
| 0.5 h | 0.000023 | 0.000023 | 0.000023 | 0.000023 | 0.000023 | 0.000023 | 0.000023 | 0.000023 | 0.000023 | 0.000023 | 0.000023 | 0.000023 | 0.000023 | |
| 0.75 h | 0.000023 | 0.000023 | 0.000023 | 0.000023 | 0.000023 | 0.000023 | 0.000023 | 0.000023 | 0.000023 | 0.000023 | 0.000023 | 0.000023 | 0.000023 | |
| 1 h | 0.000023 | 0.000023 | 0.000023 | 0.000023 | 0.000023 | 0.000023 | 0.000023 | 0.000023 | 0.000023 | 0.000023 | 0.000023 | 0.000023 | 0.000023 | |
| 1.5 h | 0.000023 | 0.000023 | 0.000023 | 0.000023 | 0.000023 | 0.000023 | 0.000023 | 0.000023 | 0.000023 | 0.000023 | 0.000023 | 0.000023 | 0.000023 | |
| 2 h | 0.000023 | 0.000023 | 0.000023 | 0.000023 | 0.000023 | 0.000063 | 0.000023 | 0.000023 | 0.000023 | 0.000023 | 0.000023 | 0.000023 | 0.000023 | |
| 2.5 h | 0.000023 | 0.000023 | 0.000023 | 0.000023 | 0.000023 | 0.000063 | 0.000862 | 0.000023 | 0.000023 | 0.000023 | 0.000023 | 0.000023 | 0.000023 | |
| 3 h | 0.000023 | 0.000023 | 0.000023 | 0.000023 | 0.000023 | 0.000023 | 0.000862 | 0.000023 | 0.000023 | 0.000023 | 0.000023 | 0.000023 | 0.000023 | |
| 4 h | 0.000023 | 0.000023 | 0.000023 | 0.000023 | 0.000023 | 0.000023 | 0.000023 | 0.000023 | 0.000063 | 0.000023 | 0.000023 | 0.000023 | 0.000023 | |
| 5 h | 0.000023 | 0.000023 | 0.000023 | 0.000023 | 0.000023 | 0.000023 | 0.000023 | 0.000023 | 0.000063 | 0.004724 | 0.000023 | 0.000023 | 0.000023 | |
| 6 h | 0.000023 | 0.000023 | 0.000023 | 0.000023 | 0.000023 | 0.000023 | 0.000023 | 0.000023 | 0.000023 | 0.004724 | 0.064472 | 0.000024 | 0.000023 | |
| 7 h | 0.000023 | 0.000023 | 0.000023 | 0.000023 | 0.000023 | 0.000023 | 0.000023 | 0.000023 | 0.000023 | 0.000023 | 0.064472 | 0.452332 | 0.000023 | |
| 8 h | 0.000023 | 0.000023 | 0.000023 | 0.000023 | 0.000023 | 0.000023 | 0.000023 | 0.000023 | 0.000023 | 0.000023 | 0.000024 | 0.452332 | 0.000023 | |
| 24 h | 0.000023 | 0.000023 | 0.000023 | 0.000023 | 0.000023 | 0.000023 | 0.000023 | 0.000023 | 0.000023 | 0.000023 | 0.000023 | 0.000023 | 0.000023 |
| 0.25 h | 0.5 h | 0.75 h | 1 h | 1.5 h | 2 h | 2.5 h | 3 h | 4 h | 5 h | 6 h | 7 h | 8 h | 24 h | |
|---|---|---|---|---|---|---|---|---|---|---|---|---|---|---|
| 0.25 h | 0.000023 | 0.000023 | 0.000023 | 0.000023 | 0.000023 | 0.000023 | 0.000023 | 0.000023 | 0.000023 | 0.000023 | 0.000023 | 0.000023 | 0.000023 | |
| 0.5 h | 0.000023 | 0.000023 | 0.000023 | 0.000023 | 0.000023 | 0.000023 | 0.000023 | 0.000023 | 0.000023 | 0.000023 | 0.000023 | 0.000023 | 0.000023 | |
| 0.75 h | 0.000023 | 0.000023 | 0.000023 | 0.000023 | 0.000023 | 0.000023 | 0.000023 | 0.000023 | 0.000023 | 0.000023 | 0.000023 | 0.000023 | 0.000023 | |
| 1 h | 0.000023 | 0.000023 | 0.000023 | 0.000023 | 0.000023 | 0.000023 | 0.000023 | 0.000023 | 0.000023 | 0.000023 | 0.000023 | 0.000023 | 0.000023 | |
| 1.5 h | 0.000023 | 0.000023 | 0.000023 | 0.000023 | 0.000023 | 0.000023 | 0.000023 | 0.000023 | 0.000023 | 0.000023 | 0.000023 | 0.000023 | 0.000023 | |
| 2 h | 0.000023 | 0.000023 | 0.000023 | 0.000023 | 0.000023 | 0.001161 | 0.000023 | 0.000023 | 0.000023 | 0.000023 | 0.000023 | 0.000023 | 0.000023 | |
| 2.5 h | 0.000023 | 0.000023 | 0.000023 | 0.000023 | 0.000023 | 0.001161 | 0.065416 | 0.000023 | 0.000023 | 0.000023 | 0.000023 | 0.000023 | 0.000023 | |
| 3 h | 0.000023 | 0.000023 | 0.000023 | 0.000023 | 0.000023 | 0.000023 | 0.065416 | 0.000028 | 0.000023 | 0.000023 | 0.000023 | 0.000023 | 0.000023 | |
| 4 h | 0.000023 | 0.000023 | 0.000023 | 0.000023 | 0.000023 | 0.000023 | 0.000023 | 0.000028 | 0.018850 | 0.000023 | 0.000023 | 0.000023 | 0.000023 | |
| 5 h | 0.000023 | 0.000023 | 0.000023 | 0.000023 | 0.000023 | 0.000023 | 0.000023 | 0.000023 | 0.018850 | 0.255247 | 0.000361 | 0.000023 | 0.000023 | |
| 6 h | 0.000023 | 0.000023 | 0.000023 | 0.000023 | 0.000023 | 0.000023 | 0.000023 | 0.000023 | 0.000023 | 0.255247 | 0.844798 | 0.034334 | 0.000023 | |
| 7 h | 0.000023 | 0.000023 | 0.000023 | 0.000023 | 0.000023 | 0.000023 | 0.000023 | 0.000023 | 0.000023 | 0.000361 | 0.844798 | 0.945591 | 0.000023 | |
| 8 h | 0.000023 | 0.000023 | 0.000023 | 0.000023 | 0.000023 | 0.000023 | 0.000023 | 0.000023 | 0.000023 | 0.000023 | 0.034334 | 0.945591 | 0.000023 | |
| 24 h | 0.000023 | 0.000023 | 0.000023 | 0.000023 | 0.000023 | 0.000023 | 0.000023 | 0.000023 | 0.000023 | 0.000023 | 0.000023 | 0.000023 | 0.000023 |
| 0.25 h | 0.5 h | 0.75 h | 1 h | 1.5 h | 2 h | 2.5 h | 3 h | 4 h | 5 h | 6 h | 7 h | 8 h | 24 h | |
|---|---|---|---|---|---|---|---|---|---|---|---|---|---|---|
| 0.25 h | 0.000031 | 0.000023 | 0.000023 | 0.000023 | 0.000023 | 0.000023 | 0.000023 | 0.000023 | 0.000023 | 0.000023 | 0.000023 | 0.000023 | 0.000023 | |
| 0.5 h | 0.000031 | 0.017836 | 0.000023 | 0.000023 | 0.000023 | 0.000023 | 0.000023 | 0.000023 | 0.000023 | 0.000023 | 0.000023 | 0.000023 | 0.000023 | |
| 0.75 h | 0.000023 | 0.017836 | 0.242620 | 0.000023 | 0.000023 | 0.000023 | 0.000023 | 0.000023 | 0.000023 | 0.000023 | 0.000023 | 0.000023 | 0.000023 | |
| 1 h | 0.000023 | 0.000023 | 0.242620 | 0.015568 | 0.000023 | 0.000023 | 0.000023 | 0.000023 | 0.000023 | 0.000023 | 0.000023 | 0.000023 | 0.000023 | |
| 1.5 h | 0.000023 | 0.000023 | 0.000023 | 0.015568 | 0.339811 | 0.000568 | 0.000023 | 0.000023 | 0.000023 | 0.000023 | 0.000023 | 0.000023 | 0.000023 | |
| 2 h | 0.000023 | 0.000023 | 0.000023 | 0.000023 | 0.339811 | 0.823644 | 0.038723 | 0.000026 | 0.000023 | 0.000023 | 0.000023 | 0.000023 | 0.000023 | |
| 2.5 h | 0.000023 | 0.000023 | 0.000023 | 0.000023 | 0.000568 | 0.823644 | 0.962901 | 0.022289 | 0.000047 | 0.000023 | 0.000023 | 0.000023 | 0.000023 | |
| 3 h | 0.000023 | 0.000023 | 0.000023 | 0.000023 | 0.000023 | 0.038723 | 0.962901 | 0.722052 | 0.022289 | 0.000184 | 0.000025 | 0.000023 | 0.000023 | |
| 4 h | 0.000023 | 0.000023 | 0.000023 | 0.000023 | 0.000023 | 0.000026 | 0.022289 | 0.722052 | 0.962901 | 0.285118 | 0.028893 | 0.001917 | 0.000023 | |
| 5 h | 0.000023 | 0.000023 | 0.000023 | 0.000023 | 0.000023 | 0.000023 | 0.000047 | 0.022289 | 0.962901 | 0.996898 | 0.771570 | 0.277744 | 0.000023 | |
| 6 h | 0.000023 | 0.000023 | 0.000023 | 0.000023 | 0.000023 | 0.000023 | 0.000023 | 0.000184 | 0.285118 | 0.996898 | 0.999912 | 0.960372 | 0.000035 | |
| 7 h | 0.000023 | 0.000023 | 0.000023 | 0.000023 | 0.000023 | 0.000023 | 0.000023 | 0.000025 | 0.028893 | 0.771570 | 0.999912 | 0.999987 | 0.000842 | |
| 8 h | 0.000023 | 0.000023 | 0.000023 | 0.000023 | 0.000023 | 0.000023 | 0.000023 | 0.000023 | 0.001917 | 0.277744 | 0.960372 | 0.999987 | 0.014872 | |
| 24 h | 0.000023 | 0.000023 | 0.000023 | 0.000023 | 0.000023 | 0.000023 | 0.000023 | 0.000023 | 0.000023 | 0.000023 | 0.000035 | 0.000842 | 0.014872 |
| 0.25 h | 0.5 h | 0.75 h | 1 h | 1.5 h | 2 h | 2.5 h | 3 h | 4 h | 5 h | 6 h | 7 h | 8 h | 24 h | |
|---|---|---|---|---|---|---|---|---|---|---|---|---|---|---|
| 0.25 h | 0.000023 | 0.000023 | 0.000023 | 0.000023 | 0.000023 | 0.000023 | 0.000023 | 0.000023 | 0.000023 | 0.000023 | 0.000023 | 0.000023 | 0.000023 | |
| 0.5 h | 0.000023 | 0.000023 | 0.000023 | 0.000023 | 0.000023 | 0.000023 | 0.000023 | 0.000023 | 0.000023 | 0.000023 | 0.000023 | 0.000023 | 0.000023 | |
| 0.75 h | 0.000023 | 0.000023 | 0.000023 | 0.000023 | 0.000023 | 0.000023 | 0.000023 | 0.000023 | 0.000023 | 0.000023 | 0.000023 | 0.000023 | 0.000023 | |
| 1 h | 0.000023 | 0.000023 | 0.000023 | 0.000023 | 0.000023 | 0.000023 | 0.000023 | 0.000023 | 0.000023 | 0.000023 | 0.000023 | 0.000023 | 0.000023 | |
| 1.5 h | 0.000023 | 0.000023 | 0.000023 | 0.000023 | 0.000023 | 0.000023 | 0.000023 | 0.000023 | 0.000023 | 0.000023 | 0.000023 | 0.000023 | 0.000023 | |
| 2 h | 0.000023 | 0.000023 | 0.000023 | 0.000023 | 0.000023 | 0.000023 | 0.000023 | 0.000023 | 0.000023 | 0.000023 | 0.000023 | 0.000023 | 0.000023 | |
| 2.5 h | 0.000023 | 0.000023 | 0.000023 | 0.000023 | 0.000023 | 0.000023 | 0.000025 | 0.000023 | 0.000023 | 0.000023 | 0.000023 | 0.000023 | 0.000023 | |
| 3 h | 0.000023 | 0.000023 | 0.000023 | 0.000023 | 0.000023 | 0.000023 | 0.000025 | 0.000023 | 0.000023 | 0.000023 | 0.000023 | 0.000023 | 0.000023 | |
| 4 h | 0.000023 | 0.000023 | 0.000023 | 0.000023 | 0.000023 | 0.000023 | 0.000023 | 0.000023 | 0.000023 | 0.000023 | 0.000023 | 0.000023 | 0.000023 | |
| 5 h | 0.000023 | 0.000023 | 0.000023 | 0.000023 | 0.000023 | 0.000023 | 0.000023 | 0.000023 | 0.000023 | 0.000201 | 0.000023 | 0.000023 | 0.000023 | |
| 6 h | 0.000023 | 0.000023 | 0.000023 | 0.000023 | 0.000023 | 0.000023 | 0.000023 | 0.000023 | 0.000023 | 0.000201 | 0.000045 | 0.000023 | 0.000023 | |
| 7 h | 0.000023 | 0.000023 | 0.000023 | 0.000023 | 0.000023 | 0.000023 | 0.000023 | 0.000023 | 0.000023 | 0.000023 | 0.000045 | 0.007099 | 0.000023 | |
| 8 h | 0.000023 | 0.000023 | 0.000023 | 0.000023 | 0.000023 | 0.000023 | 0.000023 | 0.000023 | 0.000023 | 0.000023 | 0.000023 | 0.007099 | 0.000023 | |
| 24 h | 0.000023 | 0.000023 | 0.000023 | 0.000023 | 0.000023 | 0.000023 | 0.000023 | 0.000023 | 0.000023 | 0.000023 | 0.000023 | 0.000023 | 0.000023 |
References
- Güney, T. Renewable energy, non-renewable energy and sustainable development. Int. J. Sustain. Dev. World Ecol. 2019, 26, 389–397. [Google Scholar] [CrossRef]
- Greinert, A.; Mrówczyńska, M.; Szefner, W. The Use of Waste Biomass from the Wood Industry and Municipal Sources for Energy Production. Sustainability 2019, 11, 3083. [Google Scholar] [CrossRef]
- UNEP (United Nations Environment Programme). Converting Waste Agricultural Biomass into a Resource; United Nations Environment Programme Division of Technology, Industry and Economics International Environmental Technology Centre: Osaka, Japan, 2015. [Google Scholar]
- Chun, A.M.S.; Brisson, I.E. Ground Rules in Humanitarian Design; John Wiley & Sons Ltd.: Chichester, UK, 2015. [Google Scholar]
- Cowie, A.; Berndes, G.; Junginger, M.; Ximenes, F. Response to Chatham House Report “Woody Biomass for Power and Heat: Impacts on the Global Climate”; Supporting document; EIA Bioenergy: Paris, France, 2017. [Google Scholar]
- Gao, Y.; Skutsch, M.; Masera, O.; Pacheca, P. A Global Analysis of Deforestation due to Biofuel Development; Working Paper 68; CIFOR (Center for International Forestry Research): Bogor, Indonesia, 2011. [Google Scholar]
- Bamwesigye, D.; Kupec, P.; Chekuimo, G.; Pavlis, J.; Asamoah, O.; Darkwah, S.A.; Hlaváčková, P. Charcoal and Wood Biomass Utilization in Uganda: The Socioeconomic and Environmental Dynamics and Implications. Sustainability 2020, 12, 8337. [Google Scholar] [CrossRef]
- Muscat, A.; de Olde, E.; de Boer, I.; Ripoll-Bosch, R. The battle for biomass: A systematic review of food-feed-fuel competition. Glob. Food Secur. 2020, 25, 100330. [Google Scholar] [CrossRef]
- Poore, J.; Nemecek, T. Reducing food’s environmental impacts through producers and consumers. Science 2018, 360, 987–992. [Google Scholar] [CrossRef] [PubMed]
- Garnett, T.; Röös, E.; Little, D. Lean, Green, Mean, Obscene…? What Is Efficiency? And Is It Sustainable? Animal Production and Consumption Reconsidered; FCRN (Food Climate Research Network): Oxford, UK, 2015. [Google Scholar]
- Haberl, H.; Erb, K.-H.; Krausmann, F. Human Appropriation of Net Primary Production: Patterns, Trends, and Planetary Boundaries. Annu. Rev. Environ. Resour. 2014, 39, 363–391. [Google Scholar] [CrossRef]
- Karlberg, L.; Hoff, H.; Flores-López, F.; Goetz, A.; Matuschke, I. Tackling biomass scarcity—From vicious to virtuous cycles in sub-Saharan Africa. Curr. Opin. Environ. Sustain. 2015, 15, 1–8. [Google Scholar] [CrossRef]
- Wang, T.; Zhai, Y.; Li, H.; Zhu, Y.; Li, S.; Peng, C.; Wang, B.; Wang, Z.; Xi, Y.; Wang, S.; et al. Co-hydrothermal carbonization of food waste-woody biomass blend towards biofuel pellets production. Bioresour. Technol. 2018, 267, 371–377. [Google Scholar] [CrossRef] [PubMed]
- Pahla, G.; Ntuli, F.; Muzenda, E. Torrefaction of landfill food waste for possible application in biomass co-firing. Waste Manag. 2018, 71, 512–520. [Google Scholar] [CrossRef] [PubMed]
- European Commission. The European Green Deal; European Commission: Brussels, Belgium, 2019; Available online: https://ec.europa.eu/info/sites/info/files/european-green-deal-communication_en.pdf (accessed on 6 December 2020).
- Scherhaufer, S.; Moates, G.; Hartikainen, H.; Waldron, K.; Obersteiner, G. Environmental impacts of foof waste in Europe. Waste Manag. 2018, 77, 980113. [Google Scholar] [CrossRef]
- Jose, S.; Bhaskar, T. Biomass and Biofuels: Advanced Biorefineries for Sustainable Production and Distribution; CRC Press: Boca Raton, FL, USA, 2018. [Google Scholar]
- Dahlquist, E. Biomass as Energy Source: Resources, Systems and Applications; CRC Press: Boca Raton, FL, USA, 2013. [Google Scholar]
- Mani, S.; Tabil, L.G.; Sokhansanj, S. Grinding performance and physical properties of wheat and barley straws, corn stover and switchgrass. Biomass Bioenergy 2004, 27, 339–352. [Google Scholar] [CrossRef]
- Karunanithy, C.; Muthukumarappan, K.; Donepudi, A. Moisture sorption characteristics of corn stover and big bluestem. J. Renew. Energy 2013, 2013, 939504. [Google Scholar] [CrossRef]
- Cai, J.; He, Y.; Yu, X.; Banks, S.W.; Yang, Y.; Zhang, X.; Yu, Y.; Liu, R.; Bridgwater, A.V. Review of physicochemical properties and analytical characterization of lignocellulosic biomass. Renew. Sustain. Energy Rev. 2017, 76, 309–322. [Google Scholar] [CrossRef]
- Cu, S.; Collins, H.M.; Betts, N.S.; March, T.J.; Janusz, A.; Stewart, D.C.; Skadhauge, B.; Eglinton, J.; Kyriacou, B.; Little, A.; et al. Water uptake in barley grain: Physiology; genetics and industrial applications. Plant. Sci. 2016, 242, 260–269. [Google Scholar] [CrossRef]
- Strandberg, M.; Olofsson, I.; Pommer, L.; Wiklund-Lindstrom, S.; Aberg, K.; Nordin, A. Effects of Temperature and Residence Time on Continuous Torrefaction of Spruce Wood. Fuel Process. Technol. 2015, 134, 387–398. [Google Scholar] [CrossRef]
- Bisdom, E.B.A.; Dekker, L.W.; Schoute, J.F. Water repellency of sieve fractions from sandy soils and relationships with organic material and soil structure. Geoderma 1993, 56, 105–118. [Google Scholar] [CrossRef]
- Singh, R.; Krishna, B.B.; Kumar, J.; Bhaskar, T. Opportunities for Utilization of Non-Conventional Energy Sources for Biomass Pretreatment. Bioresour. Technol. 2016, 199, 398–407. [Google Scholar] [CrossRef]
- Alvarez, J.G.; Moya, R.; Puente-Urbina, A.; Rodriguez-Zuniga, A. Thermogravimetric, Volatilization Rate, and Differential Scanning Calorimetry Analyses of Biomass of Tropical Plantation Species of Costa Rica Torrefied at Different Temperatures and Times. Energies 2018, 11, 696. [Google Scholar] [CrossRef]
- Cocker-Maciejewska, A. Obróbka wstępna biomasy na potrzeby systemów energetycznych (Biomass pre-treatment for energy purposes). Ochr. Śródowiska i Zasobów Nat. 2007, 30, 133–141. (In Polish) [Google Scholar]
- Van Der Stelt, M.M.; Gerhauser, H.; Kiel, J.J.; Ptasinski, K.K. Biomass upgrading by torrefaction for the production of biofuels: A review. Biomass Bioenergy 2011, 35, 3748–3762. [Google Scholar] [CrossRef]
- Carneiro, R.J.M.; Godina, R.; Oliveira, M.J.C.; Ribeiro, N.L.J. Future Perspectives of Biomass Torrefaction: Review of the Current State-Of-The-Art and Research Development. Sustainability 2018, 10, 2323. [Google Scholar]
- Baronti, S.; Vaccari, F.P.; Miglietta, F.; Calzolari, C.; Lugato, C.; Orlandini, S.; Pini, R.; Zulian, C.; Genesio, L. Impact of Biochar Application on Plant Water Relations in Vitis vinifera (L.). Eur. J. Agron. 2014, 53, 38–44. [Google Scholar] [CrossRef]
- Alvarez, A.; Nogueiro, D.; Pizarro, C.; Matos, M.; Bueno, J.L. Non-Oxidative Torrefaction of Biomass to Enhance its Fuel Properties. Energy 2018, 158, 1–8. [Google Scholar] [CrossRef]
- Yan, W.; Acharjee, T.C.; Coronella, C.J.; Vasquez, V.R. Thermal Pretreatment of Lignocellulosic Biomass. Environ. Prog. Sustain. Energy 2009, 28, 435–440. [Google Scholar]
- Labuza, T.P. Moisture Sorption: Practical Aspects of Isotherm Measurement and Use; American Association of Cereal Chemists: St. Paul, MN, USA, 1984. [Google Scholar]
- Martinez, M.G.; Helias, E.; Ratel, G.; Thiery, S.; Melkior, T. Torrefaction of Woody and Agricultural Biomass: Influence of the Presence of Water Vapor in the Gaseous Atmosphere. Processes 2021, 9, 30. [Google Scholar] [CrossRef]
- Świechowski, K.; Stegenta-Dąbrowska, S.; Liszewski, M.; Bąbelewski, P.; Koziel, J.A.; Białowiec, A. Oxytree Pruned Biomass Torrefaction: Process Kinetics. Materials 2019, 12, 3334. [Google Scholar] [CrossRef]
- Lin, G.; Yang, H.; Wang, X.; Mei, Y.; Li, P.; Shao, J.; Chen, H. The moisture sorption characteristics and modelling of agricultural biomass. Biosyst. Eng. 2016, 150, 191–200. [Google Scholar] [CrossRef]
- Dyjakon, A.; Noszczyk, T.; Smędzik, M. The Influence of Torrefaction Temperature on Hydrophobic Properties of Waste Biomass from Food Processing. Energies 2019, 12, 4609. [Google Scholar] [CrossRef]
- Cahyanti, M.N.; Doddapaneni, T.R.K.C.; Madissoo, M.; Parn, L.; Virro, I.; Kikas, T. Torrefaction of Agricultural and Wood Waste: Comparative Analysis of Selected Fuel Characteristics. Energies 2021, 14, 2774. [Google Scholar] [CrossRef]
- Nyashina, G.S.; Kurgankina, M.A.; Strizhak, P.A. Environmental, economic and energetic benefits of using coal and oil processing waste instead of coal to produce the same amount of energy. Energy Convers. Manag. 2018, 174, 175–187. [Google Scholar] [CrossRef]
- Acharjee, T.C.; Coronella, C.J.; Vasquez, V.R. Effect of thermal pretreatment on equilibrium moisture content of lignocellulosic biomass. Bioresour. Technol. 2011, 102, 4849–4854. [Google Scholar] [CrossRef]
- Satpathy, S.K.; Tabil, L.G.; Meda, V.; Naik, S.N.; Prasad, R. Torrefaction of wheat and barley straw after microwave heating. Fuel 2014, 124, 269–278. [Google Scholar] [CrossRef]
- Chen, W.H.; Lin, B.J.; Colin, B.; Petrissans, A.; Petrissans, M. A study of hygroscopic property of biomass pretreated by torrefaction. Energy Proc. 2019, 158, 32–36. [Google Scholar] [CrossRef]
- Chang, S.; Zhao, Z.; Zheng, A.; He, F.; Huang, Z.; Li, H. Characterization of products from torrefaction of sprucewood and bagasse in an auger reactor. Energy Fuels 2012, 26, 7009–7017. [Google Scholar] [CrossRef]
- Chen, Y.; Liu, B.; Yang, H.; Yang, Q.; Chen, H. Evolution of Functional Groups and Pore Structure During Cotton and Corn Stalks Torrefaction and its Correlation with Hydrophobicity. Fuel 2014, 137, 41–49. [Google Scholar] [CrossRef]
- Chen, D.; Gao, A.; Cen, K.; Zhang, J.; Cao, X.; Ma, Z. Investigation of Biomass Torrefaction Based on Three Major Components: Hemicellulose, Cellulose and Lignin. Energy Convers. Manag. 2018, 169, 228–237. [Google Scholar] [CrossRef]
- Wang, S.; Dai, G.; Ru, B.; Zhao, Y.; Wang, X.; Xiao, G.; Luo, Z. Influence of Torrefaction on the Characteristics and Pyrolysis Behaviour of Cellulose. Energy 2017, 120, 864–871. [Google Scholar] [CrossRef]
- Chen, W.H.; Peng, J.; Bi, X.T. A state-of-the-art review of biomass torrefaction, densification, and applications. Renew. Sustain. Energy Rev. 2015, 44, 847–866. [Google Scholar] [CrossRef]
- Korshunov, A.; Kichatov, B.; Sudakov, V.; Kolobov, A.; Gubernov, V.; Golubkov, A.; Libet, P.A.; Kireynov, A.; Yurchenko, S.O. Hygroscopic property of biofuel obtained by torrefaction of wood in a quiescent layer of bentonite. Fuel 2020, 282, 118766. [Google Scholar] [CrossRef]
- Chen, Q.; Zhang, R.; Wang, Y.; Wen, X.; Qin, D. The Effect of Bamboo Charcoal on Water Absorption, Contact Angle, and the Physical-Mechanical Properties of Bamboo/Low-Density Polyethylene Composites. BioResources 2016, 11, 9986–10001. [Google Scholar] [CrossRef][Green Version]
- Tiebe, C.; Detjens, M.; Fechner, A.; Sielemann, S.; Lorek, A.; Wernecke, R.; Stoltenberg, H. Development of a Device for Staged Determination of Water Activity and Moisture Content. Proceedings 2018, 2, 881. [Google Scholar] [CrossRef]
- Mu, B.; Wang, H.; Hao, X.; Wang, Q. Morphology, Mechanical Properties and Dimensional Stability of Biomass Particles/High Density Polyethylene Composites: Effect of Species and Composition. Polymers 2018, 10, 308. [Google Scholar] [CrossRef] [PubMed]
- Tamrakar, S.; Lopez-Anido, R.A. Water absorption of wood polypropylene composite sheet piles and its influence on mechanical properties. Constr. Build. Mater. 2011, 25, 3977–3988. [Google Scholar] [CrossRef]


| Parameter | Standard/Method |
|---|---|
| Moisture content (MC) | PN EN ISO 18134-2:2017-03E |
| Higher heating value (HHV) | PN EN ISO 18125:2017-07 |
| Volatile matter content (VMC) | PN EN ISO 18123:2016-01 |
| Ash content (AC) | PN EN ISO 18122:2015 |
| Fixed carbon content (FCC) | ASTM D-3172-73 |
| Parameter | Value |
|---|---|
| Volume | 335 dm3 |
| Temperature range | −10 °C/+90 °C |
| 0Electric parameters | 3/-/PE, AC 220 V ± 10%, 60 Hz |
| Cooling | R134 A, 0.6 kg |
| HP max. | 25 bar |
| Nominal output power | 1.7 kW |
| Nominal current | 10 A |
| Weight | 410 kg |
| Dimensions | 780 mm × 1775 mm × 1480 mm |
| 105 °C | 200 °C | 220 °C | 240 °C | 260 °C | 280 °C | 300 °C | 320 °C | |
|---|---|---|---|---|---|---|---|---|
| 0.25 h | 0.026 | 0.022 | 0.022 | 0.020 | 0.025 | 0.024 | 0.021 | 0.020 |
| SD | 0.003 | 0.001 | 0.005 | 0.003 | 0.002 | 0.006 | 0.001 | 0.003 |
| 0.5 h | 0.042 | 0.034 | 0.035 | 0.031 | 0.038 | 0.038 | 0.034 | 0.032 |
| SD | 0.005 | 0.001 | 0.005 | 0.004 | 0.002 | 0.008 | 0.001 | 0.003 |
| 0.75 h | 0.054 | 0.043 | 0.043 | 0.038 | 0.047 | 0.048 | 0.043 | 0.041 |
| SD | 0.006 | 0.001 | 0.005 | 0.004 | 0.003 | 0.008 | 0.001 | 0.004 |
| 1 h | 0.067 | 0.052 | 0.052 | 0.046 | 0.054 | 0.056 | 0.052 | 0.049 |
| SD | 0.007 | 0.002 | 0.005 | 0.005 | 0.002 | 0.009 | 0.001 | 0.005 |
| 1.5 h | 0.082 | 0.064 | 0.064 | 0.055 | 0.064 | 0.067 | 0.064 | 0.061 |
| SD | 0.008 | 0.002 | 0.005 | 0.005 | 0.002 | 0.007 | 0.002 | 0.005 |
| 2 h | 0.095 | 0.075 | 0.074 | 0.063 | 0.07 | 0.075 | 0.072 | 0.069 |
| SD | 0.009 | 0.002 | 0.005 | 0.006 | 0.002 | 0.006 | 0.002 | 0.006 |
| 2.5 h | 0.105 | 0.083 | 0.081 | 0.068 | 0.075 | 0.080 | 0.079 | 0.076 |
| SD | 0.010 | 0.002 | 0.005 | 0.006 | 0.002 | 0.005 | 0.002 | 0.005 |
| 3 h | 0.114 | 0.090 | 0.088 | 0.074 | 0.078 | 0.085 | 0.085 | 0.082 |
| SD | 0.010 | 0.002 | 0.005 | 0.006 | 0.002 | 0.004 | 0.002 | 0.005 |
| 4 h | 0.129 | 0.102 | 0.098 | 0.082 | 0.084 | 0.09 | 0.091 | 0.089 |
| SD | 0.010 | 0.002 | 0.005 | 0.005 | 0.002 | 0.002 | 0.001 | 0.005 |
| 5 h | 0.141 | 0.112 | 0.107 | 0.089 | 0.088 | 0.095 | 0.096 | 0.094 |
| SD | 0.011 | 0.002 | 0.005 | 0.006 | 0.002 | 0.002 | 0.001 | 0.004 |
| 6 h | 0.150 | 0.120 | 0.113 | 0.094 | 0.091 | 0.097 | 0.099 | 0.098 |
| SD | 0.011 | 0.002 | 0.006 | 0.005 | 0.002 | 0.001 | 0.001 | 0.004 |
| 7 h | 0.158 | 0.126 | 0.118 | 0.099 | 0.094 | 0.100 | 0.102 | 0.101 |
| SD | 0.010 | 0.002 | 0.006 | 0.005 | 0.002 | 0.001 | 0.001 | 0.003 |
| 8 h | 0.164 | 0.132 | 0.122 | 0.103 | 0.096 | 0.101 | 0.104 | 0.103 |
| SD | 0.010 | 0.002 | 0.006 | 0.005 | 0.001 | 0.001 | 0.001 | 0.003 |
| 24 h | 0.202 | 0.164 | 0.145 | 0.128 | 0.108 | 0.113 | 0.117 | 0.118 |
| SD | 0.004 | 0.001 | 0.006 | 0.002 | 0.001 | 0.003 | 0.001 | 0.002 |
| 105 °C | 200 °C | 220 °C | 240 °C | 260 °C | 280 °C | 300 °C | 320 °C | |
|---|---|---|---|---|---|---|---|---|
| 0.25 h | 0.035 | 0.030 | 0.033 | 0.029 | 0.036 | 0.035 | 0.035 | 0.039 |
| SD | 0.001 | 0.002 | 0.003 | 0.001 | 0.003 | 0.002 | 0.003 | 0.002 |
| 0.5 h | 0.055 | 0.046 | 0.049 | 0.045 | 0.053 | 0.050 | 0.051 | 0.058 |
| SD | 0.001 | 0.002 | 0.003 | 0.002 | 0.004 | 0.004 | 0.006 | 0.002 |
| 0.75 h | 0.072 | 0.058 | 0.059 | 0.055 | 0.066 | 0.062 | 0.063 | 0.071 |
| SD | 0.002 | 0.003 | 0.004 | 0.002 | 0.005 | 0.004 | 0.006 | 0.002 |
| 1 h | 0.085 | 0.067 | 0.068 | 0.063 | 0.073 | 0.070 | 0.071 | 0.080 |
| SD | 0.001 | 0.005 | 0.004 | 0.002 | 0.005 | 0.004 | 0.006 | 0.003 |
| 1.5 h | 0.105 | 0.082 | 0.077 | 0.072 | 0.085 | 0.081 | 0.081 | 0.092 |
| SD | 0.002 | 0.003 | 0.004 | 0.002 | 0.005 | 0.005 | 0.008 | 0.002 |
| 2 h | 0.122 | 0.094 | 0.084 | 0.079 | 0.091 | 0.087 | 0.087 | 0.099 |
| SD | 0.002 | 0.003 | 0.004 | 0.002 | 0.004 | 0.005 | 0.008 | 0.002 |
| 2.5 h | 0.134 | 0.102 | 0.089 | 0.084 | 0.096 | 0.091 | 0.093 | 0.104 |
| SD | 0.002 | 0.003 | 0.005 | 0.002 | 0.003 | 0.005 | 0.007 | 0.002 |
| 3 h | 0.144 | 0.109 | 0.093 | 0.088 | 0.100 | 0.095 | 0.095 | 0.108 |
| SD | 0.002 | 0.003 | 0.004 | 0.001 | 0.003 | 0.005 | 0.011 | 0.001 |
| 4 h | 0.160 | 0.120 | 0.099 | 0.094 | 0.106 | 0.100 | 0.100 | 0.113 |
| SD | 0.002 | 0.003 | 0.004 | 0.001 | 0.003 | 0.006 | 0.010 | 0.001 |
| 5 h | 0.173 | 0.129 | 0.101 | 0.098 | 0.110 | 0.103 | 0.104 | 0.117 |
| SD | 0.001 | 0.003 | 0.008 | 0.002 | 0.003 | 0.007 | 0.011 | 0.001 |
| 6 h | 0.183 | 0.136 | 0.104 | 0.098 | 0.113 | 0.106 | 0.106 | 0.119 |
| SD | 0.001 | 0.003 | 0.008 | 0.006 | 0.002 | 0.007 | 0.011 | 0.001 |
| 7 h | 0.191 | 0.141 | 0.104 | 0.103 | 0.114 | 0.105 | 0.108 | 0.120 |
| SD | 0.001 | 0.003 | 0.009 | 0.002 | 0.003 | 0.012 | 0.011 | 0.001 |
| 8 h | 0.197 | 0.145 | 0.105 | 0.105 | 0.116 | 0.106 | 0.110 | 0.122 |
| SD | 0.001 | 0.003 | 0.009 | 0.002 | 0.002 | 0.012 | 0.012 | 0.001 |
| 24 h | 0.223 | 0.162 | 0.114 | 0.115 | 0.124 | 0.115 | 0.120 | 0.130 |
| SD | 0.001 | 0.002 | 0.008 | 0.003 | 0.002 | 0.012 | 0.012 | 0.001 |
| 105 °C | 200 °C | 220 °C | 240 °C | 260 °C | 280 °C | 300 °C | 320 °C | |
|---|---|---|---|---|---|---|---|---|
| 0.25 h | 0.032 | 0.032 | 0.031 | 0.054 | 0.03 | 0.031 | 0.032 | 0.036 |
| SD | 0.002 | 0.001 | 0.002 | 0.031 | 0.001 | 0.002 | 0.002 | 0.001 |
| 0.5 h | 0.054 | 0.05 | 0.048 | 0.071 | 0.045 | 0.047 | 0.049 | 0.055 |
| SD | 0.002 | 0.002 | 0.001 | 0.030 | 0.001 | 0.003 | 0.003 | 0.001 |
| 0.75 h | 0.069 | 0.061 | 0.059 | 0.083 | 0.055 | 0.059 | 0.06 | 0.069 |
| SD | 0.002 | 0.002 | 0.001 | 0.030 | 0.001 | 0.003 | 0.003 | 0.001 |
| 1 h | 0.083 | 0.071 | 0.068 | 0.091 | 0.062 | 0.067 | 0.068 | 0.077 |
| SD | 0.002 | 0.002 | 0.001 | 0.031 | 0.001 | 0.002 | 0.003 | 0.001 |
| 1.5 h | 0.102 | 0.084 | 0.081 | 0.102 | 0.072 | 0.078 | 0.078 | 0.089 |
| SD | 0.003 | 0.002 | 0.002 | 0.031 | 0.001 | 0.003 | 0.002 | 0.002 |
| 2 h | 0.118 | 0.095 | 0.09 | 0.108 | 0.078 | 0.084 | 0.085 | 0.096 |
| SD | 0.003 | 0.001 | 0.002 | 0.032 | 0.001 | 0.003 | 0.001 | 0.001 |
| 2.5 h | 0.132 | 0.103 | 0.098 | 0.113 | 0.082 | 0.089 | 0.089 | 0.100 |
| SD | 0.004 | 0.001 | 0.002 | 0.032 | 0.001 | 0.003 | 0.001 | 0.002 |
| 3 h | 0.143 | 0.11 | 0.104 | 0.116 | 0.085 | 0.092 | 0.092 | 0.103 |
| SD | 0.004 | 0.001 | 0.003 | 0.032 | 0.001 | 0.003 | 0.001 | 0.002 |
| 4 h | 0.161 | 0.119 | 0.112 | 0.121 | 0.089 | 0.096 | 0.096 | 0.108 |
| SD | 0.003 | 0.002 | 0.002 | 0.033 | 0.001 | 0.003 | 0.001 | 0.002 |
| 5 h | 0.174 | 0.126 | 0.119 | 0.123 | 0.091 | 0.099 | 0.098 | 0.11 |
| SD | 0.003 | 0.004 | 0.002 | 0.033 | 0.001 | 0.003 | 0.001 | 0.002 |
| 6 h | 0.184 | 0.132 | 0.124 | 0.125 | 0.093 | 0.100 | 0.100 | 0.112 |
| SD | 0.002 | 0.004 | 0.002 | 0.033 | 0.001 | 0.002 | 0.001 | 0.003 |
| 7 h | 0.193 | 0.137 | 0.127 | 0.127 | 0.094 | 0.101 | 0.101 | 0.113 |
| SD | 0.001 | 0.003 | 0.002 | 0.032 | 0.001 | 0.001 | 0.001 | 0.003 |
| 8 h | 0.200 | 0.141 | 0.131 | 0.128 | 0.095 | 0.101 | 0.102 | 0.114 |
| SD | 0.001 | 0.003 | 0.002 | 0.032 | 0.001 | 0.001 | 0.001 | 0.003 |
| 24 h | 0.237 | 0.156 | 0.145 | 0.134 | 0.102 | 0.107 | 0.108 | 0.120 |
| SD | 0.004 | 0.013 | 0.002 | 0.034 | 0.001 | 0.003 | 0.001 | 0.004 |
| 105 °C | 200 °C | 220 °C | 240 °C | 260 °C | 280 °C | 300 °C | 320 °C | |
|---|---|---|---|---|---|---|---|---|
| 0.25 h | 0.022 | 0.023 | 0.023 | 0.030 | 0.032 | 0.031 | 0.036 | 0.032 |
| SD | 0.002 | 0.002 | 0.003 | 0.001 | 0.001 | 0.002 | 0.001 | 0.005 |
| 0.5 h | 0.036 | 0.037 | 0.037 | 0.046 | 0.050 | 0.049 | 0.055 | 0.049 |
| SD | 0.002 | 0.003 | 0.004 | 0.001 | 0.002 | 0.004 | 0.001 | 0.007 |
| 0.75 h | 0.048 | 0.049 | 0.049 | 0.060 | 0.064 | 0.063 | 0.071 | 0.062 |
| SD | 0.003 | 0.004 | 0.004 | 0.002 | 0.002 | 0.005 | 0.002 | 0.008 |
| 1 h | 0.058 | 0.058 | 0.058 | 0.069 | 0.073 | 0.073 | 0.082 | 0.074 |
| SD | 0.003 | 0.004 | 0.005 | 0.002 | 0.001 | 0.005 | 0.004 | 0.009 |
| 1.5 h | 0.076 | 0.075 | 0.073 | 0.085 | 0.089 | 0.085 | 0.099 | 0.089 |
| SD | 0.004 | 0.004 | 0.006 | 0.002 | 0.002 | 0.005 | 0.004 | 0.010 |
| 2 h | 0.09 | 0.088 | 0.085 | 0.096 | 0.099 | 0.099 | 0.110 | 0.099 |
| SD | 0.005 | 0.005 | 0.006 | 0.002 | 0.001 | 0.006 | 0.003 | 0.010 |
| 2.5 h | 0.103 | 0.099 | 0.095 | 0.106 | 0.108 | 0.108 | 0.118 | 0.108 |
| SD | 0.005 | 0.005 | 0.007 | 0.002 | 0.001 | 0.005 | 0.003 | 0.009 |
| 3 h | 0.113 | 0.108 | 0.103 | 0.113 | 0.115 | 0.114 | 0.124 | 0.115 |
| SD | 0.006 | 0.005 | 0.007 | 0.001 | 0.001 | 0.005 | 0.003 | 0.009 |
| 4 h | 0.130 | 0.122 | 0.115 | 0.124 | 0.124 | 0.125 | 0.134 | 0.124 |
| SD | 0.006 | 0.005 | 0.008 | 0.002 | 0.001 | 0.005 | 0.003 | 0.008 |
| 5 h | 0.145 | 0.133 | 0.126 | 0.132 | 0.132 | 0.132 | 0.141 | 0.131 |
| SD | 0.007 | 0.006 | 0.007 | 0.002 | 0.001 | 0.004 | 0.003 | 0.008 |
| 6 h | 0.152 | 0.140 | 0.134 | 0.138 | 0.138 | 0.138 | 0.147 | 0.137 |
| SD | 0.009 | 0.006 | 0.007 | 0.002 | 0.001 | 0.004 | 0.003 | 0.007 |
| 7 h | 0.166 | 0.149 | 0.140 | 0.144 | 0.143 | 0.143 | 0.152 | 0.143 |
| SD | 0.007 | 0.005 | 0.007 | 0.002 | 0.001 | 0.004 | 0.003 | 0.007 |
| 8 h | 0.175 | 0.155 | 0.146 | 0.148 | 0.147 | 0.147 | 0.156 | 0.147 |
| SD | 0.006 | 0.005 | 0.006 | 0.002 | 0.001 | 0.004 | 0.003 | 0.007 |
| 24 h | 0.232 | 0.19 | 0.178 | 0.176 | 0.177 | 0.177 | 0.184 | 0.178 |
| SD | 0.004 | 0.002 | 0.003 | 0.002 | 0.001 | 0.003 | 0.003 | 0.004 |
| Waste | Coefficient | 105 °C | 200 °C | 220 °C | 240 °C | 260 °C | 280 °C | 300 °C | 320 °C |
|---|---|---|---|---|---|---|---|---|---|
| Lemon peel | a | 0.0417 | 0.0335 | 0.0296 | 0.0250 | 0.0195 | 0.0213 | 0.0234 | 0.0239 |
| b | 0.0713 | 0.0565 | 0.0560 | 0.0480 | 0.0546 | 0.0570 | 0.0543 | 0.0520 | |
| R2 | 0.9886 | 0.9850 | 0.9881 | 0.9919 | 0.9835 | 0.9721 | 0.9759 | 0.9822 | |
| Grapefruit peel | a | 0.0466 | 0.0326 | 0.0191 | 0.0201 | 0.0208 | 0.0188 | 0.0196 | 0.0213 |
| b | 0.0918 | 0.0718 | 0.0668 | 0.0623 | 0.0727 | 0.0690 | 0.0696 | 0.0786 | |
| R2 | 0.9827 | 0.9819 | 0.9481 | 0.9714 | 0.9524 | 0.9401 | 0.9597 | 0.9388 | |
| Mandarin peel | a | 0.0494 | 0.0302 | 0.0276 | 0.0188 | 0.0168 | 0.0180 | 0.0177 | 0.0195 |
| b | 0.0895 | 0.0738 | 0.0704 | 0.0898 | 0.0614 | 0.0659 | 0.0666 | 0.0753 | |
| R2 | 0.9881 | 0.9824 | 0.9813 | 0.9292 | 0.9361 | 0.9139 | 0.9217 | 0.9117 | |
| Butternut-squash peel | a | 0.0485 | 0.0401 | 0.0370 | 0.0346 | 0.0335 | 0.0339 | 0.0343 | 0.0337 |
| b | 0.0663 | 0.0654 | 0.0636 | 0.0733 | 0.0760 | 0.0752 | 0.0837 | 0.0756 | |
| R2 | 0.9752 | 0.9864 | 0.9887 | 0.9928 | 0.9963 | 0.9954 | 0.9934 | 0.9965 |
| Effect | SS | df | MS | F | p |
|---|---|---|---|---|---|
| Lemon peel | |||||
| Intercept | 2.205 | 1 | 2.205 | 100829.9 | 0.00 |
| Climatic Chamber Operation Time (CCOT) | 0.350 | 13 | 0.026 | 1233.5 | 0.00 |
| Torrefaction Temperature (TT) | 0.047 | 7 | 0.006 | 308.4 | 0.00 |
| Interaction (TT∙CCOT) | 0.025 | 91 | 0.0002 | 12.6 | 0.00 |
| Error | 0.004 | 224 | 0.00002 | ||
| Grapefruit peel | |||||
| Intercept | 3.060 | 1 | 3.060 | 124952.6 | 0.00 |
| Climatic Chamber Operation Time (CCOT) | 0.298 | 13 | 0.022 | 936.6 | 0.00 |
| Torrefaction Temperature (TT) | 0.086 | 7 | 0.012 | 503.3 | 0.00 |
| Interaction (TT∙CCOT) | 0.042 | 91 | 0.0004 | 19.1 | 0.00 |
| Error | 0.005 | 224 | 0.00002 | ||
| Mandarin peel | |||||
| Intercept | 3.134 | 1 | 3.134 | 23974.6 | 0.00 |
| Climatic Chamber Operation Time (CCOT) | 0.295 | 13 | 0.022 | 173.6 | 0.00 |
| Torrefaction Temperature (TT) | 0.098 | 7 | 0.014 | 108.1 | 0.00 |
| Interaction (TT∙CCOT) | 0.054 | 91 | 0.0005 | 4.5 | 0.00 |
| Error | 0.029 | 224 | 0.0001 | ||
| Butternut-squash peel | |||||
| Intercept | 3.776 | 1 | 3.776 | 171662.2 | 0.00 |
| Climatic Chamber Operation Time (CCOT) | 0.642 | 13 | 0.049 | 2248.0 | 0.00 |
| Torrefaction Temperature (TT) | 0.008 | 7 | 0.001 | 53.8 | 0.00 |
| Interaction (TT∙CCOT) | 0.014 | 91 | 0.0001 | 7.3 | 0.00 |
| Error | 0.004 | 224 | 0.00002 | ||
Publisher’s Note: MDPI stays neutral with regard to jurisdictional claims in published maps and institutional affiliations. |
© 2021 by the authors. Licensee MDPI, Basel, Switzerland. This article is an open access article distributed under the terms and conditions of the Creative Commons Attribution (CC BY) license (https://creativecommons.org/licenses/by/4.0/).
Share and Cite
Dyjakon, A.; Noszczyk, T.; Sobol, Ł.; Misiakiewicz, D. Influence of Torrefaction Temperature and Climatic Chamber Operation Time on Hydrophobic Properties of Agri-Food Biomass Investigated Using the EMC Method. Energies 2021, 14, 5299. https://doi.org/10.3390/en14175299
Dyjakon A, Noszczyk T, Sobol Ł, Misiakiewicz D. Influence of Torrefaction Temperature and Climatic Chamber Operation Time on Hydrophobic Properties of Agri-Food Biomass Investigated Using the EMC Method. Energies. 2021; 14(17):5299. https://doi.org/10.3390/en14175299
Chicago/Turabian StyleDyjakon, Arkadiusz, Tomasz Noszczyk, Łukasz Sobol, and Dominika Misiakiewicz. 2021. "Influence of Torrefaction Temperature and Climatic Chamber Operation Time on Hydrophobic Properties of Agri-Food Biomass Investigated Using the EMC Method" Energies 14, no. 17: 5299. https://doi.org/10.3390/en14175299
APA StyleDyjakon, A., Noszczyk, T., Sobol, Ł., & Misiakiewicz, D. (2021). Influence of Torrefaction Temperature and Climatic Chamber Operation Time on Hydrophobic Properties of Agri-Food Biomass Investigated Using the EMC Method. Energies, 14(17), 5299. https://doi.org/10.3390/en14175299