Article

Oxyfuel Combustion of a Model MSW—An Experimental Study

1
Department of Thermal Energy, SINTEF Energy Research, 7465 Trondheim, Norway
2
Agency for Waste Management (REG), City of Oslo, 0516 Oslo, Norway
*
Author to whom correspondence should be addressed.
Energies 2021, 14(17), 5297; https://doi.org/10.3390/en14175297
Submission received: 1 July 2021 / Revised: 18 August 2021 / Accepted: 23 August 2021 / Published: 26 August 2021
(This article belongs to the Special Issue Waste-to-Energy Technology Integrated with Carbon Capture)

Abstract

:
The oxyfuel combustion of a model MSW (municipal solid waste) under various conditions was carried out in a lab-scale reactor. The aim was to study the behavior of MSW and identify challenges and opportunities associated with the development of this technology in the context of integration with CCS (carbon capture and storage). The experimental results show the effects of the oxidizer composition on the combustion process. Complete combustion can be attained under a variety of oxyfuel conditions, and the differences highlighted with O2/CO2 as an oxidizer compared with O2/N2 do not constitute showstoppers. MSW oxyfuel combustion hence offers a great potential for the combined (1) treatment of waste (contaminants’ destruction, volume, and weight reduction), (2) production of heat/power, and (3) CCS with negative CO2 emissions.

1. Introduction

Municipal solid waste (MSW) is a complex mixture produced by households as well as commercial and service activities. The current treatment and disposal methods include landfilling, material recycling (especially for metals, glass, paper products, and plastics) and energy recovery in waste-to-energy (WtE) plants. Composting and biogas production (via anaerobic digestion) are also employed for biodegradable waste fractions. Sadly, adequate waste management is only widespread in parts of Europe, North America, and Asia. Worldwide, an estimated 70% of the solid waste is dumped in uncontrolled dumps or landfills, causing an array of hygienic and environmental problems, including uncontrolled CH4 emissions, a highly potent GHG (Greenhouse Gas) [1]. With an increasing population, improving standards of living for many as well as stronger environmental awareness can only mean that more MSW will be produced in the future, but also that both material recycling and WtE capacities will have to increase on a massive scale.
The development soon-to-be impacting the waste management sector is related to climate change and GHG emissions. The Intergovernmental Panel on Climate Change (IPCC) scenarios [2] modelled for Earth’s climate evolution in the coming decades show that the Paris’ agreement ambitious goals to mitigate temperature increase can only be met with carbon capture and storage (CCS), and, in all probabilities, solutions allowing for negative CO2 emissions, in other words, removing CO2 from the atmosphere. With MSW being mainly biogenic, more than 50% in most European cases [3], CCS integrated with WtE can be a viable CO2 negative alternative in addition to BECCS (Bioenergy carbon capture and storage).
How can CCS be applied to WtE? The main characteristics of WtE are rather different from oil/gas/coal-fired power/heat generation systems, for which CCS has been largely developed. The vast majority of WtE plants in the world are grate-fired installations with a MSW throughput of approx. 200,000 tons per year per plant [3] (European average) and producing heat (district heat, processed heat for the industry) and/or power. Western MSW has a lower heating value of about 8–12 MJ/kg and is highly heterogeneous. It contains many minor and trace compounds not found in other solid fuels, and its properties will vary over time, both on a minute and season basis, making stable operation a challenge and limiting overall energy efficiency. Each ton of MSW produces about one ton of CO2 during combustion. CO2 concentrations in the flue gas are comparable to (wet basis) coal incineration, and a highly advanced flue gas treatment is required to meet emissions values limits. WtE plants are on average much smaller than coal-fired power plants, making downscaling and economy of scale an issue when considering CCS integration.
Despite these specific conditions, post-combustion CO2 capture based on solvents such as amines appears to be promising, as demonstrated by the pilot testing performed by Fortum Oslo Varme in their WtE plant in Klemetsrud, Oslo, Norway [4]. However, for greenfield applications, innovative capture solutions can offer additional benefits. Oxyfuel combustion is combustion using pure oxygen or a mixture of oxygen and (recirculated) flue gas (i.e., mainly CO2) as an oxidizer instead of using air. In this context, the advantages of oxyfuel combustion for CCS are obvious: the exhaust gas is mainly composed of CO2 that can easily be captured through water condensation and removal of impurities. The proposed technological combination (oxyfuel combustion + energy production + flue gas treatment + CCS) for a new generation of WtE plants will offer net negative CO2 emissions + minimal emissions + energy recovery (heat and power from non-recyclables) + safe thermal waste treatment (sanitization, destruction of organic contaminants, reduction in volume and weight). This will make WtE an integral part of a more circular economy.
Oxyfuel combustion has so far been developed and demonstrated for coal [5], for which it has shown great potential. The use of pure oxygen in addition to air or full substitution for combustion in industrial processes has been known for many years [6] for its advantages in terms of higher temperature, lower flue gas volumes, and higher heat transfer rate, amongst others. In the context of MSW oxyfuel combustion integrated with CCS, it seems preferable to keep or modified as little as possible the main features of air-fired grate combustion to benefit from this robust technology experience and know-how. This would include keeping temperatures close to air combustion (especially in the combustion chamber) via flue gas recycling to avoid the need for expensive materials and alloys as well as prevent ash-related challenges such as slagging. However, only limited work has been performed on biomass and waste. The studies using coal have only limited relevance as these three fuels are fundamentally different. Key fundamental findings from oxyfuel combustion of coal include: (1) the oxyfuel combustion environment (N2, CO2) affects the combustion process (devolatilization and char burnout), e.g., the overall char burning rate is lower with CO2 than with N2 [7,8]; (2) to obtain flame stability and ignition similar to air, a O2 concentration of 30 vol% is necessary in CO2 [9]; (3) a general observation (but it cannot be generalized) is that NOx emissions are lower in oxyfuel combustion on an energy basis (mg/MJ) [10] but the NOx concentration (ppm or mg/Nm3) in the flue gas of oxy-combustion is usually similar or higher than that in air combustion [11].
As already mentioned, MSW is highly heterogeneous and contains high levels of moisture and ash, as well as several minor and trace elements not found in coal. Existing studies are focusing on extremely small-scale experiments (thermogravimetric analysis (TGA) for kinetics studies) of individual waste or biomass fractions or investigate the pyrolysis process as the first stage of combustion. Results concerning the combustion process and selected emissions have shown that oxyfuel combustion of MSW is worth exploring further [12]. Key findings on fundamental aspects (TGA of single waste fractions) are similar to coal’s, e.g., the negative effects of CO2 on flame stability and ignition [13], or NOx emissions that are usually reported to decrease with oxy fuel combustion but not in all studies [14,15].
However, the topic requires more laboratory-scale (larger than TGA), well-controlled experimental studies with MSW-like mixtures, rather than individual homogeneous fractions and using advanced analytical measurements. It is especially interesting to explore several key aspects simultaneously in a continuous thermal conversion process, namely temperature, combustion stability, and emissions, as performed in this study.
In this work, we aim at demonstrating the feasibility of oxyfuel combustion with MSW using lab-scale experiments and discuss advantages as well as any showstopper for this technology in the context of CCS integration for WtE. We will carry out this work by comparing air and oxy-combustion characteristics for MSW at different conditions and determining the fundamental behavior of MSW during oxyfuel combustion.

2. Materials and Methods

2.1. Experimental Set-Up

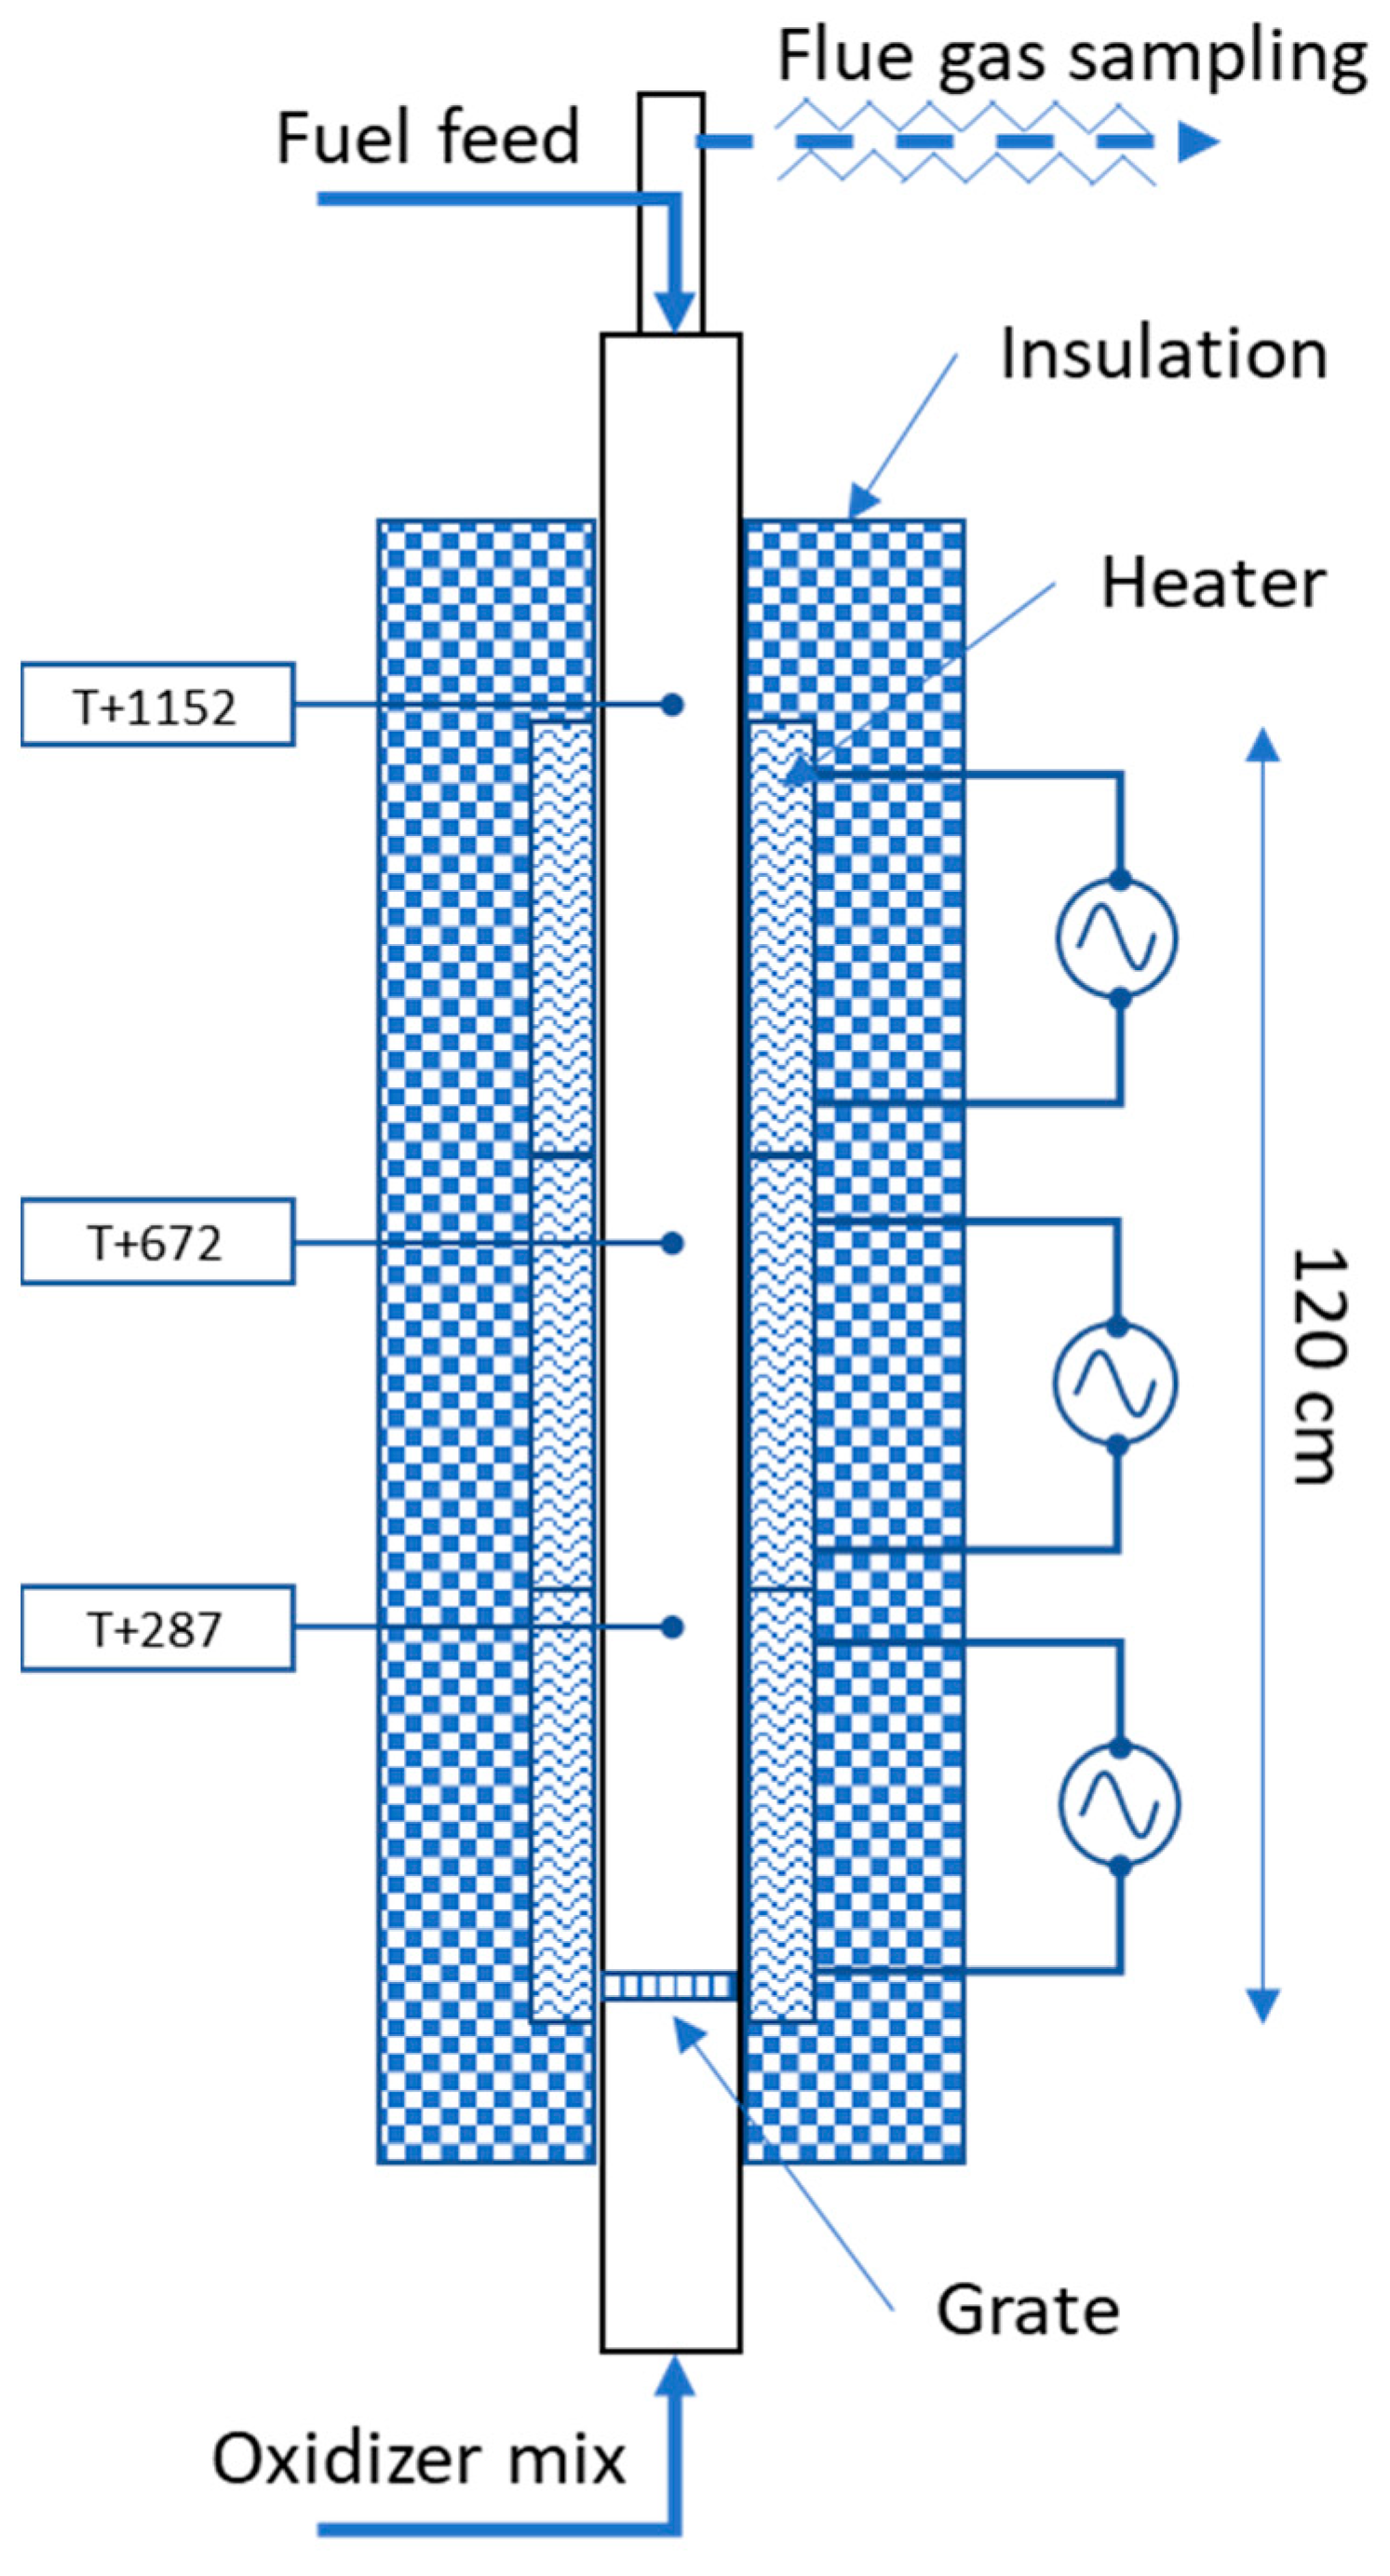
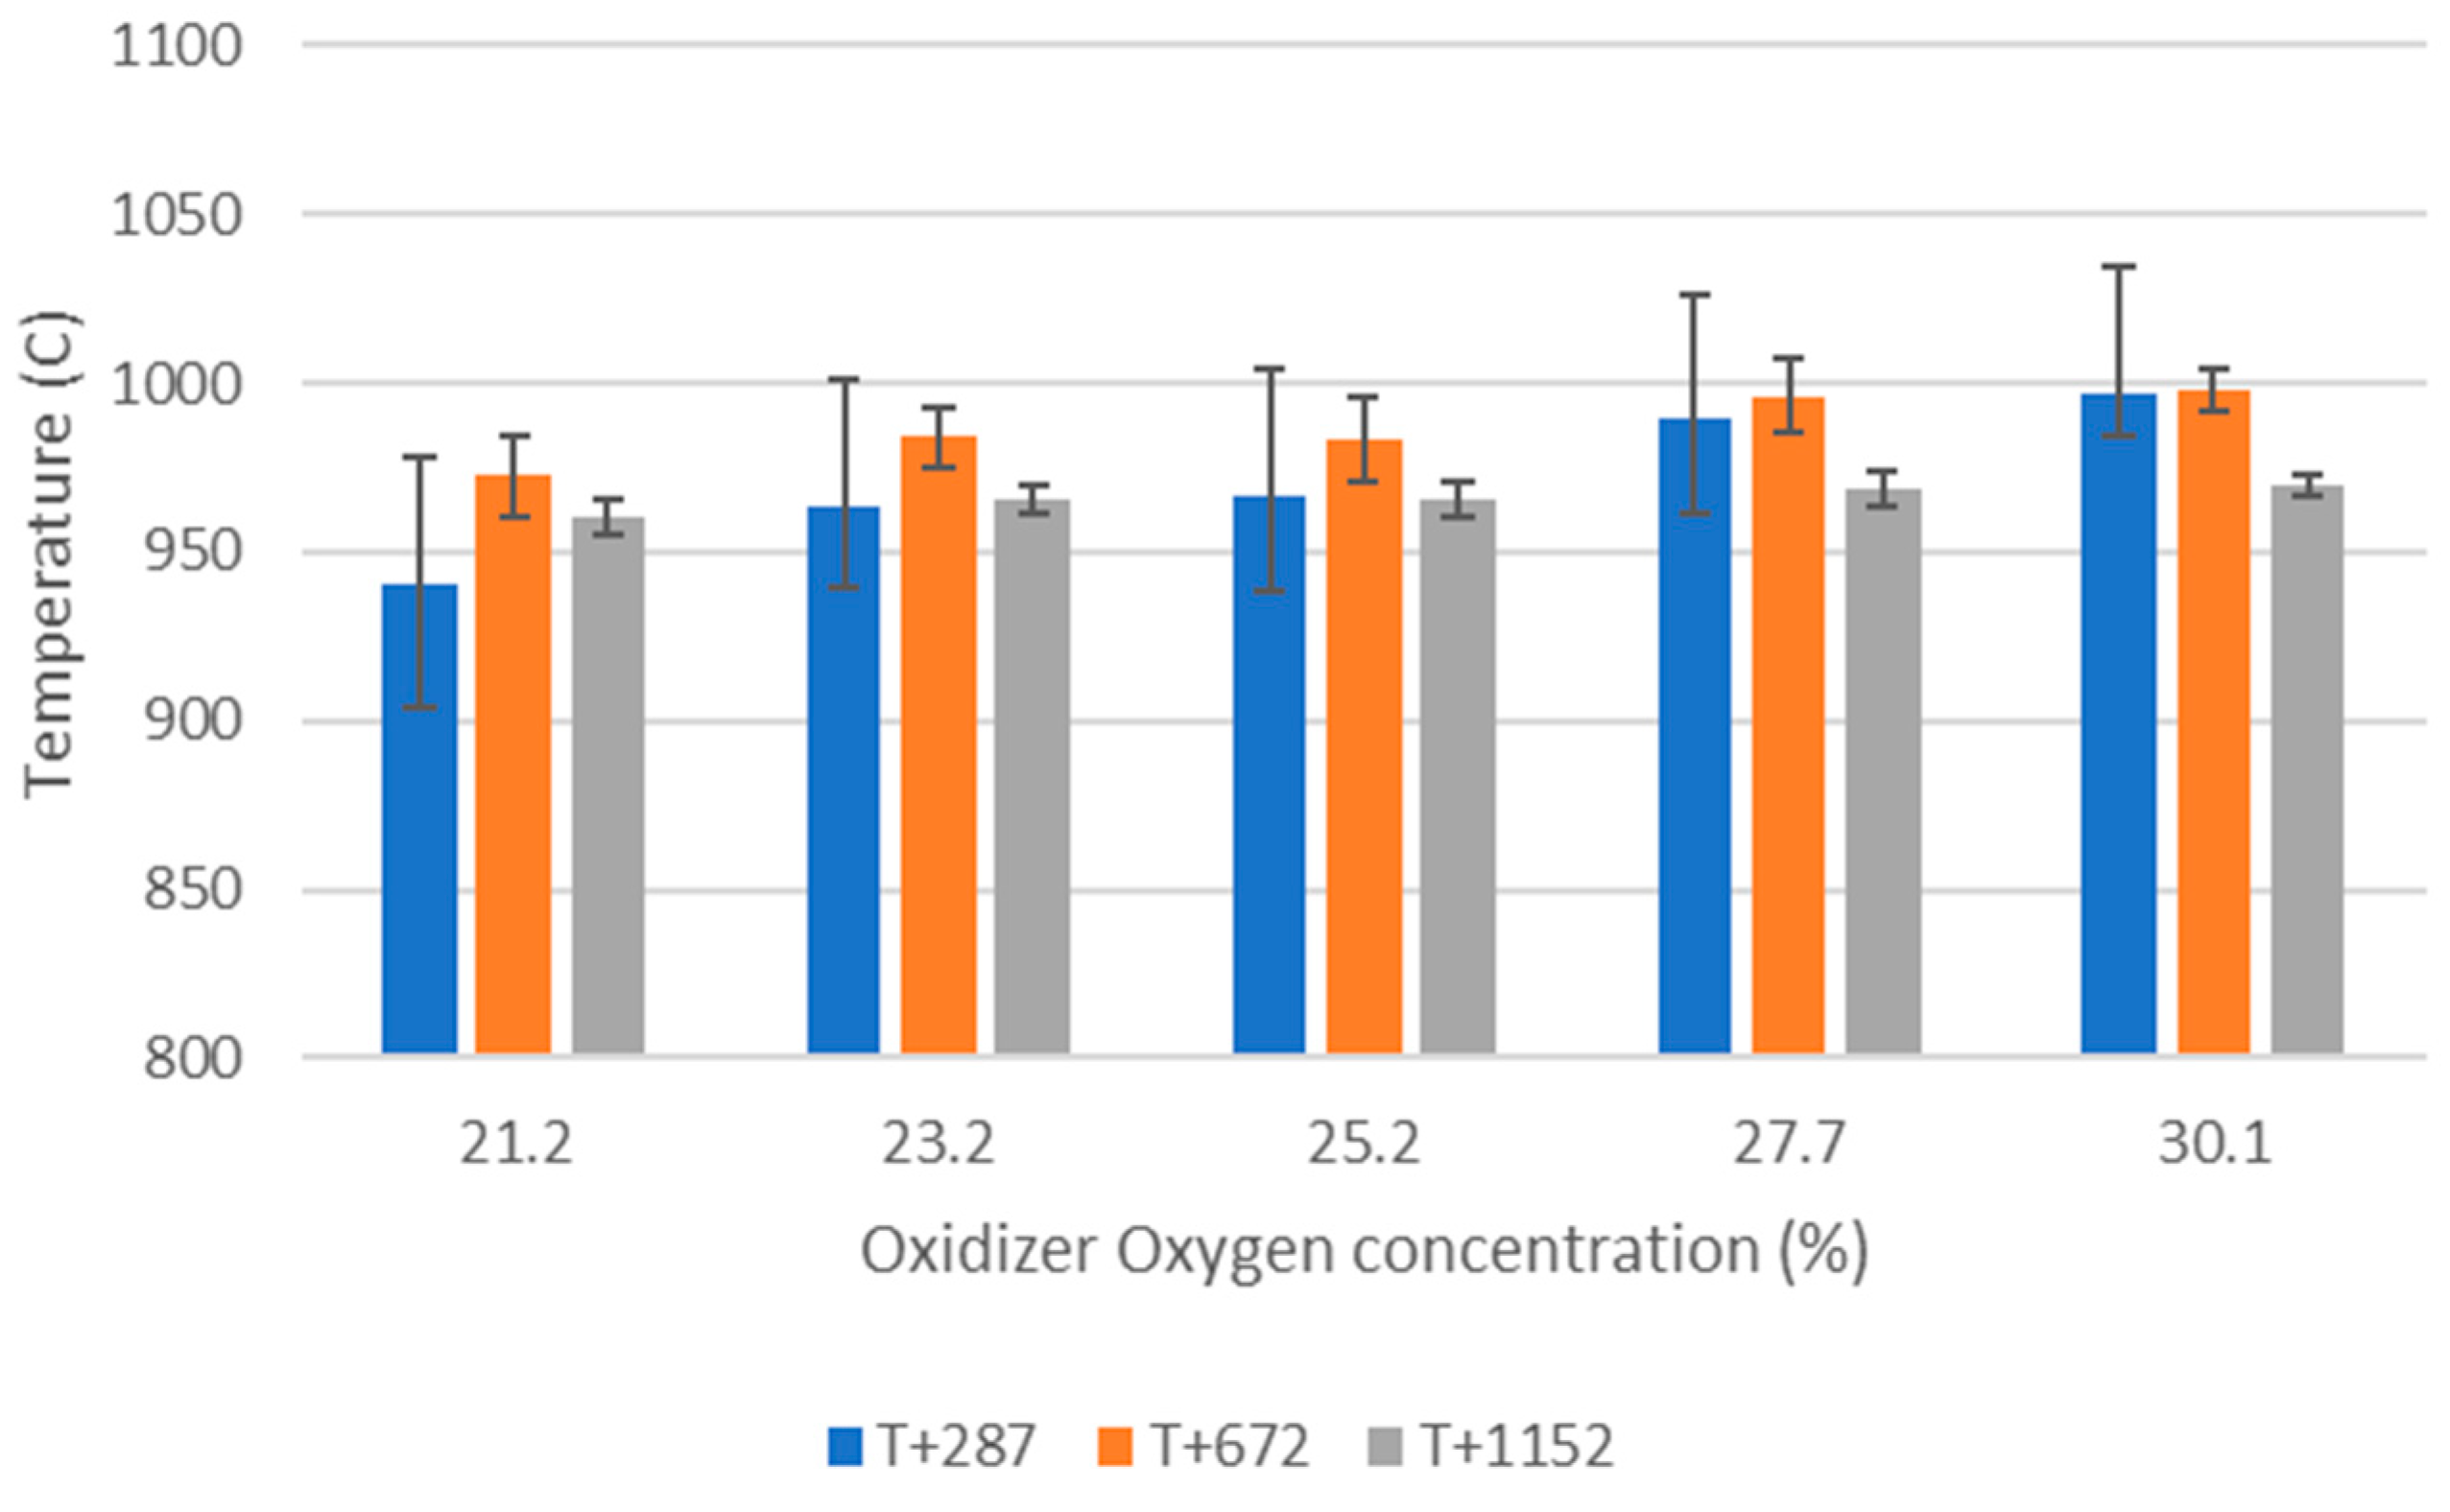
Figure 1 shows the vertical tube furnace (VTF) reactor used in this study. It includes a 2000 mm long, 120 mm inner diameter tube, at the bottom of which a perforated grate is placed. The ceramic tube is surrounded by 3 separate electric heaters and insulation. Three thermocouples (T+287, T+672 and T+1152, the number indicating the distance from the grate in millimeters) placed as shown in the figure allow to monitor the temperature inside the reactor.
The feedstock is introduced from the top using a feeding screw while the oxidizer gas mixture is introduced from the bottom section. The exhaust gas exiting the reactor at the top section is sampled and passed through a heated line to an FTIR analyzer and then after condensation of its water content, to an O2 analyzer. The FTIR analyzer (Gasmet DX-4000) has a 0.4 L volume cell with a 5 m pathlength and an 8 cm−1 resolution. It monitors major and minor species of interest including water vapor and used a factory-set calibration setup specifically designed for high CO2 (up to 85%) and high water vapor (up to 50%) concentrations. Two calibration series are used for CO, one at ppm level and the other at low% level. The O2 analyzer is of paramagnetic type, which has a better accuracy and utilization range than the built-in zirconium cell found in the FTIR instrument.
Up to total gas flow rates of approximately 290 NL/min (at 1000 °C), the reactor flow is laminar. The Reynolds number is approximately 1200–1300 for the gas flow rates of interest in this study (160–170 NL/min). The residence time in the reactor is estimated to be ca. 1.6 s. in the heated and insulated zone for gas flow rates of 150–170 NL/min at 1000 °C. The pressure was measured at the top and the bottom of the reactor tube to detect any blockage. Ash samples are collected at the end of each day. The experimental reproducibility has been investigated and is good.

2.2. Materials/Feedstocks

One feedstock is used in this study: model MSW pellets.
MSW is a complex, changing, heterogeneous mixture made of a variety of materials, i.e., food, paper, plastic, woody, and non-woody biomass, textiles, metal, glass, and more. Each material can be divided into sub-fractions, e.g., the plastic fraction is made of HDPE (high density polyethylene), PVC (polyvinylchloride), PE (polyethylene), PS (polystyrene), etc. In this study, it is deemed essential to have a good control over the fuel properties while realistically portraying the main characteristics of MSW. After careful consideration, the following mixture (or model MSW) was selected: 10 wt% cardboard (packaging box), 40 wt% virgin wood (from wood pellets) and 50 wt% white office paper, with the overall properties listed in Table 1. The resulting mixture exhibits an elemental composition close to many western-type MSW [3]. It is a simplified MSW, but correctly reflects the main aspects of MSW, most importantly, moderate energy content (less than 20 MJ/kg) and high ash content (above 5 wt%).
Plastic (less than 10–12 wt% in most EU MSW) was not included due to the risk of melting on the grate that could damage the reactor. Furthermore, increasing material recycling rates will soon reduce its content in MSW going to WtE.
Biodegradable waste (e.g., food) was not included to avoid hygienic issues during storage and handling of the model MSW. However, it is represented by wood in the model MSW. Like plastic, food waste (in the EU) will be increasingly sorted out for separate treatment (or collected separately) to fulfill EU material recovery rates targets.
Metal and glass were not used as they mainly act as heat sinks (even though melting might happen, for example, for aluminium).
The model MSW is prepared by shredding the various constituents to approximately 5–6 mm particles before mixing them thoroughly (including wetting to ease blending and pelletizing) at the pre-defined proportions. The resulting mixture is then pelletized before being dried to approximately 3–5 wt% moisture content.

2.3. Practical Comments on the Set-Up: Feeding System and Changing Operational Conditions

The screw used for fuel feeding had a direct impact on the overall appearance of the emissions trace that exhibited what can be described as small oscillations or variations. The feeding system employed resulted in a kind of “pulsed” (rather than continuous) introduction of pellets, dropping 1–3 at a time before a pause of up to a few seconds depending on the feeding rate. In addition, it was observed that the screw sometime broke pellets while feeding. These phenomena were responsible for minor and random variations but did not have any effect on the validity of the results that are presented as average values. Note that this comment does not apply to large emissions peaks observed when operating conditions are changed and that are due to other processes, e.g., a transient, unstable combustion process.
Furthermore, two distinct events lead to unstable conditions: (a) experiment start-up, as it takes a few minutes for the process to stabilize when feedstock is first introduced, and (b) when changing experimental conditions.

2.4. Method/Procedure and General Comments on the Experiments

The overall procedure of an experiment follows these steps (see Figure 1):
  • The reactor is heated overnight and left to stabilize at a given reactor temperature, typically 1000 °C. A moderate flow of air is maintained.
  • The reactor is operated continuously at a defined fuel effect (i.e., fuel feeding rate), typically 1.3 kg/h, via a screw feeder placed at the top of the VTF furnace.
  • The oxidizer mixture (air, N2 or CO2 with various O2 concentration) reaches the grate and the feedstock from below (typical total gas flow rate in: 150–300 NL/min).
  • Temperatures (3 thermocouples are placed inside the reactor (see Figure 1); pressure difference (between reactor top and bottom) and gas emissions (exiting from the top of the reactor to an FTIR) are measured and recorded continuously.
  • Each experimental period (time during which all parameters are kept constant) lasts from approx. 45 min to approx. 2 h.
The key parameters and variables in this study (experimental matrix in next section):
  • Feedstock–model MSW.
  • Fuel feeding rate–fixed at 1.3 kg/h.
  • Reactor temperature (electrically controlled)–fixed at 1000 °C.
  • Oxidizer/gas mass flow rate in—varying or fixed.
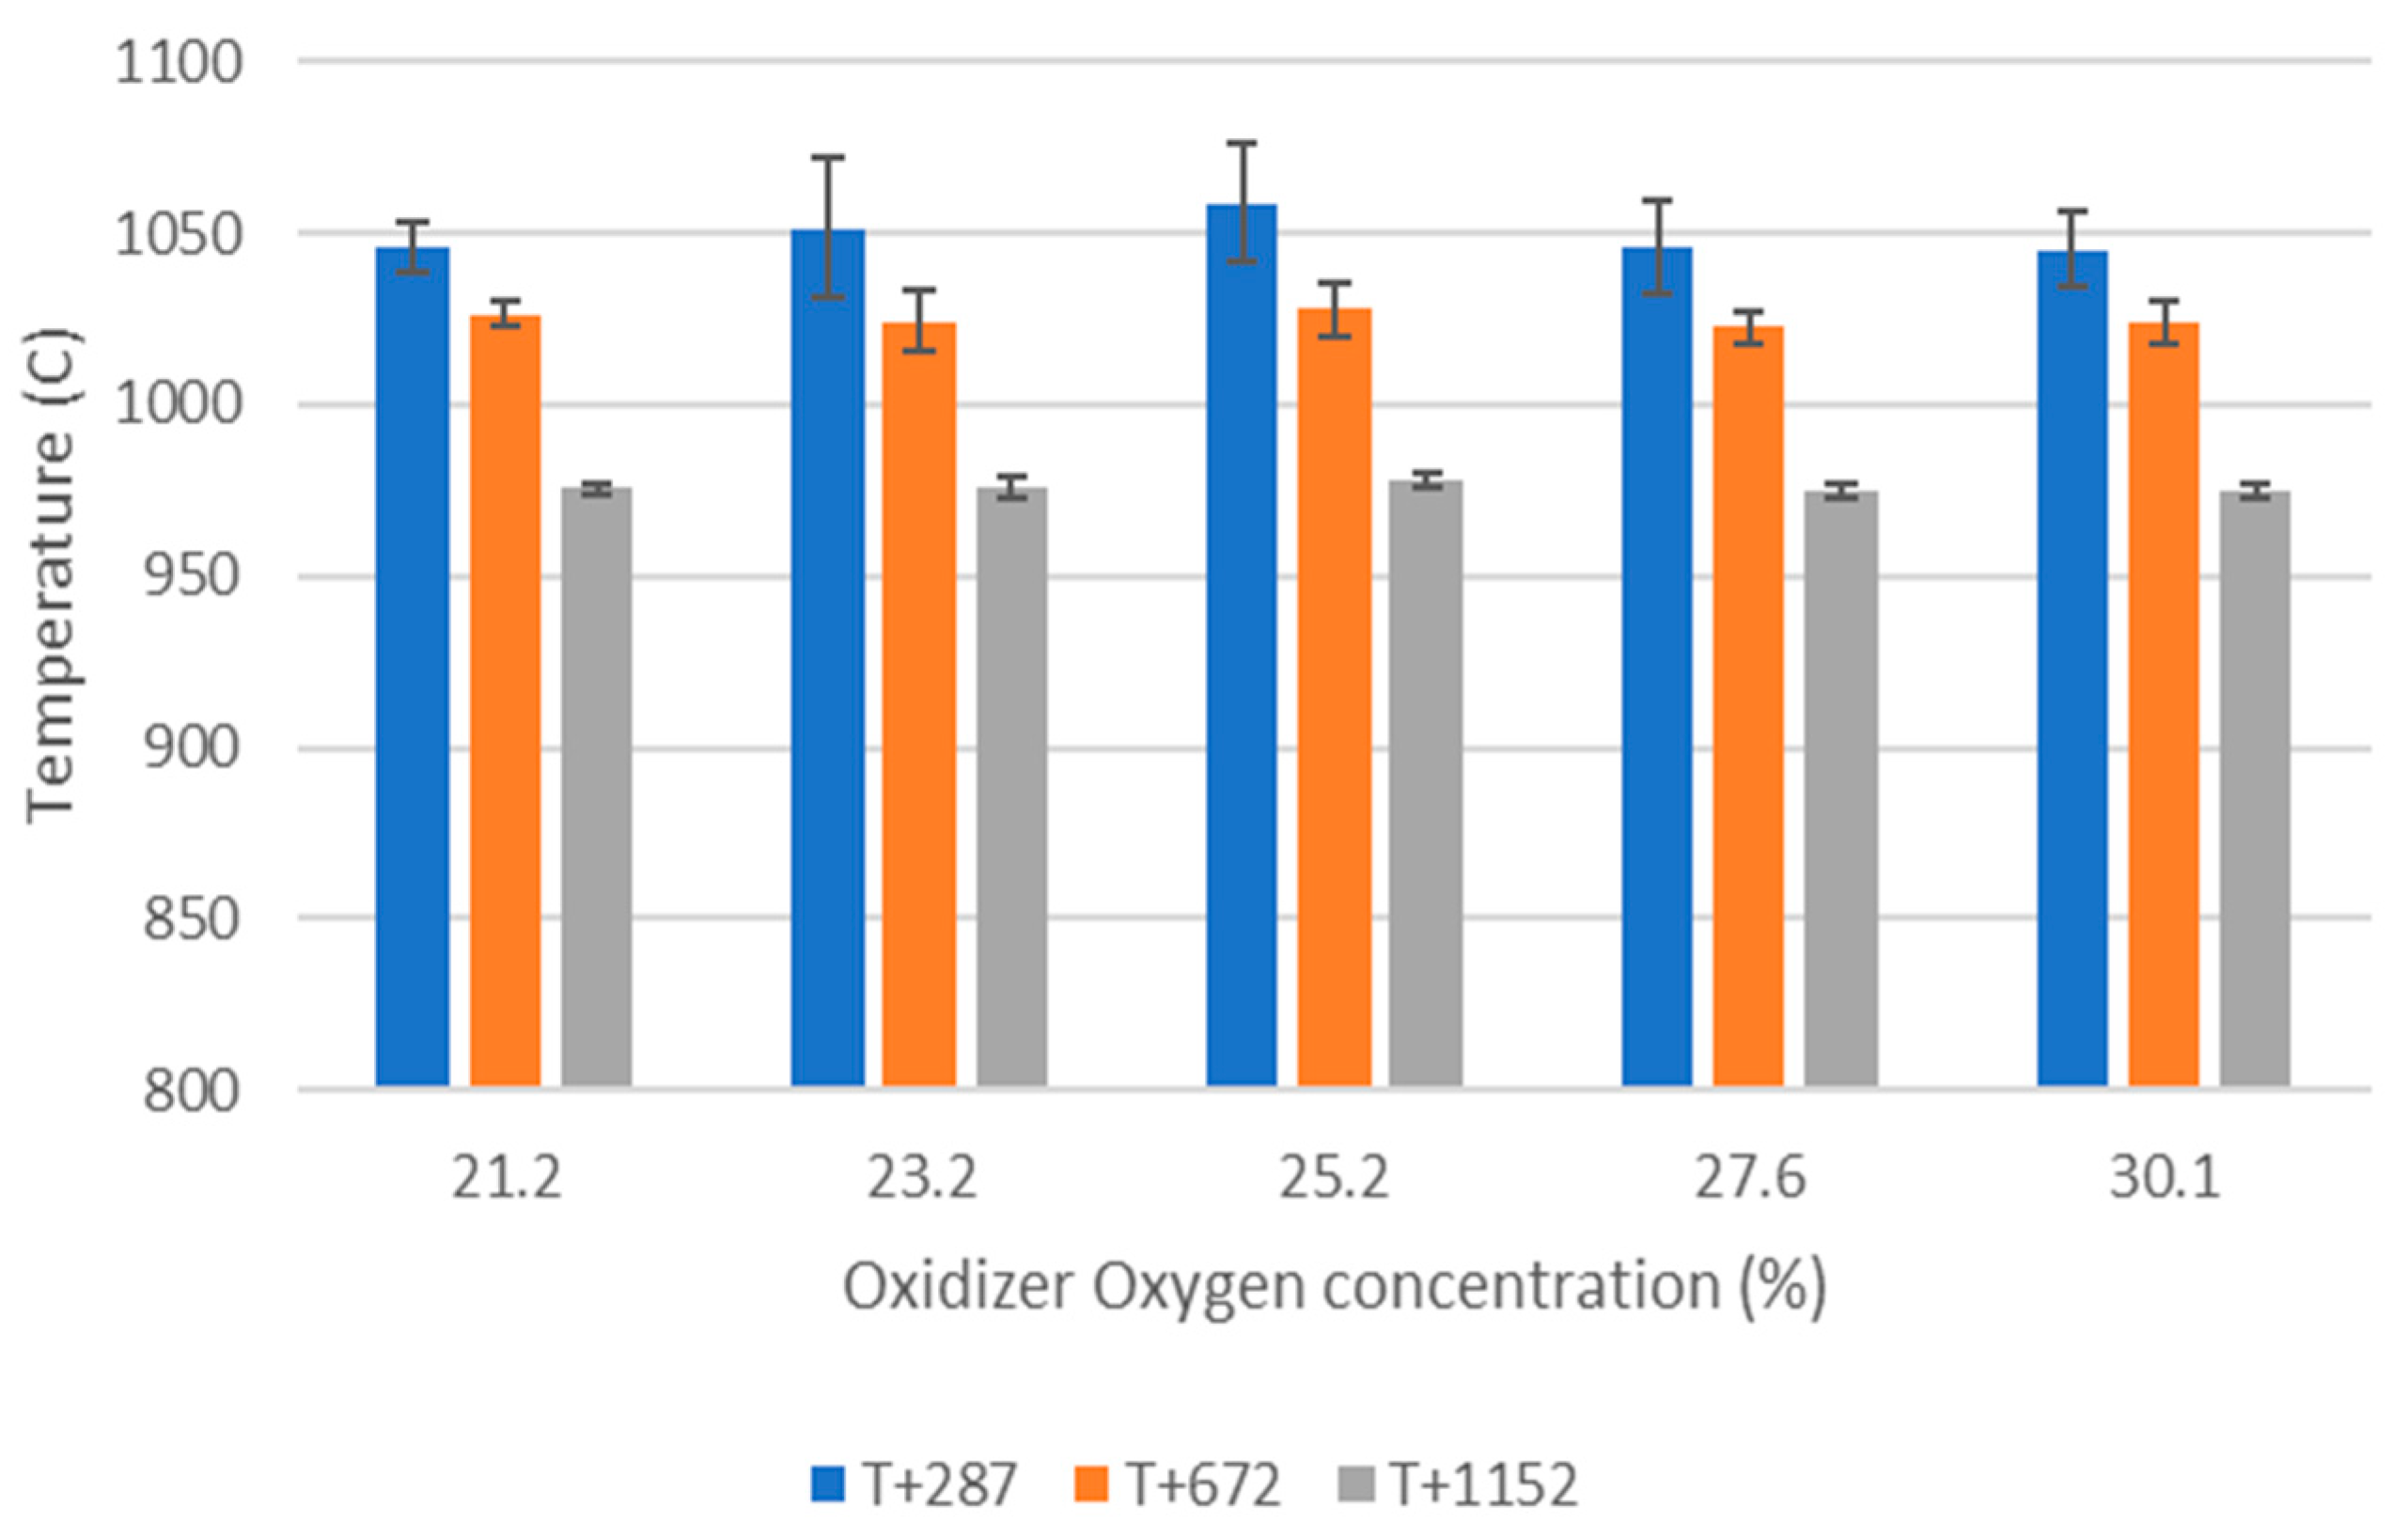
  • O2 concentration—varying from 21 to 30 vol%.
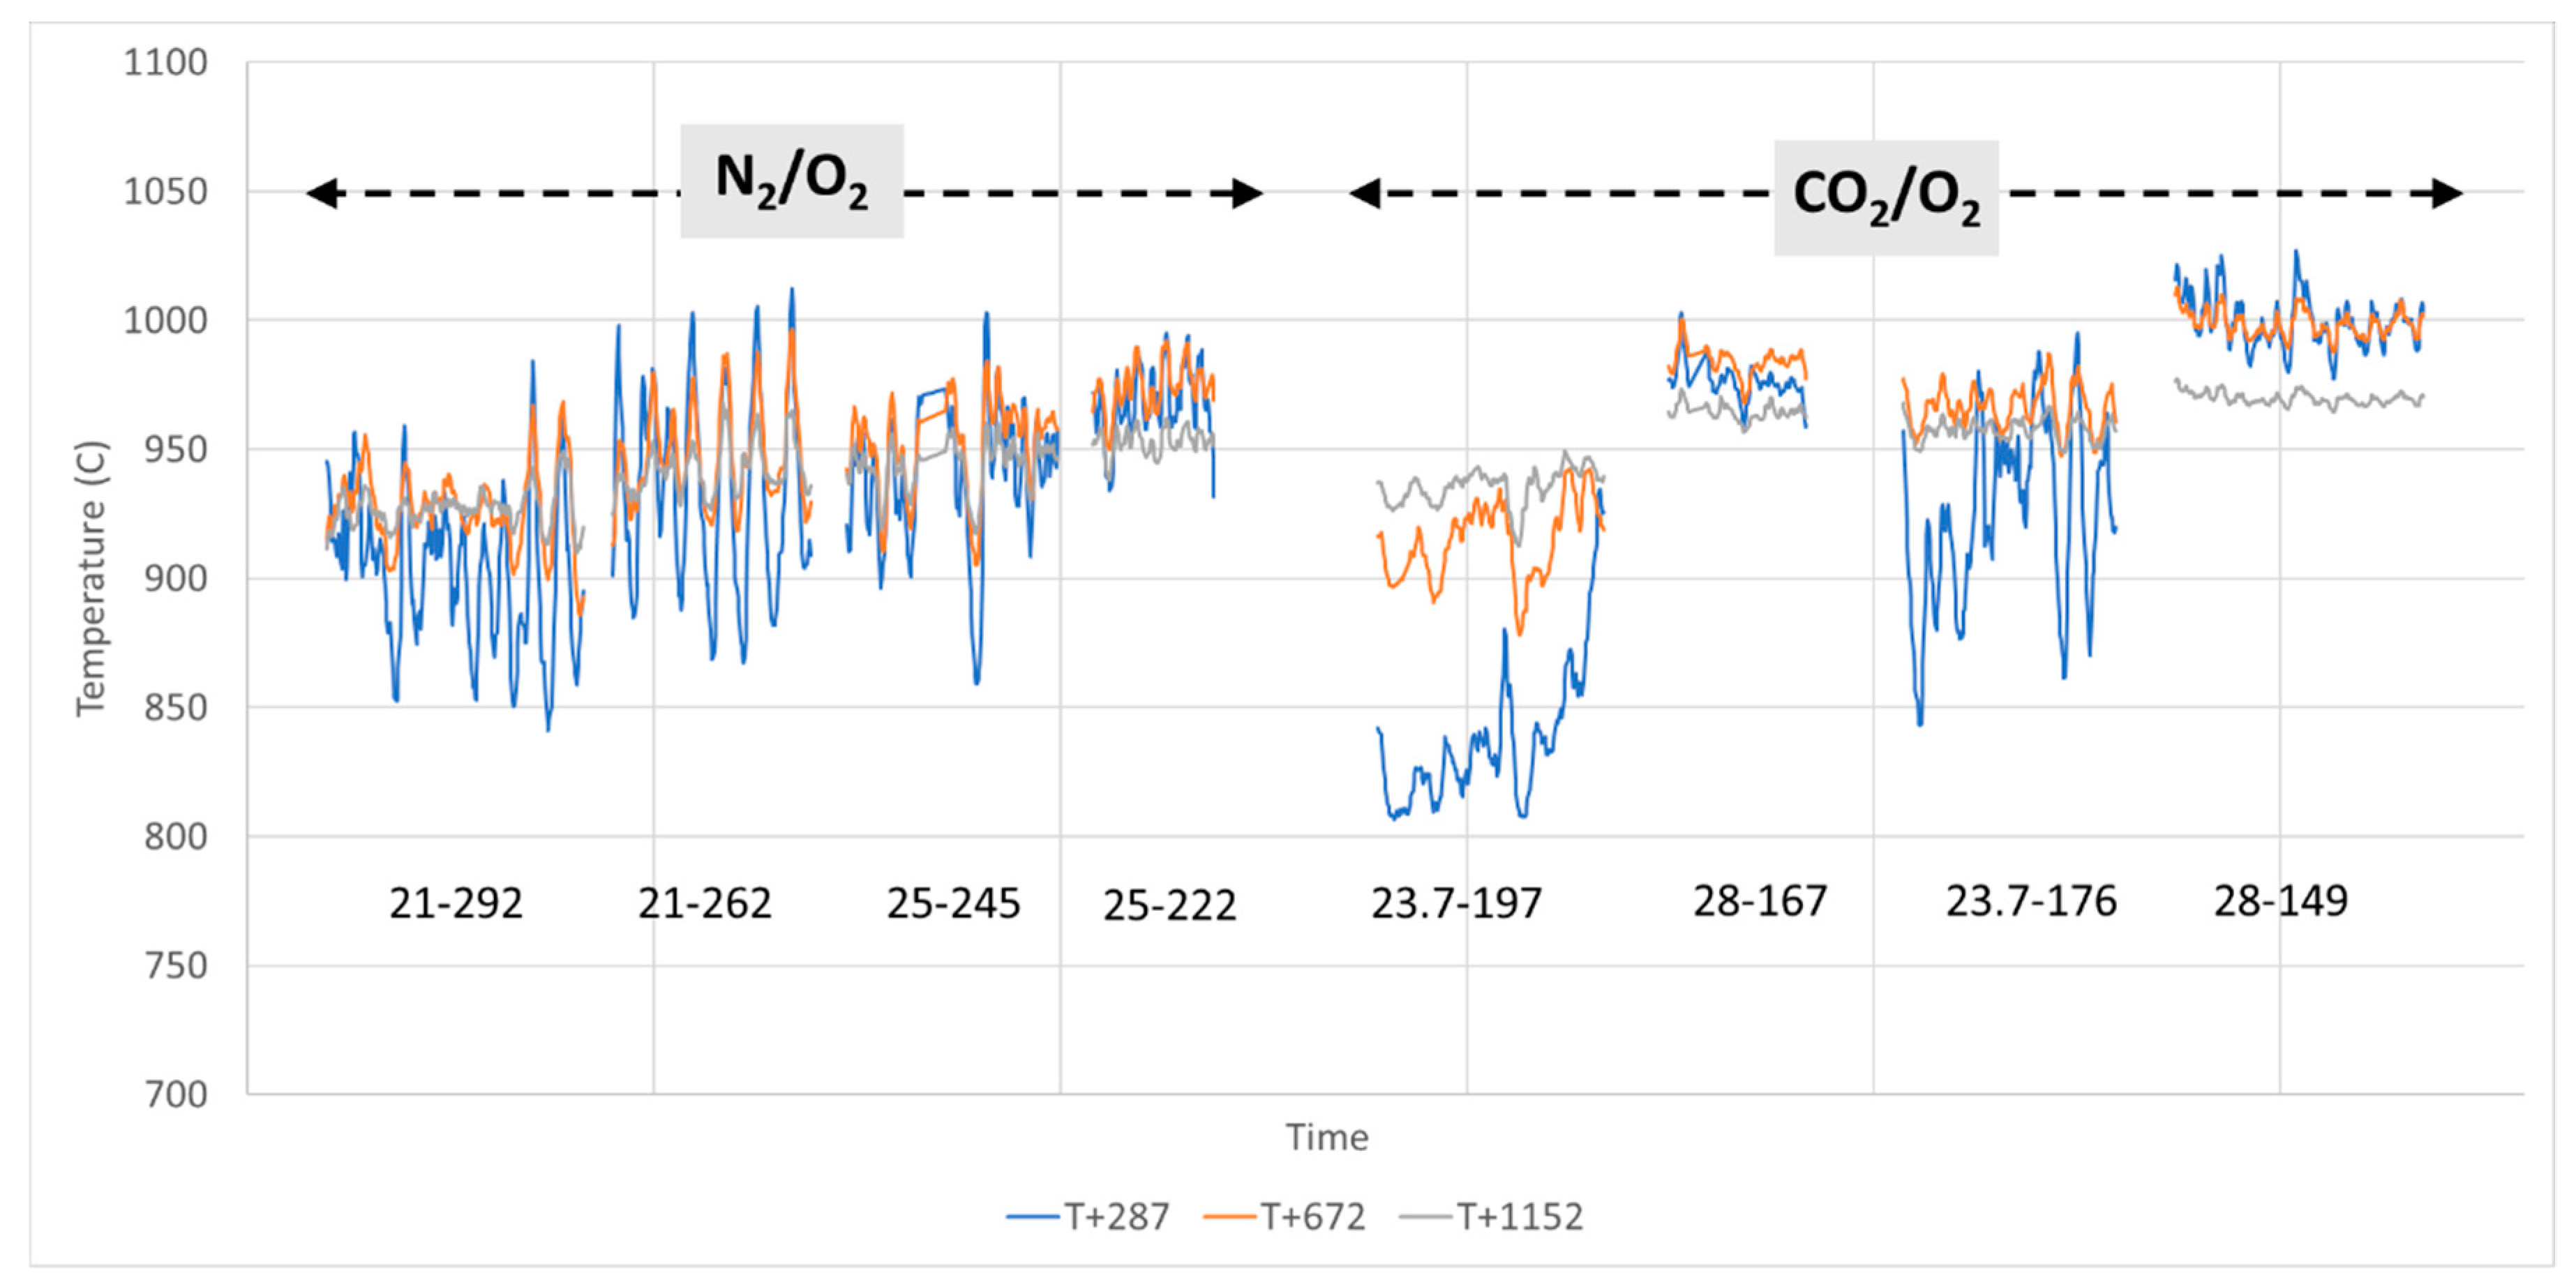
  • Oxidizer composition—CO2 or N2 together with varying O2 concentrations.
The main experimental results investigated in this study:
  • Combustion quality and stability:
    CO and UHC (unburned hydrocarbons) as main indicators.
    Temperatures inside the reactor (3 thermocouples (TC) along the VTF).
    O2 and CO2 in exhaust.
  • Gaseous pollutants emissions:
    NOx emissions.
The calculated carbon mass balance was satisfying for the experiments, on average 100–120%. Deviations may be due imperfect waste fractions mix in the pellets, varying moisture content (the pellets were not stored under controlled humidity conditions), and analysis limitations, e.g., varying logging time.
The Results and Discussion section provides a concise and precise description of the experimental results, their interpretation and comparison with relevant literature, as well as the conclusions that can be drawn from them.

3. Results and Discussion

3.1. The Experimental Matrix and Main Averaged Results

Table 2 and Table 3 present the experimental conditions and the main averaged results. Gaseous emissions are normalized (mg/Nm3, dry basis, 11% O2).

3.2. Combustion Quality and Stability

3.2.1. Heat and Temperature

The reactor is operated at a temperature of 1000 °C (electrically maintained), which is representative of average combustion temperatures found in the waste bed on air-fired MSW grate incinerators. There are several temperature measurement stations as described in Section 2.1, three of which are placed inside the combustion zone (see Figure 1).
In Figure 2, one can observe the effect of parameters such as oxidizer flow velocity on the reactor behavior, where at higher flow velocity the temperature fluctuates considerably, a sign that the combustion process is affected by intermittent quenching due to a higher equivalence ratio and possibly turbulence effect. The largest fluctuations occur near the grate, where the combustion is starting, but is felt all along the reactor. Note also that the oxidizer gas is injected at the bottom of the reactor at room temperature and the distance to the grate is too short for the oxidizer to reach 1000 °C at the grate’s level. The time series shows that the highest fluctuations tendency is observed with a combination of low reactivity oxidizer (i.e., CO2 as inert and low O2 concentration) and high velocity, where the temperature is highly unstable (see case 23.7% O2 in CO2 at 197 NL/min). An extensive screening has been performed to define an optimal operating range of flow velocity for the cases of interest, which all need to be within cold flow laminar conditions. These tests show that it is important that the temperature measurements are discussed in correlation with the electric power applied to maintain the temperature in the reactor.
By operating the reactor without combustion and only air flowing, it was measured that the heat losses through the wall at 1000 °C and the necessary water cooling of flanges are approximately 4 kW. When the fuel is fed into the reactor and combustion initiates, the heat released from combustion can be calculated to be around 6 kW independently of the oxidizer composition tested, which is in agreement with the feeding rate of MSW pellets (1.3 kg/h equivalent to 20.5 MJ/h or 5.7 kW).
Figure 3 shows the reactor temperatures at different O2 concentrations with N2 in oxidizer. The heat release occurs mostly near the grate as the highest temperatures are observed at the station closest to the grate “T+287”, i.e., the thermocouple located 28.7 cm above the grate while the electric heater nearest to the grate (“Power bottom”) delivers the lowest power, as shown in Figure 4. The top electrical heater (“Power top”) delivers the highest output to keep the top section of the reactor at 1000 °C to compensate for heat losses. The pattern is rather insensitive to oxygen concentration, apart from a natural tendency for less electrical heating when oxygen concentration increases due to higher heat release at the bottom of the reactor.
When the oxidizer is composed of CO2 instead of N2, the situation in the reactor is affected negatively. To sustain combustion, larger electrical heating is needed as shown in Figure 4, where at 25.2% O2 in CO2 the total electric heating applied is twice as much as in the N2 case. This can be directly related to CO2 and N2 different heat capacities. At room temperature, CO2 has a heat capacity of about 37 J/(mol·K) while N2’s is only about 29. Furthermore, the electrical heating is needed mostly at the bottom of the grate, indicating that the combustion heat release is low in that section. The reactor temperatures shown in Figure 5 are indeed highest at the mid-section and barely reaching 1000 °C, even at 30% O2 in N2. The error bars for the temperature at T+287 showing the amplitude of fluctuations (i.e., root mean square) are high, meaning that all the combustion steps (devolatilization, gasification, oxidation) occurring as the MSW pellets fall on the grate are more intermittent and generally less stable. Only the case at 30% O2 in CO2 gives temperature distribution in the reactor similar to the air case. A result in accordance with observations made with oxyfuel combustion of coal [9].

3.2.2. CO (+CH4, Hydrocarbons)

CO is the main indicator of the combustion process quality (full oxidation) and stability. Poor combustion conditions, especially local reducing conditions due to, e.g., inadequate mixing between fuel and oxidizer or cold spots will lead to (often short-lived) CO peaks. As such, its emission levels are regulated for incineration of MSW. As a reference, the CO BAT-AEL (best available technologies associated emission levels) is 10–50 mg/Nm3 for new and existing WtE plants (daily average) [3].
For all the model MSW experiments carried out under a variety of conditions (see Section 3.1), stable combustion is achieved with low average levels of CO (below 35 mg/Nm3) and none or extremely few individual peaks, occurring mainly when conditions are changed (removed for averaged values). Figure 6 and Figure 7 show the standardized, average CO emissions during model MSW combustion at various O2 concentrations and mixtures (alternatively N2 and CO2). Overall: (1) CO emissions are slightly higher with CO2 than N2 (but still extremely low), (2) CO emissions variations (given as standard deviation) seems to be larger with CO2 than with N2, and (3) these variations seem to be increasing in magnitude with increasing O2 concentrations (clearly noticeable for O2/CO2), but acceptable combustion conditions are still attained for all the cases studied.
The overall conclusion is that our experimental results show the potential offered by oxyfuel combustion of MSW: the model MSW, under different stoichiometries and residence times, O2 concentrations (ranging from 21 to 30 vol%) in both CO2 and N2, can be properly combusted at similar, low levels of CO, although there is a clear tendency for higher CO values with CO2 in the oxidizer. As an example, at similar O2 concentration (25 vol%) and overall conditions, CO concentration and oscillations are approximately 3 times higher with CO2 than with N2. This detrimental effect of CO2—also discussed in Section 3.2—on the combustion process agrees with the literature on oxyfuel combustion for coal, where it has been shown that CO2 can have a strong impact on ignition, flame stability, and char combustion (see Introduction), mainly because of its higher heat capacity compared with N2.
The hydrocarbons measured by FTIR analysis (i.e., CH4, C2H6, C2H4, C3H8, C6H14) are found at extremely low levels (1–3 ppm at the most) except in specific instances, especially daily start-up and usually for less than 1 min, confirming the complete combustion in all oxidizer compositions investigated.

3.2.3. O2 and CO2 in Exhaust Gas

Industrial, full-scale WtE plants must operate with excess air due to the process instabilities (mainly associated with MSW heterogeneity and changing properties), resulting typically in 5–6 vol% O2 in exhaust gas (wet basis) corresponding to 40% excess air ratio [16], although it is not unusual for older plants to operate at 8–10 vol% O2. Operating at as low as possible excess air while ensuring satisfyingly low CO emissions offer several advantages, among others lowering NOx production and reducing heat losses due to unused air (mainly N2) in the system. It has been shown that it is possible to operate WtE plants with 3 vol% O2 in the exhaust gas (lambda below 1.20) [16]. In our work, optimal excess air operation was not the main concern. Only a single primary air supply is used, and hence mixing between fuel and oxidizer is probably not optimal and limited by the set-up configuration (fixed grate, tube reactor, cold oxidizer, gas pre-mixing, and distribution). Under acceptable conditions with air, the reactor operated with 5–10 vol% O2 in the exhaust (wet basis) corresponding to lambda of 1.5+. Optimizing air excess ratio and oxidizer addition supply strategy will be necessary when further developing MSW oxyfuel combustion.
For the experiments using CO2 in the oxidizer (see Table 2), CO2 concentrations in the exhaust gas vary between 78.5 and 86.6 vol% (wet basis), while with N2 in the oxidizer (See Table 3), CO2 concentrations are approximately 10–11 vol% (wet basis). Higher CO2 concentrations are an important factor facilitating CCS. The ability to carry out a stable and complete combustion process for MSW in CO2 rather than N2 as demonstrated in this study is an important step in the development of oxyfuel combustion as a viable CCS route for WtE.

3.3. NOx (NO, NO2), N2O and Other Gaseous Pollutants

In the EU, several emissions to air from WtE are regulated. This includes dust, metals, metalloids, mercury, HCl, HF, SO2, NH3, and organic compounds (dioxins, furans, PCBs). In addition to the main combustion products, our FTIR (see Section 2.1) is calibrated to measure HCl, HF, SO2, HCN, and NH3 online. Minute levels of the aforementioned species (1–2 ppm) were detected during the experiments. It is to be expected as the model MSW has low levels of S and Cl. Oxyfuel combustion will not create new challenges regarding these pollutants and it is expected that they will be handled as with air combustion as the same fundamental chemical processes can be expected below 1500 °C.
NOx is highly sensitive to temperature and O2 availability, two parameters affected by oxyfuel combustion compared with air combustion. In MSW incineration, NOx is overwhelmingly formed via the fuel NOx mechanism where HCN and NH3 released from the feedstock are oxidized to NO [17]. A lack of oxidizer will hence limit fuel-NOx formation. Thermal NOx, and even more so prompt NOx, are not expected to play an important role in air-fired MSW grate incineration. Temperature control (using recirculated flue gas) with oxyfuel combustion of MSW should ensure that fuel NOx remains the only NOx forming mechanism. Our experiments show the intertwined influence of turbulence, temperature and O2 availability on NOx formation during oxyfuel combustion.
The experiments show that NO emissions increase with increasing O2 concentrations, (see Figure 6, Figure 7 and Figure 8 and Table 2 and Table 3). Only minute amounts of NO2 and N2O are detected. Increasing from 21 to 30 vol% O2, the normalized NOx emissions are more than doubled. This confirms that O availability is paramount to NOx formation in the system studied. While NOx emissions are often reported to decrease (on energy basis) in an oxy-combustion system with coal [10], the NOx concentration in the exhaust gas is usually similar or higher than with air combustion [11]. Most oxy-combustion studies concerning waste and biomass are limited to TGA kinetics studies of biomass residues and individual waste fractions, but the increasing and stabilizing NOx trend observed here is in accordance with the existing literature [18], even though the actual emissions levels will be strongly dependent on the fuel and the operating conditions. There are no significant differences between experiments with N2 and CO2 at 21–25 O2 vol%, but NOx emissions seem a bit higher in CO2 above this point and reach a plateau at approx. 250–350 mg/Nm3. The CO2 thermal properties (higher heat capacity than N2) are not affecting NOx formation when compared at equal O2 concentration because the reactor is set at a constant temperature; therefore, the lower combustion temperature with CO2 is compensated by higher electrical heating (see Section 3.2.1). Thus, in Figure 8, the thermal effect on NO formation is decoupled from the chemical effect of oxygen and it allows to conclude that CO2 is not chemically involved in the formation of NOx in this temperature range. There could also be an additional effect due to increased local turbulence (and hence better gas phase mixing) when shifting from N2 to CO2 as suggested by the more unstable CO emissions.
Even though the results obtained in this laboratory scale set-up cannot be directly extrapolated to an industrial grate furnace, they represent the chemical phenomena where combustion takes place, and NO formation occurs. Comparing the propensity of NO to form in air and oxyfuel mode allows to predict that NOx should not be a major issue. Therefore, similar NOx reduction measures (primary and/or secondary) as in conventional plant should be sufficient. The higher concentrations obtained if the local O2 concentrations are purposedly selected higher (to achieve for example higher local temperature or higher heat release rate) could lead to higher NOx concentration in the flue gas and to higher reduction costs; however, the reduced flue gas volume could compensate that effect.

3.4. Important Considerations for a Full-Scale MSW Oxyfuel Combustion Plant

An important aspect that should not be neglected even at the early stages of MSW oxyfuel combustion development is the question of legislation and operation permit. Oxyfuel combustion may be considered significantly different from air combustion and several aspects (e.g., residence time, temperature, flue gas amounts, emissions levels) may require new/revised legislation and a new kind of operation permit. This is most certainly a time-consuming and uncertain undertaking. Risks and uncertainties can be reduced if the system proposed remains similar to traditional grate-fired incineration, as we strongly recommend.
We believe that for optimal implementation of (1) oxyfuel combustion for proper destruction of contaminants in non-recyclable MSW, (2) heat/power production, (3) efficient flue gas cleaning, and (4) carbon capture, new plants especially designed are the preferred option. The best overall approach would be to remain as close as possible to the existing air-fired grate installations in terms of design, processes, technologies, and materials. Even though savings in terms of equipment size can be expected, additional costs for O2 production, temperature monitoring, and control may be necessary (and possibly the need for secondary NOx reduction measures). The example of the SYNCOM technology [19] shows the advantages and challenges observed in a grate system at low/intermediate levels of oxygen enrichment.

4. Conclusions

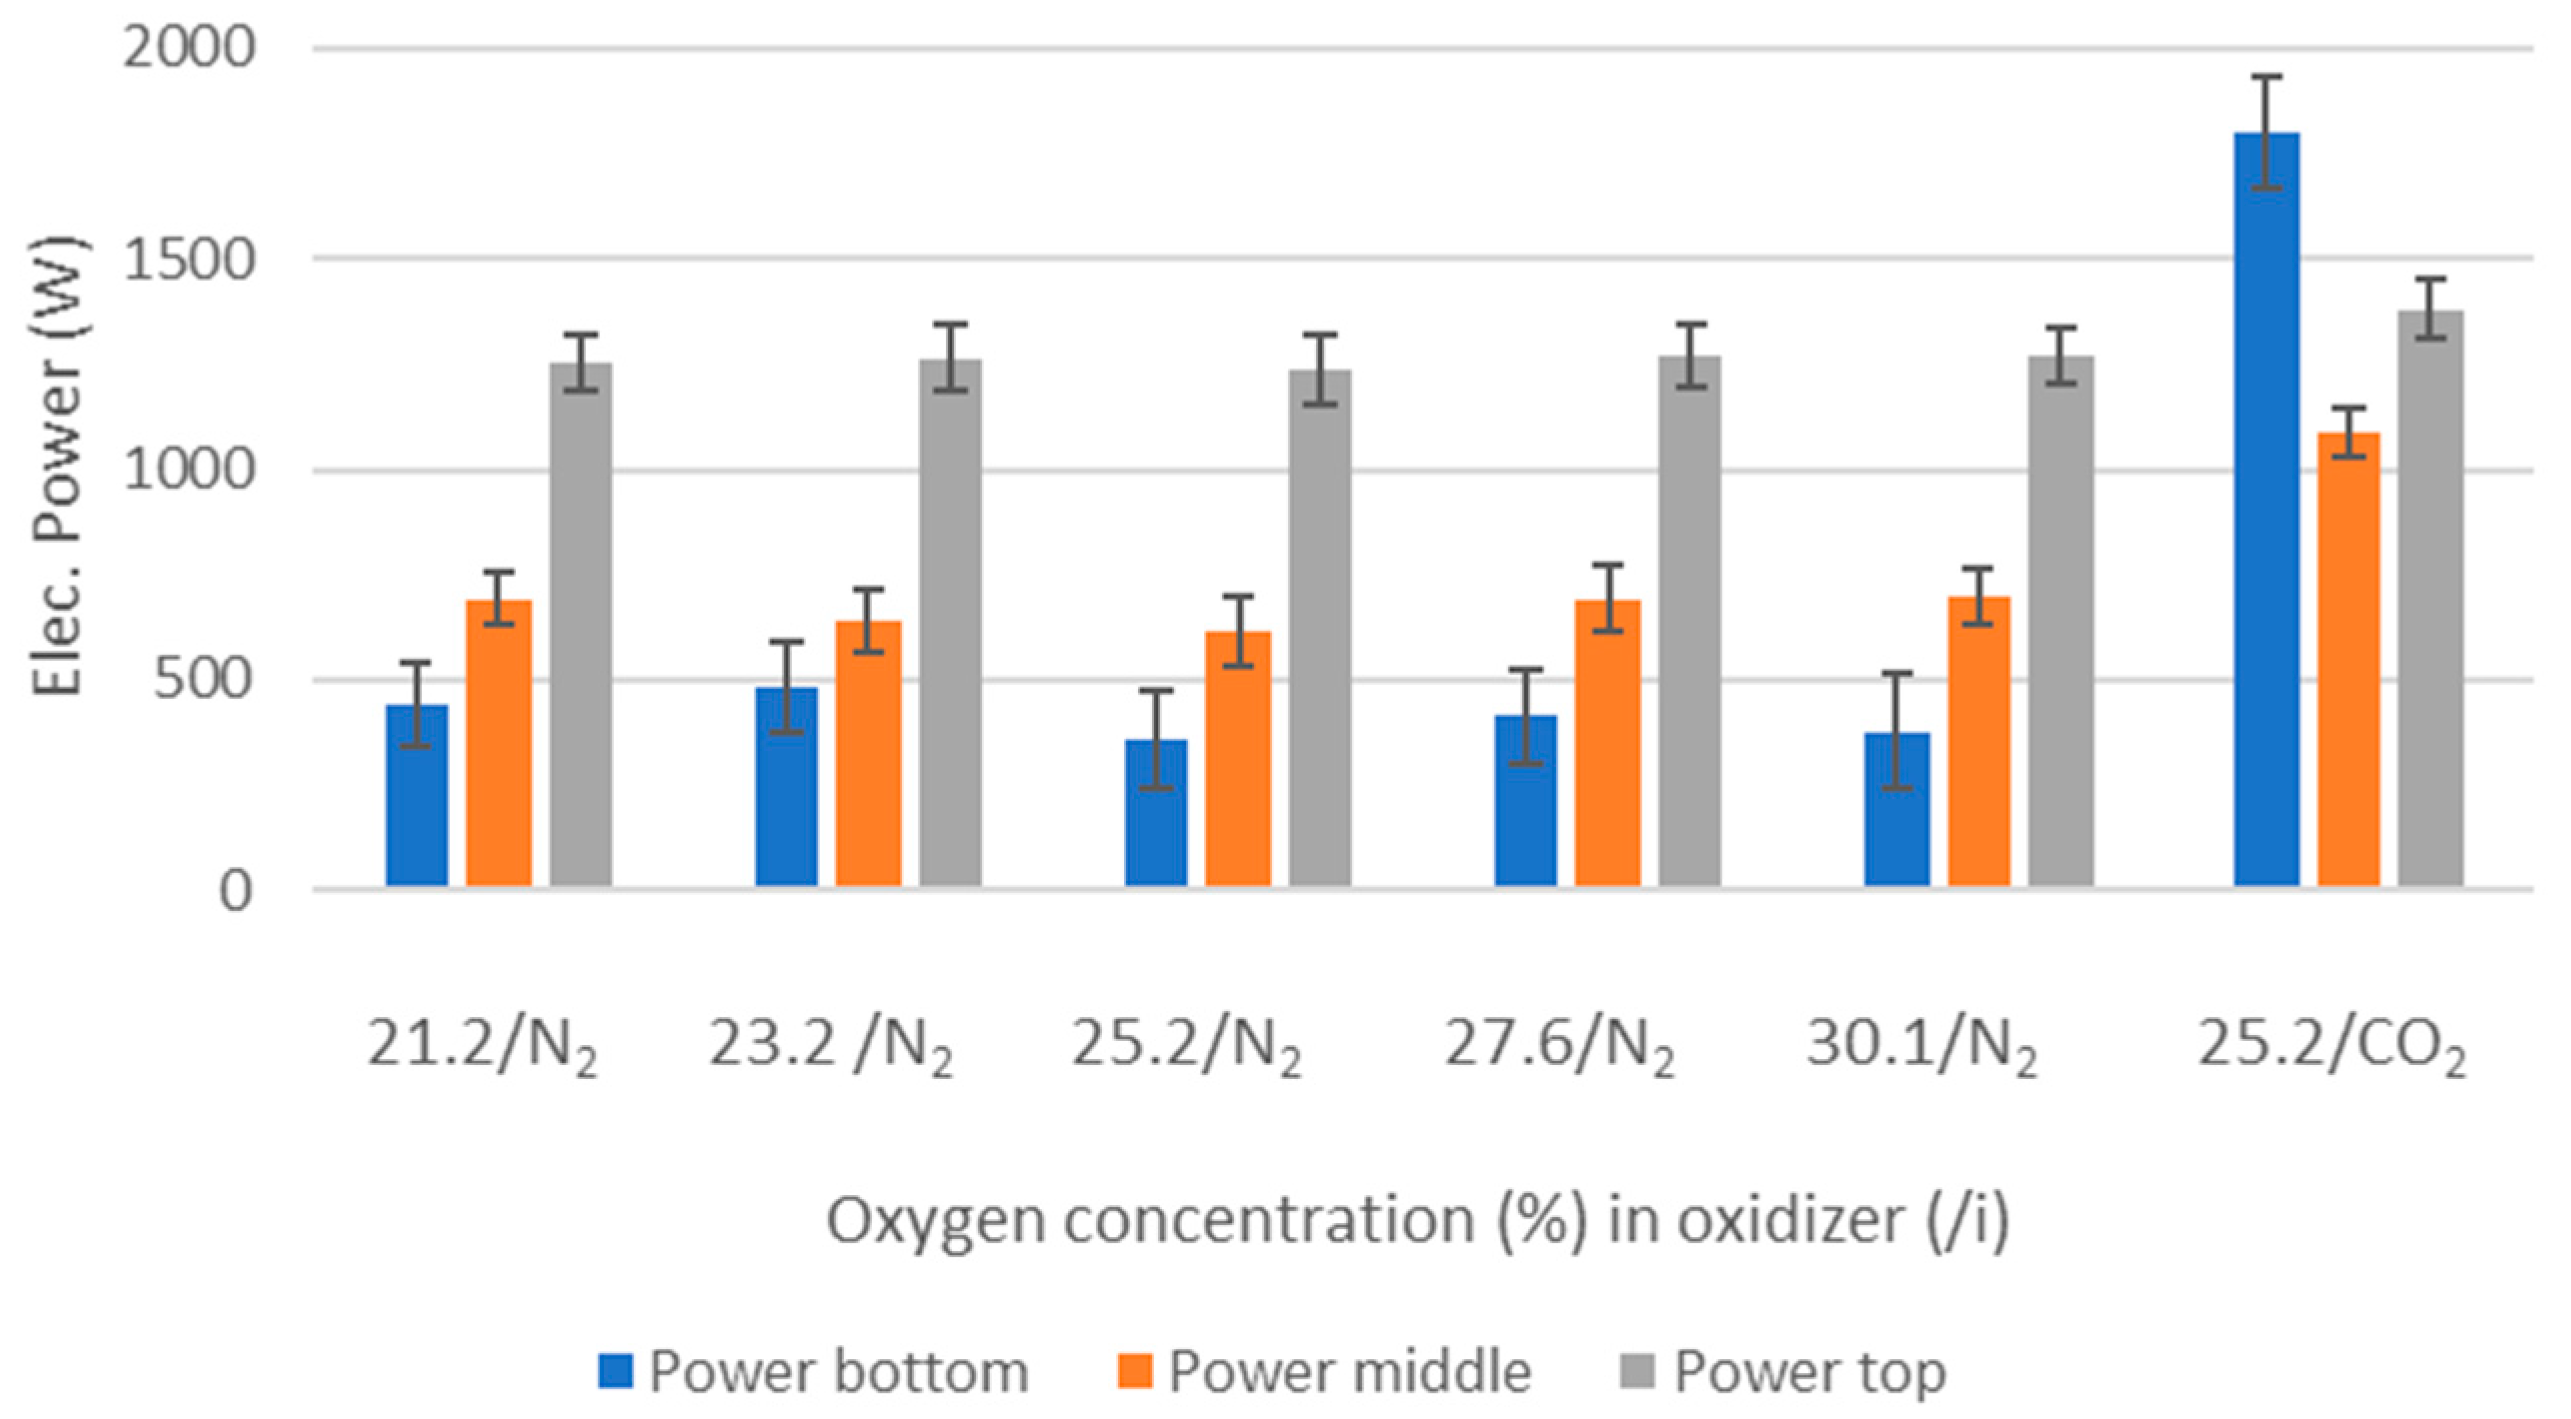
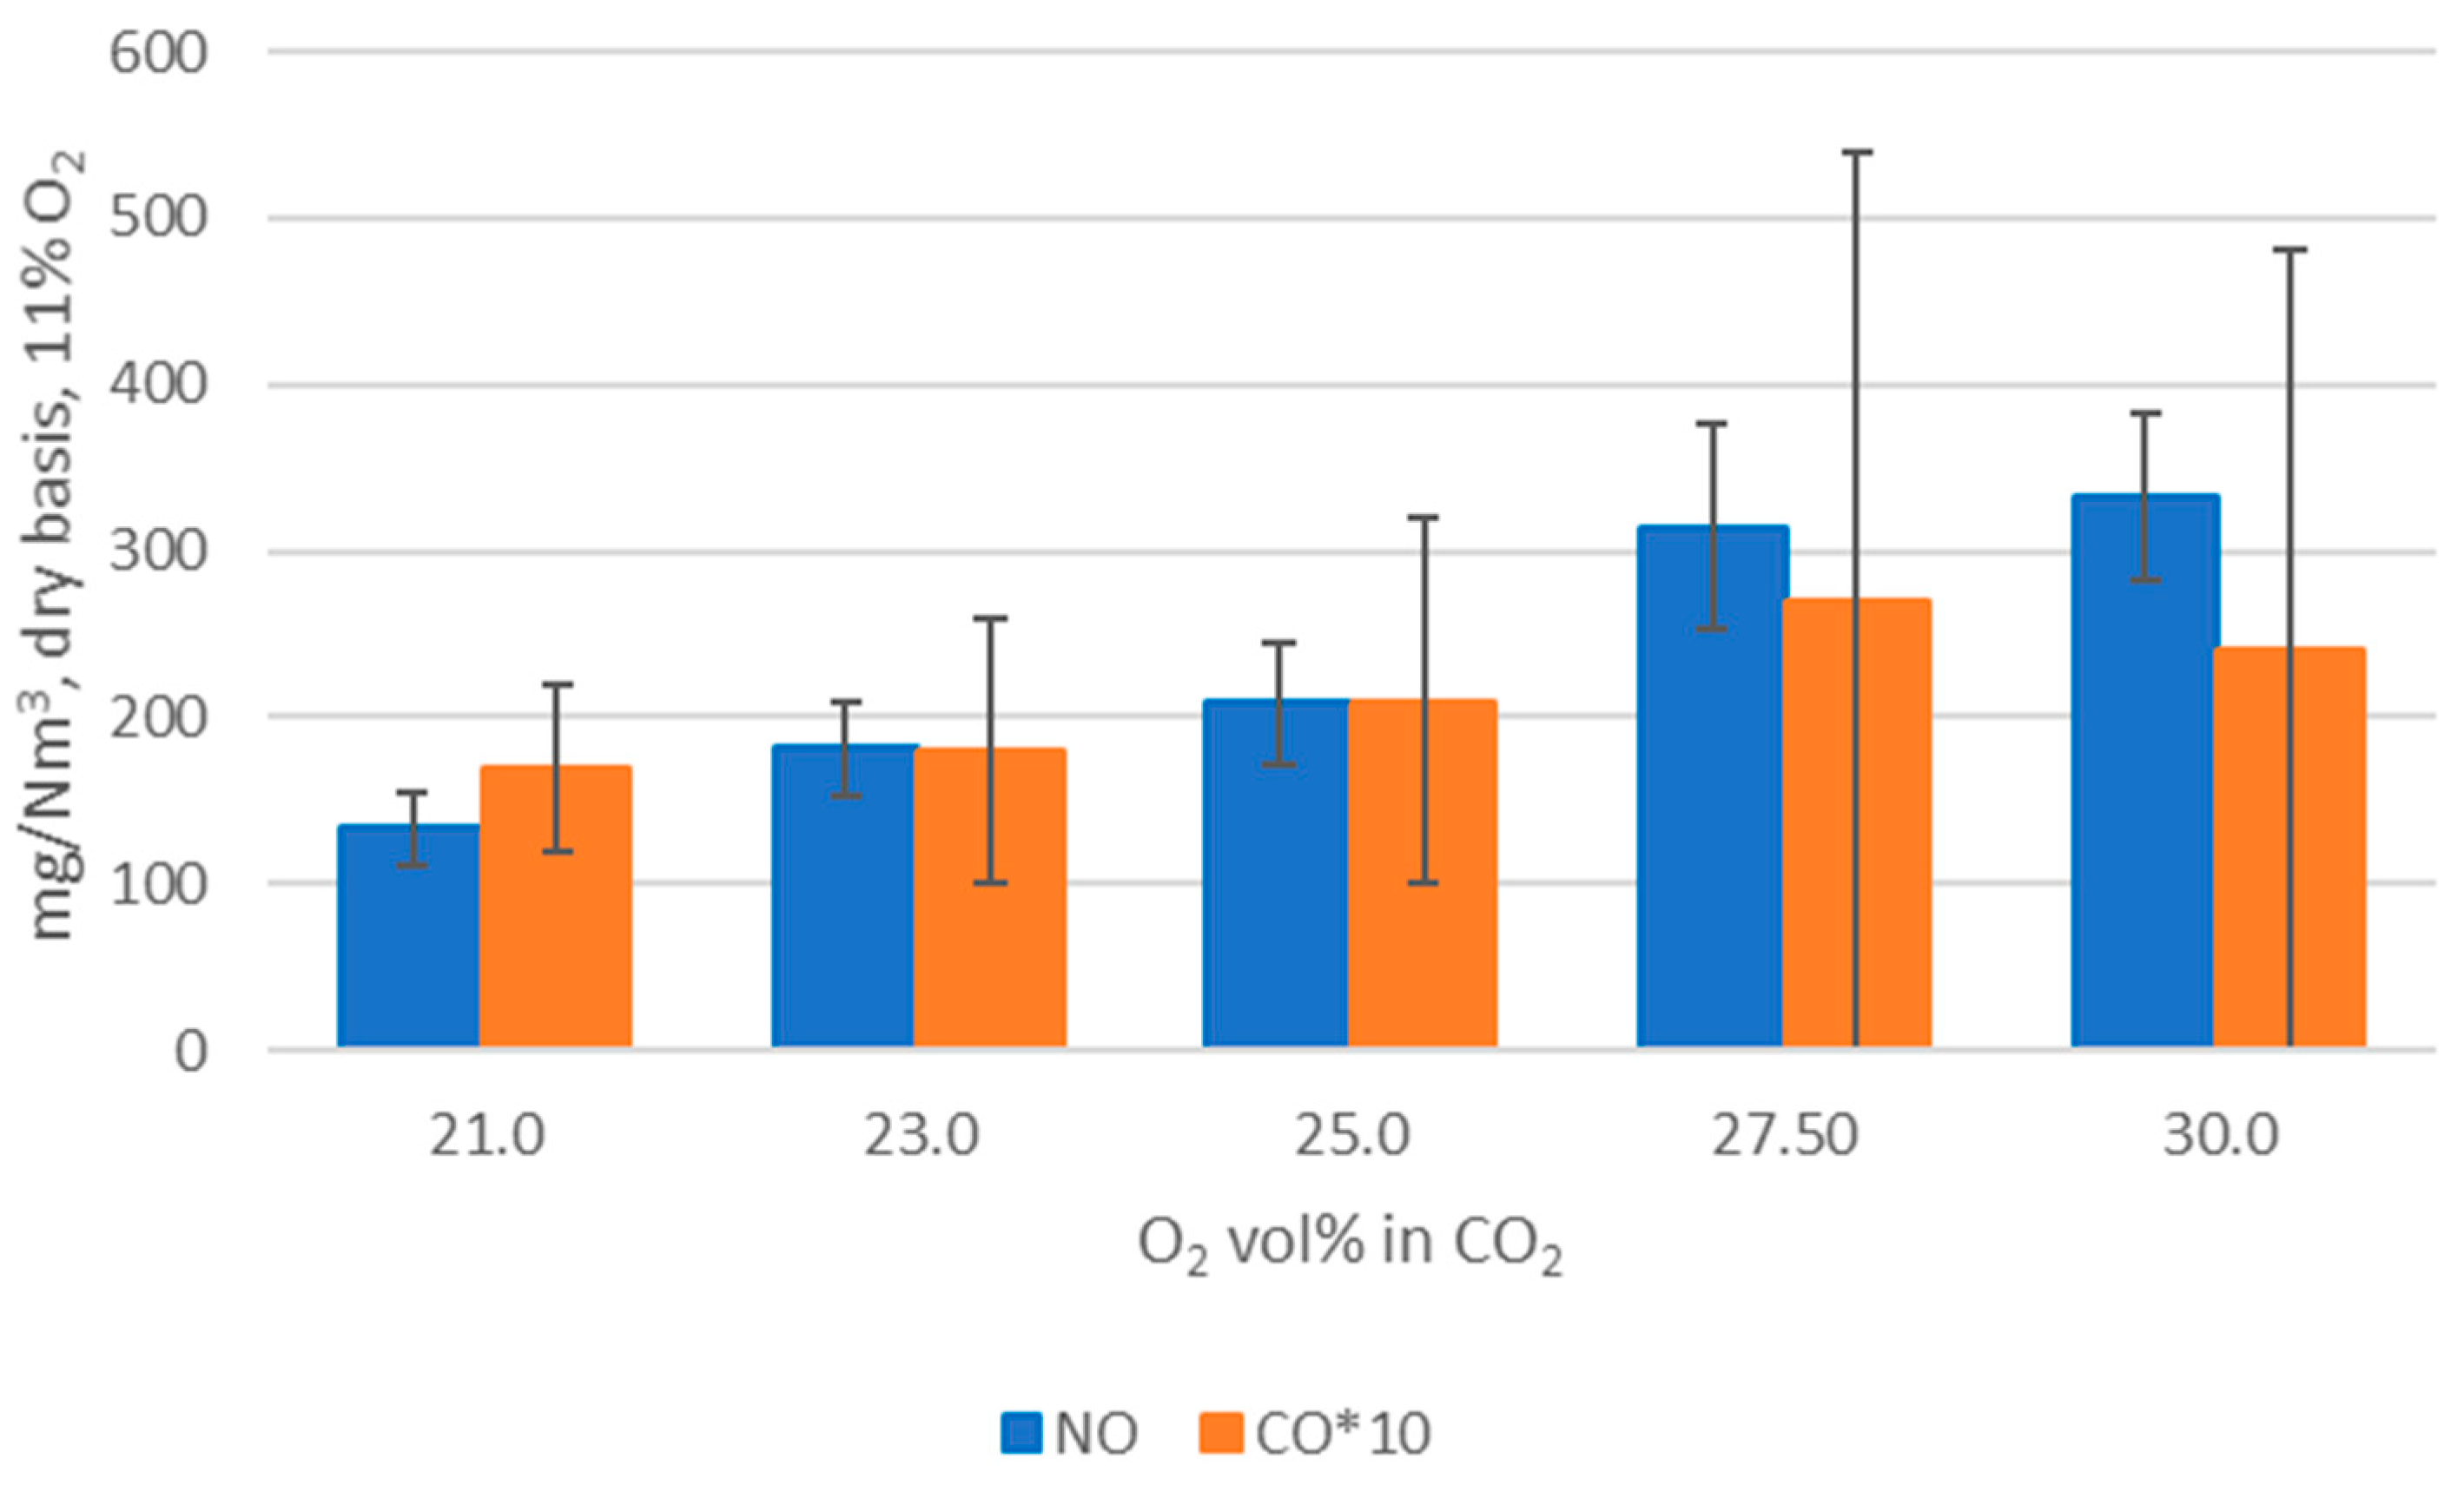
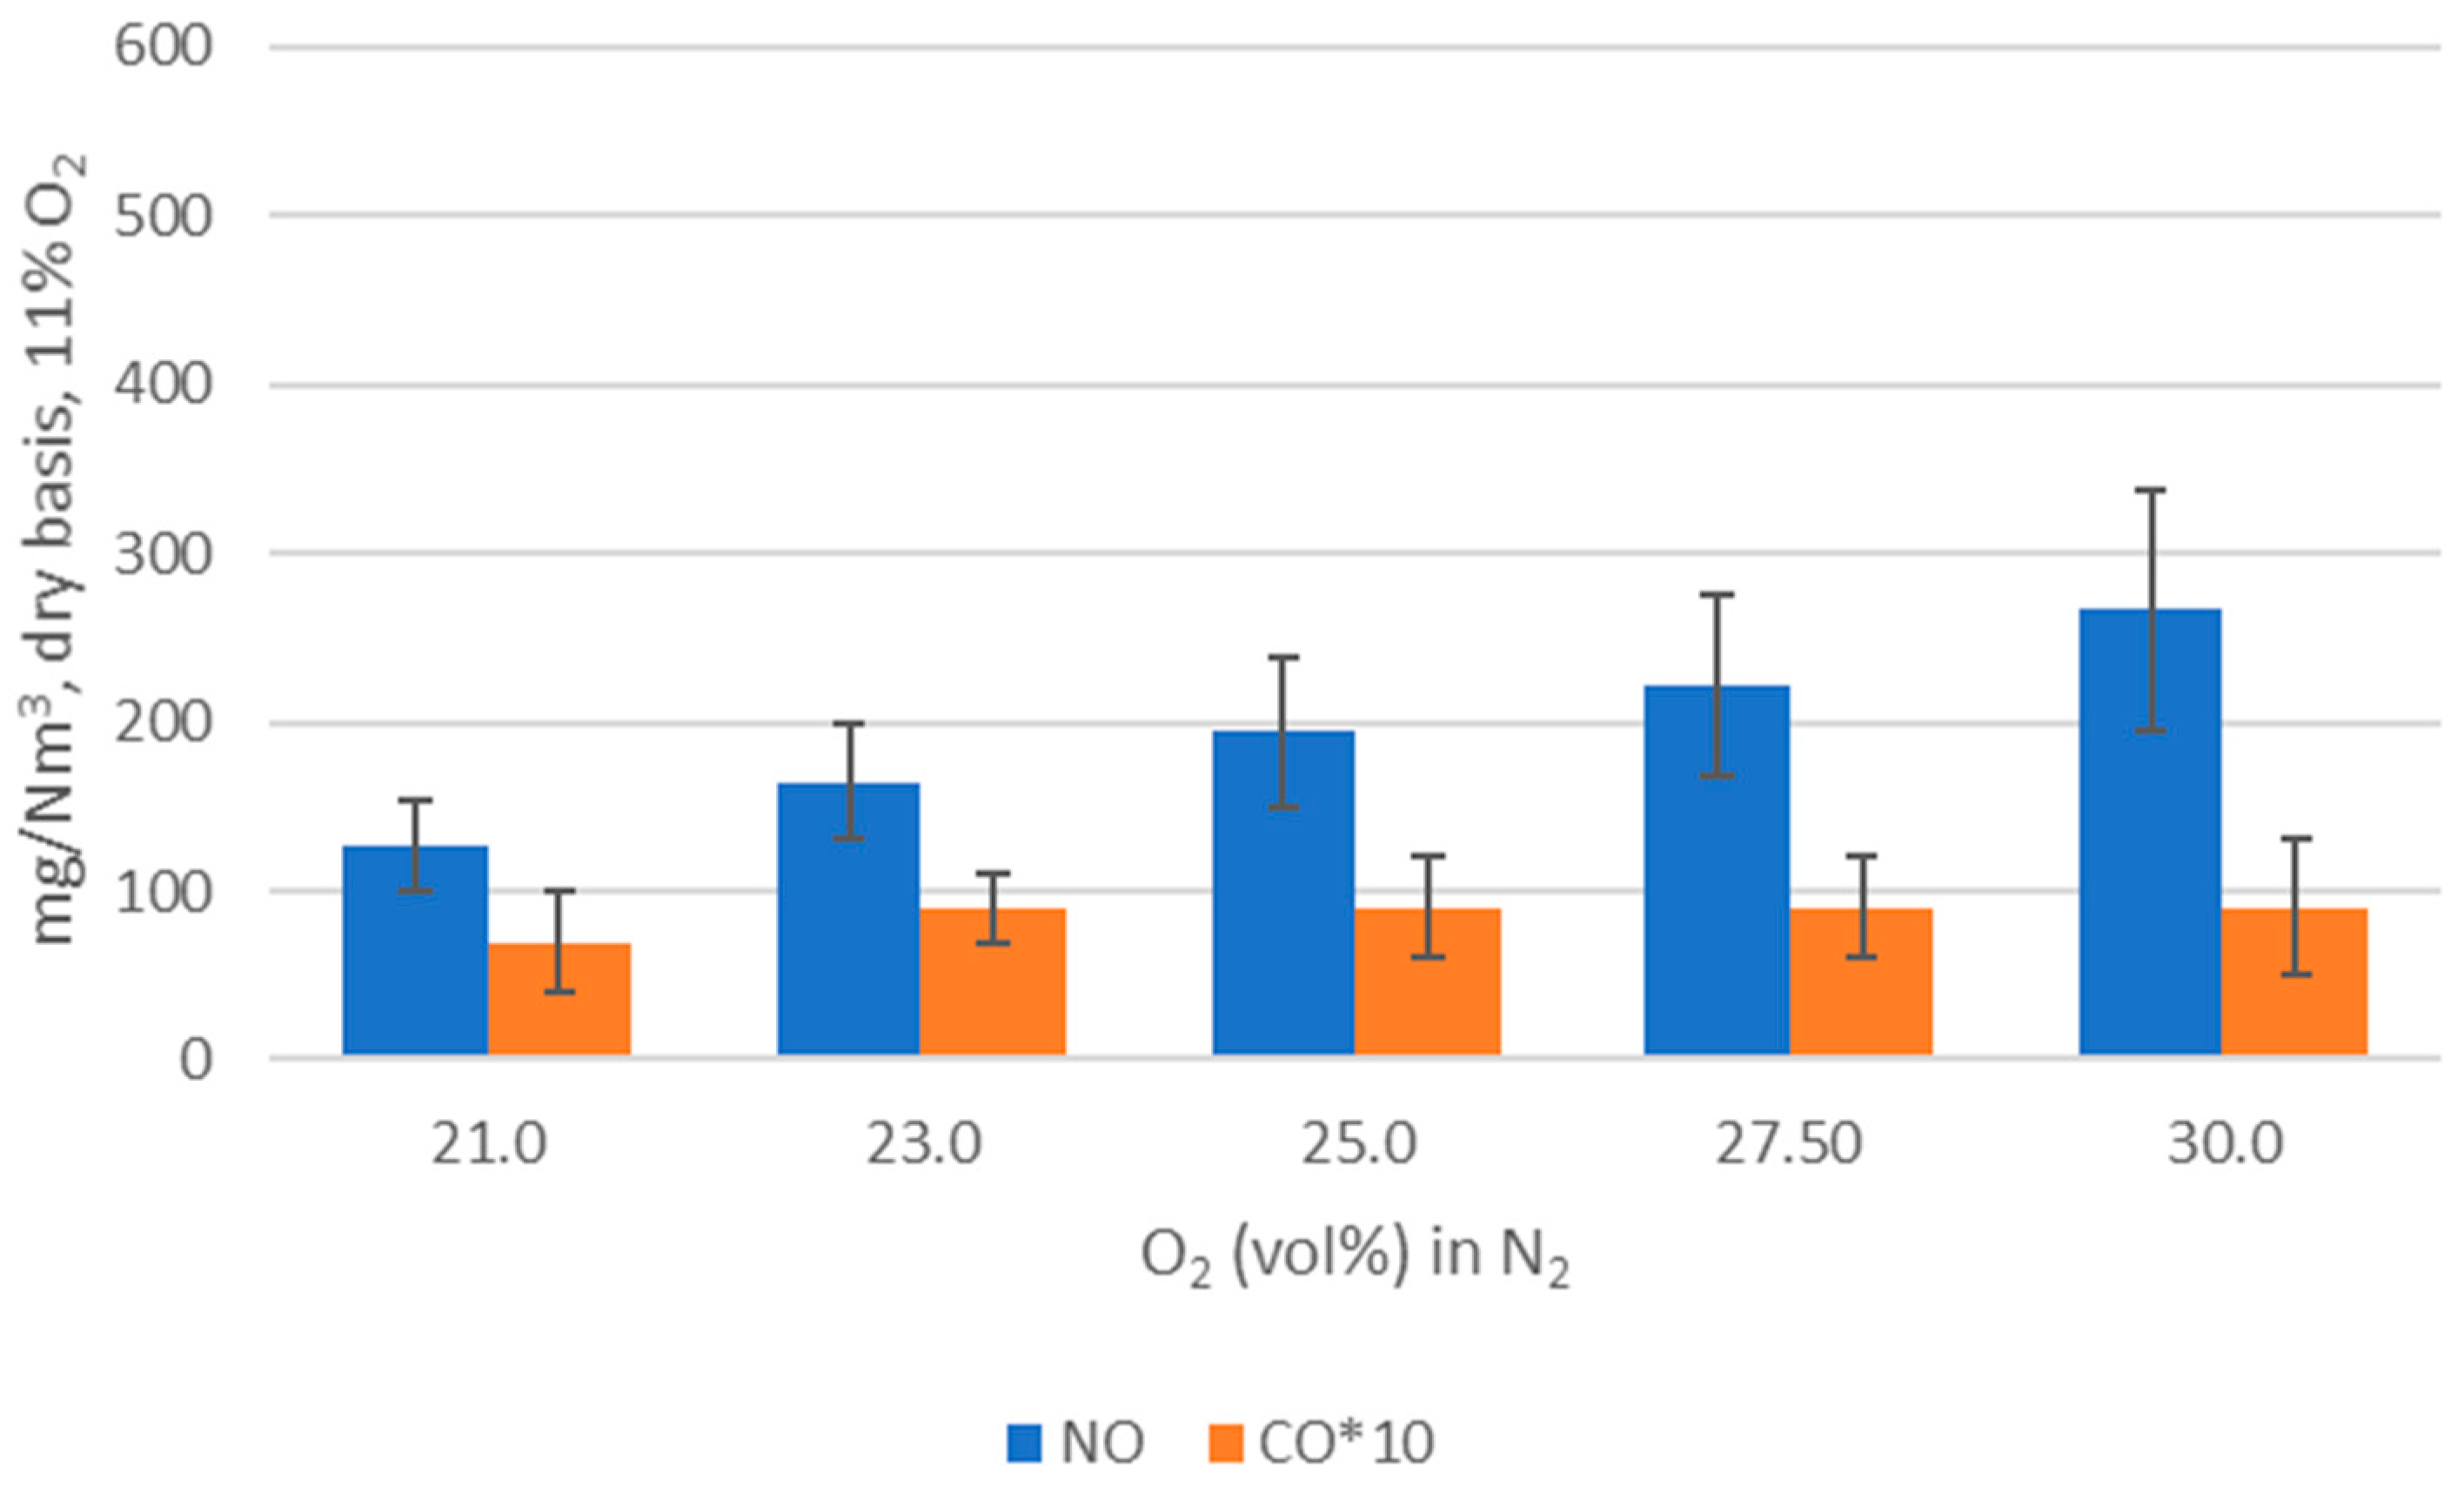
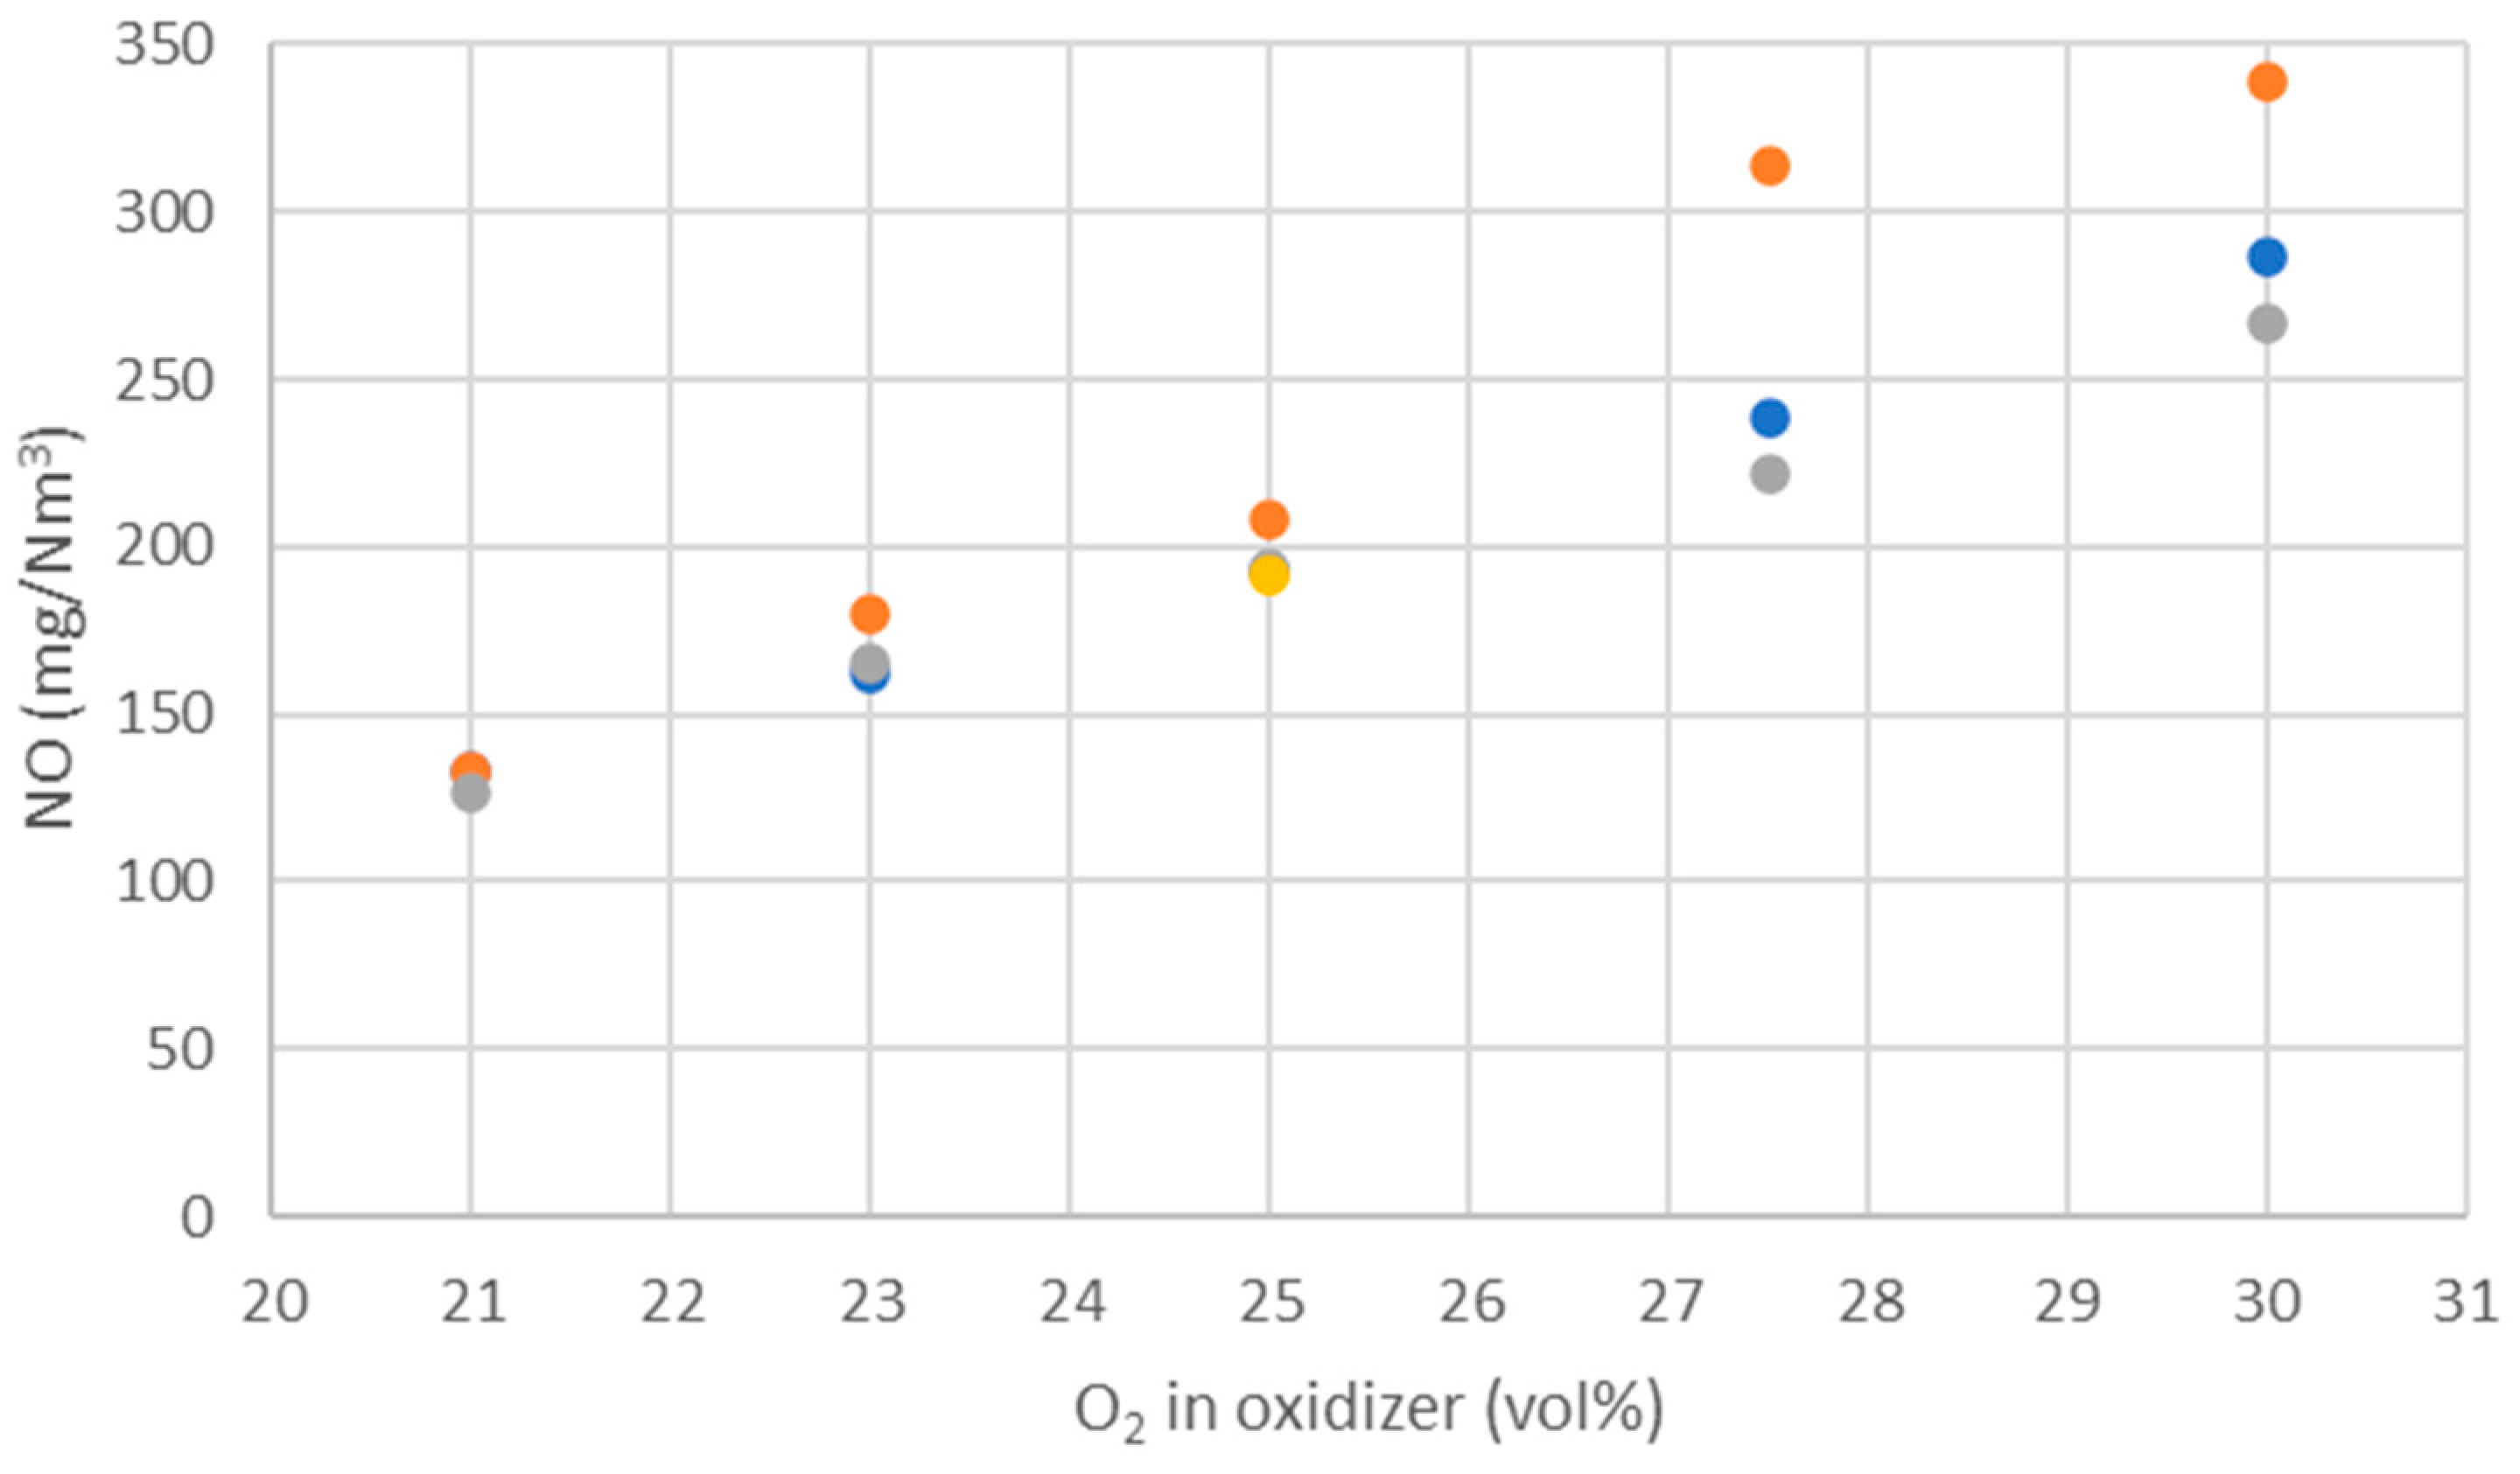
WtE with advanced gas cleaning system destroys contaminants and reduces the weight and volume of mixed waste that cannot be recycled. It also produces mainly renewable energy as MSW is predominantly of biogenic origin. Combined with CCS, WtE would hence offer the potential for carbon negative emissions, a key measure to fight climate change. Several CCS technologies exist or are under development and oxyfuel combustion integrated with CCS has shown to be a promising technology for solid fuels such as coal. The experimental assessment of oxyfuel combustion in a laboratory scale reactor performed and reported in this study shows that a model MSW can satisfactorily be combusted under different oxyfuel conditions provided that the oxygen concentration in the oxidizer is carefully adapted. The results also indicate that there is no unsurmountable showstopper for the further development of MSW oxyfuel combustion. The results in this study contribute to the further development of oxyfuel combustion as they confirm that stable combustion can be attained under different operating oxyfuel conditions, using both N2 and CO2, for a complex mixture. Stable combustion with high CO2 concentrations (in the range of 78–87 vol% in the flue gas) was attained even though CO2’s higher heat capacity (compared with N2) impacts the combustion process negatively. Working at these conditions will greatly facilitate the implementation of CO2 capture. The results also indicate that NOx emissions will be increasing with O availability, a trend observed both with N2 and CO2.
The aforementioned challenges can be addressed, e.g., with adequate combustion chamber design, appropriate local O2 concentrations, advanced recirculated flue gas strategy (amount, temperature, wet/dry, raw/clean), and primary and secondary measures for NOx. Further oxyfuel combustion development should be considered in the perspective of a system building upon air-fired grate combustion technology with combustion temperatures below 1200 °C to benefit from the existing know-how while avoiding excessive material costs. This is especially important to be able to handle untreated, mixed, unrecyclable waste.
Further studies should advance further oxyfuel combustion and include experiments with higher O2 concentrations, (bottom and fly) ash analysis, other waste mixtures, kinetics, different reactor temperatures, study of local conditions, and the effects of heterogeneity, temperature measurements in a waste bed under oxyfuel conditions, advanced oxidizer supply strategies, and optical study to observe the combustion process in situ.

Author Contributions

Conceptualization, M.D., M.B., P.C., J.B., J.S. and M.N.P.O.; investigation, J.B. and M.N.P.O.; data curation, M.B., M.D. and J.B.; writing—original draft preparation, M.B. and M.D.; writing—review and editing, J.B., P.C., J.S. and M.N.P.O.; project administration, M.D. and J.S.; funding acquisition, M.D. and J.S. All authors have read and agreed to the published version of the manuscript.

Funding

The research was funded by the Research Council of Norway (RCN) through the CapeWaste IPN project (grant number 281869) and the ERA NET Cofund ACT NEWEST-CCUS project (grant number 305062).

Data Availability Statement

Restrictions apply to the availability of these data.

Conflicts of Interest

The authors declare no conflict of interest. The funders had no role in the design of the study; in the collection, analyses, or interpretation of data; in the writing of the manuscript, or in the decision to publish the results.

References

  1. Stuen, J. CCS from Waste Incineration from Polluting Industry to Part of the Climate Solution. 2019. Available online: https://www.forskningsradet.no/contentassets/3fb0ac44a9c5479f8aca0fb12eadd133/johnny-stuen-fortum-oslo-varme-klemetsrud-energigjenvinningsanlegg-med-ccs-efk2019-.pdf (accessed on 20 August 2021).
  2. IPCC Special Report. Global Warming of 1.5 °C. 2018. Available online: https://www.ipcc.ch/sr15/ (accessed on 20 August 2021).
  3. JRC Science for Policy Report. BAT Reference Document for Waste Incineration. 2019. Available online: https://eippcb.jrc.ec.europa.eu/reference/Waste-incineration-0 (accessed on 20 August 2021).
  4. Fagerlund, J.; Zevenhoven, R.; Thomassen, J.; Tednes, M.; Abdollahi, F.; Thomas, L.; Nielsen, C.J.; Mikoviny, T.; Wisthaler, A.; Zhu, L.; et al. Performance of an amine-based CO2 capture pilot plant at the Fortum Oslo Varme Waste to Energy plant in Oslo, Norway, 2021. Int. J. Greenh. Gas Control. 2021, 106, 103242. [Google Scholar] [CrossRef]
  5. Stanger, R.; Wall, T.; Spörl, R.; Paneru, M.; Grathwohl, S.; Weidmann, M.; Scheffknecht, G.; McDonald, D.; Myöhänen, K.; Ritvanen, J.; et al. Oxyfuel combustion for CO2 capture in power plants. Int. J. Greenh. Gas Control. 2015, 40, 55–125. [Google Scholar] [CrossRef]
  6. Baukal, C.E., Jr. Oxygen-Enhanced Combustion; CRC Press: Boca Raton, FL, USA, 2013; ISBN 0-8493-1695-2 (1998). [Google Scholar]
  7. Al-Makhadmeh, L.; Maier, J.; Scheffknecht, G. Coal pyrolysis and char combustion under oxyfuel conditions. In Proceedings of the 34th International Technical Conference on Clean Coal & Fuel Systems, Clearwater, FL, USA, 31 May–4 June 2009; pp. 112–123. [Google Scholar]
  8. Shaddix, R.; Hecht, H.; Jimenez, S.; Lee, S. Evaluation of rank effects and gas temperature on coal char burning rates during oxyfuel combustion. In Proceedings of the 34th International Technical Conference on Clean Coal & Fuel Systems, Clearwater, FL, USA, 31 May–4 June 2009. [Google Scholar]
  9. Grathwohl, S.; Maier, J.; Scheffknecht, G. Testing and Evaluation of Advanced Oxyfuel Burner and Firing Concepts. In Proceedings of the 2nd Oxyfuel Combustion Conference (OCC2), Yeppoon, Australia, 12–16 September 2011. [Google Scholar]
  10. Buhre, B.J.; Elliott, L.K.; Sheng, C.; Gupta, R.P.; Wall, T.F. Oxyfuel combustion technology for coal-fired power generation. Prog. Energy Combust. Sci. 2005, 31, 283–307. [Google Scholar] [CrossRef]
  11. Ramos, J.; Navarrete, B.; Munoz, F.; Gil, B.; Otero, P.; Kuivalainen, R.; Hiltunen, T. NOx emissions experiences in a 30MWth circulating fluidized bed boiler under oxy-combustion conditions. In Proceedings of the 3rd Oxyfuel Combustion Conference (OCC3), Ponferrada, Spain, 9–13 September 2013. [Google Scholar]
  12. Wienchol, P.; Szlęk, A.; Ditaranto, M. Waste-to-energy technology integrated with carbon capture-Challenges and opportunities. Energy 2020, 198, 117352. [Google Scholar] [CrossRef]
  13. Tang, Y.; Ma, X.; Lai, Z.; Fan, Y. Thermogravimetric analyses of co-combustion of plastic, rubber, leather in N2/O2 and CO2/O2 atmospheres. Energy 2015, 90, 1066–1074. [Google Scholar] [CrossRef]
  14. Shah, I.A.; Gou, X.; Zhang, Q.; Wu, J.; Wang, E.; Liu, Y. Experimental study on NOx emission characteristics of oxy-biomass combustion. J. Clean. Prod. 2018, 199, 400–410. [Google Scholar] [CrossRef]
  15. Sher, F.; Pans, M.A.; Sun, C.; Snape, C.; Liu, H. Oxy-fuel combustion study of biomass fuels in a 20 kWth fluidized bed combustor. Fuel 2018, 215, 778–786. [Google Scholar] [CrossRef]
  16. Strobel, R.; Waldner, M.H.; Gablinger, H. Highly efficient combustion with low excess air in a modern energy from-waste (EfW) plant. Waste Manag. 2018, 73, 301–306. [Google Scholar] [CrossRef] [PubMed]
  17. Becidan, M.; Skreiberg, Ø.; Hustad, J.E. NOx and N2O Precursors (NH3 and HCN) in Pyrolysis of Biomass Residues. Energy Fuels 2007, 21, 1173–1180. [Google Scholar] [CrossRef]
  18. Tang, Y.; Ma, X.; Lai, Z.; Zhou, D.; Lin, H.; Chen, Y. NOx and SO2 emissions from municipal solid waste (MSW) combustion in CO2/O2 atmosphere. Energy 2012, 40, 300–306. [Google Scholar] [CrossRef]
  19. Martin GmbH Website. Available online: https://www.martingmbh.de/media/files/Technologie/SYNCOM_Plus18.pdf (accessed on 20 August 2021).
Figure 1. Sketch of the vertical tube furnace (VTF) reactor showing the three independently regulated heating zones, streams in and out, the grate, and the thermocouples locations (in mm over the grate).
Energies 14 05297 g001
Figure 2. Temperature time trace examples (e.g., T+287 = thermocouple placed 287 mm above the grate, see Figure 1) for different oxidizers as specified under each time segment (e.g., first segment on the left is 21% O2 in N2 at a flow rate of 292 NL/min).
Energies 14 05297 g002
Figure 3. Temperatures at different O2 input concentrations, O2/N2 input mixes, total oxidizer flow rate in: 160 NL/min (except 30.1 case, 150 NL/min). “T+number” indicates the location of the thermocouple above the grate in mm (see also Figure 1).
Energies 14 05297 g003
Figure 4. Electrical power and O2 input concentrations, O2/N2 and O2/CO2 input mixes, total oxidizer flow rate in: 160 NL/min (except 30.1 case, 150 NL/min). Power bottom is closest to grate.
Energies 14 05297 g004
Figure 5. Temperatures and O2 input concentrations, O2/CO2 input mixes, total oxidizer flow rate in: 160 NL/min (except 30.1, 150 NL/min). “T+number”: see Figure 3 caption.
Energies 14 05297 g005
Figure 6. NO and CO emissions (with standard deviation) with different O2/CO2 oxidizer mix.
Energies 14 05297 g006
Figure 7. NO and CO emissions (with standard deviation) with different O2/N2 oxidizer mix.
Energies 14 05297 g007
Figure 8. NOx emissions as a function of O2 input concentration. O2/CO2 (orange and yellow) and O2/N2 (blue and grey) mixtures. Similar conditions (1000 °C, 1.3 kg/h, 160 NL/min (except the highest point at 30%, 150 NL/min)).
Energies 14 05297 g008
Table 1. Model MSW pellets main characteristics (EN method).
PropertiesModel MSWUnit
Moisture3.0wt% a.s. 2
Ash content11.3wt% a.s. 2
Volatile matter78.9wt% a.s. 2
S 10.032wt% d.b. 3
Cl 10.089wt% d.b. 3
C 142.8wt% d.b. 3
H 15.4wt% d.b. 3
N 10.12wt% d.b. 3
O 139.9wt% d.b. 3
Calorific value15.8MJ/kg d.b.
Dimensions(6/15)cm
1 calculated based on individual constituents’ elemental analysis; 2 % weight as received; 3 % weight dry basis.
Table 2. Varying O2/CO2 concentrations, fixed total flow rate. Feedstock effect: 1.3 kg/h; reactor temperature set at 1000 °C.
Air in (NL/min)O2 in (NL/min)CO2 in (NL/min)Sum Gas in (NL/min)O2 in (vol%)NO (mg/Nm3)CO (mg/Nm3)T+287 (°C)
0.033.6126.4160.021.013317941
0.036.8123.2160.023.018118963
0.040.0120.0160.025.020821966
0.044.0116.0160.027.531427990
0.045.0105.0150.030.033324997
Table 3. Varying O2/N2 concentrations, fixed total flow rate. Feedstock effect: 1.3 kg/h; reactor temperature set at 1000 °C.
O2 in (NL/min)N2 in (NL/min)CO2 in (NL/min)Sum Gas in (NL/min)O2 in (vol%)NO (mg/Nm3)CO (mg/Nm3)T+287 (°C)
36.8123.20.0160.023.016591053
40.0120.00.0160.025.019491057
44.0116.00.0160.027.522291047
48.0112.00.0160.030.026791044
33.6126.40.0160.021.012771045
40.00.0120.0160.025.019124980
Publisher’s Note: MDPI stays neutral with regard to jurisdictional claims in published maps and institutional affiliations.

