Abstract
Pyrolysis, one of the key thermochemical conversion technologies, is very promising to obtain char, oil and combustible gases from solid fuels. Kinetic modeling is a crucial method for the prediction of the solid conversion rate and analysis of the pyrolysis process. We recently developed a new statistical model for the universal description of solid fuel decomposition, which shows great potential in studying solid fuel pyrolysis. This paper demonstrates three essential applications of this new model in the analysis of Artemisia apiacea pyrolysis, i.e., identification of the conversion rate peak position, determination of the reaction mechanism, and evaluation of the kinetics. The results of the first application show a very good agreement with the experimental data. From the second application, the 3D diffusion-Jander reaction model is considered as the most suitable reaction mechanism for the description of Artemisia stem pyrolysis. The third application evaluates the kinetics of Artemisia stem pyrolysis. The evaluated kinetics vary with the conversion degree and heating rates, in which the activation energies and pre-exponential factors (i.e., show a linear relationship, regardless of the conversion and heating rates. Moreover, the prediction of the conversion rate using the obtained kinetics shows an excellent fit with the experimental data.
1. Introduction
Biomass as the fourth largest primary energy resource shows great potential in sourcing the energy needs from renewables [1]. As reported by the International Energy Agency (IEA), bioenergy has the potential to provide 10% of the primary energy supply to the world by 2035, and biofuel will be capable to covering 27% of transportation fuel consumption by 2050 [2]. Thermochemical conversion technologies, as the key method to convert bioresources to energy and renewable products, have drawn more and more attention over the past decades [3,4]. Among thermochemical conversion technologies (i.e., pyrolysis, gasification, combustion, etc.), pyrolysis, which is not only a significant stage of combustion and gasification but also an independent key thermal conversion technology, presents great potential to produce high-quality renewable fuels [5,6].
The solid fuel pyrolysis process is the decomposition of the organics inside solids in the absence of oxygen. The solid conversion rate and products are of most interest for research studies and industry applications [7]. Kinetic modeling is regarded as a useful tool for the prediction of the solid conversion rate and even the species evolution [8]. In previous studies, typical kinetic models are always based on the Arrhenius theory, in which the conversion rate can be calculated by the kinetic constant, times the reaction model function [9]. To predict the solid conversion rate, evaluation of the kinetic parameters i.e., the pre-exponential factor, temperature order and activation energy, has been the focus in the previous studies, such as the model-fitting method and the model-free (isoconversional) method [10]. The model-fitting method, e.g., Coats–Redfern (CR) method, needs to assume the reaction model in advance, then the global kinetic parameters can be estimated by fitting the thermogravimetric analysis (TGA) experimental data [11,12]. While the global kinetics from the model-fitting method are simple and convenient, it normally cannot output accurate predictions for more complex materials. In addition, the kinetics are over-reliant on the reaction model assumption, which limits its application. On the contrary, the model-free methods, e.g., Kissinger–Akahria–Sunose (KAS), Flynn–Wall–Ozawa (FWO), and the Friedman method, do not need to assume the reaction model, and the kinetics can be evaluated for a given conversion degree [13]. It requires a series of TGA data obtained under at least three different heating rates [14]. The activation energies evaluated from this method, regardless of the reaction model, are considered more reliable [15]. While the calculation of the pre-exponential factor is dependent on the selected reaction model.
Besides the typical kinetic models for the evaluation of kinetics, some studies have aimed at investigating reaction models. Gai et al. summarized commonly used reaction models for the description of the pyrolysis of solids [16]. Five groups of reaction models are classified, i.e., reaction order, Mampel power law, nucleation, contracting geometry and diffusion. In addition, Criado proposed an analytical way named the ‘master plot’ for the determination of the reaction mechanism from commonly used reaction models for solid pyrolysis [17]. Identification of the proper reaction model, other than from experience, is a big step, while the strength of the universal description with the kinetics needs to be further investigated. In this regard, a new model based on the generalized extreme value (GEV) distribution for first-order reactions has been reported by Li et al. [18]; it found that first-order pyrolysis processes could be modeled universally. It also illustrated the strength of the universal model for the solid conversion rate, which points to a new perspective for investigation of the kinetic model. Inspired by the work of Li et al., a universal model for the description of solid fuel pyrolysis for all the feasible reaction models was proposed in our previous study [19]. Experimental validations and comparisons to the typical kinetic model have followed. The properties of the universal model show great potential in understanding and analyzing the solid fuel pyrolysis process. Further applications and development of the universal model need to be carried out to enrich this new aspect.
In this study, the new statistical model that we recently developed to describe the pyrolysis of solids in a universal way is manifested briefly for the readability of this paper. Then three essential applications based on the model are applied in Artemisia stem pyrolysis, i.e., identification of the conversion rate peak position, determination of the reaction model and evaluation of the kinetics. The prediction results show a good agreement with the experimental data, the proposed methods also stand out by their simplicity and applicability. At last, the kinetic analysis of Artemisia stem pyrolysis was investigated for studying the characteristics of this vital wormwood biomass in Asia. The kinetic compensation effect (KCE) was analyzed as well. It shows that the activation energy of the Artemisia stem varies a lot along the conversion, and it is influenced by the heating rate as well.
2. Methods and Materials
To facilitate the understanding of this paper, both the new model for the description of solid fuel pyrolysis and the related TGA experiments of the Artemisia stem are briefly presented in this section. The experimental data obtained will be used for validation and applications of the presented model. More details can be found in the relevant references, e.g., the detailed derivation of the new model in our previous study [19].
2.1. The Model Description
For solid fuel pyrolysis, the Arrhenius theory is commonly used for the conversion process. The typical conversion rate of solid decomposition can be described as Equation (1) [20].
where is the kinetic constant, which is a function of the reaction temperature ; denotes the reaction model.
For nonisothermal experiments of a constant heating rate , the conversion rate can be expressed with respect to the temperature T as shown in Equation (2) [21].
where and are the pre-exponential factor and activation energy, respectively. The conversion is determined as the current mass loss over the final mass loss
where , and denote the initial solid mass (at t = 0), solid mass (at t = t) and the final solid mass (at t = ).
By integrating Equation (1) and setting , the integration form of the conversion rate can be expressed as below [22].
where is a dimensionless variable. The temperature integral does not have an analytical solution. Differentiating Equation (4), the new formulation can be obtained.
For the reactions in which , we can derive Equation (6) from Equation (5).
If we set a new variable named the reaction progress indicator , then we can have [23].
For first-order reactions , the based conversion rate can be written fully explicitly with respect to .
Equation (8) is the universal expression we recently developed for the solid fuel pyrolysis of the first-order reaction model [19]. It is precisely consistent with the standardized generalized extreme value (GEV) distribution. More details about the based statistical kinetic model can be found in [19], e.g., the detailed derivation and plots. The expression of the new model is certain for a given reaction mechanism regardless of the kinetics and materials.
2.2. Experiments and Materials
The experimental data come from [24], in which the Artemisia stem samples with an average diameter less than 0.2 mm were analyzed through a Netzsch STA449F3 thermal analyzer under a pure nitrogen atmosphere. The samples for each TGA test were dried at 353 K for about 24 h in advance, and heated from 300 to 1000 K under the heating rates of 10, 20, 30, 40 and 50 K/min, respectively. The sample powder was held in an alumina cup during the test run.
3. Applications of the Developed Model to Artemisia Stem Pyrolysis
In this section, three applications of the new model, namely, identification of the conversion peak position, determination of the reaction mechanism, and evaluation of the kinetics, are demonstrated for Artemisia stem pyrolysis. The kinetic analysis of Artemisia pyrolysis is also carried out. The detailed description and results for each application are presented below.
3.1. Identification of the Conversion Rate Peak Position
As illustrated in Section 2, for a given reaction mechanism , the peak of the conversion rate always occurs at a fixed reaction progress indicator . All the details of the most common pyrolysis mechanisms can be seen in Table 1 in our previous work [19]. Based on this characteristic, the peak position of the solid conversion rate can be easily obtained if the reaction mechanism is certain. Reference [24] concludes that the F1, F2, F3 and D3 reaction mechanisms are suitable for the description of Artemisia stem pyrolysis, in which for F1, F2, F3 and for D3. The four reaction mechanisms are used for prediction of the conversion rate peak position by its characteristics.

Table 1.
The model-predicted vs. experimentally determined temperature (in units of K) at the peak conversion rate during pyrolysis of Artemisia stem under different heat rates.
Figure 1 plots the conversion progress indicator against the temperature of Artemisia stem pyrolysis under different heating rates. The identification of the conversion rate peak position with the assumption of F1, F2 and F3 reaction models is shown in Figure 1a, and the counterpart, using D3 as the reaction model, is shown in Figure 1b. The peak temperature of the conversion rate for each experiment can be estimated by the intersection of the curve and in Figure 1a or in Figure 1b. The predicted results of the temperature at the peak conversion rate are listed in Table 1. Among the different reaction mechanisms, the predicted peak temperatures using the D3 reaction model are higher than those using the reaction order models. Compared to the experimental data, the predicted results based on the F1 reaction model show the best agreement with the experimental data. This conclusion illustrates that the F1 reaction mechanism is more suitable for the kinetic description around the conversion rate peak position than the others, whereas one cannot broadly conclude that it is more suitable during the overall pyrolysis process. Further work for the determination of the reaction mode for the whole pyrolysis process needs to be carried out.
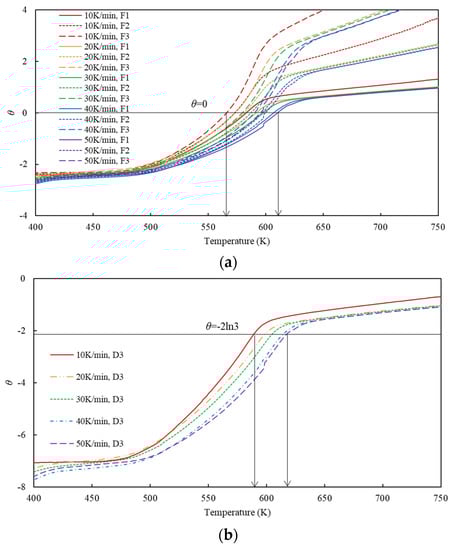
Figure 1.
Identification of the conversion rate peak position based on the proposed method for the F1, F2 and F3 reaction model (a) and the D3 reaction model (b).
3.2. Determination of the Reaction Mechanism
The based conversion rate, on the other hand, can be expressed in Equation (9) [25],
which shows the relation of the based conversion rate with the temperature-based rate . To simplify Equation (9), the approximation equation of the temperature integral (where ), which was used in the KAS method [26], was applied in Equation (9). Another expression of the new model was formed in Equation (10) [19].
On the right-hand side of Equation (10), can be obtained from the TGA data for each experiment with a fixed heating rate , and can be evaluated from model-free methods without the assumption of a reaction model.
The values of can be determined from experimental data using Equation (10). The can also be calculated by the universal expressions of the most common mechanisms of solid fuel pyrolysis, as derived and summarized in Table 1 in [19]. By comparing them as shown in Equation (11), the reaction model or mechanism best suited for the description of Artemisia stem pyrolysis may be determined.
The smaller the is, the closer the reaction model will be to the certain standard generalized model. This step is similar to the determination of reaction mechanisms by the ‘master plot’ [27]. However, using the approximation equation makes the expression simpler and more applicable than the ‘master plot’.
Figure 2 shows the results of the difference in calculated by the two methods as presented in Equation (11) for the conversion range of 0.1–0.8. Here it needs to be mentioned that the activation energies used in the calculation are from [24], evaluated by the KAS method based on the experimental data, since there is no assumption of the reaction model for the evaluation of the activation energies. Figure 2a plots the differences for all the common reaction mechanisms. The zoom-in of the seven plots at the bottom (F1, F2, F3, D1, D3, R2, R3), are considered better suited to describe Artemisia stem pyrolysis, as shown in Figure 2b.
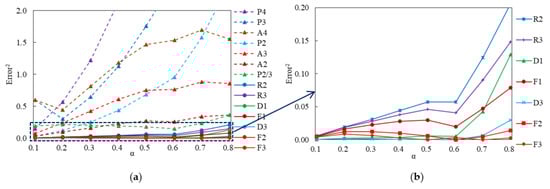
Figure 2.
Difference in the between the calculation of different potential reaction models (cf. Table 1 in [19] for details) and the experimental results, as calculated by Equation (11): (a) the plots for all the common reaction models (b) the zoom-in of the seven plots at the bottom.
To figure out the order of agreement of the seven reaction models with the experimental results, the relative error (RE) for the reaction model ( F1, F2, F3, D1, D3, R2, R3) at each conversion is defined as Equation (12).
From the comparison in Figure 3, we conclude that among all the reaction mechanisms, D3 and F3 are the two best reaction models to describe the Artemisia stem pyrolysis process with a total RE of 13.9 and 38.0, respectively, followed by D1, F2, F1, R3, and R2. This application shows that the new model can reliably and easily determine the feasible reaction mechanism in a relatively theoretical way for the pyrolysis of solids.
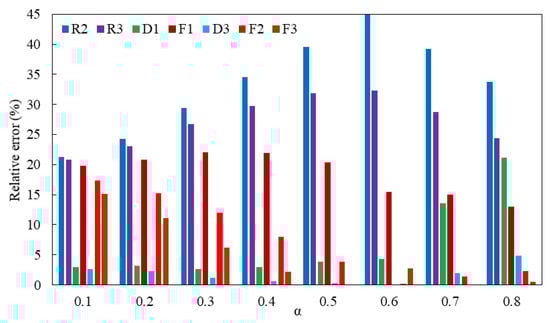
Figure 3.
The relative error of the seven reaction models (F1, F2, F3, D1, D3, R2, R3).
3.3. Evaluation of the Kinetics
If the reaction mechanism is known for a pyrolysis process, one can reform Equation (10) to separate the activation energy, then the kinetics can be obtained via Equation (13). This shows another aspect of the model application. It is worth mentioning, Equations (10) and (13) are the same expression but in a different form. The former is used only if Ea is evaluated in advance by other methods, e.g., KAS, while the latter is used only if the reaction mechanism is determined in advance.
Using the approximation equation (where ), the pre-exponential factor can be calculated by reformulating into Equation (14).
This method for evaluation of the kinetics was validated in our previous work [19].
The reaction model D3 was selected for the evaluation of the kinetic data, since it is the best reaction model for Artemisia stem pyrolysis as described in Section 3.2. The activation energies (Ea) and the pre-exponential factor (A) were evaluated by the new model with 0.05 as the conversion step. Figure 4 shows the evaluated activation energy distributions along the conversion for Artemisia stem pyrolysis under different heating rates, while Figure 5 plots the relationship of A and Ea. The evaluated kinetics vary with conversion degree and heating rates, because we assume the kinetics are dependent on conversion and heating rates in this method. From the results, a number of observations can be made. First, the activation energies vary a lot during the conversion: the minimum is 4 kJ/mol and the maximum is 295 kJ/mol. The values of the activation energies increase first and then decrease along the conversion degree. The peak value of the activation energy occurs around the conversion of 0.65. Second, the activation energies are different for the pyrolysis under different heating rates even at the same conversion. The difference is about 30 kJ/mol for the experiments with a heating value from 10 K/min to 50 K/min. This result is different from the typical isoconversional methods, which assume the activation energy is independent of the heating rate. Comparatively, the heating rate does not affect the activation energies as much as the conversion does. Third, in Figure 5, the lnA and Ea show a linear relationship, as the kinetic compensation effect (KCE) is expressed as for the mutual dependence of the Arrhenius parameters caused by the properties of the general kinetic equation, i.e., the reaction temperature interval, conversion, reaction model and the isokinetic hypothesis [28]. The KCE plot shows the strength of the kinetic parameters regardless of the heating rate, which can be used to improve the accuracy and stability of the kinetic analysis for solid fuel pyrolysis [29]. According to the fitting result, in this study the coefficient a = 0.2113, b = −7.8937 with the R2 = 0.9928. The high R2 value indicates the isokinetic hypothesis used in the evaluation of the kinetics for the D3 model is considered acceptable.
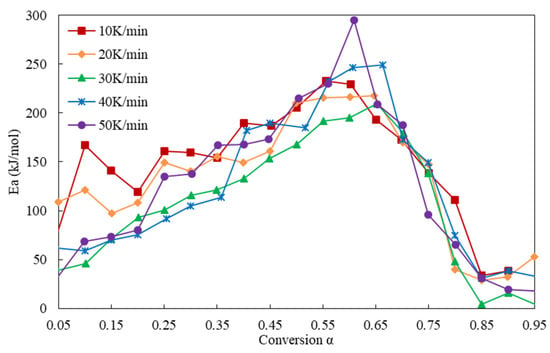
Figure 4.
The activation energies evaluated by the new model during Artemisia stem pyrolysis conversion α.
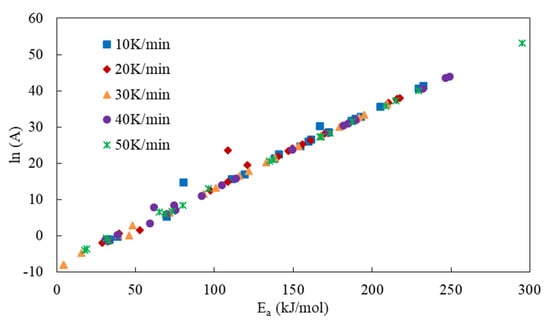
Figure 5.
The relationship of the evaluated Ea and A.
To demonstrate the reliability of the evaluated kinetics from this model, Figure 6 compares the experimental data of Artemisia stem pyrolysis under different heating rates and the calculated conversion rates using the evaluated kinetics in Figure 4 and Figure 5. D3 was chosen as the reaction model for the calculation of the solid conversion rate by Equation (2). The following conclusions are drawn from the comparison. First, the prediction results show good agreement with the experimental data. That illustrates the reliability and applicability of the evaluated kinetics from the model. Second, the calculated conversion rates fit the experimental data of 30 K/min best. That is probably due to the less noisy experimental data compared to the experiments under other heating rates. The accuracy of the kinetic model is sensitive to the quality of the experimental data. Third, the prediction error at the initial and ending stages are larger than those at the stable conversion stage. The greatest error may come from (1) the largest experimental error; (2) the complexity of the reaction model at the initial and ending stages. A smaller conversion step and multiple reaction models are recommended for calculation of the conversion rate at the beginning and ending stages of the pyrolysis.
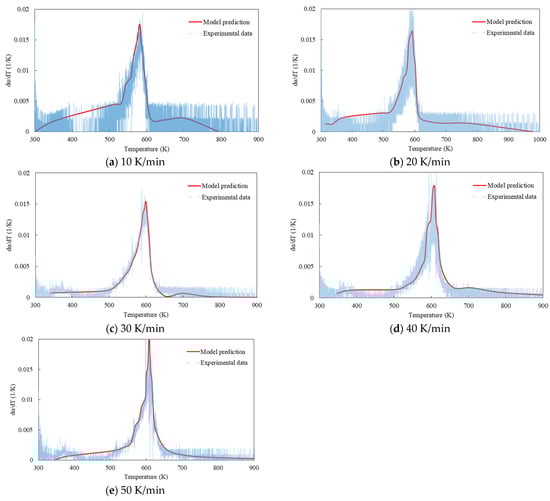
Figure 6.
Comparison of the predicted conversion rate using the evaluated kinetics by the new model and the experimental data of Artemisia stem pyrolysis under different heating rates (a) 10 K/min, (b) 20 K/min, (c) 30 K/min, (d) 40 K/min and (e) 50 K/min.
To sum up, the activation energies of Artemisia stem pyrolysis vary a lot along the conversion and are lightly influenced by the heating rate. The evaluated kinetics are consistent with KCE expression. The kinetics evaluated by this model are reliable for predicting the solid conversion rate during the pyrolysis process. A smaller conversion step and a reasonable reaction mechanism are recommended for the kinetic analysis at the initial and ending stages of solid fuel pyrolysis.
4. Conclusions
In this paper, extended works based on a new statistical model for the description of solid fuel pyrolysis have been successfully carried out for the kinetic analysis of Artemisia stem pyrolysis. Three applications based on the new model are demonstrated: identification of the conversion rate position, determination of the reaction mechanism, and evaluation of the activation energies. Based on the assumed first-order reaction model, the identified conversion peak temperature showed a negligible difference compared to the experimental data. The results of the determination of the reaction mechanism show the 3D diffusion-Jander reaction model fits Artemisia stem pyrolysis best. At last, the kinetics of Artemisia stem pyrolysis are proven to change with the conversion and heating rates. The kinetic compensation effect is shown in the evaluated kinetics as well. The evaluated kinetics are reliable to apply in the prediction of the solid conversion rate compared to experimental data.
Author Contributions
Conceptualization, T.G. and C.Y.; modeling, T.G.; writing—original draft preparation, T.G.; writing—review and editing, C.Y. and T.B.; supervision, C.Y. and T.B. All authors have read and agreed to the published version of the manuscript.
Funding
This research is partly supported by external funding from Innovation Fund Denmark (0143-00015B) and internal funding from AAU Energy.
Institutional Review Board Statement
Not applicable.
Informed Consent Statement
Not applicable.
Data Availability Statement
Not applicable.
Acknowledgments
Tianbao Gu would like to acknowledge the China Scholarship Council and AAU Energy for supporting his PhD study in Aalborg University. The authors are grateful to Changjian Wang with the School of Civil Engineering, Hefei University of Technology, Hefei, China, for sharing the original experimental data.
Conflicts of Interest
The authors declare no conflict of interest.
References
- Demirbas, M.F.; Balat, M.; Balat, H. Potential Contribution of Biomass to the Sustainable Snergy Development. Energy Conv. Manag. 2009, 50, 1746–1760. [Google Scholar] [CrossRef]
- Wang, S.; Dai, G.; Yang, H.; Luo, Z. Lignocellulosic Biomass Pyrolysis Mechanism: A State-of-the-Art Review. Prog. Energy Combust. Sci. 2017, 62, 33–86. [Google Scholar] [CrossRef]
- Bridgwater, A.V. Renewable Fuels and Chemicals by Thermal Processing of Biomass. Chem. Eng. J. 2003, 91, 87–102. [Google Scholar] [CrossRef]
- Chen, T.; Ku, X.; Lin, J.; Ström, H. CFD-DEM Simulation of Biomass Pyrolysis in Fluidized-Bed Reactor with a Multistep Kinetic Scheme. Energies 2020, 13, 5358. [Google Scholar] [CrossRef]
- Nzihou, A.; Stanmore, B.; Lyczko, N.; Minh, D.P. The Catalytic Effect of Inherent and Adsorbed Metals on the Fast/Flash Pyrolysis of Biomass: A Review. Energy 2019, 170, 326–337. [Google Scholar] [CrossRef] [Green Version]
- Khiari, B.; Jeguirim, M. Pyrolysis of Grape Marc from Tunisian Wine Industry: Feedstock Characterization, Thermal Degradation and Kinetic Analysis. Energies 2018, 11, 730. [Google Scholar] [CrossRef] [Green Version]
- Zhang, H.; Wang, Y.; Shao, S.; Xiao, R. An Experimental and Kinetic Modeling Study Including Coke Formation For Catalytic Pyrolysis of Furfural. Combust. Flame 2016, 173, 258–265. [Google Scholar] [CrossRef]
- Burra, K.R.G.; Gupta, A.K. Modeling of Biomass Pyrolysis Kinetics Using Sequential Multi-Step Reaction Model. Fuel 2019, 237, 1057–1067. [Google Scholar] [CrossRef]
- Richter, F.; Atreya, A.; Kotsovinos, P.; Rein, G. The Effect of Chemical Composition on the Charring of Wood Across Scales. Proc. Combust. Inst. 2019, 37, 4053–4061. [Google Scholar] [CrossRef]
- Li, M.; Jiang, L.; He, J.; Sun, J. Kinetic Triplet Determination and Modified Mechanism Function Construction for Thermo-Oxidative Degradation of Waste Polyurethane Foam Using Conventional Methods and Distributed Activation Energy Model Method. Energy 2019, 175, 1–13. [Google Scholar] [CrossRef]
- Wu, Z.; Ma, C.; Jiang, Z.; Luo, Z. Structure Evolution and Gasification Characteristic Analysis on Co-pyrolysis Char from Lignocellulosic Biomass and Two Ranks of Coal: Effect Of Wheat Straw. Fuel 2019, 239, 180–190. [Google Scholar] [CrossRef]
- Han, Z.; Li, J.; Gu, T.; Yan, B.; Chen, G. The Synergistic Effects of Polyvinyl Chloride and Biomass During Combustible Solid Waste Pyrolysis: Experimental Investigation and Modeling. Energy. Conv. Manag. 2020, 222, 113237. [Google Scholar] [CrossRef]
- Noszczyk, T.; Dyjakon, A.; Koziel, J.A. Kinetic Parameters of Nut Shells Pyrolysis. Energies 2021, 14, 682. [Google Scholar] [CrossRef]
- Meng, F.; Zhou, Y.; Liu, J.; Wu, J.; Wang, G.; Li, R.; Zhang, Y. Thermal Decomposition Behaviors and Kinetics of Carrageenan-Poly Vinyl Alcohol Bio-Composite Film. Carbohydr. Polym. 2018, 201, 96–104. [Google Scholar] [CrossRef]
- Vyazovkin, S.; Burnham, A.K.; Criado, J.M.; Pérez-Maqueda, L.A.; Popescu, C.; Sbirrazzuoli, N. ICTAC Kinetics Committee Recommendations for Performing Kinetic Computations on Thermal Analysis Data. Thermochim. Acta 2011, 520, 1–19. [Google Scholar] [CrossRef]
- Gai, C.; Zhang, Y.; Chen, W.; Zhang, P.; Dong, Y. Thermogravimetric and Kinetic Analysis of Thermal Decomposition Characteristics of Low-Lipid Microalgae. Bioresour. Technol. 2013, 150, 139–148. [Google Scholar] [CrossRef]
- Criado, J.M. Kinetic Analysis of DTG Data from Master Curves. Thermochim. Acta 1978, 24, 186–189. [Google Scholar] [CrossRef]
- Li, X.; Grace, J.R.; Bi, X.; Campbell, J.S. A New Pyrolysis Model Based on Generalized Extreme Value (GEV) Distributions and its Application to Lignocellulosic Biomass. Fuel 2016, 184, 211–221. [Google Scholar] [CrossRef]
- Gu, T.; Fu, Z.; Berning, T.; Li, X.; Yin, C. A simplified kinetic model based on a universal description for solid fuels pyrolysis: Theoretical Derivation, Experimental Validation, and Application Demonstration. Energy 2021, 225, 120133. [Google Scholar] [CrossRef]
- Kim, G.; Lee, D.; Jeon, C. Fundamental Characteristics and Kinetic Analysis of Lignocellulosic Woody and Herbaceous Biomass Fuels. Energies 2019, 12, 1008. [Google Scholar] [CrossRef] [Green Version]
- Ali, I.; Naqvi, S.R.; Bahadar, A. Kinetic Analysis of Botryococcus Braunii Pyrolysis Using Model-Free and Model Fitting methods. Fuel 2018, 214, 369–380. [Google Scholar] [CrossRef]
- Chong, C.T.; Mong, G.R.; Ng, J.; Chong, W.W.F.; Ani, F.N.; Lam, S.S.; Ong, H.C. Pyrolysis characteristics and kinetic studies of Horse Manure Using Thermogravimetric Analysis. Energy. Conv. Manag. 2019, 180, 1260–1267. [Google Scholar] [CrossRef]
- Málek, J. The Kinetic Analysis of Non-Isothermal Data. Thermochim. Acta 1992, 200, 257–269. [Google Scholar] [CrossRef]
- Liu, H.; Wang, C.; Zhao, W.; Yang, S.; Hou, X. Pyrolysis Characteristics and Kinetic Modeling of Artemisia Apiacea by Thermogravimetric Analysis. J. Anal. Calorim. 2018, 131, 1783–1792. [Google Scholar] [CrossRef]
- Mianowski, A.; Baraniec, I. Three-Parametric Equation in Evaluation of Thermal Dissociation of Reference Compound. J. Therm. Anal. Calorim. 2009, 96, 179–187. [Google Scholar] [CrossRef]
- Vo, T.K.; Ly, H.V.; Lee, O.K.; Lee, E.Y.; Kim, C.H.; Seo, J.; Kim, J.; Kim, S. Pyrolysis Characteristics and Kinetics of Microalgal Aurantiochytrium Sp. KRS101. Energy 2017, 118, 369–376. [Google Scholar] [CrossRef]
- Criado, J.M.; Málek, J.; Ortega, A. Applicability of the Master Plots in Kinetic Analysis of Non-Isothermal Data. Thermochim. Acta 1989, 147, 377–385. [Google Scholar] [CrossRef]
- Koga, N. A Review of the Mutual Dependence of Arrhenius Parameters Evaluated by the Thermoanalytical Study of Solid-State Reactions: The Kinetic Compensation Effect. Thermochim. Acta 1994, 244, 1–20. [Google Scholar] [CrossRef]
- Zhu, H.; Liu, N. Kinetic analysis based on the kinetic compensation effect and optimization calculation. Thermochim. Acta 2020, 690, 178686. [Google Scholar] [CrossRef]
Publisher’s Note: MDPI stays neutral with regard to jurisdictional claims in published maps and institutional affiliations. |
© 2021 by the authors. Licensee MDPI, Basel, Switzerland. This article is an open access article distributed under the terms and conditions of the Creative Commons Attribution (CC BY) license (https://creativecommons.org/licenses/by/4.0/).