Article

Determinants of the EU Citizens’ Attitudes towards the European Energy Union Priorities

Faculty of Organization and Management, Silesian University of Technology, 41-800 Zabrze, Poland
*
Author to whom correspondence should be addressed.
Energies 2021, 14(17), 5237; https://doi.org/10.3390/en14175237
Submission received: 14 July 2021 / Revised: 20 August 2021 / Accepted: 23 August 2021 / Published: 24 August 2021
(This article belongs to the Section C: Energy Economics and Policy)

Abstract

:
The European Union has adopted very ambitious climate and energy goals for the coming years. The key prerequisite to successfully achieve these goals seems to be extensive support and adequate commitment of the member states and their citizens to the implementation of the clean energy transition and climate neutrality measures. Therefore, this study presents a comprehensive analysis aiming to identify the factors determining the EU citizens’ attitudes towards the European Energy Union priorities. The analysis was based on representative data obtained from residents of twenty-seven EU countries using a Eurobarometer survey. The collected data were subjected to a comparative analysis and binary logistic regression. The research results demonstrated that the support for specific energy policy priorities varies significantly depending on different perceptions of the EU citizens and was affected by a number of demographic variables. It was indicated that perceiving the environment, climate and energy as the most important issues from the perspective of an individual, a country and the EU significantly affects attitudes towards energy policy priorities. However, this mostly concerned the awareness of the importance of these issues at the EU level. Individuals who supported a common energy policy among the EU member states were more likely to point to green energy priorities, whereas guaranteeing low energy prices for companies and consumers seemed less important for them. It was remarkable that the reduction of energy consumption was indicated as an energy policy priority by respondents expecting both more and less decision-making at the European level in the field of environmental protection. People with a right-wing orientation were the most likely to support the competitiveness of the EU’s industry, while individuals with a leftist ideology showed the strongest tendency to opt for environmental protection. Furthermore, gender, occupation and the place and country of residence emerged as very important determinants of attitudes towards the European Energy Union priorities, whereas age and the educational level were predictors in very few cases only.

1. Introduction

Fighting climate change is a key challenge the world is facing in the 21st century. At the core of this challenge is the question of energy. In particular, the total level of energy consumption and the use of fossil fuels as the primary energy source. Statistics show that about two thirds of the world’s greenhouse gas emissions arise when fossil fuels are fired to obtain heat and electricity for households, transport and industry. For this reason, countries all around the world have been making efforts, to a greater or lesser extent, to ensure the production of clean energy, as well as its more efficient use by end users.
Energy processes are also responsible for the largest share of greenhouse gas emissions in the European Union—in 2017, emissions from this sector accounted for 77.9% of total greenhouse gas emissions in the EU [1]. This is why the EU has for years been implementing numerous initiatives making it a world leader in fighting climate change. These initiatives include:
  • Establishing in 2007 and adopting in 2009 a package of ambitious energy and climate goals to be achieved in 2020—20% reduction in greenhouse gas emissions (compared to 1990 levels), 20% of energy produced from renewable sources and 20% improvement in energy efficiency [2].
  • Establishing in January 2014 the climate and energy policy framework for 2020–2030—recommendation to increase the reduction of greenhouse gas emissions to at least 40% by 2030 (compared to 1990 levels), increase to at least 27% of production renewable energies and further improving energy efficiency [3].
  • Adopting in February 2015 a framework strategy for the Energy Union to provide all Europeans with clean, safe and affordable energy [4].
  • Ratification of the Paris Climate Agreement and the EU’s commitment to achieve a reduction of greenhouse gas emissions by at least 40% by 2030.
  • Publishing in 2016 and implementing in the following years a set of ambitious new rules for the EU energy policy called the “Clean Energy Package for all Europeans” [5], which includes new 2030 targets for energy efficiency and renewables (obtaining at least 32% share of renewable energy and at least 32.5% improvement in energy efficiency) and requires each EU country to establish its own integrated national energy and climate plan for 2021–2030, outlining how it intends to fulfil its contributions to the EU-wide effort.
  • Adopting in November 2018 a long-term strategic vision of a prospering, modern, resource-efficient, competitive and also climate-neutral economy by 2050 [6].
  • Presenting in March 2020 the proposal for the first European climate law, which includes the goal set in the European Green Deal, to make Europe’s economy and society climate neutral by 2050 [7].
  • Presenting in September 2020 the proposal to increase the GHG reduction target to at least 55% by 2030 compared to 1990 levels [8]. A final proposal is expected to be presented in July 2021.
The adoption of all these initiatives should ensure the implementation of the European Energy Union strategy in five mutually reinforcing and closely related dimensions: (1) energy security, (2) a fully integrated European energy market, (3) energy efficiency contributing demand reduction, (4) decarbonizing the economy and (5) research, innovation and competitiveness. It should also enable all Europeans to have access to clean, safe and affordable energy. However, without intensive actions taken by governments and residents of the EU countries, it will not be possible to achieve all assumed climate and energy goals. Statistical data and the report on the state of the Energy Union published in October 2020 show that the EU has so far only achieved the target of reducing greenhouse gas emissions [9] and most likely the target of increasing the share of renewable energy production by 2020 [10]. However, it is not known whether the goal of improving energy efficiency by 2020 has been achieved, because in 2019, the EU energy consumption indicators showed higher levels of energy consumption than planned to be achieved in 2020 [11]. Probably due to the COVID-2019 pandemic, energy consumption in 2020 has been limited, but these reductions will be short-term and may not allow the 2030 target to be met.
Therefore, individual member states, as well as energy end users, need to advance efforts if the EU is to achieve all its climate and energy targets by 2030 and the overall carbon neutrality target by 2050 [12]. However, it should be taken into account that introducing further clean energy transition measures will generate significant costs, and this will affect the energy price paid by consumers [13]. Therefore, it is very important that members of the public are involved in achieving the climate and energy goals and are aware of the purposefulness of the actions taken. Research shows that people are more likely to accept energy policy goals when they are properly involved in the relevant decision-making process and believe that the process is fair and their interests are taken into account [14,15]. This is why it is so important to get to know the public’s opinion about the energy policy objectives that people consider to be a priority to be achieved in the coming years. This knowledge should concern the priorities selected to be achieved both at the level of the entire EU and individual countries, because each country has a different specificity and different objectives may be indicated by its citizens as priorities. It is also important to identify the determinants that influence people’s attitudes towards energy policy in individual EU countries, as well as in the entire EU, in order to intensify activities enabling the transformation towards clean energy and climate neutrality. It should be noted that to identify these factors, it is necessary to get to know the views of as many people as possible on this subject.
The European Commission periodically examines a public opinion as a part of the Standard Eurobarometer survey (which focuses on monitoring key trends relevant for the European Union as a whole, European Commission priorities and contemporary socio-political events), as Special Eurobarometer surveys (which are detailed thematic surveys relevant to the activities of the European institutions) or as a Flash Eurobarometer (which is an ad hoc thematic survey, carried out in a short time and covering a wide range of specific topics). In the area of public opinion polls on the energy policy, the Standard Eurobarometer survey regularly asks about the priorities that respondents believe should be most important for the Energy Union. Such questions appeared, i.e., in the Eurobarometer wave EB91.5 from 2019, waves EB89.1 and EB90.3 from 2018, waves EB87.3 and EB88.3 from 2017, wave EB86.2 from 2016, and waves EB83.1 and EB83.3 from 2015. Unfortunately, the Eurobarometer does not ask the same questions in every survey and even if the intention of the question is the same, the specific formulations may be different.
The Eurobarometer also conducts opinion polls in selected areas of energy policy. Examples of such studies include: Special Eurobarometer 492 wave EB91.4 from 2019 (in which the residents of the European Union were asked about their opinion on the functioning of the Energy Union), Special Eurobarometer 435 wave EB83.4 from 2015 (containing questions about changes climate and energy efficiency); 2011 Special Eurobarometer EB75.1 (in which EU citizens were asked about the measures they are taking to reduce energy consumption), Special Eurobarometer 360 wave EB74.3 2010 (with questions about increasing the EU’s responsibility to ensure safe energy supply for all EU members) and a special Eurobarometer survey 324 wave 72.2 from 2009 (which surveyed the public opinion of EU residents about nuclear energy and the safety of its production and use).
Public opinion polls in the field of energy policy were also carried out as part of the European Social Survey European Research Infrastructure “Public Attitudes to Climate Change” (ESS8 2016).
Data on public opinion on energy issues, including data collected as a part of the Eurobarometer and the European Social Survey, were the basis of many analyzes. Examples include identifying the influence of cultural aspects on the use of renewable and nuclear energy [16,17] or the determination of the impact of the Fukushima nuclear power plant disaster on the acceptance of the use of different energy sources [18,19,20]. In the literature under analysis, there are also studies in which the results of public opinion polls in the field of energy policy are analyzed, but they are often based on small samples or are conducted in the context of one country, e.g., [21,22,23,24,25,26,27,28,29,30,31,32,33,34]; are focused only on a selected aspect of energy policy, e.g., [35,36,37,38,39,40,41,42]; or they are quite extensive but based on data from Eurobarometer surveys from several years ago [43,44]. Therefore, there is a need to further expand and update research on the determinants of the public attitudes towards energy policy priorities.
The aim of this research was to identify the factors determining the EU citizens’ attitudes towards the priorities on which the energy policy should focus in the coming years. Data collected under the standard Eurobarometer 91 wave EB91.5 were used to identify these factors [45]. To the best of our knowledge, no study has been published so far presenting the results of the analysis of data on energy priorities from this Eurobarometer. The data collected from twenty-seven EU countries was subjected to statistical analysis using a comparative analysis and binary logistic regression. The obtained results allowed:
  • To identify the European Energy Union priorities that are most relevant in each EU country as well as in the entire EU;
  • To determine the characteristics of the respondents influencing their attitudes towards specific energy priorities;
  • To compare the strength of the influence of relevant factors on the selection of a given priority.
The structure of this article is as follows: Section 2 presents the results of the literature review in the field of determinants of attitudes towards energy policy. The research methodology is described in detail in Section 3. Section 4 presents and discusses the results of statistical and econometric analysis. Finally, the concluding remarks and limitations are presented in Section 5.

2. Literature Review

Efficient implementation of the energy policy requires adequate acceptance of the public [46]. Therefore, the identification and understanding of what factors affect public support for various energy policy measures seem to be of particular importance. The performed literature review aimed to indicate potential determinants of attitudes towards energy policies. To achieve this goal, relevant instances of research were identified and analyzed to determine the factors that influence energy consumption patterns, energy-saving behaviors and, in particular, the acceptance of specific energy policies.
The research results indicate that there are psychological, social and cultural factors related to individual perceptions, beliefs and values, as well as demographic variables (i.e., age, gender, education level, income, household composition, dwelling location, occupation, etc.) that may affect the acceptance of energy policies and energy-related attitudes and behaviors. However, considering the specificity of these variables, mixed effects were obtained.
Wang and Kim demonstrated that the acceptance of energy policy is affected by individual perceptions and beliefs as well as the socio-cultural context specific for each country [18]. Based on a survey performed in South Korea, Lee and Ko indicated that symmetrical and transparent communication increases acceptance of government decisions on nuclear energy policy [47]. In addition, information provision and transparency were indicated as a necessary pre-condition for higher level of passive public involvement and active public engagement in decision-making [48]. The role of the perceived trust, benefits and risks in relation to propensity to use renewable energy was emphasized by Park and Ohm [20]. People are more prone to accept energy policy when it aligns with and supports their important values [46]. Allen Wolters et al. found that respondents with stronger environmental values were more likely to support energy efficiency, funding for renewable energy and price discrimination policies [21]. Wang and Kim demonstrated that environmentalism decrease nuclear power acceptance [18]. Based on data from a national British survey, Corner et al. also indicated that higher environmental values are negatively related to support for nuclear power. However, when nuclear power was perceived as a measure to mitigate climate change and to improve energy security, this led to conditional or reluctant acceptance of nuclear energy and analyzed relationships became positive [38]. The acceptability of energy policy is higher when people are aware of energy problems and feel morally obliged to reduce them [49]. Moreover, energy policy is more acceptable when it does not seriously threaten freedom of choice [50].
Analyzing households in major Asian cities, Hori et al. indicated that environmental behavior, global warming awareness and social interactions were strongly related to energy-saving actions [51]. Drawing on data retrieved from European Social Survey, Stadelmann-Steffen and Eder revealed that individuals characterized by high acceptance of anthropogenic causes of climate change were more likely to support green energy policy instruments such as tax on fossil fuels, subsidies for renewables and withdrawal of the energy-inefficient household appliances [52]. Furthermore, Verschoor et al. found interconnection between support for various types of energy policies and indicated that individuals who support a fossil fuel tax are more likely to support banning inefficient appliances and subsidizing renewables [53]. Anderson et al. demonstrated that the public opinion on environmental protection in a country directly affects governmental policies [35]. Based on a survey conducted in Greece and exploring determinants of public awareness of renewable energy sources, Karytsas and Theodoropoulou found that environmentally friendly behavior and engagement in energy saving actions had positive effects on public awareness of different renewable energy sources [26]. Drawing on data from a survey of German respondents, Groh and von Mollendorff revealed that the perceived importance of climate protection and environmental sustainability were pivotal factors for a strong support of the renewable energy transition [54]. Analyzing survey data obtained from respondents representing North America’s Pacific Northwest, Hazboun and Boudet demonstrated that views on climate and environmental priorities were strong predictors of the acceptance of various energy types. In particular, individuals who prioritized environmental protection over economic development were more likely to support wind, solar and wave/tidal energy and less likely to support nuclear, natural gas and hydroelectric energy. Anthropogenic warming consciousness was positively related to support for solar, wind and wave/tidal energy, and negatively related to support for coal, nuclear, natural gas and hydropower [55]. Marquart-Pyatt et al. found that climate change views and renewable energy views positively affect green energy policy preferences [56]. Based on the data from a survey conducted in Germany, Liebe and Dobers demonstrated that climate change concern affects the acceptance of wind and solar energy. Furthermore, people characterized by climate change concern had no intentions to protests against the renewable energy power plants [29]. Moreover, investigating preferences of Swiss households, Motz found that environmental concern influences interest in 100% renewable-based supply [57]. Drawing on the results of a survey of Dutch households, van Rijnsoever and Farla indicated that environmental attitudes affect the propensity to accept the energy technologies with a low risk of catastrophes and low spatial impact. However, respondents with high environmental attitudes valued the price to pay for energy less [58]. The research by Wicker and Becken demonstrated that climate change concern positively affects energy policies perceptions and declared changes in behaviors related to energy consumption. By contrast, respondents concerned about energy availability were less likely to support energy policies and to change behaviors related to energy consumption in the future [59].
The results of the literature review indicate that political ideology can be a significant predictor of the acceptance of the energy policy and energy-related attitudes and behaviors. Stadelmann-Steffen and Eder demonstrated that individuals with leftist ideology were more likely to support green energy policy instruments [52]. Marquart-Pyatt et al. indicated that individuals with a left-wing orientation were prone to support progressive energy policies more than their counterparts on the right [56]. The research by Allen Wolters et al. found that respondents with more liberal political ideology were prone to support energy efficiency, renewables and price discrimination policies [21]. Wang and Kim proved that left ideology decrease nuclear power acceptance [18]. Furthermore, McCright et al. emphasized that citizens with left political orientation were more likely to believe in anthropogenic climate change and to stand behind the actions to mitigate it [60]. In turn, Tosun and Mišić indicated that respondents with a right-wing orientation were more likely to support security dimension of Energy Union priorities (i.e., guaranteeing a continuous energy supply and guaranteeing the EU’s energy independence). By contrast, this group of respondents were less likely to accept climate-related priorities (i.e., developing renewable energy and fighting global warming) and environmental dimensions (i.e., protecting the environment) [44]. Groh and von Mollendorff revealed that conservative respondents were less likely to accept renewables [54]. Moreover, Hazboun and Boudet indicated that conservatives were prone to support coal and nuclear energy, and less likely to support wind energy [55].
Considering gender as a potential determinant of the acceptance of energy policies, Balta-Ozkan and Le Gallo highlighted that women had a lower probability to choose guaranteeing continuous energy supply, energy independence, reduction of energy consumption and guaranteeing the competitiveness of industries than men. Instead, women were more likely to indicate protecting the environment as national energy policy priority [43]. Women were also more likely to indicate environment and climate protection as European Energy Union priorities. However, this group was characterized by decreased propensity to prioritize energy security and energy independence [44]. According to Knox-Hayes et al., women express a greater concern for energy security than men [39]. Women were also indicated as more concerned about energy problems and related risks [58]. Moreover, Karytsas and Theodoropoulou found that gender is significantly related to the knowledge and awareness of various renewable energy sources [26]. However, other studies showed that gender was not found to be a predictor of energy-conserving behavior [31], and the willingness to adopt renewables [32].
Exploring data derived from interviews performed in seventeen European countries, Balta-Ozkan and Le Gallo indicated that age was positively related to the selection of guaranteeing a continuous energy supply and energy independence as an energy policy priority. However, as age decreased, respondents showed a stronger preference for guaranteeing low prices for consumers and protecting the environment [43]. Based on the analysis of Greek households, Sardianou proved that consumers’ age was negatively related to their willingness to adopt the energy-conserving actions [31]. Moreover, Karytsas and Theodoropoulou found that age had significant negative relations with the knowledge and awareness of different renewable energy sources (e.g., solar energy) [26]. Young individuals were also more likely to support green energy policy instruments [52]. Based on data from household surveys conducted in the U.S. western states, Allen Wolters et al. found that younger people were prone to support voluntary energy conservation campaigns and research in renewable technologies [21]. Analyzing cross-sectional datasets from Greece, Sardianou and Genoudi indicated that middle-aged people are characterized by greater willingness to adopt renewable energy sources [32]. On the other hand, older people were more likely to indicate the energy security and energy independence as European Energy Union priorities. However, this group demonstrated decreased propensity to prioritize environment and climate protection [44]. By contrast, Urban and Scasny, using observations from nine OECD countries, indicated that older people were more environmentally concerned and were more likely to reduce energy demand and introduce energy efficiency measures [61]. The study by Knox-Hayes et al. showed that greater energy security concern was also observed for older individuals [39]. Furthermore, the older people were found as more concerned about energy problems and related risks [58]. Nevertheless, Hori et al. revealed a weak effect of age on the relationships between environmental behavior and energy-saving behaviors [51].
Exploring the dataset obtained from households in eleven European countries, Mills and Schleich found that families with young children place primary importance on energy savings for environmental reasons and are more likely to adopt energy-efficient use behaviors. On the other side, families with elderly members were focused on financial savings, and were less likely to undertake energy efficiency and conservation activities [62]. Moreover, Sardianou indicated that consumers living with an extended family were more likely to undertake energy conservation improvement [31]. Analyzing UK respondents, Druckman and Jackson also indicated that energy use patterns were strongly related to household composition [63]. The study by Balta-Ozkan and Le Gallo showed that young families (with children under 10 years old) were prone to select low prices for consumers as a national energy policy priority, but families with children aged 10 to 14 years old had a lower probability to choose guaranteeing a continuous supply of energy [43].
It was found that the education level was positively related to the selection of energy policy priorities such as protecting the environment, reducing energy consumption, guaranteeing continuous energy supply and guaranteeing energy independence. On the other hand, as years of education decreased, guaranteeing low prices for consumers was less likely to be selected as a national energy policy priority [43]. The higher educational level was also positively related to support of green energy policy instruments [52]. Moreover, higher education level increased willingness to adopt energy-efficient practices and stated importance of energy savings for emissions reductions (however, it decreased the stated importance for financial reasons) [62]. Highly educated people were also found to be characterized by greater willingness to adopt renewable energy sources [32]. Individuals with higher educational level were prone to support voluntary energy conservation campaigns and research in renewable technologies [21]. Karytsas and Theodoropoulou indicated that educational level had significant relations with the knowledge and awareness on different renewable energy sources (e.g., solar energy) [26]. By contrast, the greater energy security concern was observed for individuals with lower educational level [39]. Nevertheless, the other studies showed that educational level was not found to be predictors of energy-conserving behaviors [31,61].
The research by Sardianou revealed that propensity to undertake energy conservation improvement increases in consumers with higher incomes [31]. Druckman and Jackson demonstrated that energy use patterns were strongly related to income levels [63]. Furthermore, Urban and Scasny indicated that wealthier households were less concerned about environmental problems and tended to adopt energy-saving curtailments less, but were more likely to invest in energy efficiency [61]. Sardianou and Genoudi found positive effect of income on acceptance of renewable energy projects [32]. Higher incomes were also positively related to expectations of energy efficiency standards improvement in new construction [21]. However, Knox-Hayes et al. indicated that greater energy security concern was observed for respondents with lower income [39]. Moreover, Hori et al. revealed that income had a weak effect on energy-saving behaviors [51].
It was also demonstrated that occupation may influence attitudes towards energy policy. For example, employed professionals were found to be less likely to choose guaranteeing low prices for consumers, but more likely to select guaranteeing independence in the field of energy as national energy policy priorities. By contrast, manual workers were prone to support guaranteeing low prices for consumers; however, this group showed decreased propensity to prioritize the reduction of energy consumption [43]. Furthermore, Karytsas and Theodoropoulou found that having an occupation, studies or interests related to environment, technology or engineering had significant relationships with the knowledge and awareness on different renewable energy sources (e.g., wind energy) [26].
The literature under analysis showed that households in large cities had a higher probability to select protecting the environment and guaranteeing a continuous energy supply as national energy policy priorities. By contrast, this type of household had lower probability to select guaranteeing low energy prices for consumers than those in rural and small urban areas [43]. The urban domicile was also indicated as a predictor of support for green energy policy instruments [52]. Moreover, Druckman and Jackson indicated that energy use patterns were strongly related to type of dwelling, tenure and location (i.e., rural or urban) [63].
It should be noted that the described factors cannot be investigated and discussed in isolation. They are often connected and interact in many different ways [64]. Nevertheless, as indicated by the literature review, although various studies on energy policy have been published in recent years, it is hard to find examples of comprehensive research covering the wide spectrum of European energy policy priorities. Moreover, the publications that exist often focus on a narrow set of potential predictors of attitudes towards the energy policy. Furthermore, very little research has been performed in the domain under consideration based on the latest primary sources. Therefore, we believe that research on determinants of the Europeans’ attitudes towards priorities of the EU’s energy policy needs to be further investigated and extended. The issues definitely require updating.

3. Materials and Methods
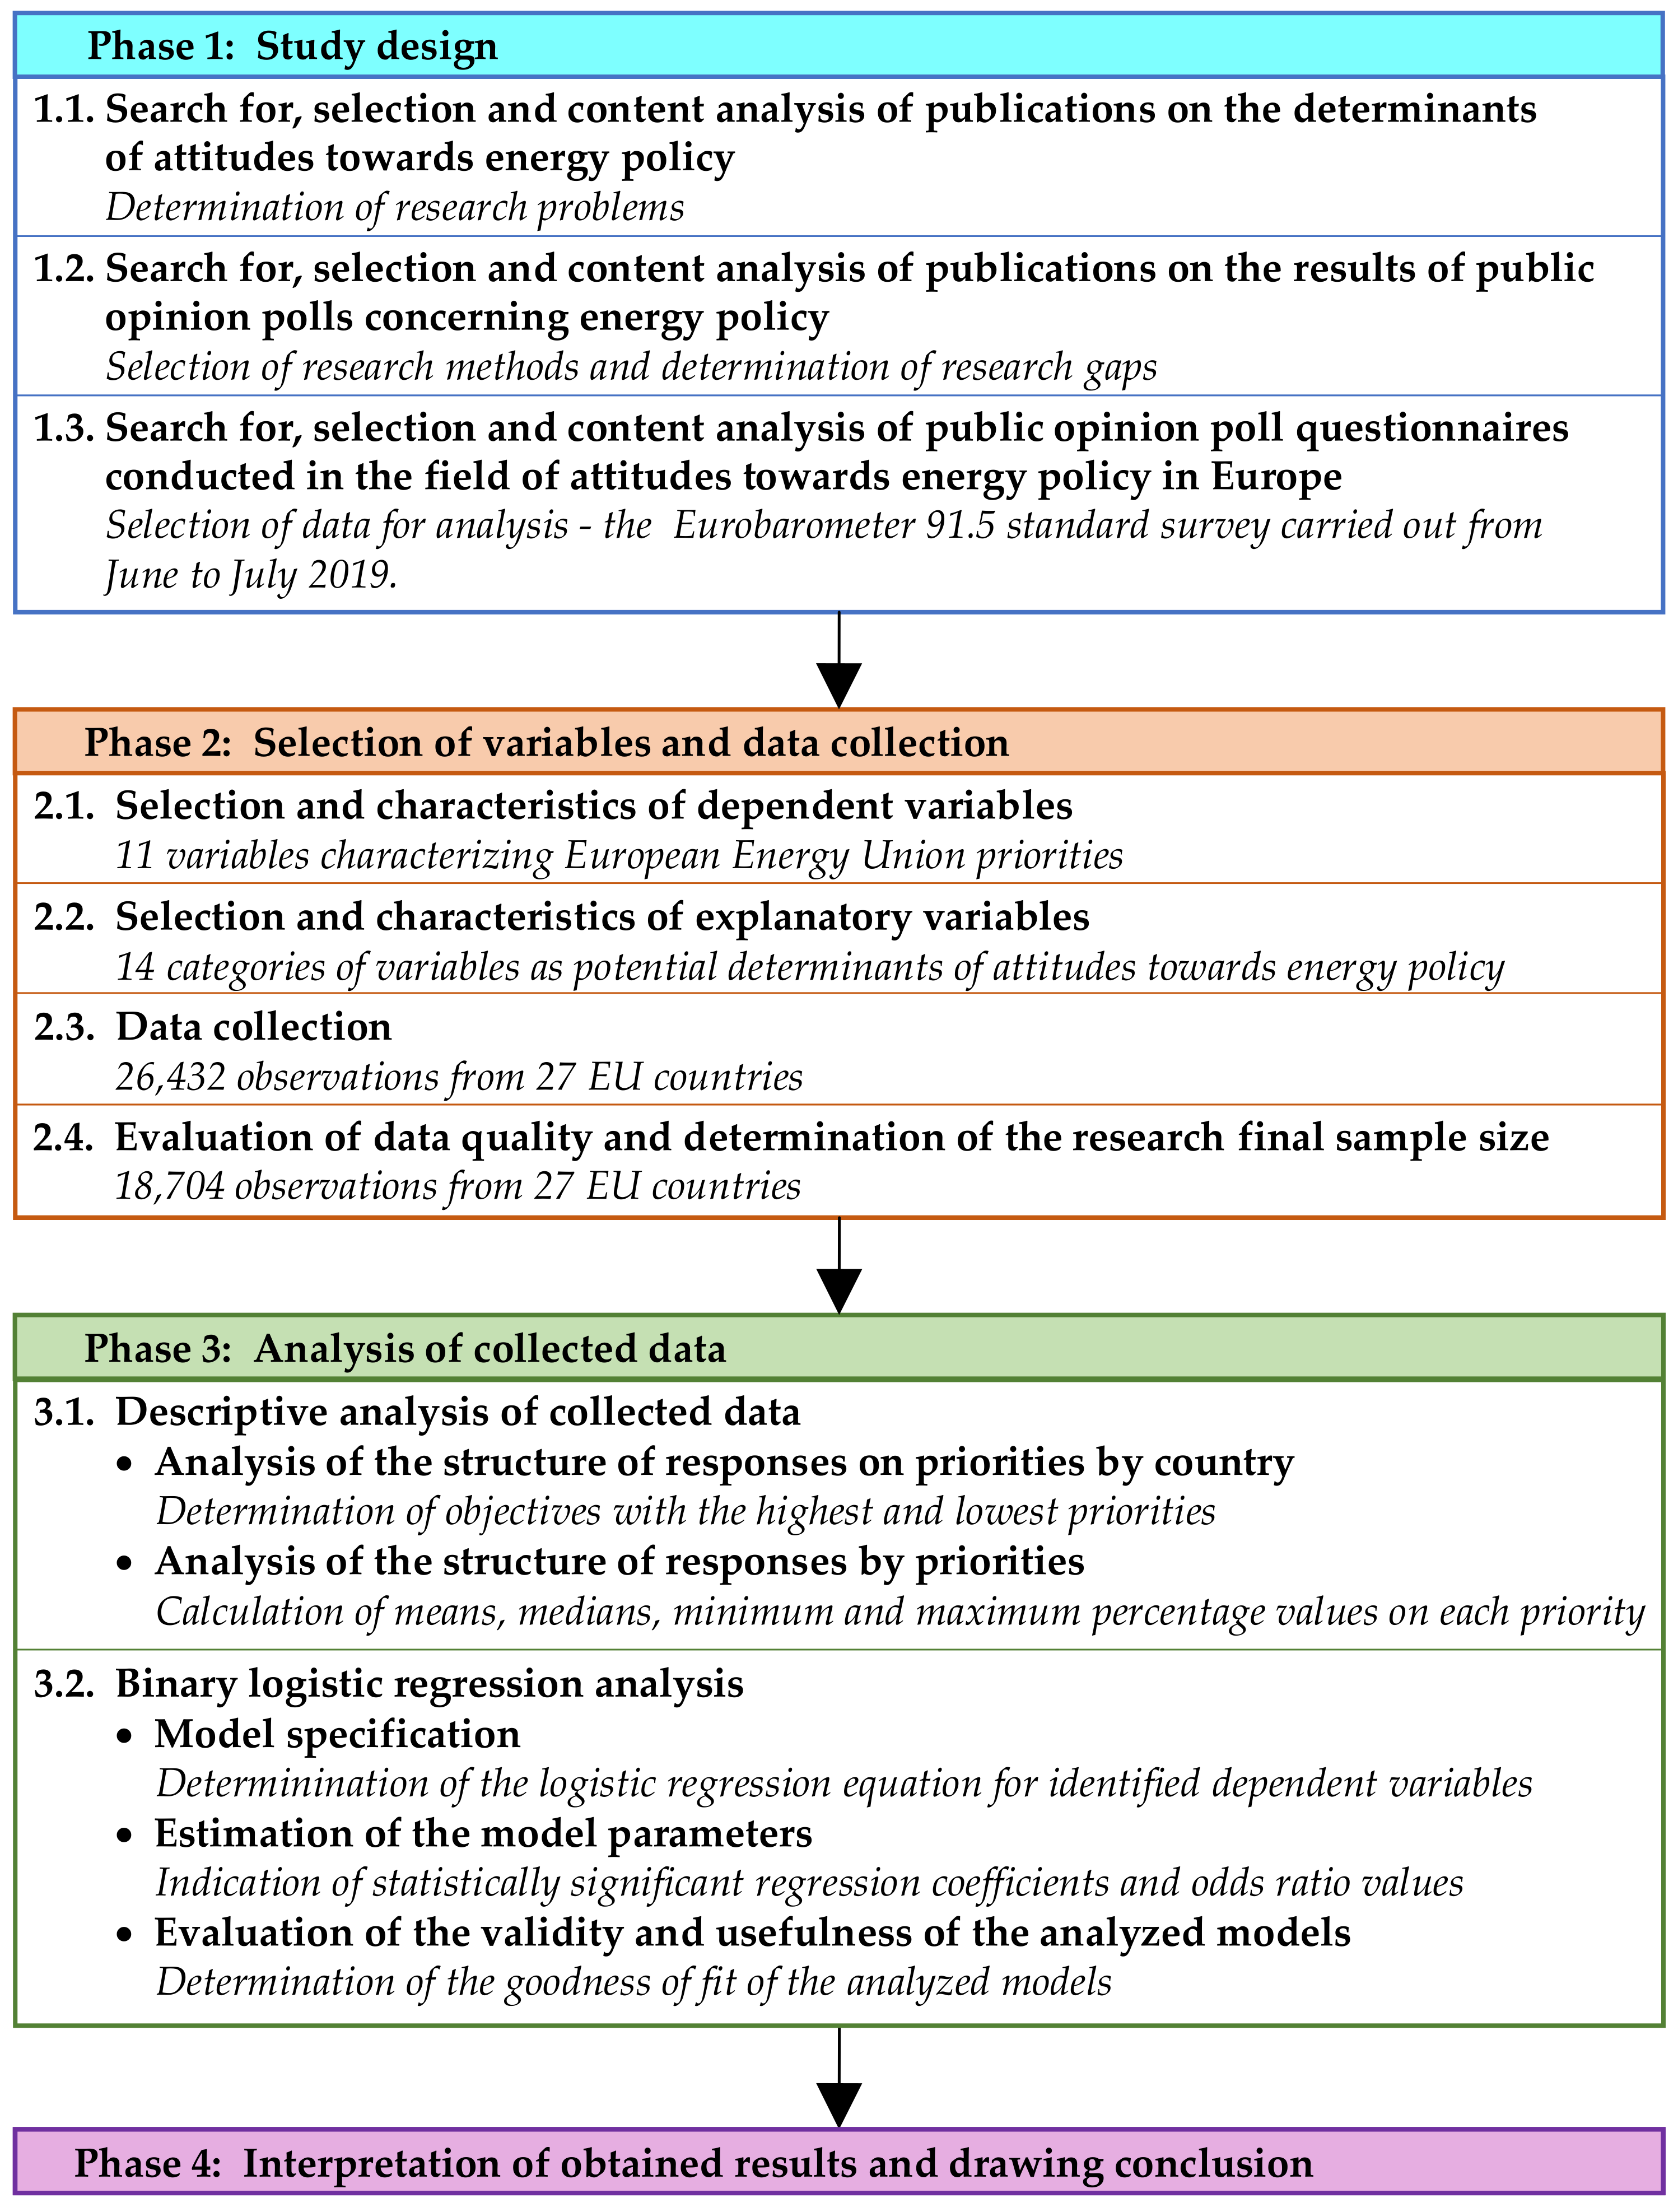
In order to identify the determinants of the Europeans’ attitudes towards Energy Union priorities, it was decided to use statistical data from the Eurobarometer, which is a survey instrument used by the European Commission, the European Parliament and other EU institutions to monitor the state of public opinion in Europe on issues related to the European Union, and also European attitudes on issues of a political or social nature.
The research presented in this article was carried out according to the following phases: (1) study design, (2) selection of variables and data collection, (3) analysis of collected data and (4) interpretation of obtained results and drawing conclusions. The details of consecutive phases of the research methodology adopted in this study are presented in Figure 1.

3.1. Study Design

In the first step of this research, two bibliographic sources (Scopus and Web of Science) were searched in order to indicate publications on the determinants of attitudes towards energy policy and publications describing the results of public opinion research on energy policy. After the initial selection, the publications were subject to content analysis, which allowed us to identify which determinants are most often indicated as conditioning attitudes towards energy policy (referred to in Section 2). The analysis also allowed to indicate what research in the field of determination of attitudes towards energy policy has been carried out so far, and what data sources and research methods have been used in these studies.
Due to the fact that determination of the factors influencing the energy attitudes and behaviors of society requires the knowledge of the opinions of as many people as possible, it was decided to review the databases collecting the results of surveys of European citizens in the area of their approach to energy policy. As mentioned in the introduction, such surveys are systematically conducted as part of the Eurobarometer survey and were carried out in 2016 as part of the European Social Survey European Research Infrastructure “Public Attitudes to Climate Change” (ESS8 2016). Ultimately, it was decided to base this study on data collected under the Standard Eurobarometer 91 wave EB91.5 [45].
The Eurobarometer 91.5 survey was conducted on request of the European Commission, Directorate-General Communication, from June to July 2019. The primary data were collected by Kantar Public Brussels. The study included the resident population of 34 countries: the 27 member states of the European Union, Great Britain (which was an EU member at the time of the study), as well as 5 candidate countries (Turkey, North Macedonia, Montenegro, Serbia, Albania) and the Turkish Cypriot community. The number of people interviewed in each country was around 1000, with the exception of Cyprus, Malta, Luxembourg. Montenegro and Turkish Cypriot, where the number of respondents was smaller (around 500). The respondents had to be 15 years or older. In order to ensure the representativeness of the research, a multi-stage and random sampling design was used.
All interviews were conducted face to face at home and in the appropriate national language. Respondents were asked to express their opinion in various areas, including attitudes towards the European Union (assessment of the current situation and expectations for the coming months), priorities of the European Union and European citizenship, the future of the EU and participation in the 2019 elections of the European Parliament. It should be noted that a large part of the Eurobarometer 91.5 (ZA7576) data duplicated the Eurobarometer 90.3 (ZA7489) and the Eurobarometer 89.1 (ZA6963) questions.

3.2. Selection of Variables and Data Collection

To select dependent and explanatory variables, a detailed review of the Eurobarometer 91.5 questionnaire [45] was performed. The eleven dependent variables were established, and they were based on the question QB2 in the questionnaire survey: “In your opinion, which of the following objectives should be given top priority in a European Energy Union?” Each respondent could choose up to three out of the eleven following categories: (1) guaranteeing reasonable energy prices for customers, (2) guaranteeing a continuous supply of energy, (3) guaranteeing EU’s independence in the field of energy, (4) protecting the environment, (5) interconnecting energy infrastructure, (6) fighting global warming, (7) guaranteeing the competitiveness of EU’s industry, (8) reducing energy consumption, (9) guaranteeing reasonable energy prices for companies, (10) pooling EU’s negotiating power towards energy providers, (11) developing renewable energy. The dependent variables demonstrate whether the individual respondents mentioned (coded as 1) or not mentioned (coded as 0) the relevant category as a European Energy Union top priority.
The research comprises a wide spectrum of the following explanatory variables:
  • Perceiving the environment, climate and energy as the most important issues facing individual respondent—based on the question QA4a: “And personally, what are the two most important issues you are facing at the moment?” (Max. 2 answers from 15 categories were possible, and “the environment, climate and energy” was one of them.)
  • Perceiving the environment, climate and energy as the most important issues facing respondent’s country of residence—based on the question QA3a: “What do you think are the two most important issues facing (our country) at the moment?” (Max. 2 answers from 14 categories were possible, and “the environment, climate and energy” was one of them.)
  • Perceiving the environment, energy supply, and climate change as the most important issues facing the EU—based on the question QA5: “What do you think are the two most important issues facing the EU at the moment?” (Max. 2 answers from 13 categories were possible, and “the environment”, “energy supply” and “climate change” were among them.)
  • Support for a common energy policy among EU member states—based on the question QA16: “What is your opinion on each of the following statements? Please tell me for each statement, whether you are for it or against it”. The seventh statement referred to “a common energy policy among EU member states”, and possible answers were “for”, “against”, “DK (Do not know)” and “refusal”.
  • Opinion about the scope of decision-making at a European level in the field of securing energy supply and protecting the environment—based on the question QE1: “For each of the following areas, please tell me if you believe that more decision-making should take place at a European level or on the contrary that less decision-making should take place at a European level”. The fifth analyzed area was “securing energy supply” and the seventh was “protecting the environment”, and possible answers were “more decision-making at a European level”, “less decision-making at a European level”, “no change is needed”, and “refusal”.
  • Political ideology—based on the question D1: “In political matters people talk of ‘the left’ and ‘the right’. How would you place your views on this scale?” The answers could be indicated on a 10-point left-right scale (1—left; 10—right) or it was possible to answer “DK” or “refusal”.
  • Gender—based on the question D10 about respondent’s gender (“man” and “woman” were possible answers).
  • Age—based on the question D11: “How old are you?” The respondents could indicate their age in years. Depending on the obtained answers, for the purposes of this study, respondents were grouped into following age categories: 15–24, 25–34, 35–44, 45–54, 55–64, 65–74 and 75+.
  • Having children less than 10 years old—based on the question D40b: “Could you tell me how many children less than 10 years old live in your household?” The respondents could indicate a relevant number, but for the purposes of this study, they were grouped into two categories: “with children less than 10 years old” or “without children less than 10 years old”.
  • Having children aged 10 to 14 years old—based on the question D40c: “Could you tell me how many children aged 10 to 14 years old live in your household?” The respondents could indicate a relevant number, but for the purposes of this study, they were grouped into two categories: “with children aged 10 to 14 years old” or “without children aged 10 to 14 years old”.
  • Educational level—based on the question D8: “How old were you when you stopped full-time education?” The respondents could indicate a specific age or select the answer “still studying”, “no education”, “DK” or “refusal”. Depending on specific responses, for the purposes of this study, the respondents were grouped into the following education categories: “no full time”, “still studying”, “up to 15”, “16–19”, “20+”.
  • Occupation—based on the question D15a: “What is your current occupation?” The respondents could indicate a specific current occupation. Depending on the obtained answers, for the purposes of this study, respondents were grouped into following occupation categories: “not working” (i.e., responsible for ordinary shopping and looking after the home or without any current occupation, not working, student, unemployed or temporarily not working, retired or unable to work through illness), “manual laborers” (i.e., farmer, fisherman, skilled manual worker, other (unskilled) manual worker, servant), “providing services” (i.e., owner of a shop, craftsmen, salesmen, driver, service job—hospital, restaurant, police, fireman), “office workers” (i.e., department head, junior manager, teacher, technician, employed position, working mainly at a desk), “professionals” (i.e., self-employed professional—lawyer, medical practitioner, accountant, architect, etc.; employed professional—employed doctor, lawyer, accountant, architect), “business people and top-level managers” (i.e., business proprietors, owner of a company, general management, director or top management—managing directors, director general, other director).
  • Place of residence—based on the question D25: “Would you say you live in a…?” The possible answers were “rural area or village”, “small or middle sized town”, “large town” or “DK”.
  • Country—based on the section B of the questionnaire survey. The relevant respondent’s country of residence was appointed by the interviewer.
Primary data from Eurobarometer 91.5 were obtained from the GESIS—Leibniz-Institute for the Social Sciences website [45]. The data collected contained the responses of 32,524 respondents from 34 countries. Due to the fact that the aim of this research was to get to know the public opinion of residents of EU member states, the responses of people from 5 candidate countries, the Turkish Cypriot community and the United Kingdom (which is not an EU member since February 2020), were removed from the survey sample. As a result, the research sample was limited to 26,432 answers provided by people living in twenty-seven EU countries.
The collected data were qualitatively assessed, and it was decided that further analyses would not take into account the answers “I don’t know” (“DK”) and “refusal” given by respondents to any of the analyzed questions. This decision was made due to the fact that the answer “DK” is provided by those respondents who are not entirely sure of the meaning of the question, e.g., [65], or want to avoid thinking and/or getting involved, e.g., [66]. Therefore, so that the answers “DK” do not distort the results of the statistical analysis, they are most often treated as missing data and excluded from the analysis [67]. An overview of the summary statistics of the variables that were included in the statistical analysis conducted in this study is provided in Table 1 and Table 2. It should be noted that the total number of observations is different for many of the variables due to the fact that the number of “DK” or “refusal” responses was different for each question.
Finally, after removing all responses from respondents who answered “DK” or “refusal” to any of the analyzed questions, the size of the research sample was 18,704 observations.

3.3. Analysis of Collected Data

The collected data analysis was started by investigating the structure of objectives to be given the highest priority in the European Union energy policy according to respondents, by country. In particular, the answers obtained from respondents from individual countries of the EU-27 were compared. Based on that, the priorities selected the most and the least often in the member states were defined. Moreover, the mean values and the medians were calculated and the minimum and the maximum percentages of answers given on each priority by respondents in individual EU countries were indicated.
Later on, the collected data were subjected to a regression analysis. Considering the binary character of the dependent variable, where the investigated attitudes towards specific energy priorities of the EU take on the values of “mentioned” or “not mentioned”, the binary logistic regression model was applied [68]. The model is one of the most common tools used for years in the area of social and economic sciences for such variables; it is also the most frequently applied model that takes account of discrete variables with two or more values [69,70,71]. The logistic regression model is also recommended for one more reason—it makes it possible to present results in what is referred to as the Odds Ratio (OR). The general form of the logistic regression model is based on Equation (1):
P   Y = 1 | x 1 , , x i = e β 0 + i = 1 k β i   *   X i 1 + e β 0 + i = 1 k β i   *   X i
where P (Y = 1|x1, …, xi) is conditional probability that variable Y will take on the value of 1 for values of explanatory variables x1, …, xi, Y is the dependent variable, β0i are regression coefficients and xi are explanatory variables.
Appropriate transformation of Equation (1) results in the logit form of the logistic regression model described by Equation (2):
logit   P Y = 1 | x 1 , , x i = β 0 + i = 1 k β i x i
In its logit form and taking account of the variables selected in the analysis, the model used in this study is defined by Equation (3):
logit   P ( DVa = 1 | X ) = β 0 + β b EnvClimEnergyCountryIssue + β c EnvClimEnergyIndividualIssue + β d EnvEUIssue + β e EnergySupEUIssue + β f ClimEUIssue + β g CommonEUEnergyPolicy + h = 1 2 β h DecisionSecEnergySup h + i = 1 2 β i DecisionProtEnv i + β j PolitIdeol + β k Woman + l = 1 6 β l Age l + β m ChildrenUpto 9 yo + β n Children 10 to 14 yo + o = 1 4 β o Education o + p = 1 5 β p Occupation p + q = 1 2 β q Residence q + r = 1 26 β r Country r
where DVa; a = 1,…,11 denotes all relevant dependent variables and | X denotes all relevant explanatory variables (Note: The formula uses the names of the variables characterized in Table 1 and Table 2).
For each category of explanatory variables, a single one referred to as the reference variable was determined; for the others, regression coefficients β , the OR and the OR confidence interval values were calculated. The results of the binary logistic regression analysis made it possible to determine and compare the impact of individual features of respondents on their attitudes towards specific European Energy Union priorities. The method of the model parameters estimation was based on the so-called Maximum Likelihood Technique [72]. The value of regression coefficient β reflects the impact magnitude and its sign denotes the impact direction. The probability of choosing a given objective as the European Energy Union priority increases or decreases depending on whether the value is positive or negative, respectively. According to the assumptions of the logistic regression model, the OR value of reference variables is 1. The other OR values show how many times the chance that a respondent from a given group will choose specific objectives as energy policy priority is higher (if the OR is higher than 1) or lower (if the OR value is lower than 1) compared to a respondent indicating the reference variable.
In order to check the variability of the obtained results, the standard error in regression coefficient β and the resulting confidence interval of the OR value were calculated.
The model was verified using the Hosmer–Lemeshow goodness-of-fit test, which makes it possible to assess how well the model fits the data [73,74].
The final phase of the study included interpretation of obtained results and conclusions.

4. Results and Discussion

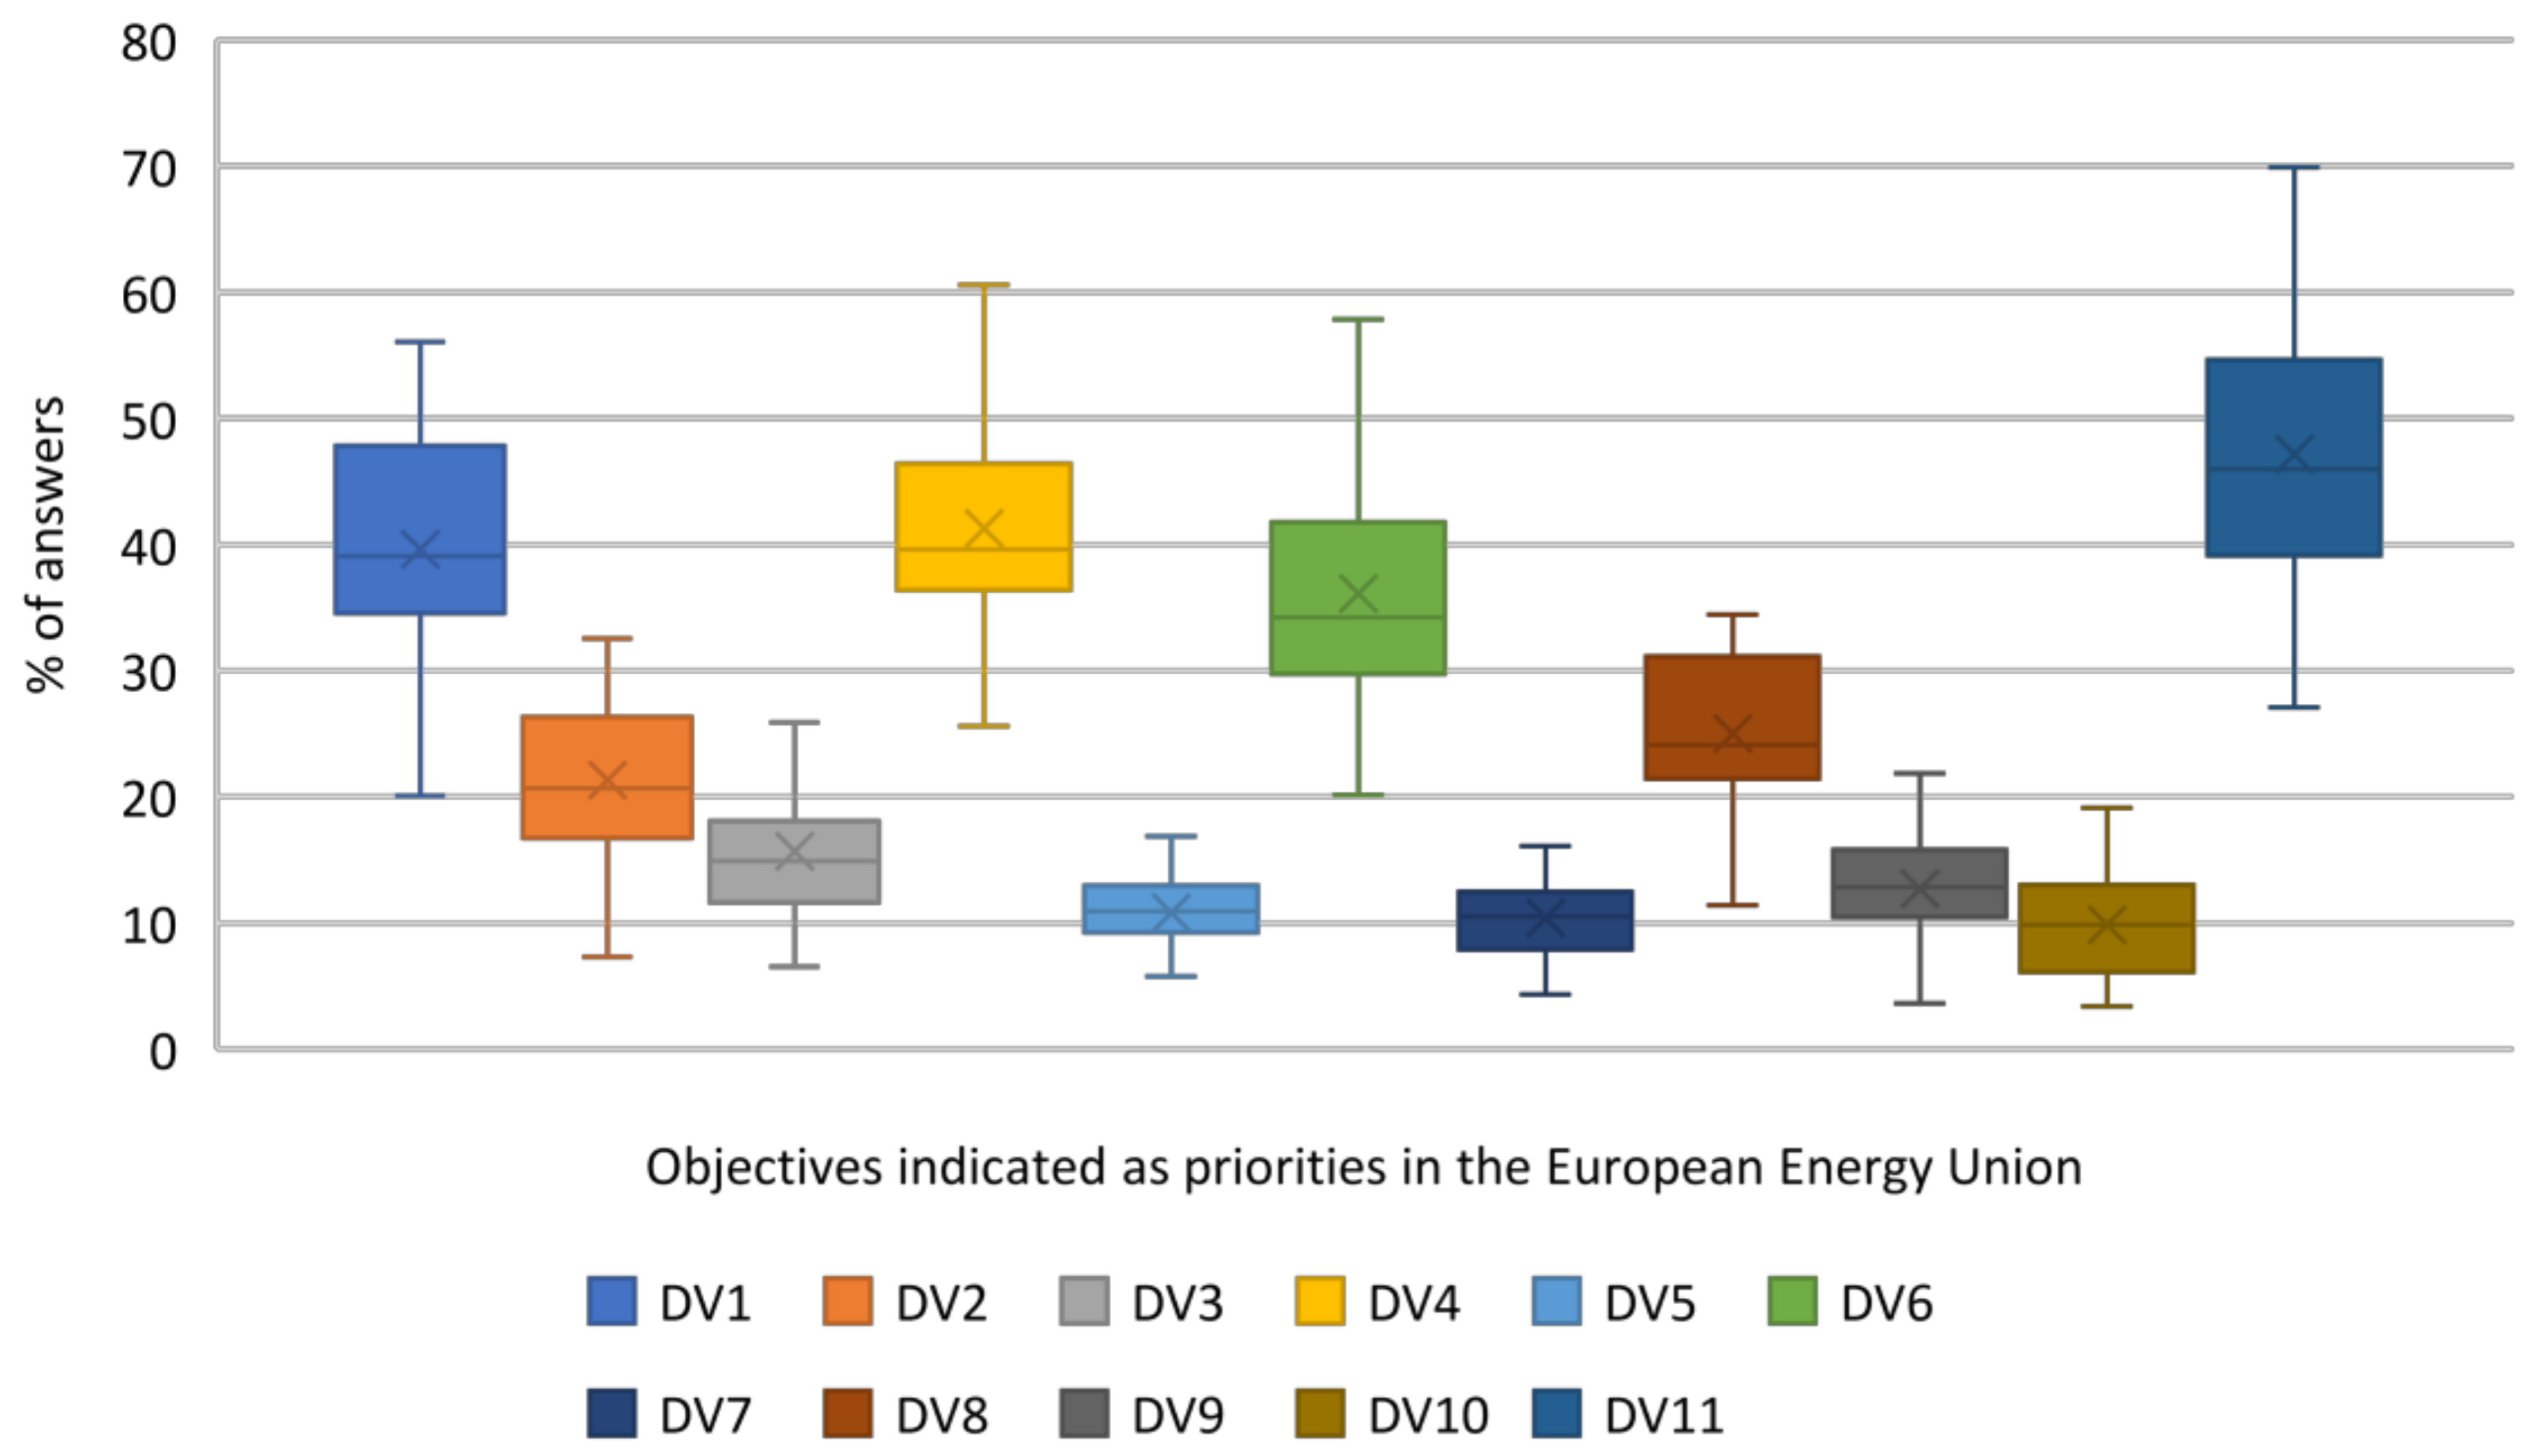
4.1. The European Energy Union Priorities—Comparative Analysis by Country

The analysis of the collected data began with a comparison of the responses given by residents of different EU member states regarding which priorities, according to them, the European Energy Union should focus on in the coming years. Each respondent could choose up to 3 out of 11 priorities mentioned in the questionnaire. The summary of results showing the choices of respondents in individual European Union countries is presented in Table 3. The following colors were used in the Table 3 to mark the following information:
  • Red color—the priority selected by the largest number of respondents in a given country;
  • Blue color—the priority which came second in a given country in terms of the number of respondents who indicated it;
  • Green color—the priority which came third in a given country in terms of the number of respondents who indicated it;
  • Brown color—the least frequently chosen priority in a given country.
The data presented in Table 3 show that respondents in all twenty-seven EU countries indicated developing renewable energy as an objective which should be given top priority in a European Energy Union. It is the most frequently mentioned priority in 17 EU countries, it ranks second in 3 EU countries in terms of the number of respondents who chose it and it ranks third in 7 EU countries. This priority is most often mentioned by the inhabitants of the Scandinavian countries—in Sweden, 69.9% of respondents chose it, in Finland, 66.01% and in Denmark, 64.12%. The second most frequently indicated objective which should be a priority in the European Energy Union is protecting the environment. It is at the top of the priority list in 5 countries, it takes second place in 10 countries and it is third in 6 countries. This priority achieved the highest score in Malta, where 64.71% of the inhabitants chose it in first place, and in Cyprus, where it was chosen by 60.58% of the inhabitants. As for the third objective which should be given the highest priority in the European Energy Union, the respondents mentioned guaranteeing reasonable energy prices for customers. This priority turned out to be the most important for respondents in five countries: Bulgaria (51.36% of respondents), Estonia (54.58% of respondents), Lithuania (40.13% of respondents), Latvia (56.05% of respondents) and Slovakia (39.09% of respondents). In all these countries, it is at the top of the priority ranking. The objective fighting global warming ranks fourth on the priority list. It does not rank first in any of the EU countries, but came second in three countries and third in nine countries.
The least frequently chosen priority is the objective pooling EU’s negotiating power towards energy providers. This priority received the lowest response rate in 11 countries. The second least frequently indicated priority is interconnecting energy infrastructure, which came last in six countries.
A comparison of the distributions between all of 11 objectives indicated by all respondents from twenty-seven EU countries as the priorities of the European Energy Union is presented in Figure 2. It should be noted that these priorities are the dependent variables in this study.

4.2. Binary Logistic Regression Results Analysis

The next stage was to subject the collected data to a regression analysis enabling determination and comparison of the impact of the respondents’ opinions and features on their attitudes towards the European Energy Union priorities. The analysis results (values of the regression coefficient, the OR and the CI) are listed in Table 4.
The obtained results showed that the perception of the environment, climate and energy as the most important issues facing individual respondents had, to some extent, a significant effect on their attitudes towards the EU’s energy priorities. The respondents who indicated these issues as the most important at the individual level showed a tendency to support fighting global warming (OR = 1.24) and protecting the environment (OR = 1.20) as energy policy priorities. However, they were less likely to accept guaranteeing reasonable energy prices for customers (OR = 0.76) and for companies (OR = 0.84) as priorities. These findings proved that the perceived importance of environmental sustainability and climate protection at the individual level are pivotal determinants for a strong support of these issues as energy policy priorities [54,56,59]. Moreover, the obtained results suggested that respondents with stronger environmental values are less interested in guaranteeing reasonable energy prices for customers and companies, which is in line with another study on energy price discrimination policies [21].
The perception of the environment, climate and energy as the most important issues at the country level had a significant and positive effect on the acceptance of fighting global warming (OR = 1.47), developing renewable energy (OR = 1.23), protecting the environment (OR = 1.16) and pooling the EU’s negotiating power towards energy providers (OR = 1.16) as energy policy priorities. Nevertheless, individuals who indicated these issues as the most important aspects facing their country were not very willing to support guaranteeing reasonable energy prices for companies (OR = 0.69), reasonable energy prices for customers (OR = 0.76), a continuous energy supply (OR = 0.78) and guaranteeing the competitiveness of the EU’s industry (OR = 0.79). The analysis results confirmed that the opinion on environmental issues at the country level affects attitudes towards the energy policy [35]. In particular, this concerns the support for green energy policy objectives [56] and less interest in energy prices for companies and customers [58], or the competitiveness of industry.
Considering the perception of the environment as the most important issue facing the EU, the results revealed that it had a significant and positive effect on the acceptance of protecting the environment (OR = 1.56), fighting global warming (OR = 1.32), reduction of energy consumption (OR = 1.14) and developing renewable energy (OR = 1.10). By contrast, it had a negative influence on supporting such energy policy priorities as guaranteeing reasonable energy prices for customers (OR = 0.69) and prices for companies (OR = 0.75) or guaranteeing a continuous energy supply (OR = 0.75). Perceiving the energy supply as the most important issue facing the EU increased the acceptance of interconnecting the energy infrastructure (OR = 1.44), pooling the EU’s negotiating power towards energy providers (OR = 1.29) and the EU’s energy independence (OR = 1.24) as the European Energy Union priorities. Furthermore, it decreased the support for guaranteeing reasonable energy prices for customers (OR = 0.71) and protecting the environment (OR = 0.73). By contrast, the perception of climate change as the most important issue facing the EU was positively related to supporting the fight against global warming (OR = 1.99), protecting the environment (OR = 1.40) and developing renewable energy (OR = 1.16). Yet, it decreased the acceptance of guaranteeing the competitiveness of the EU’s industry (OR = 0.72), a continuous supply of energy (OR = 0.73), reasonable energy prices for companies (OR = 0.75) and prices for customers (OR = 0.77), as well as pooling the EU’s negotiating power towards energy providers (OR = 0.77), the EU’s energy independence (OR = 0.81) and interconnecting the energy infrastructure (OR = 0.87) as energy policy priorities.
In general, the findings concerning the perception of the environment, climate change and energy supply as the most important issues facing the EU and the likelihood of support for different energy policy priorities are in line with a previous study performed by Tosun and Mišić [44].
Respondents who supported a common energy policy among the EU member states were more likely to point to the need for developing renewable energy (OR = 1.35), interconnection of the energy infrastructures (OR = 1.35), fighting global warming (OR = 1.26) and protecting the environment (OR = 1.11) as energy policy priorities. Yet, they were less likely to include in those priorities guaranteeing reasonable energy prices for companies (OR = 0.79) and prices for customers (OR = 0.91). Therefore, this research has shown that the respondents supporting a common European energy policy focused primarily on green energy priorities, while guaranteeing low energy prices for companies and consumers seemed to be for them less important issue.
The analysis results showed relatively few statistically important relationships between the respondents’ declared opinion about the scope of decision-making at the European level in the field of securing the energy supply and their tendency to choose specific priorities of the EU’s energy policy. It turns out that respondents who expect that more decision-making is needed in this respect exhibited a greater tendency to indicate guaranteeing a reasonable energy price for companies (OR = 1.54) as an energy policy priority, whereas reducing energy consumption (OR = 0.63) attracted less attention on their part. Respondents who expect that less decision-making is necessary exhibited a greater tendency to indicate guaranteeing a reasonable energy price for companies (OR = 1.50) as an energy policy priority; they were less likely to choose reducing energy consumption (OR = 0.66) as a priority. It was remarkable that respondents who expect both more and less decision-making at the European level in the field of securing the energy supply have similar preferences concerning the EU’s energy priorities. This may mean that some of them expect taking up or withdrawing from certain actions at the level of the EU, whereas others have similar expectations, but at the country level.
The obtained results also show that respondents who expect more decision-making at the European level in the field of protecting the environment had a relatively greater tendency to indicate as the EU’s energy priorities the reduction of energy consumption (OR = 1.67) and protecting the environment (OR = 1.53) and were less likely to choose interconnecting the energy infrastructure (OR = 0.57), guaranteeing reasonable energy prices for companies (OR = 0.67) or a continuous supply of energy (OR = 0.70). Those expecting less decision-making were more willing to choose the reduction of energy consumption (OR = 1.40) and less likely to opt for the fight against global warming (OR = 0.70) as an energy policy priority. It was also remarkable that the reduction of energy consumption was indicated as an energy policy priority by respondents expecting both more and less decision-making at the European level in the field of environmental protection. However, this may mean that the first group expects more extensive actions in this respect at the EU level, whereas the other group may expect such activities at the country level.
The analysis results showed that political ideology had a complex and significant effect on the Europeans’ attitudes towards the EU energy priorities. It was indicated that respondents with a right-wing orientation were more likely to support guaranteeing the competitiveness of the EU’s industry (OR = 1.07), the EU’s energy independence (OR = 1.04), a continuous supply of energy (OR = 1.03) and reasonable energy prices for customers (OR = 1.02), as well as interconnecting the energy infrastructure (OR = 1.03). By contrast, individuals with a left-wing political orientation had a tendency to support such priorities as protecting the environment (OR = 0.97), reducing energy consumption (OR = 0.98) and developing renewable energy (OR = 0.98). These findings are in line with previous studies suggesting that individuals with leftist ideology are interested in green and progressive energy policy priorities [52,56]. Moreover, our results confirmed that respondents with a right-wing orientation tend to accept the security dimension of the European Energy Union priorities [44].
The research also demonstrated that gender is a strong predictor of attitudes towards energy policy priorities. It was found that women were more likely than men to point to environmental protection (OR = 1.30) and guaranteeing reasonable energy prices for customers (OR = 1.09), but at the same time, they were less likely to prioritize interconnecting the energy infrastructure (OR = 0.72), guaranteeing the competitiveness of the EU’s industry (OR = 0.73), the EU’s independence in the field of energy (OR = 0.78), a continuous supply of energy (OR = 0.85) and pooling the EU’s negotiating power towards energy providers (OR = 0.90). In general, it is unsurprising that women were more likely to indicate environmental protection as the energy policy priority [43], but they also were more willing to support guaranteeing reasonable energy prices for customers. Yet, women were less likely to prioritize energy security and energy independence [44] or industry competitiveness. It is, to some extent, in contrast to previous studies, according to which women expressed a greater concern for energy security compared to men [39].
Age was a predictor in very few cases only. Respondents at the age of 75 and older exhibited a greater tendency to choose guaranteeing a continuous supply of energy (OR = 1.49) as an energy policy priority. This confirmed that older people were more likely to prioritize energy security [39,43,44]. At the same time, older respondents turned out to be less likely to choose fighting global warming (OR = 0.76). Yet, the youngest respondents (15–24 years old) showed a preference for protecting the environment as a priority. This confirmed that young individuals (15–24 years old) are more likely to support green energy policy [21,52] and environmental protection [43]. However, it is in contrast to findings from other studies suggesting that older people are more environmentally concerned [61].
Having children was not found to be an important predictor of the choice of the European Energy Union priorities. In this case, there was only one significant relationship which concerned parents of children older than 9. Such respondents exhibited a greater tendency to choose guaranteeing a continuous supply of energy (OR = 1.49) as a priority. This was the finding of a previous study by Balta-Ozkan with regard to supporting the national energy policy priority [43]. However, there was no statistically essential relationship between the answers of respondents having children at the age of up to 9 and their choices in the scope under analysis.
Educational level seemed to be a relatively weak predictor. The analysis results showed that those still studying were more willing to choose the development of renewable energy (OR = 1.84), but less so when it came to guaranteeing reasonable energy prices for customers (OR = 0.54). By contrast, the group of respondents with the longest educational history (20+) was eager to choose developing renewable energy (OR = 1.75). A higher educational level was also previously found to be positively related to higher support for green energy policy instruments [52]. Moreover, former research demonstrated that as years of education decreased, guaranteeing reasonable energy prices for consumers became less likely to be selected as a national energy policy priority [43]. However, another study suggested that highly educated people tended to adopt renewable energy sources [32].
The results demonstrated that occupation was an important predictor. The group consisting of business people and top-level managers was more likely to choose guaranteeing reasonable energy prices for companies (OR = 1.77), interconnecting the energy infrastructure (OR = 1.51) and guaranteeing the EU’s independence in the field of energy (OR = 1.48) as energy policy priorities. It should be emphasized, however, that this group was unlikely to prioritize guaranteeing reasonable energy prices for customers (OR = 0.67), protecting the environment (OR = 0.75) or guaranteeing a continuous supply of energy (OR = 0.76). For office workers, the most common energy union priorities were interconnecting the energy infrastructure (OR = 1.27), guaranteeing the EU’s independence in the field of energy (OR = 1.24), reducing energy consumption (OR = 1.24) and developing renewable energy (OR = 1.13). By contrast, they were less likely to support guaranteeing reasonable energy prices for customers (OR = 0.72). Service providers showed a preference for interconnecting the energy infrastructure (OR = 1.32), reducing energy consumption (OR = 1.20) and guaranteeing the EU’s independence in the field of energy (OR = 1.17); they were less likely to opt for guaranteeing reasonable energy prices for customers (OR = 0.81) as a priority. Professionals were observed to choose guaranteeing the EU’s independence in the field of energy (OR = 1.51), interconnecting the energy infrastructure (OR = 1.49) and guaranteeing the competitiveness of the EU’s industry (1.41), but they were not interested in reasonable energy prices for customers (OR = 0.64). It was remarkable that business people and top-level managers, who probably belong to the wealthiest individuals, do not consider environmental protection as a priority. This seems to be in line with the results of previous research showing that wealthier households are less concerned about environmental problems [61]. On the other hand, it should not come as a surprise that they are more interested in guaranteeing reasonable energy prices for companies and care much less for low energy prices for customers.
The place of residence turned out to be an equally important predictor. Large-city dwellers were more likely to choose pooling the EU’s negotiating power towards energy providers (OR = 1.20), guaranteeing the competitiveness of the EU’s industry (OR = 1.19), independence in the field of energy (OR = 1.18), fighting global warming (OR = 1.12) and protecting the environment (OR = 1.10) as priorities, whereas they showed a much smaller preference in this respect for guaranteeing reasonable energy prices for customers (OR = 0.82) or developing renewable energy (OR = 0.91). Residents of small and middle-sized towns more often pointed to protecting the environment (OR = 1.11) and more seldom—to guaranteeing reasonable energy prices for customers (OR = 0.89), developing renewable energy (OR = 0.90) or reducing energy consumption (OR = 0.92) as the EU’s energy priority. This, to some extent, confirms the findings of a previous study on the national energy policy priority [43]. However, what stands out from our research is that households in rural and small urban areas tended more to support guaranteeing reasonable energy prices for consumers and expressed a preference for developing renewable energy.
The country of origin emerged as a very important predictor. The analysis revealed a number of statistically essential differences in the tendencies exhibited by residents of different countries to select specific priorities of the EU’s energy policy. Guaranteeing reasonable energy prices for customers was most often chosen as a priority by respondents living in Estonia (OR = 2.03), Latvia (OR = 1.99), Belgium (OR = 1.68) and Bulgaria (OR = 1.68). The residents of Denmark (OR = 0.56), Sweden (OR = 0.58) and Italy (OR = 0.66) were the least likely to select this objective. Respondents from France (OR = 0.18) and Luxembourg (OR = 0.32) showed the slightest preference for guaranteeing a continuous supply of energy as an energy policy priority. The residents of Cyprus (OR = 0.24), Malta (OR = 0.32) and Spain (OR = 0.35) were the least willing to opt for guaranteeing the EU’s independence in the field of energy. Protecting the environment was an important priority for those living in Cyprus (OR = 2.91), Malta (OR = 2.71) and France (OR = 1.94). The residents of Bulgaria (OR = 0.68) were the least likely to select this objective. The residents of Croatia (OR = 1.58) and the Netherlands (OR = 1.57) were the most likely to choose interconnecting the energy infrastructure as an energy policy priority of the EU, and the residents of Finland (OR = 0.29) and Malta (OR = 0.53) were the least likely. Fighting global warming was most often selected by the residents of Sweden (OR = 2.21), France (OR = 2.15), Denmark (OR = 1.93) and Finland (OR = 1.93); Estonians were at the other end of the scale (OR = 0.65). Those living in Finland (OR = 1.49), the Czech Republic (OR = 1.49) and Italy (OR = 1.48) were the most willing to opt for guaranteeing the competitiveness of the EU’s industry as an energy policy priority. This option was selected the least often by the residents of Cyprus (OR = 0.37), the Netherlands (OR = 0.58) and Slovenia. Reducing energy consumption was most often selected by Austrians (OR = 1.00), whereas in Estonia (OR = 0.27), Portugal (OR = 0.29) and Bulgaria (OR = 0.31), this option was chosen the most seldom. Latvians (OR = 1.58) and Bulgarians (OR = 1.47) were the most likely to choose guaranteeing reasonable energy prices for companies as a priority, whereas in the Netherlands (OR = 0.27) and Denmark (OR = 0.40), that was the least frequent choice. The residents of Romania had the strongest preference (OR = 1.58) for pooling the EU’s negotiating power towards energy providers as an energy policy priority of the EU; this objective was the least frequently selected in Finland (OR = 0.23), Malta (OR = 0.26), Slovenia (OR = 0.32), Sweden and Latvia (both OR = 0.36). Finally, developing renewable energy was most willingly selected by the residents of Sweden (OR = 2.28), Finland (OR = 2.22), Denmark (OR = 1.80) and Portugal (OR = 1.72), whereas in Bulgaria (OR = 0.48), Slovenia (OR = 0.57), Czechia (OR = 0.64), Lithuania (OR = 0.66) and Latvia (OR = 0.66) that was the least frequent choice.

5. Conclusions

Energy is the driving force of the economy and therefore the European Energy Union is one of the key strategies of the EU. The policy must be ambitious, competitive and long-term, as well as reasonable and beneficial to all member states. In recent years, the EU has adopted many ambitious goals in the field of climate and energy policy, the achievement of which will require significant efforts from the governments of the EU countries. It also seems necessary to increase the involvement of EU citizens, otherwise, not all objectives will be achieved.
While setting energy policy priorities, it should be remembered that the degree of citizens’ involvement in the implementation of individual measures depends on their inclusion in the decision-making process. The more citizens feel that their opinion counts in the decision-making process, the more willingly they will become involved in the implementation of activities enabling the achievement of energy policy objectives. For this reason, it seems important to get to know the public’s opinion on the activities that should be prioritized in the field of energy policy both at the level of the entire EU and the member states. This knowledge is all the more important considering that, according to the 2018 Regulation of the European Parliament and of the Council on the Governance of the Energy Union, the member states were obliged to develop integrated national energy and climate plans by the end of 2019, showing how the country was going to meet its energy and climate targets regarding all five dimensions of the European Energy Union in 2021–2030 [75]. These plans will have to be updated in draft by June 2023, with a final version expected by June 2024.
Due to the fact that the implementation of the European Energy Union may proceed in different ways in each country, it is important to indicate what determinants affect people’s attitudes towards energy issues. In this way, knowing the factors influencing the acceptance of specific energy policy priorities by EU citizens, the governments of EU member states will be able to target appropriate information and education campaigns in the field of energy policy focused on a given social group, depending on, e.g., gender, age, occupation or the place of residence. This should enable a more effective implementation of the set climate and energy goals.
This research has confirmed some findings of previous studies. However, it has also provided new results and interesting insights into the existing literature. The analysis results demonstrated that the support for specific European Energy Union priorities varies significantly depending on the different perception of Europeans and is affected by a number of demographic variables.
It was indicated that perceiving the environment, climate and energy as the most important issues from the perspective of an individual, a country and the EU significantly affects the attitudes towards the European Energy Union priorities. However, this mostly concerns the awareness of the importance of these issues at the EU level. It is unsurprising that considering environmental problems as the most important issues facing the EU was found as a strong predictor of support for protecting the environment as a priority, and the importance given to climate change resulted in prioritizing the fight against global warming. However, it is worth noting that the respondents perceiving the environment, climate and energy as the most important issues at the individual, national and European level were by far the least likely to accept guaranteeing reasonable energy prices for customers as a priority of the EU’s energy policy. Respondents who supported a common energy policy among the EU member states were more likely to point to green energy priorities (e.g., developing renewable energy, fighting global warming, protecting the environment), while guaranteeing low energy prices for companies and consumers seemed to be for them a less important issue. It was remarkable that the reduction of energy consumption was indicated as an energy policy priority by respondents expecting both more and less decision-making at the European level in the field of environmental protection. However, this may mean that the first group expects more extensive actions in this respect at the EU level, whereas the other group may expect such activities at the country level. The analysis results proved that political ideology has a complex and significant effect on the Europeans’ attitudes towards priorities of the EU’s energy policy. It was revealed that respondents with a right-wing orientation were the most likely to support guaranteeing the competitiveness of the EU’s industry, while individuals with leftist ideology showed the strongest tendency to opt for environmental protection. Gender was found to be a strong predictor of attitudes towards energy policy priorities. It is worth noting that women were more likely than men to point to environmental protection and guaranteeing reasonable energy prices for customers as the EU’s energy priorities. Age was a predictor in very few cases only. Older respondents exhibited a greater tendency to choose guaranteeing a continuous supply of energy as a priority of the EU’s energy policy, but they turned out to be less likely to choose fighting global warming. Furthermore, the youngest respondents showed a preference for environmental protection as an energy priority. Education proved to be a relatively weak predictor. The analysis results showed that those still studying were more willing to choose developing renewable energy, but less so when it came to guaranteeing reasonable energy prices for customers. By contrast, the group of respondents with the longest educational history (20+) was eager to prioritize developing renewable energy. Considering occupation as a predictor, the most interesting results seem to be those obtained for the group of business people and top-level managers, who were most likely to choose guaranteeing reasonable energy prices for companies as the EU’s energy policy priority. However, this group was unlikely to prioritize guaranteeing reasonable energy prices for customers and protecting the environment. Large-city dwellers were more likely to prioritize pooling the EU’s negotiating power towards energy providers, guaranteeing the competitiveness of the EU’s industry, independence in the field of energy, fighting global warming and protecting the environment as priorities, whereas they showed a much smaller preference in this respect for guaranteeing reasonable energy prices for customers or developing renewable energy. By contrast, households in rural and small urban areas tend more to support guaranteeing reasonable energy prices for consumers and express a preference for developing renewable energy. Moreover, the country of origin emerged as a very important predictor of attitudes towards priorities of the EU’s energy policy. For example, guaranteeing reasonable energy prices for customers was most often chosen as a priority by respondents living in Estonia and Latvia. The residents of Cyprus, Malta and Spain were the least willing to opt for guaranteeing the EU’s independence in the field of energy. Protecting the environment was an important priority for those living in Cyprus and Malta. Fighting global warming was most often selected by the residents of Sweden, France, Denmark and Finland. Those living in Finland, the Czech Republic and Italy were the most willing to opt for guaranteeing the competitiveness of the EU’s industry as an energy policy priority. Latvians and Bulgarians) were the most likely to choose guaranteeing reasonable energy prices for companies as a priority. Finally, developing renewable energy was most willingly selected by the residents of Sweden and Finland.
This research, like other studies, has some limitations. Yet, these limitations create potential opportunities for interesting future research. The analysis was conducted using a large sample of data obtained from individuals representing twenty-seven EU countries. However, its still-limited geographical scope does not allow generalization of the findings to other regions of the world. The analysis was based on subjective self-reported data. Therefore, there is a potential risk that the answers might have been affected by social desirability. On the other hand, considering the standardized procedure and format of the used Eurobarometer questionnaire, this probably was not the case. It should be noted that most of the obtained data were available as categorical variables, in particular, binary ones (recorded as yes/no responses). This limits variability in the analyzed models. Therefore, future research using continuous variables would be of interest to enrich a similar analysis. Moreover, the presented research was based on data available in the Eurobarometer survey. This means that it could not capture some of the variables, which made it impossible for us to perform an in-depth analysis. Additional information would have extended the research results, but the data availability might have been a challenge. Nevertheless, future studies might apply the proposed model when considering other potential determinants of attitudes towards the energy policy. It must be also noted that the analysis was based on cross-sectional data. Panel data gained from individuals in each EU country (i.e., with samples kept permanent over time) would make it possible to test and determine causal relations between the analyzed variables.
Despite the above-mentioned limitations, it must be emphasized that the authors of this article have put in a great deal of effort to make it as comprehensive as possible and in the most accurate manner. We believe that the paper will be an important contribution to the identification of factors determining the Europeans’ attitude towards the priorities on which the energy policy should focus in the coming years.

Author Contributions

Conceptualization, A.J. and A.R.; methodology, A.J., A.R. and M.S.; formal analysis, M.S.; investigation, A.J., A.R. and M.S.; writing—original draft preparation, A.J., A.R. and M.S.; writing—review and editing, A.J. and A.R.; visualization, A.J., A.R. and M.S. All authors have read and agreed to the published version of the manuscript.

Funding

The research presented in the article was supported by statutory work 13/030/BK_21/0065 carried out at the Department of Production Engineering, Faculty of Organization and Management, Silesian University of Technology.

Institutional Review Board Statement

Not applicable.

Informed Consent Statement

Not applicable.

Data Availability Statement

All data retrieved from GESIS Data Archive: https://search.gesis.org/research_data/ZA7576 (accessed on 7 April 2021).

Conflicts of Interest

The authors declare no conflict of interest.

References

  1. European Commission. Report from the Commission. Fourth Biennial Report from the European Union Required under the United Nations Framework Convention on Climate Change; C/2019/8832; European Commission: Brussels, Belgium, 2019. [Google Scholar]
  2. Commission of the European Communities. Communication from the Commission to the European Parliament, the Council, the European Economic and Social Committee and the Committee of the Regions. Europe’s Climate Change Opportunity; COM/2008/30 final; European Commission: Brussels, Belgium, 2008. [Google Scholar]
  3. European Commission. Communication from the Commission to the European Parliament, the Council, the European Economic and Social Committee and the Committee of the Regions. A Policy Framework for Climate and Energy in the Period from 2020 to 2030; COM/2014/15 final; European Commission: Brussels, Belgium, 2014. [Google Scholar]
  4. European Commission. Communication from the Commission to the European Parliament, the Council, the European Economic and Social Committee, the Committee of the Regions and the European Investment Bank. A Framework Strategy for a Resilient Energy Union with a Forward-Looking Climate Change Policy; COM/2015/80 final; European Commission: Brussels, Belgium, 2015. [Google Scholar]
  5. European Commission. Communication from the Commission to the European Parliament, the Council, the European Economic and Social Committee, the Committee of the Regions and the European Investment Bank. Clean Energy for All Europeans; COM/2016/860 final; European Commission: Brussels, Belgium, 2016. [Google Scholar]
  6. European Commission. Communication from the Commission to the European Parliament, the European Council, the Council, the European Economic and Social Committee, the Committee of the Regions and the European Investment Bank. A Clean Planet for All. A European Strategic Long-Term Vision for a Prosperous, Modern, Competitive and Climate Neutral Economy; COM/2018/773 final; European Commission: Brussels, Belgium, 2018. [Google Scholar]
  7. European Commission. Proposal for a Regulation of the European Parliament and of the Council Establishing the Framework for Achieving Climate Neutrality and Amending Regulation (EU) 2018/1999 (European Climate Law); COM/2020/80 final; European Commission: Brussels, Belgium, 2020. [Google Scholar]
  8. European Commission. Communication from the Commission to the European Parliament, the Council, the European Economic and Social Committee and the Committee of the Regions. Stepping Up Europe’s 2030 Climate Ambition Investing in a Climate-Neutral Future for the Benefit of Our People; COM/2020/562 final; European Commission: Brussels, Belgium, 2020. [Google Scholar]
  9. Eurostat Database. Greenhouse Gas Emissions by Source Sector. Available online: https://appsso.eurostat.ec.europa.eu/nui/show.do?dataset=env_air_gge&lang=en (accessed on 4 June 2021).
  10. Eurostat Database. Share of Energy from Renewable Sources. Available online: https://appsso.eurostat.ec.europa.eu/nui/show.do?dataset=nrg_ind_ren&lang=en (accessed on 4 June 2021).
  11. Eurostat Database. Energy Efficiency. Available online: https://appsso.eurostat.ec.europa.eu/nui/show.do?dataset=nrg_ind_eff&lang=en (accessed on 4 June 2021).
  12. European Commission. Report from the Commission to the European Parliament, the Council, the European Economic and Social Committee and the Committee of the Regions. 2020 Report on the State of the Energy Union Pursuant to Regulation (EU) 2018/1999 on Governance of the Energy Union and Climate Action; COM/2020/950 final; European Commission: Brussels, Belgium, 2020. [Google Scholar]
  13. Jonek-Kowalska, I. Transformation of energy balances with dominant coal consumption in European economies and Turkey in the years 1990–2017. Oeconomia Copernic. 2019, 10, 627–647. [Google Scholar] [CrossRef] [Green Version]
  14. Huijts, N.M.; Molin, E.J.; Steg, L. Psychological factors influencing sustainable energy technology acceptance: A review-based comprehensive framework. Renew. Sustain. Energy Rev. 2012, 16, 525–531. [Google Scholar] [CrossRef]
  15. Perlaviciute, G.; Steg, L. Contextual and psychological factors shaping evaluations and acceptability of energy alternatives: Integrated review and research agenda. Renew. Sustain. Energy Rev. 2014, 35, 361–381. [Google Scholar] [CrossRef]
  16. Mouro, C.; Castro, P.; Kronberger, N.; Duarte, P. Multilevel approach to energy options across EU: The role of supra-national governance, values and trust. Int. Rev. Soc. Psychol. 2013, 26, pp. 73–95. Available online: https://www.cairn.info/revue-internationale-de-psychologie-sociale-2013-3-page-73.htm (accessed on 10 May 2021).
  17. West, J.; Bailey, I.; Winter, M. Renewable energy policy and public perceptions of renewable energy: A cultural theory approach. Energy Policy 2012, 38, 5739–5748. [Google Scholar] [CrossRef]
  18. Wang, J.; Kim, S. Comparative Analysis of Public Attitudes toward Nuclear Power Energy across 27 European Countries by Applying the Multilevel Model. Sustainability 2018, 10, 1518. [Google Scholar] [CrossRef] [Green Version]
  19. Poortinga, W.; Aoyagi, M.; Pidgeon, N.F. Public perceptions of climate change and energy futures before and after the Fukushima accident: A comparison between Britain and Japan. Energy Policy 2013, 62, 1204–1211. [Google Scholar] [CrossRef]
  20. Park, E.; Ohm, J.Y. Factors influencing the public intention to use renewable energy technologies in South Korea: Effects of the Fukushima nuclear accident. Energy Policy 2014, 65, 198–211. [Google Scholar] [CrossRef]
  21. Allen Wolters, E.; Steel, B.S.; Warner, R.L. Ideology and Value Determinants of Public Support for Energy Policies in the U.S.: A Focus on Western States. Energies 2020, 13, 1890. [Google Scholar] [CrossRef]
  22. Batel, S.; Devine-Wright, P. Populism, identities and responses to energy infrastructures at different scales in the United Kingdom: A post-Brexit reflection. Energy Res. Soc. Sci. 2018, 43, 41–47. [Google Scholar] [CrossRef]
  23. Bolsen, T.; Cook, F. The Polls—Trends Public Opinion on Energy Policy: 1974–2006. Public Opin. Q. 2008, 72, 364–388. [Google Scholar] [CrossRef]
  24. Bergquist, P.; Konisky, D.M.; Kotcher, J. Energy policy and public opinion: Patterns, trends and future directions. Prog. Energy 2020, 2, 032003. [Google Scholar] [CrossRef]
  25. Costa-Font, J.; Rudisill, C.; Mossialos, E. Attitudes as an Expression of Knowledge and “Political Anchoring”: The Case of Nuclear Power in the United Kingdom. Risk Anal. 2008, 28, 1273–1287. [Google Scholar] [CrossRef] [PubMed]
  26. Karytsas, S.; Theodoropoulou, H. Socioeconomic and demographic factors that influence publics’ awareness on the different forms of renewable energy sources. Renew. Energy 2014, 71, 480–485. [Google Scholar] [CrossRef]
  27. Koecklin, M.; Longoria, G.; Fitiwi, D.; DeCarolis, J.; Curtis, J. Public acceptance of renewable electricity generation and transmission network developments: Insights from Ireland. Energy Policy 2021, 151, 112185. [Google Scholar] [CrossRef]
  28. Lee, D.; Kim, M.; Lee, J. Adoption of green electricity policies: Investigating the role of environmental attitudes via big data-driven search-queries. Energy Policy 2016, 90, 187–201. [Google Scholar] [CrossRef]
  29. Liebe, U.; Dobers, G.M. Decomposing public support for energy policy: What drives acceptance of and intentions to protest against renewable energy expansion in Germany? Energy Res. Soc. Sci. 2019, 47, 247–260. [Google Scholar] [CrossRef] [Green Version]
  30. Manley, D.K.; Hines, V.; Jordan, M.W.; Stoltz, R. A survey of energy policy priorities in the United States: Energy supply security, economics, and the environment. Energy Policy 2013, 60, 687–696. [Google Scholar] [CrossRef]
  31. Sardianou, E. Estimating energy conservation patterns of Greek households. Energy Policy 2007, 35, 3778–3791. [Google Scholar] [CrossRef]
  32. Sardianou, E.; Genoudi, P. Which factors affect the willingness of consumers to adopt renewable energies? Renew. Energy 2013, 57, 1–4. [Google Scholar] [CrossRef]
  33. Szakály, Z.; Balogh, P.; Kontor, E.; Gabnai, Z.; Bai, A. Attitude toward and Awareness of Renewable Energy Sources: Hungarian Experience and Special Features. Energies 2021, 14, 22. [Google Scholar] [CrossRef]
  34. Uba, K. Who formulates renewable-energy policy? A Swedish example. Energy Policy 2010, 38, 6674–6683. [Google Scholar] [CrossRef]
  35. Anderson, B.; Böhmelt, T.; Ward, H. Public opinion and environmental policy output: A cross-national analysis of energy policies in Europe. Environ. Res. Lett. 2017, 12, 114011. [Google Scholar] [CrossRef]
  36. Batel, S.; Devine-Wright, P. Towards a better understanding of people’s responses to renewable energy technologies: Insights from Social Representations Theory. Public Underst. Sci. 2015, 24, 311–325. [Google Scholar] [CrossRef] [Green Version]
  37. Contu, D.; Mourato, S.; Kaya, O. Individual preferences towards nuclear energy: The transient residency effect. Appl. Econ. 2020, 52, 3219–3237. [Google Scholar] [CrossRef]
  38. Corner, A.; Venables, D.; Spence, A.; Poortinga, W.; Demski, C.; Pidgeon, N. Nuclear power, climate change and energy security: Exploring British public attitudes. Energy Policy 2011, 39, 4823–4833. [Google Scholar] [CrossRef]
  39. Knox-Hayes, J.; Brown, M.A.; Sovacool, B.K.; Wang, Y. Understanding attitudes toward energy security: Results of a cross-national survey. Glob. Environ. Chang. 2013, 23, 609–622. [Google Scholar] [CrossRef]
  40. Smith, H.; Gilbert, C. Communication Barriers and Lessons Learned in Energy Policy. Sustainability 2018, 10, 449. [Google Scholar] [CrossRef] [Green Version]
  41. Stoutenborough, J.W.; Sturgess, S.G.; Vedlitz, A. Knowledge, risk, and policy support: Public perceptions of nuclear power. Energy Policy 2013, 62, 176–184. [Google Scholar] [CrossRef]
  42. Zaunbrecher, B.S.; Ziefle, M. Integrating acceptance-relevant factors into wind power planning: A discussion. Sustain. Cities Soc. 2016, 27, 307–314. [Google Scholar] [CrossRef]
  43. Balta-Ozkan, N.; Le Gallo, J. Spatial variation in energy attitudes and perceptions: Evidence from Europe. Renew. Sustain. Energy Rev. 2018, 81, 2160–2180. [Google Scholar] [CrossRef] [Green Version]
  44. Tosun, J.; Mišić, M. Conferring Authority in the European Union: Citizens’ Policy Priorities for the European Energy Union. J. Eur. Integr. 2020, 42, 19–38. [Google Scholar] [CrossRef]
  45. European Commission and European Parliament. Eurobarometer 91.5. GESIS Data Archive, Cologne. ZA7576 Data file Version 1.0.0; European Commission and European Parliament: Brussels, Belgium, 2019. [Google Scholar] [CrossRef]
  46. Steg, L.; Perlaviciute, G.; van der Werff, E. Understanding the human dimensions of a sustainable energy transition. Front. Psychol. 2015, 6, 805. [Google Scholar] [CrossRef] [PubMed] [Green Version]
  47. Lee, T.; Ko, M.C. The Effects of Citizen Knowledge on the Effectiveness of Government Communications on Nuclear Energy Policy in South Korea. Information 2021, 12, 8. [Google Scholar] [CrossRef]
  48. Devine-Wright, P. Public engagement with large-scale renewable energy technologies: Breaking the cycle of NIMBYism. WIREs Clim. Chang. 2011, 2, 19–26. [Google Scholar] [CrossRef] [Green Version]
  49. Steg, L.; Dreijerink, L.; Abrahamse, W. Factors influencing the acceptability of energy policies: A test of VBN theory. J. Environ. Psychol. 2005, 25, 415–425. [Google Scholar] [CrossRef]
  50. Leijten, F.R.M.; Bolderdijk, J.W.; Keizer, K.; Gorsira, M.; van der Werff, E.; Steg, L. Factors that influence consumers’ acceptance of future energy systems: The effects of adjustment type, production level, and price. Energy Effic. 2014, 7, 973–985. [Google Scholar] [CrossRef]
  51. Hori, S.; Kondo, K.; Nogata, D.; Ben, H. The determinants of household energy-saving behavior: Survey and comparison in five major Asian cities. Energy Policy 2013, 52, 354–362. [Google Scholar] [CrossRef]
  52. Stadelmann-Steffen, I.; Eder, C. Public opinion in policy contexts. A comparative analysis of domestic energy policies and individual policy preferences in Europe. Int. Political Sci. Rev. 2021, 42, 78–94. [Google Scholar] [CrossRef]
  53. Verschoor, M.; Albers, C.; Poortinga, W.; Böhm, G.; Steg, L. Exploring relationships between climate change beliefs and energy preferences: A network analysis of the European Social Survey. J. Environ. Psychol. 2020, 70, 101435. [Google Scholar] [CrossRef]
  54. Groh, E.D.; von Mollendorff, C. What shapes the support of renewable energy expansion? Public attitudes between policy goals and risk, time, and social preferences. Energy Policy 2020, 137, 111171. [Google Scholar] [CrossRef]
  55. Hazboun, S.O.; Boudet, H.S. Public Preferences in a Shifting Energy Future: Comparing Public Views of Eight Energy Sources in North America’s Pacific Northwest. Energies 2020, 13, 1940. [Google Scholar] [CrossRef] [Green Version]
  56. Marquart-Pyatt, S.T.; Qian, H.; Houser, M.K.; McCright, A.M. Climate Change Views, Energy Policy Preferences, and Intended Actions across Welfare State Regimes: Evidence from the European Social Survey. Int. J. Sociol. 2019, 49, 1–26. [Google Scholar] [CrossRef]
  57. Motz, A. Consumer acceptance of the energy transition in Switzerland: The role of attitudes explained through a hybrid discrete choice model. Energy Policy 2021, 151, 112152. [Google Scholar] [CrossRef]
  58. van Rijnsoever, F.J.; Farla, J.C.M. Identifying and explaining public preferences for the attributes of energy technologies. Renew. Sustain. Energy Rev. 2014, 31, 71–82. [Google Scholar] [CrossRef] [Green Version]
  59. Wicker, P.; Becken, S. Conscientious vs. ambivalent consumers: Do concerns about energy availability and climate change influence consumer behaviour? Ecol. Econ. 2013, 88, 41–48. [Google Scholar] [CrossRef] [Green Version]
  60. McCright, A.M.; Dunlap, R.E.; Marquart-Pyatt, S.T. Political ideology and views about climate change in the European Union. Environ. Politics 2016, 25, 338–358. [Google Scholar] [CrossRef]
  61. Urban, J.; Scasny, M. Exploring domestic energy-saving: The role of environmental concern and background variables. Energy Policy 2012, 47, 69–80. [Google Scholar] [CrossRef]
  62. Mills, B.; Schleich, J. Residential energy-efficient technology adoption, energy conservation, knowledge, and attitudes: An analysis of European countries. Energy Policy 2012, 49, 616–628. [Google Scholar] [CrossRef] [Green Version]
  63. Druckman, A.; Jackson, T. Household energy consumption in the UK: A highly geographically and socio-economically disaggregated model. Energy Policy 2008, 36, 3177–3192. [Google Scholar] [CrossRef] [Green Version]
  64. Drews, S.; van den Bergh, J.C.J.M. What explains public support for climate policies? A review of empirical and experimental studies. Clim. Policy 2016, 16, 855–876. [Google Scholar] [CrossRef]
  65. Feick, L.F. Latent Class Analysis of Survey Questions That Include Don’t Know Responses. Public Opin. Q. 1989, 53, 525–547. [Google Scholar] [CrossRef]
  66. Oppenheim, A.N. Questionnaire Design, Interviewing and Attitude Measurement, 2nd ed.; Continnuum: London, UK; New York, NY, USA, 2000. [Google Scholar]
  67. Denman, D.C.; Baldwin, A.S.; Betts, A.C.; McQueen, A.; Tiro, J.A. Reducing “I Don’t Know” Responses and Missing Survey Data: Implications for Measurement. Med. Decis. Mak. 2018, 38, 673–682. [Google Scholar] [CrossRef] [PubMed]
  68. Cox, D.R. The Regression Analysis of Binary Sequences. J. R. Stat. Soc. Ser. B 1958, 20, 215–242. [Google Scholar] [CrossRef]
  69. Guo, G.; Zhao, H.X. Multilevel Modeling for Binary Data. Annu. Rev. Sociol. 2000, 26, 441–462. [Google Scholar] [CrossRef]
  70. Hosmer, D.W.; Lemeshow, S.; Sturdivant, R.X. Applied Logistic Regression, 3rd ed.; Wiley: New York, NY, USA, 2013. [Google Scholar] [CrossRef]
  71. Stoltzfus, J.C. Logistic Regression: A brief Primer. Acad. Emerg. Med. 2011, 18, 1099–1104. [Google Scholar] [CrossRef] [PubMed]
  72. Kleinbaum, D.G.; Klein, M. Logistic Regression, 3rd ed.; Springer: New York, NY, USA, 2010. [Google Scholar] [CrossRef]
  73. Hosmer, D.W.; Hosmer, T.; Lemeshow, S. A Goodness-of-Fit the Multiple Logistic Regression Model. Commun. Stat. 1980, 10, 1043–1069. [Google Scholar] [CrossRef]
  74. Lemeshow, S.; Hosmer, D.W. A Review of Goodness of Fit Statistics for Use in the Development of Logistic Regression Models. Am. J. Epidemiol. 1982, 115, 92–106. [Google Scholar] [CrossRef]
  75. Regulation (EU) 2018/1999 of the European Parliament and of the Council of 11 December 2018 on the Governance of the Energy Union and Climate Action, amending Regulations (EC) No 663/2009 and (EC) No 715/2009 of the European Parliament and of the Council, Directives 94/22/EC, 98/70/EC, 2009/31/EC, 2009/73/EC, 2010/31/EU, 2012/27/EU and 2013/30/EU of the European Parliament and of the Council, Council Directives 2009/119/EC and (EU) 2015/652 and repealing Regulation (EU) No 525/2013 of the European Parliament and of the Council. OJ L 328; Publications Office of the European Union: Luxembourg, Luxembourg, 2018; pp. 1–77.
Figure 1. Research methodology.
Energies 14 05237 g001
Figure 2. Box plots of objectives indicated by the EU countries as European Energy Union priorities. Note: Whiskers represent the minimum and maximum percentage of answers given by the respondents of EU countries on each priority. The box is drawn from Q1 to Q3 with a horizontal line drawn in the middle to denote the median. The sign X represents the mean value for each priority.
Energies 14 05237 g002
Table 1. Overview of dependent variables.
Dependent VariableNo. of ObservationsMentionedNot Mentioned
Guaranteeing reasonable energy prices for customers (DV1)25,80810,20515,603
Guaranteeing a continuous supply of energy (DV2)552220,286
Guaranteeing EU’s independence in the field of energy (DV3)384221,966
Protecting the environment (DV4)10,53415,274
Interconnecting energy infrastructure (DV5)269523,113
Fighting global warming (DV6)915016,658
Guaranteeing the competitiveness of EU’s industry (DV7)255823,250
Reducing energy consumption (DV8)626219,546
Guaranteeing reasonable energy prices for companies (DV9)320022,608
Pooling EU’s negotiating power towards energy providers (DV10)240823,400
Developing renewable energy (DV11)11,73414,074
Table 2. Overview of explanatory variables.
Category NameNo. of ObservationsDependent VariableReference Mean
Perceiving the environment, climate and energy as the most important issues facing individual (Env-Clim-Energy-Individual-Issue)26,210Not-mentionedX
Mentioned 0.126
Perceiving the environment, climate and energy as the most important issues facing country (Env-Clim-Energy-Country-Issue)26,225Not-mentionedX
Mentioned 0.176
Perceiving the environment as the most important issues facing the EU (Env-EU-Issue)25,388Not-mentionedX
Mentioned 0.125
Perceiving energy supply as the most important issues facing the EU (Energy-Sup-EU-Issue)25,388Not-mentionedX
Mentioned 0.054
Perceiving climate change as the most important issues facing the EU (Clim-EU-Issue)25,388Not-mentionedX
Mentioned 0.225
Support for a common energy policy among EU member states (Common-EU-Energy-Policy)24,125AgainstX
For 0.800
Opinion about the scope of decision-making at a European level in the field of securing energy supply (Decision-Sec-Energy-Sup)24,986No change is neededX
More decision-making at a European level 0.753
Less decision-making at a European level 0.213
Opinion about the scope of decision-making at a European level in the field of protecting the environment (Decision-Prot-Env)25,412No change is neededX
More decision-making at a European level 0.792
Less decision-making at a European level 0.183
Political ideology (Polit-Ideol)21,559Interval variable on a 10-point left-right scale (1–left; 10–right) 5.266
Gender (Gender)26,432ManX
Woman 0.545
Age (Age)26,43215–24X
25–34 0.121
35–44 0.156
45–54 0.170
55–64 0.185
65–74 0.182
75+ 0.098
Having children less than 10 years old (Children < 10 years old)26,430Not-mentionedX
Mentioned 0.170
Having children aged 10 to 14 years old (Children 10–14 years old)26,430Not-mentionedX
Mentioned 0.119
Educational level (Education)26,016No full timeX
Still studying 0.064
Up to 15 0.132
16–19 0.433
20+ >0.361
Occupation (Occupation)26,432Not workingX
Manual laborers 0.129
Service providers 0.149
Office workers 0.164
Professionals 0.043
Business people and top-level managers 0.030
Place of residence (Residence)26,420Rural area or villageX
Small or middle sized town 0.386
Large town 0.280
Country (Country)26,432AustriaX
Belgium 0.040
Bulgaria 0.039
Cyprus 0.019
Czech Republic 0.038
Germany 0.056
Denmark 0.038
Estonia 0.038
Spain 0.038
Finland 0.038
France 0.038
Greece 0.038
Croatia 0.038
Hungary 0.039
Ireland 0.039
Italy 0.039
Lithuania 0.038
Luxembourg 0.019
Latvia 0.038
Malta 0.019
The Netherlands 0.039
Poland 0.038
Portugal 0.038
Romania 0.039
Sweden 0.038
Slovenia 0.038
Slovakia 0.040
Table 3. Objectives to be given the highest priority in the European Energy Union according to respondents, in percent, by country.
Country DV1DV2DV3DV4DV5DV6DV7DV8DV9DV10DV11
Austria35.0729.4920.9436.4311.2831.6010.2934.4514.5013.1444.73
Belgium47.2219.3114.9036.8310.0741.769.6522.1413.2212.8049.63
Bulgaria51.3628.8124.0725.5915.9320.1714.5813.3921.5315.7627.12
Cyprus47.8116.796.5760.5810.2238.324.3821.1710.589.1245.99
Czech Republic40.8617.1316.8842.269.2629.1915.7427.5417.018.1233.88
Germany37.1624.6413.4746.7514.4234.2312.5223.3810.4611.8145.72
Denmark20.1217.5311.6554.9411.4154.596.0029.065.066.5964.12
Estonia54.5832.5725.8839.6111.0920.957.9211.4412.856.1646.65
Spain49.7915.278.1247.738.2538.937.5721.1812.655.6455.57
Finland32.4230.2017.5238.173.4048.5014.2522.2211.503.4066.01
France36.997.3114.9255.255.7851.758.3728.9211.269.8954.79
Greece50.2628.8717.7839.8212.7630.8012.6320.3614.699.4152.71
Croatia37.7220.9317.9227.9416.5433.4610.4023.4315.7913.0340.35
Hungary39.9524.2614.5128.8912.9632.5811.8921.7610.1113.0843.64
Ireland30.8023.6010.4039.6010.9339.4712.5327.2011.607.3349.20
Italy28.7019.4220.5836.5211.4529.7116.0931.1619.1314.9341.01
Lithuania40.1329.7722.2431.947.5338.969.3624.7513.047.6935.95
Luxembourg28.2911.1818.0946.3810.5345.0710.5332.246.5811.1854.61
Latvia56.0819.7911.4640.287.8123.7811.9824.1321.885.3835.59
Malta47.0618.557.2464.715.8834.396.3333.4815.843.6243.89
The Netherlands35.8626.3225.0040.4616.8936.625.5931.143.6211.7353.73
Poland36.9220.6816.9232.8210.7729.7411.6222.2213.3316.0739.15
Portugal50.4915.7313.5939.619.5142.9111.8412.6216.3110.2959.22
Romania34.6015.9613.7434.9112.9530.0211.0621.4814.6919.1235.39
Sweden20.0721.6311.1544.159.5957.8610.1431.666.025.2469.90
Slovenia39.7915.7315.5844.4811.6532.536.3532.538.024.5452.95
Slovakia39.0925.2113.3138.2413.8827.3412.0429.8912.7511.4731.16
EU-2738.7221.9215.9640.4011.1936.4910.6725.1012.4210.0547.70
Note: The respondent could mark up to three answers.
Table 4. Binary logistic regression analysis results.
VariableDV1DV2DV3DV4
B (SE)OR (95%CI)B(SE)OR (95%CI)B(SE)OR (95%CI)B (SE)OR (95%CI)
EnvClimEnergyIndividualIssue: Not mentioned (ref.)
Mentioned−0.27(0.05)0.76 ***(0.69–0.84)−0.20(0.06)0.82 ***(0.72–0.92)0.03(0.06)1.03(0.90–1.16)0.18(0.05)1.20 ***(1.09–1.31)
EnvClimEnergyCountryIssue: Not mentioned (ref.)
Mentioned−0.28(0.05)0.76 ***(0.69–0.83)−0.25(0.05)0.78 ***(0.70–0.86)−0.10(0.06)0.90(0.08–1.02)0.15(0.04)1.16 ***(1.06–1.26)
EnvEUIssue: Not mentioned (ref.)
Mentioned −0.37(0.05)0.69 ***(0.62–0.76)−0.29(0.06)0.75 ***(0.67–0.84)−0.12(0.06)0.89(0.78–1.01)0.45(0.05)1.56 ***(1.43–1.71)
EnergySupEUIssue: Not mentioned (ref.)
Mentioned −0.34(0.07)0.71 ***(0.62–0.82)0.08(0.08)1.09(0.94–1.26)0.22(0.08)1.24 **(1.06–1.45)−0.31(0.07)0.73 ***(0.64–0.84)
ClimEUIssue: Not mentioned (ref.)
Mentioned −0.26(0.04)0.77 ***(0.71–0.84)−0.31(0.05)0.73 ***(0.67–0.81)−0.22(0.05)0.81 ***(0.73–0.89)0.34(0.04)1.40 ***(1.30–1.51)
CommonEUEnergyPolicy: Against (ref.)
For −0.09(0.04)0.91 *(0.84–0.99)0.01(0.05)1.01(0.92–1.11)0.03(0.06)1.04(0.93–1.15)0.11(0.04)1.11 *(1.02–1.21)
DecisionSecEnergySup: No decisions needed (ref.)
Less decision-making−0.06(0.12)0.95(0.75–1.20)0.10(0.14)1.10(0.84–1.45)−0.13(0.15)0.88(0.66–1.18)0.06(0.12)1.07(0.84–1.34)
More decision-making0.07(0.12)1.07(0.85–1.35)0.26(0.14)1.29(0.99–1.69)0.08(0.14)1.08(0.82–1.44)−0.07(0.11)0.93(0.74–1.16)
DecisionProtEnv: No decisions needed (ref.)
Less decision-making0.21(0.14)1.23(0.93–1.63)−0.25(0.16)0.78(0.58–1.06)−0.04(0.17)0.96(0.68–1.35)0.04(0.15)1.04(0.78–1.38)
More decision-making0.17(0.14)1.18(0.90–1.56)−0.36(0.15)0.70 *(0.52–0.94)−0.16(0.17)0.86(0.61–1.19)0.43(0.14)1.53 **(1.16–2.02)
PolitIdeol0.02(0.01)1.02 *(1.00–1.03)0.03(0.01)1.03 ***(1.02–1.05)0.04(0.01)1.04 ***(1.02–1.05)−0.03(0.01)0.97 ***(0.95–0.98)
Gender: Man (ref)
Woman0.08(0.03)1.09 **(1.02–1.16)−0.17(0.04)0.85 ***(0.79–0.91)−0.24(0.04)0.78 ***(0.72–0.85)0.26(0.03)1.30 ***(1.22–1.38)
Age: 15–24 years (ref.)
25–34 years−0.11(0.10)0.89(0.74–1.08)0.07(0.11)1.07(0.86–1.34)0.07(0.13)1.07(0.83–1.38)−0.10(0.09)0.90(0.76–1.08)
35–44 years0.07(0.10)1.07(0.89–1.29)0.10(0.12)1.11(0.88–1.39)0.19(0.13)1.21(0.93–1.56)−0.21(0.09)0.81 *(0.67–0.97)
45–54 years0.12(0.09)1.13(0.94–1.35)0.14(0.11)1.15(0.92–1.44)0.23(0.13)1.25(0.97–1.61)−0.21(0.09)0.81 *(0.68–0.97)
55–64 years0.03(0.09)1.03(0.85–1.24)0.13(0.11)1.14(0.91–1.42)0.20(0.13)1.22(0.95–1.57)−0.13(0.09)0.87(0.73–1.04)
65–74 years0.12(0.10)1.13(0.93–1.37)0.20(0.12)1.22(0.97–1.53)0.23(0.14)1.26(0.96–1.64)−0.25(0.10)0.78 **(0.65–0.94)
75+0.03(0.11)1.04(0.84–1.28)0.40(0.13)1.49 **(1.16–1.9)0.23(0.15)1.26(0.95–1.68)−0.23(0.10)0.79 *(0.65–0.97)
Children < 10 years old: No (ref.)
Yes−0.03(0.05)0.98(0.89–1.07)0.06(0.06)1.06(0.95–1.19)−0.01(0.06)0.99(0.88–1.12)−0.02(0.05)0.98(0.89–1.08)
Children 10–14 years old: No (ref.)
Yes−0.08(0.05)0.93(0.84–1.03)−0.18(0.06)0.84 **(0.74–0.95)−0.01(0.07)0.99(0.87–1.13)0.04(0.05)1.04(0.94–1.15)
Education: No full-time (ref.)
Still studying −0.61(0.21)0.54 **(0.36–0.81)−0.13(0.24)0.88(0.55–1.42)0.19(0.29)1.21(0.68–2.16)0.12(0.19)1.12(0.77–1.64)
Up to 150.09(0.18)1.09(0.76–1.56)0.10(0.22)1.11(0.73–1.70)−0.06(0.27)0.94(0.56–1.59)−0.03(0.17)0.98(0.69–1.37)
16–190.03(0.18)1.03(0.73–1.47)0.11(0.21)1.11(0.74–1.68)0.09(0.26)1.09(0.65–1.81)−0.08(0.17)0.93(0.66–1.29)
20+−0.10(0.18)0.91(0.64–1.29)0.00(0.21)1.00(0.66–1.51)0.21(0.26)1.23(0.74–2.04)−0.07(0.17)0.93(0.67–1.30)
Occupation: Not working (ref.)
Manual laborers−0.09(0.06)0.92(0.82–1.02)−0.02(0.07)0.98(0.86–1.11)−0.06(0.08)0.94(0.80–1.10)−0.03(0.06)0.97(0.86–1.09)
Service providers−0.21(0.05)0.81 ***(0.73–0.90)−0.08(0.06)0.92(0.81–1.04)0.16(0.07)1.17 *(1.02–1.35)−0.07(0.05)0.93(0.84–1.04)
Office workers−0.33(0.05)0.72 ***(0.65–0.80)−0.10(0.06)0.90(0.80–1.02)0.22(0.07)1.24 **(1.08–1.42)−0.03(0.05)0.97(0.88–1.08)
Professionals−0.45(0.09)0.64 *(0.54–0.76)−0.10(0.10)0.90(0.74–1.09)0.41(0.10)1.51 ***(1.25–1.83)0.01(0.08)1.01(0.86–1.18)
Business people and top-level managers−0.4(0.10)0.67 ***(0.56–0.81)−0.28(0.11)0.76 *(0.61–0.94)0.12(0.12)1.13(0.90–1.42)−0.28(0.09)0.75 **(0.63–0.91)
Residence: Rural area or village
Small/middle town−0.11(0.04)0.89 **(0.83–0.96)−0.03(0.04)0.97(0.89–1.06)0.06(0.05)1.06(0.96–1.17)0.11(0.04)1.11 **(1.03–1.20)
Large town−0.20(0.04)0.82 ***(0.75–0.89)0.01(0.05)1.01(0.92–1.11)0.16(0.05)1.18 **(1.06–1.31)0.09(0.04)1.10 *(1.01–1.19)
Country: AT (ref.)
Belgium0.52(0.10)1.68 ***(1.37–2.05)−0.56(0.12)0.57 ***(0.45–0.71)−0.44(0.13)0.64 ***(0.50–0.83)−0.09(0.10)0.92(0.75–1.12)
Bulgaria0.52(0.11)1.68 ***(1.34–2.1)−0.20(0.12)0.82(0.64–1.04)0.06(0.13)1.06(0.82–1.38)−0.38(0.12)0.68 **(0.54–0.87)
Cyprus0.29(0.15)1.33 *(1.00–1.78)−0.94(0.18)0.39 ***(0.27–0.56)−1.42(0.26)0.24 ***(0.14–0.40)1.07(0.15)2.91 ***(2.18–3.88)
Czech Republic0.14(0.11)1.15(0.94–1.42)−0.79(0.12)0.45 ***(0.36–0.58)−0.33(0.13)0.72 *(0.56–0.93)0.30(0.11)1.35 **(1.10–1.66)
Germany0.14(0.10)1.15(0.95–1.40)−0.24(0.10)0.79 *(0.64–0.97)−0.53(0.12)0.59 ***(0.46–0.75)0.29(0.10)1.34 **(1.11–1.61)
Denmark−0.59(0.12)0.56 ***(0.44–0.70)−0.50(0.13)0.60 ***(0.47–0.78)−0.70(0.14)0.50 ***(0.37–0.66)0.53(0.11)1.70 ***(1.37–2.10)
Estonia0.71(0.12)2.03 ***(1.62–2.55)0.00(0.12)0.10(0.78–1.27)0.14(0.13)1.15(0.89–1.50)0.27(0.12)1.31 *(1.04–1.64)
Spain0.49(0.11)1.64 ***(1.32–2.03)−0.91(0.13)0.40 ***(0.31–0.52)−1.05(0.16)0.35 ***(0.25–0.49)0.38(0.11)1.46 ***(1.18–1.81)
Finland−0.13(0.11)0.88(0.71–1.10)0.06(0.12)1.06(0.84–1.33)−0.24(0.13)0.79(0.60–1.02)0.00(0.11)1.00(0.81–1.25)
France0.07(0.11)1.07(0.86–1.34)−1.69(0.17)0.18 ***(0.13–0.26)−0.41(0.14)0.67 **(0.50–0.88)0.66(0.11)1.94 ***(1.56–2.41)
Greece0.41(0.11)1.51 ***(1.23–1.87)−0.23(0.11)0.80 *(0.64–1.00)−0.33(0.13)0.72 *(0.56–0.94)0.26(0.11)1.29 *(1.05–1.60)
Croatia−0.06(0.11)0.95(0.77–1.17)−0.06(0.12)0.55 ***(0.44–0.70)−0.27(0.13)0.76 *(0.59–0.98)−0.31(0.11)0.74 **(0.59–0.91)
Hungary0.02(0.11)1.02(0.83–1.25)−0.45(0.11)0.64 ***(0.51–0.80)−0.51(0.13)0.60 ***(0.46–0.78)−0.25(0.11)0.78 *(0.63–0.97)
Ireland−0.19(0.11)0.83(0.67–1.03)−0.30(0.12)0.74 *(0.59–0.93)−0.86(0.15)0.42 ***(0.31–0.57)0.05(0.11)1.05(0.85–1.30)
Italy−0.42(0.12)0.66 ***(0.52–0.83)−0.67(0.13)0.51 ***(0.40–0.66)−0.11(0.13)0.89(0.69–1.15)0.06(0.11)1.06(0.85–1.32)
Lithuania0.04(0.12)1.04(0.83–1.31)−0.14(0.12)0.87(0.69–1.11)0.00(0.14)1.00(0.76–1.30)−0.17(0.12)0.85(0.67–(1.07)
Luxembourg−0.30(0.15)0.74 *(0.55–1.00)−1.15(0.20)0.32 ***(0.21–0.47)−0.21(0.18)0.81(0.57–1.14)0.31(0.14)1.36 *(1.03–1.80)
Latvia0.69(0.12)1.99 ***(1.58–2.49)−0.68(0.13)0.51 ***(0.39–0.66)−0.84(0.16)0.43 ***(0.31–0.59)0.28(0.12)1.32 *(1.05–1.66)
Malta0.51(0.16)1.66 **(1.21–2.27)−0.55(0.19)0.58 **(0.40–0.85)−1.13(0.28)0.32 ***(0.19–0.55)1.00(0.16)2.71 ***(1.97–3.73)
The Netherlands0.09(0.11)1.09(0.89–1.35)−0.04(0.11)0.96(0.77–1.19)0.21(0.12)1.23(0.97–1.56)0.03(0.10)1.03(0.84–1.26)
Poland−0.01(0.12)0.99(0.79–1.24)−0.57(0.13)0.57 ***(0.44–0.73)−0.32(0.14)0.72 *(0.55–0.96)−0.15(0.12)0.86(0.68–1.09)
Portugal0.44(0.12)1.55 ***(1.22–1.96)−0.96(0.15)0.38 ***(0.29–0.51)−0.52(0.16)0.60 **(0.44–0.81)0.13(0.12)1.14(0.90–1.45)
Romania−0.21(0.11)0.81(0.65–1.02)−0.92(0.14)0.40 ***(0.30–0.52)−0.52(0.15)0.60 ***(0.45–0.80)0.04(0.11)1.04(0.83–1.30)
Sweden−0.55(0.12)0.58 ***(0.46–0.73)−0.28(0.12)0.76 *(0.60–0.96)−0.84(0.14)0.43 ***(0.33–0.57)0.09(0.11)1.09(0.89–1.34)
Slovenia0.04(0.11)1.04(0.84–1.30)−0.93(0.13)0.39 ***(0.30–0.51)−0.39(0.14)0.68 **(0.51–0.89)0.39(0.11)1.47 ***(1.19–1.83)
Slovakia0.01(0.11)1.01(0.81–1.25)−0.32(0.12)0.72 **(0.57–0.91)−0.56(0.14)0.57 ***(0.43–0.75)0.17(0.11)1.18(0.95–1.46)
VariableDV5DV6DV7DV8
B (SE)OR (95%CI)B (SE)OR (95%CI)B (SE)OR (95%CI)B (SE)OR (95%CI)
EnvClimEnergyIndividuallIssue: Not mentioned (ref.)
Mentioned0.11(0.07)1.11(0.97–1.28)0.21(0.05)1.24 ***(1.13–1.36)−0.01(0.08)0.99(0.84–1.15)0.06(0.05)1.06(0.96–1.17)
EnvClimEnergyCountryIssue: Not mentioned (ref.)
Mentioned0.10(0.07)1.11(0.97–1.26)0.38(0.04)1.47 ***(1.34–1.60)−0.24(0.07)0.79 **(0.68–0.91)0.04(0.05)1.04(0.95–1.14)
EnvEUIssue: Not mentioned (ref.)
Mentioned −0.08(0.07)0.92(0.80–1.07)0.28(0.05)1.32 ***(1.21–1.45)−0.14(0.08)0.87(0.75–1.02)0.13(0.05)1.14 *(1.03–1.26)
EnergySupEUIssue: Not mentioned (ref.)
Mentioned 0.36(0.09)1.44 ***(1.21–1.71)−0.06(0.07)0.94(0.82–1.08)0.17(0.1)1.19(0.98–1.43)0.10(0.07)1.11(0.96–1.28)
ClimEUIssue: Not mentioned (ref.)
Mentioned −0.14(0.06)0.87 *(0.77–0.98)0.69(0.04)1.99 ***(1.85–2.15)−0.32(0.07)0.72 ***(0.64–0.82)0.06(0.04)1.07(0.98–1.16)
CommonEUEnergyPolicy: Against (ref.)
For 0.30(0.07)1.35 ***(1.18–1.54)0.23(0.05)1.26 ***(1.15–1.37)−0.06(0.06)0.94(0.83–1.06)−0.09(0.05)0.92(0.84–1.00)
DecisionSecEnergySup: No decisions needed (ref.)
Less decision-making0.24(0.19)1.27(0.89–1.83)−0.04(0.12)0.96(0.76–1.23)0.1(0.19)1.11(0.76–1.61)−0.42(0.12)0.66 *(0.52–0.84)
More decision-making0.28(0.18)1.33(0.93–1.89)−0.03(0.12)0.97(0.77–1.23)0.18(0.19)1.20(0.83–1.74)−0.47(0.12)0.63 *(0.50–0.79)
DecisionProtEnv: No decisions needed (ref.)
Less decision-making−0.32(0.19)0.73(0.50–1.06)−0.35(0.15)0.70 *(0.53–0.94)−0.08(0.21)0.93(0.61–1.40)0.34(0.17)1.40 *(1.01–1.94)
More decision-making−0.57(0.19)0.57 **(0.39–0.82)0.06(0.14)1.06(0.80–1.41)−0.15(0.21)0.86(0.57–1.29)0.51(0.16)1.67 *(1.21–2.29)
PolitIdeol0.03(0.01)1.03 **(1.01–1.05)−0.01(0.01)0.99(0.97–1.00)0.06(0.01)1.07 ***(1.04–1.09)−0.02(0.01)0.98 *(0.96–0.99)
Gender: Man (ref)
Woman−0.33(0.05)0.72 ***(0.66–0.79)0.20(0.03)1.22 ***(1.15–1.30)−0.31(0.05)0.73 ***(0.66–0.80)0.02(0.03)1.02(0.95–1.09)
Age: 15–24 years (ref.)
25–34 years0.15(0.14)1.16(0.88–1.53)−0.03(0.09)0.97(0.81–1.17)0.23(0.15)1.26(0.94–1.67)−0.08(0.10)0.92(0.75–1.12)
35–44 years0.24(0.15)1.27(0.95–1.69)−0.12(0.10)0.89(0.74–1.07)0.19(0.15)1.21(0.91–1.62)−0.03(0.10)0.97(0.80–1.19)
45–54 years0.20(0.14)1.22(0.92–1.61)−0.16(0.09)0.85(0.71–1.02)0.23(0.15)1.26(0.94–1.67)−0.06(0.10)0.94(0.77–1.15)
55–64 years0.16(0.14)1.18(0.89–1.56)−0.08(0.09)0.92(0.76–1.11)0.08(0.15)1.09(0.81–1.45)0.04(0.10)1.04(0.85–1.26)
65–74 years0.23(0.15)1.26(0.93–1.70)−0.14(0.10)0.87(0.72–1.06)0.17(0.15)1.18(0.87–1.60)0.04(0.11)1.04(0.85–1.28)
75+0.11(0.17)1.12(0.80–1.56)−0.28(0.11)0.76 *(0.61–0.94)0.14(0.17)1.15(0.82–1.60)−0.02(0.12)0.98(0.78–1.24)
Children < 10 years old: No (ref.)
Yes0.05(0.07)1.05(0.92–1.21)0.03(0.05)1.03(0.93–1.13)0(0.07)1.00(0.87–1.16)0.06(0.05)1.07(0.96–1.18)
Children 10–14 years old: No (ref.)
Yes−0.08(0.08)0.93(0.80–1.08)0.01(0.05)1.01(0.91–1.12)−0.02(0.08)0.98(0.84–1.15)0.07(0.06)1.08(0.96–1.20)
Education: No full-time (ref.)
Still studying 0.48(0.35)1.62(0.82–3.20)0.38(0.20)1.46(0.99–2.17)−0.07(0.32)0.93(0.49–1.76)−0.10(0.21)0.90(0.60–1.36)
Up to 15−0.01(0.32)0.99(0.53–1.85)0.13(0.18)1.14(0.80–1.61)−0.32(0.29)0.73(0.41–1.29)−0.28(0.19)0.75(0.52–1.09)
16–190.21(0.31)1.23(0.67–2.27)0.11(0.17)1.11(0.79–1.56)−0.22(0.28)0.80(0.46–1.40)−0.20(0.18)0.82(0.57–1.16)
20+0.30(0.31)1.35(0.73–2.47)0.11(0.17)1.12(0.80–1.57)−0.18(0.28)0.84(0.48–1.46)−0.24(0.18)0.79(0.55–1.12)
Occupation: Not working (ref.)
Manual laborers0.08(0.09)1.08(0.90–1.30)−0.08(0.06)0.93(0.82–1.04)0.13(0.09)1.14(0.95–1.36)0.09(0.07)1.09(0.96–1.24)
Service providers0.28(0.08)1.32 ***(1.13–1.56)−0.07(0.06)0.93(0.83–1.04)0.02(0.09)1.02(0.86–1.20)0.18(0.06)1.20 *(1.06–1.34)
Office workers0.24(0.08)1.27 **(1.08–1.49)0.03(0.06)1.03(0.92–1.15)0.12(0.08)1.12(0.95–1.33)0.13(0.06)1.13 *(1.01–1.27)
Professionals0.40(0.12)1.49 ***(1.19–1.87)−0.03(0.08)0.97(0.82–1.14)0.34(0.12)1.41 **(1.12–1.78)−0.01(0.09)0.99(0.82–1.19)
Business people and top-level managers0.41(0.13)1.51 **(1.18–1.94)0.07(0.09)1.07(0.89–1.29)0.4(0.13)1.48 **(1.15–1.91)0.00(0.10)1.00(0.81–1.22)
Residence: Rural area or village
Small/middle town−0.07(0.06)0.93(0.83–1.05)0.06(0.04)1.07(0.99–1.15)0.1(0.06)1.10(0.98–1.24)−0.09(0.04)0.92 *(0.85–1.00)
Large town0.04(0.06)1.04(0.92–1.17)0.11(0.04)1.12 **(1.03–1.22)0.17(0.06)1.19 **(1.05–1.35)−0.06(0.05)0.94(0.86–1.03)
Country: AT (ref.)
Belgium−0.12(0.16)0.88(0.65–1.21)0.34(0.11)1.41 **(1.14–1.73)−0.05(0.16)0.96(0.69–1.32)−0.61(0.11)0.55 *(0.44–0.68)
Bulgaria0.36(0.16)1.44 *(1.05–1.98)−0.40(0.13)0.67 **(0.52–0.87)0.22(0.17)1.24(0.89–1.73)−1.16(0.14)0.31 *(0.24–0.42)
Cyprus−0.08(0.23)0.92(0.59–1.46)0.42(0.15)1.52 **(1.13–2.04)−0.98(0.32)0.37 **(0.20–0.70)−0.59(0.17)0.56 *(0.40–0.77)
Czech Republic−0.21(0.17)0.81(0.58–1.13)0.00(0.11)1.00(0.80–1.25)0.4(0.15)1.49 **(1.10–2.01)−0.29(0.11)0.75 *(0.60–0.93)
Germany0.30(0.14)1.35 *(1.02–1.77)−0.11(0.10)0.90(0.74–1.10)0.31(0.15)1.36 *(1.02–1.82)−0.52(0.10)0.59 *(0.49–0.73)
Denmark0.02(0.16)1.02(0.74–1.40)0.66(0.11)1.93 ***(1.55–2.41)−0.5(0.19)0.60 **(0.41–0.88)−0.28(0.11)0.75 *(0.60–0.94)
Estonia−0.12(0.18)0.89(0.63–1.26)−0.43(0.13)0.65 **(0.50–0.84)−0.4(0.2)0.67 *(0.45–0.98)−1.31(0.15)0.27 *(0.20–0.36)
Spain−0.22(0.18)0.80(0.56–1.14)0.29(0.11)1.34 **(1.07–1.68)−0.28(0.19)0.75(0.52–1.09)−0.63(0.12)0.53 *(0.42–0.67)
Finland−1.26(0.23)0.29 ***(0.18–0.45)0.66(0.11)1.93 ***(1.54–2.40)0.4(0.16)1.49 *(1.09–2.05)−0.57(0.12)0.57 *(0.45–0.71)
France−0.70(0.20)0.50 ***(0.33–0.74)0.77(0.11)2.15 ***(1.72–2.70)−0.18(0.19)0.84(0.58–1.20)−0.24(0.12)0.79 *(0.63–0.99)
Greece0.16(0.16)1.17(0.86–1.60)0.19(0.11)1.21(0.97–1.51)0.11(0.16)1.12(0.81–1.54)−0.64(0.12)0.53 *(0.42–0.67)
Croatia0.45(0.15)1.58 **(1.17–2.12)0.27(0.11)1.31 *(1.05–1.63)−0.09(0.17)0.91(0.66–1.27)−0.48(0.11)0.62 *(0.50–0.78)
Hungary0.15(0.16)1.17(0.86–1.58)0.16(0.11)1.17(0.94–1.46)0.03(0.16)1.03(0.75–1.42)−0.55(0.11)0.58 *(0.46–0.72)
Ireland−0.06(0.16)0.94(0.68–1.29)0.23(0.11)1.26 *(1.01–1.57)0.25(0.16)1.29(0.93–1.77)−0.32(0.11)0.72 *(0.58–0.90)
Italy0.04(0.17)1.04(0.75–1.45)0.05(0.12)1.05(0.84–1.33)0.39(0.16)1.48 *(1.08–2.03)−0.05(0.11)0.95(0.76–1.19)
Lithuania−0.42(0.20)0.66 *(0.45–0.97)0.43(0.12)1.53 ***(1.21–1.93)−0.14(0.19)0.87(0.60–1.25)−0.35(0.12)0.70 *(0.55–0.90)
Luxembourg−0.11(0.22)0.90(0.58–1.39)0.44(0.15)1.56 **(1.17–2.07)0.08(0.23)1.08(0.69–1.68)−0.10(0.15)0.91(0.68–1.21)
Latvia−0.46(0.20)0.63 *(0.43–0.93)−0.24(0.13)0.79(0.61–1.02)0.05(0.18)1.06(0.75–1.50)−0.39(0.13)0.68 *(0.53–0.87)
Malta−0.64(0.31)0.53 *(0.29–0.97)−0.09(0.17)0.91(0.66–1.27)−0.36(0.3)0.70(0.39–1.27)−0.04(0.16)0.96(0.70–1.33)
The Netherlands0.45(0.15)1.57 **(1.17–2.10)−0.04(0.11)0.96(0.78–1.19)−0.54(0.19)0.58 **(0.40–0.85)−0.18(0.11)0.83(0.68–1.03)
Poland−0.09(0.18)0.92(0.65–1.30)−0.08(0.12)0.92(0.72–1.18)0.07(0.18)1.07(0.76–1.52)−0.55(0.13)0.58 *(0.45–0.74)
Portugal−0.10(0.19)0.91(0.62–1.32)0.55(0.12)1.73 ***(1.36–2.20)0.17(0.18)1.18(0.82–1.70)−1.23(0.15)0.29 *(0.22–0.40)
Romania0.18(0.17)1.20(0.87–1.66)0.11(0.12)1.12(0.89–1.42)0.01(0.17)1.01(0.72–1.43)−0.61(0.12)0.55 *(0.43–0.69)
Sweden−0.24(0.17)0.79(0.57–1.09)0.79(0.11)2.21 ***(1.78–2.74)0.02(0.17)1.02(0.74–1.42)−0.14(0.11)0.87(0.71–1.08)
Slovenia0.04(0.17)1.04(0.75–1.44)0.10(0.12)1.11(0.88–1.40)−0.53(0.2)0.59 **(0.40–0.87)−0.05(0.11)0.95(0.76–1.19)
Slovakia0.22(0.16)1.25(0.92–1.71)−0.06(0.12)0.94(0.75–1.19)0.17(0.17)1.18(0.85–1.64)−0.16(0.11)0.85(0.68–1.06)
VariableDV9DV10DV11
B (SE)OR (95%CI)B (SE)OR (95%CI)B (SE)OR (95%CI)
EnvClimEnergyIndividualIssue: Not mentioned (ref.)
Mentioned−0.17(0.08)0.84 *(0.72–0.99)−0.08(0.08)0.92(0.79–1.08)0.08(0.05)1.09(0.99–1.19)
EnvClimEnergyCountryIssue: Not mentioned (ref.)
Mentioned−0.38(0.08)0.69 ***(0.59–0.80)0.15(0.07)1.16 *(1.01–1.33)0.21(0.04)1.23 ***(1.13–1.34)
EnvEUIssue: Not mentioned (ref.)
Mentioned −0.29(0.08)0.75 ***(0.64–0.87)−0.08(0.08)0.92(0.79–1.07)0.09(0.05)1.10 *(1–1.2)
EnergySupEUIssue: Not mentioned (ref.)
Mentioned −0.11(0.10)0.89(0.73–1.09)0.25(0.09)1.29 **(1.07–1.55)0.12(0.07)1.12(0.99–1.28)
ClimEUIssue: Not mentioned (ref.)
Mentioned −0.29(0.06)0.75 ***(0.66–0.84)−0.26(0.07)0.77 ***(0.68–0.88)0.15(0.04)1.16 ***(1.08–1.25)
CommonEUEnergyPolicy: Against (ref.)
For −0.23(0.06)0.79 ***(0.71–0.89)0.09(0.07)1.09(0.96–1.25)0.30(0.04)1.35 ***(1.24–1.47)
DecisionSecEnergySup: No decisions needed (ref.)
Less decision-making0.40(0.19)1.50 *(1.03–2.18)0.26(0.20)1.30(0.88–1.92)0.05(0.12)1.06(0.84–1.33)
More decision-making0.43(0.19)1.54 *(1.07–2.23)0.33(0.20)1.39(0.95–2.03)0.18(0.11)1.19(0.95–1.49)
DecisionProtEnv: No decisions needed (ref.)
Less decision-making−0.04(0.19)0.96(0.66–1.41)−0.06(0.21)0.94(0.62–1.44)−0.16(0.14)0.85(0.65–1.12)
More decision-making−0.40(0.19)0.67 *(0.46–0.98)−0.23(0.21)0.80(0.53–1.20)0.01(0.14)1.01(0.78–1.32)
PolitIdeol0.01(0.01)1.01(0.99–1.03)0.01(0.01)1.01(0.99–1.03)−0.02(0.01)0.98 **(0.97–1)
Gender: Man (ref)
Woman−0.05(0.05)0.95(0.87–1.04)−0.10(0.05)0.90 *(0.82–0.99)−0.05(0.03)0.95(0.9–1.01)
Age: 15–24 years (ref.)
25–34 years0.10(0.14)1.11(0.85–1.45)0.06(0.15)1.06(0.79–1.43)0.01(0.09)1.01(0.85–1.21)
35–44 years0.16(0.14)1.17(0.89–1.54)0.08(0.15)1.08(0.80–1.46)−0.09(0.09)0.91(0.76–1.09)
45–54 years0.07(0.14)1.07(0.82–1.40)0.07(0.15)1.08(0.80–1.44)0.02(0.09)1.03(0.86–1.22)
55–64 years0.14(0.14)1.15(0.88–1.50)0.14(0.15)1.15(0.86–1.54)−0.01(0.09)0.99(0.83–1.18)
65–74 years0.05(0.14)1.05(0.79–1.39)0.15(0.16)1.16(0.85–1.58)−0.01(0.10)0.99(0.82–1.19)
75+0.24(0.16)1.27(0.94–1.72)0.05(0.17)1.05(0.74–1.47)−0.17(0.10)0.84(0.69–1.03)
Children <10 years old: No (ref.)
Yes−0.03(0.07)0.97(0.85–1.12)−0.03(0.08)0.97(0.84–1.13)0.03(0.05)1.03(0.94–1.13)
Children 10–14 years old: No (ref.)
Yes0.00(0.07)1.00(0.87–1.16)−0.06(0.08)0.94(0.80–1.11)0.08(0.05)1.08(0.98–1.2)
Education: No full-time (ref.)
Still studying −0.41(0.29)0.66(0.37–1.17)−0.37(0.32)0.69(0.37–1.29)0.61(0.19)1.84 **(1.26–2.69)
Up to 15−0.38(0.26)0.69(0.42–1.13)−0.29(0.29)0.75(0.43–1.30)0.28(0.17)1.32(0.94–1.86)
16–19−0.34(0.25)0.71(0.43–1.16)−0.29(0.28)0.75(0.43–1.29)0.33(0.17)1.38(0.99–1.93)
20+−0.47(0.25)0.63(0.38–1.02)−0.22(0.28)0.81(0.47–1.39)0.56(0.17)1.75 ***(1.26–2.43)
Occupation: Not working (ref.)
Manual laborers0.06(0.08)1.07(0.91–1.25)−0.02(0.09)0.98(0.82–1.18)−0.02(0.06)0.98(0.88–1.1)
Service providers0.04(0.08)1.04(0.89–1.21)0.06(0.09)1.06(0.90–1.25)0.10(0.05)1.1(0.99–1.22)
Office workers0.01(0.08)1.01(0.86–1.18)0.06(0.09)1.06(0.90–1.25)0.12(0.05)1.13 *(1.02–1.25)
Professionals−0.11(0.13)0.89(0.70–1.15)0.03(0.13)1.03(0.79–1.33)0.12(0.08)1.13(0.96–1.32)
Business people and top-level managers0.57(0.12)1.77 ***(1.40–2.25)0.08(0.15)1.09(0.82–1.45)0.14(0.09)1.15(0.96–1.37)
Residence: Rural area or village
Small/middle town0.07(0.06)1.07(0.96–1.19)0.11(0.06)1.12(0.99–1.26)−0.11(0.04)0.90 **(0.83–0.96)
Large town−0.01(0.06)0.99(0.88–1.11)0.19(0.07)1.20 **(1.06–1.37)−0.09(0.04)0.91 *(0.84–0.99)
Country: AT (ref.)
Belgium0.03(0.14)1.03(0.78–1.37)−0.02(0.15)0.98(0.74–1.31)0.03(0.10)1.03(0.85–1.25)
Bulgaria0.38(0.15)1.47 **(1.10–1.95)0.16(0.16)1.17(0.86–1.59)−0.74(0.12)0.48 ***(0.38–0.6)
Cyprus−0.33(0.22)0.72(0.46–1.11)−0.43(0.24)0.65(0.41–1.04)−0.01(0.14)0.99(0.74–1.31)
Czech Republic0.13(0.14)1.14(0.87–1.50)−0.55(0.17)0.58 **(0.42–0.81)−0.44(0.11)0.64 ***(0.52–0.79)
Germany−0.19(0.14)0.83(0.63–1.09)−0.14(0.14)0.87(0.66–1.14)−0.13(0.09)0.88(0.73–1.06)
Denmark−0.93(0.20)0.40 ***(0.27–0.58)−0.79(0.18)0.45 ***(0.32–0.65)0.59(0.11)1.80 ***(1.45–2.22)
Estonia−0.19(0.16)0.83(0.60–1.14)−0.91(0.21)0.40 ***(0.27–0.60)0.04(0.11)1.05(0.84–1.31)
Spain−0.08(0.16)0.92(0.68–1.25)−0.88(0.20)0.42 ***(0.28–0.61)0.34(0.11)1.40 **(1.14–1.73)
Finland−0.19(0.16)0.83(0.61–1.12)−1.45(0.23)0.23 ***(0.15–0.37)0.80(0.11)2.22 ***(1.79–2.75)
France−0.16(0.16)0.85(0.62–1.17)−0.31(0.17)0.73(0.53–1.02)0.27(0.11)1.31 *(1.06–1.62)
Greece−0.04(0.15)0.96(0.72–1.29)−0.45(0.17)0.64 **(0.46–0.89)0.33(0.10)1.39 **(1.13–1.7)
Croatia0.01(0.14)1.01(0.76–1.33)−0.03(0.15)0.97(0.72–1.30)−0.16(0.10)0.85(0.69–1.04)
Hungary−0.47(0.16)0.62 **(0.46–0.85)−0.03(0.15)0.97(0.72–1.30)0.00(0.10)1(0.82–1.22)
Ireland−0.13(0.16)0.88(0.65–1.19)−0.63(0.18)0.53 ***(0.38–0.76)0.02(0.10)1.02(0.83–1.25)
Italy0.25(0.14)1.28(0.97–1.70)0.11(0.15)1.11(0.82–1.50)−0.13(0.11)0.88(0.71–1.09)
Lithuania−0.15(0.16)0.86(0.63–1.19)−0.64(0.19)0.53 ***(0.36–0.77)−0.42(0.12)0.66 ***(0.53–0.83)
Luxembourg−0.74(0.26)0.48 **(0.29–0.79)−0.16(0.21)0.85(0.56–1.29)0.16(0.14)1.17(0.89–1.54)
Latvia0.46(0.15)1.58 **(1.19–2.11)−1.03(0.22)0.36 ***(0.23–0.55)−0.41(0.12)0.66 ***(0.53–0.83)
Malta0.31(0.22)1.36(0.89–2.08)−1.34(0.38)0.26 ***(0.12–0.55)−0.18(0.16)0.84(0.62–1.14)
The Netherlands−1.25(0.21)0.29 ***(0.19–0.43)−0.15(0.15)0.86(0.64–1.16)0.12(0.10)1.12(0.92–1.37)
Poland−0.06(0.16)0.94(0.69–1.29)0.22(0.16)1.25(0.92–1.70)−0.31(0.11)0.73 **(0.59–0.92)
Portugal0.17(0.16)1.18(0.86–1.62)−0.26(0.18)0.77(0.54–1.11)0.54(0.12)1.72 ***(1.37–2.17)
Romania−0.05(0.15)0.95(0.70–1.28)0.46(0.15)1.58 **(1.18–2.12)−0.33(0.11)0.72 **(0.58–0.89)
Sweden−0.68(0.18)0.51 ***(0.36–0.72)−1.04(0.19)0.36 ***(0.25–0.51)0.82(0.11)2.28 ***(1.85–2.81)
Slovenia−0.65(0.18)0.52 ***(0.37–0.74)−1.15(0.22)0.32 ***(0.21–0.48)0.26(0.11)1.30 *(1.05–1.61)
Slovakia−0.20(0.15)0.82(0.60–1.10)−0.17(0.16)0.84(0.61–1.15)−0.57(0.11)0.57 ***(0.46–0.7)
Note: * p < 0.05; ** p < 0.01; *** p < 0.001.
Publisher’s Note: MDPI stays neutral with regard to jurisdictional claims in published maps and institutional affiliations.

