Article

Run-of-the-River Hydro-PV Battery Hybrid System as an Energy Supplier for Local Loads

1
Department of Electrical Engineering, Cracow University of Technology, 31-155 Krakow, Poland
2
Department of Energy, Cracow University of Technology, 31-155 Krakow, Poland
*
Author to whom correspondence should be addressed.
Energies 2021, 14(16), 5160; https://doi.org/10.3390/en14165160
Submission received: 21 July 2021 / Revised: 16 August 2021 / Accepted: 18 August 2021 / Published: 20 August 2021
(This article belongs to the Special Issue Energy Conversion System – Small Hydropower Plants)

Abstract

:
Hybrid hydro energy systems are usually analysed with pumped hydro storage systems, which can facilitate energy accumulation from other sources. Despite the lack of water storage, run-of-the-river hydropower plants are also attractive for hybrid systems owing to their low investment cost, short construction time, and small environmental impact. In this study, a hybrid system that contains run-of-the-river small hydro power plants (SHPs), PV systems, and batteries to serve local loads is examined. Low-power and low-head schemes that use variable-speed operation are considered. The novelty of this study is the proposal of a dedicated steady-state model of the run-of-the-river hydropower plant that is suitable for energy production analysis under different hydrological conditions. The presented calculations based on a real SHP of 150 kW capacity have shown that a simplified method can result in a 43% overestimation of the produced energy. Moreover, a one-year analysis of a hybrid system operation using real river flow data showed that the flow averaging period has a significant influence on the energy balance results. The system energy deficiency and surplus can be underestimated by approximately 25% by increasing the averaging time from day to month.

1. Introduction

Hybrid power systems have been investigated in many studies by analysing the cooperation between different renewable energy sources (RESs) or optimizing capacity configurations. The greatest developments have been in solar and wind systems; however, their combined installed capacity is still only approximately half that of hydropower capacity [1]. Moreover, the problem of grid stability being affected by fluctuating power from RES strengthens the hydropower position among reliable energy sources, especially for off-grid systems [2]. Hybrid power systems are usually combined with diesel generators owing to the decrease in cost and improve reliability [3,4,5].
The main disadvantages of wind and photovoltaic (PV) systems are uncertainties and large fluctuations in power production, which affect the grid stability and reliability. Therefore, they are often combined with hydro energy, which can reduce seasonal and inter-day fluctuations. Hybrid hydro energy systems are usually analysed using pumped hydro storage (PHS) systems, which can provide an accumulation of energy from other sources (wind or PV) [6]. The PHS are often integrated with wind farms in order to increase microgrid security and ensure large variable wind penetration [7]. The payback period of wind-PHS systems is estimated to be about 6–12 years [8]. Solar energy is less intermittent than wind; however, it is available only during the day, and thus, energy storage is needed to cover the surplus or deficit energy [9]. The idea of integrating different energy sources in one hybrid system (solar–wind–hydro) has become popular because the different systems can compensate for each other’s irregularities [10]. PHS solar wind systems are often combined with batteries, which provide fast system response, especially in off-grid applications. However, the battery size is minimised because it is the most expensive component with the shortest life span in hybrid RES systems [11]. The battery is usually sized to support the PHS system during low-energy shortfalls [12].
The main disadvantages of high-power PHS systems are their negative social and environmental effects, high capital costs, and long development times [7]. Reservoir systems have lower investment costs; however, they do not allow energy accumulation from other sources. The optimal sizing of large-scale hydro–PV hybrid systems based on electricity delivery demand and reservoir profile is analysed in [13]. It has been shown that proper water reservoir regulation improves the complementarity between PV and hydro. Another analysis [14] of a run-of-the-river hydropower plant with a small water tank integrated with PV showed the possibility of smoothing the energy exchange between the microgrid and the power system. The mathematical model was used in calculations to maximise the volume of energy from PV and reservoir hydropower to cover energy demand. The long-term multi-objective optimisation model for hydro/PV hybrid systems applied to large hydro power plants is presented in [15]. The results showed that the PV/hydro complementarity is especially significant in wet years when solar radiation is influenced by clouds. Reservoir hydro hybrid systems are also often integrated with batteries owing to the better energy dynamics of the hybrid system [16]. This hybrid system can be further expanded by wind turbines in order to diversify the energy sources, as presented in [17]. A medium to long-term operation strategy that improves hydropower efficiency and minimises the risk of running out of water during the dry season is proposed.
Run-of-the-river hydropower is also attractive because of the low investment cost, short construction time, and small environmental impact. Of course, this type of RES is dependent on the hydrological conditions because there are few or no water storage possibilities. Despite this, combination with a PV system and batteries can minimise the energy fluctuation. In the literature, there are few analyses of run-of-the-river hydropower plants as part of a hybrid system. In [18], the optimisation of a hybrid system in order to provide the required power production with elimination of energy shortages is presented. It is shown that increasing the renewable energy to eliminate energy shortages may not be economically justified. A mini-grid containing run-of-the-river hydropower, PV, and battery is analysed in [19] by net energy return on energy invested (EROI) factor. The results suggest that mini-hydro and PV systems can provide net energy benefits for local societies. Transient analysis of a microgrid based on dynamic models of the PV cell and the excitation system of the hydro generator is performed in [20]. All presented models of the water turbine have assumed constant efficiency under different hydrological conditions. However, turbine discharge significantly influences the efficiency of the run-of-the-river hydropower plant, which should be analysed as part of the control strategy of hybrid energy systems.
From the abovementioned studies, it follows that PV energy is a good complementary source for hydroelectric power to ensure a reliable power supply throughout the year (dry sunny or wet cloudy times). However, hydropower suffers from high inertia of the water turbines, which can limit the dynamic response of the hydropower plant. This problem can be overcome by rechargeable batteries. The use of wind turbines in hybrid systems is limited by localisation to areas with windy conditions; moreover, the usage is characterised by uncertainties and large fluctuations.
The motivation for the study presented in this paper is the need to utilise existing run-of-the-river hydropower schemes in hybrid systems. In this study, a hybrid system to serve local loads that contain a run-of-the-river hydro power plant, PV system, and battery is analysed. Low-power and low-head schemes that use variable-speed operation are considered. The main task of the proposed system is to supply energy to the customer in accordance with his current demand in order to minimize energy costs. The possible high variability and unpredictability of the river flow in a system that based mainly on hydropower requires support from the power system (on-grid mode). Fully island operation (off-grid) is not analysed due to the high investment and operating costs of batteries that can provide such operation. The novelty of this study is the proposal of a dedicated steady state model of the run-of-the-river hydropower plant that is suitable for energy production analysis under different hydrological conditions. Furthermore, a case study of a 150 kW hydropower plant [21] that supplies the water intake and pumping station [22] is analysed.

2. Control Strategy

2.1. System Structure

The analysed hybrid system contains a run-of-the-river hydropower plant, PV system, and batteries (Figure 1). The hybrid system is connected to the power grid and load (consumer) through a power electronic inverter. The hydro system (hydro), PV system (PV), and batteries are integrated using DC signals by individual converter units. The variable speed operation of the water turbine is realised by the active AC/DC rectifier, PV panels are regulated by the maximal power point tracking (MPPT) unit, and batteries are controlled by the charger unit. Low-power hydro usually contains a simple water turbine with unregulated blades and guide vanes that adjust the water flowing through the turbine.

2.2. Run-of-the-River Hydropower Plant Model

The hydropower plant model is based on turbine features, which are usually presented on the turbine discharge—speed plane. The so-called universal characteristic (hill diagram) also presents the efficiency isolines (points with the same efficiency) and guide vanes lines (Figure 2). The turbine type is usually defined by the specific speed ns [23], where there are three basic turbine types: slow (Francis)—ns < 200, normal (Kaplan)—ns ≈ 350, fast (Propeller)—ns > 500 [24]. Here, PN is the nominal power (kW), nN is the nominal speed (rpm), and HN is the nominal water head (m).
n s = n N P N H N 5 / 4
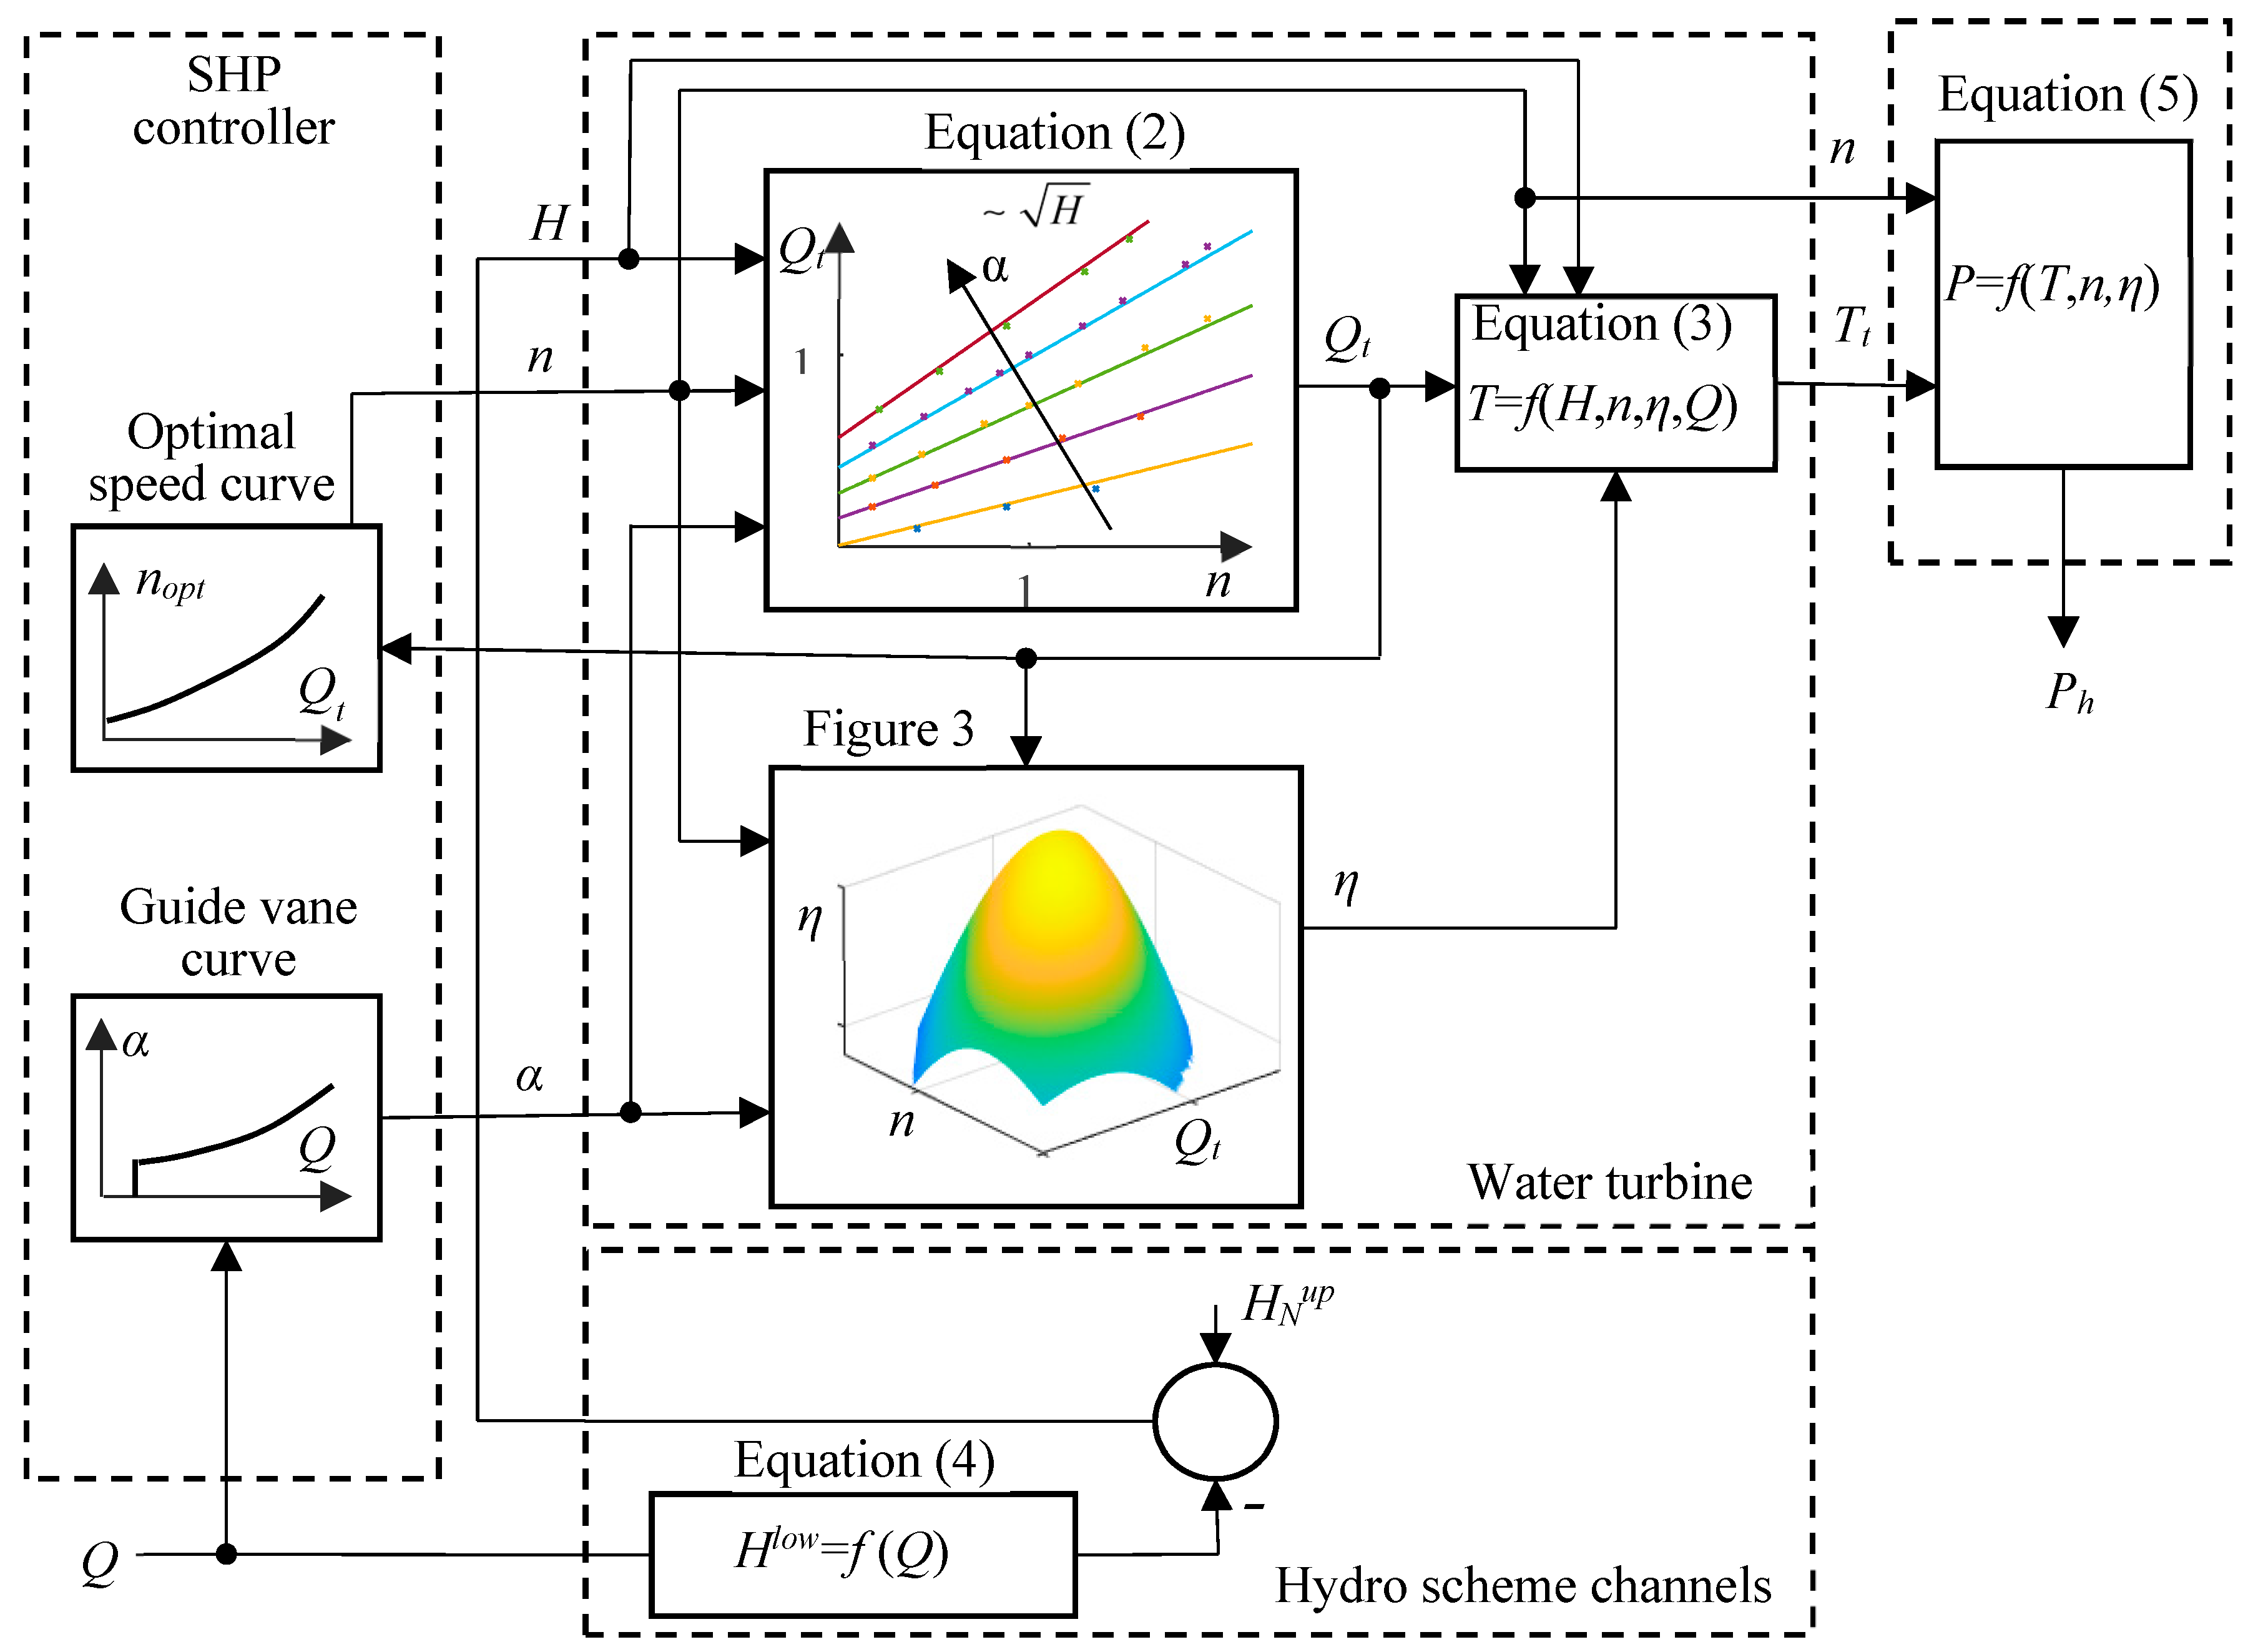
This characteristic allows the definition of the optimal operating curve composed of operating points (optimal speed nopt (Qt)) obtained at η (nopt, Qt) = maximum, which indicates the maximal efficiency for a given turbine discharge. The input signals of the turbine model are the guide vane angle α and water head H, while the output signals are turbine torque Tt and discharge Qt.
The normalised discharge can be approximated by a linear function of speed n, where the slope and intercept coefficients are functions of the guide vane angle. The influence of the guide vane angle on the water speed can be approximated by the polynomial of third degree [25]. The resulting discharge function must be additionally recalculated to the actual water head. As a result, the formula for turbine discharge takes the form (2). The accuracy of this formula was presented on the example of a real propeller turbine in [25]. The standard deviation of the relative error in percent was 1.2%, which corresponds to the measurement accuracy of the ultrasonic flow meter.
Q t = H [ ( c 11 α 3 + c 12 α 2 + c 13 α ) n + c 21 α 3 + c 22 α 2 + c 23 α ]
The turbine torque is calculated from Formula (3).
T t = P t ω = P w η ω = 3 10 4 g Q t H η n π
where Pw is the theoretical power that can be obtained from the water, Pt is the turbine mechanical power, g is the gravitational acceleration (9.81 m/s2), and ω is the angular speed. The main problem in designing this model is the estimation of efficiency function, which is dependent on many material and dimensional parameters of the turbine. The efficiency function determines the model accuracy, and thus, it needs to be accurately estimated. It is very important to obtain an evenly distributed estimation error on the speed-discharge plane. As reported in [25], good results can be obtained using the multi-layer perceptron (MLP) of a neural network. The best approximation properties of non-linear functions are usually achieved with a sigmoidal activation function in the hidden layer and a linear function in the output layer (Figure 3). The network inputs are the guide vane angle, discharge, and turbine speed, while the output is the turbine efficiency. The mean absolute error (MAE) of the learned network has to be similar to the uncertainty of the efficiency, which is usually approximately 1.5% [26]. A high MAE leads to model inaccuracy, but the MAE should not be too low to avoid the problem of overfitting (good fit on training points but poor generalisation). The presented model based on the hill diagram is useful in practice because this diagram can be taken from the model acceptance test (according to IEC 60193) during the turbine design process or identified for a real hydropower plant [26].
The model of the hydro scheme channels needs to include the changes in water level depending on the river flow. The development of hydropower project requires water permits to prevent any negative impacts on the river wildlife, ecosystem, and water level variations. The water permit for run-of-the-river power plants usually specifies the maximum upper water (damming) level. In order to obtain the highest possible energy production, this parameter is usually kept at the maximum value. Therefore, the assumption of constant upper water level for run-of-the-river schemes was made. If the river flow exceeds the turbine discharge and water level reaches the nominal value H N u p , the surplus water volume bypasses the hydropower plant via the spillway gates. This primarily affects the change in the tailrace water level (Figure 4), and thus the water head ( H = H u p H l o w ).
The tailrace water level dependency of the turbine discharge Qt and unused water volume Qu can be estimated using the stage-discharge relation of open channels [27]. Many rivers or natural and artificial channels are trapezoidal. Therefore, the cross-sections of natural watercourse channels are often approximated by this shape. The trapezoidal cross-section was therefore selected as the most common, while any shape can be used in the proposed model. The level of the head depending on the river flow Q can be estimated using the equation for a straight-line rating curve on logarithmic plotting, where β is the slope of the rating curve (4).
Q = K r ( H l o w ) β H l o w = ( Q K r ) 1 β ,   where   K r = ( H f l o o d ) β Q N , β = { 2 f o r H l o w H f l o o d 3 f o r H l o w > H f l o o d
In natural open trapezoidal channels, this curve will almost always have a slope of 2 or greater. The existing river flood plain changes the cross section and results in a slope value higher than 2 (e.g., 3) above the bankfull level Hflood.
The SHP needs to be controlled depending on the river flow and turbine parameters. In a real SHP, this task is split into two regulators. The guide vane governor adjusts the guide vanes depending on the actual river flow in order to keep the upper water level constant. The main aim of the second controller is to provide maximal SHP efficiency under different operating conditions. In classic solutions (a Kaplan turbine operating at constant speed), this controller adjusts the position of the turbine blades. In the presented solution, RESs and batteries are connected through the power electronic converter, which allows simplification of the turbine to be single-regulated (usually with a guide vanes governor) and to provide high efficiency using variable speed operation [28,29]. Thus, this controller adjusts the turbine speed depending on the turbine operating conditions. In a real SHP, the guide vane governor and optimal speed controller are closed loop PI-type regulators. Steady state analysis simplifies them into functions (optimal speed curve nopt (Qt), guide vane curve α (Qt)) that can be defined based on the hill diagram (Figure 2).
The power generated by the SHP can be calculated from the turbine speed and torque. Additionally, the efficiency of the generator and power electronic converter ηg should be included in calculations (5). The proposed SHP model allows the very accurate calculation of the efficiency of the generator and inverter in the form of an efficiency map.
P = T t ω η g = T t n π 30 η g
The run-of-the-river hydropower plant model suitable for variable-speed operation under changeable hydrological conditions is presented in Figure 5.

2.3. Energy Management Technique

The main functions of the run-of-the-river hydro/PV/battery hybrid system are the maximal production of electrical energy and to serve the local loads. This means that the system efficiency should be maximal for any given operational conditions. Therefore, PV systems should be controlled by the MPPT unit, and the hydropower plant should operate according to its optimal operating curve. The energy produced can be matched to the load demand by proper sizing of the hydro, PV, and battery as well as the management technique of the battery energy flow control.
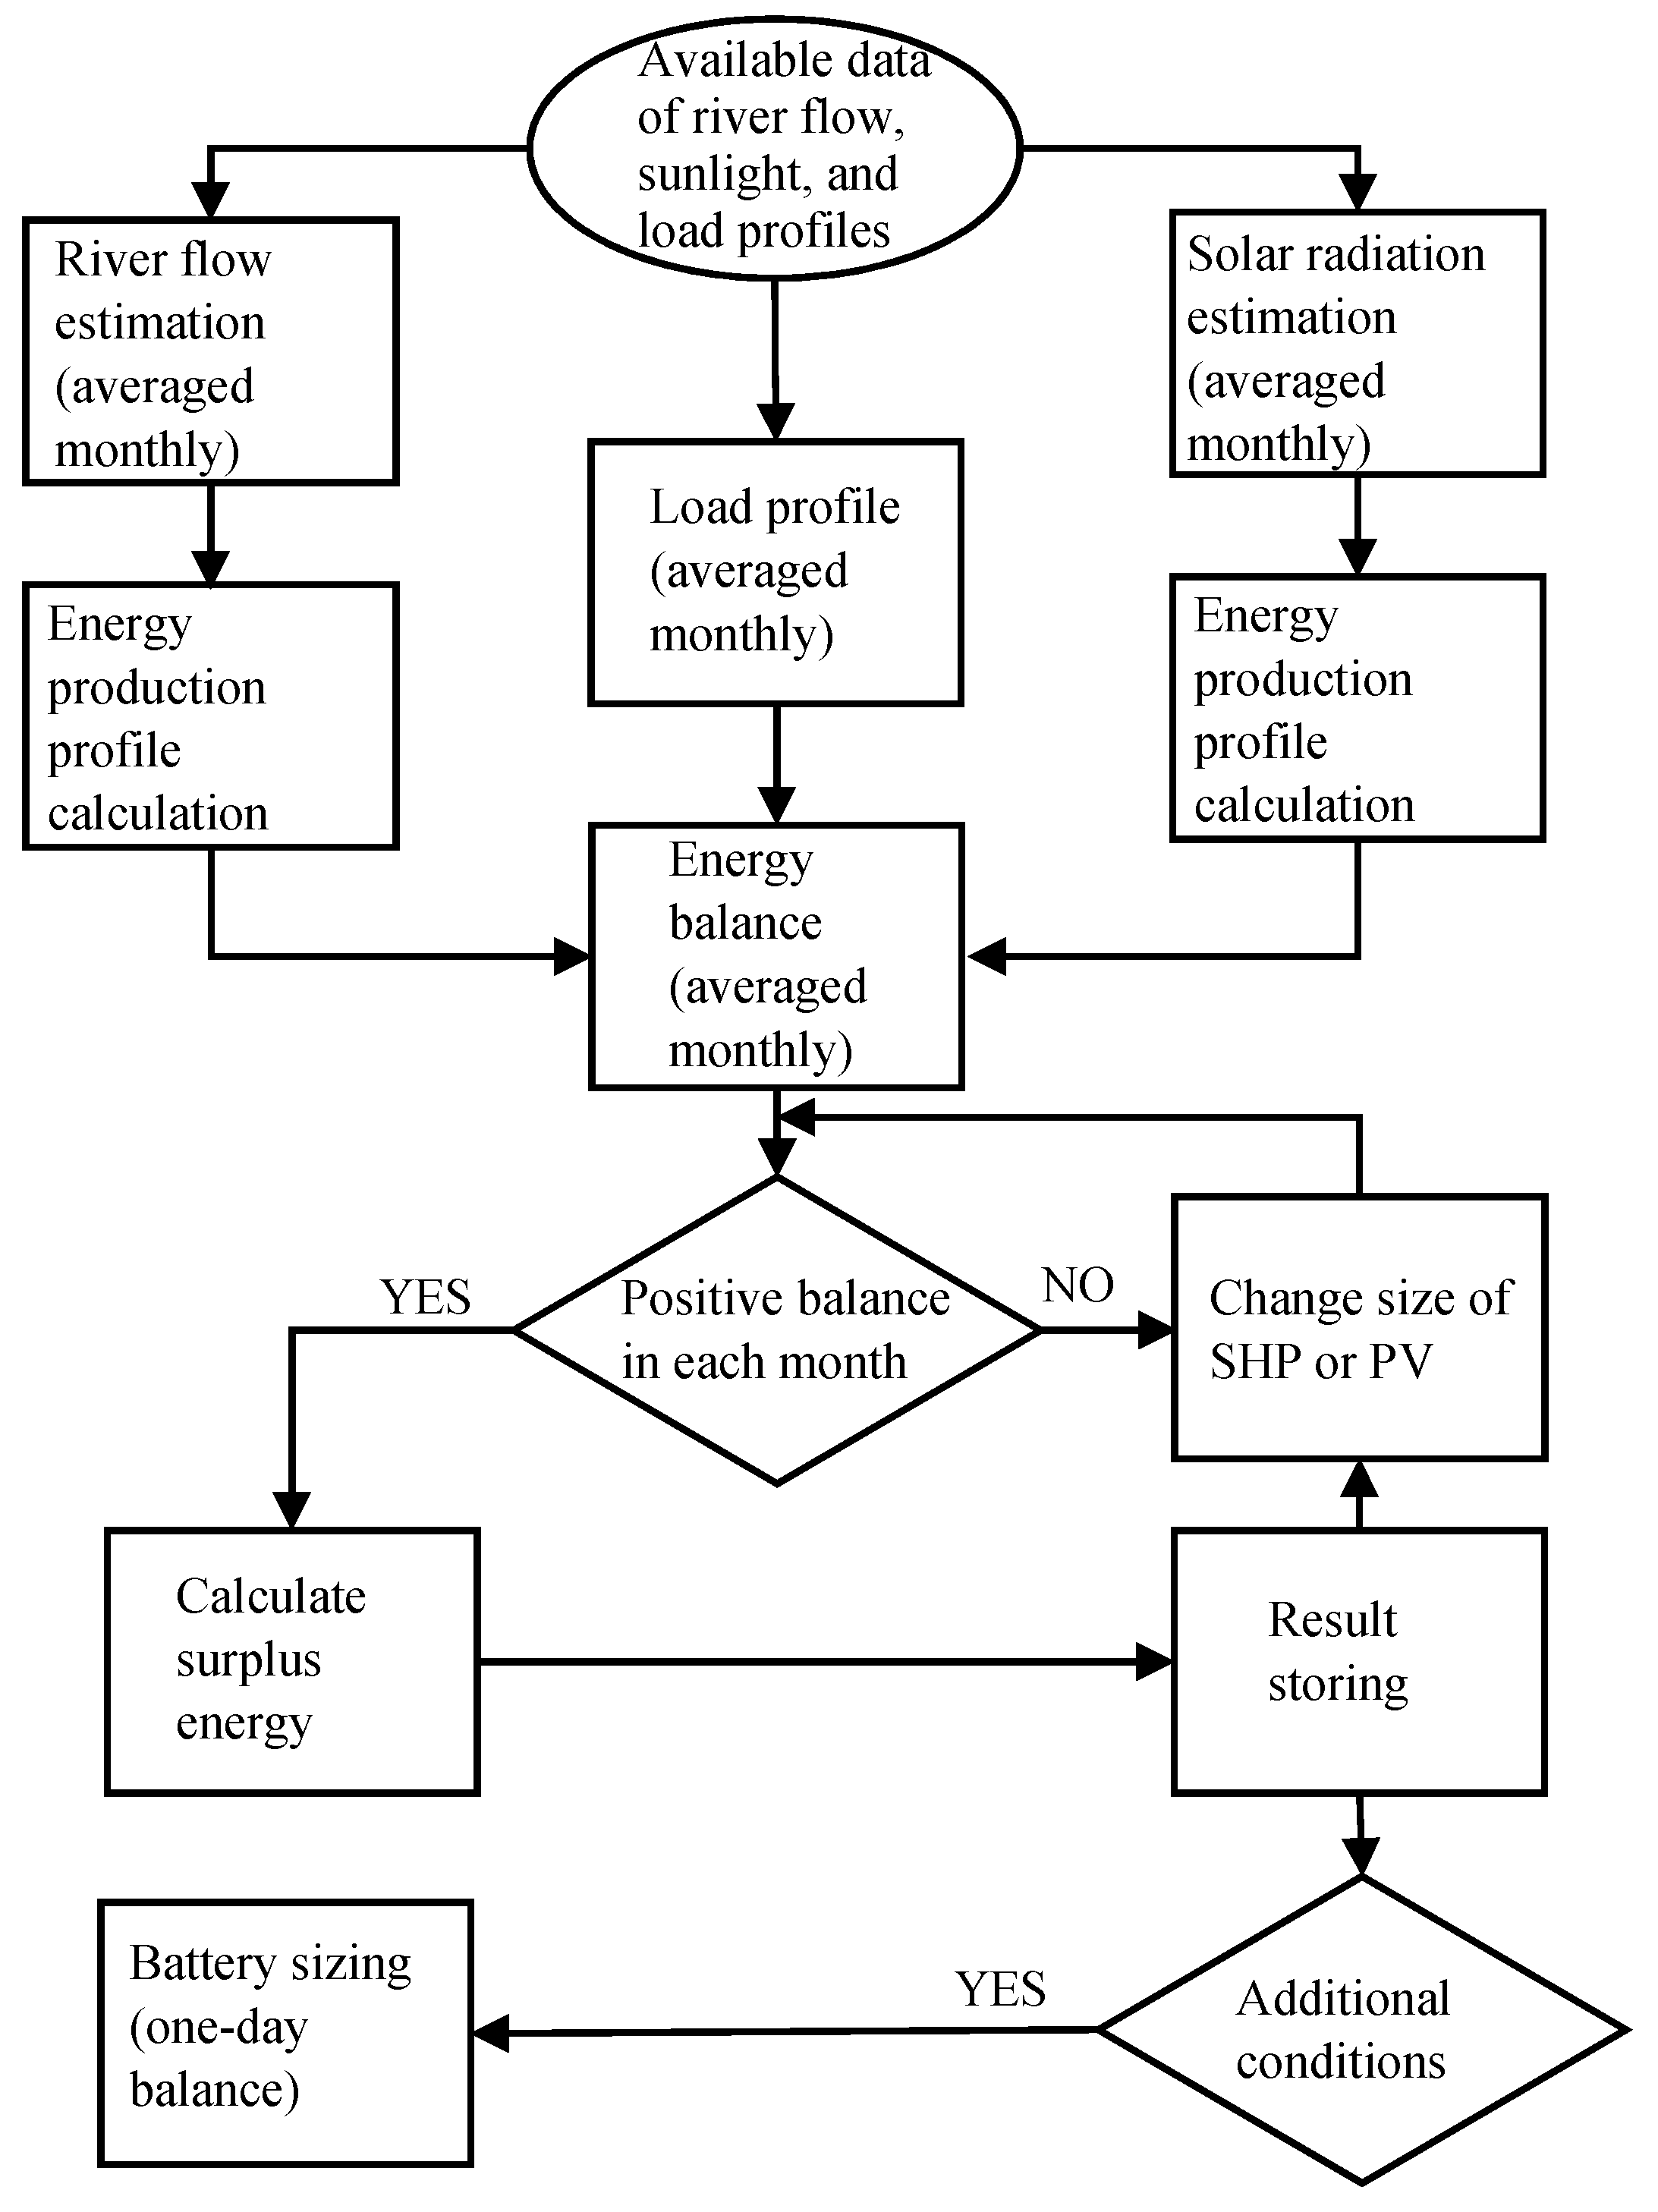
The sizing algorithm for the RESs and battery is presented in Figure 6. The input data for the algorithm are the monthly profiles of the river flow, solar radiation, and load demand. The solar radiation data and energy profile of PV systems are freely available, e.g., from the Photovoltaic Geographical Information System (PVGIS) that covers locations in Europe and Africa, as well as large part of Asia and America. The load demand is usually also easy to obtain, e.g., from design data or measurements.
The biggest problem is obtaining reliable river flow data in a given location. This can be provided by the national institutes of water management based on the observations of discharge over a long period in a given location and hydrology estimations. The river flow profile can be used to estimate the hydro power profile. The power of the run-of-the-river hydropower plant is calculated using the model presented in Section 2.2. The hydro and PV sizing are based on the system energy balance. The necessary condition of the hybrid system control is that the sum of PV and hydro energy (averaged over a month) covers the load demand. A two-dimensional set (with hydro and PV sizes as coordinates) of positive balance results with calculated surplus energy are stored. The other conditions and limitations may vary depending on the system requirements: minimal surplus energy, limited hydro power, cost effective optimization, and other variables. As a result, the hydro and PV sizes can be obtained.
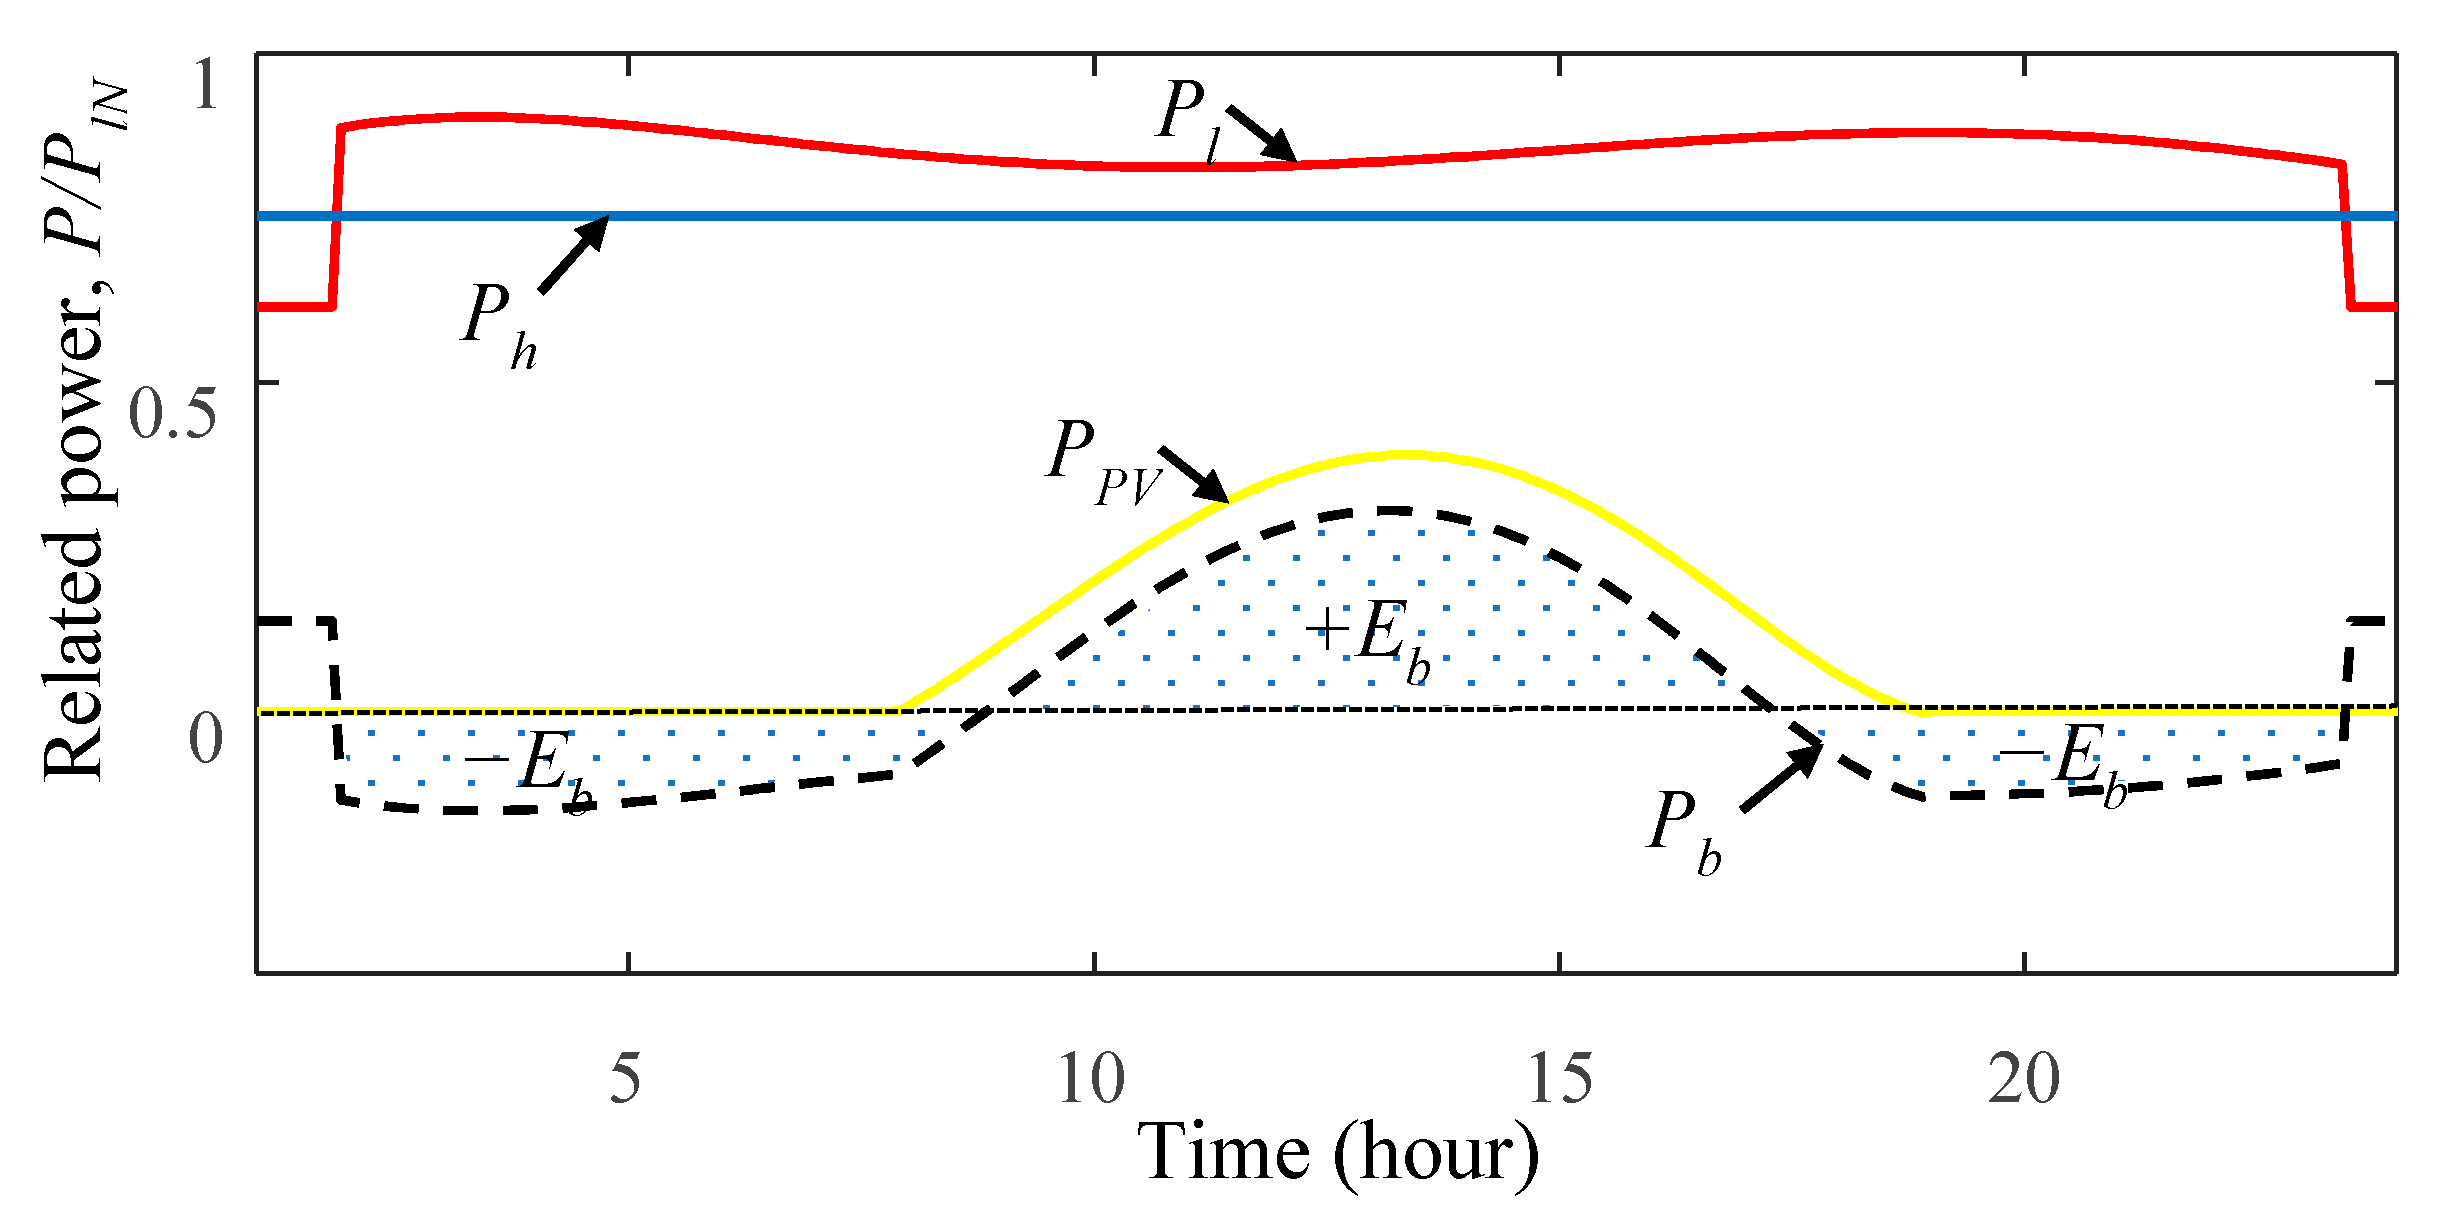
The battery can be sized based on the hourly characteristics of the water flow, sunlight, and load profile. Usually, river water flow is quite stable, and hourly fluctuations are insignificant, except for mountain rivers, intense rains, or floods. Therefore, the water flow in a one-day range can be assumed to be constant. The hourly variability of solar radiation can be estimated using database models (e.g., PVGIS). A battery is used to reduce the hourly fluctuations of the PV in the one-day range, and its size depends on the energy load demand. The choice of the day to be analysed depends on the surplus energy values during the year and additional conditions. The day chosen for analysis should be the one that gives the lowest surplus energy. This day requires the highest energy from the battery to cover the energy deficiency during the day. The hourly power profiles of hydro (Ph), PV (PPV), and load (Pl) are presented in Figure 7.
The battery power results from the system power balance ( P b = P h + P P V P l ). The battery capacity Cb (kWh) is calculated from the battery energy demand for one day Eb (kWh), depth of discharge DOD (%), and battery roundtrip efficiency ηb.
C b = E b η b D O D
The battery size is calculated based on a typical day of the given month; thus, a surplus or deficiency of energy can occur. It is assumed that this unbalanced energy will be covered by the power grid (on-grid mode).

3. Case Study

3.1. System Description

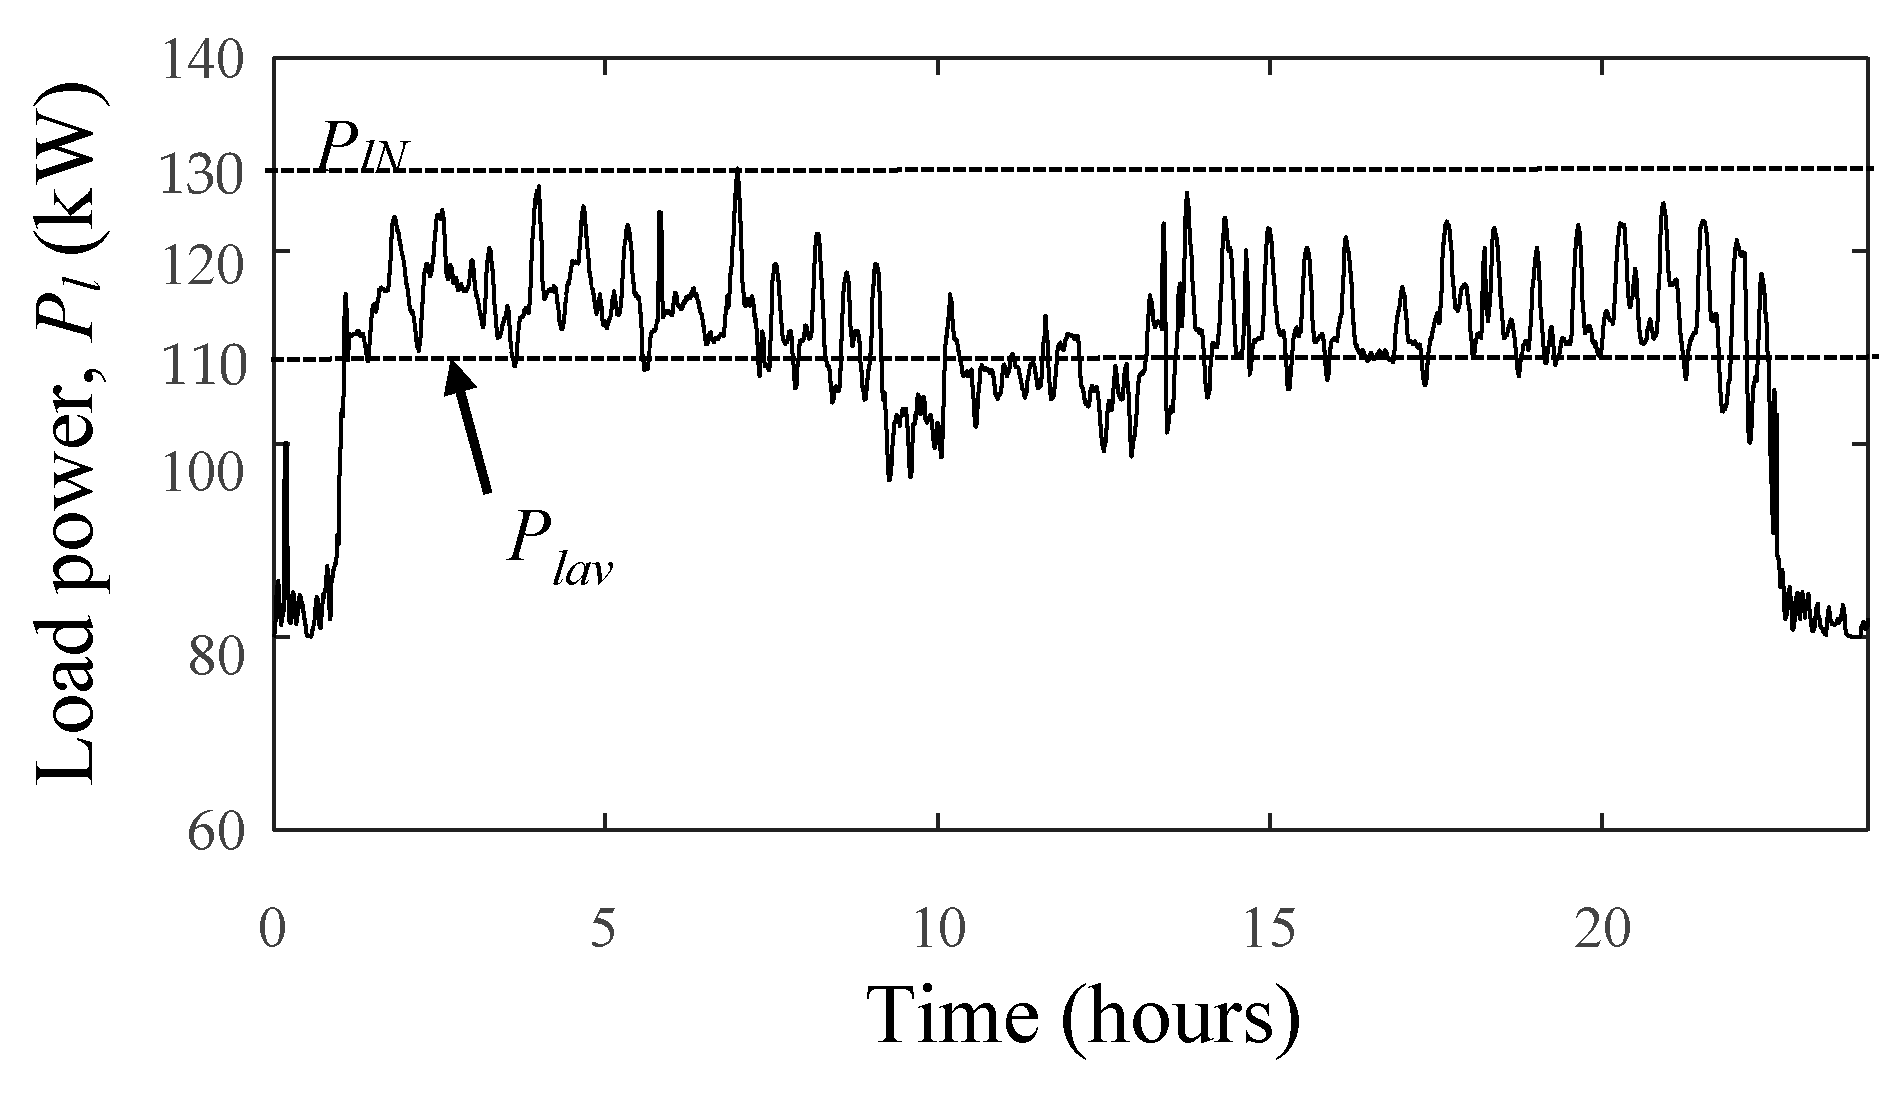
To verify the proposed SHP model correctness and energy management technique effectiveness, a one-year operation of a hybrid system was analysed. The river flow, load profile, and hydropower plant parameters were taken from a real system located in Nysa (Poland). The SHP of 150 kW contains two hydro-sets with propeller turbines operating at variable speed [21]. This plant is connected to a power grid and additionally to a consumer (load), which is the water intake and pumping station for Nysa City (Figure 8). The power consumption of the load depends on the filter process and the water supply system. Owing to the large number of water pumps working periodically, the power demand varies from 90 kW up to a nominal value (PlN) of 130 kW with a daily average power consumption (Plav) of 110 kW (Figure 9). As presented in [22], the large difference between the power profile (monthly profile as well as hourly profile) of the SHP and load demand requires a large quantity of power from the power grid to balance the system. Here, it was proposed to expand this system by adding a battery and PV (Figure 8) in order to cover the energy demand of the load (red colour).
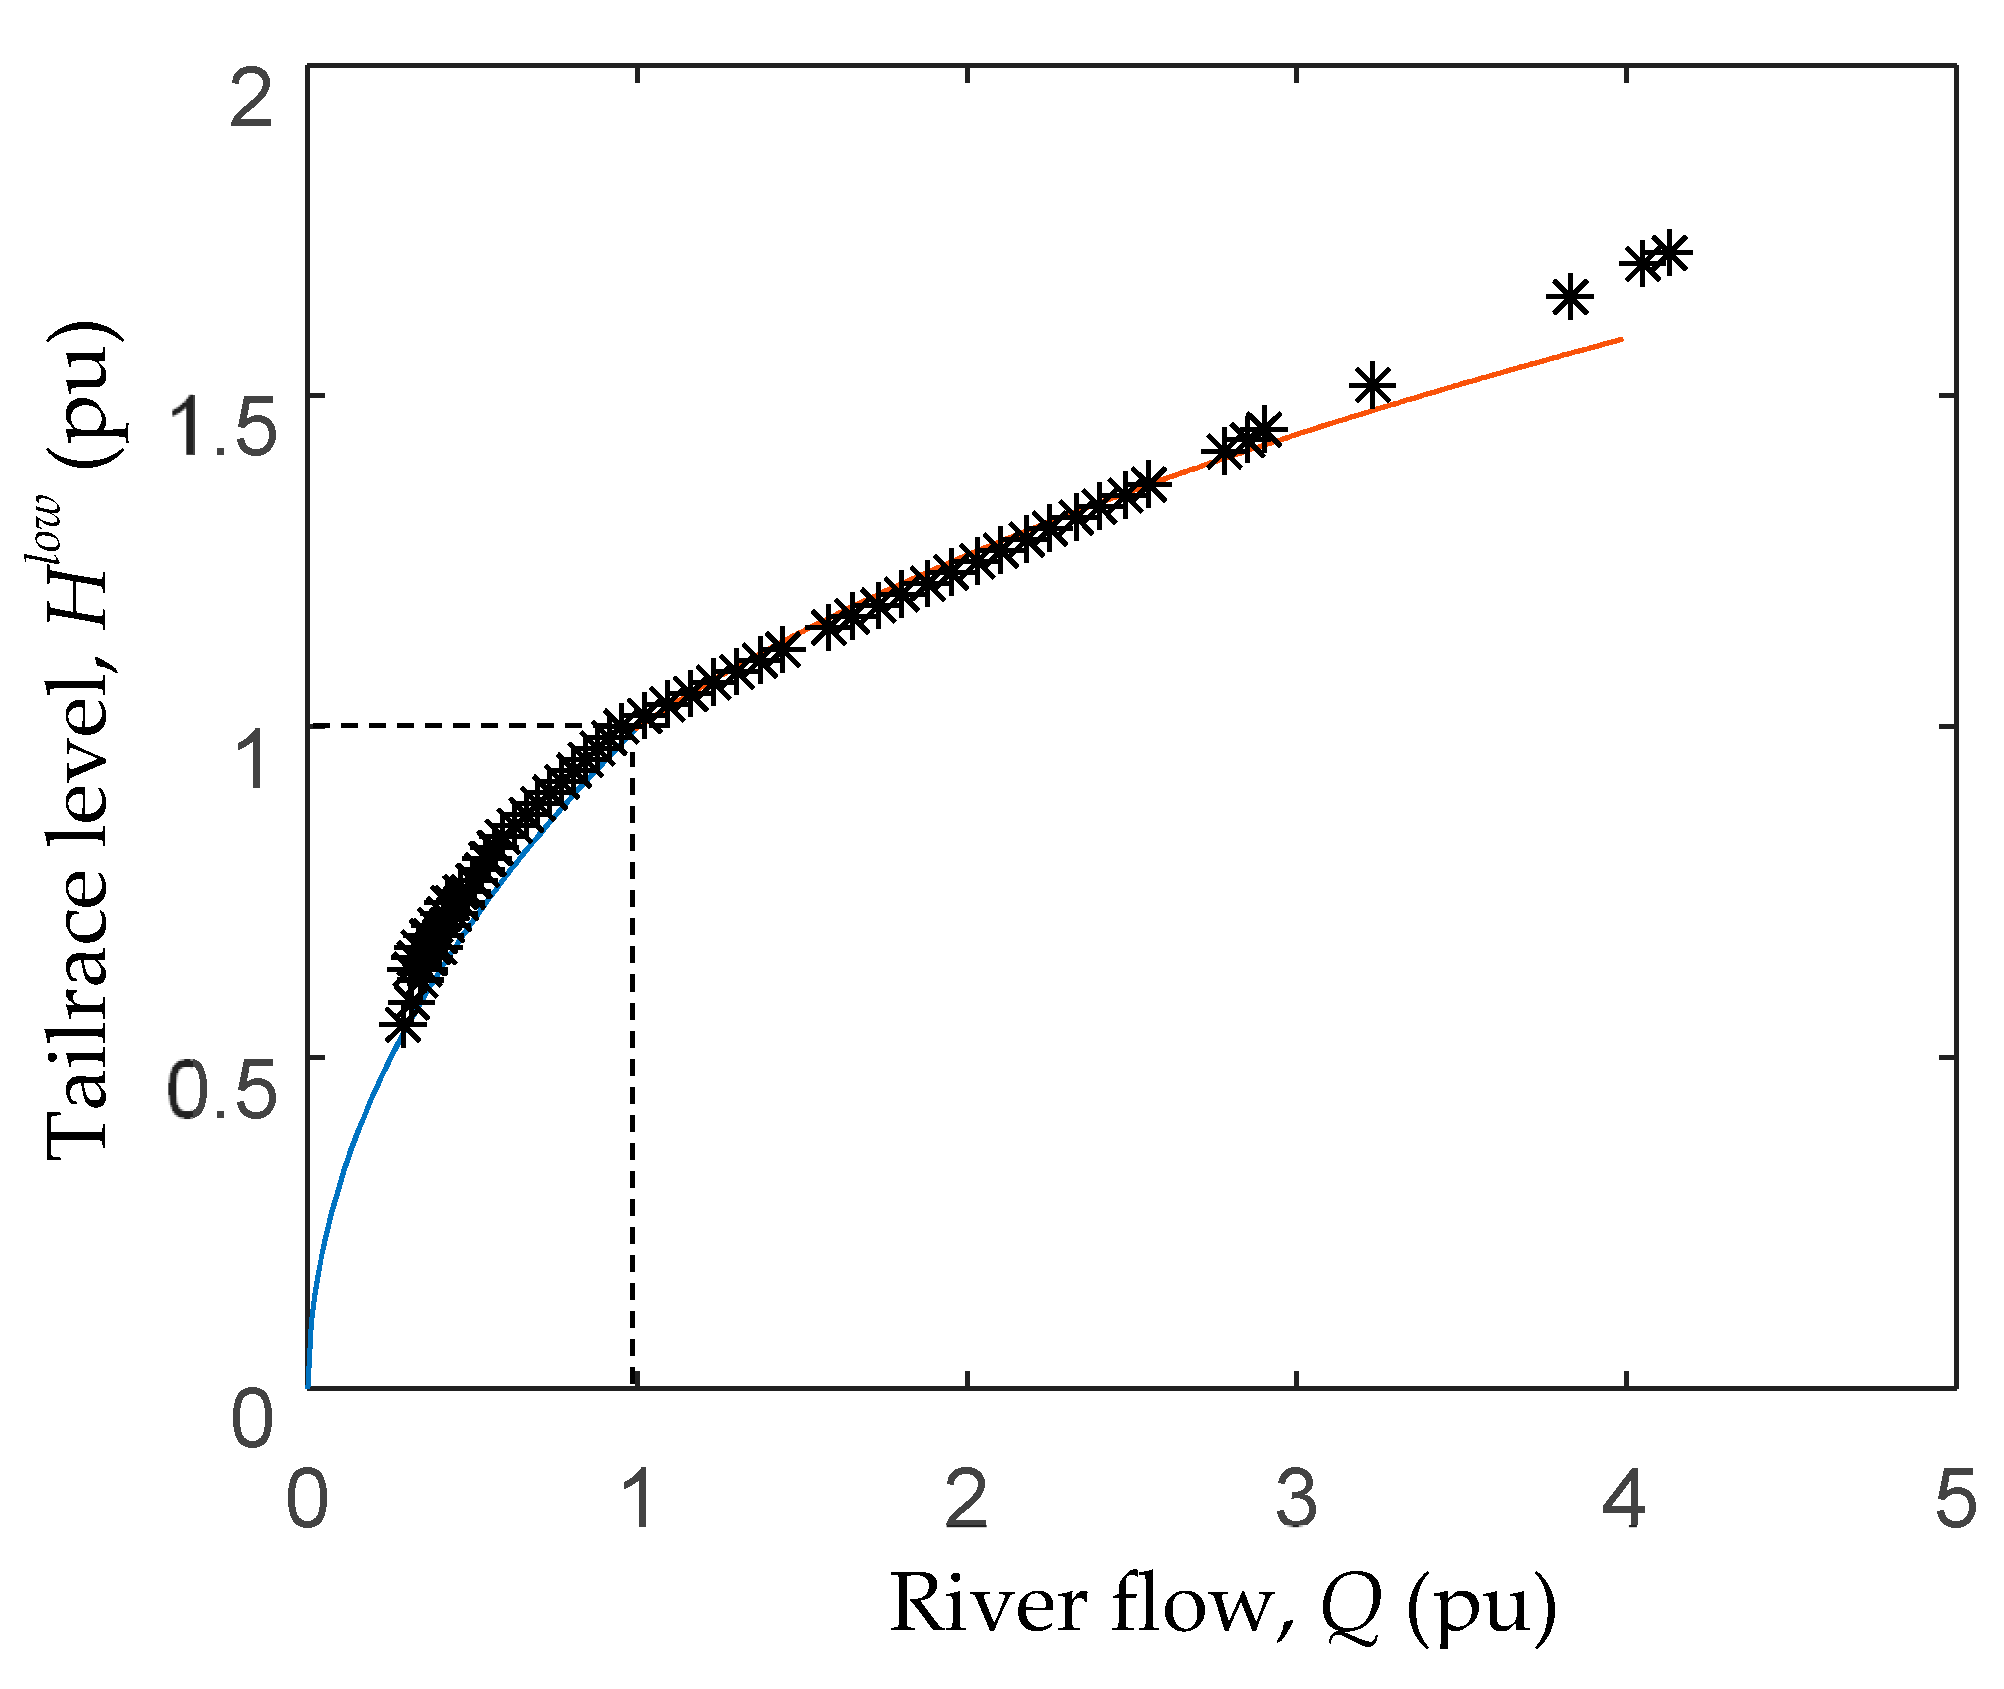
The location of the hydropower plant and the consumer is shown in Figure 10. The map also shows the water level measurement point (Głuchołazy hydrological station) of the Institute of Meteorology and Water Management—National Research Institute (IMGW-PIB). Data from this measurement point located 500 m below the SHP was used to verify the trapezoidal cross-section of the river flume defined by Formula (4). The nominal river flow is 10 m3/s and the bankfull level is 1.4 m for the measuring point. Average daily river flow values from 2013 were compared with the model level-discharge relation (Figure 11). The verification showed the satisfactory accuracy of the model. The model has a mean square error (MSE) of 0.3%, while the greatest inaccuracies relate to flows above 3 pu.
The second assumption that needs to be checked is the ability of the SHP control system to maintain a constant upper water level. For this reason, the time waveforms of water levels and the total SHP power in a twenty-month period have been presented (Figure 12). The upper water level was kept close to the target value. The fluctuation of the level was ±1% during a normal operation. In situations where the river flow is greater than the turbine capacity, the water levels increase but at different rates (Figure 12a). The maximum registered deviation of upper level in the analysed period was 5% (Figure 12b).
The presented results confirm the correctness of the assumptions made for the cross-section of the river flume and the upper water level for the run-of-the-river SHP model.

3.2. PV and Battery Sizing

PV and battery sizes were calculated based on the monthly profiles of the river flow, solar radiation, and load demand. To show the PV/hydro complementarity in Central Europe, the average solar radiation and water flow of Poland were used (Figure 13). Per unit values of solar radiation and flow with an average base quantity were analysed. The 10-year average monthly solar radiation was calculated from the PVGIS-CMSAF database. The average river flow was calculated by taking the flow for the two largest rivers in Poland (Vistula and Odra rivers) in the period 1999–2018 (based on the IMGW-PIB data) [30]. The lowest average monthly flow occurred from July to October and the highest from February to May. However, river flow is less predictable than solar radiation, taking into account the average monthly values over the years, which results in a significant difference between maximal and minimal values. Moreover, small rivers can be more unpredictable and unstable depending on local hydrological conditions. Despite this, the PV/hydro energy sources presented a complementarity on a monthly basis.
The power of the run-of-the-river hydropower plant was calculated based on the flow profile presented in Figure 13 using the model presented in Section 2.2. The necessary condition of the hybrid system control was that the sum of PV and hydro energy Ehs (averaged within the month) covered the load demand. The two-dimensional set (with hydro and PV sizes as coordinates) of annual surplus energy Ehs related to the average load energy El is presented in Figure 14.
The first additional condition was that the PV size was minimal. Moreover, it was assumed that the SHP capacity could be increased up to 110% of its current capacity, e.g., by modernization of energy conversions system (turbine, generator, and other components). These conditions were fulfilled by the configuration of 60% PV size and 110% SHP size related to the nominal load PlN. This configuration provides annual energy equal to 117% of the annual demanded load energy Pl. Next, using this configuration, the surplus monthly energy was analysed in order to select the month that had the lowest value of energy surplus (Figure 15). From the figure, it can be seen that in October the battery energy is needed most.
Thus, a typical day in October was used to size the battery. Figure 16 presents the hourly power of the load, PV, SHP, and battery. The battery surplus and deficiency energy are balanced daily. The battery energy is equal to 9.5% (251 kWh) of the average daily load energy (2640 kWh).
Taking the nominal parameters of the consumer (nominal power PlN = 130 kW, average daily power Plav =110 kW), the resulting SHP nominal power was 143 kW, the PV power was 78 kW, and the battery capacity was determined to be 422 kWh (assuming DOD = 70% and ηb = 85%).

3.3. One-Year Analysis of Hybrid System

The hydro/PV and battery sizes were calculated using monthly river flow averaged over 20 years. However, the flow of a specific river can differ significantly from the averaged value. Therefore, in this chapter, the hybrid system presented above has been analysed for one year of operation based on real flow data with one-day resolution.
The river flow fluctuations (per unit) during 2013 measured in the SHP location are presented in Figure 17a. Additionally, Figure 17c presents the day-to-day flow changes, and Figure 17d shows the absolute values sorted in descending order. From this figure, it can be seen that the per unit day-to-day flow changes exceeded 10% only 25 times during the year, which confirms the stable nature of the water flow. An important issue is the proper estimation of the real energy production of the power plant under different hydrological conditions. In most papers, the energy has been calculated using the river flow and nominal water head and nominal efficiency. This approach provides a large overestimation of the energy produced by the power plant, especially in low-head schemes, due to the limited turbine discharge, head, and efficiency variations (Figure 2). The hydro power plant can utilise the water volume limited by the turbine maximal discharge Qt. Furthermore, the tailrace level depends strongly on the actual river flow, which influences head H. In the case of high river flow (flood), the run-of-the-river power plant is often not operating. These factors are presented in Figure 17a,b. In the presented example, the real energy production made up 70% of the energy calculated using the simplified standard method.
From the above, it follows that during high river flows, the hybrid system would not produce energy from RESs (clouds would limit sunlight while the run-of-the-river would not operate due to the very low head). On-grid operation would be necessary because a long period of low energy production could occur and oversizing the battery would increase system costs significantly.
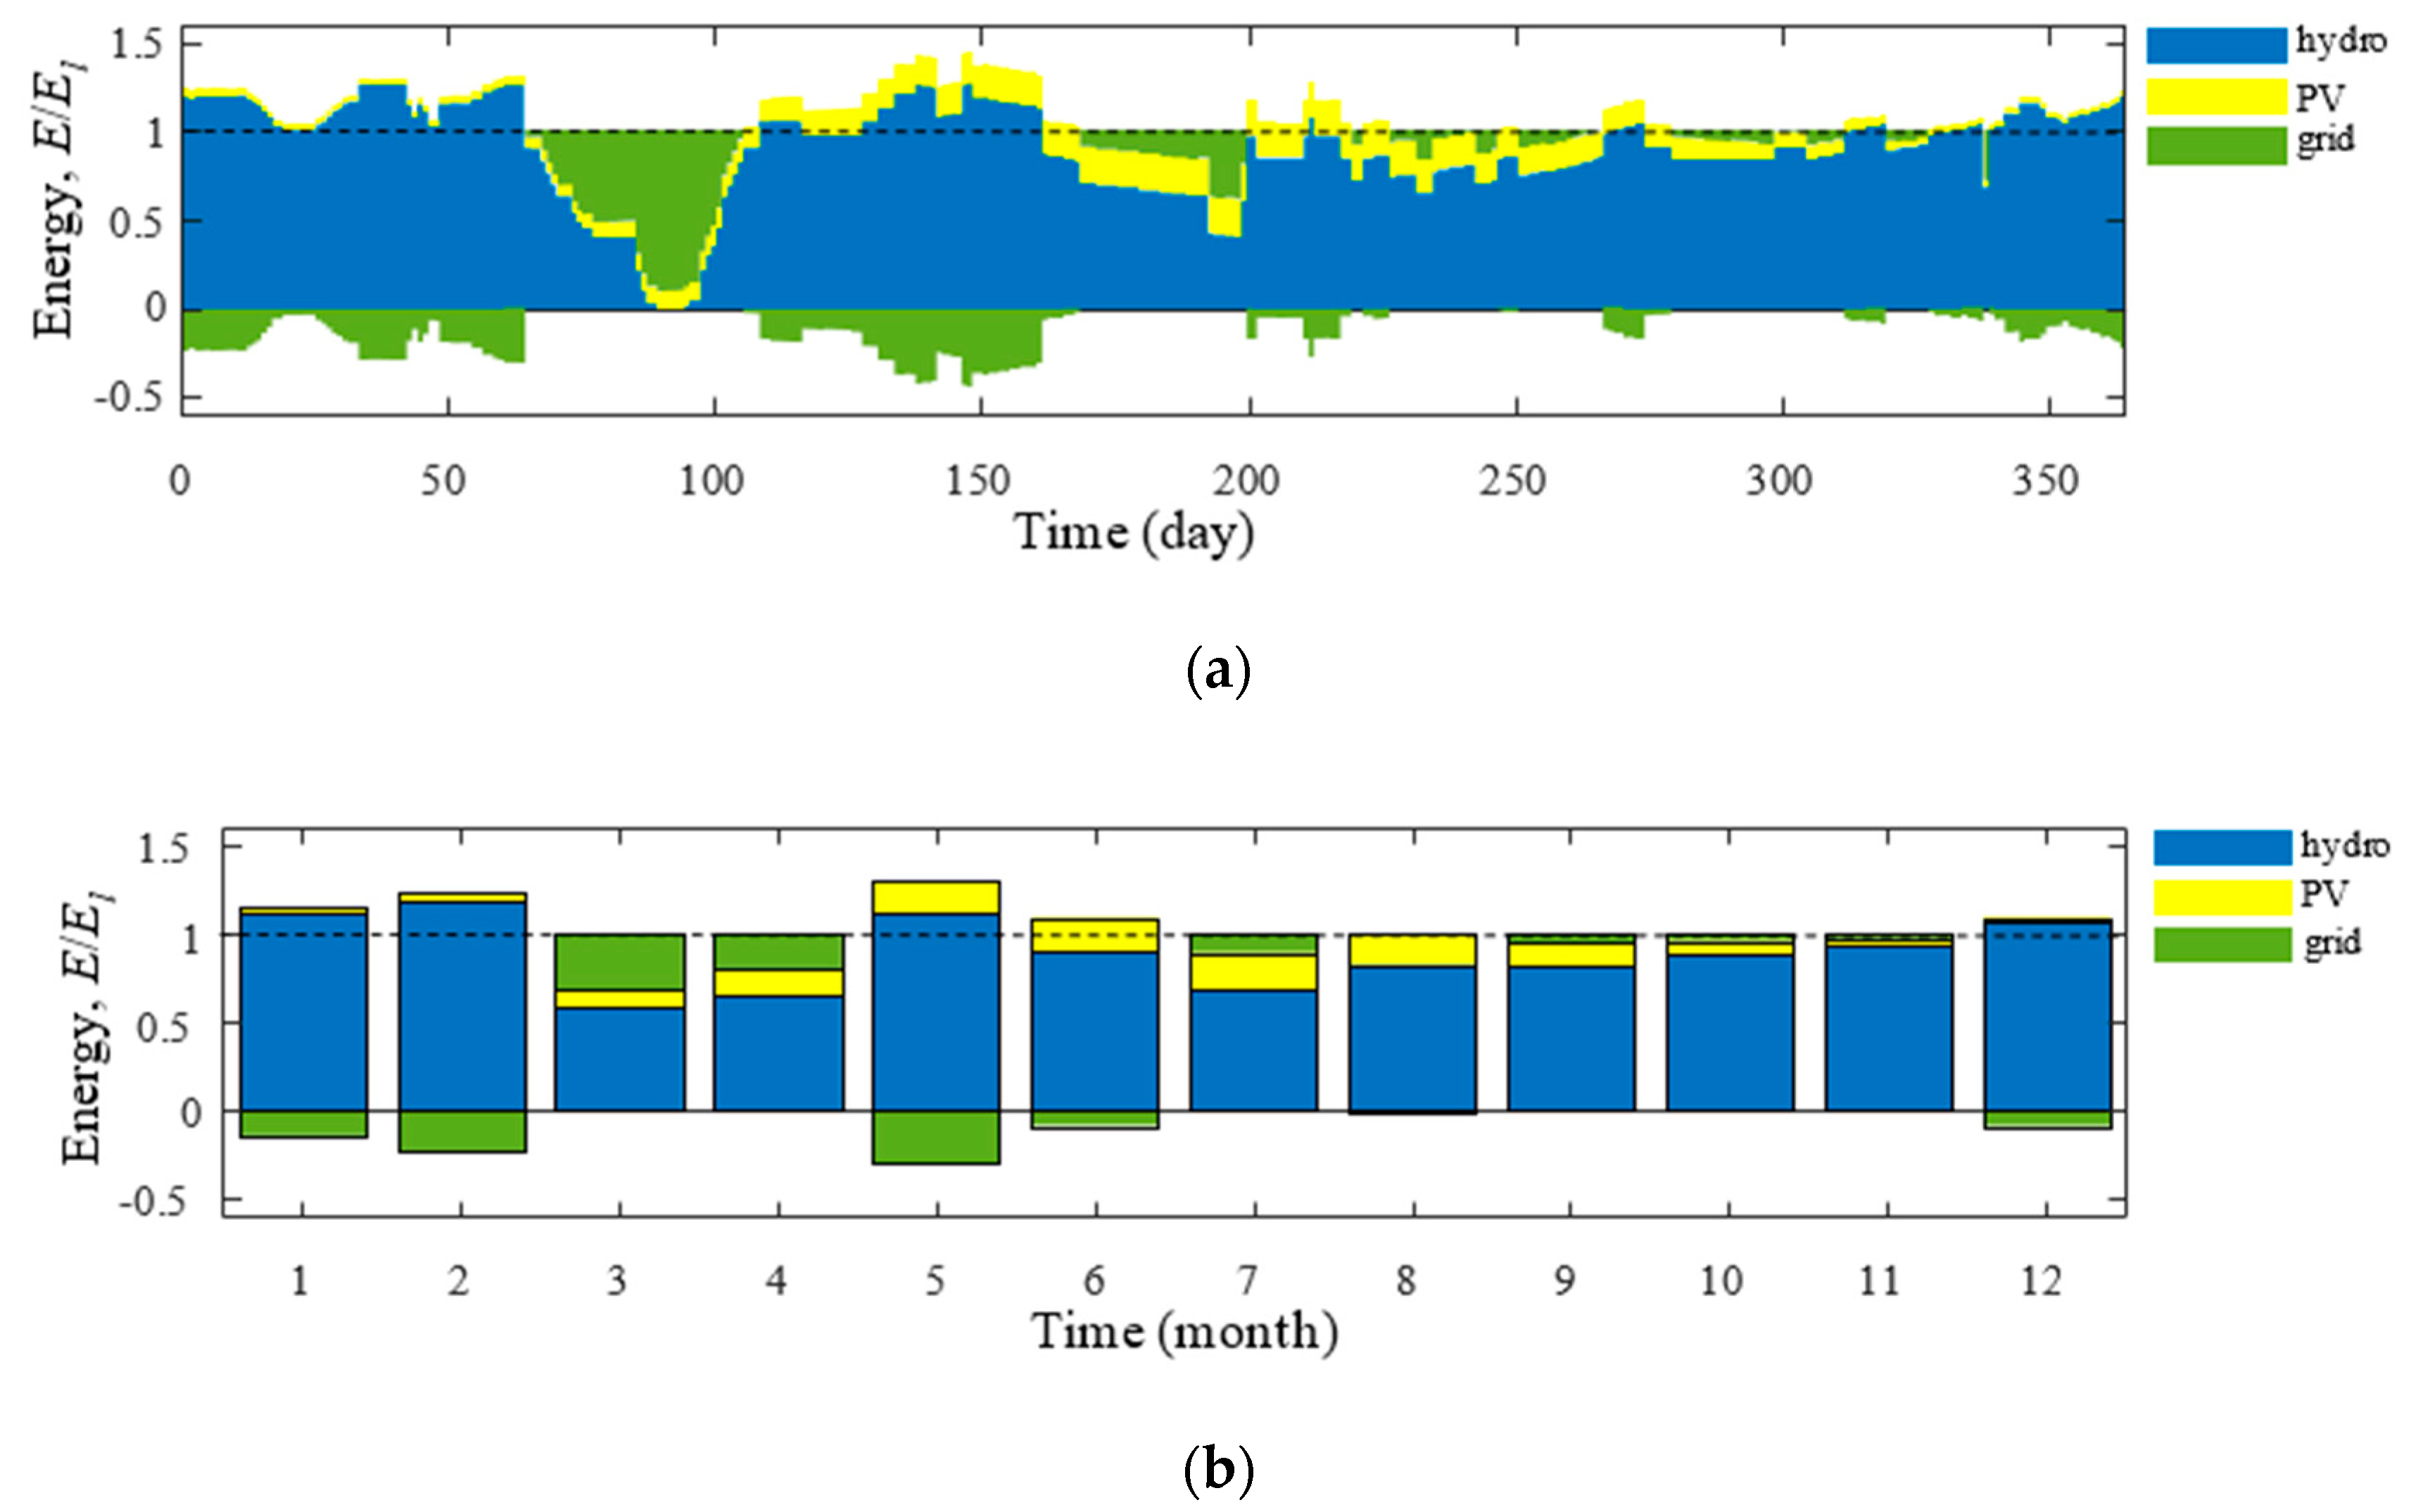
The daily energy balance of the hybrid system (Figure 18a) has been calculated based on the hydro power profile (Figure 17a). Energy deficiency is visible especially during high river flow. The yearly energy taken from the power grid is 8.3% of El (80 MWh), while the hybrid system surplus energy has been estimated at 9.5% of El (91.5 MWh). To show the influence of the averaging period on the energy balance results, the monthly balance is also shown in Figure 18b. Here, the yearly energy taken from the power grid decreases to 6.2%, while the hybrid system surplus energy is also decreased to 7%. This means that by increasing the average span of time from day to month for balance calculations, the deficiency and surplus energy were underestimated by 25%. By increasing the averaging time from day to month, information about daily energy balances is lost. The battery size is optimized for one day, so positive and negative balances can occur within one month. The monthly energy balance is the sum of daily balances according to the averaging period, which in the case of high variability of results (surpluses and shortages) causes a large error. Such a situation takes place in the presented example in the months from June to November. In the case of greater variability of daily balances, the underestimation of the surplus and deficiency of energy may be much greater than the 25% obtained in this example. This example shows that river flow precision and averaging time used in calculations can significantly influence the energy balance results.
The energy balance curve (Figure 18) shows a period of several days in which the production of the system does not exceed 10% of the demand. This confirms that the run-of-the-river SHP is a source of energy with very high production uncertainty and its use in the off-grid operation mode would require a large battery bank or, e.g., a diesel generator.

4. Conclusions

There are many existing run-of-the-river SHPs that can serve local loads, which can increase SHP profitability and improve local grid stability. An interesting solution is to combine them with PV and battery, thus creating a hybrid system. The important issue is proper sizing of the RESs and battery to provide energy suitable to local load demand. In order to optimise the system economy (limit the size of the battery), on-grid operation is assumed in the case of energy deficiency or surplus.
The sizing calculations should be based on proper mathematical models. The low hydro schemes are especially affected by hydrological conditions; thus, in this paper, a dedicated run-of-the-river SHP model was developed that includes efficiency fluctuations and water head variations. The presented model is dedicated to the analysis of the steady state of the SHP. Taking into account the dynamics of hydrological condition changes, with the exception of flood states, the analysis of the steady-state is sufficient (as discussed in Section 3.3 and presented in Figure 17c). Another assumption is the constant upper water level and the trapezoidal cross-section of the river flume. They mainly affect the water head, which affects the generated power. These assumptions were verified on a real SHP, which confirmed their correctness. The introduced assumptions are appropriate for low-head run-of-the-river SHPs. However, the modular structure of the model allows taking into account additional dependencies, increasing the area of the model’s applicability. The required input data, which can be obtained from measurements or model tests, ensures high accuracy and speed of calculations. The model universality provides different turbine types based on the hill diagram, easy implementation of the SHP control techniques, and possibility of including the generator and inverter efficiency in the form of an efficiency map. As presented herein, the calculations using the common simplified method can result in a 43% overestimation of energy produced by the SHP.
The second important problem considered in this study is the influence of the flow averaging time on the energy balance results. The system size was calculated using 20-year data in monthly resolution with the assumption of covering load demand. It should be emphasised that river flow can differ significantly depending on the year, localization, and hydrological system parameters. An example of a one-year analysis based on real flow data showed that the averaging period has a significant influence on the energy balance results. Increasing the averaging time from day to month for balance calculations causes the deficiency and surplus energy to be underestimated by 25%.
The unpredictability of river flow during the year in a run-of-the-river hydropower plant with no water storage possibilities necessitates the on-grid operation of the hybrid system. The energy imbalance can be eliminated using a battery bank; however, due to the system economy (battery capacity), the one-day balancing period was analysed.
It follows that, despite the hourly stability, the river is highly uncertain over months and years, which significantly affects hydropower power production. This should be taken into account when sizing the RESs of the hybrid system, especially with the run-of-the-river schemes, but also with reservoir hydro systems.

Author Contributions

Conceptualization, D.B. and D.C.; methodology, D.B.; software, D.B.; validation, D.B. and D.C.; formal analysis, D.B.; investigation, D.B.; resources, D.B.; data curation, D.B.; writing—original draft preparation, D.B.; writing—review and editing, A.K.; visualization, D.B.; supervision, D.B.; project administration, D.B.; funding acquisition, D.B. All authors have read and agreed to the published version of the manuscript.

Funding

This research was funded by the Polish Ministry of Science and Higher Education and performed by the Department of Electrical Engineering (E-2) of Cracow University of Technology.

Conflicts of Interest

The authors declare no conflict of interest.

References

  1. REN21. Renewables 2019 Global Status Report; REN21 Secretariat: Paris, France, 2019. [Google Scholar]
  2. Sawle, Y.; Gupta, S.; Bohre, A.K. Review of hybrid renewable energy systems with comparative analysis of off-grid hybrid system. Renew. Sustain. Energy Rev. 2018, 81, 2217–2235. [Google Scholar] [CrossRef]
  3. Himri, Y.; Stambouli, A.B.; Draoui, B.; Himri, S. Techno-economical study of hybrid power system for a remote village in Algeria. Energy 2008, 33, 1128–1136. [Google Scholar] [CrossRef]
  4. Abdullah, M.O.; Yung, V.; Anyi, M.; Othman, A.; Hamid, K.A.; Tarawe, J. Review and comparison study of hybrid diesel/solar/hydro/fuel cell energy schemes for a rural ICT Telecenter. Energy 2010, 35, 639–646. [Google Scholar] [CrossRef]
  5. Obukhov, S.; Ibrahim, A.; Tolba, M.A.; El-Rifaie, A.M. Power Balance Management of an Autonomous Hybrid Energy System Based on the Dual-Energy Storage. Energies 2019, 12, 4690. [Google Scholar] [CrossRef] [Green Version]
  6. Javed, M.S.; Ma, T.; Jurasz, J.; Amin, M.Y. Solar and wind power generation systems with pumped hydro storage: Review and future perspectives. Renew. Energy 2019, 148, 176–192. [Google Scholar] [CrossRef]
  7. Kapsali, M.; Anagnostopoulos, J.; Kaldellis, J. Wind powered pumped-hydro storage systems for remote islands: A complete sensitivity analysis based on economic perspectives. Appl. Energy 2012, 99, 430–444. [Google Scholar] [CrossRef]
  8. Ghaisi, M.; Rahmani, M.; Gharghabi, P.; Zoghi, A.; Hosseinian, S.H. Scheduling a wind hydro-pumped-storage unit con-sidering the economical optimization. Am. J. Electr. Electron. Eng. 2017, 5, 16–22. [Google Scholar]
  9. Zhao, J.; Graves, K.; Wang, C.; Liao, G.; Yeh, C.-P. A hybrid electric/hydro storage solution for standalone photovoltaic applications in remote areas. In Proceedings of the 2012 IEEE Power and Energy Society General Meeting, San Diego, CA, USA, 22–26 July 2012; pp. 1–6. [Google Scholar] [CrossRef]
  10. Khare, V.; Nema, S.; Baredar, P. Solar–wind hybrid renewable energy system: A review. Renew. Sustain. Energy Rev. 2016, 58, 23–33. [Google Scholar] [CrossRef]
  11. Bhayo, B.A.; Al-Kayiem, H.H.; Gilani, S.I.; Ismail, F.B. Power management optimization of hybrid solar photovoltaic-battery integrated with pumped-hydro-storage system for standalone electricity generation. Energy Convers. Manag. 2020, 215, 112942. [Google Scholar] [CrossRef]
  12. Javed, M.S.; Zhong, D.; Ma, T.; Song, A.; Ahmed, S. Hybrid pumped hydro and battery storage for renewable energy based power supply system. Appl. Energy 2019, 257, 114026. [Google Scholar] [CrossRef]
  13. Zhang, Y.; Ma, C.; Lian, J.; Pang, X.; Qiao, Y.; Chaima, E. Optimal photovoltaic capacity of large-scale hydro-photovoltaic complementary systems considering electricity delivery demand and reservoir characteristics. Energy Convers. Manag. 2019, 195, 597–608. [Google Scholar] [CrossRef]
  14. Jurasz, J.; Ciapała, B. Integrating photovoltaics into energy systems by using a run-off-river power plant with pondage to smooth energy exchange with the power gird. Appl. Energy 2017, 198, 21–35. [Google Scholar] [CrossRef]
  15. Li, F.-F.; Qiu, J. Multi-objective optimization for integrated hydro–photovoltaic power system. Appl. Energy 2016, 167, 377–384. [Google Scholar] [CrossRef]
  16. Fo, F.A.D.; Beluco, A.; Rossini, E.G.; de Souza, J. Influence of Time Complementarity on Energy Storage through Batteries in Hydro PV Hybrid Energy System. Comput. Water Energy Environ. Eng. 2018, 07, 142–159. [Google Scholar] [CrossRef] [Green Version]
  17. Liu, Z.; Zhang, Z.; Zhuo, R.; Wang, X. Optimal operation of independent regional power grid with multiple wind-solar-hydro-battery power. Appl. Energy 2018, 235, 1541–1550. [Google Scholar] [CrossRef]
  18. Hoseinzadeh, S.; Ghasemi, M.H.; Heyns, S. Application of hybrid systems in solution of low power generation at hot seasons for micro hydro systems. Renew. Energy 2020, 160, 323–332. [Google Scholar] [CrossRef]
  19. Kittner, N.; Gheewala, S.H.; Kammen, D.M. Energy return on investment (EROI) of mini-hydro and solar PV systems designed for a mini-grid. Renew. Energy 2016, 99, 410–419. [Google Scholar] [CrossRef] [Green Version]
  20. Ye, L.; Sun, H.B.; Song, X.R.; Li, L.C. Dynamic modeling of a hybrid wind/solar/hydro microgrid in EMTP/ATP. Renew. Energy 2012, 39, 96–106. [Google Scholar] [CrossRef]
  21. Borkowski, D.; Wegiel, T. Small Hydropower Plant with Integrated Turbine-Generators Working at Variable Speed. IEEE Trans. Energy Convers. 2013, 28, 452–459. [Google Scholar] [CrossRef]
  22. Borkowski, D. Small Hydropower Plant as a Supplier for the Primary Energy Consumer. In Proceedings of the 16th International Scientific Conference on Electric Power Engineering, Kouty nad Desnou, Czech Republic, 20–22 May 2015; pp. 148–151, ISBN 978-1-4673-6787-5. [Google Scholar]
  23. Sayers, A.T. Hydraulic and Compressible Flow Turbomachines; Mcgraw-Hill: Berkshire, UK, 1990. [Google Scholar]
  24. Dixon, S.L.; Hall, C.A. Fluid Mechanics and Thermodynamics of Turbomachinery; Elsevier: Amsterdam, The Netherlands, 2010. [Google Scholar]
  25. Borkowski, D. Analytical Model of Small Hydropower Plant Working at Variable Speed. IEEE Trans. Energy Convers. 2018, 33, 1886–1894. [Google Scholar] [CrossRef]
  26. Borkowski, D. Identification of the optimal control characteristics of a small hydropower plant using artificial neural networks and the support vector machines method. J. Hydraul. Res. 2018, 57, 715–723. [Google Scholar] [CrossRef]
  27. ISO/DIS 1100-2 Measurement of Liquid Flow in Open Channels—Part 2: Determination of the Stage-Discharge Relation; ISO: Geneva, Switzerland, 2010.
  28. Gao, J.; Dai, L.; Liu, X.; Du, X.; Luo, D.; Huang, S. Variable-Speed Hydropower Generation: System Modeling, Optimal Control, and Experimental Validation. IEEE Trans. Ind. Electron. 2020, 68, 10902–10912. [Google Scholar] [CrossRef]
  29. Vasudevan, K.R.; Ramachandaramurthy, V.K.; Venugopal, G.; Ekanayake, J.; Tiong, S. Variable speed pumped hydro storage: A review of converters, controls and energy management strategies. Renew. Sustain. Energy Rev. 2020, 135, 110156. [Google Scholar] [CrossRef]
  30. Kubiak-Wójcicka, K.; Machula, S. Influence of Climate Changes on the State of Water Resources in Poland and Their Usage. Geosciences 2020, 10, 312. [Google Scholar] [CrossRef]
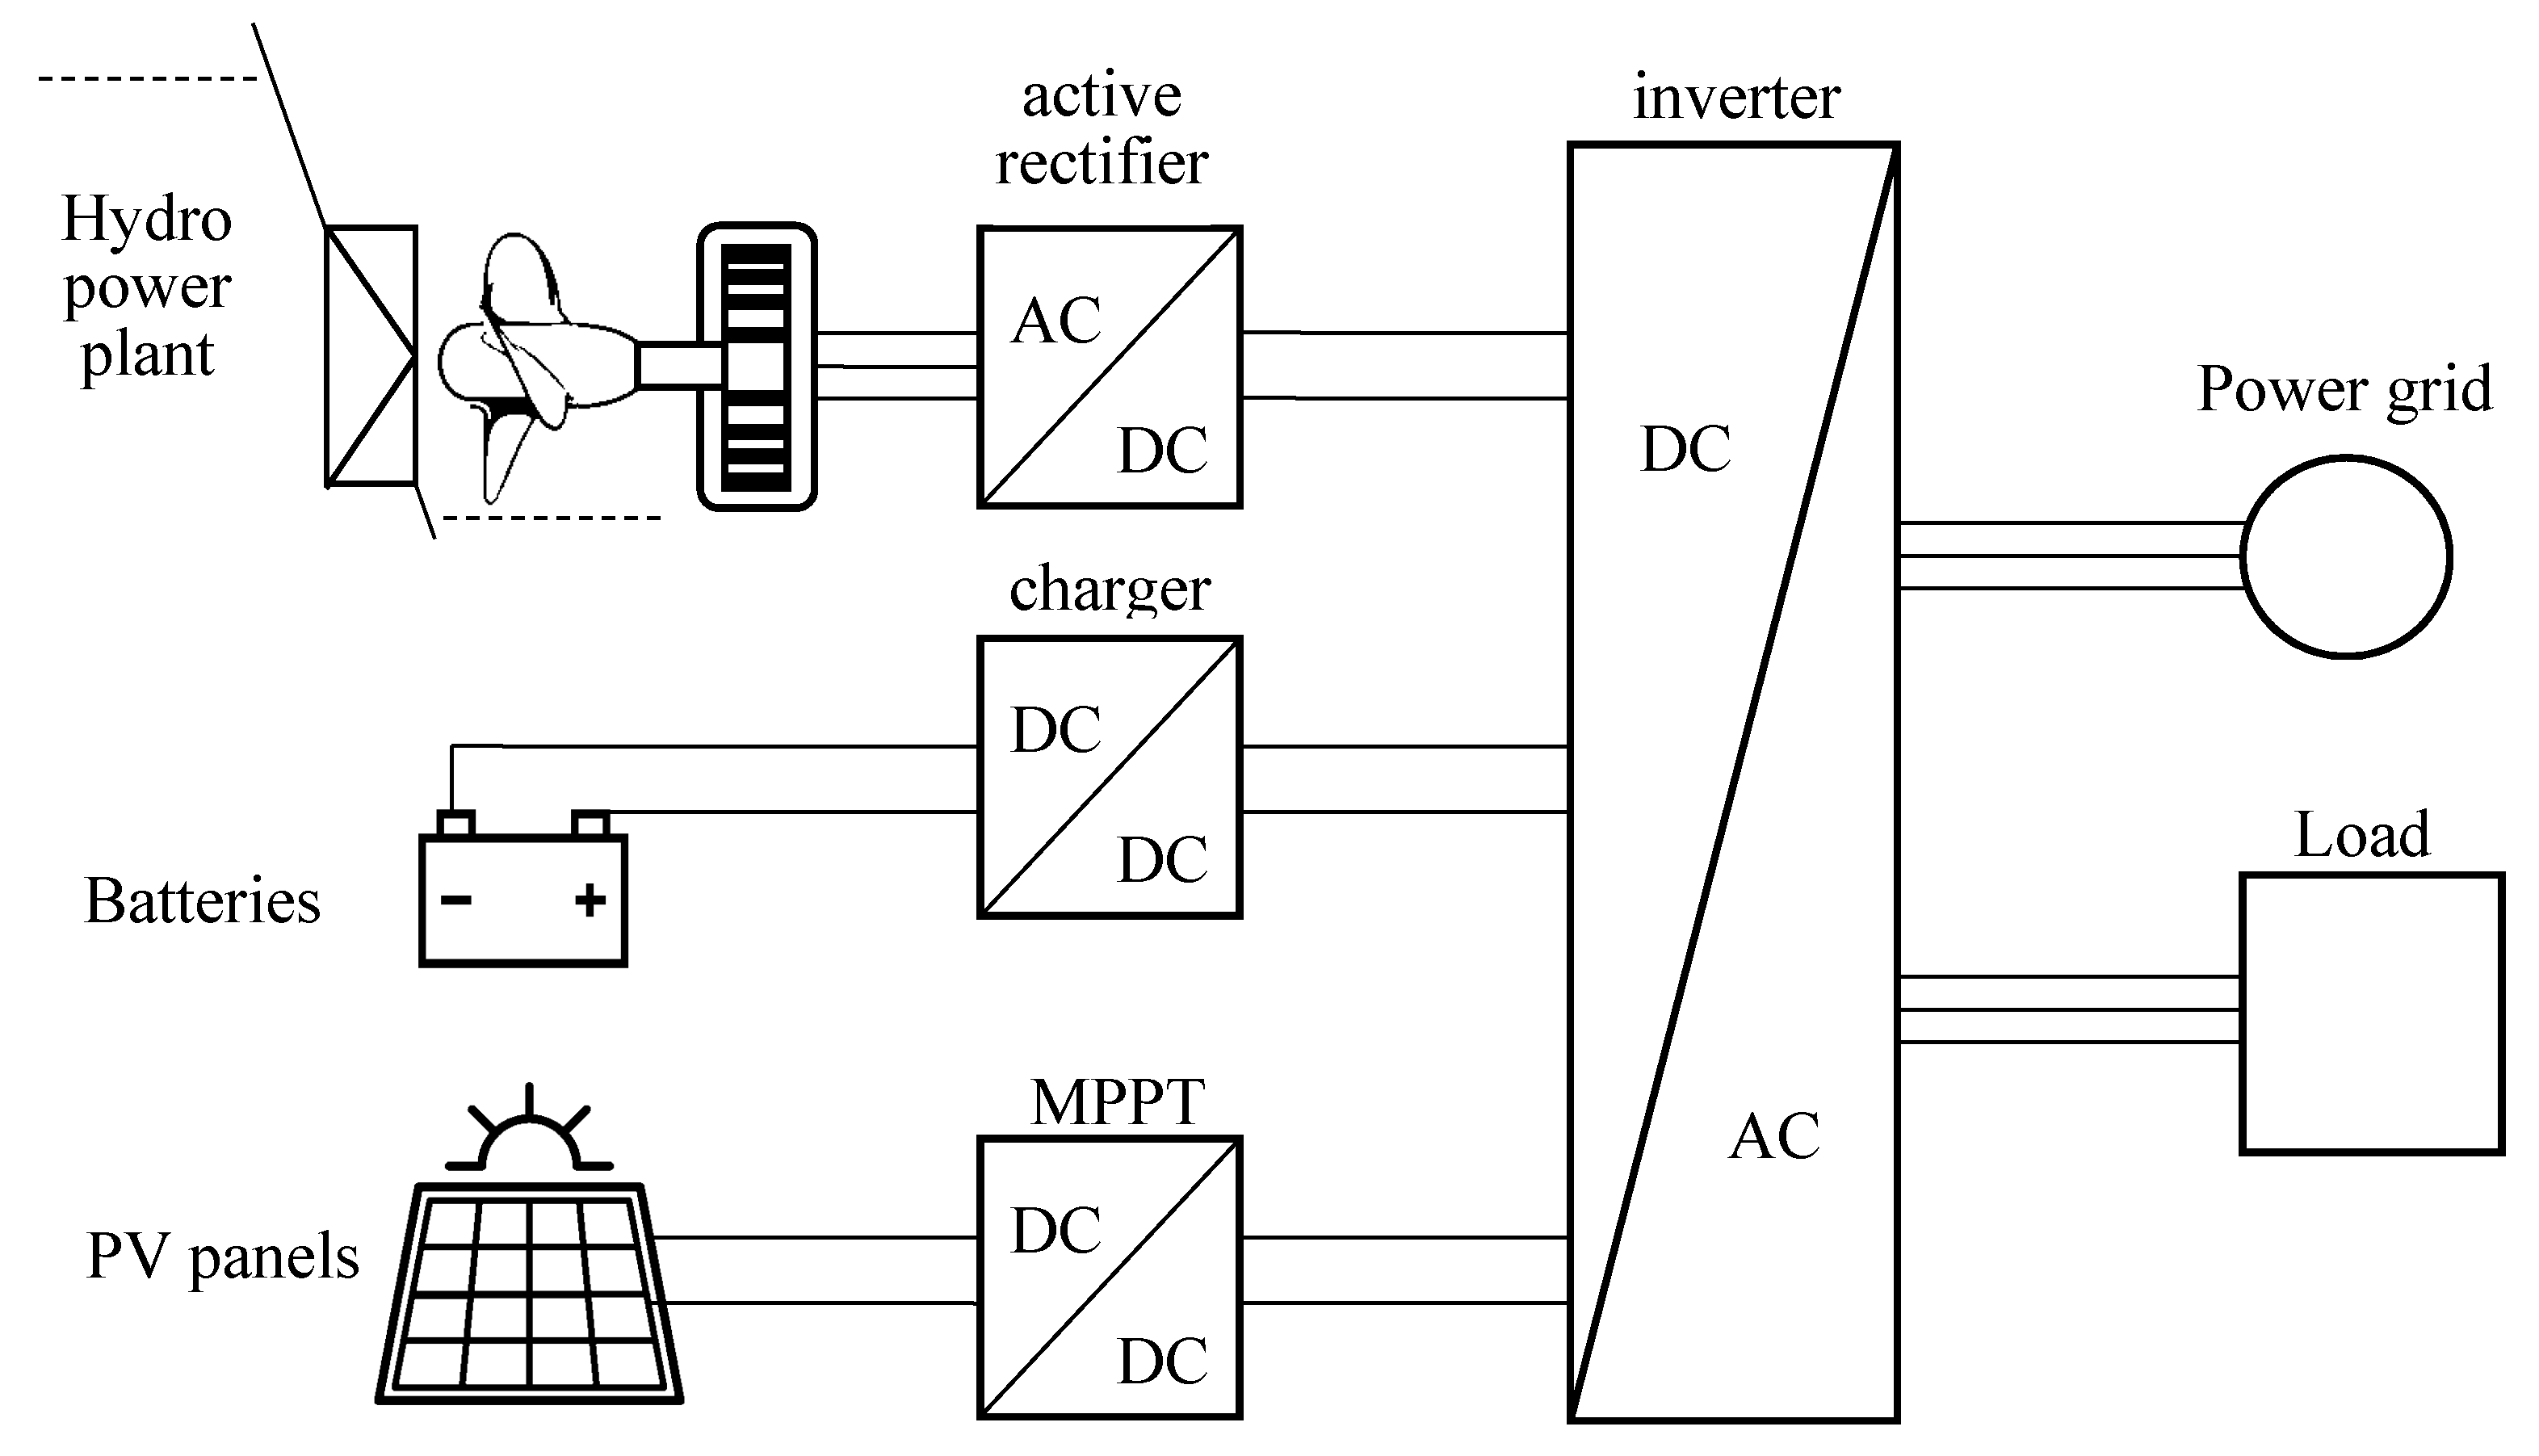
Figure 1. Schematic of the hybrid run-of-the-river hydropower plant/PV/batteries system.
Energies 14 05160 g001
Figure 2. Hill charts of a (a) fast turbine, (b) normal turbine, and (c) slow turbine showing the optimal operating curve (green solid line).
Energies 14 05160 g002
Figure 3. Structure of MLP neural network estimator of water turbine efficiency (W—weights, b—biases).
Energies 14 05160 g003
Figure 4. Hydro scheme water levels (a), tailrace channel shape and (b) tailrace level-discharge relation (c).
Energies 14 05160 g004
Figure 5. Schematic of the run-of-the-river hydropower plant model.
Energies 14 05160 g005
Figure 6. Sizing algorithm of the hydro/PV/battery hybrid system as a local supplier.
Energies 14 05160 g006
Figure 7. Hourly power profiles of load (red), PV (yellow), hydropower plant (blue), and battery (dashed black) related to nominal load power.
Energies 14 05160 g007
Figure 8. System topology of existing SHP and energy consumer (black) and proposed system expansion of PV and battery (red).
Energies 14 05160 g008
Figure 9. Typical daily power consumption of the consumer.
Energies 14 05160 g009
Figure 10. Location of the SHP, water intake and pumping station (consumer) and water level measurement point (Source: https://hydro.imgw.pl/#map/17.3033,50.432,15,true,false,0 accessed on 1 July 2021).
Energies 14 05160 g010
Figure 11. Tailrace level-discharge relation: measured data (black stars) and the model curve (blue—normal, red—flood level) based on Formula (4).
Energies 14 05160 g011
Figure 12. Real waveforms of (a) SHP power, upper and tailrace water levels, and (b) upper water level in a twenty-month period.
Energies 14 05160 g012
Figure 13. Average monthly solar radiation (yellow) and river flow (minimum, average and maximum—blue) in Poland.
Energies 14 05160 g013
Figure 14. The annual PV/hydro energy as a function of PV/hydro sizes related to the average load energy.
Energies 14 05160 g014
Figure 15. Monthly PV/hydro energy for a chosen system configuration (Ppv = 60% PlN, Ph = 110% PlN).
Energies 14 05160 g015
Figure 16. Hourly power profiles of load (red), PV (yellow), SHP (blue), and battery (dashed black) related to nominal load power.
Energies 14 05160 g016
Figure 17. Annual performance curves of (a) water flow of river; (b) sorted SHP parameters (Q—river flow, H—water head, Qt—turbine discharge, Ph—SHP output power); (c) per unit day-to-day flow changes; and (d) absolute values of per unit day-to-day flow changes sorted in descending order.
Energies 14 05160 g017
Figure 18. Energy balance of the hybrid hydro/PV battery system: (a) one-day averaging and (b) one-month averaging related to load energy.
Energies 14 05160 g018
Publisher’s Note: MDPI stays neutral with regard to jurisdictional claims in published maps and institutional affiliations.