Abstract
Ocean energy is a kind of renewable energy contained in seawater, which has the characteristics of large total reserves, sustainable use, and its being green and clean. Influenced by rising oil prices and global climate change, an increasing number of countries are attaching great importance to the strategic position of ocean energy in the future energy sector, and are formulating national ocean energy development roadmaps and conducting research and development on ocean energy technologies. Ocean current energy is a widely existing kind of ocean energy with abundant reserves. However, due to the low current velocity in most of the deep sea, low current energy has not been effectively exploited. In this paper, the Blade element momentum (BEM) theory based on Vortex column theory is used to design a special airfoil for low current energy applications, and a prototype turbine with rotor diameter of 4.46 m and tip speed ratio (TSR) of 6 is fabricated. In order to achieve stable electric power output, this paper designs a hydraulic conversion power generation control system with flexible control, and the hydraulic system working pressure designed to 21 MPa. In this paper, we conducted towing experiments on the prototype of an ocean current energy turbine, with hydraulic transmission and a control power generation system applied to the low flow rate, and achieved the target of hydraulic motor speed in the range of 14.7~15.9 r/min and steady-state speed accuracy in the range of ±1%. The research conducted in this paper can provide a research basis for the efficient exploitation of low-flow ocean current energy.
1. Introduction
Current energy is an important aspect of marine renewable energy, including offshore tidal energy, offshore current energy, deep-sea circulation energy, etc. Its energy density is much greater than other renewable energy sources, its power density is 800 times that of wind energy and its reserves are abundant. The South China Sea is one of the main areas of global typhoon activity, with the surface seawater in the South China Sea, when under the influence of the tropical marine monsoon, forming the flow direction, flow speed and other characteristics of different currents. The waterways of Jintang, Gushan and Xihoumen in Zhoushan Islands of Zhejiang Province have an average power density of over 20 kW/m2 and a maximum current speed of over 4.0 m/s, making them the richest ocean current energy resources in China. Additionally, the development environment and conditions are very good. The marine energy distribution situation in China’s coastal areas coincides with the energy demand, and the efficient development and reasonable utilization of marine current energy can provide electric energy for China’s coastal areas.
As a first-class energy conversion device for ocean current energy, the ocean current turbine is the core component of ocean current energy power generation devices, and its hydrodynamic performance is key to the efficient development and utilization of ocean current energy. Therefore, the research on the hydrodynamic performance of sea current energy turbines has been a focus and hotspot of current research. The selected designs of the airfoil and turbine blades determine the hydrodynamic performance of the sea current energy turbine. Horizontal-Axis Marine Current Turbines (HAMCT), Vertical-Axis Marine Current Turbines (VAMCT) and Oscillating-Foil Hydrokinetic Turbines (OFHT) are the main types of hydrokinetic turbine, as shown in Figure 1. Kai-Wern Ng reviews the research on HAMCT, covering the aspects of turbine design and novel modifications [1]. Depending on whether the measures are collected using specific sensors or the built-in generator phase currents sensors, Xie reviewed the techniques and methods used the detection of marine current turbines’ blade faults [2]. Senad deployed a prototype marine current energy converter, which is a fixed pitch VAMCT with a permanent magnet synchronous generator (PMSG) [3]. Katsutoshi Shirasawa proposed a novel submerged horizontal axis ocean-current turbine, similarly to kites [4]. To improve the water tightness of a marine current, In-cheol Kim designed a coupling that increased the turbine’s maximum power output by about 5% and the hydrodynamic coefficient of power by about 2% [5]. LIU designed and tested a 1/5 th scale three-bladed horizontal axis tidal current turbine and the maximum power output exceeded 29 kW. However, the power of the turbine is not very efficient [6]. In order to maximize the lift–drag ratio of the hydrofoil, LUO proposed a multi-point optimization method for foil in the operating range of from 0° to 15° of the attack angle [7]. Molland carried out cavitation tunnel experiments on four representative sections derived from the NACA series, and the results showed that the drag tends to be higher than published values in the region a = 7–13° [8]. Krishnil presented airfoil sections for a 20 kW turbine using the Multi-Objective Genetic Algorithm, designed a turbine using the airfoil characteristics of the USP07-45XX family of airfoils, with the National Renewable Energy Laboratory (NREL) rotor optimization code HARP_Opt, and provided evidence of the usefulness of modern airfoils [9]. This paper will focus on the most widely used Horizontal-Axis Marine Current Turbines (HAMCT).
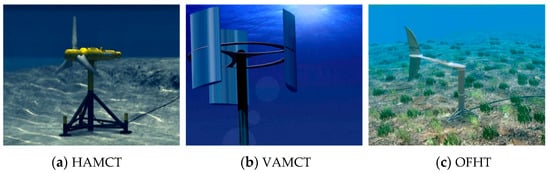
Figure 1.
Hydrokinetic turbines.
Regarding the induced motion of water flow through the turbine, many experts have established relevant theories, all of which refer to the vortex system. When the turbine blades rotate and move, the motion of the fluid in the flow field of the rotating region is not a simple one-dimensional constant flow, but a very complex three-dimensional motion. The velocity of the water flow at any point in space can be seen as a synthesis of the incoming water velocity and the rotationally induced velocity. We consider that the pressure drop on both sides of the actuator disc constitutes the energy absorbed by the turbine by the ocean current energy. In actuator disc theory, the actuator disc is described as a region swept by a plurality of airfoil blades, with each having the same radial amount of attachment rings. At the tip of each blade, spiral vortex intensity occurs in the downstream zone and convection occurs in the local flow. In this way, the accumulation of vortices at the tip of the spiral leaves forms a tubular surface. A large number of blades are infinitely close to the tubular surface, and thus become a continuous tubular vortex surface. The properties of the spiral tubular vortex surface expansion are not determined by the momentum theorem, so the tube is approximated as cylindrical, as shown in Figure 2. The vortex cylinder has a surface vortex that moves along a spiral path with a spiral angle, the angle of entry at the tip of the leaf. Since the vortex-intensity-induced velocity along the rotating surface of the turbine parallel to the rotation axis is uniform throughout the turbine disc, it can be concluded that the axial-induced velocity within the cylindrical wake is uniform at the distal end of the wake according to the Biot–Savart Law, proving that the vortex theory assumption is correct. To research the aerodynamic performance characteristics of turbine, Wu utilized the multi-relaxation time lattice Boltzmann (MRT-LBM) model and showed that the linearized migration of the tip vortex changed, and the mutual fusion of wake vortex structures was directionally weakened, inducing downstream reflection [10]. Pan used a large-eddy simulation (LES) model to research the wake vortex structure of airfoil trailing edge and showed that the lift coefficient and lift–drag ratio increased with increasing tail thickness parameters, which can impact the position of vortex formation and the length of the vortex [11]. Raquel studied the wake geometry, core radius and circulation of tip vortex using a new aerodynamic module labeled AeroVIEW (Aerodynamic Vortex fIlamEnt Wake) based on an implementation of the Free Vortex filament Method (FVM). His study obtained good predictions of the near-wake vortex dynamics and induced velocity flow field [12]. Liu solved the enlargement of the vortex system behind the turbine by using more efficient and mature blade element momentum and showed that the core growth of the vortex filaments due to turbulence mainly dominate the velocity deficit along the downstream distance in the wake [13]. Lee conducted the post-stall behaviors and nonlinear stall, and predicted the aerodynamic performances and wake geometry of turbines at a high angle of attack using the nonlinear vortex lattice method (NVLM), with the results showing that the aerodynamic loads and tip vortex curve are in good agreement with the measured data [14].
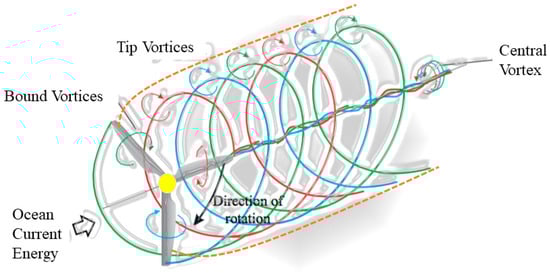
Figure 2.
Schematic diagram of vortex system downstream of an ocean current turbine [15].
BEM theory is the abbreviation of blade element momentum theory, which combines blade element theory and momentum theory and is the basis of blade hydrodynamic performance analysis. BEM theory assumes that the ocean current is an incompressible, one-dimensional and non-viscous flow. Lee used the BEM to optimize blade chord length and the built-in twist angle of the blade, which are important design variables for the optimal design of the ocean current turbine blade, and his research showed that the blade efficiency increases by 8.7%, with an annual energy production increase of approximately 7% [16]. To study the performance and wake of a horizontal axis tidal stream turbine, Nicolo adopted a hybrid Blade Element Momentum–Computational Fluid Dynamics (BEM-CFD) approach based on the Virtual Blade Model (VBM) [17]. In [17], the researcher also pointed out that greater environmental ocean turbulence may affect the length and strength of the wake formed by an ocean current turbine. To maximize power extraction, Franklyn developed blade element momentum theory to automate the procedure and predicted the power coefficient and thrust coefficient of the turbine in low-speed regions [18].
The more mature methods used in turbine blade optimization design at home and abroad are mainly the Glauert method based on blade element momentum theory, Schmitz method and Wilson optimization method, while the Wilson optimization method is closer to the engineering practice. Wilson optimization method takes the maximum power coefficient at the rated flow rate as the optimization target, the designed blade has higher energy utilization, and the model is simpler and more convenient to calculate. Many scholars have conducted related research. To improve the design’s efficiency and accuracy, Chen combined the blade element momentum and Wilson’s optimization design method to calculate the blade shape parameters. His tests showed that the method could improve the energy capture efficiency of the turbine within the range of the changing flow velocity [19]. As the velocity loss caused by drag is confined to the narrow wake, which flows both from the trailing edge of the airfoil, velocity deficient is only an aspect of the wake and does not contribute to the velocity loss upstream of the turbine disk [20]. To calculate the performance of turbine rotors, Sun considered the influence of pressure drop with Wilson’s tip correction, and the results show a better prediction than the classic BEM method, especially in the blade tip region [21].
Ocean current energy conversion is similar to wind energy conversion [22]. Since the hydraulic transmission control power generation system has great potential to absorb wind- or water-flow energy fluctuation, improving the system reliability, power quality and power generation, as well as reducing the manufacturing and operation and maintenance costs, it has attracted the attention of many manufacturers and researchers at home and abroad, and gradually become a research hotspot. Voltage frequency, as the main evaluation index of power quality, mainly depends on the speed of synchronous generator for a hydraulic transmission-controlled power generation system, so if we can capture as much ocean current energy as possible under the premise of constant speed and precise control of the hydraulic motor (error of ±0.4%), we can realize a great impetus to improve the power quality and annual power-generation capacity of existing generating units. At the same time, due to the characteristics of hydraulic flexible connection and strong scalability, for the characteristics of low flow velocity in deep sea, multiple groups of low-speed and large displacement hydraulic pumps can be combined to drive the generation of a single hydraulic motor rotation, which can adapt to ultra-low flow velocity power generation and enhance the environmental applicability. In addition to this, AC power can be supplied directly to the deep-sea equipment and DC power can be supplied through rectifiers. Borkowski showed that the control complexity in small hydropower plants is mainly caused by special steady-state features of the ocean current turbine, the long-term constants of the hydraulic system and/or aging-related degradation in the system performance, and proposed a simple formula verified on a real small hydropower plants, with 150 kW as the optimal operating curve [23]. To extend the mathematical modeling methodology, Natalia presented the methodology of spatial harmonic interactions in an axial flux permanent magnet generator for three-phase generators with asymmetrical windings and an electromagnetic circuit [24]. In this paper, we use a hydraulic system as an energy conversion system to achieve variable speed and constant frequency control of hydraulic power generation from ocean currents, as shown in Figure 3.
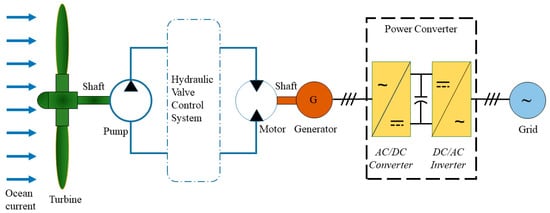
Figure 3.
Diagram of an ocean current turbine hydraulic energy generation system.
In summary, this paper focuses on the following three aspects of the study. Firstly, the design of the airfoil, blade and overall structure of the turbine is based on vortex theory, blade momentum theory and Wilson design theory, and the flow field simulation study of the ocean current turbine is carried out by Computational Fluid Dynamics (CFD). Next, the hydraulic energy conversion control system is designed and applied to the ocean current energy generation system, the hydraulic system parameters are calculated and the applicable models of hydraulic components are selected. Finally, the hydraulic power generation system of sea current energy is tested by towing experiment, and the test conclusions are drawn.
2. Methods
2.1. Ocean Current Turbine Performance Parameters
The power factor Cp is the main parameter to evaluate the performance of the ocean current turbine, and the calculation formula is as Equation (1)
where P is the ocean current turbine power, V is the ocean current velocity, and R is the radius of the rotor.
The ratio of the linear speed at the tip of the turbine blade to the rated incoming velocity is called the tip speed ratio, calculated as Equation (2)
where ω is the angular velocity of ocean current turbine rotation.
The size of the thrust of the turbine impacted by the water flow affects the installation and manufacture of the turbine, etc. The expression of the thrust coefficient is as Equation (3)
where F is the thrust of the turbine.
2.2. Vortex Column Theory
The vortex causes a change in the axial and tangential velocity of the water flow in the flow field. Here, the axial interference factor a and the tangential interference factor b are introduced. a and b represent the degree of influence of the turbine on the velocity of the water flow in the axial and tangential directions when the water passes through the rotating turbine, respectively.
In the axial direction, after the introduction of the induced factor, the axial water flow velocity of the water flow in the rotation plane of the turbine is as shown in Equation (4).
V = (1 − a)V1
In the tangential direction, the water flow creates a rotation angle in the downstream tangential direction due to the vortex motion of the water Ω, while the angular velocity of rotation of the water flow in the upstream tangential direction is 0. According to the Betz’ Law, the angular velocity of the water flow in the plane of rotation of the turbine is Ω/2. If the angular speed of the turbine is ω, then the relative angular velocity of the water flow in the plane of rotation to the turbine is as shown in Equation (5)
where Ω is the rotational angular velocity of water flow, ω is the rotational angular velocity of ocean current turbine, and b is the tangential Induced Factor.
From Equations (4)–(6), it can be derived that the tangential linear velocity of the water flow relative to the turbine at the radius r of the turbine is as shown in Equation (6).
The inlet angle φ and relative velocity Vr at the radius r of the turbine plane are as shown in Equations (7) and (8).
2.3. Blade Element Momentum (BEM) Theory
BEM is used to divide the blade into several microsegments along the spreading direction, and each microsegment is called a blade element. Assuming that there is no fluid interaction between the individual blade element planes and that each blade element is only subject to lift and drag, the forces on each blade element can be analyzed and summarized along the spreading direction to obtain the thrust and torque acting on the entire blade.
To calculate the thrust and moment of a hydraulic turbine, either in the blade element theory or in the momentum theory, the axial induction factors a and the circumferential induction factor b must be obtained. The value of the induction factor cannot be obtained by using either momentum theory or lobe theory alone. The equations of thrust and moment derived from blade theory and momentum theory need to be combined to obtain the correlation between the induction factor and the tip speed ratio. This correlation formula is the basic form of the constraint function that must be used in the optimal design of a hydraulic turbine, as shown in Equation (9).
2.4. Wilson Theory
Different design methods are chosen to design slightly different blade shapes, which are directly related to the performance of the ocean current turbine. With the continuous improvement of the basic theory, the blade design method is also gradually matured. At present, there are three main blade design methods, namely the Glauert method, Schmitz method and Wilson method. The Glauert method takes the effects of axial and induction factors on blade elements, which improves the deficiencies of blade element momentum theory into account, thus quantifying the interactions between neighboring blade elements and making the design theory more consistent with the actual results. Ignoring airfoil drag and blade tip loss in the calculation of power coefficient simplifies the calculation process and this method is widely used in the initial design of blade shape. The Wilson design method is used in the Glauert design method based on the improvement, detailed derivation of the power coefficient, blade tip speed ratio and tip loss of the mathematical relationship formula. These are considered so that the power coefficient on each blade element’s maximum, derived with high calculation accuracy in the low flow rate design results, is very close to the actual situation. This is the most common blade design method at present.
The main design model of Wilson theory is as shown in Equation (10).
Objective Function:
Constraint function:
Solver function:
Among Equations (10)–(12), the force of the blade tip is crucial to the power coefficient of the whole turbine, so the blade tip loss cannot be neglected, and the calculation formula of the blade tip loss coefficient F is as shown in Equation (13).
Installation angle θ is calculated as in Equations (14) and (15).
3. HAMCT Design
3.1. Design Requirements
To meet the requirements of energy capture in low-flow velocity ocean currents, the specific operating conditions for the HAMCT design in this paper are as follows. Ocean current velocity of no more than 0.5 m/s, power no less than 500 W, a distributed horizontal direction symmetrical arrangement of two turbines, initial design of 1.2 times the power margin, a turbine design power of 300 W each, seawater density of 1024 kg/m3, design tip speed ratio of 6, design power coefficient of 0.4, and electromechanical joint efficiency of 0.75. The key parameters of the design are shown in Table 1.

Table 1.
HAMCT key parameters.
3.2. Airfoil Selection
At present, there is no airfoil type specifically suitable for ocean current energy turbine blades, and the most-used airfoil type is still the National Advisory Committee for the Aeronautics (NACA) series airfoil type or wind turbine special airfoil type. In order to obtain a better hydrodynamic performance, the airfoil is mainly screened by its lift coefficient, drag coefficient and pitch moment coefficient. After a preliminary estimation, we concluded that the Reynolds number Re continuously decreases along the impeller spreading direction, and the basic interval is 2 × 10⁵–3 × 10⁵. Since the NACA 63 series airfoil has good lift-to-drag characteristics, this paper focuses on screening the optimal airfoil in the NACA 63 series airfoil with the best lift-to-drag ratio as the condition. The results of the airfoil analysis are shown in Figure 4.
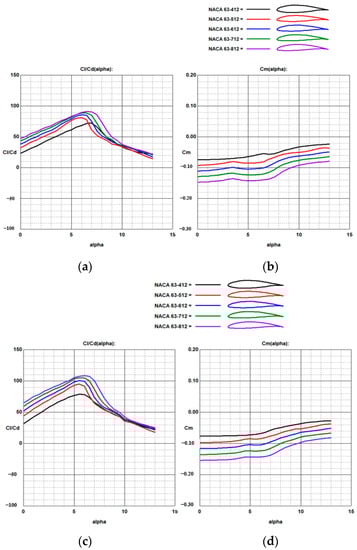
Figure 4.
Comparison of lift-to-drag ratio of airfoils with different Reynolds numbers. (a,b) are the lift-to-drag ratio and pitch moment coefficient for Re = 2 × 10⁵, (c,d) are the lift-to-drag ratio and pitch moment coefficient for Re = 3 × 10⁵.
From the above figure, it can be seen that the NACA63-8 series airfoils all have the highest lift-to-drag ratio and more gentle pitch moment coefficients, so the NACA63-8 series airfoils were selected for further analysis. When the relative thickness of the airfoil varies from 12% to 25%, the NACA63-812 airfoil has a better performance in terms of lift-to-drag ratio at different Reynolds numbers, so the NACA63-812 airfoil was chosen as the design airfoil for this paper.
3.3. Design of Blades
When researching the project, after comparing Vortex Column Theory and BEM Theory and Wilson Theory, we finally chose Wilson Theory as the design method for the hydraulic turbine blade by combining the actual working condition demand. Considering the difficulty of directly solving the parameters in the Wilson Theory model, this paper uses the fmincon optimization toolbox in MATLAB to optimize the solution for each blade element parameter and calculate the chord length and mounting angle of each blade element, etc.
In this paper, the optimization tool Fmincon function in MATLAB was used to optimize the solution of each leaf element parameter, and the calculation procedure was developed by combining the design requirements and the selected airfoil data with Wilson design theory. In this paper, the blade is divided into 18 sections, which are equally spaced along the radius direction, and the sections use NACA63-812 wing plus two circular sections at the root of the blade, totaling 20 sections. The calculated chord lengths and torsion angles of each section are shown in Table 2.
Table 2.
Blade element data at different blade heights.
In this paper, the optimal parameters of each blade element calculated by the MATLAB program are organized and converted to the corresponding coordinates, and the converted leaf element cross-section is imported into SolidWorks, as shown in Figure 5a. The turbine model is shown in Figure 5b by placing samples on the basis of each blade element’s cross-section and establishing the hub model and the model at the blade root connection.
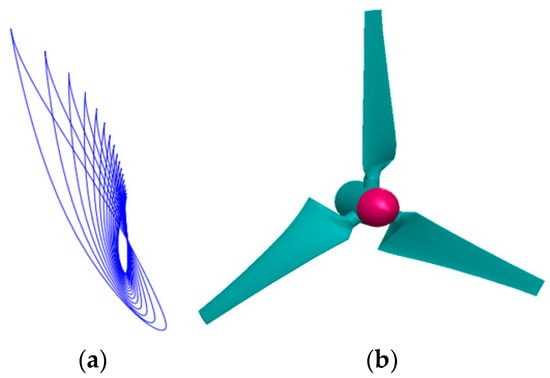
Figure 5.
Ocean current turbine design results. (a) Blade element section at different blade heights; (b) Ocean current turbine modeling.
Since parameters such as the load condition, frictional moment of the drive system, and eccentric moment of the turbine are unknown, the rotational moment of the rotor at rest for this turbine at different flow rates is calculated in this paper through a dynamic analysis of the turbine when it is not rotating, and these data can be used as a reference basis for the turbine’s starting flow rate, as shown in Figure 6. The overall structure of the ocean current turbine is shown in Figure 7.
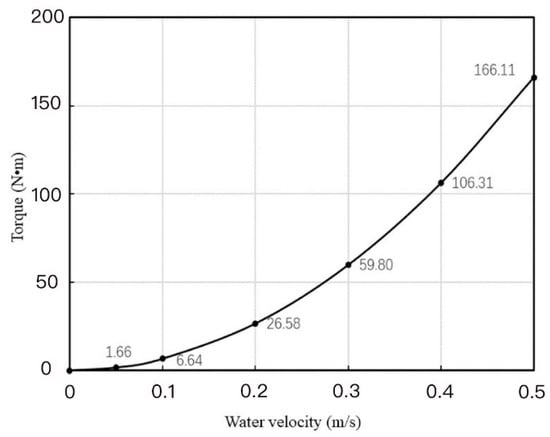
Figure 6.
Ocean current turbine torque at different flow rates.
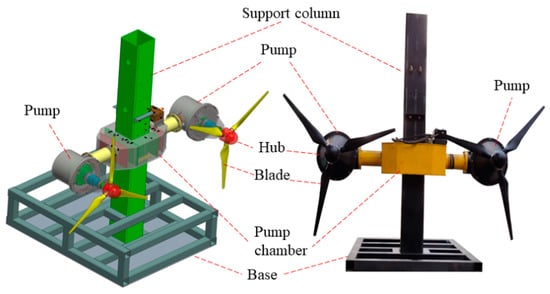
Figure 7.
HAMCT overall three-dimensional drawing and assembly structure drawing.
4. Hydraulic Control System Design
This section completes the overall design of hydraulic transmission and control power generation equipment, designs the hydraulic schematic diagram according to the requirements of hydraulic power generation equipment of ocean current energy, carries out the scheme design of hydraulic transmission and control power generation equipment, and completes the manufacturing and assembly of hydraulic power generation equipment of sea current energy.
4.1. Design of Hydraulic Transmission and Control Power Generation Equipment
The prototype of hydraulic transmission and control power generation equipment mainly consists of an energy capture device and hydraulic power generation device. In order to meet the power supply demand of the grid and realize flexible energy conversion, this paper adopts the parallel distributed hydraulic power generation equipment. The goal is to control the speed of the variable motor to stabilize around the theoretical speed of 1500 r/min, with a relative error rate of the speed no greater than ±2%, to drive the synchronous generator to achieve a constant frequency power generation. The power target of synchronous generator constant frequency power generation is 500 W, the system working pressure is 21 MPa, the voltage target is 380 V, and the power generation frequency is 50 Hz. The energy capture device adopts a distributed turbine structure. In order to monitor the hydraulic transmission and control power generation system in real time, it needs to be equipped with the necessary sensors.
The kinetic energy of the unstable water flow drives the turbine to rotate and convert into mechanical energy. The main shaft of the turbine drives the variable speed rotation of the dosing pump through coupling, which converts the mechanical energy into hydraulic energy. The hydraulic pipeline connects the dosing pump and the variable motor, and the hydraulic oil drives the motor to rotate. The control system changes the swashplate tilt angle of the hydraulic motor in real time to realize the adjustment of the displacement, so as to ensure the constant speed output of the variable motor and realize the constant frequency power generation of the synchronous generator, which finally converts the mechanical energy into stable electric energy. The energy storage device stores the electrical energy from the generator to cope with different load working conditions.
In the hydraulic transmission-controlled power generation equipment, the synchronous generator is used, with the advantages of strong environmental adaptability and adjustable excitation current. Therefore, to meet the requirements of the rated operation of the synchronous generator, the motor output speed should remain stable and reach the rated speed of the synchronous generator. The energy storage device adopts a lithium battery pack, which has the advantages of a high energy density, being clean and pollution-free, etc. The stable DC power from the generator is stored directly in the lithium battery pack through the DC–DC bidirectional converter.
Figure 8 shows the principle diagram of hydraulic transmission and control power generation. The system adopts the closed-type volumetric speed control circuit of the quantitative pump-variable motor, in which the two turbines convert the unstable kinetic energy of water flow into mechanical energy, and the quantitative pump in the main oil circuit converts the mechanical energy of the turbine, which is converted with its coaxial into hydraulic energy. It then provides the pressure energy of oil and outputs the corresponding flow rate. Speed sensors are set at the main shaft of the two dosing pumps to detect the pump speed.
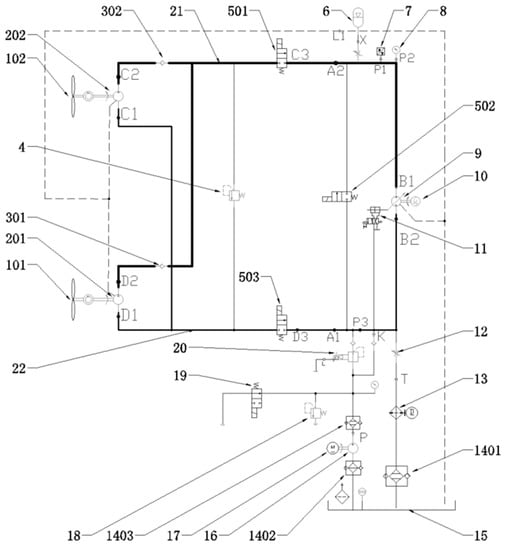
Figure 8.
Hydraulic schematic of HAMCT. 101,102—rotors; 201,202—fixed displacement pumps; 301,302—check valves; 4—safety valve; 501,502,503—solenoid valves; 6—accumulator; 7—pressure sensor; 8—hydraulic pressure gauge; 9—variable displacement hydraulic motor; 10—generator;11—directional valve; 12—flow valve; 13—cooler; 1401,1402,1403—oil filter; 15—tank; 16—refill pump; 17—refill pump motor; 18—relief valve; 19—solenoid valve; 20—pressure-reducing valve; 21—high-pressure circuit; 22—low-pressure circuit; 23—energy storage device.
A check valve is installed at the outlet of the two fixed displacement pumps to prevent the oil from flowing back. The safety valve is to prevent the danger caused by high pressure in the high-pressure circuit, and the set pressure is 21 MPa. Flow sensor and pressure sensor are installed in the high-pressure circuit to detect the flow and pressure of the hydraulic circuit in real time. An accumulator is installed on the high-pressure circuit to improve the stability of the hydraulic circuit during operation and reduce the losses caused by pressure pulsations. The oil in the high-pressure circuit drives the variable motor to rotate, converting hydraulic energy into mechanical energy. The reversing valve is equivalent to opening the switch of the motor displacement mechanism and adjusting the tilt angle of the motor swashplate to change the displacement of the motor, and the control system changes the motor displacement in real time so that the motor speed remains stable. The generator outputs the frequency voltage, converting mechanical energy into electrical energy. When the hydraulic power generation prototype is working, the solenoid valves on the high- and low-pressure circuits open. Since this system is a closed circuit, it must be equipped with an oil-replenishment system to fulfil the function of oil replenishment and cooling for the main oil circuit when oil leakage and heat generation are unavoidable. The oil charge pump motor drives the oil charge pump to pump oil from the oil charge tank and provide oil to the low-pressure circuit through the oil filter and pressure reducing valve; the pressure of the low-pressure circuit is determined by the outlet pre-sure of the pressure-reducing valve, which is set at 2 MPa. The oil charge relief valve is set at 5 MPa, which protects the oil charge system and is also the opening pressure of the displacement adjustment mechanism. The cooler is installed between the motor return port and the charge oil tank to cool down the charge oil system return circuit.
4.2. Hydraulic Transmission and Control Power Generation Equipment Prototype
This prototype adopts the hydraulic drive to convert the unstable kinetic energy of water flow into stable electric energy, which has the advantages of distributed expansion, high power density, absorbing fluctuation and stepless speed adjustment. The energy capture device is mainly composed of a support, vane, quantitative pump and back pressure valve. The support plays the role of fixed support. The impeller is driven by the water flow to rotate and convert the kinetic energy of water flow into mechanical energy. The hydraulic turbine drives the coaxially connected quantitative pump to convert mechanical energy into hydraulic energy. Hydraulic power generation device mainly consists of variable motor, valve group, accumulator, synchronous generator, an oil replenishment system, etc. The variable motor is connected with the dosing pump in the energy capture device through the hydraulic pipeline to convert hydraulic energy into mechanical energy, and then realize the conversion of electric energy through the synchronous generator. The intelligent algorithm controls the internal displacement adjustment mechanism of the motor to realize the real-time adjustment of the motor displacement, so that the frequency of the output electric energy can be kept stable under the condition of unstable kinetic energy input of water flow. The oil replenishment system consists of oil replenishment pump, oil replenishment tank, oil replenishment pump motor, solenoid valve, etc. When the pressure in the main hydraulic circuit is low, the oil replenishment system works to maintain the pressure in the main system circuit. The whole machine assembly is shown in Figure 9.
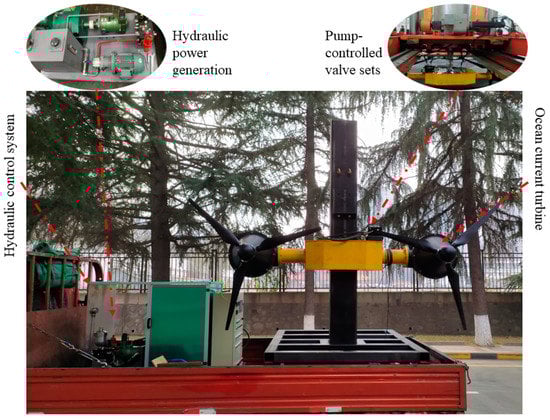
Figure 9.
Assembly of ocean current turbine and hydraulic power generation control system.
In summary, this section completes the function and scheme design of the hydraulic transmission and control power generation equipment and clarifies that its working principle is a pump-motor closed hydraulic circuit speed control system, which mainly consists of three parts: an energy capture device, hydraulic power generation device and energy storage device. According to the designed hydraulic transmission and control power generation equipment scheme, the parameters of hydraulic components in the hydraulic power generation equipment are calculated and selected, and the hydraulic transmission and control power generation equipment prototype is assembled to realize the overall hardware design and construction of the equipment.
5. Towing Experiment
In order to verify the energy-capture effect of the turbine and the control effect of the hydraulic power generation control system, a towing experiment of the ocean current energy turbine is conducted in this paper.
5.1. Basic Information of Towing Experiment
The key laboratory of “Unmanned Underwater Delivery Technology” mainly includes towing pool and integrated pool. The towing pool is 170 m long × 7 m wide × 6 m deep, with a maximum test speed of 7 m/s, as shown in Figure 10. The laboratory has the capability to conduct full-scale model hydrodynamic tests, load separation tests, power and propulsion system tests, and hydrodynamic noise tests of underwater vehicles in towing condition.
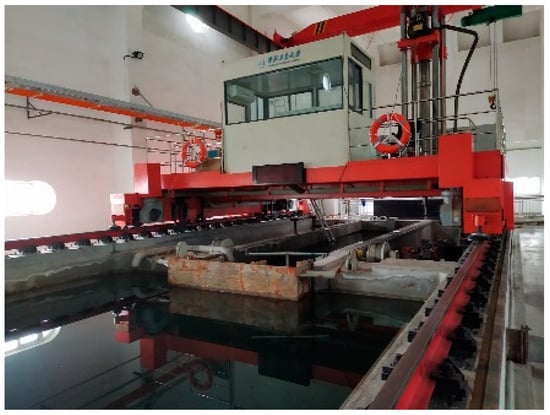
Figure 10.
Towing system for the Unmanned Underwater Delivery Technology Laboratory.
5.2. Towing Experiment Procedure
The towing experiment includes the following steps: commissioning the towing system, installing the turbine, docking the turbine, initial test of the trailer, towing test, maintaining still water, saving data, disassembling the turbine, installing the turbine to the support frame.
Step1. Commissioning the Towing System
Before the test, the towing system was debugged to ensure the normal operation of the trailer. The commissioning mainly includes mechanical structure commissioning, hydraulic locking system commissioning, hydraulic rotation system commissioning, hydraulic telescopic system commissioning, electrical control system commissioning, etc.
Step2. Installing the Turbine
The turbine test section was lifted (as shown in Figure 11a) and assembled with the trailer tie rod section by means of a connecting plate (as shown in Figure 11d). The turbine was connected to the trailer by M14 × 65 high strength bolts.
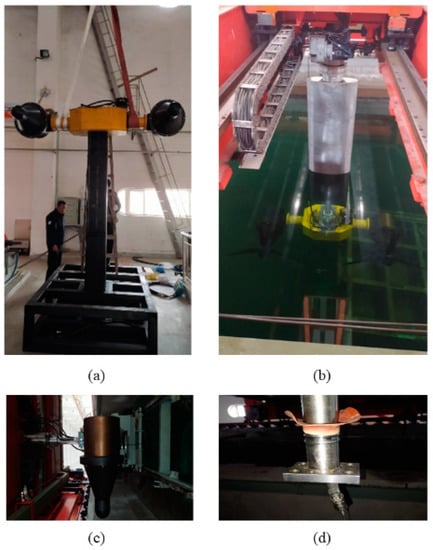
Figure 11.
Pictures of the towing experiment process. (a) Lifting turbine; (b) Turbine underwater; (c) Fixed turbine; (d) Connection plate.
Step3. Docking the Turbine
The turbine was docked (as shown in Figure 11c) and adjusted after installation was completed. The adjustment process ensured that the turbine was level and stable.
Step4. Initial Test of the Trailer
For initial commissioning, the trailer towed the turbine and the trailer was commissioned at a speed of 0.05 m/s (as shown in Figure 11b).
Step5. Towing Test
The towing tests were conducted under three different working conditions: 0.1 m/s, 0.3 m/s, and 0.5 m/s, respectively (as shown in Figure 12). The running time of the trailer under each working condition was 60 s.
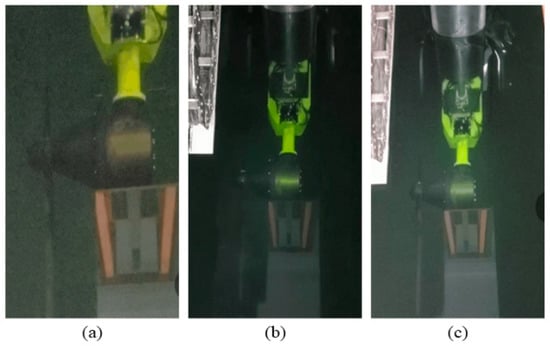
Figure 12.
Towing test under different working conditions. (a) 0.1 m/s working condition; (b) 0.3 m/s working condition, (c) 0.5 m/s working condition.
Step6. Maintaining Still Water
In order to prevent the pool fluctuations caused by dragging operation, resulting in a blocking effect, the operation of each test speed remained still for 30 min after completion, to ensure that the pool’s underwater water flow was without movement.
Step7. Saving Data
Using a USB flash drive allows one to make copies of the PLC stored data and obtain data by connecting the USB port to the back of the PLC through the USB flash drive.
Step8. Disassembling the Turbine
The hydraulic hoses, hydraulic joints and electrical signal connection lines were kept neat and tidy during the disassembly of the turbine to prevent any breakage. During the disassembly process, the blades are removed in advance, the turbine is removed from the dock, and the disassembled and completed test section is installed on the turbine support frame.
Step9. Installing the Turbine to the Support Frame
The turbine was installed to the turbine support frame and adjusted to ensure the turbine was level.
6. Results
Figure 13 shows the experimental result curve of the hydraulic motor when the hydraulic pump speed was a sine change input. In this case, the load was set constant at 10 MPa, and the pump speed input was changed to a sinusoidal signal with an amplitude of 30~50 r/min. From the experimental curve in the figure, it can be seen that under the condition of a feed-forward algorithm, the motor speed roughly maintained the sinusoidal trend of the pump speed input signal with a constant period, i.e., the motor speed followed the change in pump speed, and the motor speed fluctuated in the range of 1468~1587 r/min. Under the feedforward PID algorithm, the motor speed lost the sinusoidal trend of maintaining the pump speed input signal that the original feedforward algorithm had, due to the combined effect of disturbing factors such as flow pulsations generated within the piping and hydraulic components during the experiment, as well as control accuracy errors in control components such as PLCs, proportional amplifiers and sensors. A feed-forward algorithm detects the real-time speed of the dosing pump, obtaining the flow rate of the system, and deriving the reference value of the motor displacement through the flow balance equation. The PID algorithm fine-tunes the motor constant speed control on the basis of feed-forward coarse-tuning and corrects the larger steady-state error, so that the feed-forward PID algorithm finally maintained a motor output speed in the range of 1475~1526 r/min, and the relative error rate of motor speed was ±1.73%, which meets the design requirements and ensures the power-generation quality of the equipment.
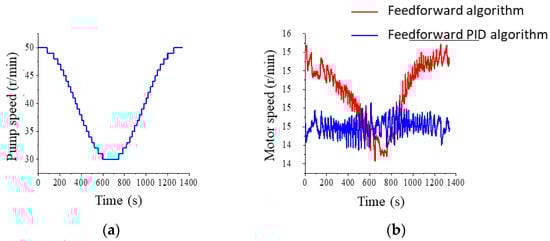
Figure 13.
Experimental curve of rotational speed change. (a) Hydraulic pump speed change input signal, (b) Hydraulic motor speed output signal.
The hydraulic motor speed conditions and the steady-state accuracy of the hydraulic motor speed under different flow rate conditions are shown in Figure 14.
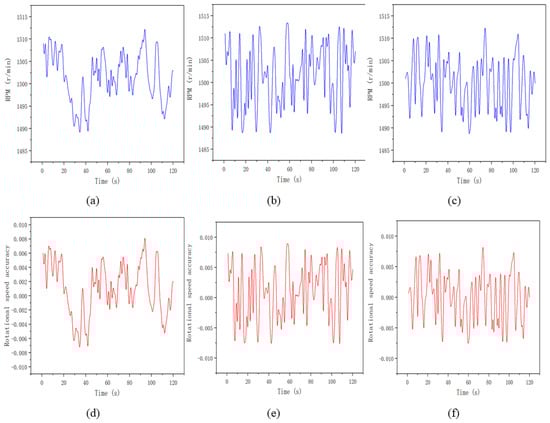
Figure 14.
Motor speed under different working conditions. (a–c) show the motor speed at 0.1 m/s, 0.3 m/s and 0.5 m/s, respectively; (d–f) show the steady-state accuracy of motor speed at 0.1 m/s, 0.3 m/s and 0.5 m/s, respectively.
Combining the above experiments on the effect of pump speed variation on motor’s constant speed control, it can be concluded that the feedforward algorithm has advantages in terms of its fast response. When the pump speed or load changes, the feedforward algorithm can quickly compensate for the motor speed, but it also generates a steady-state error and cannot restore the original smooth speed, so it is only suitable for rough commissioning stage. Combining the feedforward algorithm and PID algorithm, the PID algorithm can further optimize the parameters for the steady-state error generated by the feedforward algorithm to restore the motor speed to the target speed of 1500 r/min with a relative error rate of ±1.73%, but its response time is slow compared with the feedforward algorithm, so it is suitable for the precise commissioning stage.
7. Discussion
(1) The turbine starts to rotate from a standstill under the action of an incoming current and enters the power generation state when the turbine speed reaches a certain speed. The rotating torque of the generator is small when it is not connected to the load, and once it is connected to the load, the rotating torque of the generator is mainly determined by the load power and rotational speed. Considering the low current velocity in the marine environment, it is necessary to analyze and design the starting torque of the turbine, i.e., the torque when the turbine starts to rotate from standstill under the action of the incoming current.
(2) Generally speaking, the torque required to start the hydraulic turbine is only needed to overcome the static friction torque of the transmission system and the eccentric torque caused by the eccentricity of the turbine mass. Once the turbine starts to rotate from a standstill, the static friction becomes dynamic friction, the friction torque of the system decreases rapidly, the turbine will more easily enter the acceleration state, and VAMCT has a lower starting torque than HAMCT, so the study of VAMCT transmission system torque of VAMCT transmission system will be very meaningful.
(3) As the physical and chemical properties of deep seawater are significantly different from surface seawater, with the increase in seawater depth, the difficulty of material corrosion data accumulation and characterization method research also increases. Therefore, subsequent research also needs to consider the corrosion characteristics of deep seawater, and select and apply corrosion-resistant materials and protective coatings that suit the marine environment as the corrosion-resistant guarantee method for power generation equipment.
(4) In the future, to further increase the energy that can be captured by the ocean currents, researchers may consider extending the size of the ocean current turbine, in which case the focus needs to be on the maximum lift that the blades can withstand and the maximum torque that the hub can withstand, based on safety considerations.
8. Conclusions
(1) This paper completes the optimized design of a large-depth low-current kinetic turbine, develops a special hydrofoil suitable for a low-current deep-sea environment, proposes a new type of low-speed, heavy-load blade-design theory, and carries out global optimization with the goal of maximizing the rated current speed and power capture under a time-varying current speed. It then realizes a turbine design with high-efficiency miniaturization and wide energy capture conditions, and achieves a high energy capture efficiency of no less than 50%. Under working pressure conditions, the system efficiencies of above 0.1 m/s, 0.3 m/s and 0.5 m/s are found under the three working conditions of 61.7%, 62.1% and 64.2% respectively, no less than 50%; under the highest pressure condition, the system efficiencies of the above three working conditions are 63.2%, 62.9% and 65.1% respectively, no less than 50%.
(2) For the objective conditions of low-velocity underwater currents at large depths, through the advantages of the high energy density of hydraulic transmission, stepless speed regulation, flexible connection and strong scalability, multiple groups of high-volumetric-efficiency quantitative hydraulic pumps are used to allow the flow merge to drive variable motors to form a closed-volume speed-regulation system with high system efficiency. This helps to gather less energy into an increasing, continuous output, through optimization of the structure, parameter matching, and the use of new energy-saving technology, such as a low-voltage DC servo motor direct drive constant pressure variable pump. When used to achieve on-demand output, this can maximize the reduction in the drive system’s own energy consumption, to achieve the efficient transmission and transformation of micro-energy.
(3) Through the towing experiment, we completed the test of a hydraulic conversion power generation system of low-flow sea-current energy with a small hydraulic turbine, and achieved a rated hydraulic system pressure of 21.5 Mpa, maximum system pressure of 25 MPa, and steady-state accuracy of motor speed of ±1%, which verified the accuracy of the hydraulic turbine energy capture and hydraulic system control.
Author Contributions
Conceptualization, W.S. and H.W.; methodology, H.W. and P.G.; software, Q.H. and M.G.; validation, H.W. Y.Z., D.Z. and Z.L.; formal analysis, C.W. All authors have read and agreed to the published version of the manuscript.
Funding
This research received no external funding.
Institutional Review Board Statement
Not applicable.
Informed Consent Statement
Not applicable.
Data Availability Statement
Not applicable.
Acknowledgments
This project was supported by the equipment pre-research and sharing technology project of the equipment development department of China Military Commission (No. 41421080302), National Key Research and Development Program of China (No.2020YFB2009802) and Shaanxi Province Key Research and Development Program (No.2021ZDLGY10-01). This project was supported in part by National Natural Science Foundation of China (No. 52105068).
Conflicts of Interest
The authors declare no conflict of interest.
References
- Ng, K.-W.; Lam, W.-H.; Ng, K.-C. 2002–2012: 10 Years of Research Progress in Horizontal-Axis Marine Current Turbines. Energies 2013, 6, 1497–1526. [Google Scholar] [CrossRef] [Green Version]
- Xie, T.; Wang, T.; He, Q.; Diallo, D.; Claramunt, C. A Review of Current Issues of Marine Current Turbine Blade Fault Detection. Ocean Eng. 2020, 218, 108194. [Google Scholar] [CrossRef]
- Apelfröjd, S.; Ekström, R.; Thomas, K.; Leijon, M. A Back-to-Back 2L-3L Grid Integration of a Marine Current Energy Converter. Energies 2015, 8, 808–820. [Google Scholar] [CrossRef] [Green Version]
- Shirasawa, K.; Minami, J.; Shintake, T. Scale-Model Experiments for the Surface Wave Influence on a Submerged Floating Ocean-Current Turbine. Energies 2017, 10, 702. [Google Scholar] [CrossRef] [Green Version]
- Kim, I.; Wata, J.; Tongphong, W.; Yoon, J.-S.; Lee, Y.-H. Magnetic Coupling for a 10 KW Tidal Current Turbine: Design and Small Scale Experiments. Energies 2020, 13, 5725. [Google Scholar] [CrossRef]
- Liu, H.; Zhou, H.; Lin, Y.; Li, W.; Gu, H. Design and Test of 1/5th Scale Horizontal Axis Tidal Current Turbine. China Ocean Eng. 2016, 30, 407–420. [Google Scholar] [CrossRef]
- Luo, X.-Q.; Zhu, G.-J.; Feng, J.-J. Multi-point design optimization of hydrofoil for marine current turbine. J. Hydrodyn. Ser. B 2014, 26, 807–817. [Google Scholar] [CrossRef]
- Molland, A.F.; Bahaj, A.S.; Chaplin, J.R.; Batten, W.M.J. Measurements and Predictions of Forces, Pressures and Cavitation on 2-D Sections Suitable for Marine Current Turbines. Proc. Inst. Mech. Eng. Part M J. Eng. Marit. Environ. 2004, 218, 127–138. [Google Scholar] [CrossRef]
- Ram, K.R.; Lal, S.P.; Ahmed, M.R. Design and Optimization of Airfoils and a 20 KW Wind Turbine Using Multi-Objective Genetic Algorithm and HARP_Opt Code. Renew. Energy 2019, 144, 56–67. [Google Scholar] [CrossRef]
- Wu, W.; Liu, X.; Liu, J.; Zeng, S.; Zhou, C.; Wang, X. Investigation into Yaw Motion Influence of Horizontal-Axis Wind Turbine on Wake Flow Using LBM-LES. Energies 2021, 14, 5248. [Google Scholar] [CrossRef]
- Xiong, P.; Wu, L.; Chen, X.; Wu, Y.; Yang, W. Aerodynamic Performance Analysis of a Modified Joukowsky Airfoil: Parametric Control of Trailing Edge Thickness. Appl. Sci. 2021, 11, 8395. [Google Scholar] [CrossRef]
- Martín-San-Román, R.; Benito-Cia, P.; Azcona-Armendáriz, J.; Cuerva-Tejero, A. Validation of a Free Vortex Filament Wake Module for the Integrated Simulation of Multi-Rotor Wind Turbines. Renew. Energy 2021, 179, 1706–1718. [Google Scholar] [CrossRef]
- Liu, W.; Liu, W.; Zhang, L.; Sheng, Q.; Zhou, B. A Numerical Model for Wind Turbine Wakes Based on the Vortex Filament Method. Energy 2018, 157, 561–570. [Google Scholar] [CrossRef]
- Lee, H.; Lee, D.-J. Numerical Investigation of the Aerodynamics and Wake Structures of Horizontal Axis Wind Turbines by Using Nonlinear Vortex Lattice Method. Renew. Energy 2019, 132, 1121–1133. [Google Scholar] [CrossRef]
- Sedaghatizadeh, N. Effect of Unsteady Flow on Turbine Wake Development and Noise Generation. Available online: https://www.wind-watch.org/documents/effect-of-unsteady-flow-on-wind-turbine-wake-development-and-noise-generation/ (accessed on 17 September 2021).
- Lee, S.-L.; Shin, S. Wind Turbine Blade Optimal Design Considering Multi-Parameters and Response Surface Method. Energies 2020, 13, 1639. [Google Scholar] [CrossRef] [Green Version]
- Lombardi, N.; Ordonez-Sanchez, S.; Zanforlin, S.; Johnstone, C. A Hybrid BEM-CFD Virtual Blade Model to Predict Interactions between Tidal Stream Turbines under Wave Conditions. JMSE 2020, 8, 969. [Google Scholar] [CrossRef]
- Kanyako, F.; Janajreh, I. Investigating Blade Performance of Small Horizontal Axis Wind Turbine Based on Blade Element Momentum Theory. In Proceedings of the IEEE 2013 1st International Conference & Exhibition on the Applications of Information Technology to Renewable Energy Processes and Systems, Amman, Jordan, 29–31 May 2013; pp. 85–90. [Google Scholar] [CrossRef]
- Chen, J.-H.; Wang, X.-C.; Li, H.; Jiang, C.-H. Design of the Blade under Low Flow Velocity for Horizontal Axis Tidal Current Turbine. J. Mar. Sci. Eng. 2020, 8, 989. [Google Scholar] [CrossRef]
- Rao, K.R. Wind Energy: Technical Considerations—Contents. In Wind Energy for Power Generation; Springer International Publishing: Cham, Switzerland, 2019; pp. 1–426. ISBN 978-3-319-75132-0. [Google Scholar]
- Sun, Z.; Chen, J.; Shen, W.Z.; Zhu, W.J. Improved Blade Element Momentum Theory for Wind Turbine Aerodynamic Computations. Renew. Energy 2016, 96, 824–831. [Google Scholar] [CrossRef]
- Forslund, J.; Lundin, S.; Thomas, K.; Leijon, M. Experimental Results of a DC Bus Voltage Level Control for a Load-Controlled Marine Current Energy Converter. Energies 2015, 8, 4572–4586. [Google Scholar] [CrossRef] [Green Version]
- Borkowski, D.; Majdak, M. Small Hydropower Plants with Variable Speed Operation—An Optimal Operation Curve Determination. Energies 2020, 13, 6230. [Google Scholar] [CrossRef]
- Radwan-Pragłowska, N.; Węgiel, T.; Borkowski, D. Application of the Harmonic Balance Method for Spatial Harmonic Interactions Analysis in Axial Flux PM Generators. Energies 2021, 14, 5570. [Google Scholar] [CrossRef]
Publisher’s Note: MDPI stays neutral with regard to jurisdictional claims in published maps and institutional affiliations. |
© 2021 by the authors. Licensee MDPI, Basel, Switzerland. This article is an open access article distributed under the terms and conditions of the Creative Commons Attribution (CC BY) license (https://creativecommons.org/licenses/by/4.0/).