
Lightning Impulse Breakdown Voltage of Rice Bran Oil for Transformer Application


 , ,
, , 
Abstract
1. Introduction
2. Materials and Methods
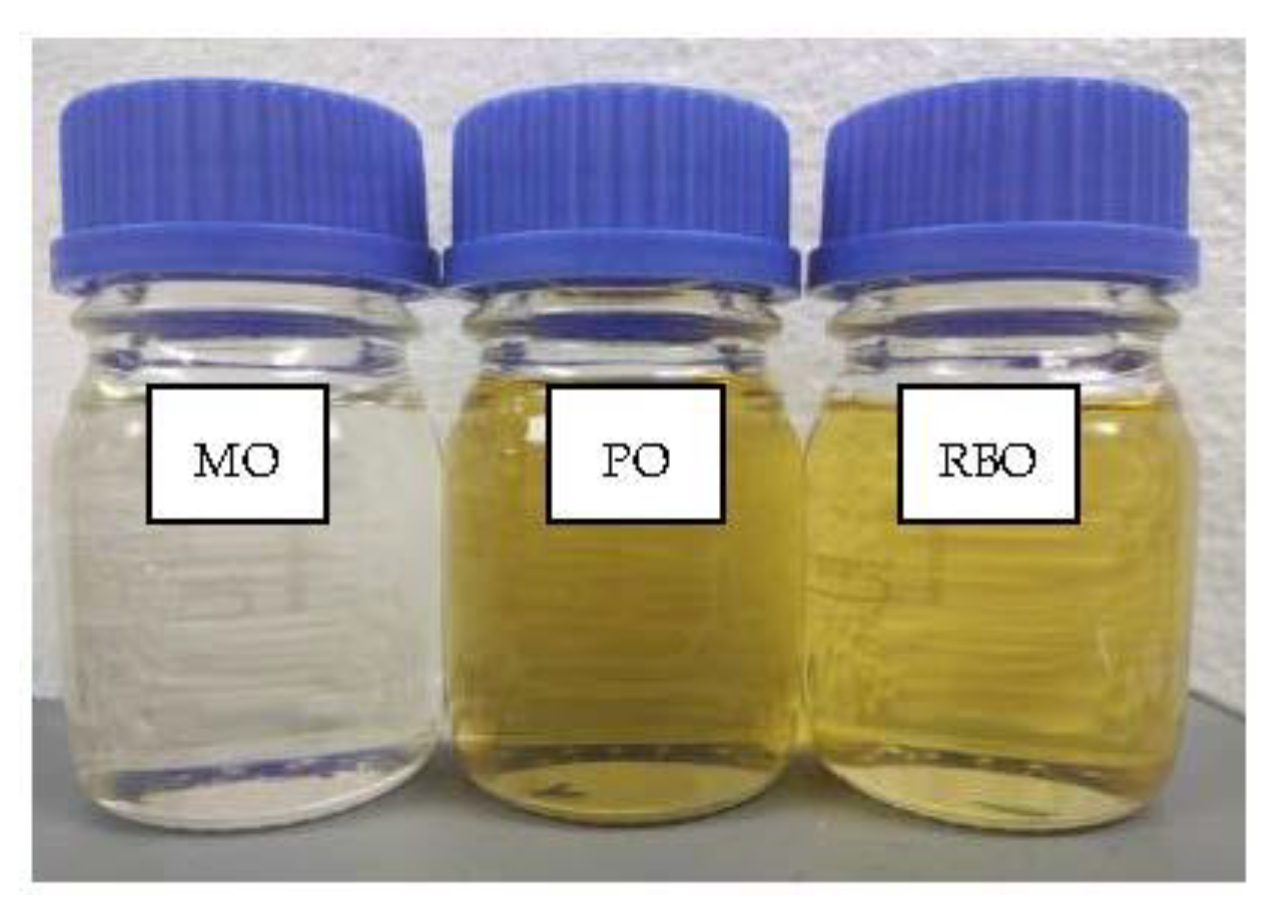
2.1. Preparation of Sample
2.2. Methodology
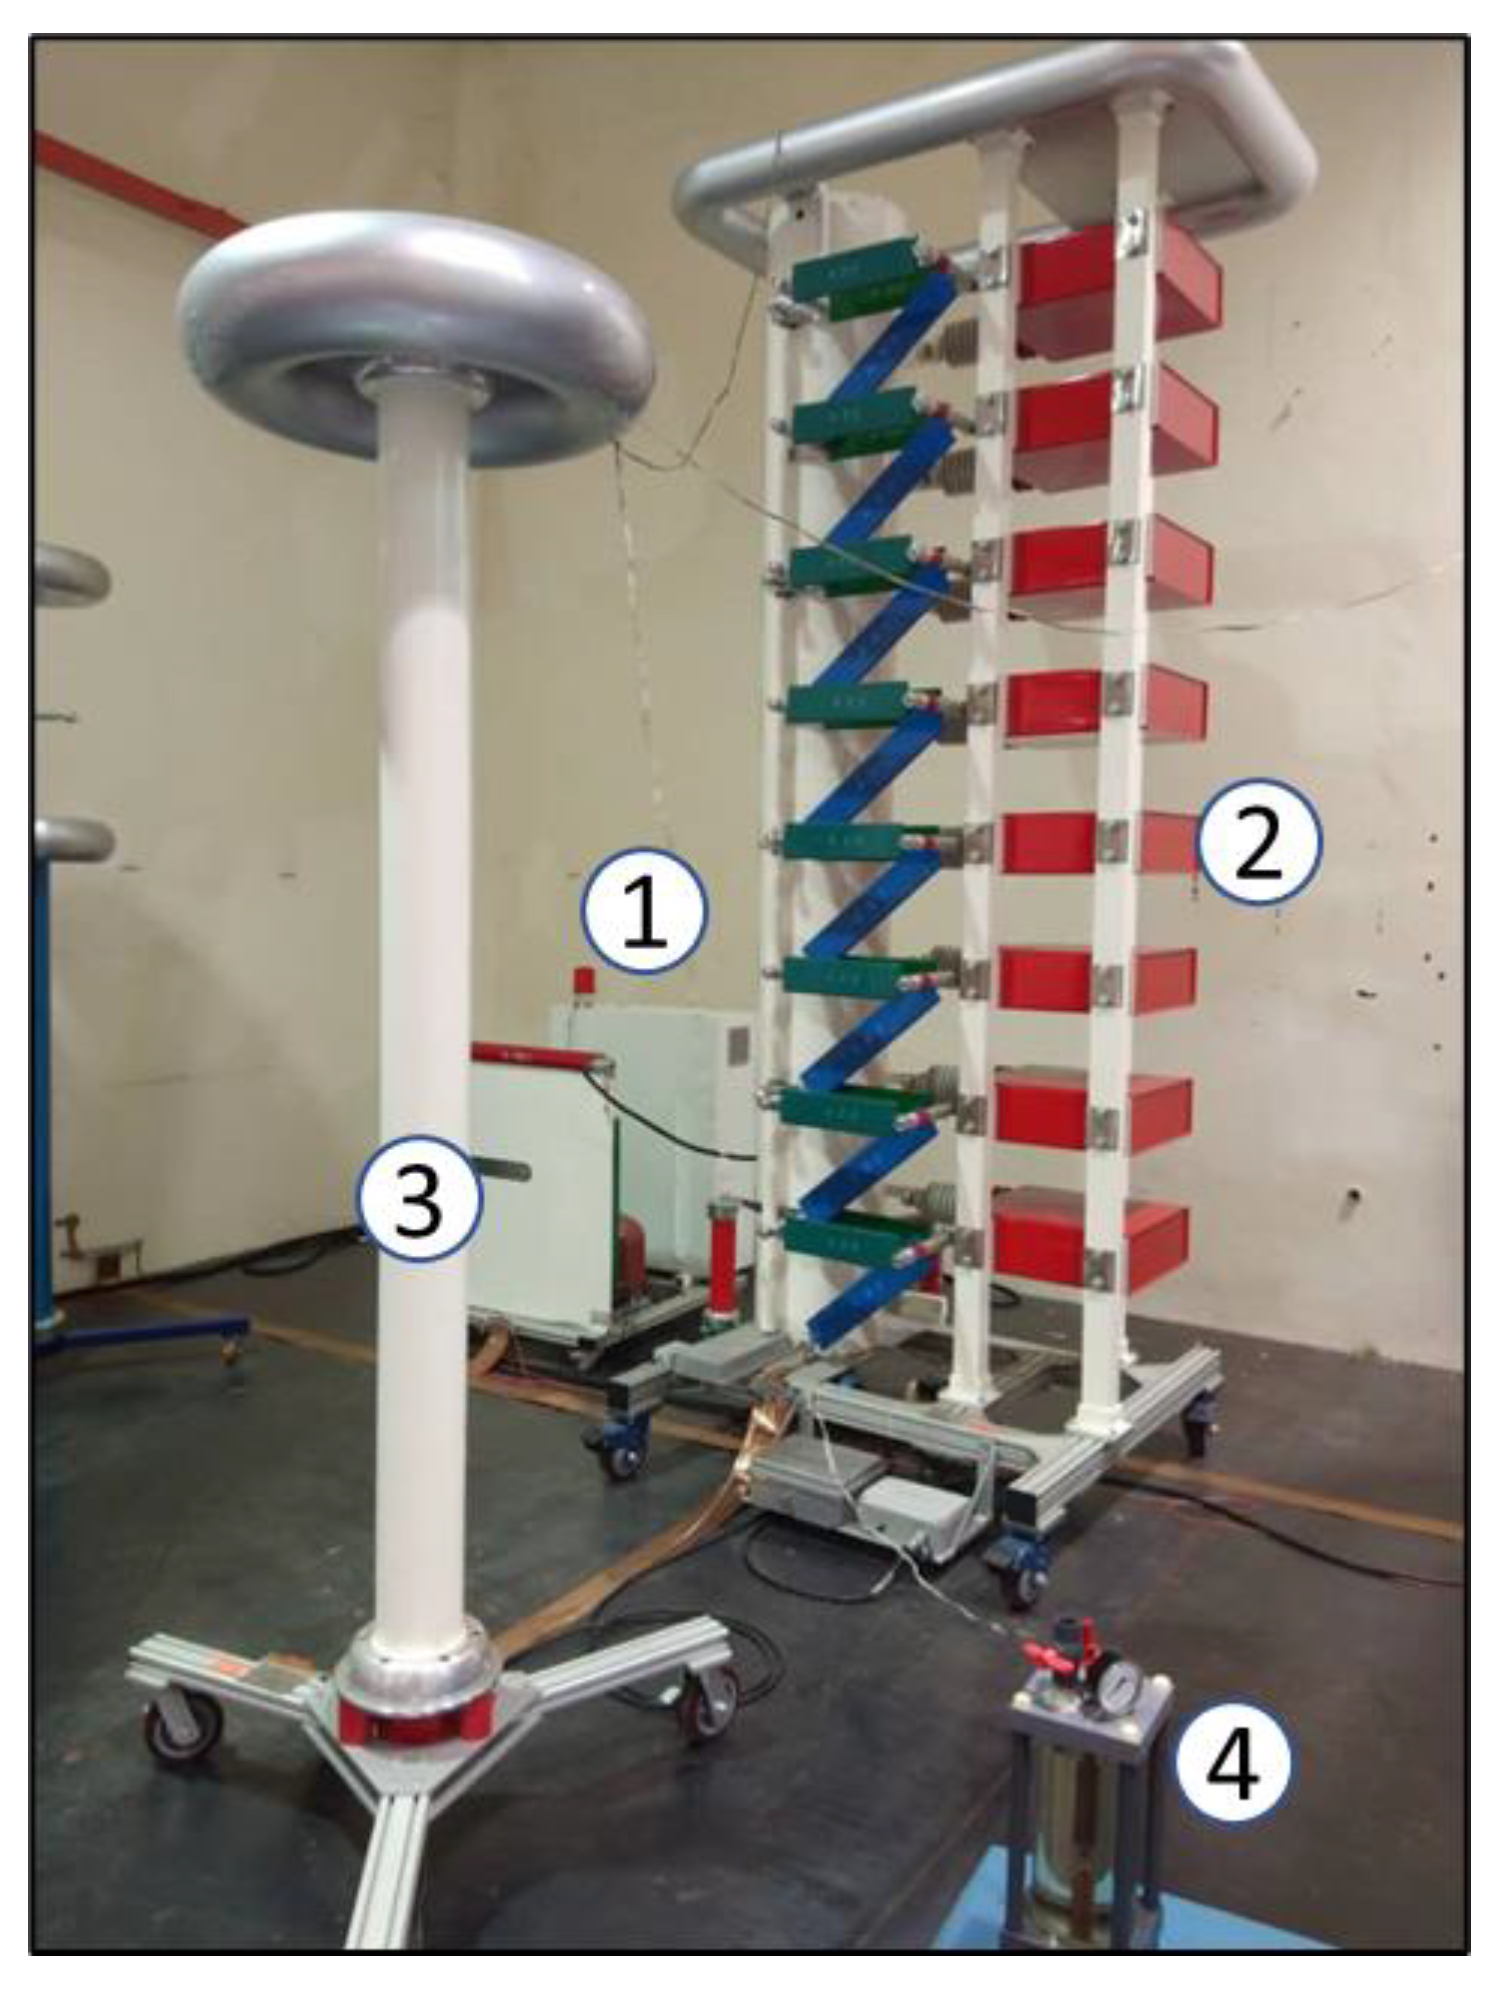
2.2.1. Experimental Setup
2.2.2. Testing Methods
- 1.
- Rising up voltage method
- 2.
- Up and down method
- 3.
- Multiple level method
3. Results and Analysis of Lightning Impulse Breakdown Voltage
3.1. Lightning Impulse Test under Uniform Electric Field
3.2. Lightning Impulse Test under Non-Uniform Electric Field
3.2.1. Effect of Small Gap Distances
3.2.2. Effect of Larger Gap Distances
4. Statistical Analysis of Experimental Data
4.1. Weibull Probability for MO, PO and RBO under Uniform Electric Field
4.2. Weibull Probability for MO, PO and RBO under Non-Uniform Electric Field
4.3. Determination of Empirical Equation for Non-Uniform Electric Field Study
5. Conclusions
Author Contributions
Funding
Institutional Review Board Statement
Informed Consent Statement
Data Availability Statement
Conflicts of Interest
References
- CIGRÉ Working Group 05. An International Survey on Failures in Large Power Transformers in Service. Electra 1988, no. 88. Available online: https://e-cigre.org/publication/ELT_088_1-an-international-survey-on-failures-in-large-power-transformers (accessed on 26 June 2021).
- Kogan, V.I.; Fleeman, J.A.; Provanzana, J.H.; Shih, C.H. Failure analysis of EHV transformers. IEEE Trans. Power Deliv. 1988, 3, 672–683. [Google Scholar] [CrossRef]
- Wang, M.; Vandermaar, A.J.; Srivastava, K.D. Review of condition assessment of power transformers in service. IEEE Electr. Insul. Mag. 2002, 18, 12–25. [Google Scholar] [CrossRef]
- Zhang, X.; Gockenbach, E. Asset-management of transformers based on condition monitoring and standard diagnosis. IEEE Electr. Insul. Mag. 2008, 24, 26–40. [Google Scholar] [CrossRef]
- Fofana, I. 50 years in the development of insulating liquids. IEEE Electr. Insul. Mag. 2013, 29, 13–25. [Google Scholar] [CrossRef]
- Oommen, T.V. Vegetable oils for liquid-filled transformers. IEEE Electr. Insul. Mag. 2002, 1, 6–11. [Google Scholar] [CrossRef]
- Wang, Z.D.; Martin, D.; Khan, I. An Overview of the Suitability of Vegetable Oil Dielectrics for Use in Large Power Transformers; Euro TechCon: Edinburgh, UK, 2006; pp. 1–23. [Google Scholar]
- Mehta, D.M.; Kundu, P.; Chowdhury, A.; Lakhiani, V.K.; Jhala, A.S. A review on critical evaluation of natural ester vis-a-vis mineral oil insulating liquid for use in transformers: Part 1. IEEE Trans. Dielectr. Electr. Insul. 2016, 23, 873–880. [Google Scholar] [CrossRef]
- Mehta, D.M.; Kundu, P.; Chowdhury, A.; Lakhiani, V.K.; Jhala, A.S. A review of critical evaluation of natural ester vis-a-vis mineral oil insulating liquid for use in transformers: Part II. IEEE Trans. Dielectr. Electr. Insul. 2016, 23, 1705–1712. [Google Scholar] [CrossRef]
- Rafiq, M.; Shafique, M.; Azam, A.; Ateeq, M.; Khan, I.; Hussain, A. Sustainable, renewable and environmental-friendly insulation systems for high voltages applications. Molecules 2020, 25, 3901. [Google Scholar] [CrossRef]
- Mendes, D.J.; Reis, A.; Nogawa, E.C.; Ferra, C.; Martins, A.J.; Passos, A.C. Advanced Application of a Natural Ester Vegetable Oil in a HV Power Transformer. Cigre, Session 2008. Available online: https://e-cigre.org/publication/A2-101_2008-advanced-application-of-a-natural-ester-vegetable-oil-in-a-hv-power-transformer (accessed on 26 June 2021).
- Thien, Y.V.; Aziz, N.; Jasni, J.; Kadir, Z.; Yunus, R.; Ishak, M.T.; Yaakub, Z. Evaluation on the lightning breakdown voltages of palm oil and coconut oil under non-uniform field at small gap distances. J. Electr. Eng. Technol. 2016, 11, 184–191. [Google Scholar] [CrossRef]
- Liu, Q.; Wang, Z.D. Streamer characteristic and breakdown in synthetic and natural ester transformer liquids with pressboard interface under lightning impulse voltage. IEEE Trans. Dielectr. Electri. Insul. 2011, 18, 1908–1917. [Google Scholar] [CrossRef]
- Haegele, S.; Tenbohlen, S.; Rapp, K.; Sbravati, A. Comparative study on inhomogeneous field breakdown in natural ester liquid and mineral oil. In Proceedings of the 2016 IEEE Conference on Electrical Insulation and Dielectric Phenomena (CEIDP), Toronto, ON, Canada, 16–19 October 2016; pp. 375–379. [Google Scholar]
- Thien, Y.V.; Azis, N.; Jasni, J.; Ab Kadir, M.Z.A.; Yunus, R.; Mohd Jamil, M.K.; Yaakub, Z. Pre-breakdown streamer propagation and breakdown characteristics of refined bleached and deodorized palm oil under lightning impulse voltage. IEEE Trans. Dielectr. Electr. Insul. 2018, 25, 1614–1620. [Google Scholar] [CrossRef]
- Haegele, S.; Tenbohlen, S.; Fritsche, R.; Rapp, K.; Sbravati, A. Characterization of inhomogeneous field breakdown in natural ester liquid compared to mineral oil. In Proceedings of the 2016 IEEE International Conference on High Voltage Engineering and Application (ICHVE), Chengdu, China, 19–22 September 2016. [Google Scholar]
- Jing, Y.; Timoshkin, I.V.; Wilson, M.P.; Given, M.J.; Macgregor, S.J.; Wang, T.; Lehr, J.M. Dielectric properties of natural ester, synthetic ester midel 7131 and mineral oil Diala D. IEEE Trans. Dielectr. Electr. Insul. 2014, 21, 644–652. [Google Scholar] [CrossRef]
- Xiang, C.; Zhou, Q.; Li, J.; Huang, Q.; Song, H.; Zhang, Z. Comparison of dissolved gases in mineral and vegetable insulating oils under typical electrical and thermal faults. Energies 2016, 9, 312. [Google Scholar] [CrossRef]
- Cheong, L.Z.; Xu, X. Rice Bran and Rice Bran Oil, Chemistry, Processing, and Utilization; AOCS Press: Urbana, IL, USA, 2019. [Google Scholar]
- Maszewska, M.; Florowska, A.; Dłużewska, E.; Wroniak, M.; Marciniak-Lukasiak, K.; Żbikowska, A. Oxidative stability of selected edible oils. Molecules 2018, 23, 1746. [Google Scholar] [CrossRef] [PubMed]
- Kumar, S.S.; Iruthayarajan, M.W.; Bakrutheen, M. Investigations on the suitability of rice bran oil and corn oil as alternative insulating liquids for transformers. IEEJ Trans. Electr. Electron. Eng. 2016, 11, 10–14. [Google Scholar] [CrossRef]
- Kumar, S.S.; Iruthayarajan, M.W.; Bakrutheen, M. Analysis of vegetable liquid insulating medium for applications in high voltage transformers. In Proceedings of the 2014 International Conference on Science Engineering and Management Research (ICSEMR), Chennai, India, 27–29 November 2014. [Google Scholar]
- Hamid, M.H.A.; Ishak, M.T.; Din, M.F.; Suhaimi, N.S.; Katim, N.I.A. Dielectric properties of natural ester oils used for transformer application under temperature variation. In Proceedings of the 2016 IEEE International Conference on Power and Energy (PECon), Melaka, Malaysia, 28–29 November 2016. [Google Scholar]
- Kunju, K.B.; Shemim, S.S. Dielectric properties of eco-friendly nanofluids. J. Phys. Conf. Ser. 2019, 1355, 012034. [Google Scholar] [CrossRef]
- Joeljoshuva, P.; Prabhu, A.; Kumar, R.A.; Kumar, S.S. Investigation of various natural esters insulating medium for the applications in high voltage machinery. Int. J. Adv. Res. Basic Eng. Sci. Technol. 2018, 4, 327–332. [Google Scholar]
- Deepa, S.N.; Srinivasan, A.D.; Veeramanju, K.T.; Sandeep Kumar, R.; Mathapati, A. Suitability of alternative insulating fluid for power transformer: A laboratory investigation. World Acad. Sci. Eng. Technol. Int. J. Electr. Comput. Eng. 2019, 13, 685–688. [Google Scholar]
- Katim, N.I.A.; Ishak, M.T.; Amin, N.A.M.; Hamid, M.H.A.; Ahmad, K.A.; Azis, N. Lightning breakdown voltage evaluation of palm oil and coconut oil as transformer oil under quasi-uniform field conditions. Energies 2018, 11, 2676. [Google Scholar] [CrossRef]
- Thien, Y.V.; Azis, N.; Jasni, J.; Kadir, N.; Yunus, R.; Ishak, M.T.; Yaakub, Z. The effect of polarity on the lightning breakdown voltages of palm oil and coconut oil under a non-uniform field for transformers application. Ind. Crop. Prod. 2016, 89, 250–256. [Google Scholar] [CrossRef]
- IEC-60897-1987, Methods for the Determination of the Lightning Impulse Breakdown Voltage of Insulating Liquids; International Electrotechnical Commission: Geneva, Switzerland, 1987.
- ASTM. ASTM D3300. Standard Test Method for Dielectric Breakdown Voltage of Insulating Liquids under Impulse Conditions; ASTM: Philadelphia, NJ, USA, 2012. [Google Scholar]
- Dang, V.H.; Beroual, A.; Al-Ammar, E.; Qureshi, M. Streamer propagation in seed based insulating oils under lightning impulse voltages. In Proceedings of the 2012 International Conference on High Voltage Engineering and Application, Shanghai, China, 17–20 September 2012; pp. 659–662. [Google Scholar]
- Haegele, S.; Vahidi, F.; Tenbohlen, S.; Rapp, K.J.; Sbravati, A. Lightning impulse withstand of natural ester liquid. Energies 2018, 11, 1964. [Google Scholar] [CrossRef]
- Loiselle, L.; Fofana, I.; Olivares-Galvan, J.C.; Campero, E. Stability of environmentally friendly fluids under electrical and thermal stresses. In Proceedings of the 2012 IEEE International Symposium on Electrical Insulation, San Juan, PR, USA, 10–13 June 2012; pp. 483–486. [Google Scholar]
- Malik, A.A.A. Chemically modified Palm Kernel Oil Ester: A possible sustainable alternative insulating liquid. Sustain. Mater. Technol. 2014, 1, 42–51. [Google Scholar]
- Liu, Q.; Wang, Z.D.; Perrot, F. Impulse breakdown voltages of ester-based transformer oils determined by using different test methods. In Proceedings of the 2009 IEEE Conference on Electrical Insulation and Dielectric Phenomena (CEIDP), Virginia Beach, VA, USA, 18–21 October 2009; pp. 608–612. [Google Scholar]
- Lu, W.U. Pre-Breakdown and Breakdown Phenomena of Alternative Transformer Liquids under Lightning Impulse Voltages. Ph.D. Thesis, University of Manchester, Manchester, UK, 2015. [Google Scholar]
- Liu, Q. Electrical Performance of Ester Liquids under Impulse Voltage for Application in Power Transformers. Ph.D. Thesis, University of Manchester, Manchester, UK, 2011. [Google Scholar]
- Liu, R.; Törnkvist, C.; Chandramouli, V.; Girlanda, O.; Pettersson, L. Geometry impact on streamer propagation in transformer insulation liquids. In Proceedings of the 2010 Annual Report Conference on Electrical Insulation and Dielectic Phenomena, West Lafayette, IN, USA, 17–20 October 2010; pp. 17–20. [Google Scholar]
- Wang, P.; Liu, Z.D.; Wang, Q.; Yi, X.; Jarman, X.; Wilson, P.; Dyer, G. Ester insulating liquids for power transformers. In Proceedings of the CIGRE 2012, Paris, France, 26–31 August 2012. [Google Scholar]
- Thien, Y.V.; Azis, N.; Jasni, J.; Yunus, R.; Kadir, M.Z.A.A.; Yaakub, Z. Influence of electrode geometry on the lightning impulse breakdown voltage of palm oil. In Proceedings of the 2018 IEEE PES Asia-Pacific Power and Energy Engineering Conference (APPEEC), Kota Kinabalu, Malaysia, 7–10 October 2018. [Google Scholar]
- Liu, R.; Jaksts, A. Breakdown processes in transformer insulation under LI voltages. In Proceedings of the IEEE International Conference on Dielectric Liquids, Coimbra, Portugal, 26 June–1 July 2005. [Google Scholar]
- Sankar, P.B. Measurement of Air Breakdown Voltage and Electric Field Using Standard Sphere Gap Method. Master’s Thesis, Department of Electrical Engineering, National Institute of Technology, Rourkela, India, 2011. [Google Scholar]
- Liu, Q.; Wang, Z.D. Breakdown and withstand strengths of ester transformer liquids in a quasi-uniform field under impulse voltages. IEEE Trans. Dielectr. Electr. Insul. 2013, 20, 571–579. [Google Scholar] [CrossRef]
- Martin, D. Evaluation of the Dielectric Capability of Ester Based Oils for Power Transformers. Ph.D. Thesis, University of Manchester, Manchester, UK, 2007. [Google Scholar]
- Martin, R. Experiences in Service with New Insulating Liquids. Cigre A2-35, October 2010. Available online: https://static.mimaterials.com/midel/documents/sales/New_Experiences_in_Service_with_New_Insulating_Liquids.pdf (accessed on 18 June 2021).
- Beroual, A.; Dang, V.H. Fractal Analysis of lightning impulse surface discharges propagating over pressboard immersed in mineral and vegetable oils. IEEE Trans. Dielectr. Electr. Insul. 2013, 20, 1402–1408. [Google Scholar] [CrossRef]
- Beroual, A.; Zahn, M.; Badent, A.; Kist, K.; Schwabe, A.J.; Yamashita, H.; Yamazawa, K.; Danikas, M.; Chadband, W.D.; Torshin, Y. Propagation and structure of streamers in liquid dielectrics. IEEE Electr. Insul. Mag. 1998, 14, 6–17. [Google Scholar] [CrossRef]
- Wedin, P. Electrical breakdown in dielectric liquids-a short overview. IEEE Electr. Insul. Mag. 2014, 30, 20–25. [Google Scholar] [CrossRef]
- Essam, A.A.-A. Optical observation of streamer propagation and breakdown in seed based insulating oil under impulse voltage. Int. J. Phys. Sci. 2014, 9, 292–301. [Google Scholar] [CrossRef]
- Martin, D.; Wang, Z.D. Statistical analysis of the AC breakdown voltages of ester-based transformer oils. IEEE Trans. Dielectr. Electr. Insul. 2008, 15, 1044–1050. [Google Scholar] [CrossRef]
- Peppas, G.D.; Pyrgioti, E.C.; Charalampakos, V.P. Investigation of statistical breakdown in mineral and natural ester oils under AC voltage. In Proceedings of the 18th International Symposium on High Voltage Engineering, Seoul, Korea, 25–30 August 2013; pp. 25–30. [Google Scholar]
- Yuan, W.; Wang, T.; Ni, H.; Gao, M.; Ding, Y.; Li, Y.; Zhao, Y.; Zhang, Q. Weibull statistical analysis of size effects on the impulse breakdown strength in transformer oil. In Proceedings of the 2017 IEEE 19th International Conference on Dielectric Liquids (ICDL), Manchester, UK, 25–29 June 2017; pp. 29–32. [Google Scholar]
- Wilson, M.P.; Given, M.; Timoshkin, I.; Macgregor, S.; Wang, T.; Sinclair, M.; Thomas, K.; Lehr, J. Impulse-driven surface breakdown Data: A weibull statistical analysis. IEEE Trans. Plasma Sci. 2012, 40, 2449–2456. [Google Scholar] [CrossRef]
- Thien, Y.V.; Azis, N.; Jasni, J.; Ab Kadir, M.Z.A.; Yunus, R.; Ishak, M.T.; Yaakub, Z. Investigation on the lightning breakdown voltage of palm oil and coconut oil under non-uniform field. In Proceedings of the 2014 IEEE International Conference on Power and Energy (PECon), Kuching, Malaysia, 1–3 December 2014; pp. 1–4. [Google Scholar]


| Parameter | Specification |
|---|---|
| Product | Hyrax hypertrans transformer oil |
| Appearance | Clear and bright |
| Standards requirement | IEC 60296: 2003 |
| Pour point (°C) | −40 |
| Flash point (°C) | 135 |
| Viscosity (mm²/s) at 40 °C Viscosity (mm²/s) at 100 °C Density at 15 °C (kg/m3) Moisture content (ppm) Particle contamination (µm) | 10.4 3.3 880.5 7 32 |
| Characteristic | PO | RBO |
|---|---|---|
| Saturated fat (g) | 45.4 | 22.3 |
| Mono-unsaturated fat (g) | 43.0 | 42.3 |
| Poly-unsaturated fat (g) | 11.6 | 35.4 |
| Vitamin E (mg) | 4.4 | 1 |
| Pour Point (°C) | −27 | −33 |
| Flash Point (°C) | 283 | 297 |
| Viscosity (mm2/s) at 40 °C Viscosity (mm²/s) at 100 °C Density at 15 °C (kg/m3) Mositure content (ppm) Particle contamination (µm) | 45 12.6 915.5 96 51 | 42 10.2 886 84 44 |
| Impulse Breakdown Voltage (kV) at 2.0 mm Gap Distance | |||||||
| MO | PO | Diff Oil% | RBO | Diff Oil% | |||
| Mean | SD | Mean | SD | Mean | SD | ||
| 130.8 | 9.3 | 121.0 | 5.3 | 7.4 | 122.0 | 6.0 | 6.7 |
| Impulse Breakdown Voltage (kV) at 3.8 mm Gap Distance | |||||||
| MO | PO | Diff Oil% | RBO | Diff Oil% | |||
| Mean | SD | Mean | SD | Mean | SD | ||
| 224.0 | 17.2 | 196.1 | 17.5 | 12.5 | 200.2 | 16.0 | 10.6 |
| Impulse Breakdown Voltage (kV) at 6.0 mm Gap Distance | |||||||
| MO | PO | Diff Oil% | RBO | Diff Oil% | |||
| Mean | SD | Mean | SD | Mean | SD | ||
| 291.3 | 7.7 | 252.5 | 14.9 | 13.3 | 256.1 | 13.9 | 12.1 |
| Samples | LI Breakdown Voltage at 2.0 mm Gap Distance (kV) | ||||
| Testing Methods | |||||
| Rising Voltage | Up and down | Method Diff% | Multiple Level | Method Diff% | |
| MO | 125.32 | 129.50 | 4.42 | 135.78 | 9.48 |
| PO | 115.85 | 119.97 | 2.99 | 122.43 | 5.10 |
| RBO | 119.91 | 119.71 | 0.67 | 125.38 | 5.14 |
| Samples | LI Breakdown Voltage at 3.8 mm Gap Distance (kV) | ||||
| Testing Methods | |||||
| Rising Voltage | Up and down | Method Diff% | Multiple Level | Method Diff% | |
| MO | 213.81 | 214.77 | 0.45 | 238.66 | 11.62 |
| PO | 187.26 | 190.26 | 2.21 | 206.35 | 10.19 |
| RBO | 194.58 | 191.40 | 2.22 | 211.95 | 8.93 |
| Samples | LI Breakdown voltage at 6.0 mm gap distance (kV) | ||||
| Testing Methods | |||||
| Rising Voltage | Up and down | Method Diff% | Multiple Level | Method Diff% | |
| MO | 293.83 | 286.54 | 2.48 | 292.93 | 0.31 |
| PO | 251.85 | 243.23 | 3.42 | 251.70 | 3.25 |
| RBO | 261.45 | 256.56 | 1.87 | 260.04 | 3.73 |
| Samples | Lightning Impulse Breakdown Voltage (kV) | |
|---|---|---|
| Gap Distances (mm) | ||
| 2.0 | 3.8 | |
| MO in this study | 130.76 | 224.03 |
| MO of previous study | 140.3 | 236.33 |
| Diff% | 6.8 | 5.2 |
| PO in this study | 121.03 | 196.14 |
| PO of previous study | 130.67 | 206 |
| Diff% | 7.4 | 4.8 |
| Impulse Breakdown Voltage (kV) at 2.0 mm Gap Distance | |||||||
| MO | PO | Diff Oil% | RBO | Diff Oil% | |||
| Mean | SD | Mean | SD | Mean | SD | ||
| 83.31 | 4.57 | 73.02 | 4.14 | 7.22 | 74.19 | 5.21 | 5.73 |
| Impulse Breakdown Voltage (kV) at 3.8 mm Gap Distance | |||||||
| MO | PO | Diff Oil% | RBO | Diff Oil% | |||
| Mean | SD | Mean | SD | Mean | SD | ||
| 111.19 | 6.60 | 98.87 | 6.6 | 11.08 | 97.53 | 5.66 | 12.29 |
| Impulse Breakdown Voltage (kV) at 6.0 mm Gap Distance | |||||||
| MO | PO | Diff Oil% | RBO | Diff Oil% | |||
| Mean | SD | Mean | SD | Mean | SD | ||
| 133.00 | 5.49 | 115.81 | 5.84 | 12.92 | 118.1 | 5.09 | 11.18 |
| Samples | Breakdown Voltage at 2.0 mm Gap Distance (kV) | ||||
| Testing Methods | |||||
| Rising Voltage | Up and down | Method Diff% | Multiple Level | Method Diff% | |
| MO | 78.75 | 76.15 | 4.20 | 82.06 | 3.30 |
| PO | 72.61 | 71.88 | 3.79 | 74.71 | 2.81 |
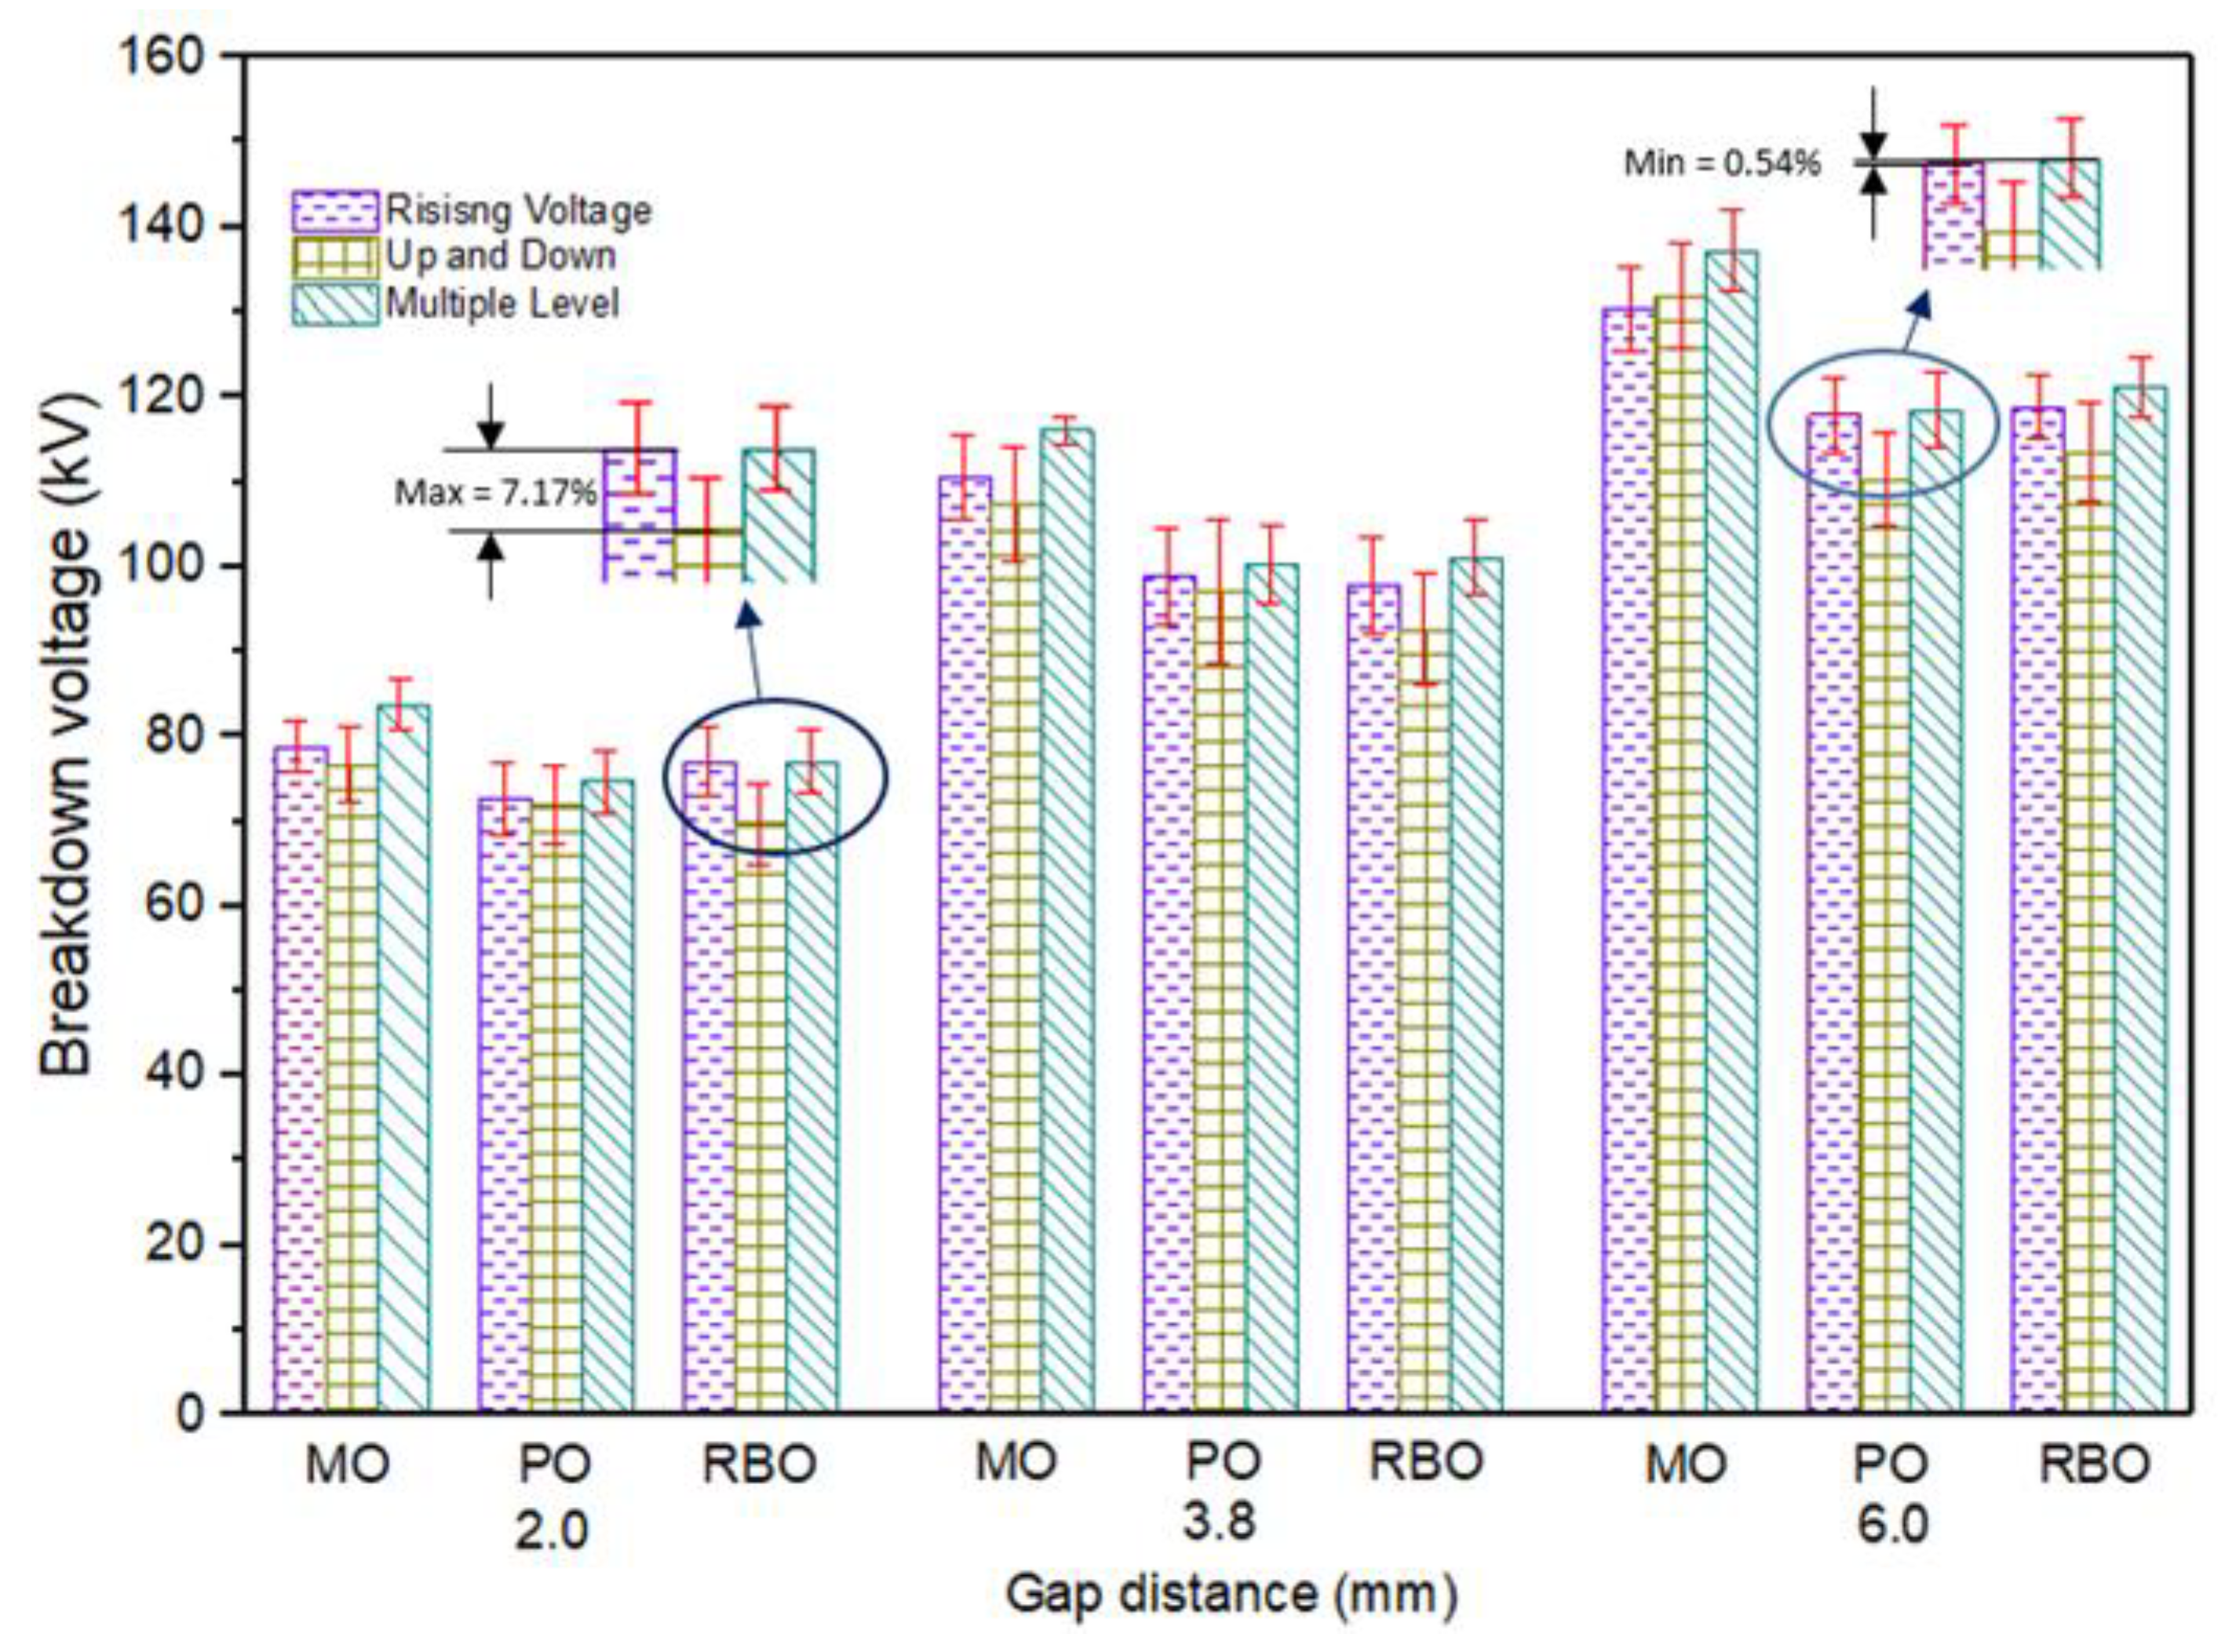
| RBO | 75.01 | 69.63 | 7.17 | 77.01 | 2.67 |
| Samples | Breakdown Voltage at 3.8 mm Gap Distance (kV) | ||||
| Testing Methods | |||||
| Rising Voltage | Up and down | Method Diff% | Multiple Level | Method Diff% | |
| MO | 110.48 | 107.32 | 7.50 | 116.02 | 4.78 |
| PO | 98.84 | 97.14 | 1.72 | 100.18 | 1.36 |
| RBO | 97.72 | 92.54 | 5.30 | 101.13 | 3.49 |
| Samples | Breakdown Voltage at 6.0 mm Gap Distance (kV) | ||||
| Testing Methods | |||||
| Rising Voltage | Up and down | Method Diff% | Multiple level | Method Diff% | |
| MO | 130.30 | 131.89 | 5.28 | 137.18 | 1.22 |
| PO | 117.79 | 110.34 | 6.32 | 118.43 | 0.54 |
| RBO | 118.83 | 113.51 | 4.48 | 121.08 | 1.89 |
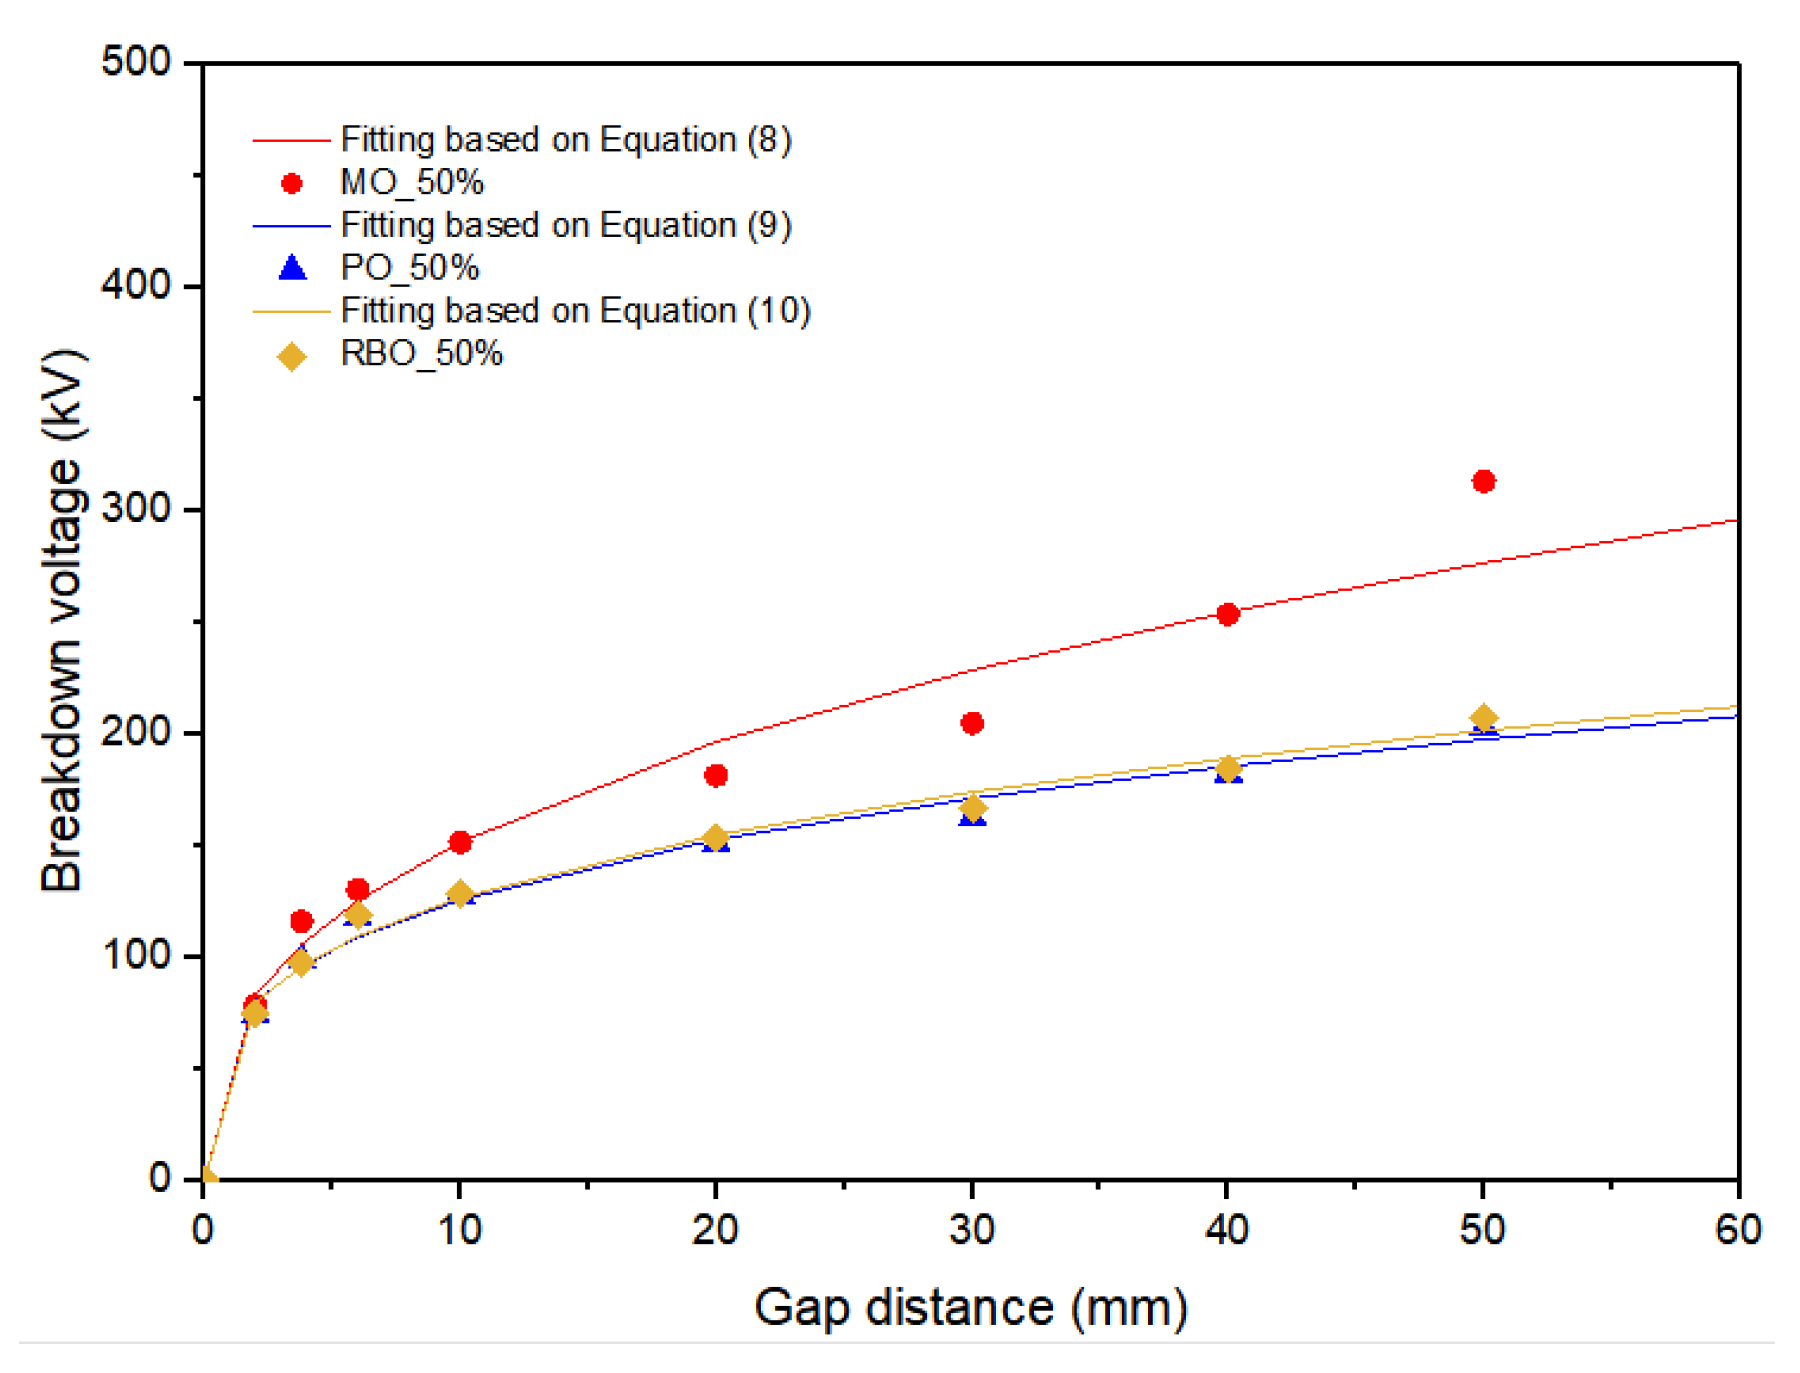
| Oil Samples | 50% Breakdown Voltage (kV) at Various Gap Distances (mm) | |||||
|---|---|---|---|---|---|---|
| 10.0 | 20.0 | 30.0 | 40.0 | 50.0 | ||
| MO | Mean | 151.41 | 181.22 | 203.78 | 252.77 | 312.22 |
| SD | 2.07 | 2.19 | 10.09 | 1.90 | 3.58 | |
| PO | Mean | 127.46 | 150.19 | 162.39 | 181.73 | 202.60 |
| SD | 1.96 | 5.90 | 1.48 | 3.60 | 4.57 | |
| Diff% | 15.82 | 17.12 | 20.31 | 28.10 | 35.11 | |
| RBO | Mean | 128.81 | 153.41 | 166.47 | 184.45 | 207.31 |
| SD | 0.89 | 0.90 | 2.44 | 1.58 | 3.89 | |
| Diff% | 14.9 | 15.35 | 20.31 | 27.04 | 33.62 | |
| Breakdown Probability | Impulse Breakdown Voltage (kV) at 2.0 mm Gap Distance | ||
| MO | PO | RBO | |
| 1% | 100.19 | 100.60 | 108.13 |
| 50% | 131.76 | 122.50 | 120.4 |
| Shape, α | 1.48 | 1.09 | 0.49 |
| Scale, β | 130.37 | 121.46 | 119.91 |
| Breakdown Probability | Impulse Breakdown Voltage (kV) at 3.8 mm Gap Distance | ||
| MO | PO | RBO | |
| 1% | 177.81 | 153.97 | 138.55 |
| 50% | 226.65 | 202.54 | 198.22 |
| Shape, α | 2.44 | 2.26 | 2.48 |
| Scale, β | 224.04 | 200.23 | 196.14 |
| Breakdown Probability | Impulse Breakdown Voltage (kV) at 6.0 mm Gap Distance | ||
| MO | PO | RBO | |
| 1% | 260.99 | 209.96 | 196.71 |
| 50% | 292.13 | 258.00 | 254.21 |
| Shape, α | 1.09 | 1.98 | 2.12 |
| Scale, β | 291.28 | 256.08 | 252.54 |
| Breakdown Probability | Impulse Breakdown Voltage (kV) at 2.0 mm Gap Distance | ||
| MO | PO | RBO | |
| 1% | 63.44 | 59.89 | 57.71 |
| 50% | 79.31 | 73.60 | 74.87 |
| Shape, α | 8.97 | 10.5 | 6.27 |
| Scale, β | 80.85 | 74.93 | 76.57 |
| Breakdown Probability | Impulse Breakdown Voltage (kV) at 3.8 mm Gap Distance | ||
| MO | PO | RBO | |
| 1% | 94.39 | 79.08 | 80.74 |
| 50% | 112.27 | 99.77 | 98.31 |
| Shape, α | 12.38 | 18.20 | 17.52 |
| Scale, β | 113.98 | 101.82 | 100.00 |
| Breakdown Probability | Impulse Breakdown Voltage (kV) at 6.0 mm Gap Distance | ||
| MO | PO | RBO | |
| 1% | 113.73 | 96.90 | 103.68 |
| 50% | 133.75 | 116.57 | 118.96 |
| Shape, α | 16.03 | 22.93 | 21.00 |
| Scale, β | 135.63 | 118.45 | 120.32 |
| Breakdown Probability | Impulse Breakdown Voltage (kV) at 10.0 mm Gap Distance | ||
| MO | PO | RBO | |
| 1% | 142.30 | 121. 11 | 125.75 |
| 50% | 151.62 | 127.84 | 128.96 |
| Shape, α | 18.07 | 13.14 | 19.64 |
| Scale, β | 151.41 | 127.46 | 128.82 |
| Breakdown Probability | Impulse Breakdown Voltage (kV) at 20.0 mm Gap Distance | ||
| MO | PO | RBO | |
| 1% | 175.22 | 132.31 | 149.95 |
| 50% | 181.60 | 150.96 | 153.46 |
| Shape, α | 20.10 | 21.03 | 18.02 |
| Scale, β | 181.23 | 150.19 | 153.42 |
| Breakdown Probability | Impulse Breakdown Voltage (kV) at 30.0 mm Gap Distance | ||
| MO | PO | RBO | |
| 1% | 189.45 | 157.12 | 158.61 |
| 50% | 204.93 | 162.70 | 166.97 |
| Shape, α | 12.46 | 17.06 | 13.11 |
| Scale, β | 203.78 | 162.39 | 166.48 |
| Breakdown Probability | Impulse Breakdown Voltage (kV) at 40.0 mm Gap Distance | ||
| MO | PO | RBO | |
| 1% | 246.72 | 172.29 | 180.58 |
| 50% | 253.66 | 182.41 | 184.68 |
| Shape, α | 6.15 | 7.84 | 9.42 |
| Scale, β | 234.71 | 181.74 | 184.45 |
| Breakdown Probability | Impulse Breakdown Voltage (kV) at 50.0 mm Gap Distance | ||
| MO | PO | RBO | |
| 1% | 287.75 | 192.97 | 195.13 |
| 50% | 313.47 | 203.36 | 207.01 |
| Shape, α | 5.29 | 8.82 | 7.48 |
| Scale, β | 315.78 | 202.60 | 207.32 |
Publisher’s Note: MDPI stays neutral with regard to jurisdictional claims in published maps and institutional affiliations. |
© 2021 by the authors. Licensee MDPI, Basel, Switzerland. This article is an open access article distributed under the terms and conditions of the Creative Commons Attribution (CC BY) license (https://creativecommons.org/licenses/by/4.0/).
Share and Cite
Abdul Hamid, M.H.; Ishak, M.T.; Suhaimi, N.S.; Adnan, J.; Makmor, N.F.; Katim, N.I.A.; Abd Rahman, R. Lightning Impulse Breakdown Voltage of Rice Bran Oil for Transformer Application. Energies 2021, 14, 5084. https://doi.org/10.3390/en14165084
Abdul Hamid MH, Ishak MT, Suhaimi NS, Adnan J, Makmor NF, Katim NIA, Abd Rahman R. Lightning Impulse Breakdown Voltage of Rice Bran Oil for Transformer Application. Energies. 2021; 14(16):5084. https://doi.org/10.3390/en14165084
Chicago/Turabian StyleAbdul Hamid, Mardhiah Hayati, Mohd Taufiq Ishak, Nur Sabrina Suhaimi, Jaafar Adnan, Nazrul Fariq Makmor, Nurul Izzatul Akma Katim, and Rahisham Abd Rahman. 2021. "Lightning Impulse Breakdown Voltage of Rice Bran Oil for Transformer Application" Energies 14, no. 16: 5084. https://doi.org/10.3390/en14165084
APA StyleAbdul Hamid, M. H., Ishak, M. T., Suhaimi, N. S., Adnan, J., Makmor, N. F., Katim, N. I. A., & Abd Rahman, R. (2021). Lightning Impulse Breakdown Voltage of Rice Bran Oil for Transformer Application. Energies, 14(16), 5084. https://doi.org/10.3390/en14165084