Abstract
To support farmers and improve the quality of crops production, designing of smart greenhouses is becoming indispensable. In this paper, a novel prototype for remote monitoring of a greenhouse is designed. The prototype allows creating an adequate artificial environment inside the greenhouse (e.g., water irrigation, ventilation, light intensity, and CO2 concentration). Thanks to the Internet of things technique, the parameters controlled (air temperature, relative humidity, capacitive soil moisture, light intensity, and CO2 concentration) were measured and uploaded to a designed webpage using appropriate sensors with a low-cost Wi-Fi module (NodeMCU V3). An Android mobile application was also developed using an A6 GSM module for notifying farmers (e.g., sending a warning message in case of any anomaly) regarding the state of the plants. A low-cost camera was used to collect and send images of the plants via the webpage for possible diseases identification and classification. In this context, a deep learning convolutional neural network was developed and implemented into a Raspberry Pi 4. To supply the prototype, a small-scale photovoltaic system was built. The experimental results showed the feasibility and demonstrated the ability of the prototype to monitor and control the greenhouse remotely, as well as to identify the state of the plants. The designed smart prototype can offer real-time remote measuring and sensing services to farmers.
1. Introduction
Currently, the problems of climate change and environmental damage (due to CO2 emissions when burning fossil sources such as gas, oil, coal, etc.) have further serious problems of food and agricultural productivity [1]. The procedure of producing high-quality crops is very important to meet the increasing demand of food products around the world. The industry of greenhouses is become a more fast-growing sector around the world. The greenhouse splits the crop from the environment, thus providing some sort of housing from the direct influence of external weather conditions. A greenhouse is mainly designed as a light transparent shelter to improve environmental conditions for plant production quality. Greenhouses are used to make a suitable atmosphere for planting and preventing plants from exposure to harsh environmental conditions, such as heavy rainfall or high solar radiation [2].
High or low temperatures, high humidity, CO2 concentration, aeration, condensation of water, and water evaporation inside the greenhouse are among the major challenges faced by traditional greenhouses. Therefore, to achieve maximum returns from greenhouse cultivations, it is vital to maintain an environment that minimizes energy consumption [3]. Many parameters such as air temperature (Ta), relative humidity (RH), soil moisture (SM), light intensity (LI), and carbon dioxide (CO2) concentration are involved and dependent on each other; this makes the greenhouse climate control a complicated procedure [4].
In the last decades, greenhouse climate monitoring and control problems have received considerable attention in agriculture engineering research [5]. Recently, researchers are more and more attracted to the application of the Internet of things (IoT) [6] to modernize greenhouses by designing smart monitoring systems [7] and creating artificial environments [8].
For example, Castañeda-Miranda and Castaño-Meneses [9] developed an automatic system for monitoring crops inside a greenhouse using solar energy and the IoT technique so that users could easily monitor the temperature, watering, and light through a mobile application. A wireless system enabling communication between the central control unit and four robots that worked in a model greenhouse was developed by Kumar et al. [10]; the results showed the potential of the system for application in real-life greenhouse operations. Chie et al. [11] designed an IoT-based system to monitor the environmental factors of an orchid greenhouse and the growth status of Phalaenopsis at the same time. As indicated by the authors, the system shows a great potential to provide quantitative information with high spatiotemporal resolution to floral farmers. Liao et al. [12] compared microclimate parameters inside two different tropical greenhouses using a custom-built wireless sensor for data fusion. A detailed review about the use of the IoT in the agricultural sector including greenhouses, various sensors which aid the IoT and agriculture, their applications, challenges, advantages, and disadvantages are reported in this paper [13].
Diesel is mainly used to supply greenhouses (e.g., for water pumping, irrigation, etc.) in remote areas, which is costly (e.g., in Saharan regions) [14]; however, currently, the utilization of solar energy (such as photovoltaic) for supplying greenhouses in remote areas is considered to be among the important applications of renewable energy sources [15]. The possibility to apply photovoltaic energy and the IoT to monitor greenhouses was shown by Aschilean et al. [16].
Another issue is the greenhouse crop diseases identification and early classification; recently, attempts have been made to design efficient approaches based on the IoT technique and image processing [17], for example, Mishra et al. [18] designed an IoT-based strawberry disease prediction system for smart farming; the capability of the model in disease prediction was shown. Kim et al. [19] used the IoT technique and a machine learning algorithm to classify plant diseases at an early stage. An IoT-based monitoring system for precision agricultural applications such as epidemic disease control was developed by Pavel et al. [20]; an expert system was also developed to make decisions regarding the diseases. A survey on the current techniques and prediction models based on image processing and the role of the IoT being applied for identification, detection as well as quantification of tomato plant diseases was shown by Khattab et al., Verma et al., and Diyan et al. [21,22,23].
The objective of this work was to design an effective smart monitoring system for modern greenhouse applications. To do this, the IoT technique, a clean source of energy, and deep convolutional neural networks (DCNN) were used. The proposed modern greenhouse will help farmers to:
- control different environmental parameters inside the greenhouse,
- ensure remote sensing and easy analysis of the collected data in real time,
- ensure early detection and classification of tomato diseases in plants,
- receive notifications about the state of the greenhouse.
The main contributions are listed below:
- design of a low-cost monitoring prototype,
- development of a webpage for monitoring parameters inside the greenhouse,
- development of deep neural networks for diseases detection and classification,
- development of an Android application for notifications about anomalies.
This paper is organized as follows: the next section provides the Materials and Methods including different steps to design the prototype (webpage, mobile application, and diseases identification and classification). The experimental results are reported in Section 3. The final Section 4 gives some concluding remarks and perspectives.
2. Materials and Methods
2.1. Monitoring and Displaying Greenhouse Parameters
Figure 1 shows a block diagram of the proposed monitoring system. It consists mainly of sensors (capacitive soil moisture, relative humidity, air temperature, light intensity, CO2, and ultrasonic), actuators (valve, water pump, fan, and servomotor), LCD (liquid crystal display; allows visualizing the measured data). A low-cost microcontroller (Arduino Mega 2560) was used to control and monitor different parameters inside the greenhouse. The parameters monitored were Ta, SM, RH, LI, CO2 concentration, and water level (WL).
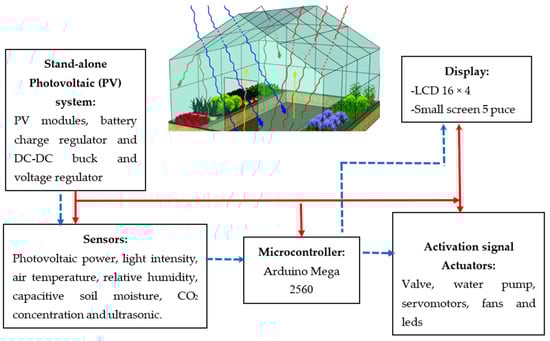
Figure 1.
Basic structure of the monitoring system (solid red line: power, dashed blue line: data).
The control process is summarized in the following steps:
- ✓
- Step #1: Initialization, defining, loading reference parameters (CO2ref, Taref, SMref, RHref, WLref, and LIref) based on thr experimental thresholds.
- ✓
- Step #2: Measurements of the actual parameters (Ta, RH, SM, WL, CO2 and LI).
- ✓
- Step #3: Comparison of the parameters (measured versus references) for each sensor (e.g., if the measured Ta is outside of the Taref interval, the controller sends a signal to activate the corresponding relay and start the fan to refresh the environment inside the greenhouse).
- ✓
- Step #4: Sending a signal to the actuators by activating the corresponding relays:
- -
- water pump: start filling the tank;
- -
- valve: start watering and irrigation of the plants;
- -
- servomotor: open windows for fresh air;
- -
- fan: turn on air ventilation;
- -
- LED: turn on the light.
CO2ref, Taref, SMref, RHref, WLref, and LIref are reference parameters.
Most sensor networks require careful manual installation and configuration to assure that software components are properly associated with the physical instruments that they represent. The calibration method for each sensor is shown in Appendix A.
2.2. IoT and Webpage Development
To design the webpage, CCS, HTML, JavaScript languages and the Firebase platform were used. A Wi-Fi module named NodeMCU ESP8266 and a Wi-Fi camera module (ESP32) were used to collect and upload the measured data and images of the plants to the webpage for visualization and possible diseases classification.
Figure 2 shows a block diagram for uploading the measured parameters and images to the designed webpage using the IoT technique.
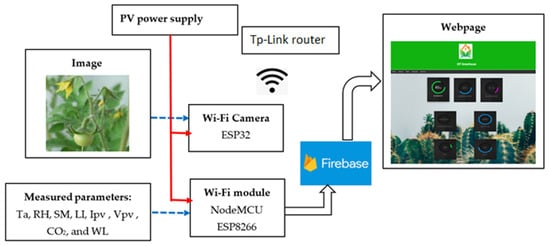
Figure 2.
Block diagram for uploading parameters and images to the designed webpage using the IoT technique.
The HTML language was mainly used to make the page structure, CCS—for designing a suitable environment, and JavaScript—for creating a dynamic environment. The Firebase designed by Google was used for hosting the webpage and database management.
2.3. Mobile Application and Notification
A mobile application was developed using Expo React-Native and a NodeMCU ESP8266 module. This application allows us to visualize the greenhouse parameters remotely (See Figure 3a).
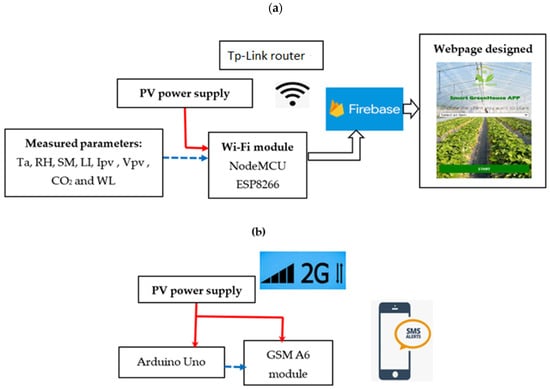
Figure 3.
(a) Mobile application for data visualization, (b) mobile application structure for SMS notifications.
To notify users about the state of the greenhouse (missed power supply, failure sensors, Internet failure, and diseases of the plants), a A6 GSM module with Arduino Uno were used. Figure 3b shows the workflow of this application.
2.4. Database and Deep Learning CNNs for Diseases Classification
Classification and identification of plant diseases at early stages using image processing and analysis of environmental sensing data not only help farmers to get healthy plants but also maximize the production. In this work, we focused mainly on one type of vegetables (tomatoes).
The database used in this study comprises various images (e.g., tomato diseases) [24]. To detect and classify the tomato diseases, a deep convolutional neural network (DCNN) was developed. Figure 4 shows the basic workflow of the DCNN for multiclass images classification. It consists of two parts, (1) the features extraction part, which contains some layers (convolutional and maximum pooling) and (2) the classification part, which performs nonlinear transformations of the extracted features (flattened and fully connected layers). The output could be the softmax function for predicting the class.
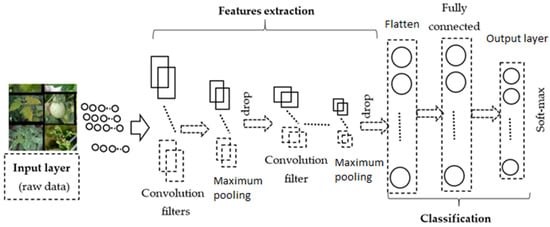
Figure 4.
Basic structure of the DCNN used for the classification of disease in plants.
The DCNN code was implemented using the Python language in Raspberry Pi 4. The different steps for implementing the model into a Raspberry device are summarized below:
- Step 1: Train the DCNN model
- Step 2: Call the model on Raspberry with tf.lite.Interpreter()
- Step 3: Program the ESP32 camera to save images every time we access its IP address
- Step 4: Resize and change the type of the image to fit our model
- Step 5: Predict this image with the model and get the result
- Step 6: Use the Pyrebase library to make connections with the database
- Step 7: Save the result to the Firebase database
- Step 8: Read with NodeMCU and send an SMS if there is a problem
2.5. Standalone Photovoltaic Power System
A standalone PV system was used to supply the different components of the greenhouse, including electronic boards, water pumps, fans, lights, and the servomotor. It comprised three PV modules (360 W) connected in parallel, with one battery (12 V, 200 Ah), a charge regulator (24 V/30 A), a DC–DC buck converter, and a voltage regulator (in = 7–12 V, out = 5 or 3.3 V).
Figure 5 shows the block diagram of the standalone PV power system utilized to supply the greenhouse.
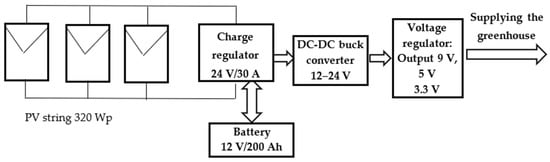
Figure 5.
Standalone PV system configuration used for supplying the greenhouse.
Figure 6 shows a real photo of the standalone PV system (SAPV) available at the Renewable Energy Laboratory, Jijel University (Jijel, Algeria).
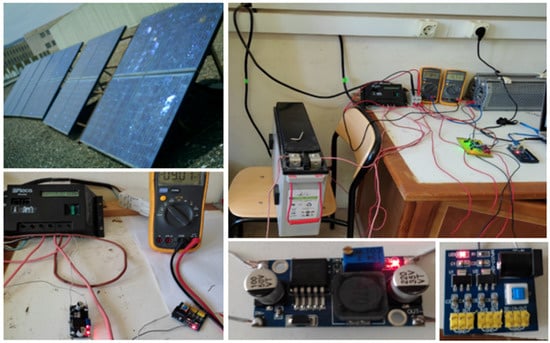
Figure 6.
Real photo of the standalone PV system (Renewable Energy Laboratory, Jijel University, Jijel, Algeria).
3. Results and Discussion
3.1. Photovoltaic Power Supply System
To test the PV power system, we plotted in Figure 7 the data acquisition system, the output current, voltage, solar irradiance, and air temperature for a short period (25 May 2021, from 10 am to 12 am, with a time step of 5 s). To track the maximum power, the maximum power point algorithm was integrated, and more details can be found in our previous work [25,26].
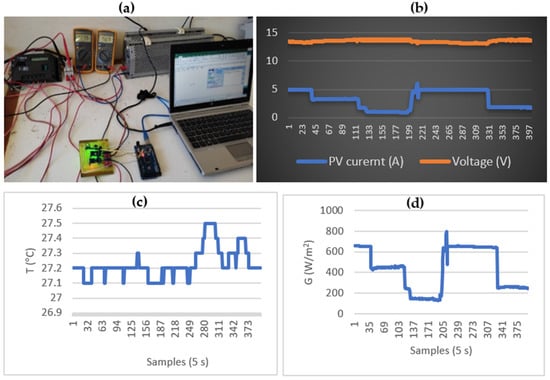
Figure 7.
PV power system measurements: (a) measurement system using Arduino Uno, (b) PV voltage and current, (c) air temperature, and (d) solar irradiance (25 May 2021, from 10 am to 12 am, with a time step of 5 s).
From Figure 7b, it can be seen that the produced PV current and voltage were enough to supply the main components of the greenhouse.
3.2. Smart Greenhouse Prototype
Figure 8 depicts a real photo of the designed prototype, including the data acquisition system. The used components are listed in Appendix B (Table A1). The whole prototype cost around 150 dollars.
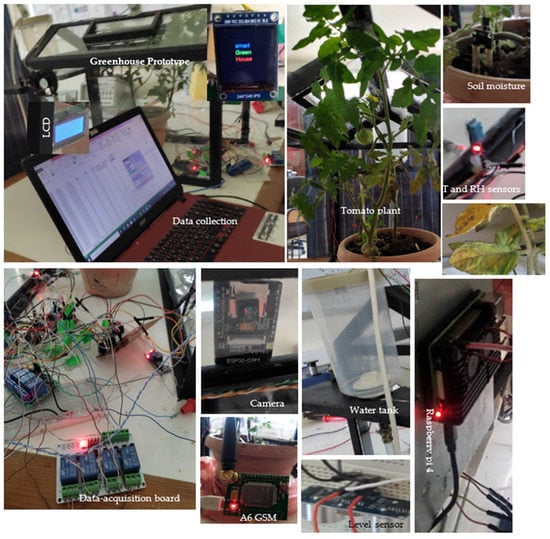
Figure 8.
A real photo of the smart greenhouse prototype.
3.3. Monitoring and Data Visualization
Figure 9a shows the main webpage designed for the smart greenhouse. The users can easily visualize the measured parameters online.
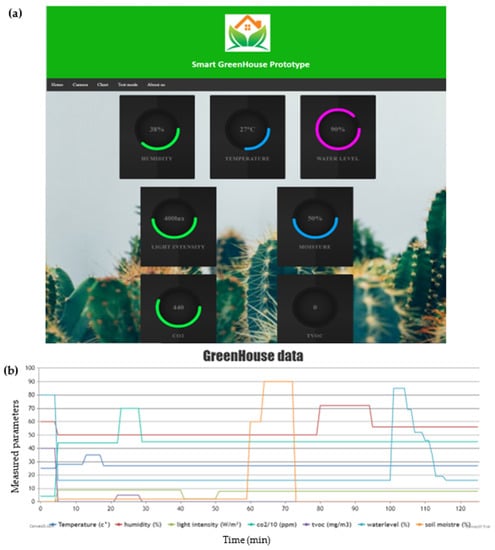
Figure 9.
(a) The main webpage of the smart greenhouse, (b) monitored greenhouse parameters: T, RH, LI, WL, CO2, TVOC, and SM for a short period of 110 min.
To test the monitoring system, we illustrated in Figure 9b an example of the data posted to the webpage. The uploaded data were the real-time values of Ta, RH, LI, CO2 concentration, air pollution, WL, and SM. The data were collected on 19 June 2021 for a period of 112 min. These results confirm and show clearly the correct functioning of the developed monitoring system and the webpage.
3.4. Warning SMS and Mobile Application
3.4.1. Warning SMS
A mobile application was developed in order to check the state of the greenhouse. Thus, users could be notified with a simple phone SMS in case of any problem in the system. The following Figure 10 displays a type of an SMS message received by a user (e.g., no Internet connection).
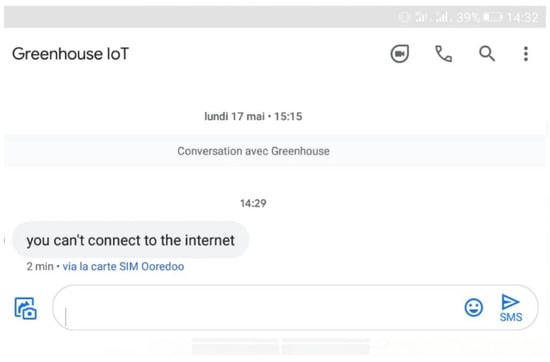
Figure 10.
SMS notification (e.g., no Internet connection).
3.4.2. Mobile Application (Android)
The main Android screens of the developed mobile application are depicted in Figure 11. This application can help farmers to visualize the collected parameters and monitor the greenhouse remotely.
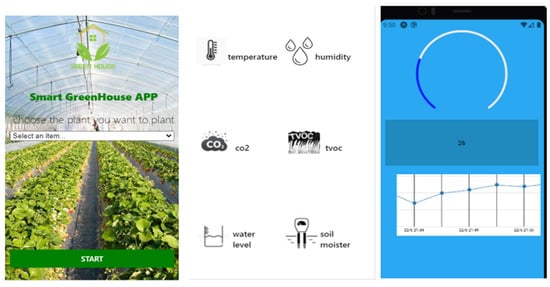
Figure 11.
The main Android application screens for the designed smart greenhouse.
3.5. Plant Diseases Classification
The database used in this study consists of six categories (five disease classes and one health class). It contains a single leaf, multiple leaves, a single background, and a complex background. All the images were unified to 227 × 227 pixels. The diseases examined (in case of tomato plants) were bacterial spot, black leaf mold, gray leaf spot, late blight, and powdery mildew.
Figure 12 shows an example of the images (diseases of tomato plants) available in the database.
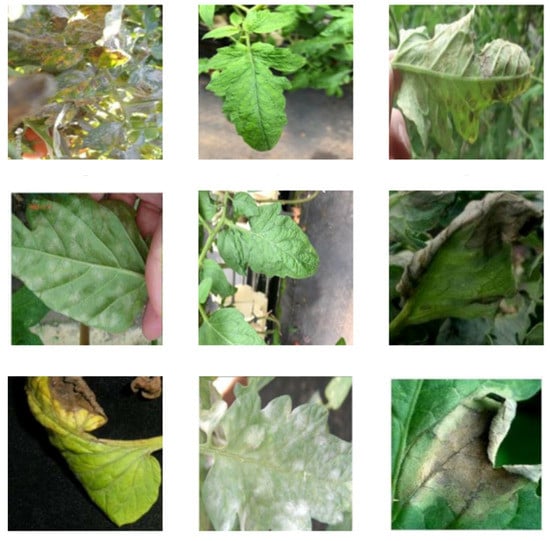
Figure 12.
Diseases of tomato plants (images available in the database).
To develop the DCNN model, 4970 unified images were used; 3976 images (80%) were used for the training process, 994 images (20%)—for testing the model. The structure of the developed DCNN model is given below:
- Number of layers: ten layers (one AveragePooling2D layer, two ConvD2 layers, two MaxPool2D layer, one Flatten layer, one Dropout layer, and three Dense layers)
- Epoch = 20
- Optimizer = Adam
- Activation function = ReLU and SoftMax
- Loss = SparseCategoricalCrossent
The main code of the model is given as follows:
- Model_DCNN = keras.Sequential([
- keras.layers.AveragePooling2D(12,(4,3),
- input_shape=(227,227,3)),
- keras.layers.Conv2D(128, (3,3), activation=‘relu’),
- keras.layers.MaxPool2D(2,2),
- keras.layers.Conv2D(64, (1,1), activation=‘relu’),
- keras.layers.MaxPool2D(2,2),
- keras.layers.Dropout(0.4, input_shape=(2,)),
- keras.layers.Flatten(),
- keras.layers.Dense(128, activation=‘relu’),
- keras.layers.Dense(64, activation=‘relu’),
- keras.layers.Dense(32, activation=‘softmax’)
- ])
- Model_DCNN.compile(optimizer=‘adam’,loss=keras.losses.SparseCategoricalCrossentropy(),metrics=[‘accuracy’])
- history=Model_DCNN.fit(train_ds, epochs=20, batch_size=32)
The code was implemented and run under Google Colab, which is a free online cloud-based Jupyter Notebook environment. The DCNN model was trained under a GPU (Tesla K80 with 12 GB of GDDR5, Intel Xeon Processor with two cores @ 2.20 GHz and 13 GB RAM).
Figure 13 shows the loss and the accuracy during the training process. The loss was close to 0.001 and the accuracy was about 0.99. These results confirm the good training of the model; thus, the DCNN model was ready to classify and identify the diseases of tomato plants.
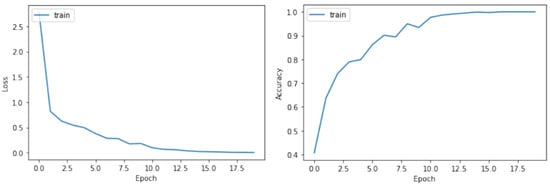
Figure 13.
Loss and accuracy functions of the DCNN model for the classification of diseases (tomato plants).
To evaluate the performance of the developed DCNN model, we calculated the following error metrics:
where TP—number of true positive, TN—number of true negative, FP—number of false positives, FN—number of false negative.
The results of the calculated error metrics are listed in Table 1.

Table 1.
Error metrics: precision, recall, F1 score, and accuracy.
According to Table 1, good accuracy (88%) was obtained for diseases classification of tomato plants. However, the results could be improved by using a large database with high-quality images.
Although the smart prototype designed has some advantages such as low-cost, free source of energy, good flexibility, capability to monitor diseases, good skills and knowledge, particularly in the implementation of the DCNN, to classify diseases are indispensable.
4. Conclusions and Outlook
A smart greenhouse was designed and experimentally verified at a laboratory scale. The greenhouse prototype was equipped with a smart monitoring system able to control and remotely monitor greenhouse parameters. The greenhouse was supplied by a free source of energy, a small-scale autonomous PV system, which was basically used to supply the main components of the greenhouse such as sensors, electronic boards, water pumps, LED lights, fans, servomotors, and relays. Thus, an artificial climate inside the greenhouse was created, with appropriate control of air temperature, relative humidity, soil moisture, CO2 concentration, light intensity, by means of precise ventilation, lighting, and irrigation. Users could be also notified by an SMS about the state of the plants before the outbreak of the disease. The combination of the Internet of Things and deep learning have showed their capability to monitor the health of the plant investigated in this study. Detection and classification of plant diseases can help farmers to monitor plants growth efficiently for better crops production.
Future work will focus on the application of advanced predictive control algorithms for parameters control inside the greenhouse. Furthermore, the application of computer vision and other deep learning frameworks will be investigated. A large dataset with different cultivated plants (images) will be used.
Author Contributions
Conceptual approach, A.M. (Adel Mellit) and M.B,; data curation, A.M. (Adel Mellit) and O.H.; software, O.H. and A.M. (Abdelaziz Messalaoui); calculations and modeling, M.B.; writing of original draft, A.M. (Adel Mellit) and M.B., visualization A.M. (Abdelaziz Messalaoui), M.B., O.H., and A.M. (Abdelaziz Messalaoui); review and editing A.M. (Abdelaziz Messalaoui) and M.B.; funding acquisition M.B. All authors have read and agreed to the published version of the manuscript.
Funding
This research was funded by Deanship of Scientific Research at the Islamic University of Madinah, Saudi Arabia, grant number 489.
Institutional Review Board Statement
Not applicable for this study.
Informed Consent Statement
Not applicable for this study.
Data Availability Statement
The data used in the present study is publicly available (https://data.mendeley.com/datasets/ngdgg79rzb/1).
Acknowledgments
We would like to thank the Deanship of Scientific Research at the Islamic University of Madinah, Saudi Arabia, for the financial support of this work through the program Tamayyouz II of the academic year 2020/2021, research project No. 489.
Conflicts of Interest
The authors declare no conflict of interest.
Abbreviations
| CO2 | Carbon dioxide |
| CO2ref | Reference carbon dioxide |
| DC | Direct current |
| DCNN | Deep convolutional neural networks |
| DL | Deep learning |
| GSM | Global System for Mobile Communications |
| HTML | HyperText Markup Language |
| IoT | Internet of things |
| Ipv | Photovoltaic current |
| LED | Light-emitting diode |
| LCD | Liquid Crystal display |
| LI | Light intensity |
| LIref | Reference light intensity |
| NodeMCU | Node MicroController Unit |
| PV | Photovoltaic |
| RH | Relative humidity |
| RHref | Reference relative humidity |
| SAPV | Standalone PV System |
| SM | Soil moisture |
| SMref | Reference soil moisture |
| SMS | Short Message Service |
| Ta | Air temperature |
| Taref | Reference air temperature |
| TVOC | Total volatile organic compounds |
| Vpv | Photovoltaic voltage |
| WL | Water level |
| WLref | Reference water level |
Appendix A
- Calibration of the CO2 and air quality sensors (CCS811):
The CCS811 sensor will recalibrate itself each time it is powered on. CCS811 does not require calibration, but it does need to be “burned-in”. This means that after around 1 week the sensor is more stable.
- Calibration of the air temperature and humidity sensor (DHT11):
We connected the sensor to a Vernier data collection interface, used the Vernier data collection program, and the stored calibration was used. Furthermore, we could compare the collected data with another calibrated instrument that measures relative humidity (hygrometer or psychrometer).
- Calibration of the light sensor (BH1750):
BH1750FVI (or BH1750) is a calibrated digital light sensor IC that measures the incident light intensity and converts it into a 16-bit digital number. The BH1750FVI sensor directly gives digital output. The sensor output can be accessed through an I2C interface. It can measure ambient light intensity and the units of measurement are lx. Interfacing this module with Arduino is quite easy.
- Calibration of the current sensor ACS 7120 (30 A)
The calibration of the current sensor ACS 7120 (30 A) was performed using the methodology described in [27].
- Calibration of the voltage sensor
We followed the method of calibration used with Arduino as indicated in [28].
- Calibration of Ultrasonic (HC04)
For the calibration of Ultrasonic HC04, we used the methodology given in [29].
Appendix B
Table A1.
Used components specifications, accuracy and prices.
Table A1.
Used components specifications, accuracy and prices.
| Item | Reference/Specification | Accuracy/Resolution | Price (USD) |
|---|---|---|---|
| Microcontrollers | Arduino Mega 2560 | Accuracy of ± 2 LSB The maximum error is 2 bits (4 decimal) in 10 bits (1024 decimal). The worst-case accuracy of the converter is 4/1024, or 1 part in 256 i.e., 0.25%. | 14 |
| Processor | Raspberry 4 pi 2 Go | Resolution up to 1080p at the 60 Hz refresh rate. | 70 |
| LED | 12 V | - | 3 |
| GSM module | A6 | Sensitivity < −105 | 5 |
| Wi-Fi module | NodeMCU ESP8266 | 14-bit resolution. The minimum resolution could reach as much as 44 ns. External clock accuracy between 15 and +15 ppm | 2.5 |
| Relative humidity and air temperature sensor | (DHT11) | ± 5% RH, ± 0.5 °C accuracy | 1.5 |
| Position sensor | Ultrasonic HC04 | Absolute accuracies of 1–3% in the operating range from −25 °C to +70 °C. | 0.75 |
| Relay | 5 V | - | 10 |
| Light sensor | BH1750 | Accuracy: ± 20%. This sensor can accurately measure the lx value of light up to 65,535 lx. | 0.95 |
| CO2 sensor | CCS811 | 2% tolerance due to accuracy of the internal clock in Mode timings | 4 |
| Valve | 12 V | - | 2.5 |
| Water pump | 12 V | High accuracy | 8 |
| Fan | 12 V | - | 3 |
| Servomotor | MG960R | Servos operate accurately at speeds up to 5000 rpm or more. Its stopping accuracy is within ± 0.05 degrees (with no load). | 5 |
| Voltage sensor | 25 V | Resolution of 0.00489 V | 1.5 |
| Current sensor | ACS 7120 (30 A) | Accuracy < 2% | 2 |
| LCD | 4 × 16 | - | 2.5 |
| Screen | 1.3 inch | - | 3 |
| Capacitive soil moisture | V 1.22 | 2–3% of the actual soil moisture | 3 |
References
- Wang, T.; Wu, G.; Chen, J.; Cui, P.; Chen, Z.; Yan, Y.; Zhang, Y.; Li, M.; Niu, D.; Li, B.; et al. Integration of solar technology to modern greenhouse in China: Current status, challenges and prospect. Renew. Sustain. Energy Rev. 2017, 70, 1178–1188. [Google Scholar] [CrossRef]
- Rayhana, R.; Xiao, G.; Liu, Z. Internet of Things Empowered Smart Greenhouse Farming. IEEE J. Radio Freq. Identif. 2020, 4, 195–211. [Google Scholar] [CrossRef]
- Gorjian, S.; Ebadi, H.; Najafi, G.; Chandel, S.S.; Yildizhan, H. Recent advances in net-zero energy greenhouses and adapted thermal energy storage systems. Sustain. Energy Technol. Assess. 2021, 43, 100940. [Google Scholar] [CrossRef]
- Azaza, M.; Tanougast, C.; Fabrizio, E.; Mami, A. Smart greenhouse fuzzy logic based control system enhanced with wireless data monitoring. ISA Trans. 2016, 61, 297–307. [Google Scholar] [CrossRef] [PubMed]
- Oliveira, J.; Boaventura-Cunha, J.; Oliveira, P.M. Automation and Control in Greenhouses: State-of-the-Art and Future Trends. In Lecture Notes in Electrical Engineering; Springer Science and Business Media LLC: Berlin, Germany, 2017; Volume 402, pp. 597–606. [Google Scholar]
- Leithardt, V.; Santos, D.; Silva, L.; Viel, F.; Zeferino, C.; Silva, J. A Solution for Dynamic Management of User Profiles in IoT Environments. IEEE Lat. Am. Trans. 2020, 18, 1193–1199. [Google Scholar] [CrossRef]
- Nawandar, N.K.; Satpute, V.R. IoT based low cost and intelligent module for smart irrigation system. Comput. Electron. Agric. 2019, 162, 979–990. [Google Scholar] [CrossRef]
- Martins, J.A.; Ochôa, I.S.; Silva, L.A.; Mendes, A.S.; González, G.V.; Santana, J.D.P.; Leithardt, V.R.Q. PRIPRO: A Comparison of Classification Algorithms for Managing Receiving Notifications in Smart Environments. Appl. Sci. 2020, 10, 502. [Google Scholar] [CrossRef] [Green Version]
- Castañeda-Miranda, A.; Castaño-Meneses, V.M. Internet of things for smart farming and frost intelligent control in greenhouses. Comput. Electron. Agric. 2020, 176, 105614. [Google Scholar] [CrossRef]
- Kumar, A.; Singh, V.; Kumar, S.; Jaiswal, S.P.; Bhadoria, V.S. IoT enabled system to monitor and control greenhouse. Mater. Today 2020, in press. [Google Scholar] [CrossRef]
- Chiu, Y.-C.; Yang, P.-Y.; Grift, T.E. A wireless communication system for automated greenhouse operations. Eng. Agric. Environ. Food 2014, 7, 78–85. [Google Scholar] [CrossRef]
- Liao, M.-S.; Chen, S.-F.; Chou, C.-Y.; Chen, H.-Y.; Yeh, S.-H.; Chang, Y.-C.; Jiang, J.-A. On precisely relating the growth of Phalaenopsis leaves to greenhouse environmental factors by using an IoT-based monitoring system. Comput. Electron. Agric. 2017, 136, 125–139. [Google Scholar] [CrossRef]
- Shamshiri, R.R.; Bojic, I.; van Henten, E.; Balasundram, S.K.; Dworak, V.; Sultan, M.; Weltzien, C. Model-based evaluation of greenhouse microclimate using IoT-Sensor data fusion for energy efficient crop production. J. Clean. Prod. 2020, 263, 121303. [Google Scholar] [CrossRef]
- Ratnaparkhi, S.; Khan, S.; Arya, C.; Khapre, S.; Singh, P.; Diwakar, M.; Shankar, A. Smart agriculture sensors in IOT: A review. Mater. Today 2020, in press. [Google Scholar] [CrossRef]
- Benzaouia, M.; Hajji, B.; Rabhi, A.; Mellit, A.; Benslimane, A.; Dubois, A.M. Energy Management Strategy for an Optimum Control of a Standalone Photovoltaic-Batteries Water Pumping System for Agriculture Applications. In International Conference on Electronic Engineering and Renewable Energy; Springer: Singapore, 2020; pp. 855–868. [Google Scholar] [CrossRef]
- Aschilean, I.; Rasoi, G.; Raboaca, M.S.; Filote, C.; Culcer, M. Design and Concept of an Energy System Based on Renewable Sources for Greenhouse Sustainable Agriculture. Energies 2018, 11, 1201. [Google Scholar] [CrossRef] [Green Version]
- Huang, K.; Shu, L.; Li, K.; Yang, F.; Han, G.; Wang, X.; Pearson, S. Photovoltaic Agricultural Internet of Things Towards Realizing the Next Generation of Smart Farming. IEEE Access 2020, 8, 76300–76312. [Google Scholar] [CrossRef]
- Mishra, M.; Choudhury, P.; Pati, B. Modified ride-NN optimizer for the IoT based plant disease detection. J. Ambient. Intell. Humaniz. Comput. 2021, 12, 691–703. [Google Scholar] [CrossRef]
- Kim, S.; Lee, M.; Shin, C. IoT-Based Strawberry Disease Prediction System for Smart Farming. Sensors 2018, 18, 4051. [Google Scholar] [CrossRef] [PubMed] [Green Version]
- Pavel, M.I.; Kamruzzaman, S.M.; Hasan, S.S.; Sabuj, S.R. An IoT Based Plant Health Monitoring System Implementing Image Processing. In Proceedings of the 2019 IEEE 4th International Conference on Computer and Communication Systems (ICCCS); Institute of Electrical and Electronics Engineers (IEEE), Piscataway, NJ, USA, 25 February 2019; pp. 299–303. [Google Scholar]
- Khattab, A.; Habib, S.E.; Ismail, H.; Zayan, S.; Fahmy, Y.; Khairy, M.M. An IoT-based cognitive monitoring system for early plant disease forecast. Comput. Electron. Agric. 2019, 166, 105028. [Google Scholar] [CrossRef]
- Verma, S.; Chug, A.; Singh, A. Prediction Models for Identification and Diagnosis of Tomato Plant Diseases. In Proceedings of the 2018 International Conference on Advances in Computing, Communications and Informatics (ICACCI); Institute of Electrical and Electronics Engineers (IEEE), Piscataway, NJ, USA, 16 April 2018; pp. 1557–1563. [Google Scholar]
- Diyan, M.; Khan, M.; Silva, B.N.; Han, K. Scheduling Sensor Duty Cycling Based on Event Detection Using Bi-Directional Long Short-Term Memory and Reinforcement Learning. Sensors 2020, 20, 5498. [Google Scholar] [CrossRef] [PubMed]
- DatabaseTomate. Available online: https://data.mendeley.com/datasets/ngdgg79rzb/1 (accessed on 27 May 2021).
- Rouibah, N.; Barazane, L.; Benghanem, M.; Mellit, A. IoT-based low-cost prototype for online monitoring of maximum output power of domestic photovoltaic systems. ETRI J. 2021, 43, 459–470. [Google Scholar] [CrossRef]
- Mellit, A.; Hamied, A.; Lughi, V.; Pavan, A.M. A Low-Cost Monitoring and Fault Detection System for Stand-Alone Photovoltaic Systems Using IoT Technique. In ELECTRIMACS 2019, Proceedings of the 13th International Conference of the IMACS TC1 Committee, Salerno, Italy, 21–23 May 2019; Springer: Berlin, Germany, 2019; Volume 604, pp. 349–358. [Google Scholar]
- Engineersgarage. Available online: https://www.engineersgarage.com/acs712-current-sensor-with-arduino/ (accessed on 20 April 2021).
- John Errington’s Experiments with an Arduino. Available online: http://www.skillbank.co.uk/arduino/calibrate.htm (accessed on 1 June 2020).
- Arduino UNO: Complete Ultrasonic Sensor Guide (HC-SR04). Available online: https://www.instructables.com/Arduino-UNO-Complete-Ultrasonic-Sensor-Guide-HC-SR/ (accessed on 13 August 2021).
Publisher’s Note: MDPI stays neutral with regard to jurisdictional claims in published maps and institutional affiliations. |
© 2021 by the authors. Licensee MDPI, Basel, Switzerland. This article is an open access article distributed under the terms and conditions of the Creative Commons Attribution (CC BY) license (https://creativecommons.org/licenses/by/4.0/).