Article

Design and Operation of a Polygeneration System in Spanish Climate Buildings under an Exergetic Perspective

by
Ana Picallo-Perez
* and
Jose Maria Sala-Lizarraga
Research Group ENEDI, Department of Energy Engineering, University of the Basque Country (UPV/EHU), 48013 Bilbao, Spain
*
Author to whom correspondence should be addressed.
Energies 2021, 14(22), 7636; https://doi.org/10.3390/en14227636
Submission received: 15 October 2021 / Revised: 9 November 2021 / Accepted: 10 November 2021 / Published: 15 November 2021
(This article belongs to the Special Issue Optimal Design of Polygeneration Systems for Buildings)

Abstract

:
This work defines and analyzes the performance of a polygeneration system in five different locations in Spain to maintain the thermal comfort and air quality of an office building. The facility is based on a chiller and a CHP engine with PV panels that provide almost all the electricity demand of the chiller. According to the energy performance analysis results, the installation working in Bilbao is a full polygeneration system since no electricity needs to be imported from the grid in summer. To quantify the energy savings related to a separated production facility, polygeneration indicators (percentage of savings PES/PExS and equivalent electric efficiency EEE/EExE) have been calculated in energy and exergy terms. The main motivation for using exergy is based on the ambiguity that can arise from the point of view of the First Law. As expected, the exergetic indicators have lower values than the energetic ones. In addition, an in-depth analysis was conducted for the air-handling unit components. The study shows the behavior of components over the year and the efficiency values from both an energy and exergy point of view. From these facts, the need arises to develop methodologies based on exergy.

1. Introduction

Concern for energy savings due to causes such as the depletion of fossil resources and climate change above all has encouraged the development of different techniques to save energy. As a whole, buildings are responsible for 40% of the European Union’s energy consumption and 36% of greenhouse gas emissions generated during their construction, use, renovation and demolition [1]. Additionally, an analysis of the sectoral structure of final energy consumption shows that residential and tertiary buildings are responsible for 29.5% of the final energy consumption. Offices, in particular, consume 5.5% [2]. Therefore, improving the energy efficiency of buildings and their thermal systems is a determining factor in achieving such objectives as energy savings and a reduction in greenhouse gas emissions.
In addition, in 2020, the uncertainty and the mobility restrictions caused by the COVID-19 health crisis have forced people to adapt to new ways of working. This new scenario has brought with it new trends and needs inside offices and homes.
Buildings have diverse demands at various energy levels. Therefore, combined heat and power (CHP) or combined cooling, heating and power (CCHP) are advantageous solutions to save primary energy consumption, reduce costs and reduce greenhouse gas emissions compared to conventional separate production. Polygeneration generally refers to the combined production of electricity, heating, cooling and domestic hot water (DHW) or any other useful energy. However, it is not common to find this type of system in buildings, even when the demands are very diverse and compatible with combined generation.
In general, polygeneration systems are designed to satisfy a percentage of the building’s thermal or electrical demand; an overview of polygeneration solutions is given in reference [3]. The advantages of polygeneration systems include the following aspects:
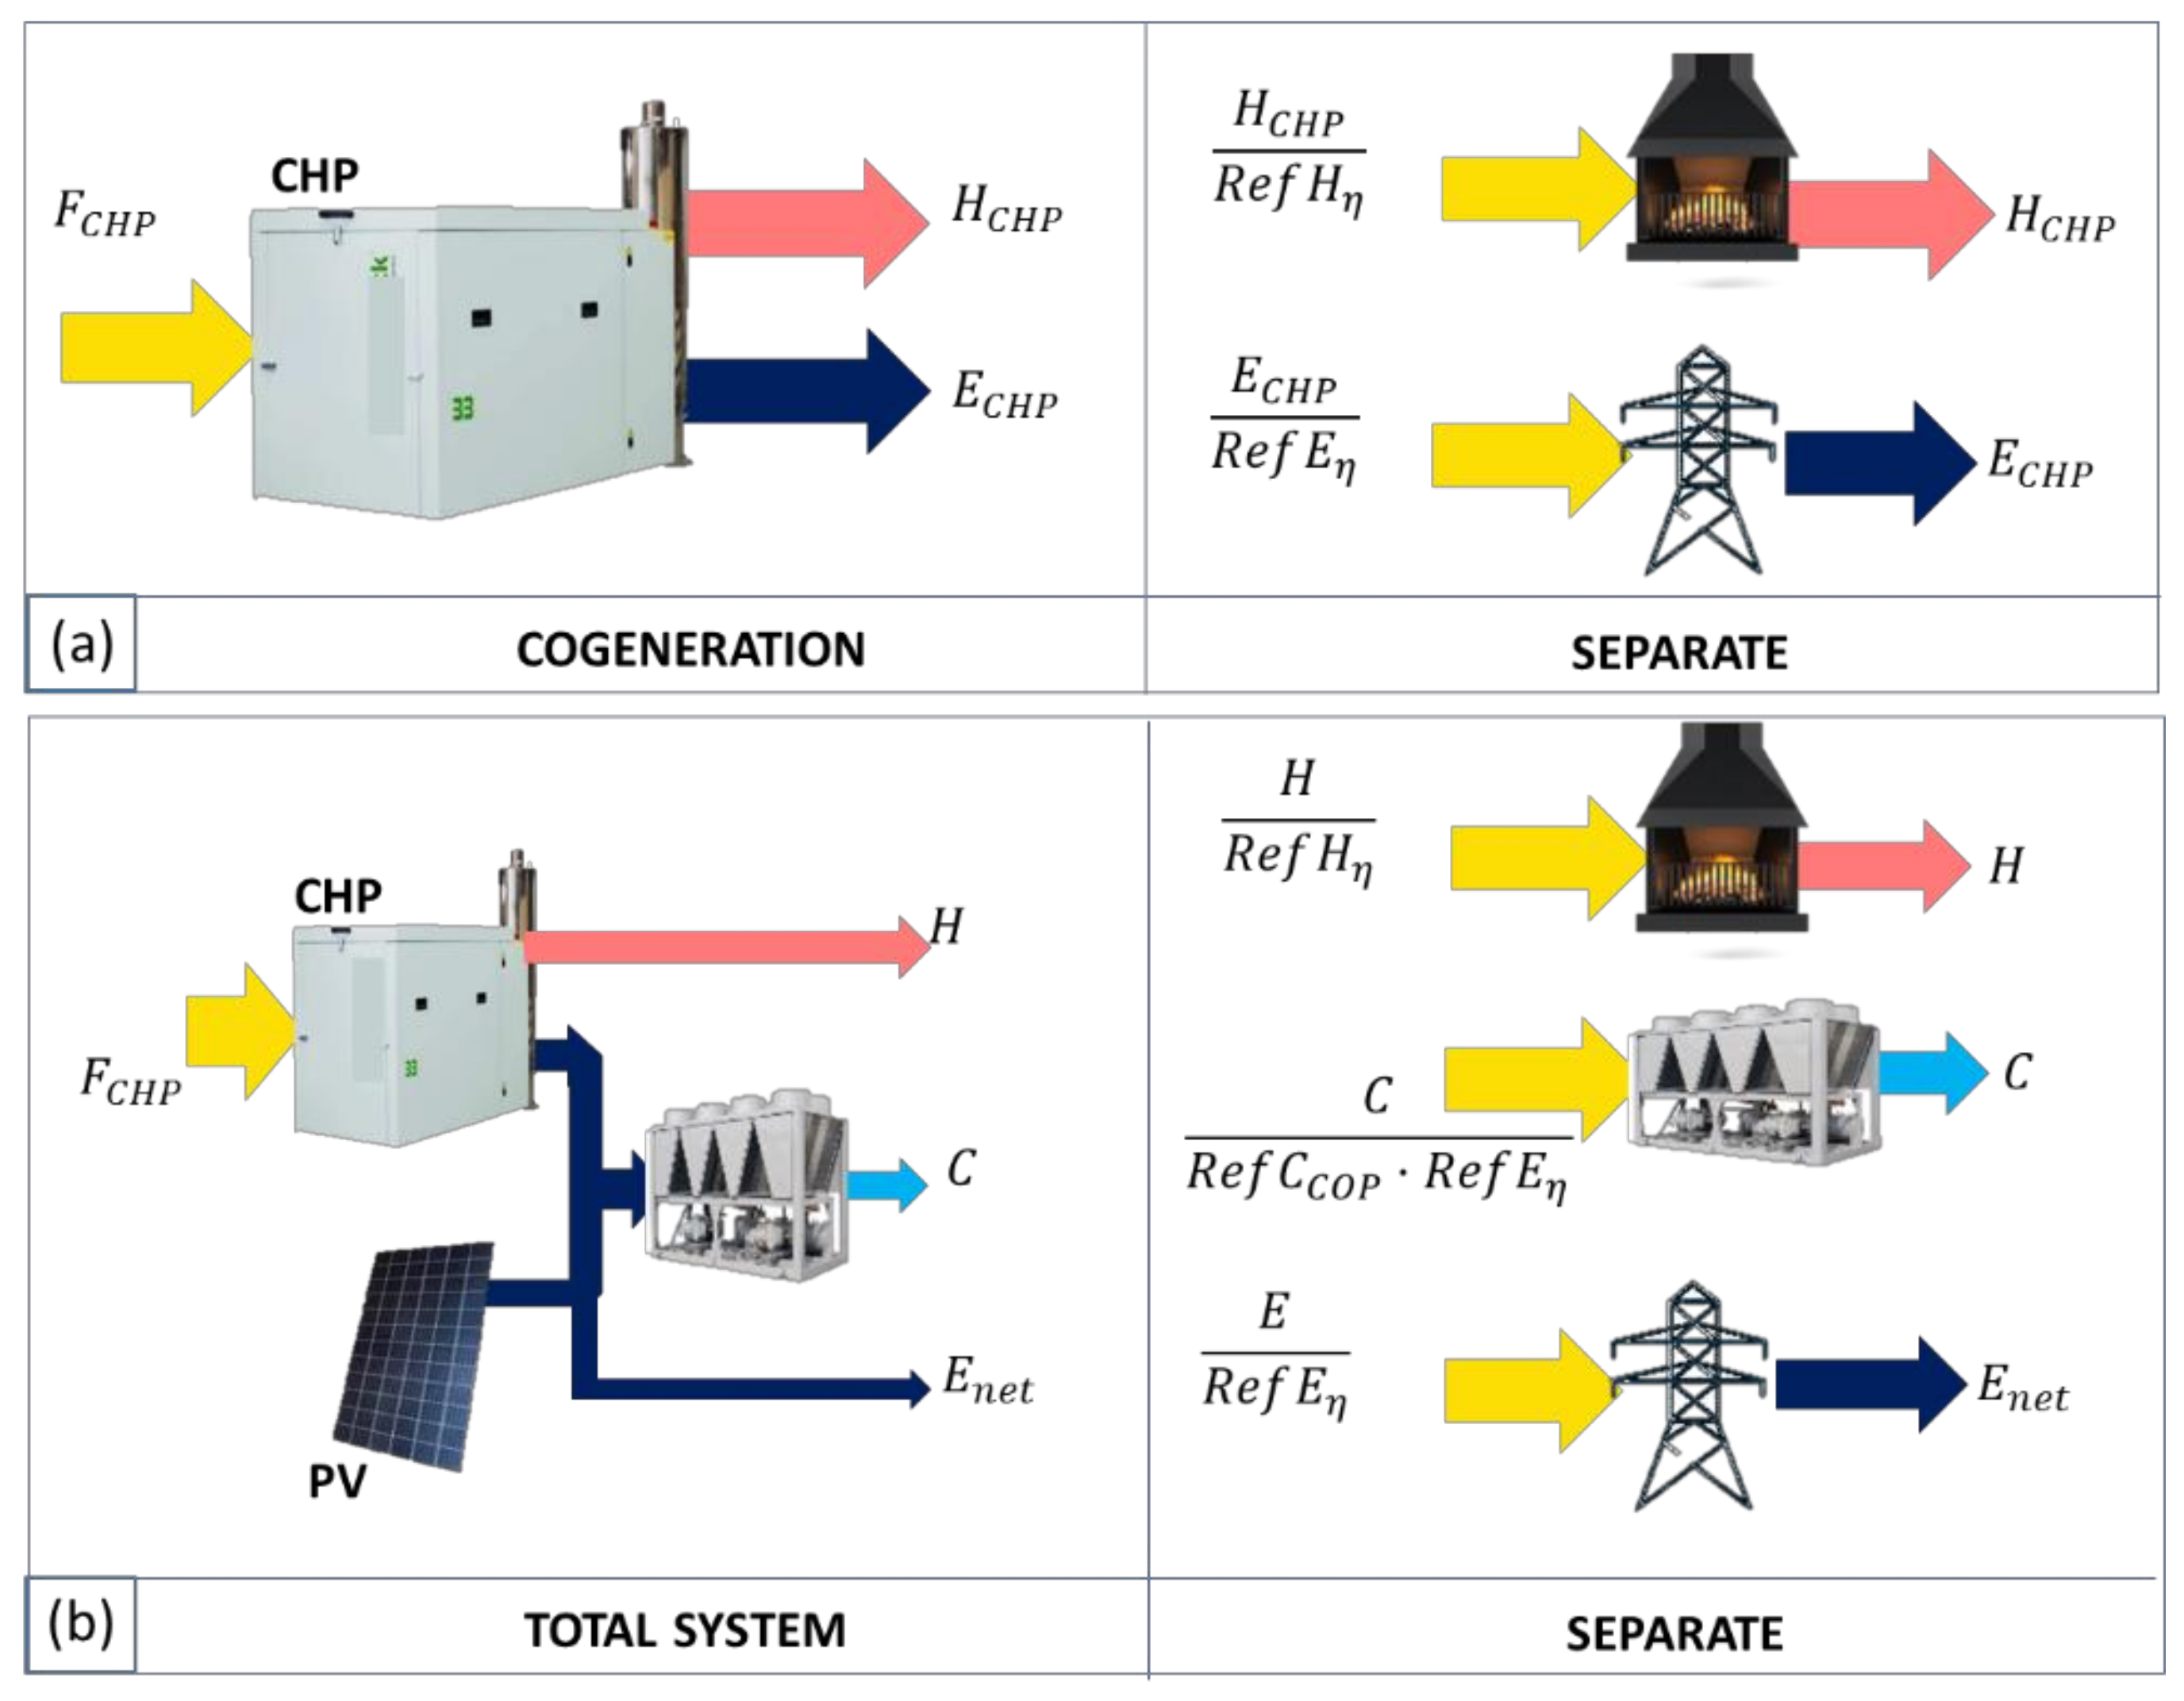
  • They have a better performance than separate generation and, therefore, they save primary energy and reduce the energy bill.
  • They serve to implement actions for the efficient use of waste heat, improving the competitiveness of the system.
  • Partial or complete independence from the electricity supply is achieved and transmission and distribution losses are reduced.
  • Polygeneration enhances energy diversity [4].
  • Among the disadvantages we can mention the following:
  • A need for greater investment.
  • A strong dependence on regulations and, therefore, a higher risk of regulatory change [5].
  • A risk of increased local pollution.
  • A risk of instability in the electrical grid and added technical risks.
The energy demand of a building mostly depends on its use; in reference [6], for example, hospital buildings are analyzed for enhancing their energy performance. In an office building, the highest energy consumption is in air-conditioning (40%), then electronic devices (35%), lighting (20%) and others (5%) [7].
Air-conditioning systems aim to ensure thermal comfort of indoor conditions by controlling the temperature and humidity of the indoor air, in order to maintain it within a narrow range of values. Humidity and temperature values outside of this range have harmful effects on the health of the occupants and damage the room materials. However, due to thermal losses and gains through the building envelope, as well as internal effects (due to lighting, people, etc.), temperature and humidity values may fall outside the desired range. Therefore, devices such as air-handling units (AHU) increase or decrease the temperature and humidity of the air and are used to control the state of the indoor air [8].
On the other hand, the contamination emitted by indoor sources also needs to be eliminated to maintain minimum health conditions. Consequently, ventilation is required that increases the energy demand, since indoor air (thermally conditioned but polluted) is replaced by clean and unconditioned outdoor air [9]. Energy consumption depends mainly on the severity of the climate in which the building is located, and the type of system installed, according to the use of the building.
In general, electricity is consumed to supply lighting, machinery and electronic requirements in offices.
Likewise, the energy demand has a significant dependence on the changing external conditions. For this reason, the Spanish Technical Building Code (CTE for its acronym in Spanish) establishes specific climatic zones according to the winter and summer climatic severity so as to specify the demand and consumption requirements [10], taking into account the altitude and the provincial capital in which the building is located.
In addition, to correctly integrate renewable technologies, the corresponding climate and orographic situation need to be analyzed.
The main objective of this work is to advise on issues related to the integration of polygeneration systems at office buildings in diverse Spanish climates, in order to control the thermal comfort and air quality, to achieve a better use of resources, and consequently to improve the quality of life. To this end, this study follows the steps below:
  • Thermal characterization of the office envelope components, both opaque and semi-transparent, are considered. Energy demand for the indoor air quality and thermal requirements are taken into account.
  • In order to cover the demands, the facility, which consists of polygeneration and renewable components, is defined. The operation and the energy performance of the facility is also analyzed, based on energy and exergy indicators.
  • Ventilation, air movement and thermal comfort are checked from an exergetic point of view, facilitating a deep energy and exergy analysis of the air-handling unit components.
As mentioned, these steps are performed for five different Spanish climates in order to obtain a full picture of the behavior of buildings in Spain and to determine the corresponding conclusions.

2. Materials and Methods

2.1. Energy and Exergy Analysis of a Thermal Installation

Conventional energy analyses are generally based on the First Law of thermodynamics. This type of analysis performs a simple process of energy accounting, where the energy inputs and outputs of the system and their transformation along the energy chain are considered. In this way, the energy input obtained from external resources (fuels, electricity, etc.) is transformed into useful products (heating, lighting, DHW, etc.). The energy flows that are not used are considered as energy losses, mostly heat losses [11].
Consequently, the analysis based on the First Law suggests that the inefficiency of a device or a process is due to these losses, therefore, the greater the losses, the greater the inefficiency. In this sense, the Carnot engine is supposed to have losses, since heat is released to a cold source, even if it is an ideal cyclic process.
On the contrary, if the exergetic analysis based on the First and Second Laws of thermodynamics is used, the irreversibility of the processes is quantified, and the inefficiencies are better defined. This information is key to detecting the possible improvements. The exergy method makes it possible to directly assess the real losses of a process, i.e., it evaluates the decrease in the available work of the energy sources.
To facilitate the reading and improve the comprehension, a brief summary of the most important variables for the exergy analysis are given according to the objectives of this work [8]:
  • Physical-specific enthalpy and exergy of humid air:
h h a = c p , a T + ω r 0 + c p , v · T
b h a = c p , a + ω c p , v T T 0 T 0 l n T T 0 + 0.461 ω + 0.622 T 0 l n p p 0
where, c p , a is the specific heat at constant pressure of dry air, c p , v is the specific heat at constant pressure of vapor, ω is the absolute humidity, r 0 is the latent heat of vaporization of water and 0 refers to the reference environment. This expression is already prepared for use in the exergy analysis of air-conditioning processes, kJ / kg   d . a . (kg dry air) being the units of h h a and b h a .
Chemical-specific exergy of humid air:
b h a c h = R T 0 0.622 ω + 0.622 l n ω 0 + 0.622 ω + 0.622 + ω ω + 0.622 l n ω ω 0 ω 0 + 0.622 ω + 0.622
where ω 0 is the absolute humidity of the air in the reference environment (RE), with the ambient air chosen as the RE. The temperature as well as the humidity of atmospheric air (and therefore the chemical potentials of the various components, including water vapor) change rapidly and significantly. Consequently, the exergy analysis of buildings and their heating and air-conditioning facilities must be carried out by taking into account these changing conditions.
Computer programs for dynamic energy building simulation carry out the calculation of heating and cooling demand hour by hour. In the same way, the calculation of the heating and cooling exergy demand will be carried out hour by hour, while also taking into account the changing conditions of the ambient air chosen as the RE.
  • Physical enthalpy and exergy of incompressible fluids:
h = c p T
b = c p T T 0 T 0 l n T T 0
  • Energy and exergy for a work flow:
w = w
b = w
where w refers to the work.
  • Chemical exergy of fuels:
b f u e l = Q F   L H V
where LHV is the lower heating value of the fuel and Q F is the quality factor of the fuel; thus, for natural gas, the average value is 1.04.
  • Specific exergy radiation per unit of area:
b = G 1 4 T 0 3 T S + 1 3 T 0 T S 4
where TS = 5.780 K corresponds to the effective temperature of the sun and G to the incident irradiation at the place.

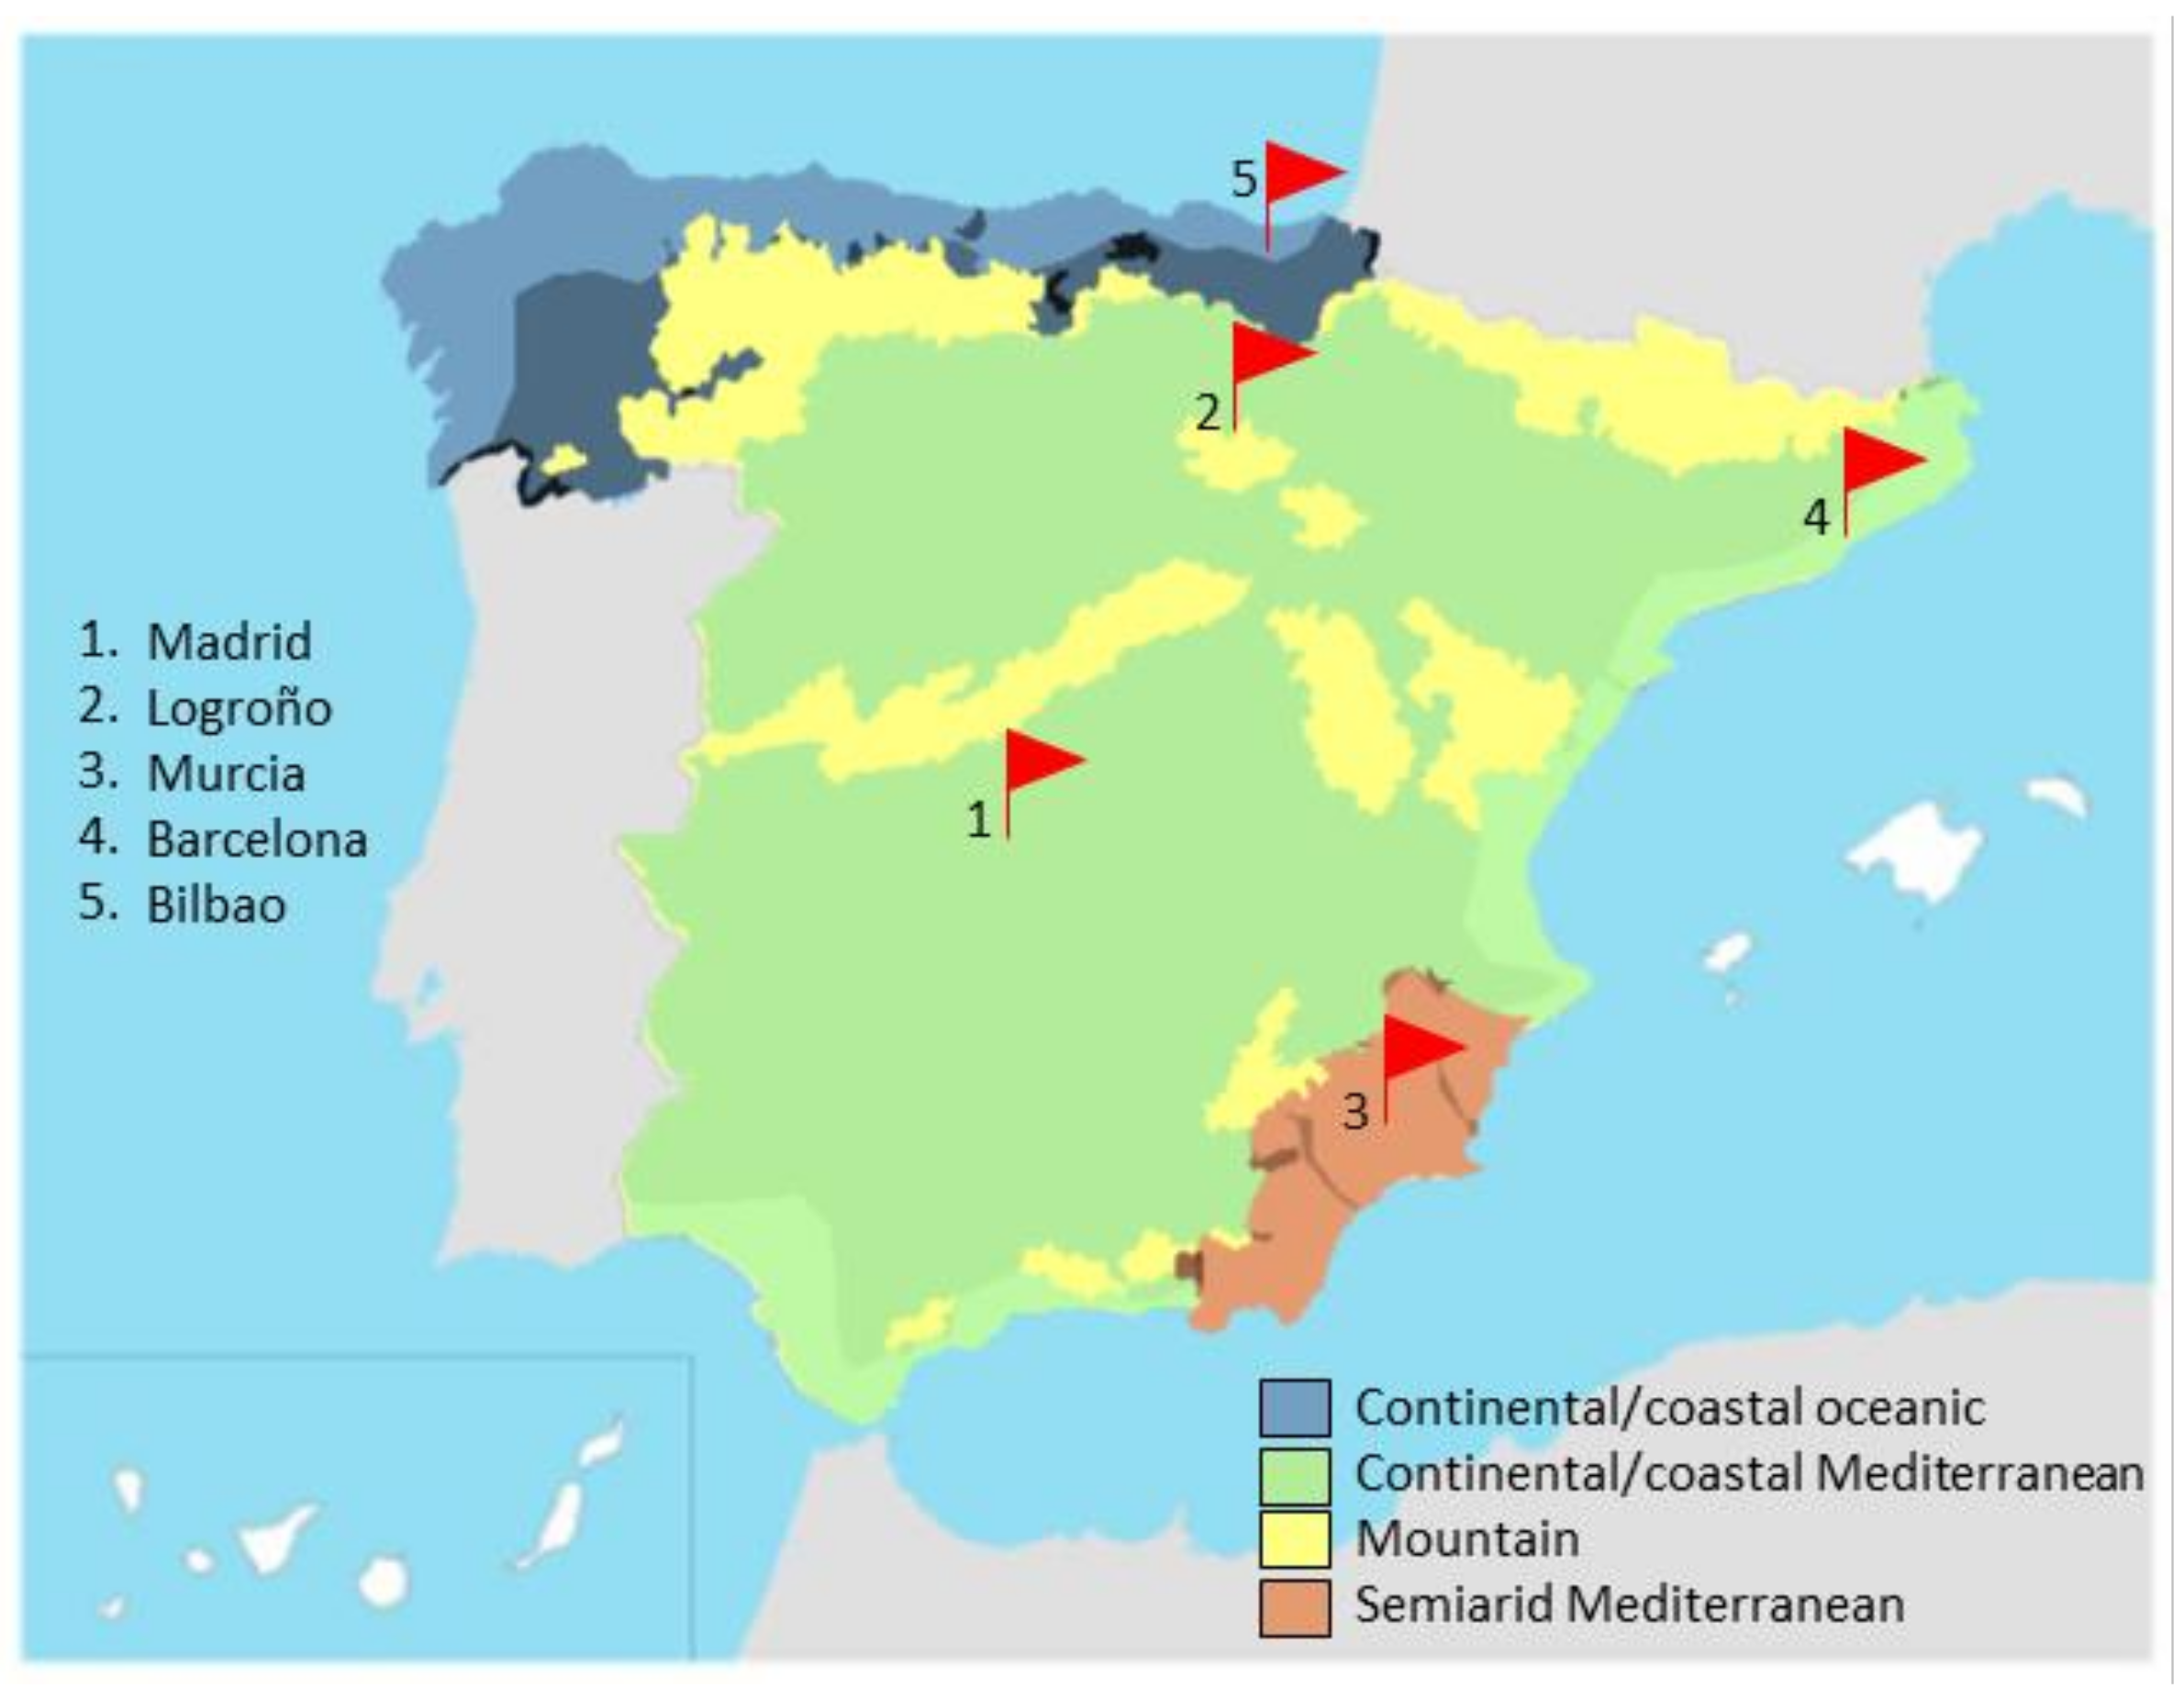
2.2. Defining the Case Study
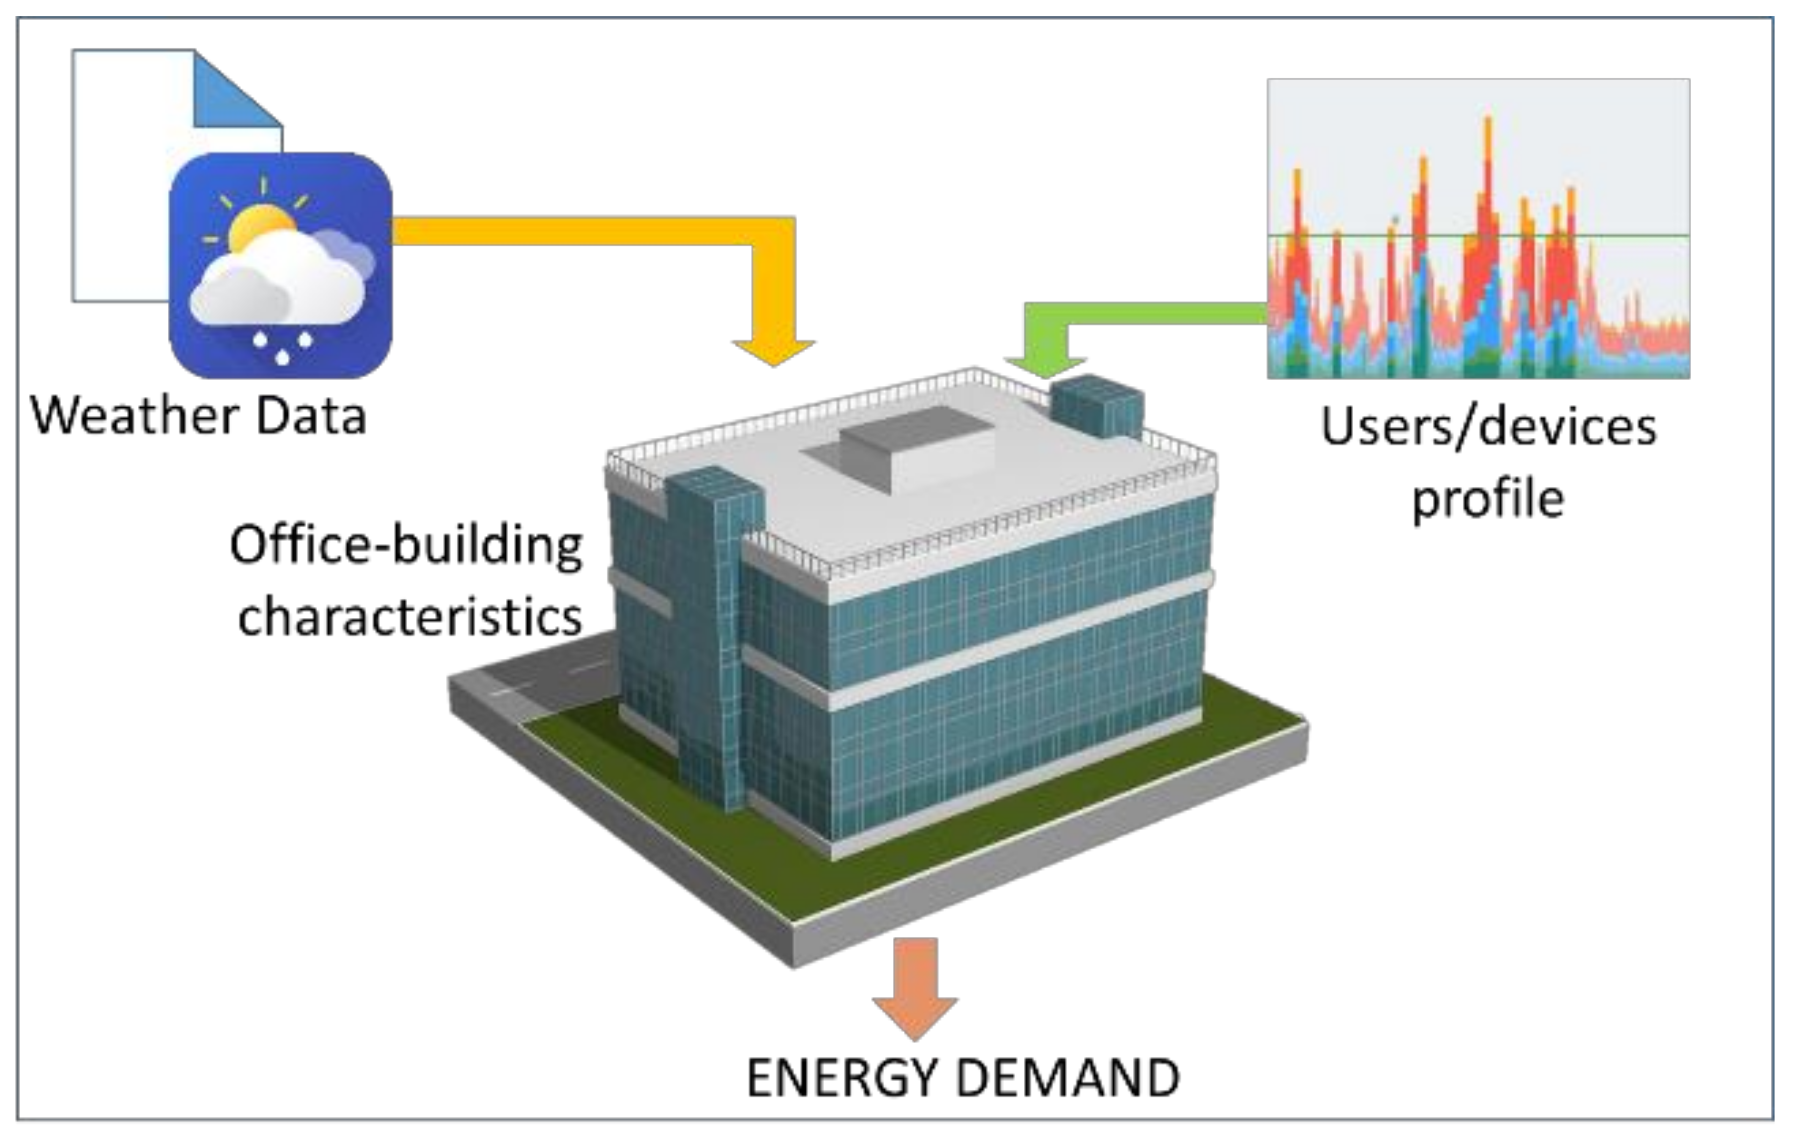
Figure 1 describes the geographic locations of the office buildings in Spain (Figure 1): Madrid, Logroño, Murcia, Barcelona and Bilbao; each location corresponds to a specific Iberian Peninsula climate in terms of the maximum/minimum temperatures and relative humidity, and the average values are presented in Table 1.

2.3. Energy Demand

The following step corresponds to the energy demand of the office building according to the building envelop characteristics, weather and usage profile (Figure 2). To calculate the energy demand, the following data were considered:
  • Building architectonics and thermal characteristics of the envelop components, defining the orientations, sizes, façade composition, non-opaque zones, etc.
  • Additionally, indoor appliances were included, defining the usage profile of the computers and lighting devices, worker presence profile, and the specific usage of the office building.
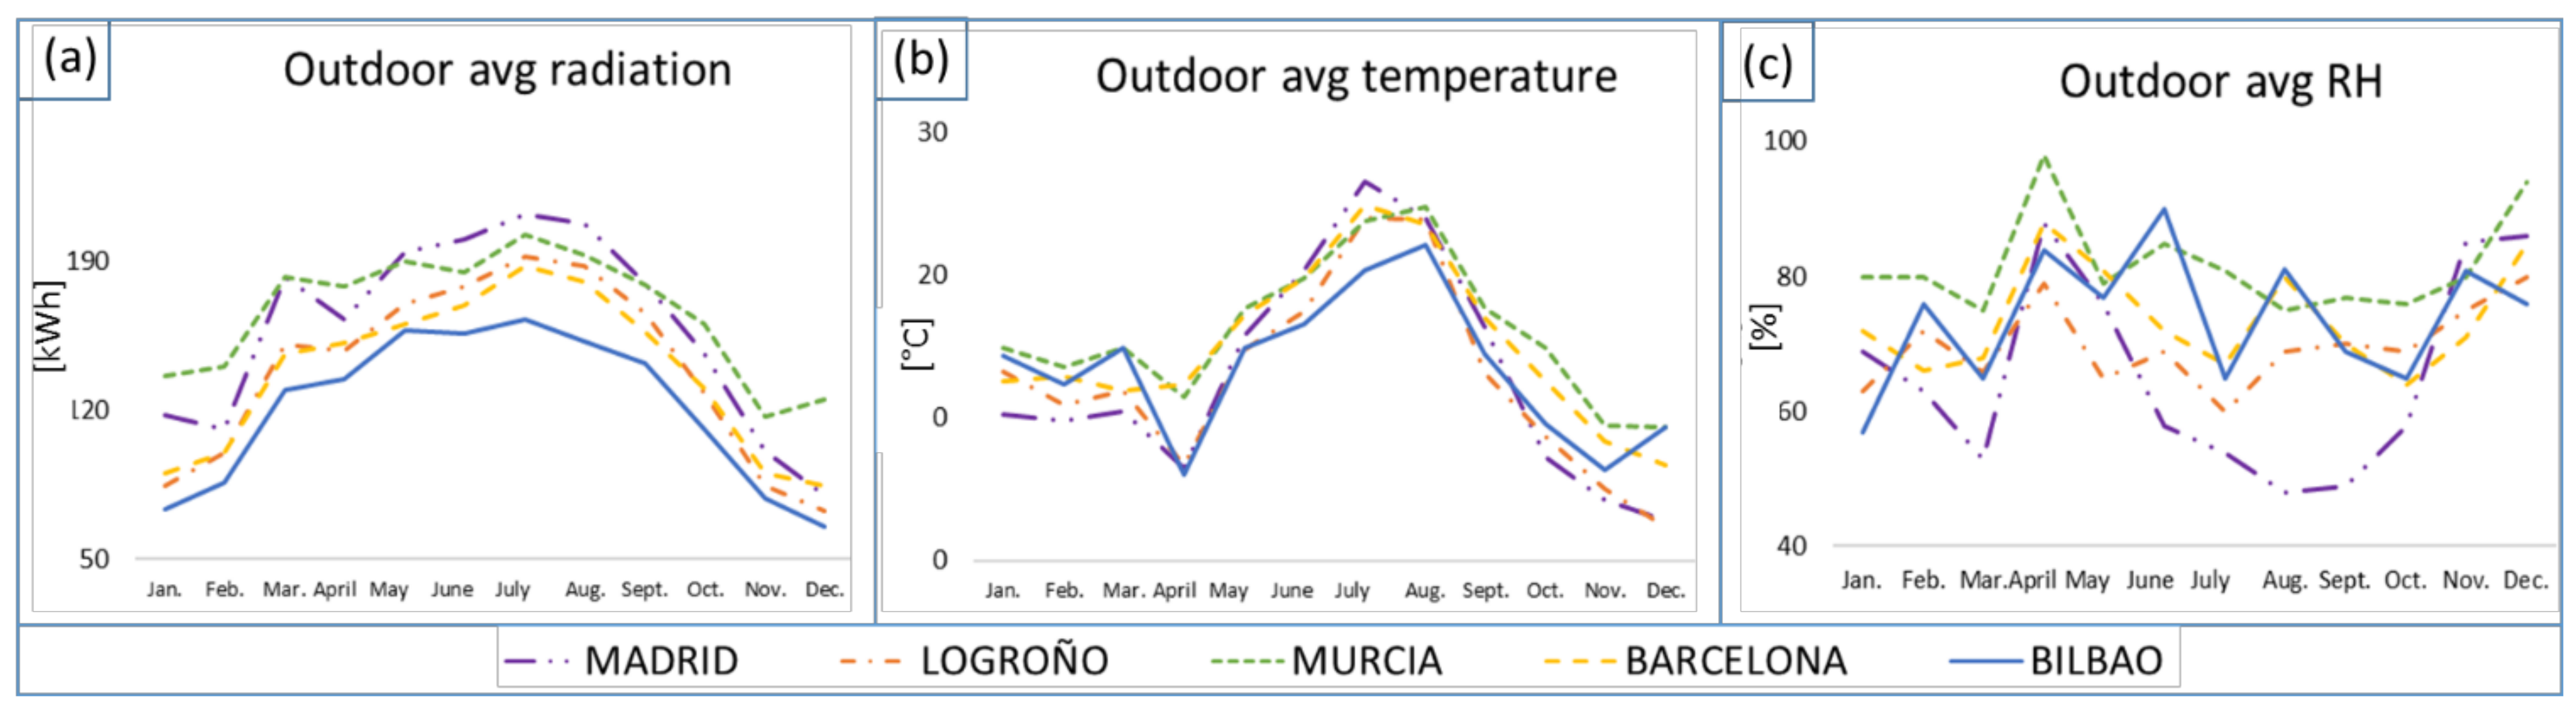
  • Weather data, such as dry-bulb temperature, humidity, radiation, etc., of the location.
  • According to the Spanish norm, offices require an IDA2 quality of indoor air, which means a minimum ventilation rate of 0.0125 m 3 / s · ach · person or 0.83 l / s · m 2 if the room is empty [12]. In addition, the operative temperature during wintertime needs to be between 21 and 23 °C and between 23 and 25 °C during summer [13], while the relative humidity should be between 45 and 55% and 40 and 60%, respectively.
The building’s structural characteristics and environmental features were defined in Transient System Simulation Tool (TRNSYS [14]) TRNBuild interface and the weather conditions were introduced according to the Meteonorm database [15].

2.4. Characteristics of the Polygeneration Facility

The polygeneration facility is designed based on the office-building requirements. Accordingly, the correct ventilation system, the air-handling unit (AHU), the generation units and the corresponding auxiliary devices and renewable technologies would provide the appropriate indoor thermal comfort conditions, as well as indoor air quality.
The polygeneration system has been designed with the main idea of avoiding, as much as possible, the consumption of fossil fuels and therefore using local renewable energies instead. For that, combined heat and power devices (CHP) and photovoltaic panels (PV) are connected to a chiller to provide heating (H), cooling (C) and electricity (E), in order to achieve the required thermal comfort and indoor air quality in combination with the ventilation system see (Figure 3).
There are currently specific indicators for polygeneration systems that aim to show the improvements of this system with respect to the separate generation. The energy saving is simply the decrease in consumption compared with the separate reference generation. Therefore, cogeneration energy savings ( E S C H P ) and total energy savings ( E S T O T ) are defined as follows [16], as can be seen in Figure 4:
E S C H P = F s e p F C H P = E C H P R e f E η + H C H P R e f H η F C H P
E S T O T = F s e p T O T F C H P + F n e t C h = E C H P + E P V C R e f C C O P R e f E η + H R e f H η + C R e f C C O P · R e f E η F C H P + F n e t C h
where F s e p represents the resource consumption required with separate generation, F C H P is the CHP fuel consumption, F n e t C h is the chiller net consumption, F n e t C h = F C h ( E C H P + E P V ) when it takes a positive value and F n e t C h = 0 in all other cases. E C H P represents the cogenerated electricity, and E P V denotes the electricity generated by photovoltaics (so the produced net electricity is E n e t = E C H P + E P V C R e f C C O P ). H and C refer to the polygenerated heating and cooling and R e f E η is the reference efficiency of local electricity generation according to the energy mix and year, while R e f H η , R e f C C O P refer to the heating reference efficiency and cooling reference coefficient of performance (COP) according to the fuel type [17].
Consequently, the percentage of energy saving (PES) is determined as follows [16]:
P E S C H P = 1 F E C H P R e f E η + H C H P R e f H η
P E S T O T = 1 F C H P + F n e t C h E C H P + E P V R e f E η + H R e f H η
If the polygeneration system has an electrical power less than 100 kWe [18], a positive PES is enough to justify the polygeneration with respect to separate generation.
The Spanish legislation that regulates cogeneration uses the concept of equivalent electrical efficiency [19]. Taking into account that, in our case, the cooling is provided by electricity C R e f C C O P · R e f E η , the fuel consumption attributable to the electricity production can be calculated as:
F e q E , C H P = F C H P F H = F C H P H C H P R e f H η
F e q E , T O T = F C H P + F n e t C h H R e f H η
hence, the equivalent electrical efficiency is:
E E E C H P = E C H P F C H P H C H P R e f H η
E E E T O T = E C H P + E P V F C H P + F n e t C h H R e f H η
If exergy parameters are used instead, the following indicators are defined for the total system as follows:
E x S T O T = B f u e l s e p B f u e l C H P + W n e t C h = W E C H P + W E P V R e f E ε + B H R e f H ε B f u e l C H P + W n e t C h
P E x S T O T = 1 B f u e l C H P + W n e t C h W E C H P + W E P V R e f E ε + B H R e f H ε
B F e q E , T O T = B f u e l C H P + W n e t C h B H R e f H ε
E E E T O T = W E C H P + W E P V B f u e l C H P + W n e t C h B H R e f H ε
where R e f E ε is the reference exergy efficiency for the local electricity generation, while R e f H ε refers to the heating reference exergy efficiency.

2.5. Energy and Exergy Analysis of the Air-Handling Unit (AHU)

This section deals with the analysis of the AHU, which is the component of the installation in charge of guaranteeing the indoor air requirements within a specific range of temperature and humidity. It usually consists of diverse components that have a specific purpose when conditioning the incoming air. Briefly, the aims of said components are:
  • Pre-conditioning the intake air by exchanging heat with the exhaust air and partially mixing it with the extracted indoor air.
  • Increasing or decreasing the temperature of the air by means of sensible heating or cooling.
  • Decreasing or increasing the humidity of the incoming air by means of cooling dehumidification or humidification by adding water.
Hence, a heat exchanger is usually used to precondition the incoming air with the outgoing exhaust air from the room. Next, cooling and heating coils (and sometimes a dehumidifier) are used to achieve the proper temperature conditions, as well as to approach ideal humidity conditions and, if needed, a humidifier is used to achieve the humidity requirement (Figure 5).
The following sections briefly describe each of the elementary processes that can take place in an AHU as well as establishing the exergy balance in order to calculate the exergy destruction in each process and define the exergy efficiency, assuming in all cases that the process is adiabatic, and therefore, the energy efficiency is 100% [8].

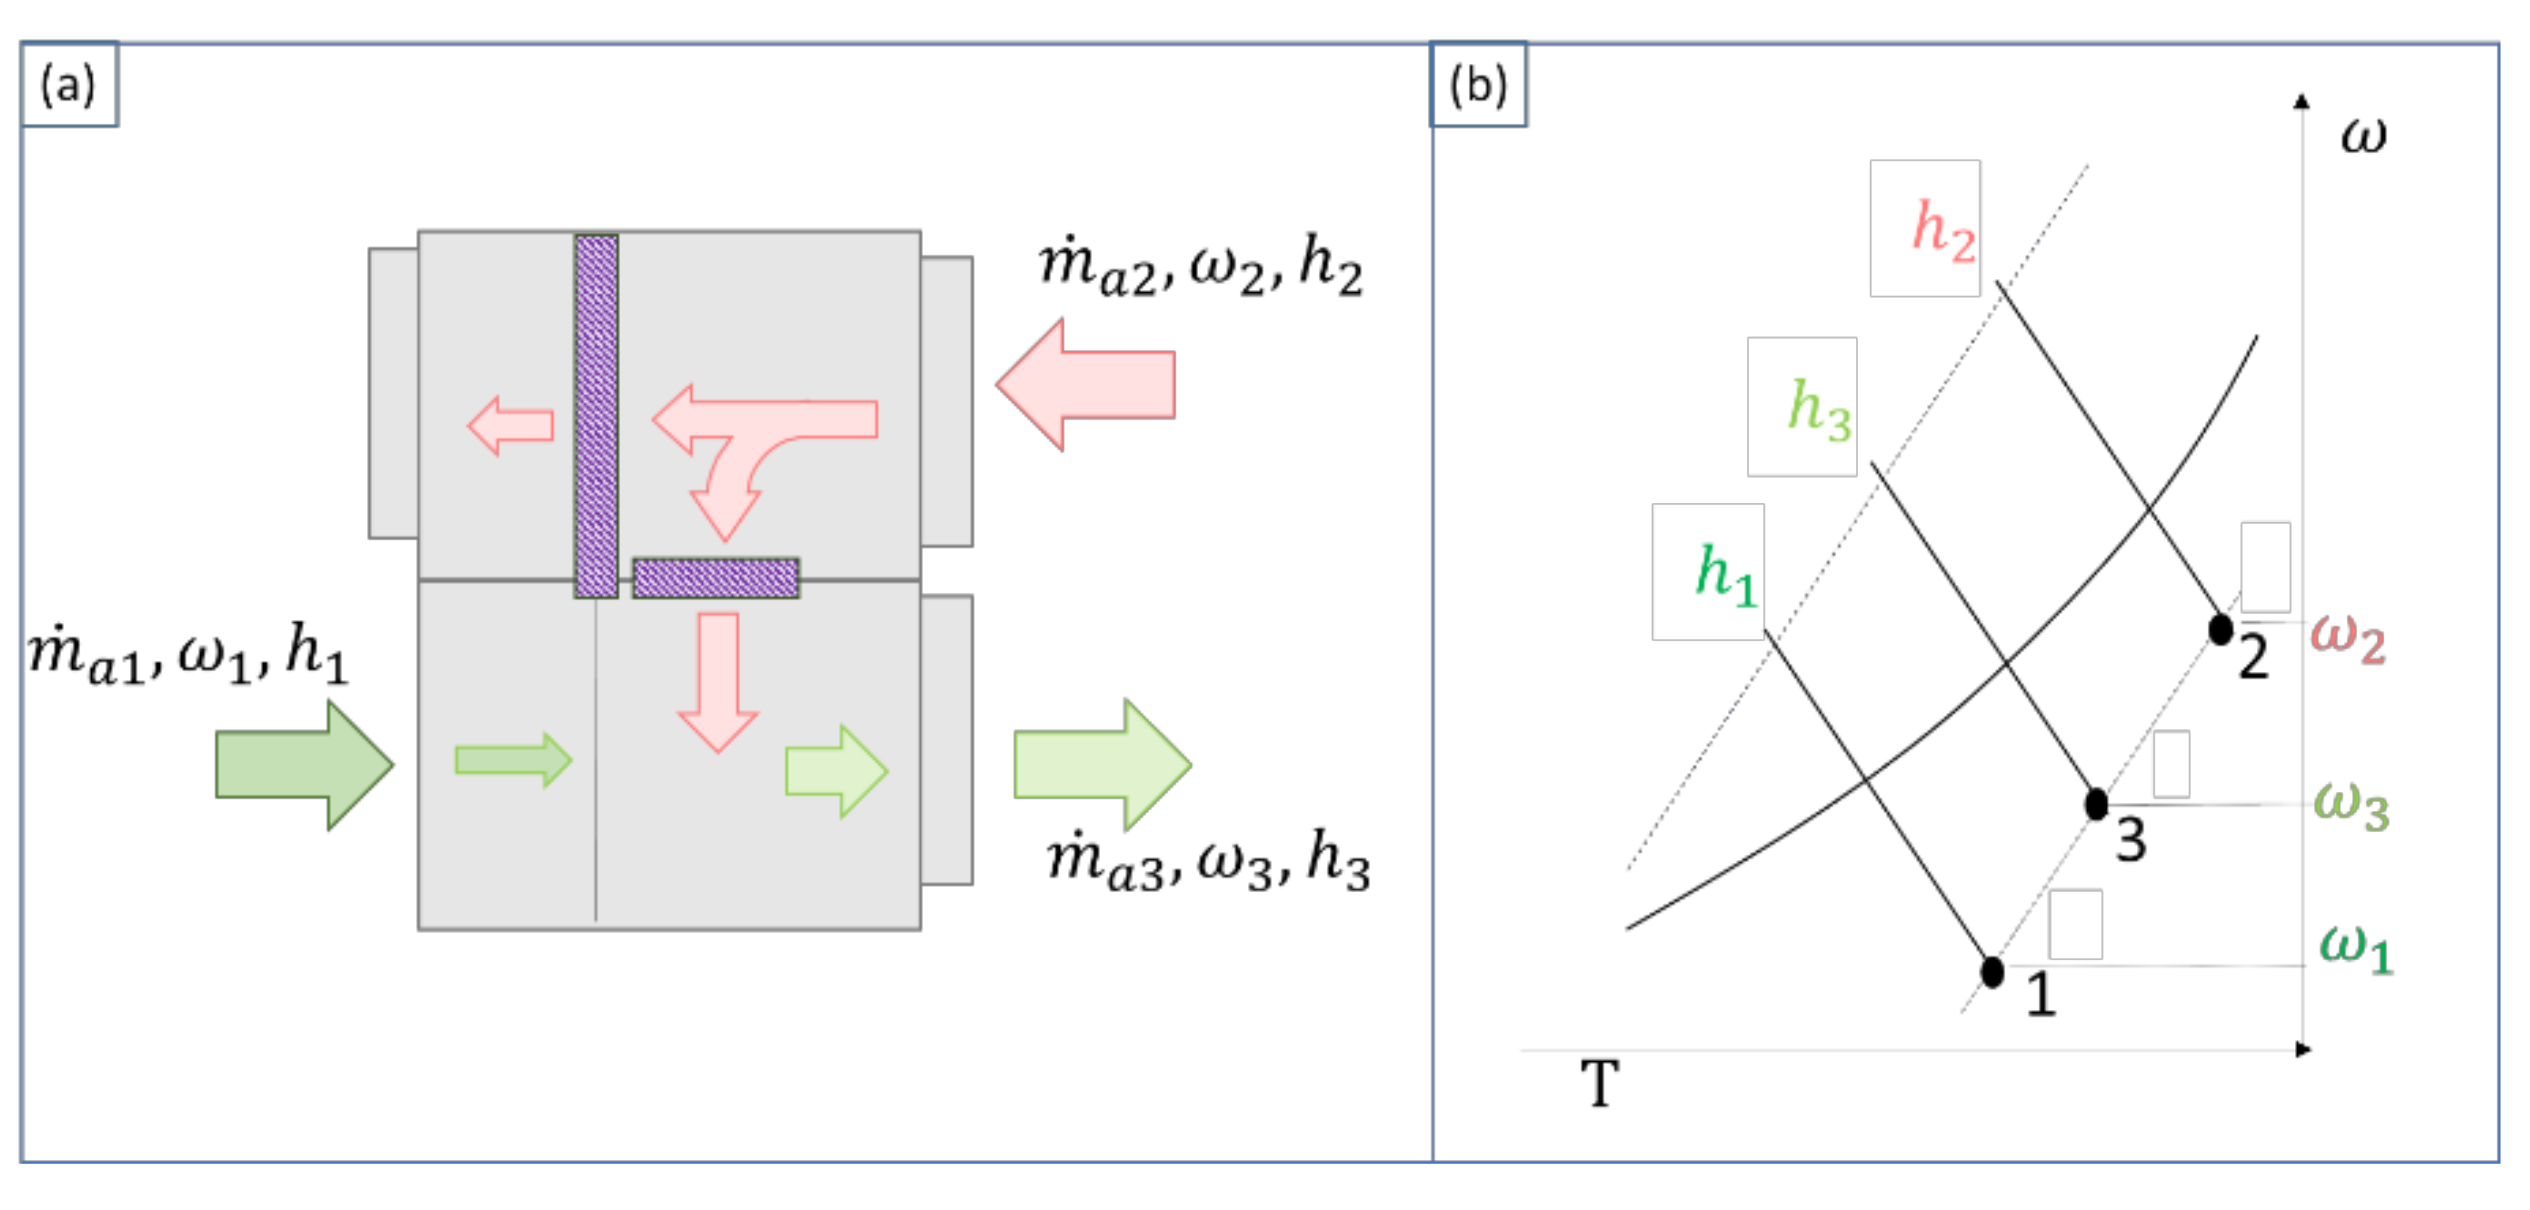
2.5.1. Adiabatic Mixing of Two Flow Rates

As already stated, the incoming clean air mass flow rate m ˙ a 1 (1) usually mixes with a fraction of the extracted indoor air m ˙ a 2 (2), resulting in the mixed airflow mass rate m ˙ a 3 (3), as can be seen in Figure 6a; this process is generally assumed to be adiabatic.
If mass and energy balances are applied, the following equation is obtained:
m ˙ a 1 m ˙ a 2 = h 2 h 3 h 3 h 1 = ω 2 ω 3 ω 3 ω 1
where ω i , h i refer to the absolute humidity and the specific enthalpy of the i-th flow, respectively (Figure 6b).
Additionally, an exergy analysis provides the exergy destruction rate D ˙ of the process:
D ˙ = m ˙ a 1 b 1 + b 1 c h + m ˙ a 2 b 2 + b 2 c h m ˙ a 3 b 3 + b 3 c h
where b i , b i c h refer to the physical and chemical exergy of the i-th flow, respectively.
Then, the exergy efficiency of the process can be defined as:
ε = m ˙ a 3 b 3 + b 3 c h m ˙ a 1 b 1 + b 1 c h + m ˙ a 2 b 2 + b 2 c h

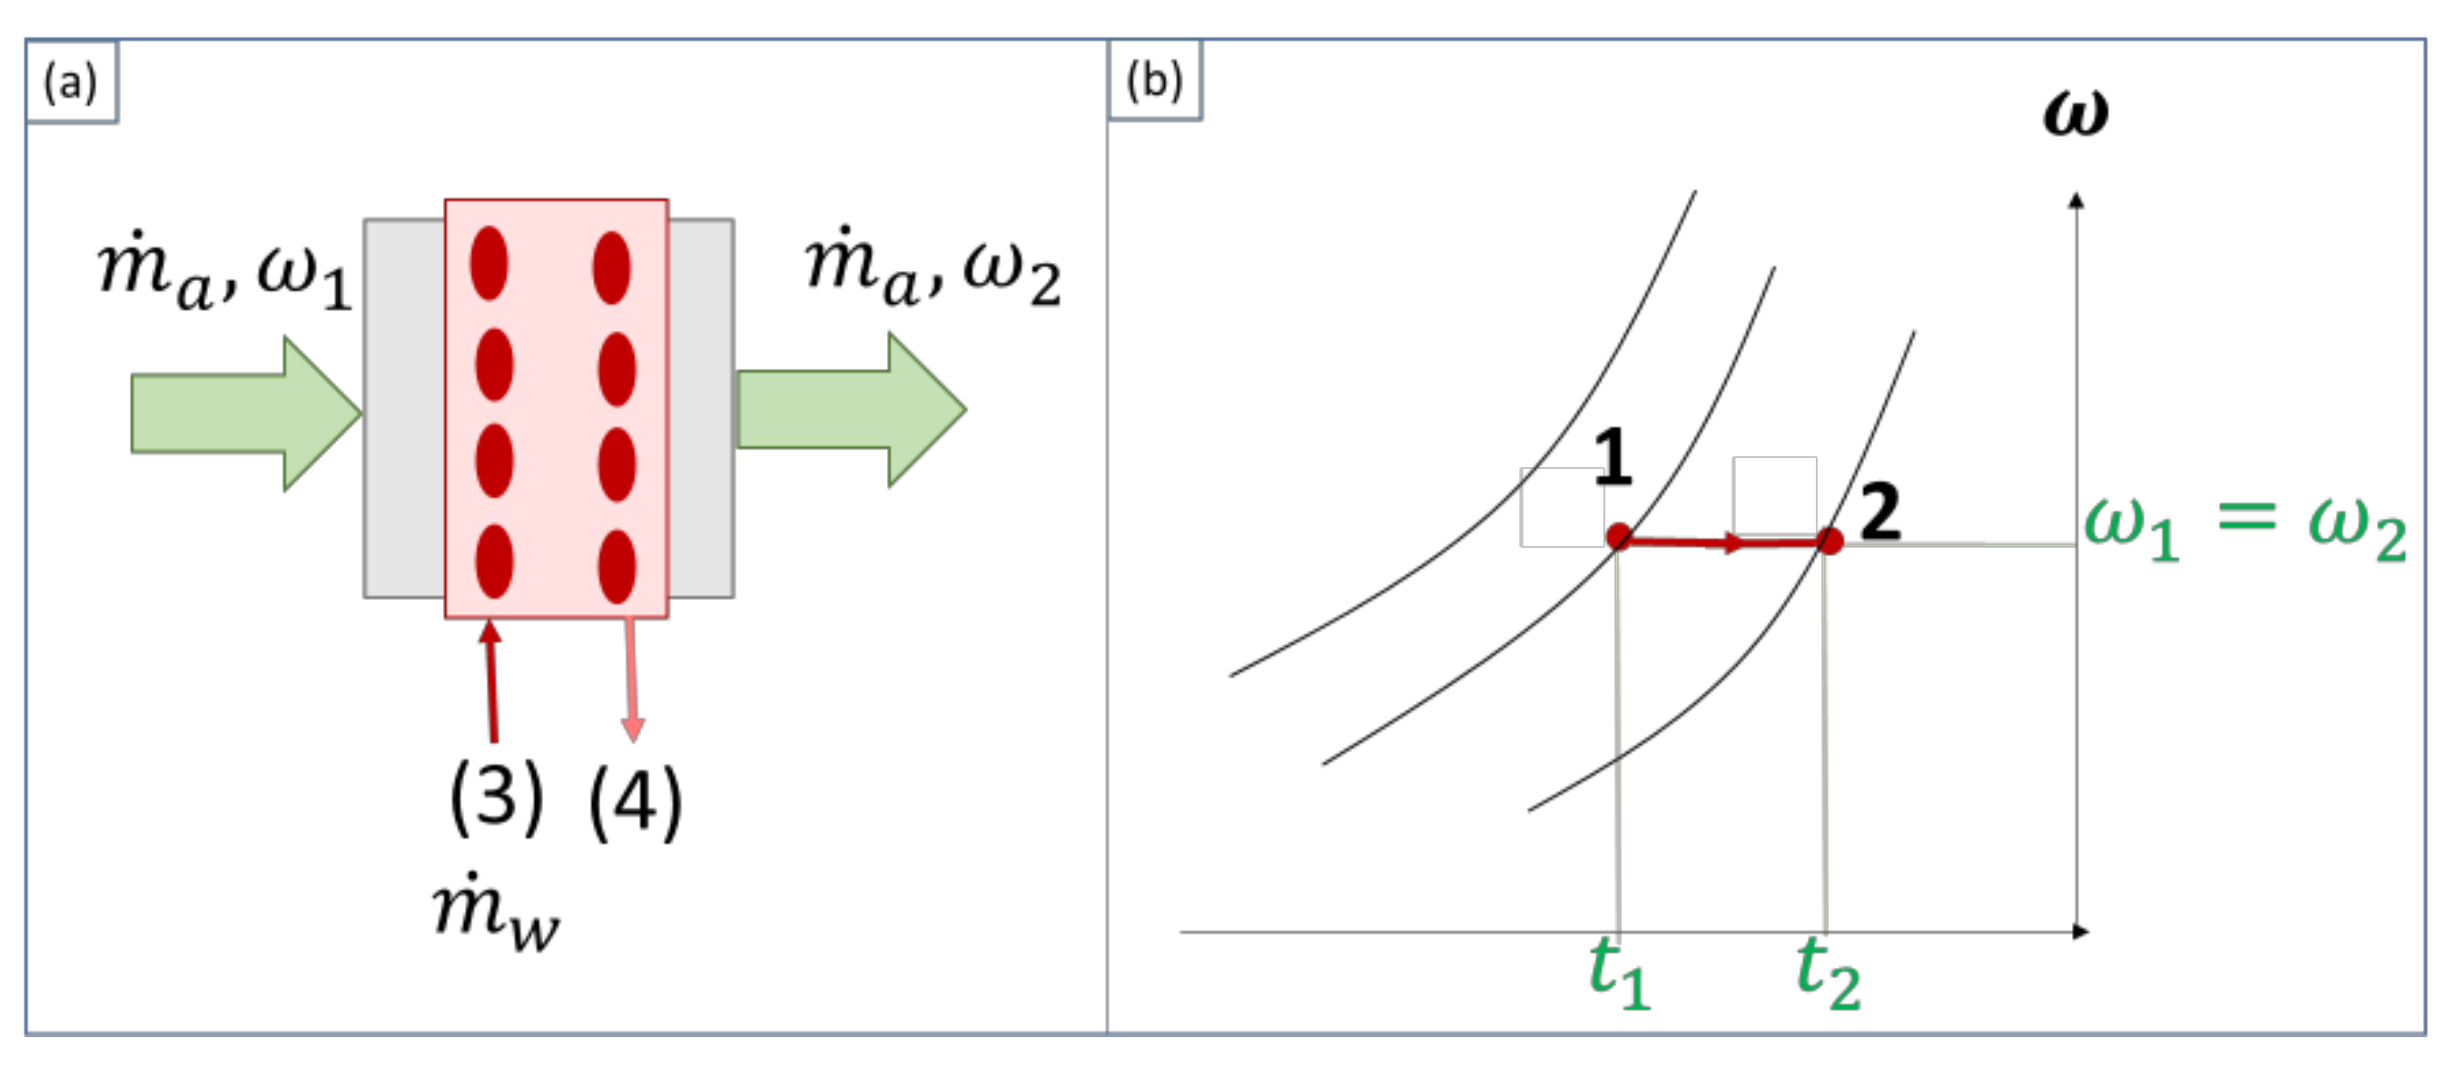
2.5.2. Sensible Heating or Cooling of the Air

A sensitive process aims to affect only the temperature of the airflow without altering its humidity. This can be achieved by a hot/cold surface of the coils. In sensitive cooling, the temperature of the cold surface must be higher than the dew point of the air, otherwise condensation will take place.
The energy balance of an adiabatic heating process of the airflow from state (1) to (2) with a m ˙ w water hot flow (decreasing its enthalpy from state (3) to (4)) is shown in Figure 7:
m ˙ a h 2 h 1 = m ˙ w h 3 h 4
In addition, the rate of exergy destruction D ˙ is obtained by the exergy balance, resulting in:
D ˙ = m ˙ a b 2 b 1 m ˙ w b 3 b 4
Considering that the purpose of the process it to increase the energy (exergy) of the airflow by decreasing the energy (exergy) of the hot water in the coil, the energy and exergy efficiencies of such adiabatic processes are:
η = m ˙ a h 2 h 1 m ˙ w h 3 h 4 = 1 a d i a b a t i c
ε = m ˙ a b 2 b 1 m ˙ w b 3 b 4 = 1 D ˙ m ˙ w b 3 b 4

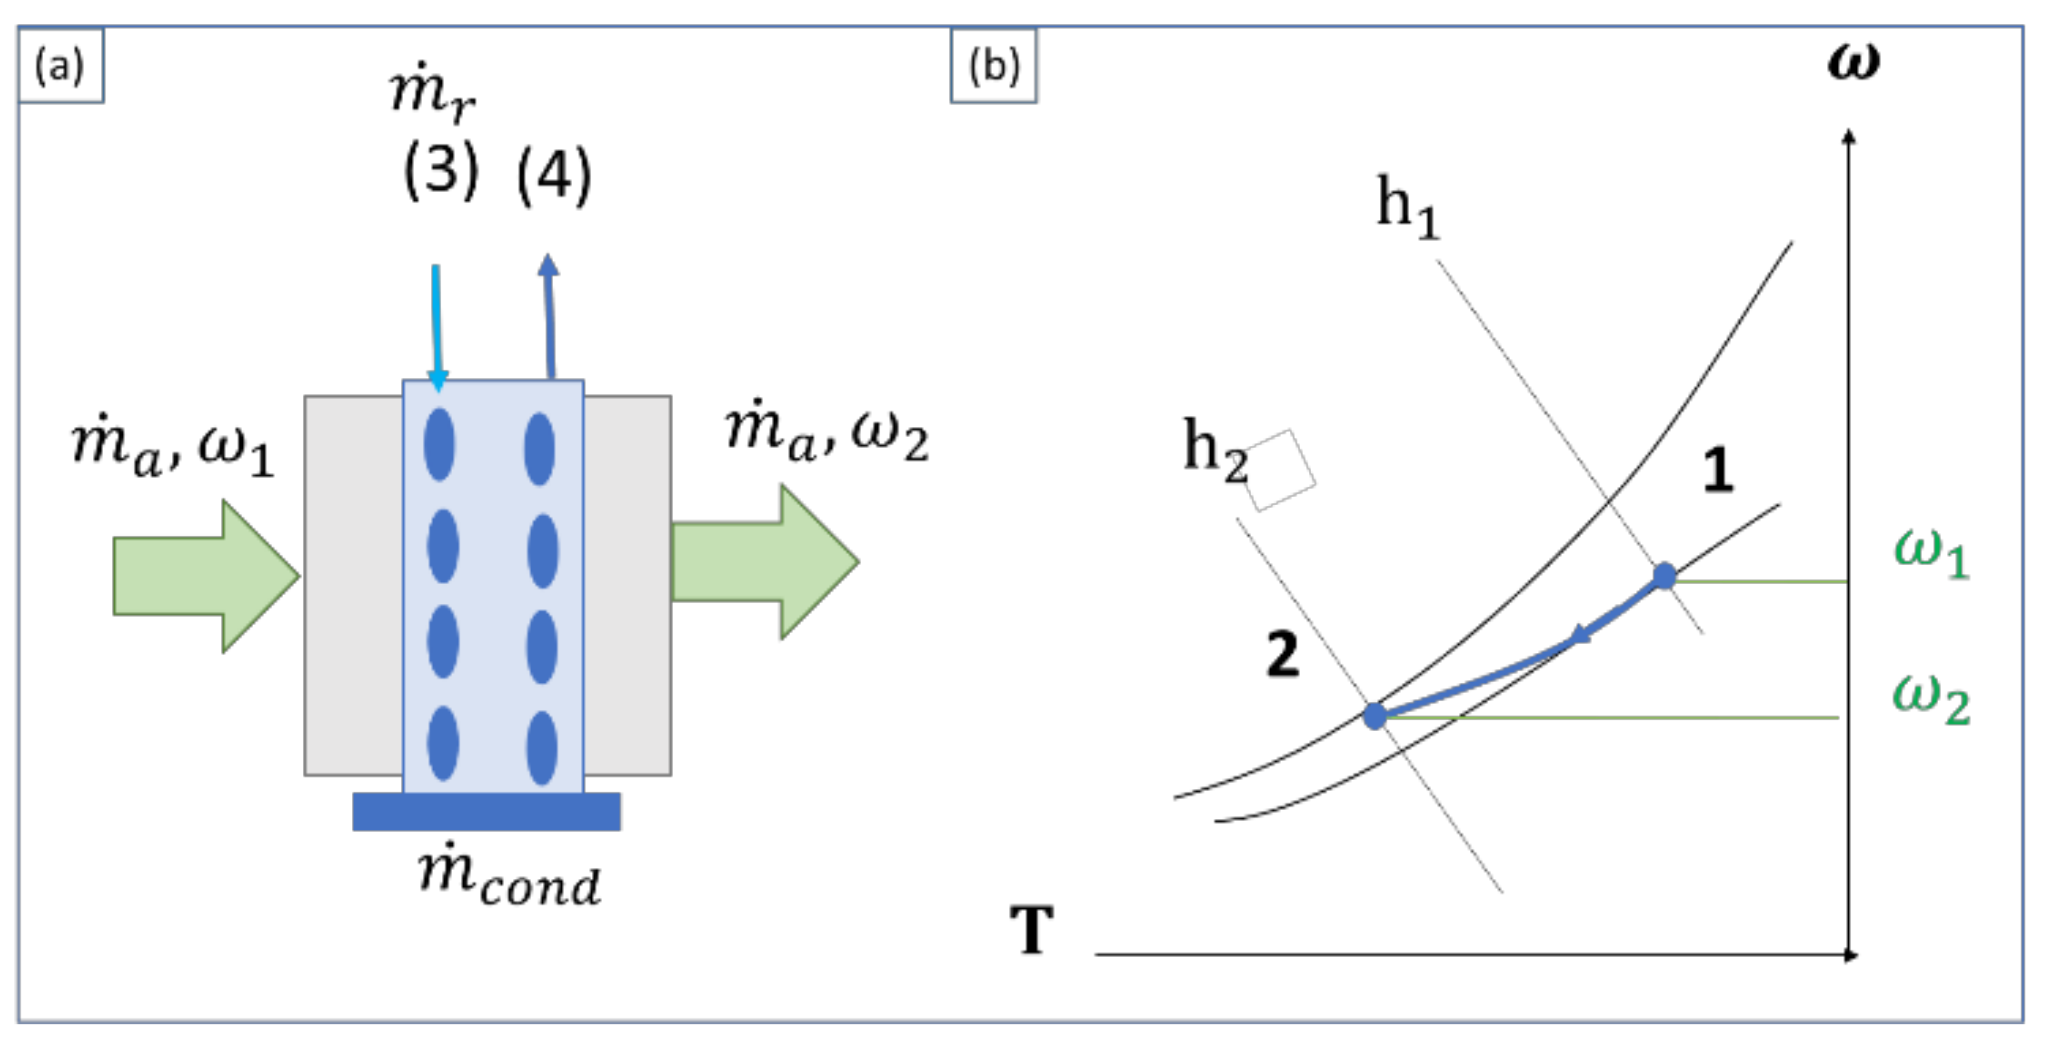
2.5.3. Cooling and Dehumidification

When the cold surface of the coil is below the dew point temperature of the inlet air, its vapor condenses so the ω absolute humidity of the air decreases from state (1) to (2) (Figure 8). In fact, while the dry-bulb temperature and the enthalpy of the air decrease, the relative humidity increases. Nevertheless, during this process, only a percentage of the air is in contact with the cooling tubes, so a bypass factor can be defined to account for the quantity of air that has not changed its state.
An energy analysis reveals that the relation between the heat exchanged by the air in the cooling coil Q ˙ and the mass flow of condensate m ˙ c o n d does not depend on the mass flow rate of circulating air:
Q ˙ m ˙ c o n d = h 1 h 2 ω 1 ω 2
The exergy destruction rate D ˙ is obtained through an exergy analysis, by considering that the refrigerated cold water m ˙ r changes its state from (3) to (4), decreasing its exergy from b 3   to   b 4 :
D ˙ = m ˙ r b 3 b 4 + m ˙ a b 1 + b 1 c h b 2 + b 2 c h m ˙ c o n d b c o n d
In this process, the physical exergy of the air decreases b 1 > b 2 , but its chemical exergy b i c h can increase or decrease. If the exergy of the condensate b c o n d is not considered, since it is very small, the exergy efficiency of the process can be defined as:
ε = b 1 + b 1 c h b 2 + b 2 c h m ˙ r b 3 b 4

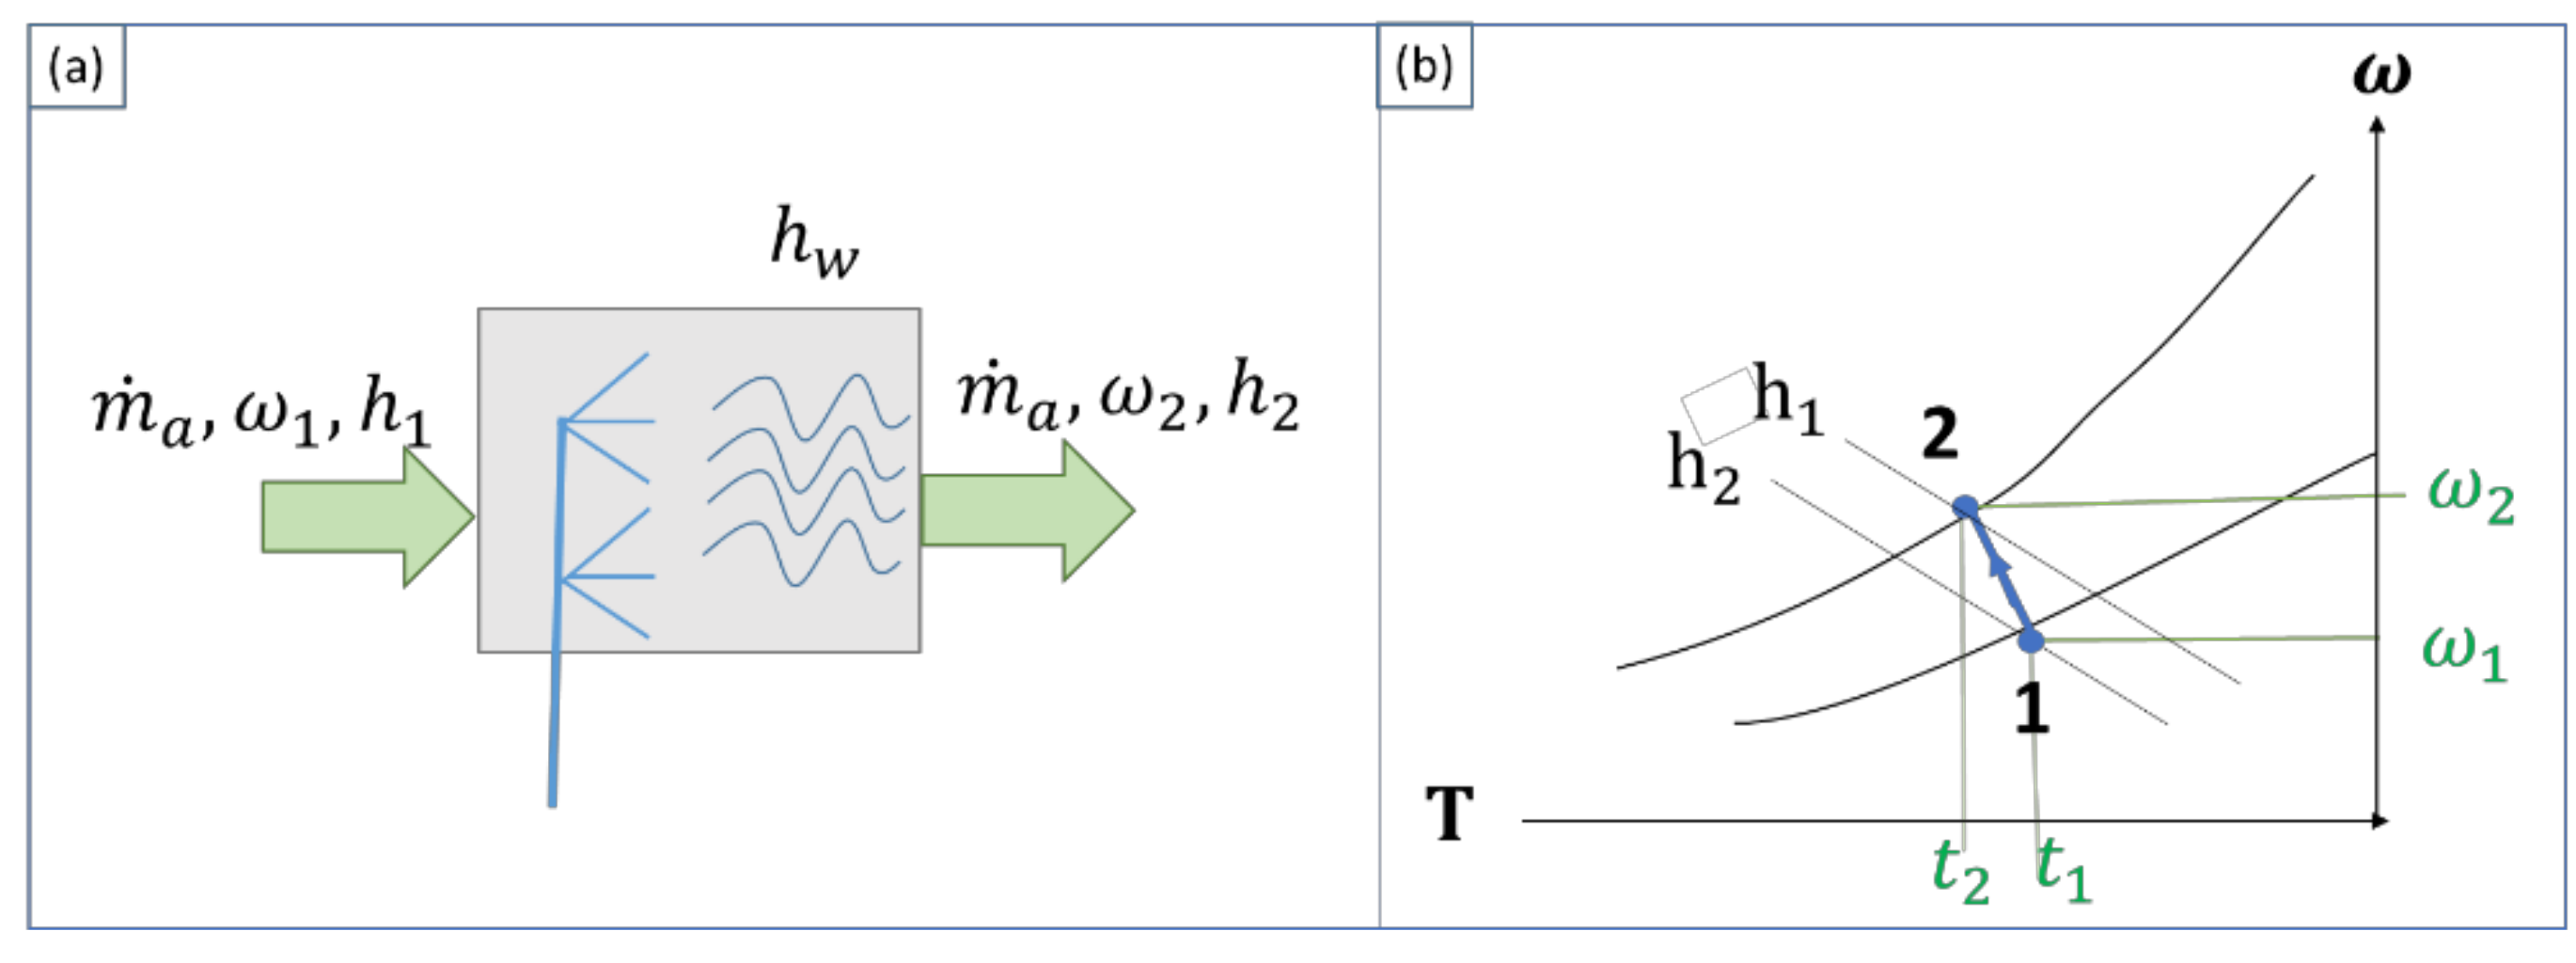
2.5.4. Humidification or Dehumidification by Mixing with Water

The humidity of the air can be modified by injecting vapor or liquid water. If the vapor is at the same level as the dry-bulb temperature of the air, only the humidity of the air would be changed, without modifying its temperature. If the vapor temperature is higher, the air is humidified and heated. If the vapor temperature is lower than the air wet-bulb temperature, but higher than the dew temperature, the air is humidified and cooled.
In an adiabatic cooling and humidifying process, liquid water is injected, which is partially evaporated, extracting heat to the airflow from state (1) to (2), as can be seen in Figure 9. According to the mass and energy balances:
h 2 h 1 ω 2 ω 1 = h w
The exergy destruction rate D ˙ of this process is:
D ˙ = m ˙ a b 1 + b 1 c h b 2 + b 2 c h + m ˙ w b w + W ˙ b
where W ˙ b is the power of the high pressure pump needed to move the water mass flow.
Accordingly, the exergy efficiency of the process can be defined as:
ε = b 2 + b 2 c h b 1 + b 1 c h m ˙ w b w + W ˙ b

3. Results

This section contains the main results of the study, beginning with the case study definition and later providing the numerical results.

3.1. Case Study

The proposed building is an office building with a symmetric square architecture, 10 floors and 420 m2 each floor surface. The total volume of the building is 12,600 m3. Because of its use, the indoor air quality must be verified during the whole year, as well as the indoor comfort temperature and humidity.
The main physical and thermal characteristics of the different walls and windows are those defined in reference [20]. From these thermal properties and the geometry of those components, a thermal capacity of 7560 kJ/K has been calculated for the entire envelope of the building. The internal gains were inserted according to the building usage: lighting, workers and computers.

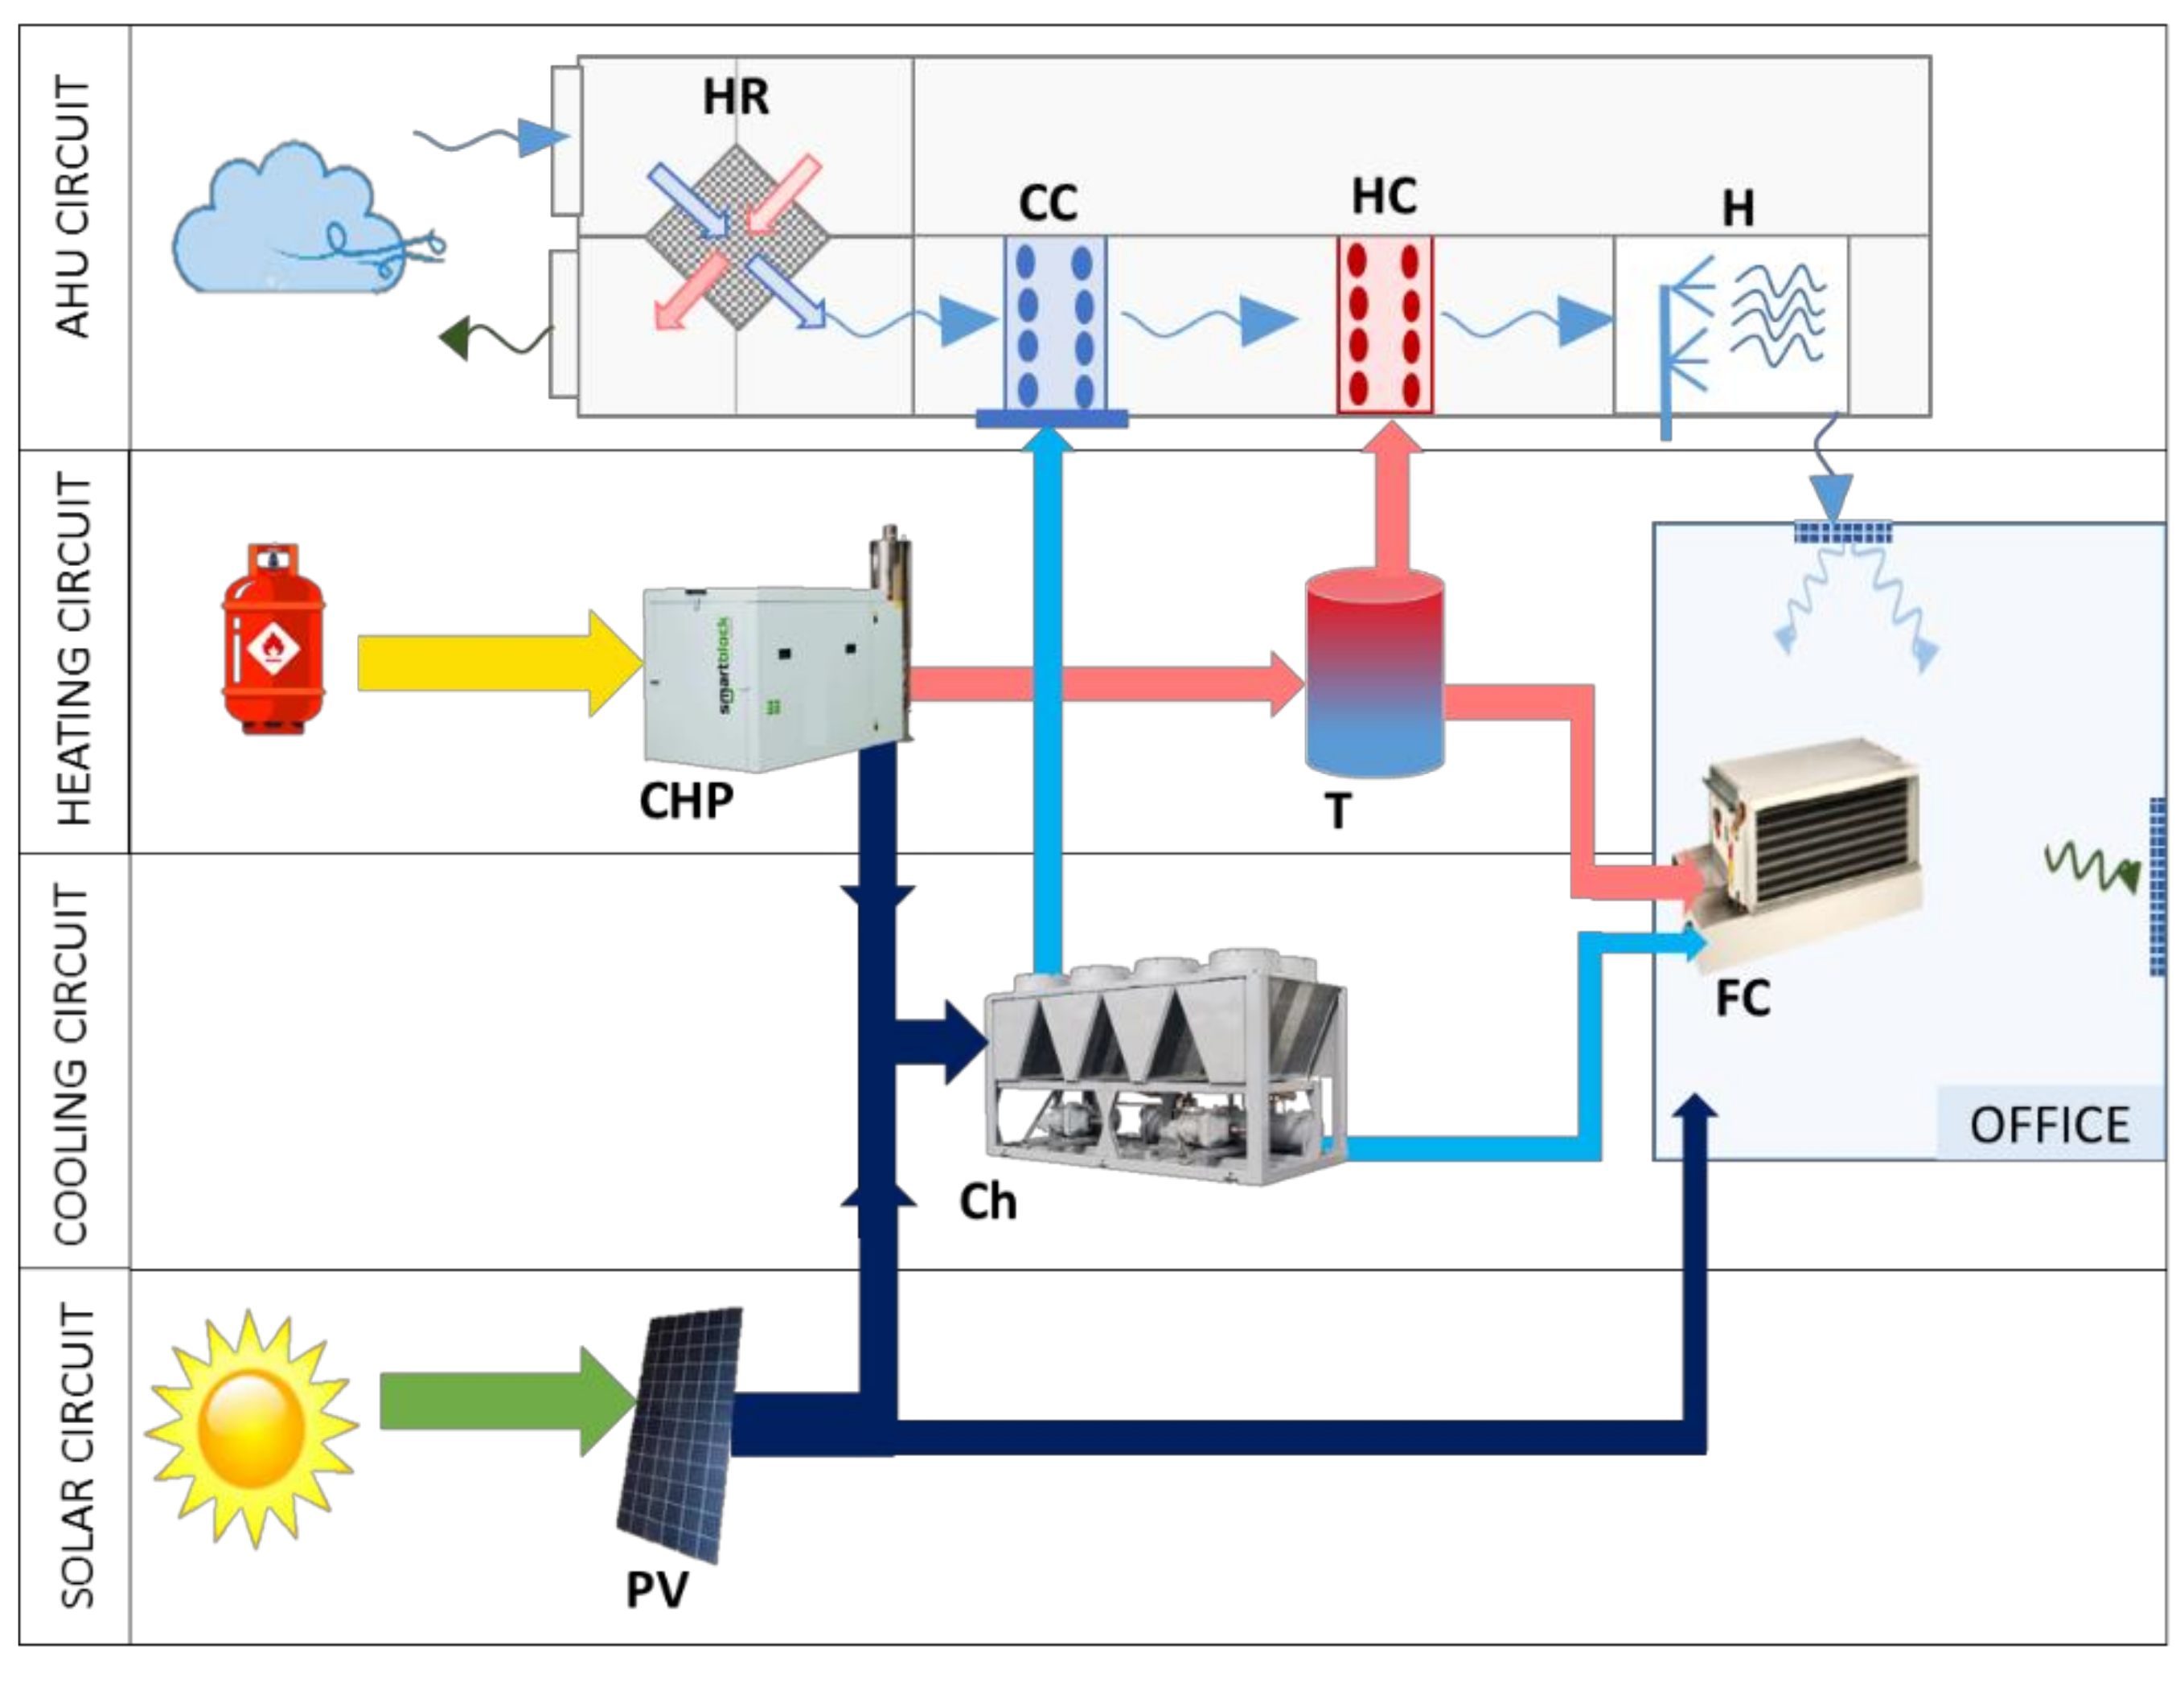
3.2. Description of the Complete Installation

As mentioned, besides the generation components, the selected facility consists of an overriding air-handling unit (AHU) and two fan-coil terminals per floor to provide the air with the appropriate temperature and humidity to the building (Figure 10). The four main circuits are:
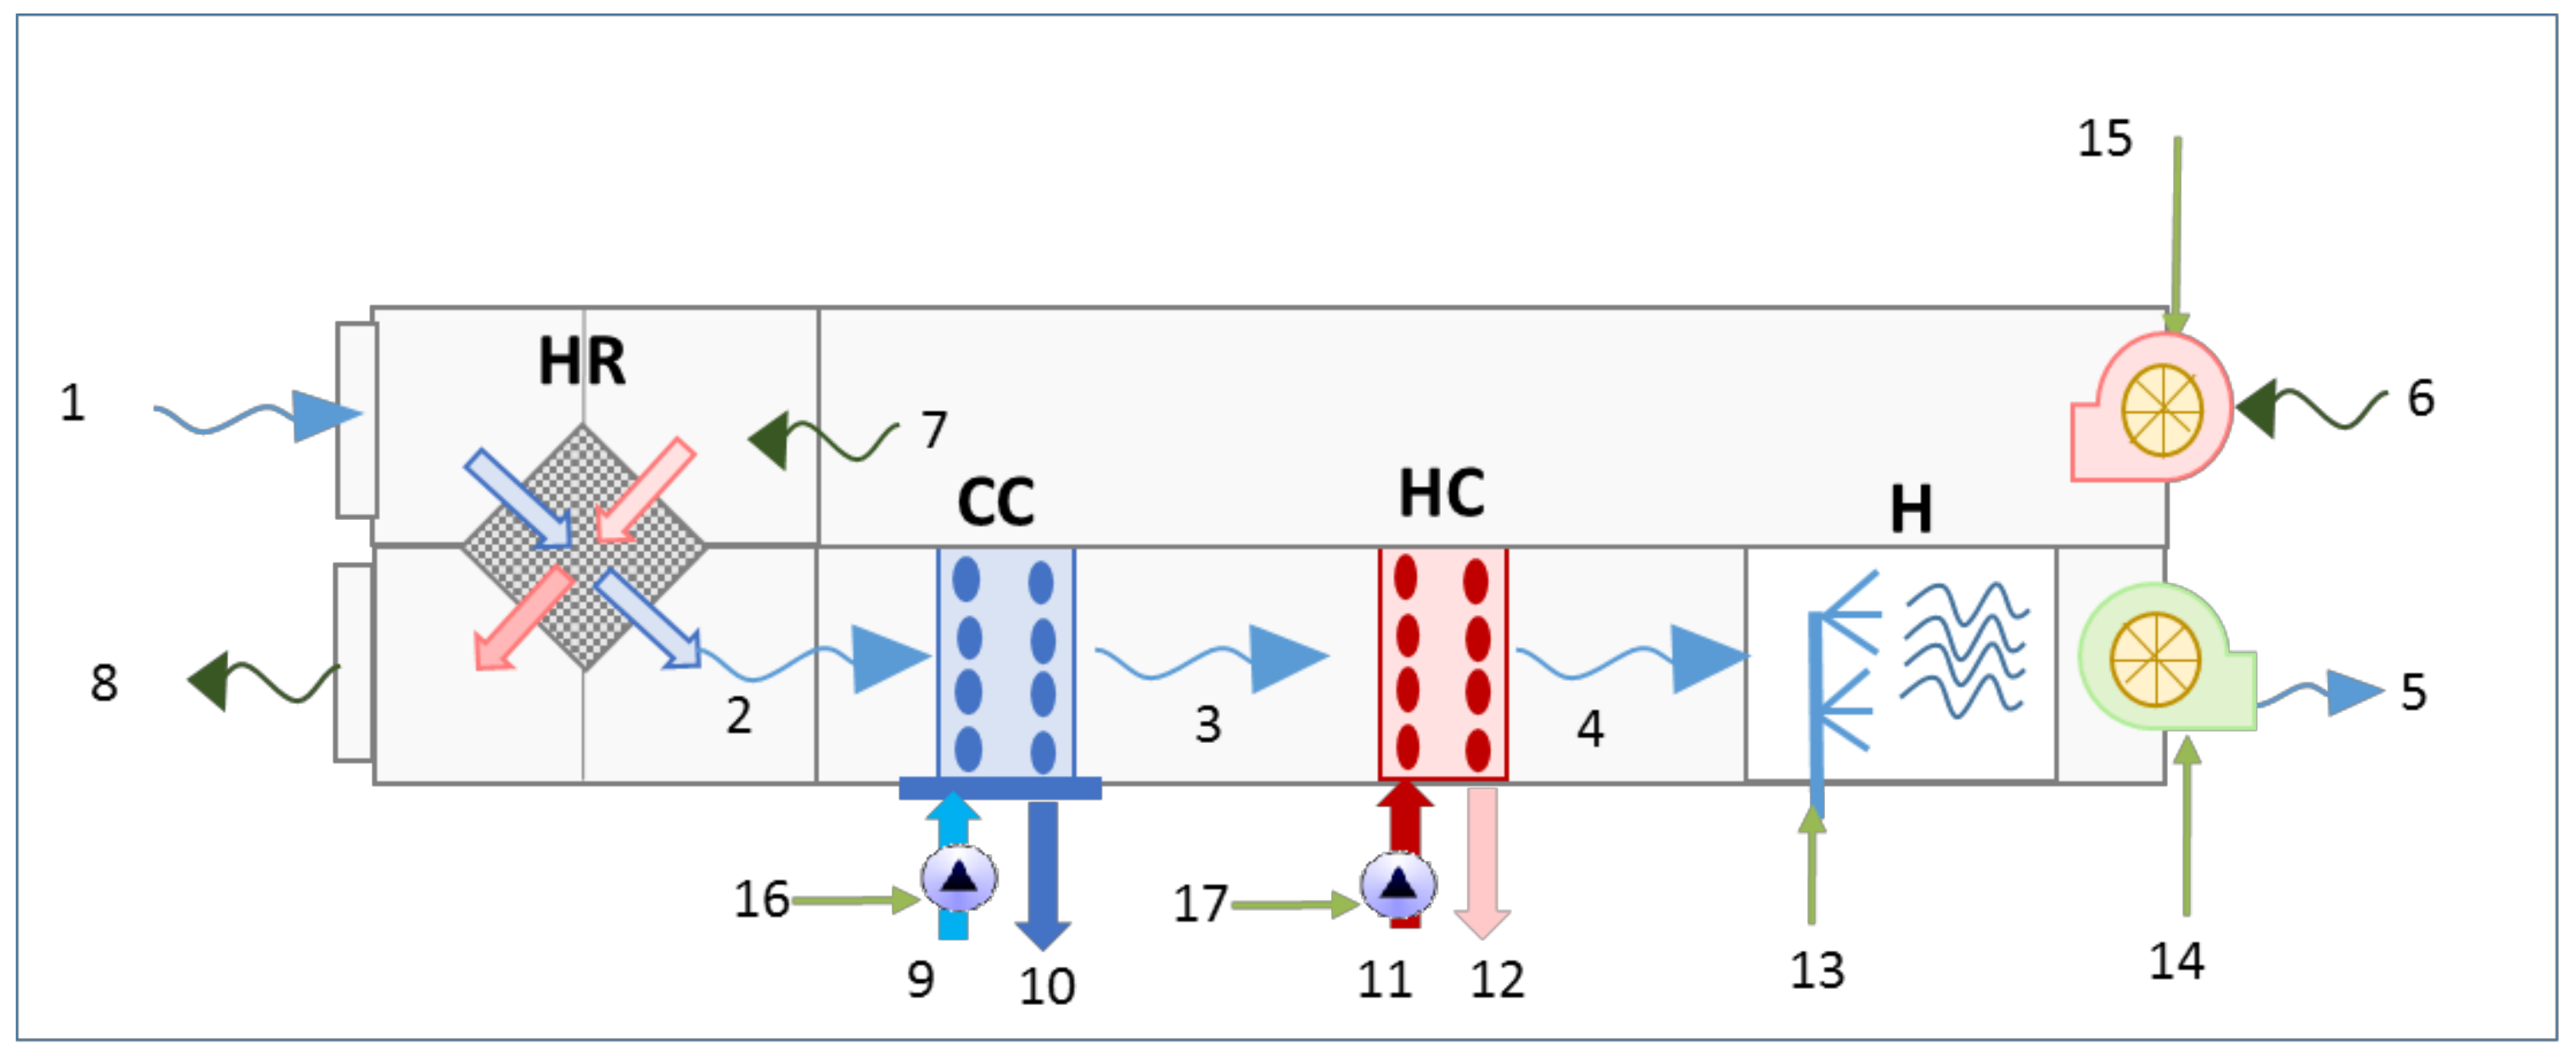
  • AHU circuit: which consists of the heat recovery (HR), a cooling coil (CC), a heating coil (HC) and a humidifier (H) to condition the intake air; this circuit provides the required ventilation for IDA2 indoor quality.
  • Heating circuit: formed by two natural gas internal combustion cogeneration engines (CHP) of 50 kWe electric power and 87.7 kWt thermal nominal power each. A 2500 L thermal storage tank introduces the inertia to the circuit and feeds the HC and the fan coils (FC) with hot water to satisfy the heating demand.
  • Cooling circuit: the cogenerated electricity and the photovoltaic panels (PV) feed a 110 kW chiller (Ch); when self-produced electricity is not enough, it is taken from the net. The chiller provides cold water to the CC and to the FC, to satisfy the cooling demand.
  • Solar circuit: PV panels with 60 m2 total area that generate electricity for the Ch and/or the office lighting.
  • The control system has the following schedule:
  • In wintertime, programmed between 1 November and 15 May, heating is provided, if required. Summertime is between 16 May and 31 October, and cooling is provided to the building in this period.
  • Ventilation (provided by the AHU system) is activated during the whole year following the IDA 2 requirement.
  • The indoor air temperature is maintained between 19 and 23 °C in winter and between 21 and 25 °C in summer. In addition, the relative humidity is between 45 and 66% in winter and 40 and 60% in summer.
All these circuits and the control system were implemented in the Trnsys Simulation Studio interface and the simulation was performed for 8760 h, using a 6-min time step.

3.3. Facility Operation Analysis

Once the simulation was performed, energy and exergy analyses were conducted. For that purpose, hourly thermodynamic data were extracted, and the respective energy and exergy calculations were carried out for each system flow during the 8760 h of the year.
The chemical exergy and physical exergy were calculated for the humid airflows. For water flows, conversely, only the thermal component of the exergy was considered. Although avoiding that means not considering fans and pumps individually, their electrical consumption was introduced together within the circuit main generators.
Therefore, the operation analysis stage has the following phases:
  • The adequacy of the indoor air control is checked in all the Spanish locations of the office building.
  • An energy analysis of the total system is performed over the year in a dynamic way for the different locations of the office buildings and the main polygeneration indicators are calculated.
  • Finally, an exergy analysis is carried out focusing on the AHU components.

Energy and Exergy Analysis of the AHU

The analysis is based on the abovementioned formulae using the numbering of flows shown in Figure 11. Flows 1–8 correspond to the air (Formulae (1–3)); 9–10 are the water-cooling flow supplied by the chiller (Formulae (4–5)); 11–12 correspond to heating water flow coming from the CHP (Formulae (4–5)); and flows 13–17 are the electrical power consumption of pumps and fans (Formulae (6–7)). The η energy and ε exergy efficiencies of the AHU components are:
η H R = m ˙ a 2 h 2 + m ˙ a 8 h 8 m ˙ a 1 h 1 + m ˙ a 7 h 7 ε H R = m ˙ a 2 b 2 + b 2 c h + m ˙ a 8 b 8 + b 8 c h m ˙ a 1 b 1 + b 1 c h + m ˙ a 7 b 7 + b 7 c h
η C C = h 2 h 3 m ˙ r h 10 h 9 + w 16 ε C C = b 2 + b 2 c h b 3 + b 3 c h m ˙ r b 9 b 10 + w 16
η H C = m ˙ a h 3 h 2 m ˙ w h 11 h 12 + w 17 ε H C = m ˙ a b 3 b 2 m ˙ w b 11 b 12 + b 17
η H = h 5 h 4 m ˙ w h w + w 13 ε H = b 5 + b 5 c h b 4 + b 4 c h m ˙ w b w + w 13
So, considering the outgoing exhaust air 8 as a loss, the total η A H U and ε A H U efficiencies of the whole AHU system are:
η A H U = m ˙ a h 5 h 1 m ˙ r h 10 h 9 + m ˙ w h 11 h 12 + w 13 + w 14 + w 15 + w 16 + w 17
ε A H U = m ˙ a b 5 + b 5 c h b 1 + b 1 c h m ˙ r b 9 b 10 + m ˙ w b 11 b 12 + w 13 + w 14 + w 15 + w 16 + w 17

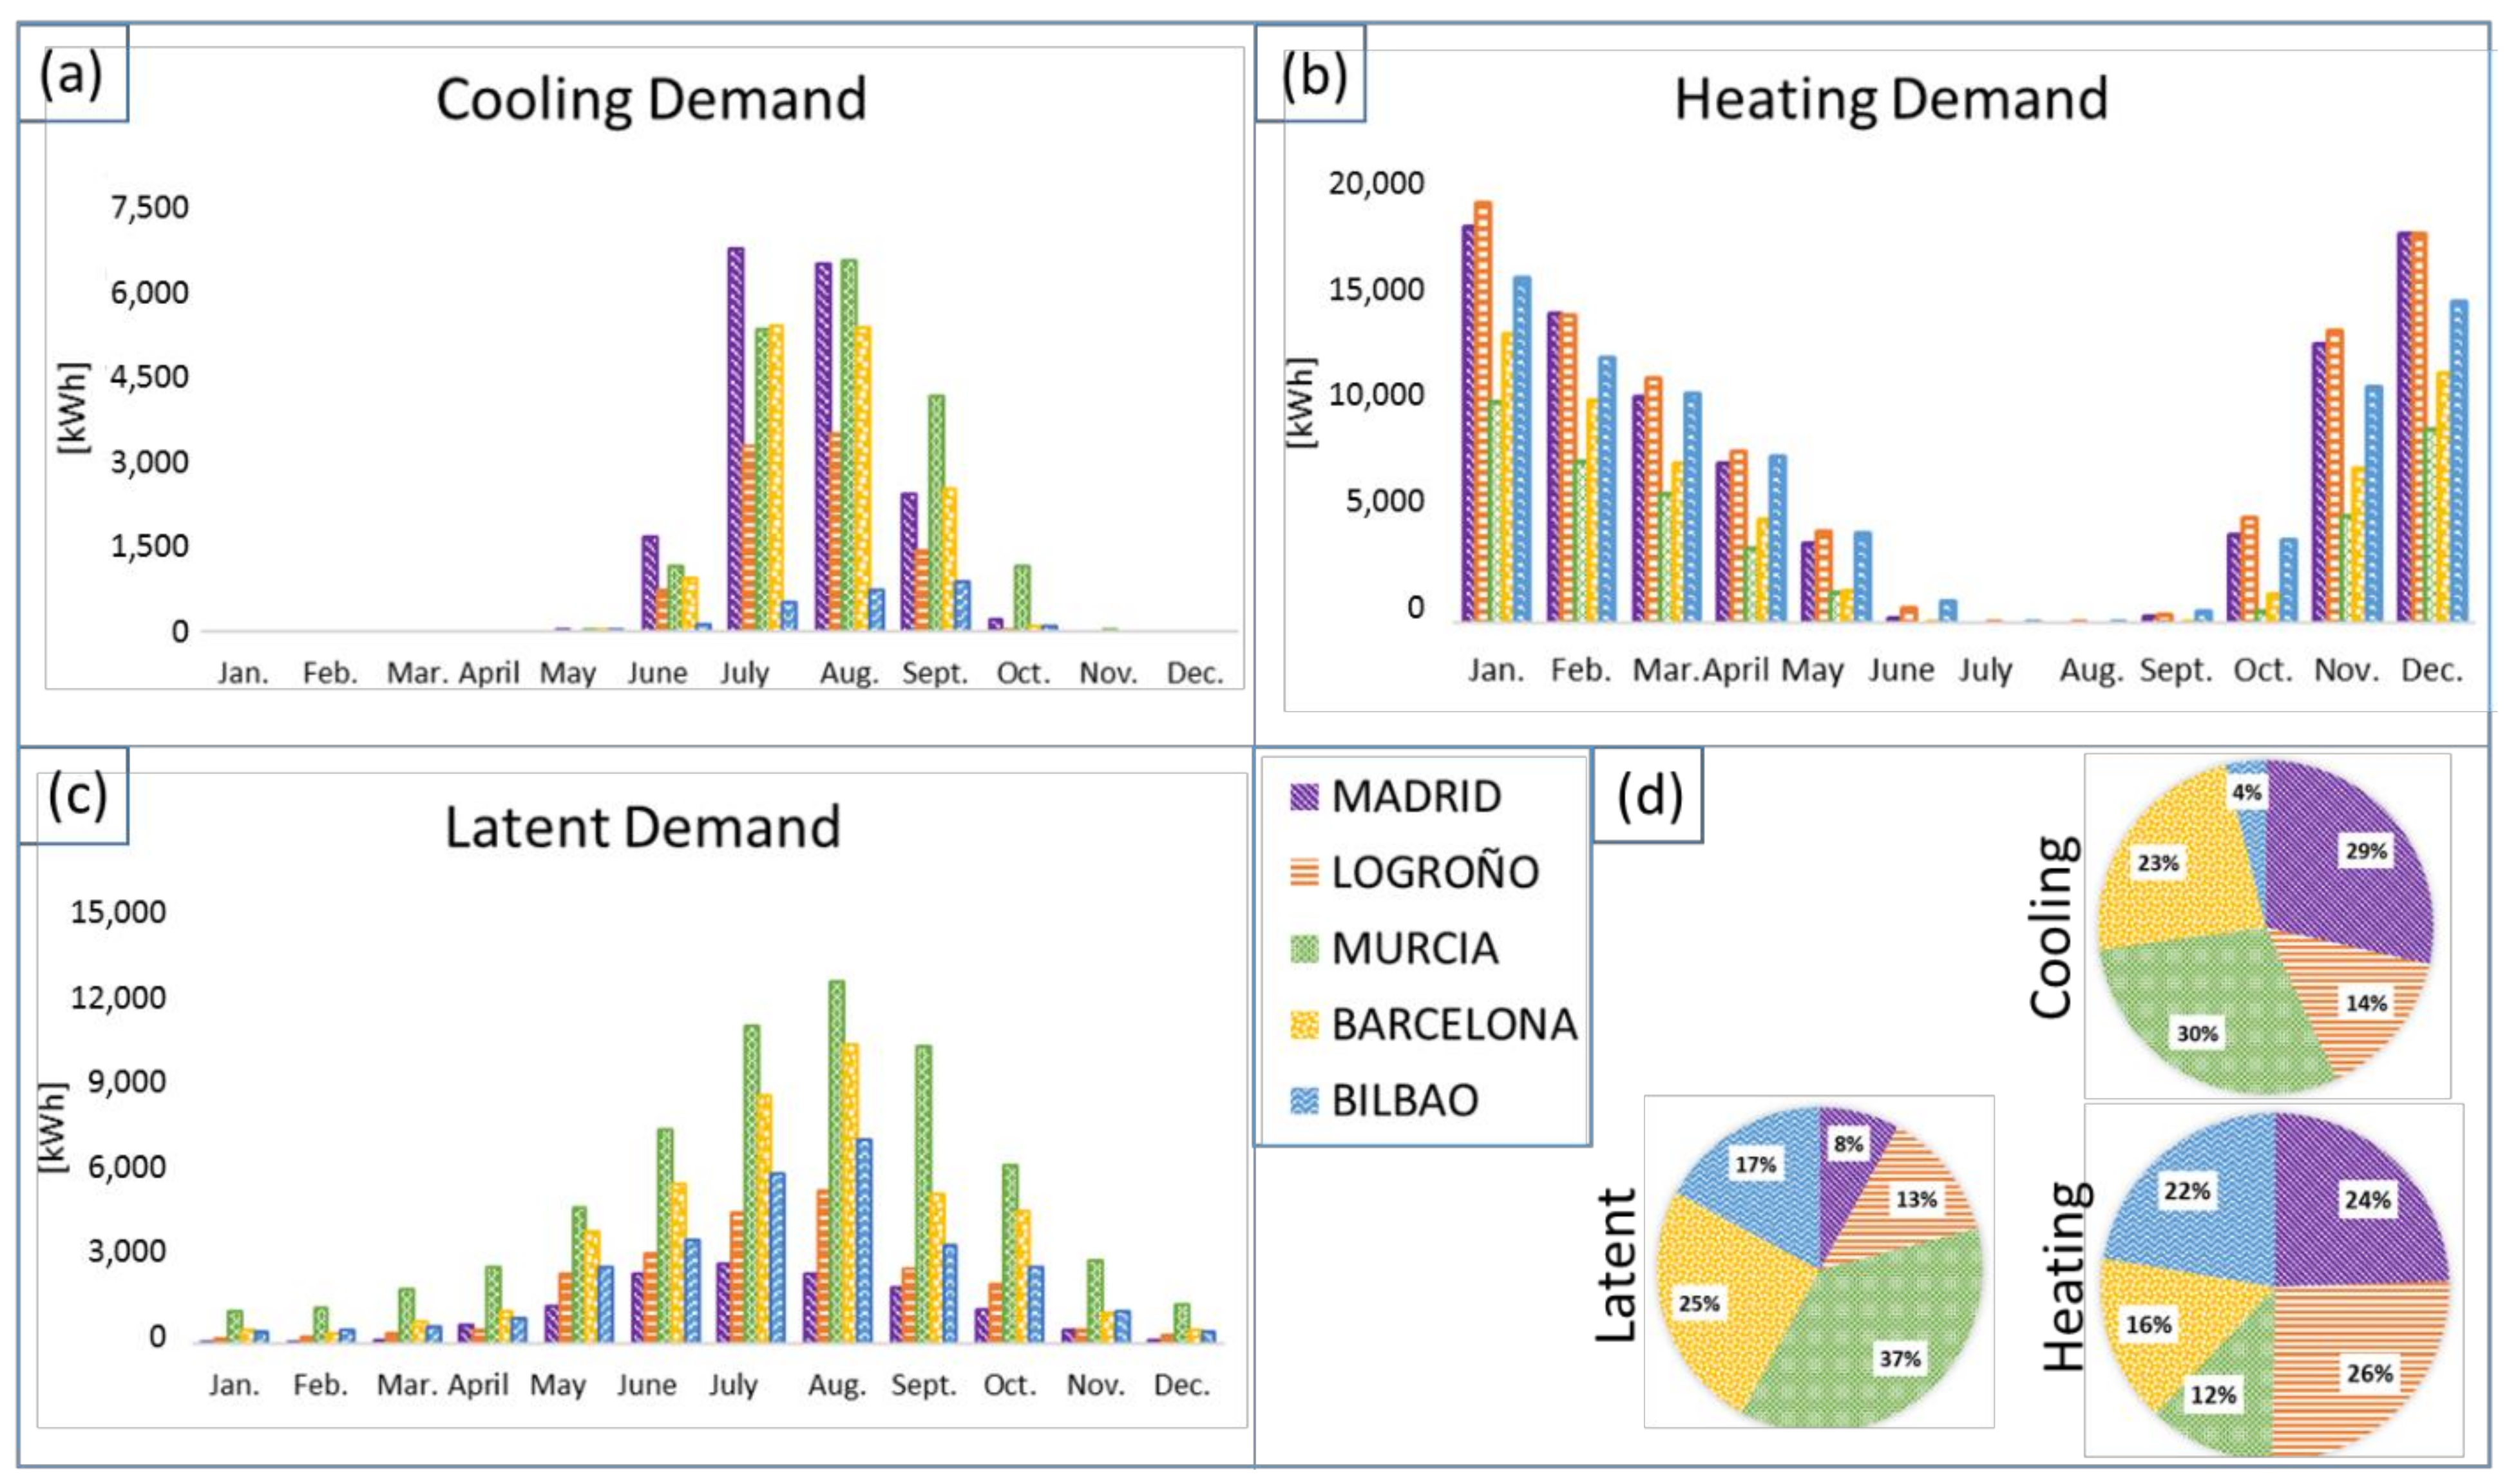
3.4. Numerical Results for Heating and Cooling Demands in Different Climates

The following subsections show the numerical results obtained and the corresponding analysis thereof.
A Weather Data Processor introduces the weather data of the five locations displayed in Figure 1. Figure 12 depicts the average radiation, temperature and relative humidity of each city according to the typical meteorological year; here, only the operating-time data are shown, i.e., night or weekend values are not revealed.
Before defining the energy supply system, the building heating and cooling demands must be calculated. Figure 13 shows the sensible cooling, heating and latent demands to control the relative humidity range of the building in the five cities throughout the year and the relative consumption at all the locations. As can be seen in Figure 13, we can conclude the following:
  • Murcia has the highest cooling demand (30%, very close to Madrid’s demand) and Bilbao has almost no cooling demand compared to the rest of the cities (4%), see Figure 13a.
  • Logroño’s heating demand is the highest (26%) and Murcia’s (12%) the lowest, but still worth noting, see Figure 13b.
Murcia is the city with highest outdoor relative humidity (Figure 13c) and the latent demand required to maintain the indoor humidity inside the comfort range is also the highest (37%). Madrid is the driest place (and close to the comfort humidity conditions), so its latent demand is the smallest (8%), see Figure 13c.
In accordance with these results, the maximum heating and cooling power is calculated for each location (Table 2).

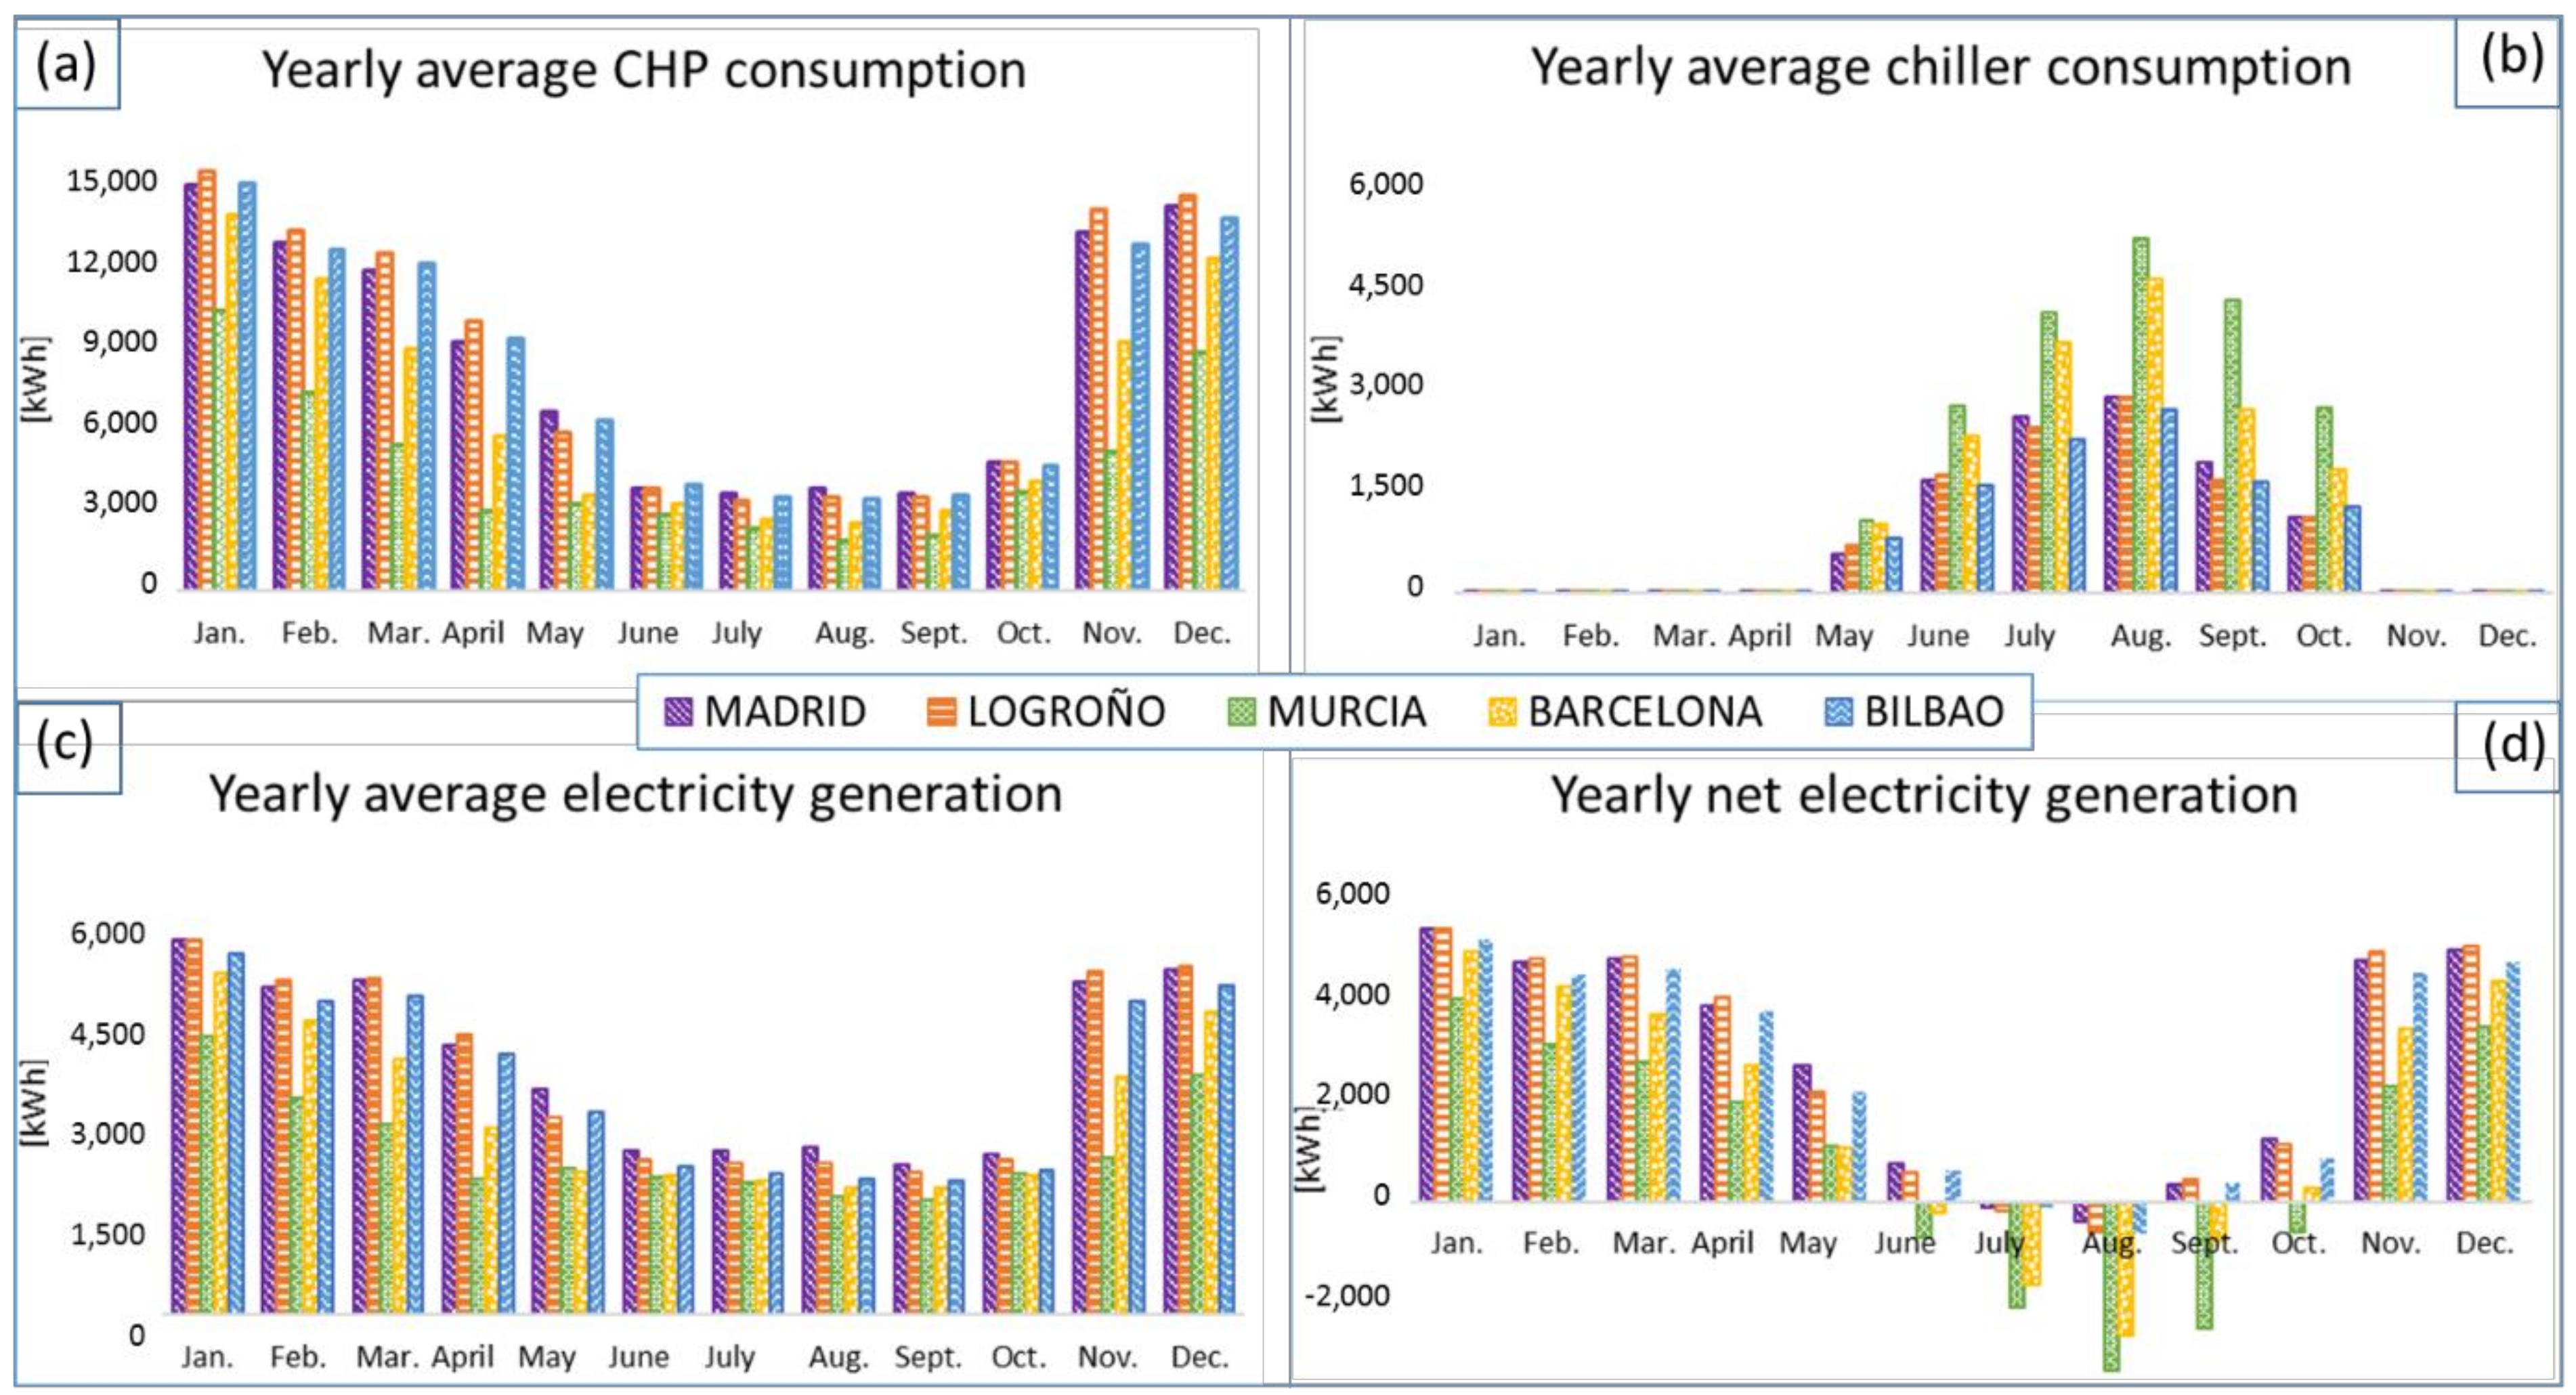
3.5. Numerical Results of Facility Operation Results

3.5.1. Energy Analysis Results

Figure 14 displays the energy consumption and electricity generation in the five cities throughout the year. The following comments can be made:
  • During the whole year, the CHP or the PV cells supply the electricity consumed by the chiller in Bilbao, whereas in the rest of the cities, electricity from the grid is needed in the warmest months. Therefore, the facility in Bilbao can be considered a complete polygeneration that consumes only natural gas in the CHP.
Since monthly values are not representative enough, and hourly (or even lower) values depict the energy use of the building in a more precise way, Figure 15 was included. This figure shows the indoor conditions of a representative winter week (starting 1 January) and a summer week (starting 1 August) in Madrid.
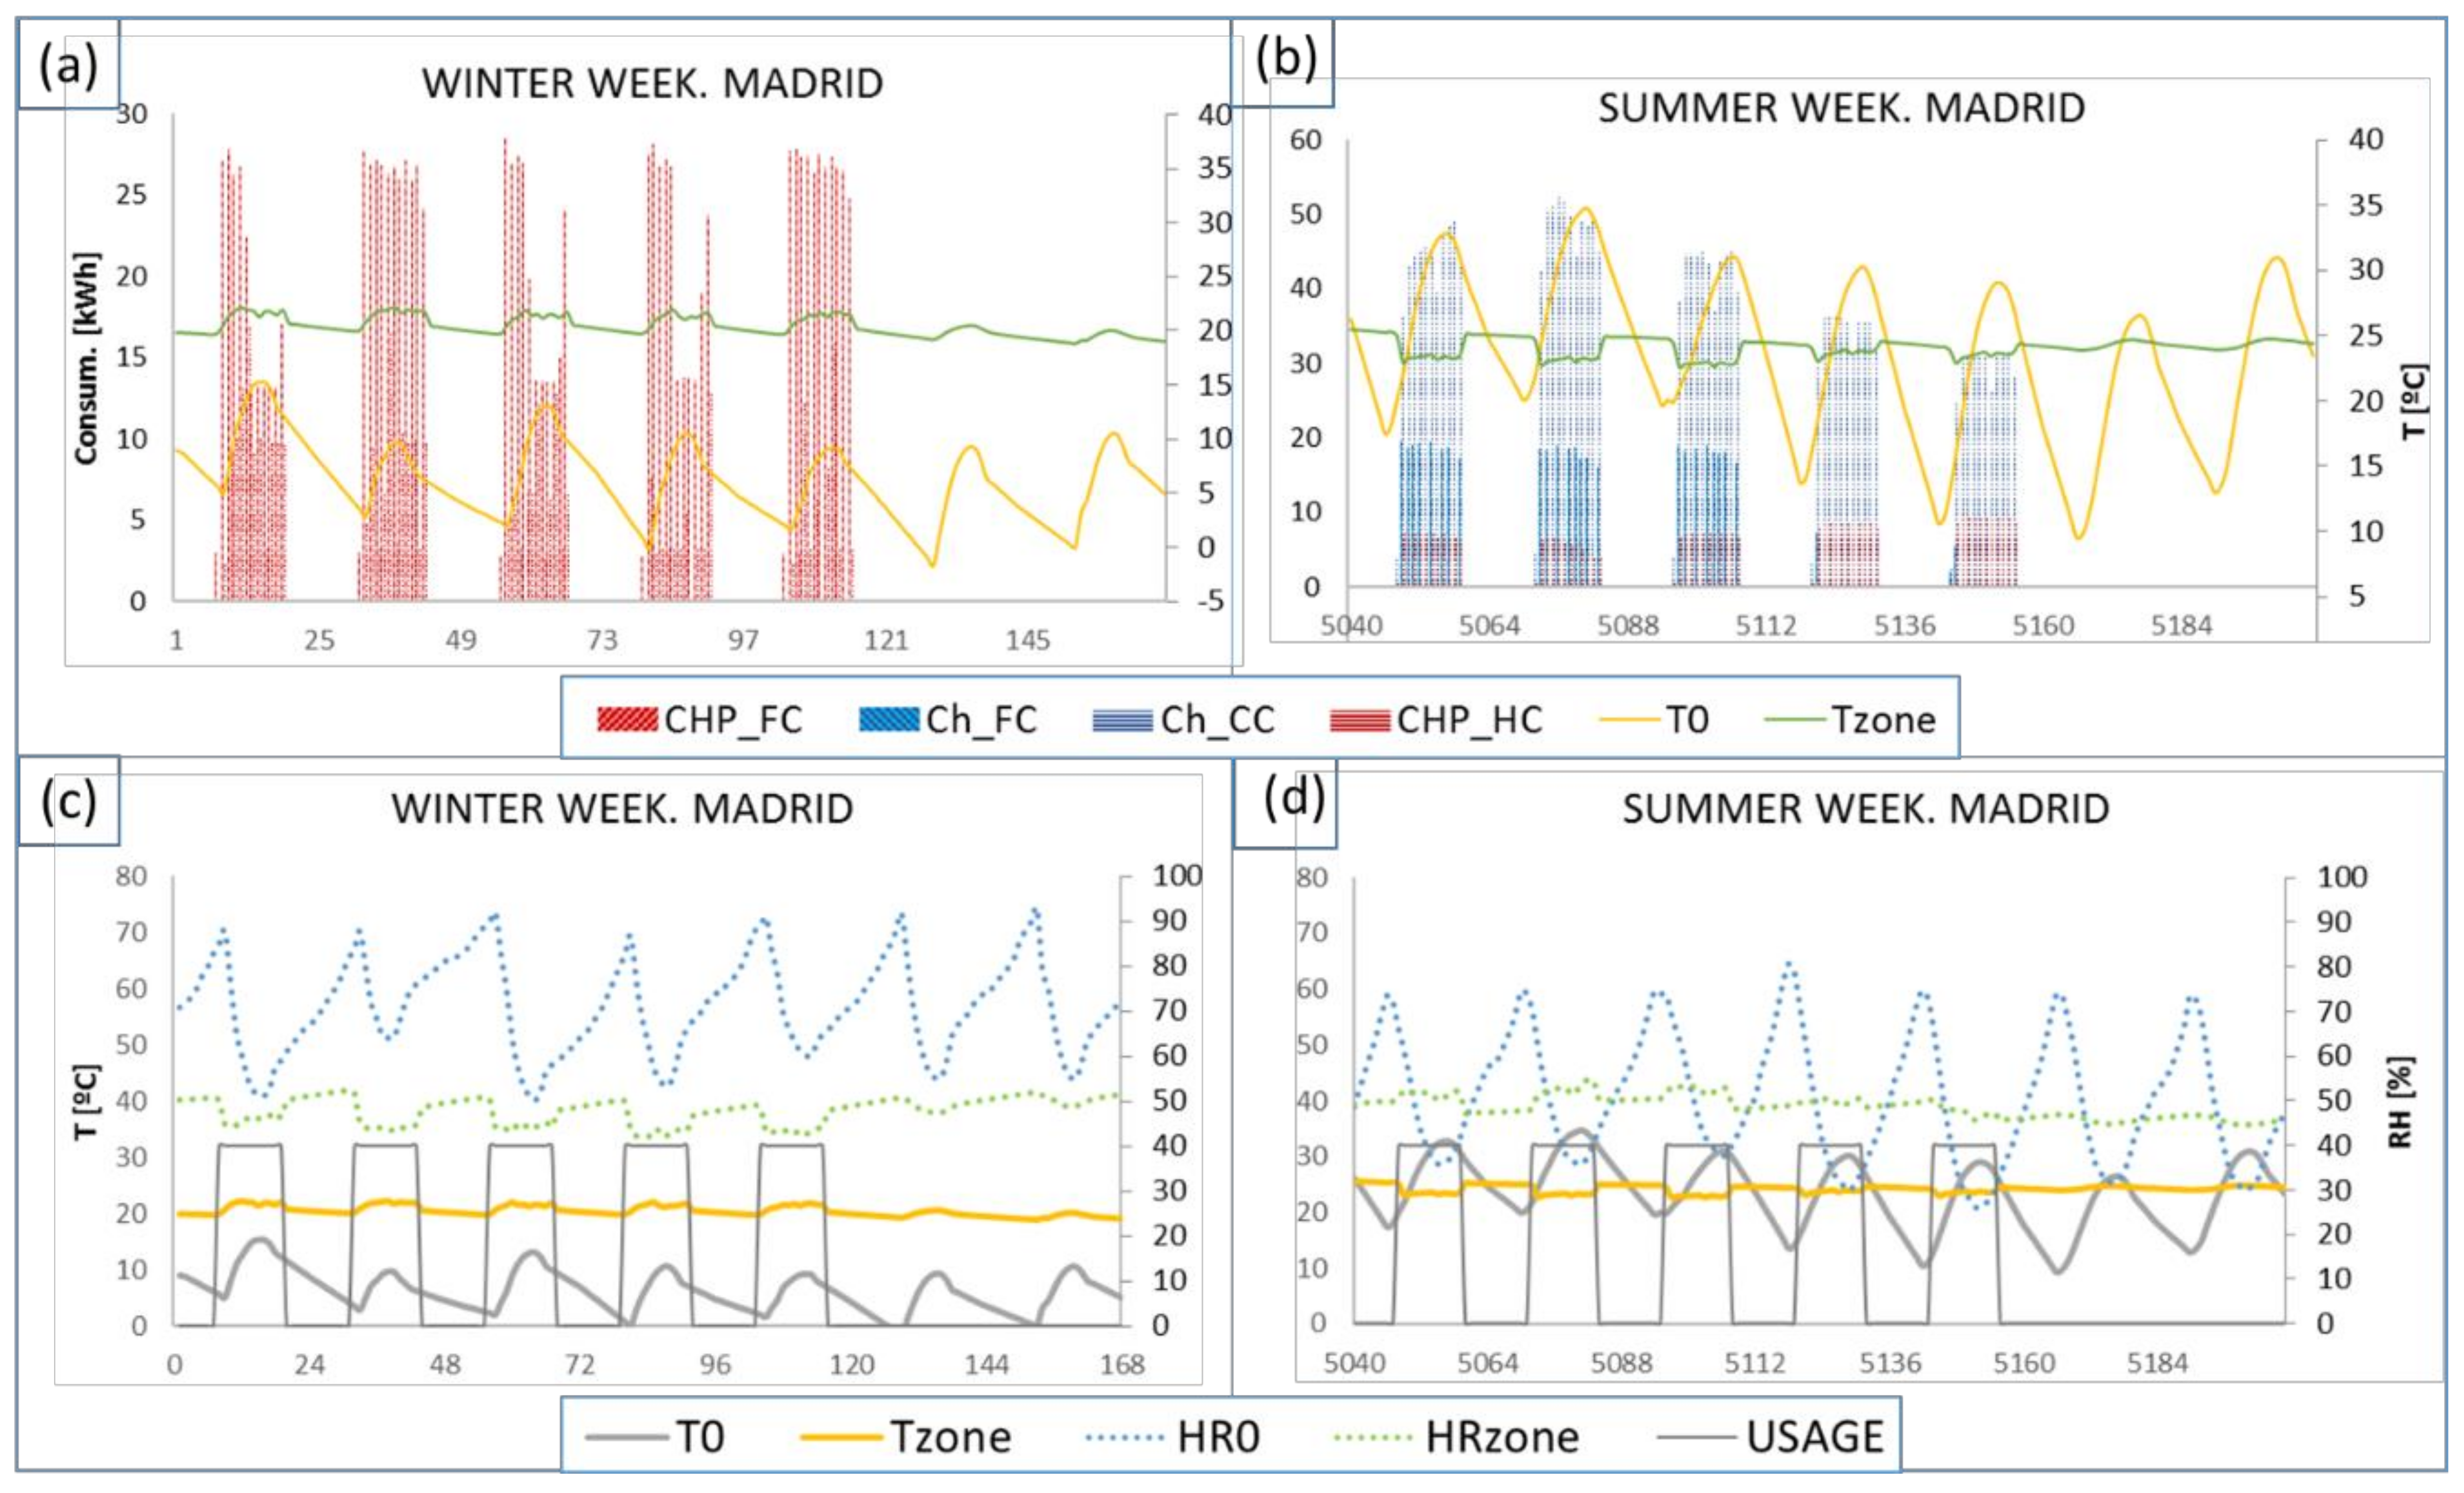
  • In winter, the chiller is turned off (Ch_FC and Ch_CC are null), part of the heating is provided by the fan coil supported by the CHP (CHP_FC) and the rest by the AHU heating coil (CHP_HC) in order to provide the appropriate RH indoor conditions. On weekends, the heating system is off (Figure 15a).
  • In winter, although the outside relative humidity RH0 is high and the temperature T0 is low, the indoor RH and T are maintained within the comfort range. The usage of the building is limited from Monday to Friday (Figure 15c).
  • In summer, the cooling demand is provided partly by the fan coil supported by the Ch (Ch_FC) and the rest by the cooling coil of the AHU (Ch_CC). The CHP is turned on in order to dehumidify the incoming outdoor air until the indoor comfort conditions are reached (Figure 15b,d).

3.5.2. Polygeneration Indicators

The yearly and monthly energy saving ( E S T O T ) and the equivalent electric fuel consumption ( F e q E , T O T ) of the total system in different locations are shown in the upper part of Figure 16, where R e f E η is taken as 44%, R e f H η = 90 % , R e f C C O P = 3 [17]. All the cities show a similar tendency:
  • E S T O T is positive in all the places over the whole year, so polygeneration creates savings related to the separate generation of heating, cooling and electricity (Figure 16a).
  • The equivalent electric fuel consumption in summer ( F e q E , T O T ) is lower since less electricity is cogenerated (because heating demand is lower) and cooling demand is high (Figure 16b).
Furthermore, the yearly and monthly exergy savings (ExS) and the equivalent electric exergy consumption ( B F e q E , T O T ) of the total system are shown in the lower part of Figure 16, where R e f E ε is taken as 44%, R e f H ε = 13 % .
Therefore, E x S T O T is lower than the energy saving since the fuel’s quality factor is 1.04, while the heating and cooling demand are low quality energy flows (with a very low-quality factor). However, the B F e q E , T O T is higher than the energy parameter since electricity is 100% exergy.
The average values of the PES and EEE energy and exergy indicators for the total polygeneration are shown in Table 3. As can be seen, the PES is always positive and electricity is generated with a higher equivalent electric efficiency, in either energy or exergy values (higher than 44%).

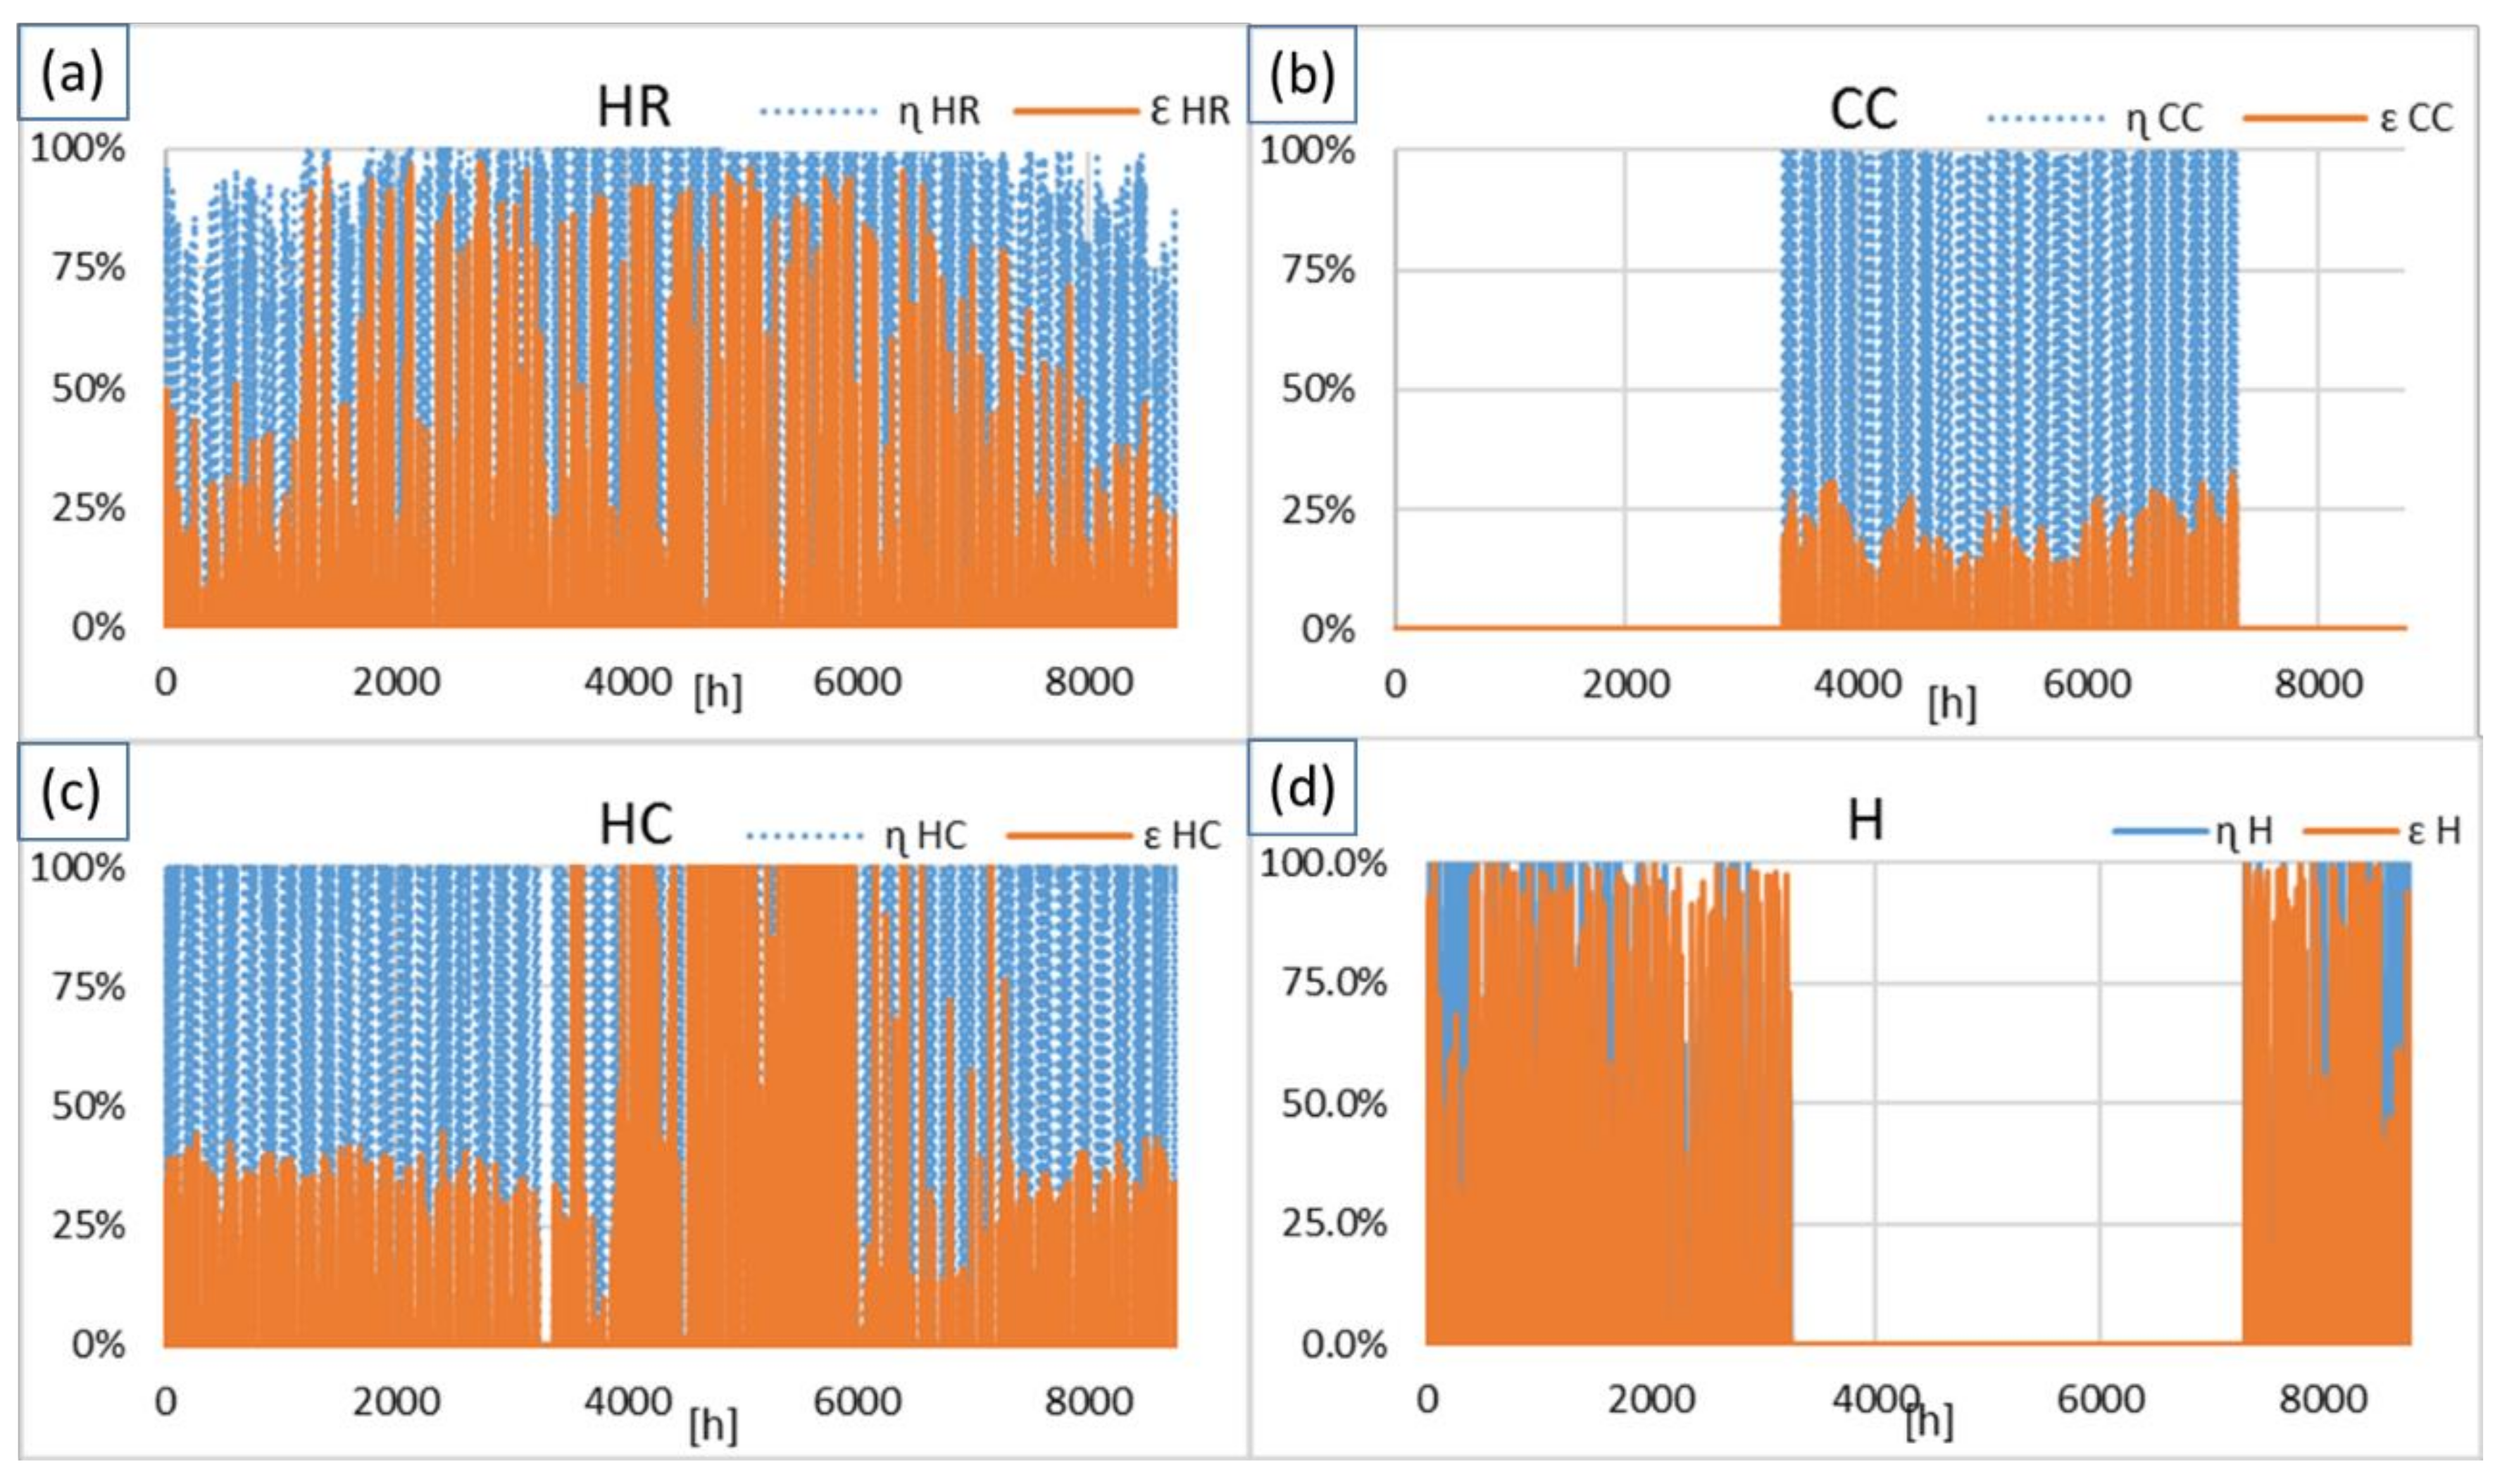
3.5.3. Energy and Exergy Analysis of IAQ Components

Figure 17 shows the energy and exergy efficiency of the AHU components (heat recovery (HR), cooling coil (CC), heating coil (HC) and humidifier (H)), during the year in Madrid.
  • HR energy efficiency is close to the ideal value, with a yearly average efficiency of 90%, while the exergetic efficiency is much lower, with a yearly average value of 25%, due to the exergy destruction because of the mixing of flows at different temperature levels (Figure 17a).
  • CC only works in summer. Its average energy efficiency is 95%, while the exergy efficiency is 15%. There is a high exergy destruction in the process since the exergy of the airflow (sum of the physical and chemical components) barely changes in comparison with the decrease in exergy of the refrigerant water (Figure 17b).
  • HC preheats the air during the winter but bypasses it in summer. Therefore, the average energy efficiency is 89% during the winter and its average exergy efficiency is 23% (Figure 17c).
  • H is only switched on in winter with an average energy efficiency of 90% and an average exergy efficiency of 57% (Figure 17d).
The average global energy efficiency of the AHU is η A H U = 35 % and average global exergy efficiency is ε A H U = 28 % .

4. Discussion

Polygeneration systems need to be compared to separate generation systems in order to analyze the energy savings achieved. With the aim of quantifying those energy savings, polygeneration indicators can be calculated in energy and exergy terms, despite the fact that in most cases only the energy point of view is accounted for in the analysis. The main motivation for applying techniques based on the First and Second Laws of thermodynamics (through the exergy parameter) in thermal systems is based on the ambiguity or lack of precision that can arise when analyzing the systems exclusively from the point of view of the First Law.
On the one side, positive P E S T O T and P E x S T O T means that polygeneration creates savings related to the separate generation of heating, cooling and electricity. On the other side, positive E E E T O T and E E x E T O T show the adequacy of the local electricity production when compared with the electricity imported from the grid. As expected, the exergetic indicators take much lower values than the energetic ones. These exergy indicators remind us of the appropriateness of using waste heat to provide low-quality energy demands and high-quality energy resources for electricity generation.
New future research directions arise from these facts to develop methodologies based on exergy, such as thermoeconomics [21]. The purpose of this methodology is to carry out a rational distribution of costs based on the irreversibilities (exergy destructions in the processes). These costs are calculated based on the unit exergy costs at each piece of equipment, as well as on the basis of the structural interactions in the system.

5. Conclusions

A polygeneration facility, based on a chiller, a CHP and PV panels, that provides the thermal energy demands and the IAQ requirements, was analyzed. According to the energy performance analysis results, the installation working in Bilbao is a fully polygeneration system, in the sense that cogenerated electricity and electricity from the PV panels is enough to supply the chiller demand during the whole year. The net yearly electricity generation is 29.8 MWh, which corresponds to the sum of the yearly cogenerated electricity and the PV electric production minus the yearly electricity consumption in the chiller. For the other cities, electricity needs to be imported from the grid in summer. Nevertheless, in all the cities the PES index is always positive, and electricity is generated with a higher equivalent electrical efficiency in either energy or exergy values (higher than 44%).
In addition, an in-depth analysis was conducted for the AHU components. The study shows the behavior of HR, CC, HC and H over the entire year and the average efficiency values from both an energy and exergy point of view. All the components show a much lower exergy efficiency compared to the energy efficiency, because exergy considers the real losses (quantified by the exergy destruction), and it penalizes the mixing between flows at different levels of temperature and humidity. As a whole, the AHU average global energy efficiency is η A H U = 35 % while the average global exergy efficiency is ε A H U = 28 % .

Author Contributions

Conceptualization, A.P.-P. and J.M.S.-L.; methodology, A.P.-P. and J.M.S.-L.; software, A.P.-P.; validation, A.P.-P. and J.M.S.-L.; formal analysis, A.P.-P. and J.M.S.-L.; investigation, A.P.-P. and J.M.S.-L.; resources, A.P.-P. and J.M.S.-L.; data curation, A.P.-P.; writing—original draft preparation, A.P.-P.; writing—review and editing, J.M.S.-L.; visualization, A.P.-P. and J.M.S.-L.; supervision, J.M.S.-L. All authors have read and agreed to the published version of the manuscript.

Funding

This research received no external funding.

Acknowledgments

The authors acknowledge the support provided by the Laboratory for the Quality Control in Buildings of the Basque Government.

Conflicts of Interest

The authors declare no conflict of interest.

Abbreviations

Mathematic Nomenclature
b physical exergy of incompressible fluids
b f u e l chemical exergy of fuels
b h a physical-specific exergy of humid air
b h a q chemical-specific exergy of humid air
c p specific heat at constant pressure
D ˙ exergy destruction rate
ε exergy efficiency
η energy efficiency
hspecific enthalpy
m ˙ mass flow rate
Q ˙ heat exchange
R e f X η reference efficiency of local X fuel type generation
Ttemperature
T S effective temperature of the sun
ω absolute humidity
wwork
Subindexes
0reference environment
aair
CHPcombined heat and power
condcondensate
Eelectricity
netnet electricity production
sepseparate generation
TOTtotal
vvapor
wwater
Acronym
IAQindoor air quality
AHUair-handling units
Ccooling
CCcooling coil
CCHPcombined cooling, heating and power
Chchiller
CHPcombined heat and power
COPcoefficient of performance
CTESpanish Technical Building Code
DHWdomestic hot water
Eelectricity
EEEequivalent electrical efficiency
EExEequivalent electrical exergy efficiency
ESenergy savings
Fresource consumption
FCFan coils
Gincident irradiation
Hheating
Hhumidifier
HCheating coil
HRheat recovery
IDA2air quality 2nd classification
LHVlower heating value
PESpercentage of energy savings
PExSpercentage of exergy savings
PVphotovoltaic panels
QFquality factor of the fuel
REreference environment
TRNSYSTransient System Simulation Tool

References

  1. Buckley, N.; Mills, G.; Reinhart, C.; Berzolla, Z.M. Using Urban Building Energy modelling (UBEM) to support the new European Union’s Green Deal: Case study of Dublin Ireland. Energy Build. 2021, 247, 111115. [Google Scholar] [CrossRef]
  2. Economidou, M.; Todeschi, V.; Bertoldi, P.; Agostino, D.D.; Zangheri, P.; Castellazzi, L. Review of 50 years of EU energy efficiency policies for buildings. Energy Build. 2020, 225, 110322. [Google Scholar] [CrossRef]
  3. Hani, M.R.; Mahidin, M.; Erdiwansyah, E.; Husin, H.; Khairil, K.; Hamdani, H. An overview of polygeneration as a sustainable energy solution in the future. J. Adv. Res. Fluid Mech. Therm. Sci. 2020, 74, 85–119. [Google Scholar] [CrossRef]
  4. Pinto, E.S.; Serra, L.M.; Lázaro, A. Economic and environmental assessment of renewable energy and energy storage integration in standalone polygeneration systems for residential buildings. In Proceedings of the International Conference on Solar Heating and Cooling for Buildings and Industry 2019, Santiago, Chile, 4–7 November 2019. [Google Scholar]
  5. Pina, E.A.; Lozano, M.A.; Serra, L.M. Assessing the influence of legal constraints on the integration of renewable energy technologies in polygeneration systems for buildings. Renew. Sustain. Energy Rev. 2021, 149, 111382. [Google Scholar] [CrossRef]
  6. Prada, M.; Prada, I.F.; Cristea, M.; Popescu, D.E.; Bungău, C.; Aleya, L.; Bungău, C.C. New solutions to reduce greenhouse gas emissions through energy efficiency of buildings of special importance–Hospitals. Sci. Total Environ. 2020, 718, 137446. [Google Scholar] [CrossRef] [PubMed]
  7. FENERCOM; Community of Madrid; Ministry of Economy, Employment and Finance. Guide to Saving and Energy Efficiency in Offices and Offices; Mares Ideas Publicitarias S.L: Madrid, Spain, 2017. [Google Scholar]
  8. Sala-Lizarraga, J.M.; Picallo-Perez, A. Exergy Analysis and Thermoeconomics of Buildings: Design and Analysis for Sustainable Energy Systems; Butterworth-Heinemann: Oxford, UK, 2019. [Google Scholar]
  9. Picallo-Perez, A.; Sala-Lizarraga, J.M.; Odriozola-Maritorena, M.; Hidalgo-Betanzos, J.M.; Gomez-Arriaran, I. Ventilation of buildings with heat recovery systems: Thorough energy and exergy analysis for indoor thermal wellness. J. Build. Eng. 2021, 39, 102255. [Google Scholar] [CrossRef]
  10. Government of Spain, CSIC for the General Directorate of Urban Agenda and Architecture of the Ministry of Transport, Mobility and Urban Agenda. Technical Building Code. Available online: https://www.codigotecnico.org/DocumentosCTE/parte1.html (accessed on 8 November 2021).
  11. Picallo-Perez, A.; Lazzaretto, A.; Sala, J.M. Overview and implementation of dynamic thermoeconomic & diagnosis analyses in HVAC&R systems. J. Build. Eng. 2020, 32, 101429. [Google Scholar]
  12. Calama-González, C.M.; León-Rodríguez, Á.L.; Suárez, R. Indoor air quality assessment: Comparison of ventilation scenarios for retrofitting classrooms in a hot climate. Energies 2019, 12, 4607. [Google Scholar] [CrossRef] [Green Version]
  13. IDAE (Institute for Energy Diversification and Saving. Government of Spain). Thermal Comfort in an Air-Conditioned Space; 2019. Available online: https://www.idae.es/articulos/bienestar-termico-en-un-espacio-climatizado (accessed on 8 November 2021).
  14. Beckman, W.A.; Broman, L.; Fiksel, A.; Klein, S.A.; Lindberg, E.; Schuler, M.; Thornton, J. TRNSYS The most complete solar energy system modeling and simulation software. Renew. Energy 1994, 5, 486–488. [Google Scholar] [CrossRef]
  15. Remund, J.; Kunz, S. Meteonorm Version 5. METEOTEST. 2003. Available online: www.meteotest.com (accessed on 8 November 2021).
  16. Zhao, X.; Wang, C.; Li, F.; Liang, J.; Zhou, Y.; Xiao, W. Research on energy saving evaluation index of combined heat and power generation system. In Proceedings of the 10th International Conference on Measuring Technology and Mechatronics Automation (ICMTMA), Changsha, China, 10–11 February 2018; IEEE: Piscataway, NJ, USA, 2018; pp. 159–162. [Google Scholar]
  17. IDAE (Institute for Energy Diversification and Saving. Government of Spain). Technical Guide for the Measurement and Determination of Useful Heat, Electricity and Primary Energy Savings of High-Efficiency Cogeneration; IDEA: Madrid, Spain, 2008.
  18. DIRECTIVE 2004/8/EC of the European Parlament and of the Council of 11 February 2004 on the Promotion of Cogeneration Based on a Useful Heat Demand in the Internal Energy Market and Amending Directive 92/42/EEC; BOE: Madrid, Spain, 2004; Available online: https://eur-lex.europa.eu/legal-content/EN/TXT/PDF/?uri=CELEX:32004L0008&from=DE (accessed on 1 November 2021).
  19. Ministry of Industry, Energy and Tourism. Royal Decree 413/2014, of June 6, which Regulates the Activity of Electricity Production from Renewable Energy Sources, Cogeneration and Waste; BOE: Madrid, Spain, 2014.
  20. Picallo-Perez, A.; Catrini, P.; Piacentino, A.; Sala, J.M. A novel thermoeconomic analysis under dynamic operating conditions for space heating and cooling systems. Energy 2019, 180, 819–837. [Google Scholar] [CrossRef]
  21. Picallo-Perez, A.; Sala, J.M.; Hernández, A. Application of thermoeconomics in HVAC systems. Appl. Sci. 2020, 10, 4163. [Google Scholar] [CrossRef]
Figure 1. Geographic location of the office buildings in Spain.
Energies 14 07636 g001
Figure 2. Schematic diagram for building’s energy demand.
Energies 14 07636 g002
Figure 3. Energy generation facility scheme.
Energies 14 07636 g003
Figure 4. Comparison between combined generation and separate reference generation in (a) cogeneration and (b) total system.
Energies 14 07636 g004
Figure 5. Scheme of a typical AHU and its components.
Energies 14 07636 g005
Figure 6. (a) Adiabatic mixture and (b) psychometric diagram of the process.
Energies 14 07636 g006
Figure 7. (a) Sensible air heating and (b) psychometric diagram of the process.
Energies 14 07636 g007
Figure 8. (a) Dehumidification by cooling and (b) psychometric diagram of the process.
Energies 14 07636 g008
Figure 9. (a) Humidification and cooling and (b) psychometric diagram of the process.
Energies 14 07636 g009
Figure 10. Scheme of the total facility.
Energies 14 07636 g010
Figure 11. Flow numbering for energy and exergy analysis of the AHU.
Energies 14 07636 g011
Figure 12. Average (a) radiation (b) temperature and (c) relative humidity of the 5 cities.
Energies 14 07636 g012
Figure 13. Monthly (a) cooling, (b) heating and (c) latent demand of the office and (d) relative demands in the 5 cities.
Energies 14 07636 g013
Figure 14. Yearly (a,b) energy consumption and (c,d) electricity generation in the 5 cities.
Energies 14 07636 g014
Figure 15. Indoor conditions of a representative (a,c) winter week (1st of January) and (b,d) summer week (1st of August) in Madrid.
Energies 14 07636 g015
Figure 16. Yearly (a,c) total energy/exergy savings and (b,d) monthly total equivalent electric fuel/exergy consumption.
Energies 14 07636 g016
Figure 17. Energy and exergy efficiency of AHU components in Madrid (a) HR (b) CC (c) HC (d) H.
Energies 14 07636 g017
Table 1. Climatic extreme conditions and average conditions of 5 cities in Spain.
LOCATIONTmax
[°C]
Tmin
[°C]
RHmax
[%]
RHmin
[%]
Madrid36.79−5.8710026.05
Logroño37.20−4.5710033.00
Murcia31.99−0.6710051.00
Barcelona31.290.4310039.05
Bilbao33.70−2.7710036.00
T avg Winter
[°C]
T avg Summer
[°C]
RH avg Winter
[%]
RH avg Summer
[%]
Madrid8.3620.3572.3259.16
Logroño8.4818.9675.8467.97
Murcia12.6621.7481.0579.13
Barcelona11.9621.2771.9673.46
Bilbao10.3118.5474.4273.15
Table 2. Maximum heating and cooling power.
LOCATIONMax Heat Pow. [kW]Max Cool Pow. [kW]
Madrid134109
Logroño141118
Murcia97121
Barcelona111102
Bilbao128104
Table 3. Energy and exergy polygeneration indicators.
LOCATION P E S T O T E E E T O T P E x S T O T E E x E T O T
Madrid33%1.4516%0.70
Logroño31%1.3815%0.69
Murcia22%1.246%0.67
Barcelona24%1.226%0.63
Bilbao30%1.3212%0.66
Publisher’s Note: MDPI stays neutral with regard to jurisdictional claims in published maps and institutional affiliations.

