Abstract
To achieve carbon neutrality by 2050, Korea has been expanding its investment in renewal energy distribution and technology development. However, with this rapid expansion of renewable energy, public concern about it has grown. This study developed and used a big data analysis-based procedure to analyze the questions registered on Naver, the largest portal site in Korea, from 2008 to 2020 to identify public concern over renewable energy. The big data analysis-based procedure consisted of two steps. The first was a frequency analysis to identify the most frequently registered words. The second was to classify questions using term frequency-inverse document frequency (TF-IDF) weight and cosine similarity based on word2vec. The analysis revealed the most frequently registered words related to renewable energy, such as “solar power,” “power generation,” “energy,” and “wind power.” It also revealed the most frequently registered questions, such as those related to solar panel installation, renewable energy generation methods, and certificates. To continue expanding renewable energy, it is becoming increasingly important to understand the public’s concerns and create a method to resolve their objections to renewable energy. It is expected that the procedure in this study may provide relevant insight for the method.
Highlights
- We developed a big data analysis-based procedure to identify public concerns.
- We applied the procedure to identify public concerns about renewable energy in Korea.
- We analyzed a total of 18,321 questions about renewable energy posted on a website.
- The analyses showed that the public was most interested in solar-related matters.
1. Introduction
According to the International Energy Agency (IEA), renewable energy is useful energy collected from renewable resources, which are naturally replenished, such as solar, wind, ocean, hydropower, and geothermal resources [1]. As such, the process of obtaining energy from nature has been in the spotlight in situations where significant environmental pollution is expected.
Recently, the Republic of Korea (ROK) adopted a new energy policy to promote the use of renewable energy to generate electricity. For this reason, the ROK government has been increasing its investment in the development of power generation technologies using renewable energy and focusing on the spreading of renewable energy facilities.
As the renewable energy promotion policy is implemented, public concern over renewable energy has naturally grown. There has been much research to understand the public perception of renewable energy from various perspectives. Hagen et al. conducted a survey using Internet panels randomly selected from Canada, the United States, and Mexico to identify the public’s perception of renewable energy due to climate change [2]. Ntanos et al. conducted a survey to understand the Greek people’s perception of renewable energy sources, and they performed a one-way analysis of variance and binary logit regression to evaluate the Greek people’s willingness to pay for the expansion of renewable energy sources [3]. Rogers et al. had semi-structured interviews with residents in a rural area in the UK to determine whether they would like to participate in a renewable energy project [4]. Stoutenborough et al. surveyed the US adults using a structured questionnaire to identify their perception of various energy options for power generation [5]. Jung et al. surveyed the residents of Helsinki, Finland, to identify the factors influencing the public perception of renewable energy technology and evaluated the survey results through stochastic multicriteria acceptability analysis [6]. Kardooni et al. surveyed citizens over 20 years of age in the four regions of Peninsular Malaysia using stratified probability sampling to understand public opinion on climate change and renewable energy [7]. Anderson et al. analyzed the International Renewable Energy Association/IEA global renewable energy policy database containing the results of surveys conducted from 1974 to 2015 to understand the relationship between governmental renewable energy policies and changes in public opinion on renewable energy in European countries [8]. Ribeiro et al. suggested the public perception assessment methodology to predict the public perception of renewable energy technologies using a regression model, and demonstrated its usefulness for hydro, wind, biomass, and solar energies in Portugal [9]. Dehler-Holland et al. developed a structural topic model to perform sentiment analysis for the 6645 newspaper articles on German Renewable Energy Act [10].
With the recent development of Internet search engines, some studies have used big data analysis techniques to understand the public opinion by analyzing texts in online spaces such as social network services, Internet cafés, blogs, and Internet websites. Kim et al. proposed a word network model to analyze users’ Reddit posts to investigate the public perception of renewable energy resources [11]. Li et al. collected tweets on Twitter about fossil fuels and renewable energy, analyzed them using the Valence Aware Dictionary and sEntiment Reasoner tool to understand public perception, and compared the analysis results for the three different regions [12]. Kim et al. collected tweets about solar energy generation in the United States, conducted sentiment analysis using the robustly optimized bidirectional encoder representations from transformers pretraining approach sentiment classification model, and compared them with the states’ renewable energy policies [13]. Loureiro et al. collected tweets about climate change in the UK and Spain and used the National Research Center Canada Emotion Lexicon sentiment dictionary to evaluate public preferences regarding the various energy policies [14]. Jain et al. performed classification and sentiment analysis of the tweets containing the hashtag ‘#RenewableEnergy’. To classify the tweets, the five types of machine learning (K Nearest Neighbor, Support Vector Machine, Naïve Bayes, Adaboost, and Bagging) were applied, and the support vector machine was found to be with the highest accuracy [15].
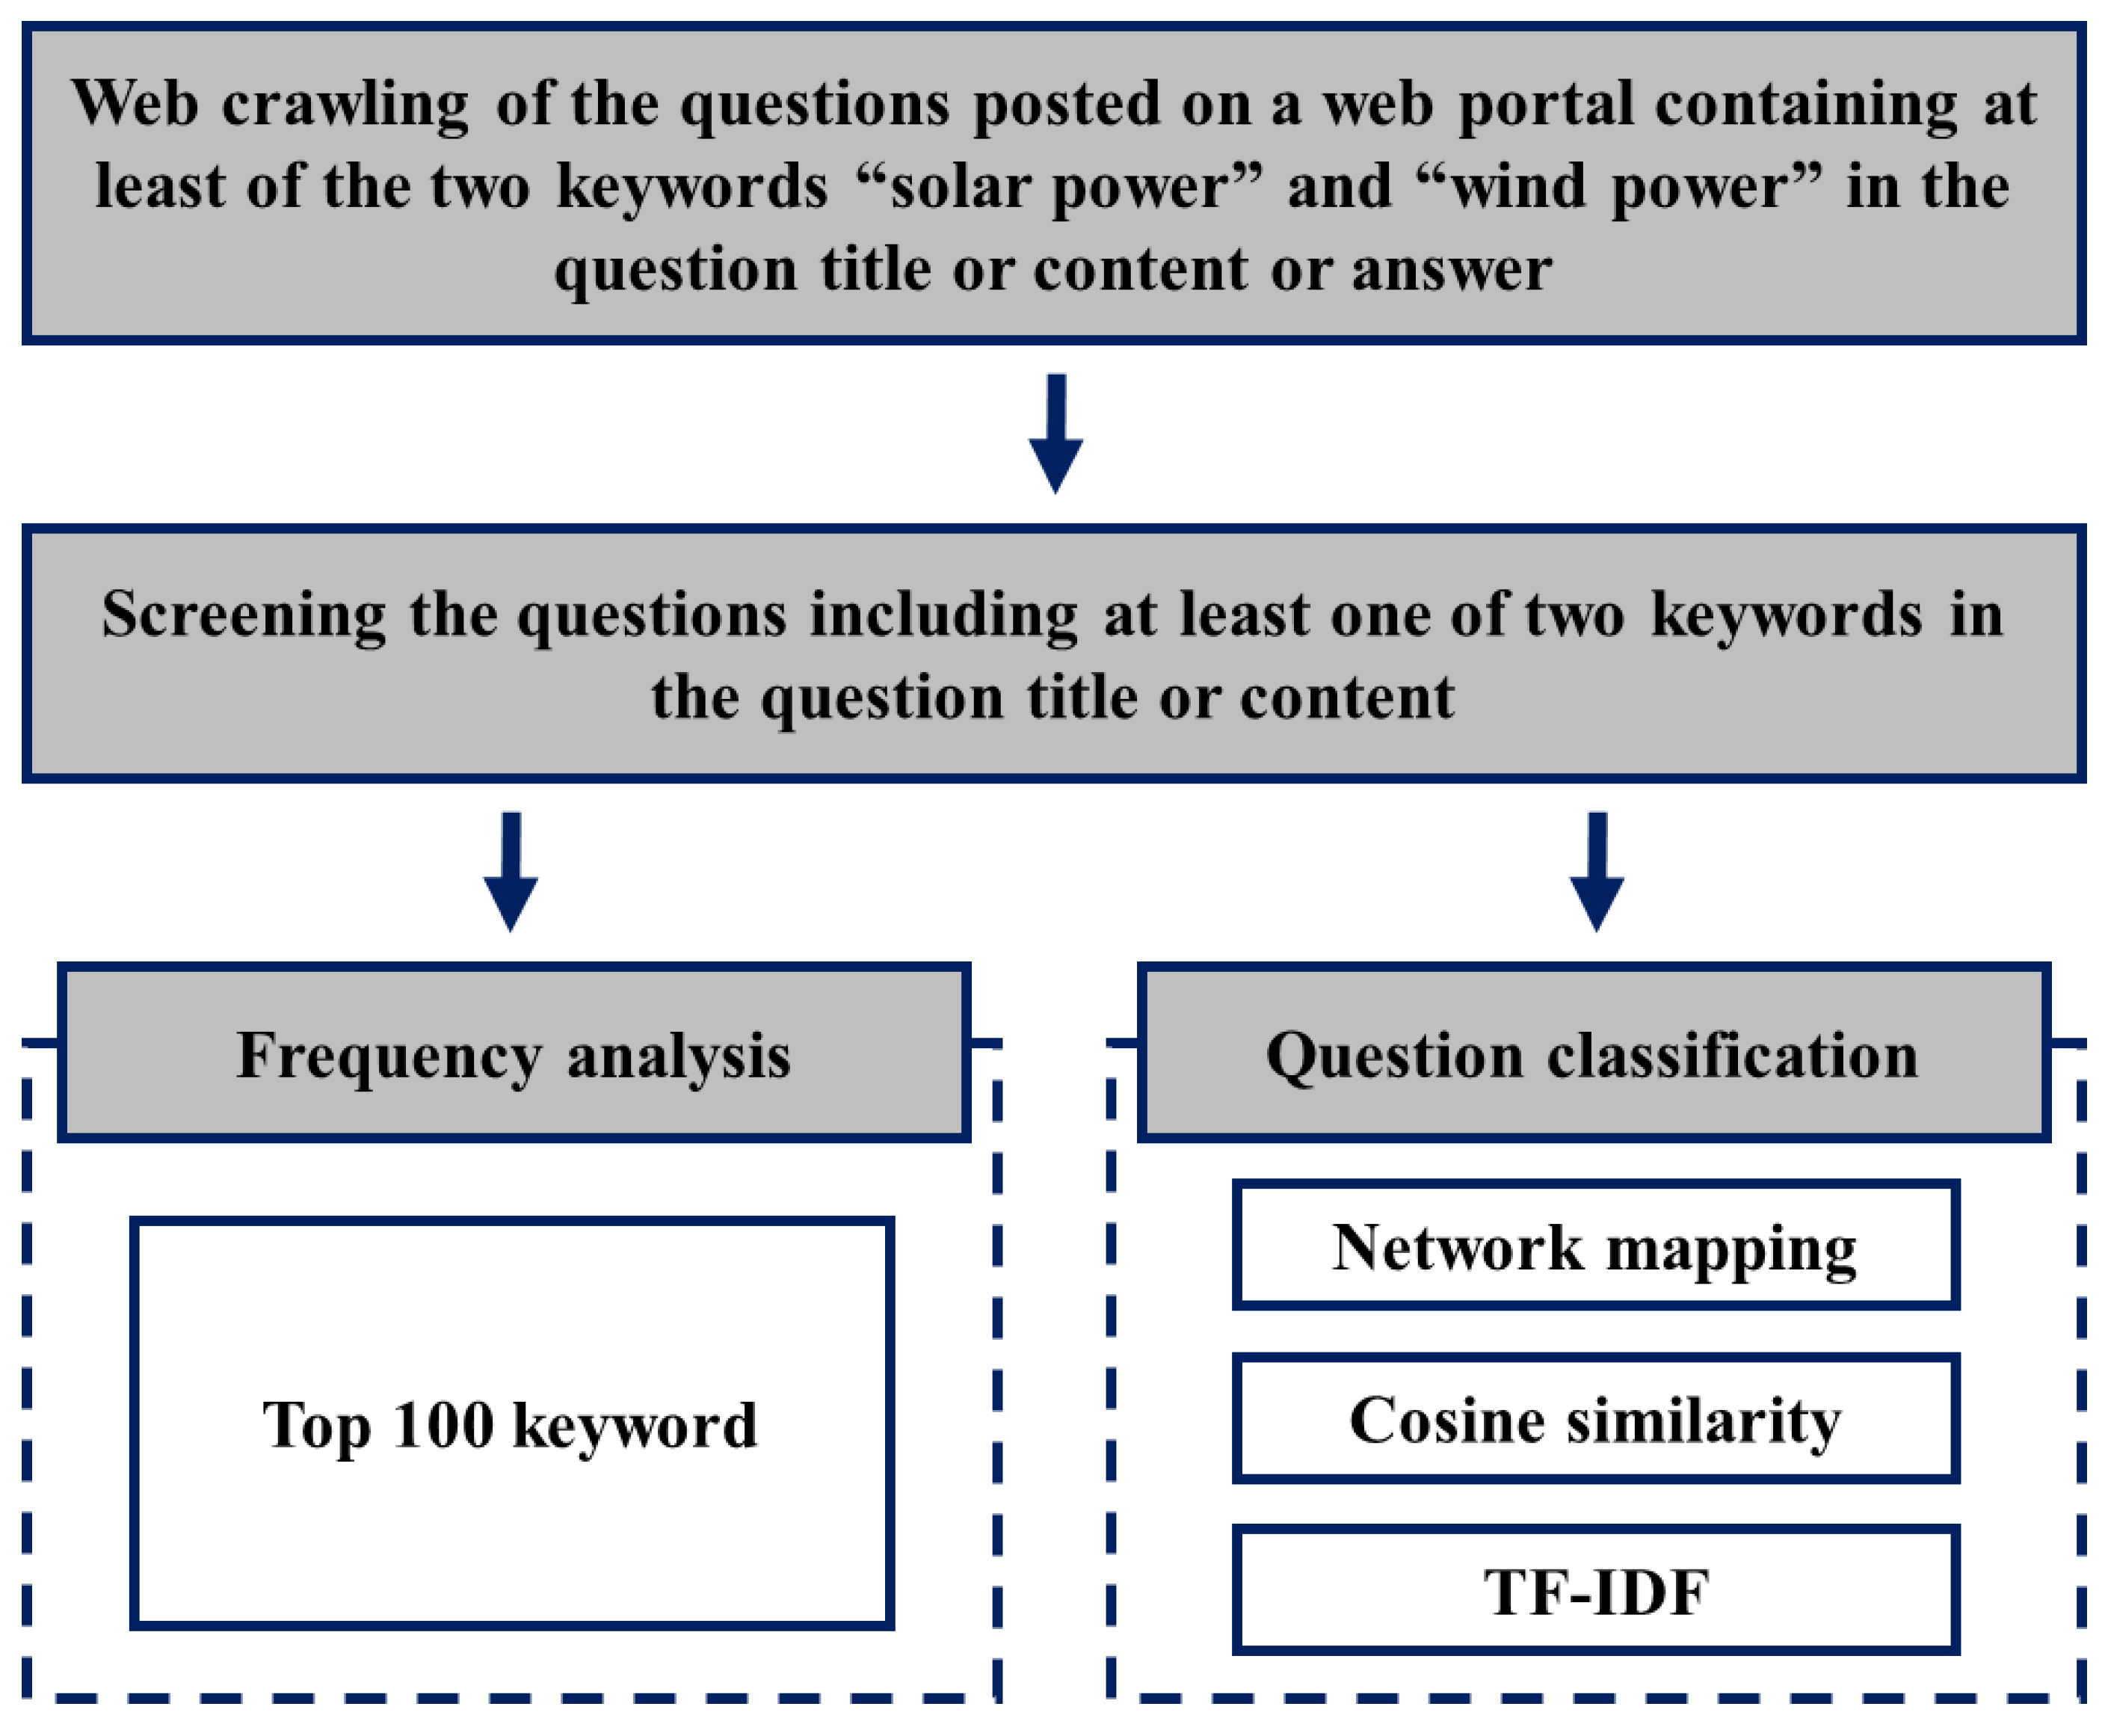
Many studies have analyzed public perception and acceptance of renewable energy expressed on various social networking services, but few studies have directly derived the public concerns. Therefore, in this study, a big data analysis-based procedure consisting of several statistical methods was developed to analyze the questions about renewable energy registered in the knowledge-sharing service Knowledge iN of Naver, one of the largest search engines in the ROK, to identify the public concerns about renewable energy. Our analysis period was from January 2008 to December 2020. Among the questions registered on the Knowledge iN service for this period, the questions containing the keywords “solar power” or “wind power” were crawled. Two types of analysis for the questions so extracted were performed in this study. First, a frequency analysis was done to identify the words most frequently mentioned in the questions. Second, the questions were grouped by topic using word network mapping, TF-IDF weights, and cosine similarity based on word2vec. Figure 1 shows the overall process of our analysis.
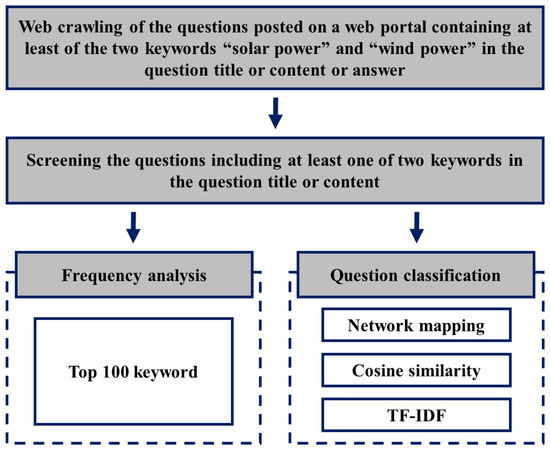
Figure 1.
Overview of the analysis procedure.
2. Materials and Methods
2.1. Web Scraping
The data for our analysis were the questions registered on Knowledge iN, a knowledge-sharing service of Naver, one of the largest search engines in the ROK. Knowledge iN allows any Naver user to register and answer any registered question. Knowledge iN was chosen for our analysis because the questions for a specific field show what the public is interested in or concerned about.
To analyze the Knowledge iN questions about renewable energy, all the questions registered from January 2008 to December 2020 were extracted using R, a big data analysis language. The keywords for the extraction were “solar power” and “wind power.” The extracted questions included at least one of the two keywords in the question title or content. The two keywords were chosen because “solar power” and “wind power” account for 85% or more of the total capacity in kW of renewable energy facilities in the ROK, and they can be seen as representing the total renewable energy in the ROK [16].
Among the extracted questions, there were questions that were not about “solar power” and “wind power” though they were crawled by using the two keywords. Those questions were not about ‘solar power’ or ‘wind power’ but contained at least one of the two keywords in the answers to them. Accordingly, the questions including at least one of the two keywords only in the title and content of the question were re-extracted.
2.2. Frequency Analysis
Frequency analysis was applied to identify the words most commonly mentioned in all the questions extracted in the previous step. Before the main analysis, the extracted questions were preprocessed by removing unnecessary parts of the questions through morpheme analysis. The morpheme analyzer used was Eunjeonhannip in the R package NLP4kec [17,18]. After extracting the nouns with morpheme analysis, special characters, numbers, and meaningless words were removed. Then, a dataset was created of the words and their frequency in the entire set of questions. The words were sorted by frequency in descending order. Finally, the 100 words with the highest frequency were listed.
2.3. Classification of the Questions
After the frequency analysis, the extracted questions were grouped by topic. First, a word network map was drawn based on the TF-IDF weights to create categories for grouping the questions by topic. The central words found to be related on the map were identified and regarded as the candidate categories for grouping the questions. Finally, the degree of association between the words in each question and the central words were scored, and the candidate categories with the highest scores were selected as the final categories.
2.3.1. Selection of the Central Words
The words extracted in Section 2.2 were used to draw a word network map showing the relationship between the words. TF-IDF analysis was applied to preprocess the words using the tm package [19]. Then, the words with a weight of 0.01 or less were excluded from further analysis due to their low frequency of appearance in the questions. TF-IDF is a statistical method to determine the importance of a specific word in a document by multiplying the TF value by the IDF value [20], where TF is the occurrence frequency of a specific word in a document and IDF is inversely proportional to the occurrence frequency of a specific word in a document, so the importance of a word with low frequency should not be underestimated [21]. TF-IDF can be calculated as [22]:
where is the weight of term i in document j, N is the number of documents in the data set, is the document frequency of term i in the data set.
Finally, a word network map was drawn with the top 100 words. The line thickness between two words indicates the frequency of the two words appearing simultaneously in a document and the degree of relevance between them. In addition, the size of the circle is expressed as the sum of the number of lines connected to each word, and is a measure of “degree centrality” that evaluates the centrality by the number of lines. Groups with five or more other words connected to each other were identified. For each word in the group, the word with many connections to other words had a larger circle size. Then, the word with the largest size was chosen as the central word that represented the group.
2.3.2. Question Classification Using TF-IDF and Cosine Similarity
The central words for the groups selected in the previous section were regarded as the categories to classify the questions. Each question was scored based on the number of words similar to the central words mentioned in the question and assigned to the category with the highest score.
Cosine similarity and TF-IDF weights were used to score the questions. Cosine similarity was calculated using a function in the R package wordVectors [23]. Cosine similarity measures the degree to which two vectors are similar using the cosine value of the angle between the vectors [24]. That is, the degree of similarity between the two words is determined from the similarity of the directions of their two vectors as a value from −1 to +1. Where the cosine similarity of two vectors in completely opposite directions is −1, and that of two vectors in the same direction is +1 [25]. Cosine similarity can be calculated as [26,27]:
where and are N dimension vectors, and is the angle between X and Y.
To calculate the cosine similarity, a vectorized dataset is required. For this, word2vec was used [23], a tool to vectorize the words of a text to represent the semantic relationship between the words [28]. The number of dimensions of the word2vec training data was set to 100, and its window was set to 5. The window is the number of neighboring words referenced to predict the central word, with the degree of association of the two words used to calculate the distance between them [23].
Finally, each category was scored using the TF-IDF weights and the cosine similarity value obtained in the previous sections. The scoring was conducted as follows. A TF-IDF weight was given to the words similar to each category. The more often the words with high relevance to the category were mentioned in the questions, the higher the score became. Accordingly, the category with the highest score became the category that best represented all question categories.
A part of the computer code for the previous analyses is shown in Table 1.

Table 1.
Variable name and function of the code used for analysis.
3. Results
3.1. Web Scraping
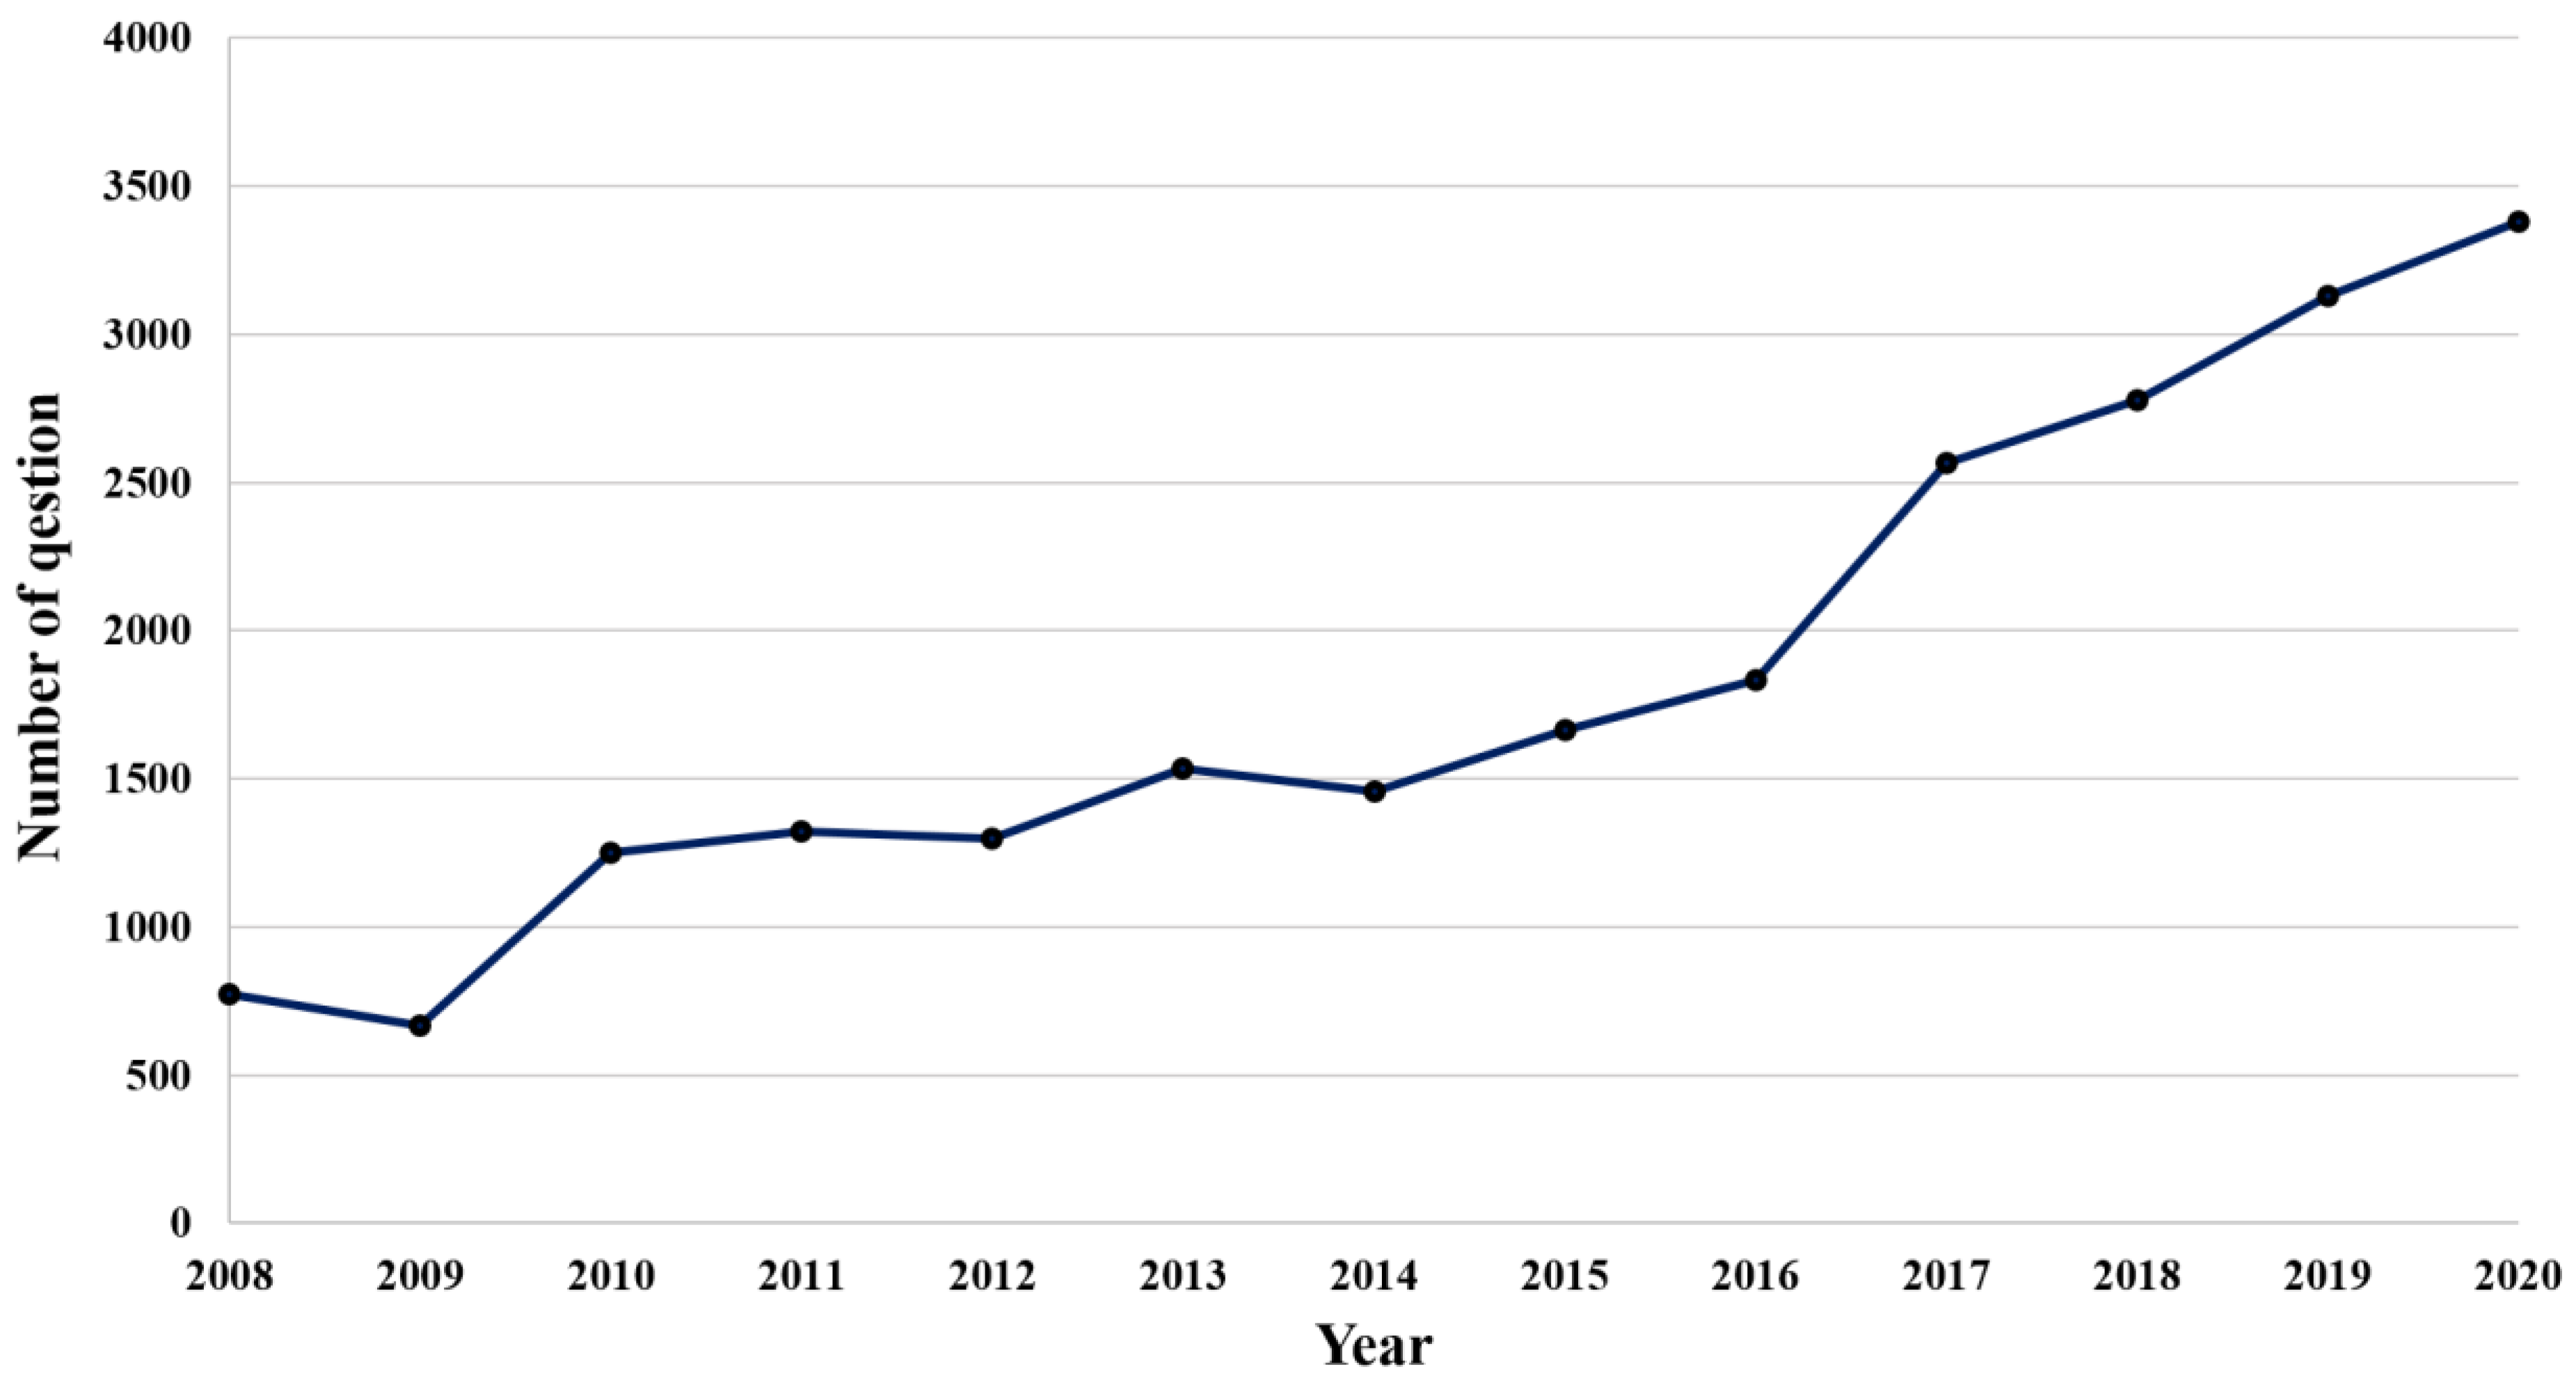
After searching for the questions posted on Knowledge iN using the keywords “solar power” and “wind power,” 101,042 questions were extracted, with an average of 7772 per year. Only those extracted questions that contained at least one keyword in both their title and content were screened for further analysis, resulting in 18,321 questions, with an average of 1409 per year. Figure 2 shows the annual number of questions about renewable energy used for our analysis. It also shows that the number of questions per year is gradually increasing. The year with the fewest questions was 2009 at 669. The year with the most questions was 2020, at 3380. This increase in the number of questions can be seen as an increase in public interest in renewable energy.

Figure 2.
Number of questions about renewable energy by year.
3.2. Frequency Analysis
Frequency analysis was applied to find the most frequently mentioned words in all the questions about renewable energy posted on Knowledge iN. The top 100 frequently mentioned words are listed in Table 2. As shown in the table, words related to power generation by renewable energy such as “solar power,” “power generation,” “energy,” and “wind power” appeared most often, followed by those related to “electricity,” “battery,” and “use.” In addition, words related to employment, such as “university,” “certificate,” “study,” “major,” “exam,” and “engineer,” appeared frequently. Words related to other energy resources, such as “nuclear power” and “hydropower,” were ranked in the top 100.
Table 2.
List of the top 100 words most frequently appearing in questions.
3.3. Classification of the Questions
3.3.1. Word Network Map
A word network map, which visually represents the relationship between the words, was drawn to select the categories to classify the questions. TF-IDF weight analysis was conducted to collect data for the word network map, gathering a total of 387 significant words. Using these significant words, a data frame was created to show the TF-IDF weights between pairs of words. Table 3 shows a section of the data frame with the TF-IDF weights between the pairs of words. Only the pairs with a weight greater than 0.01 are shown.
Table 3.
Section of data frame showing TF-IDF weight values between pairs of words.
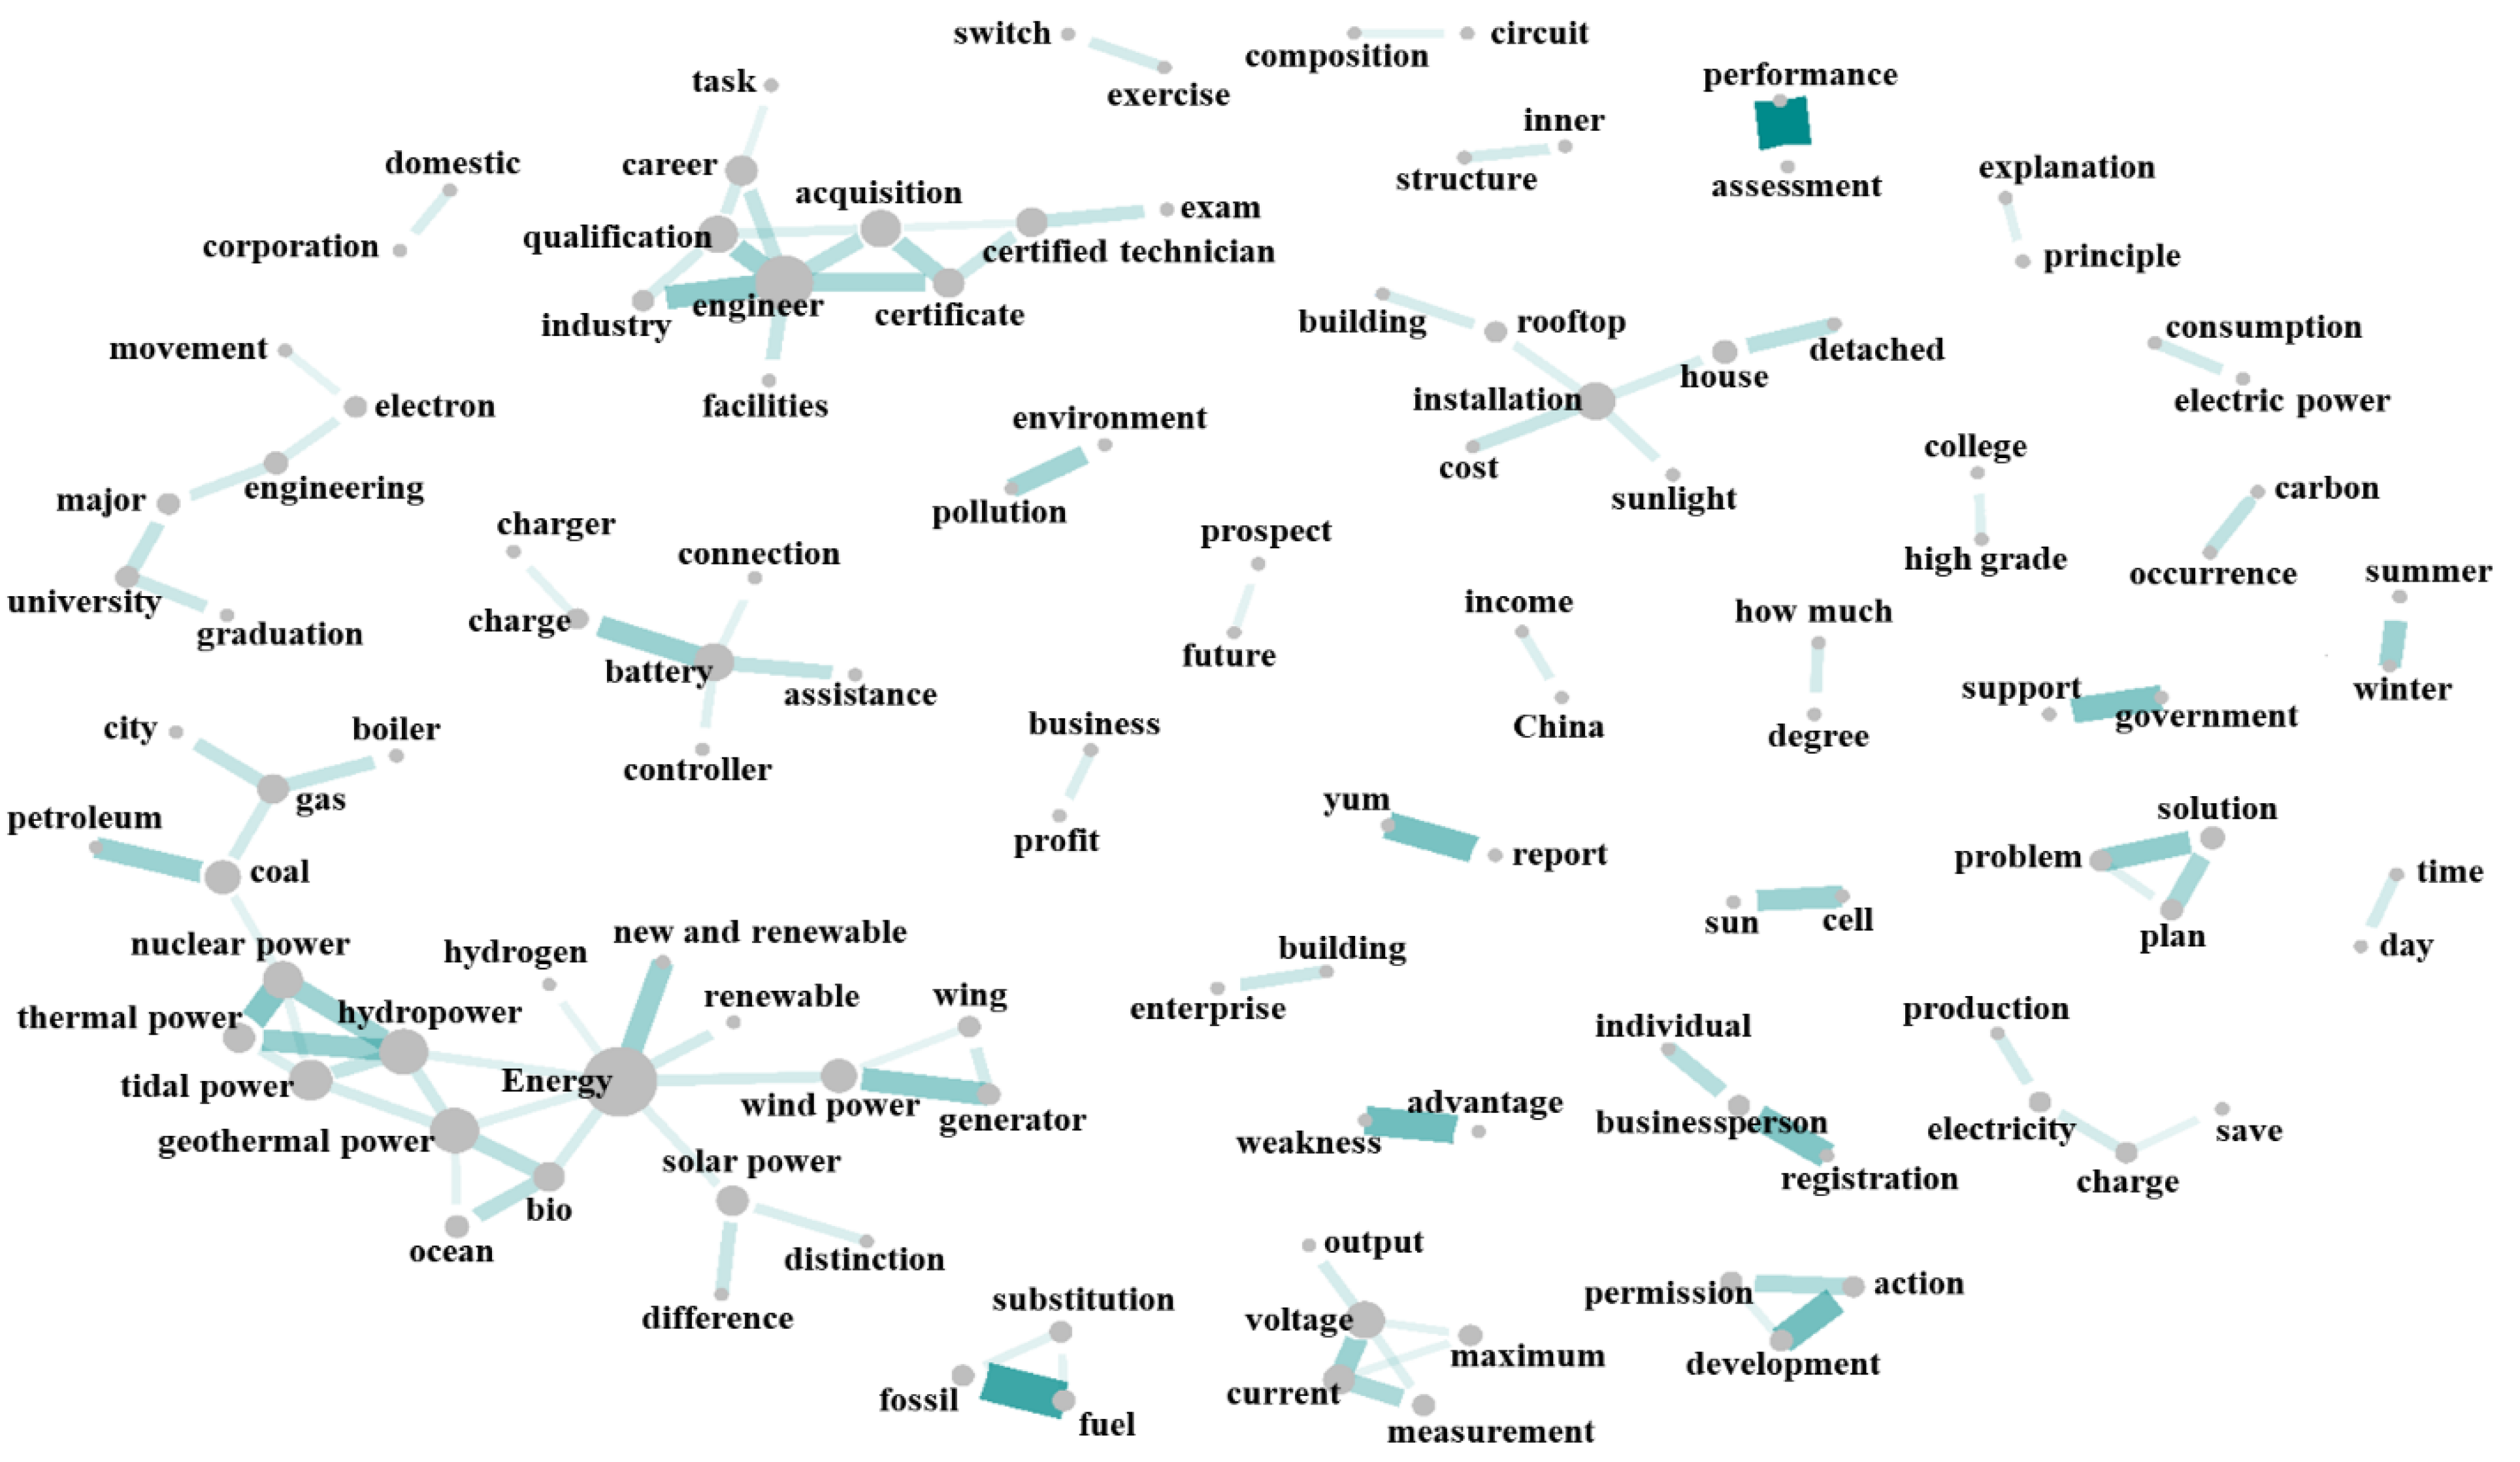
Figure 3 is a word network map consisting of the 100 words whose weights were in the top 100 among the word pairs in Table 3. In the figure, two words related to each other are connected by lines whose color intensity depends on the degree of association between the words. Words connected by a dark line are closely related, indicating a high degree of association, whereas a lighter line indicates a lower degree of association. Words not connected by lines are unrelated. The size of the circle means “degree centrality” and is expressed as the sum of the number of all lines connected to a word. In other words, the more lines connected to the word, the larger size of the circle is expressed.
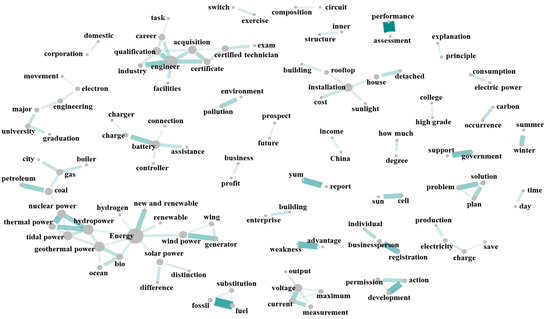
Figure 3.
Word network map.
Finally, in Figure 3, words connected by lines to five or more other words were grouped. Among the words in these groups, the central word was selected to represent each group, as summarized in Table 4. A total of six groups were identified with the central words “energy,” “installation,” “university,” “engineer,” “battery,” and “voltage.”
Table 4.
List of relevant words and central words by group.
3.3.2. Question Classification
To classify the questions by the previously selected categories, the cosine similarity values between the six central words and 11584 total words were first calculated. Table 5 shows a section of the cosine similarity matrix.
Table 5.
Section of the matrix showing cosine similarity values between central words and the relevant words.
Using the TF-IDF weight values of all the words and the cosine similarity values between the words and the central words, each question was scored on relevance to each category. Table 6 shows a section of the question scores for each category.
Table 6.
Selection of question scores for each category.
Finally, each question was classified to the category with the highest score among all the categories. The classification results are summarized in Table 7. The mean score in the third column is the average score of all questions classified to each category. Table 7 shows that the number of questions pertaining to the “installation” group was the highest, at 8598. Most questions in the “installation” group were about installing solar power facilities, installation location, and cost. The number of questions pertaining to the “energy” group was 5690, with the majority about wind power, hydropower, and nuclear power and the different power generation methods for each energy resource. Furthermore, there were 1978 questions in the “battery” group, 993 questions in the “engineer” group, 902 questions in the “voltage” group, and 160 questions in the “university” group.
Table 7.
Results of classification of questions by category.
In our analysis, a total of 18,321 questions were classified by category. The reason all the questions were classified is because the two keywords “solar power” and “wind power” are included in all the questions, and the related words of the group set as categories are also included.
Next, the questions with the highest score in each category were extracted. Table 8 shows that the questions contained a number of the central words and the relevant words are summarized in Table 4.
Table 8.
List of questions with the highest score for each category.
The highest score for the “energy” category was 2.75, and the question with the highest score in this category was about the “characteristics, pros, and cons of different renewable energy resources.” The highest score for the “installation” category was 2.63, with the highest-scoring question about the “construction cost of individual solar panels.” The highest score for the “university” category was 2.03, with the highest-scoring question about “majors and domestic universities related to renewable energy.” The highest score for the “engineer” category was 2.92, and the question with the highest score was about the “acquisition of solar-related certificates and prospect of employment in this field.” The highest score for the “battery” category was 3.27, with the question with the highest score about “charging of solar power controller.” The highest score for the “voltage” category was 3.55, with the highest-scoring question about “electrical knowledge such as voltage and current.”
The original questions in Table 8 were written in Korean, and the structure and word order were slightly changed in translating them into English to convey the meaning more effectively.
4. Discussion
In the ROK, the current energy policy emphasizes the expansion of renewable energy to respond to the climate crisis. Thus, the current government is significantly expanding its investment in the expansion of renewable energy. As many articles about renewable energy are pouring in every day through various media, the public is naturally interested in renewable energy and expresses their opinions in various ways.
With the development of online media, many people are free to express their opinions by posting comments on Internet articles. In addition, on a specific website where knowledge can be shared, many users are free to ask and answer questions to address each other’s curiosity. There have been studies to analyze texts posted on social network services (SNS) such as Twitter and Reddit. Such studies included the analysis results of the regional perception of renewable energy [12], the regional perception of solar energy [13], and the difference in perception between the two countries on climate change [14]. These studies identified the emotional expressions SNS users wanted to share through SNS, but could not figure out what they were specifically curious about. Therefore, if the questions SNS users asked online and their answers are carefully analyzed, it is possible to identify the public’s interest and concerns specifically.
In this study, therefore, questions posted on the section of Knowledge iN in the portal site Naver were analyzed using R, a big data analysis language, to determine what the public is interested in regarding renewable energy. First, frequency analysis was done and found that words related to power generation by renewable energy appeared most often, followed by words related to charging, the use of renewable energy, electricity, employment, university, and other energy resources. Then, what the public was most interested in about renewable energy was found to be the use and principles of renewable energy and power generation by renewable energy. In addition, with the expansion of renewable energy in the ROK, the public interest in jobs in the renewable energy field, such as workplaces, employment, and certificates, has also increased.
Next, the extracted questions were classified by category on a specific topic. For this, a word network map was drawn to identify groups of words with high relevance, and then six categories were selected: “energy,” “installation,” “university,” “engineer,” “battery,” and “voltage.” Furthermore, the TF-IDF weight value and the word2vec-based cosine similarity were applied to assign a score according to how many related words in each category the questions contained. Finally, the categories with the highest scores were determined. Consequently, the most questions were found in the following categories: “installation,” “energy,” “battery,” “engineer,” “voltage,” and “university.”
Moreover, the question that received the highest score in each category was chosen. Related words were identified through the word network map, and the topics of the questions were also closely related to these words. As a result, 8598 questions were classified into the installation group that had the most questions. Next, the questions were sorted in the order of energy (5690), battery (1978), article (993), voltage (902), and university (160).
This analysis confirmed that the public was most interested in solar panel installation and its installation cost. In addition, people were interested in the characteristics and pros and cons of power generation by other renewable energy resources, as well as professions, including universities and majors related to renewable energy, and exams for certification. There were many questions about electrical knowledge, such as batteries, charging, voltage, and current.
Based on the analysis results, implementation strategies for renewable energy policy can be formulated to meet the needs of the public. For example, after confirming many questions related to solar panel installation, strategies such as developing detailed manuals for solar panel installation and subsidies for installation costs could be considered. It is also possible to develop such strategies as Internet articles or card news to introduce the characteristics and pros and cons of power generation using renewable energy resources. Furthermore, brochures to introduce renewable energy-related majors and universities can be produced.
At a moment when renewable energy has emerged as the biggest topic in the Korean energy industry, increasingly more questions and opinions are expected to come out. Accordingly, analysis should continue to accurately identify the public interest and concern and increase public acceptance of renewable energy. If areas of interest to the public are accurately identified and contents produced containing the answers to the public’s questions, mutual trust between government, the energy industry, and the public will naturally increase. In other words, grasping the public opinion as it changes over time and establishing an appropriate strategy accordingly will lead to a friendly environment for renewable energy as well. In this regard, our analysis methodology could be used as a tool to derive the basic data for formulating a plan or strategy for promoting renewable energy.
5. Conclusions
This study developed a big data analysis-based procedure consisting of several types of analysis to determine what the general public was most interested in regarding renewable energy. We applied TF-IDF, cosine similarity, and word2vec to identify topics in informal texts and to classify them into categories. In addition, a word network map that visually represents the relationship between words was presented. Therefore, the methodology presented in this paper could be used as analysis tool to derive the basic data for formulating a plan or strategy for promoting renewable energy.
As time goes by, more and more social network services and mass media are being created, and the user age is being diverse. In addition, it is important to select the appropriate social media most used by citizens of each country. Therefore, subsequent study will expand the research scope to the other social network services such as Instagram, Facebook, Twitter, and Blog.
Author Contributions
Conceptualization, S.-Y.J.; methodology, S.-Y.J. and J.-W.K.; investigation, S.-Y.J. and Y.-S.K.; visualization, H.-Y.J.; writing—original draft, S.-Y.J.; writing—review and editing, J.-H.M. All authors have read and agreed to the published version of the manuscript.
Funding
This research was funded by the National Research Foundation of Korea (NRF), grant number 2020M2D2A2062436.
Institutional Review Board Statement
Not applicable.
Informed Consent Statement
Not applicable.
Data Availability Statement
The data presented in this study are available on request from the corresponding author.
Acknowledgments
This work was supported by a National Research Foundation of Korea (NRF) grant funded by the Korean government (Ministry of Science and ICT) (No. 2020M2D2A2062436).
Conflicts of Interest
The author declare no conflict of interest.
References
- International Energy Agency (IEA). Renewable Energy into the Mainstream. IEA Renewable Energy Working Party 2003. Available online: https://library.um.edu.mo/ebooks/b1362376x.pdf (accessed on 28 May 2021).
- Hagen, B.; Pijawka, D. Public perceptions and support of renewable energy in North America in the context of global climate change. Int. J. Disaster Risk Sci. 2015, 6, 385–398. [Google Scholar] [CrossRef] [Green Version]
- Ntanos, S.; Kyriakopoulos, G.; Chalikias, M.; Arabatzis, G.; Skordoulis, M. Public perceptions and willingness to pay for renewable energy: A case study from Greece. Sustainability 2018, 10, 687. [Google Scholar] [CrossRef] [Green Version]
- Rogers, J.C.; Simmons, E.A.; Convery, I.; Weatherall, A. Public perceptions of opportunities for community-based renewable energy projects. Energy Policy 2008, 36, 4217–4226. [Google Scholar] [CrossRef] [Green Version]
- Stoutenborough, J.W.; Shi, L.; Vedlitz, A. Probing public perceptions on energy: Support for a comparative, deep-probing survey design for complex issue domains. Energy 2015, 81, 406–415. [Google Scholar] [CrossRef]
- Jung, N.; Moula, M.E.; Fang, T.; Hamdy, M.; Lahdelma, R. Social acceptance of renewable energy technologies for buildings in the Helsinki Metropolitan Area of Finland. Renew. Energy 2016, 99, 813–824. [Google Scholar] [CrossRef]
- Kardooni, R.; Yusoff, S.B.; Kari, F.B.; Moeenizadeh, L. Public opinion on renewable energy technologies and climate change in Peninsular Malaysia. Renew. Energy 2018, 116, 659–668. [Google Scholar] [CrossRef]
- Anderson, B.; Böhmelt, T.; Ward, H. Public opinion and environmental policy output: A cross-national analysis of energy policies in Europe. Environ. Res. Lett. 2017, 12. [Google Scholar] [CrossRef]
- Ribeiro, F.; Ferreira, P.; Araújo, M.; Braga, A.C. Modelling perception and attitudes towards renewable energy technologies. Renew. Energy 2018, 122, 688–697. [Google Scholar] [CrossRef]
- Dehler-Holland, J.; Schumacher, K.; Fichtner, W. Topic Modeling Uncovers Shifts in Media Framing of the German Renewable Energy Act. Patterns 2021, 2, 100169. [Google Scholar] [CrossRef] [PubMed]
- Kim, J.S.; Jeong, D.H.; Choi, D.J.; Park, E.I. Exploring public perceptions of renewable energy: Evidence from a word network model in social network services. Energy Strateg. Rev. 2020, 32, 100552. [Google Scholar] [CrossRef]
- Li, R.; Crowe, J.; Leifer, D.; Zou, L.; Schoof, J. Beyond big data: Social media challenges and opportunities for understanding social perception of energy. Energy Res. Soc. Sci. 2019, 56, 101217. [Google Scholar] [CrossRef]
- Kim, S.Y.; Ganesan, K.; Dickens, P.; Panda, S. Public sentiment toward solar energy—opinion mining of twitter using a transformer-based language model. Sustainability 2021, 13, 2673. [Google Scholar] [CrossRef]
- Loureiro, M.L.; Alló, M. Sensing climate change and energy issues: Sentiment and emotion analysis with social media in the U.K. and Spain. Energy Policy 2020, 143, 111490. [Google Scholar] [CrossRef]
- Jain, A.; Jain, V. Sentiment classification of twitter data belonging to renewable energy using machine learning. J. Inf. Optim. Sci. 2019, 40, 521–533. [Google Scholar] [CrossRef]
- Korea Electric Power Corporation. Statistics of Electric Power in Korea 2020. Available online: https://home.kepco.co.kr/kepco/KO/ntcob/ntcobView.do?pageIndex=1&boardSeq=21047466&boardCd=BRD_000099&menuCd=FN05030103&parnScrpSeq=0&categoryCdGroup=®DateGroup2= (accessed on 28 May 2021).
- Yoo, Y.H.; Lee, Y.W. Eunjeonhannip Project. Available online: http://eunjeon.blogspot.com/ (accessed on 28 May 2021).
- Kim, N.Y. NLP4kec Package. Available online: https://github.com/NamyounKim/NLP4kec (accessed on 28 May 2021).
- Feinerer, I.; Introduction to the tm Package: Text Mining in R. R Vignette 2020. Available online: https://cran.r-project.org/web/packages/tm/vignettes/tm.pdf (accessed on 28 May 2021).
- Trstenjak, B.; Mikac, S.; Donko, D. KNN with TF-IDF based framework for text categorization. Procedia Eng. 2014, 69, 1356–1364. [Google Scholar] [CrossRef] [Green Version]
- Zhang, W.; Yoshida, T.; Tang, X. A comparative study of TF*IDF, LSI and multi-words for text classification. Expert Syst. Appl. 2011, 38, 2758–2765. [Google Scholar] [CrossRef]
- Uǧuz, H. A two-stage feature selection method for text categorization by using information gain, principal component analysis and genetic algorithm. Knowl. Based Syst. 2011, 24, 1024–1032. [Google Scholar] [CrossRef]
- Schmidt, B. wordVectors Package. Available online: https://github.com/bmschmidt/wordVectors (accessed on 28 May 2021).
- Sarwar, B.; Karypis, G.; Konstan, J.; Riedl, J. (sarwar 2001) Item-based collaborative filtering recommendation.pdf. In Proceedings of the 10th International Conference on World Wide Web, Hong Kong, China, 1–5 May 2001; pp. 285–295. [Google Scholar]
- Rakholia, R.M.; Saini, J.R. Information retrieval for Gujarati language using cosine similarity based vector space model. Adv. Intell. Syst. Comput. 2017, 516, 1–9. [Google Scholar] [CrossRef]
- Xia, P.; Zhang, L.; Li, F. Learning similarity with cosine similarity ensemble. Inf. Sci. 2015, 307, 39–52. [Google Scholar] [CrossRef]
- Li, B.; Han, L. Distance weighted cosine similarity measure for text classification. In Proceedings of the 14th International Conference, IDEAL 2013, Hefei, China, 20–23 October 2013; pp. 611–618. [Google Scholar] [CrossRef]
- Mikolov, T.; Chen, K.; Corrado, G.; Dean, J. Efficient estimation of word representations in vector space. arXiv 2013, arXiv:1301.3781. [Google Scholar]
Publisher’s Note: MDPI stays neutral with regard to jurisdictional claims in published maps and institutional affiliations. |
© 2021 by the authors. Licensee MDPI, Basel, Switzerland. This article is an open access article distributed under the terms and conditions of the Creative Commons Attribution (CC BY) license (https://creativecommons.org/licenses/by/4.0/).