Article

Framework for Developing a Low-Carbon Energy Demand in Residential Buildings Using Community-Government Partnership: An Application in Saudi Arabia

School of Engineering, University of British Columbia (Okanagan), Kelowna, BC V1V 1V7, Canada
*
Author to whom correspondence should be addressed.
Energies 2021, 14(16), 4954; https://doi.org/10.3390/en14164954
Submission received: 21 June 2021 / Revised: 27 July 2021 / Accepted: 4 August 2021 / Published: 12 August 2021
(This article belongs to the Special Issue Optimization and Innovation of Nearly Zero-Energy Buildings)

Abstract

:
Rapid population growth has led to significant demand for residential buildings around the world. Consequently, there is a growing energy demand associated with increased greenhouse gas (GHG) emissions. The residential building energy demand in arid countries such as Saudi Arabia is supplied with fossil fuel. The existing consumption pattern of fossil fuels in Saudi Arabia is less sustainable due to the depletion of fossil fuel resources and resulting environmental impacts. Buildings built in hot and arid climatic conditions demand high energy for creating habitable indoor environments. Enormous energy is required to maintain a cool temperature in hot regions. Moreover, climate change may have different impacts on hot climatic regions and affect building energy use differently. This means that different building interventions may be required to improve the performance of building energy performance in these geographical regions, thereby reducing the emissions of GHGs. In this study, this framework has been applied to Saudi Arabia, a hot and arid country. This research proposes a community–government partnership framework for developing low-carbon energy in residential buildings. This study focuses on both the operational energy demand and a cost-benefit analysis of energy use in the selected geographical regions for the next 30 years (i.e., 2050). The proposed framework primarily consists of four stages: (1) data collection on energy use (2020 to 2050); (2) setting a GHG emissions reduction target; (3) a building intervention approach by the community by considering cost, energy, and GHG emissions using the Technique for Order of Performance by Similarity to the Ideal Solution (TOPSIS) to select the best combinations in each geographical region conducting 180 simulations; and (4) a clean energy approach by the government using grey relational analysis (GRA) to select the best clean energy system on the grid. The clean energy approach selected six different renewable power generation systems (i.e., PV array, wind turbine, hybrid system) with two storage systems (i.e., battery bank and a combination of electrolyte, fuel cell, and hydrogen tank storage). This approach is designed to identify the best clean energy systems in five geographical regions with thirty scenario analyses to define renewable energy-economy benefits. This framework informs through many engineering tools such as residential building energy analysis, renewable energy analysis, multi-criteria decision analysis (MCDA) techniques, and cost-benefit analysis. Integration between these engineering tools with the set of energy policies and public initiatives is designed to achieve further directives in the effort to reach greater efficiency while downsizing residential energy demands. The results of this paper propose that a certain level of cooperation is required between the community and the government in terms of financial investments and the best combinations of retrofits and clean energy measures. Thus, retrofits and clean energy measures can help save carbon emissions (enhancing the energy performance of buildings) and decrease associated GHG emissions, which can help policy makers to achieve low-carbon emission communities.

1. Introduction

1.1. Background

Worldwide, the demand for residential buildings has become a significant demand due to increasing population growth rates. As a result, there has also been a growing energy demand associated with the increase in greenhouse gas (GHG) emissions. The residential building energy demand in arid countries such as Saudi Arabia accounts for 52% of the total national electricity consumption [1,2]. The existing consumption pattern of fossil fuels in Saudi Arabia is less sustainable due to the depletion of fossil fuel resources and subsequent environmental impacts. The carbon dioxide level increased from 172 million tons in 1990 to 625 million tons in 2018 from the consumption of fossil fuels and related industrial operations [3].
Moreover, only 30% of Saudi nationals own their own homes. Furthermore, around two-thirds of the population is under the age of 30. This estimation suggests that to meet the needs of growing populations, the country must build 2.5 million new homes by 2025. This is a challenging task to complete. The residential energy demand in Saudi Arabia is increasing due to population growth, high economic growth, heavily subsidized electricity rates, and the use of air conditioners during summer [4].

1.2. Literature Review

Communities tend to apply the “hierarchy of sustainable energy use prioritization strategy” [5], which places great emphasis on energy conservation, energy efficiency, and renewable energy. Energy conservation is described as household-based behavioral activities that affect residential building carbon reduction (e.g., turning off lighting and A/C). Energy efficiency aims to improve residential building’s products and services to reduce carbon production and manage the required energy for households efficiently (e.g., double glazed windows and LED lights). These methods represent a community-based approach to reducing carbon dioxide in residential buildings [6,7,8]. Renewable energy is generated from clean energy resources such as solar panels and wind turbine technology to meet energy demands. The combination of energy efficiency and energy conservation and the integration of renewable energy are considered essential for building a long-term energy approach vision [6,7,8].
Recently a new regulation has been proposed regarding energy efficiency and renewable energy in newly constructed residential buildings in the European Union [9]. Kuronen et al. [10] proposed the 4P approach, a Public–Private–People Partnership planning for the low-carbon framework in urban planning designed to bring future inhabitants to residential developments [10]. The literature concerning collaborative community and government approaches in managing energy consumption and carbon dioxide in residential buildings is limited. There is scarce evidence available on how such a joint partnership could be effective. Thus, this paper aims to develop a community-government partnership framework combining building intervention and clean energy approaches that would require significant stakeholders’ contribution (e.g., from the tech-industry, economic, political, and public sectors) to fast track progress towards reaching carbon reduction targets.
Under a community–government partnership, the best GHG emission reduction strategy can be identified by considering renewable energy and building energy efficiency with respect to government–community collaboration. The framework included a building intervention approach for the community and a clean energy approach for the government. The building intervention approach considers appositive impact, a comprehensive combination of estimated energy consumption behavior, and GHG emissions produced by common residential building types in Saudi Arabia. On the other hand, the clean energy approach investigates different renewable options to reduce GHG emissions. Combining these two approaches is designed to identify the best combinations for meeting the country’s GHG emissions reduction targets.

2. Methodology

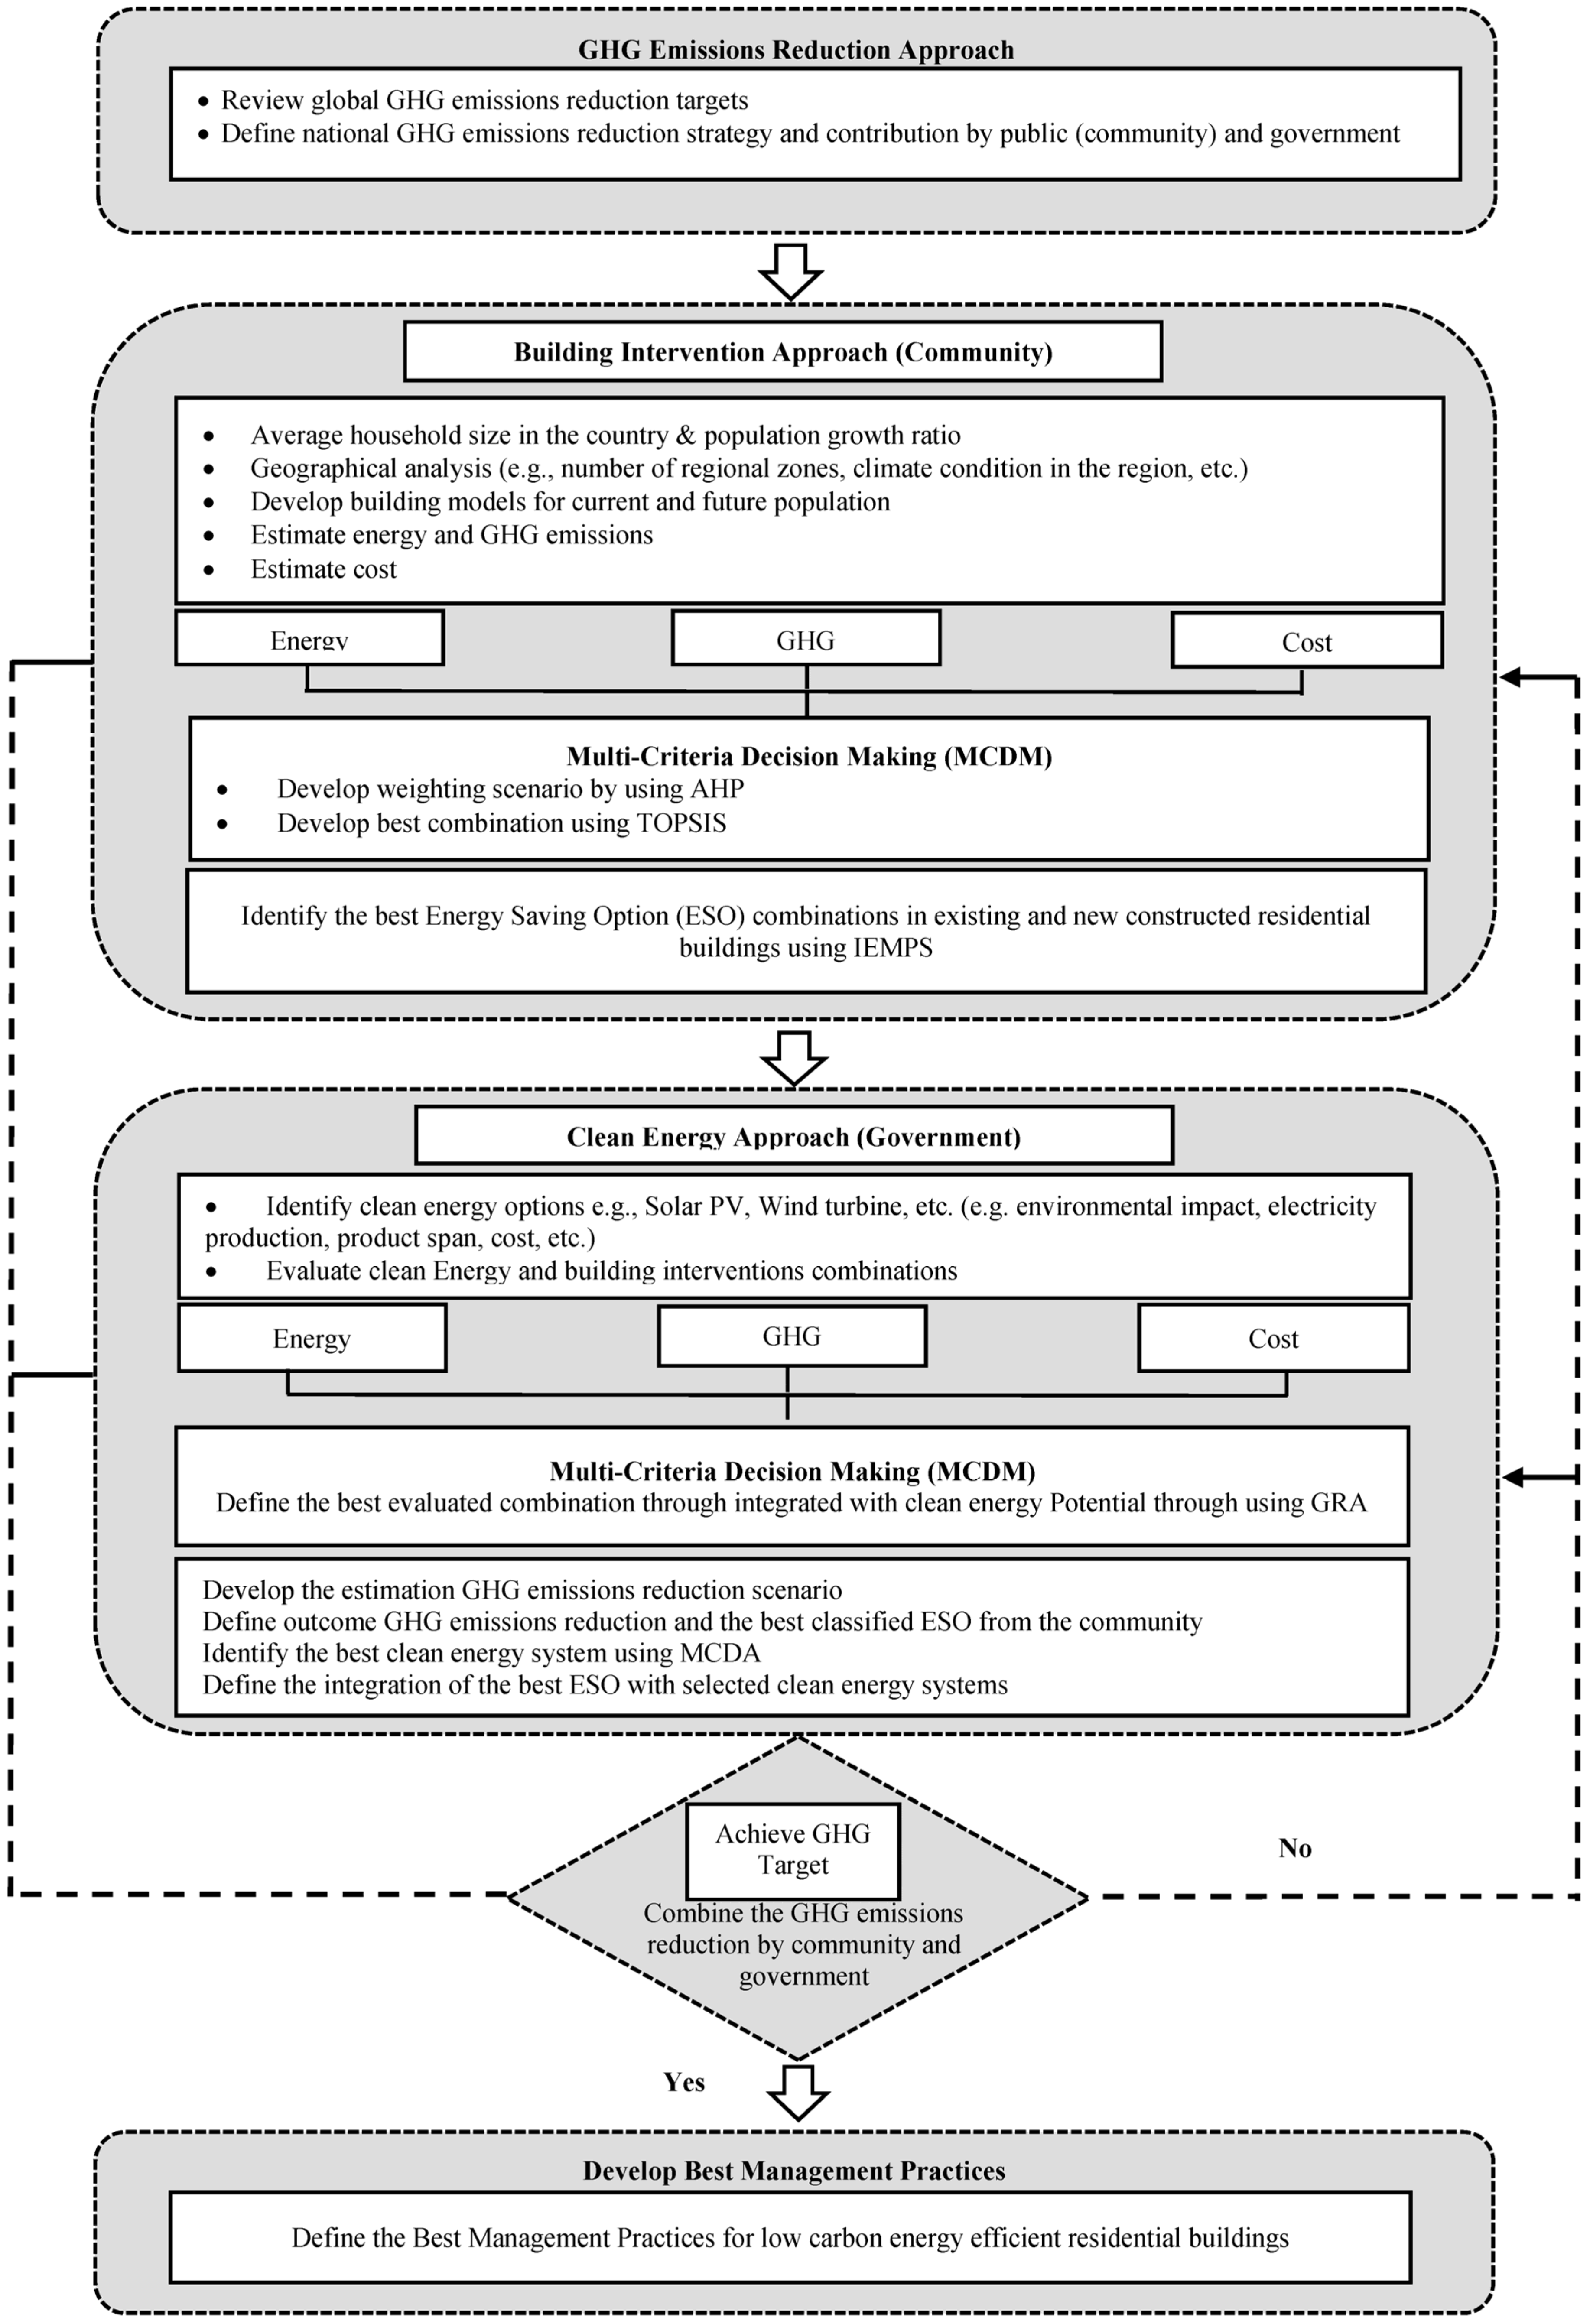
2.1. Framework Development

A community-government partnership framework is proposed for developing low-carbon residential buildings in hot and arid developing countries, as shown in Figure 1. The framework comprises two approaches for achieving GHG reduction targets: a building intervention approach by the government’s community and a clean energy approach. The first component identifies the national GHG emissions target required to meet the standards of the Paris Agreement and integrates the GHG emissions reduction roadmap know-how (as explained in Figure 2 below). Secondly, the building intervention approach is a community action and adaptation approach toward energy efficiency techniques and energy conservation awareness in residential buildings. Thirdly, the clean energy approach is a government policy to identify a suitable integration between the most suitable and affordable studied combinations and clean energy systems for the country. This framework shows the connection between the approaches to gain optimum energy performance in the operational and a clean energy selective in the country’s residential sector. The following sections will explain how these approaches work and the possible tools for building modeling and long-term energy estimation, lifecycle costing analysis, solar PV power and wind turbine structure calculations, and multi-criteria decision analysis.

2.1.1. GHG Emissions Reduction Approach

At first, national energy and GHG emissions reduction policies are reviewed based on the studied country. In addition, international GHG emission reduction mechanisms, such as those of the Paris Agreement, are reviewed in Appendix B. National and international policies are the basis for defining the national GHG emissions reduction targets. GHG emissions reduction targets are established based on the literature reviews. The targets can be achieved by the actions of communities (building owners) and government regulations. These two approaches are discussed separately.
Furthermore, it should be noted that the GHG emissions approach depends on the country’s GHG emissions reduction target, potential strategies to be applied by the communities’ building intervention approach, and the government’s clean energy approach. These strategies can be explained in the road map process of GHG emissions reduction, which illustrates the sequence of optimum combinations within a country. Thus, we need to understand how much various communities/residents are willing to invest in their housing interventions for the next few years (e.g., 30 years). Moreover, we must determine how to estimate how much particular communities contribute to the GHG emissions reduction target. Answering these questions is a part of defining the direction of a community-based approach. To define the government approach, we must determine how much the government envisions reducing GHG emissions within the country.
Furthermore, we must also determine how much the government should invest into clean energy for the next few years (e.g., 30 years) in order to meet these targets. However, there should be some convergence between the two approaches that can lead to identifying a feasible set of measures for GHG emissions reduction for hot climates. Figure 2 explains the road map for the GHG emissions strategy.

2.1.2. Building Intervention Approach (Community)

The community building intervention approach depends on alternative combinations in energy efficiency and energy conservation interventions (energy saving options (ESO)) for residential buildings. For these combinations, the Technique for Order of Performance by Similarity to Ideal Solution (TOPSIS) is applied to evaluate and identify the best combinations that suit each geographical region in the studied country. Residential building intervention strategies must be acceptable to the community to implement the selected combinations in exciting and new residential constructions in the country.

Building Modeling and Long-Range Energy Estimation and GHG Emissions

The following steps describe the residential building modeling for existing and newly constructed buildings:
  • First step: collect required data (e.g., residential building design, geographical climate condition, population).
  • Second step: develop a residential building model through Revit or another 3-D design software.
  • Third step: integrate residential building modeling design into Design Builder software for comprehensive energy analysis.
  • Fourth step: calculate energy consumption and GHG emissions mathematically. The Long-range Energy Alternative Planning System (LEAP) is a widely used software system for energy and environmental policy analyses in over 190 countries. LEAP software is used to calculate the energy demand based on the total activity level and energy intensity for each branch (i.e., region or country) [12].
The total energy demand can be calculated using Equation (1).
D b , s , t = T A b , s , t × E I b , s , t
where:
D: Total Energy Demand;
TA: Total Activity;
EI: Energy Intensity;
b: Branch;
s: Scenario;
t: year;
Equation (2) is used to calculate the energy in each technology used:
U E b , 0 = E I A g , 0 × F S b , 0 × E F F b , 0
where:
b = 1,2,3, …, B (ranging from the base year [0] to the end year);
EIAg,0: final energy intensity in aggregate energy intensity branch;
UE: useful energy intensity in a technology branch b;
FS: fuel share;
EFF: efficiency;
The useful intensity of the aggregate energy intensity branch is the sum of the suitable intensities for each technology using Equation (3)
U E A g , 0 = b = 1 B U E b , 0
The GHG emissions are calculated using Equation (4)
GHG = total   energy   consumption × emmision   factor
For Equations (1)–(3), the literature review and energy simulation (e.g., energy consumption and GHG emissions in the residential buildings) are used over a specific period (e.g., 30 years).

Life Cycle Costing Analysis (LCCA)

LCCA is an economic assessment method that includes all related costs over the life cycle of the residence including initial cost, maintenance cost, renewal cost, and disposal cost of the residential building. This research includes direct costs such as capital (e.g., construction), operation and maintenance, and residual value. The present-worth method, (i.e., net present value (NPV)), estimates life cycle cost for each alternative in the community and government approach. The NPV of all costs and electricity use and ESO cost are estimated using Equation (5) below [13,14].
N P V = t = 0 B t C t 1 + r t
where:
r is a discount rate (interest rate) of the country;
t is periods (years);
C = future expectation of energy cost;
B = present value amount for intervention cost;
The Net Present Value for Total Energy Consumption ( N P V E C ) for future expected energy cost is explained in Equation (6) below.
N P V E C = t 0 m 1 m 1 + r t × P E × z I E R
where:
P E is the present energy cost;
z I E R is the discount rate which is increasing electricity rate per year;
The total LCC is estimated using Equation (7) [15].
LCC = NPVIC + NPVOM&RC +NPV RepC + NPVEC
where:
LCC is the total life cycle cost in present value;
(PV) dollars of a given alternative;
IC is the PV investment costs (if incurred at the base date, they need not be discounted);
RepC is the PV capital replacement costs;
EC is the PV of energy costs;
OM&RC is the PV of non-fuel operating, maintenance, and repair costs;

Multi-Criteria Decision Analysis: TOPSIS

ESOs and renewable energy selection are based on three criteria: energy, GHG emissions, and total cost. The importance of the criteria’s weight is evaluated using the Analytical Hierarchy Process (AHP) based on export [16]. The criteria and the weights are aggregated using the Technique for Order of Performance by Similarity to the Ideal Solution (TOPSIS) for ESOs.
The TOPSIS method selects the best alternative that should have the shortest distance from the “positive ideal solution” and the furthest from the “negative ideal solution” in the geometrical sense. Also, this method suggests that each criterion has regularly increased or decreased utility, making it easy to target the positive ideal and negative ideal solution [17]. Moreover, the TOPSIS method calculates similarity to the positive-ideal solution by combining the distance ratio to the positive solution and the relative closeness from the negative-ideal solution for three criteria: energy, GHG emissions, and total cost as shown in the following steps:
  • First Step: calculate normalized rating vector normalization using Equation (8).
    r i j = x i j i = 1 m x i j 2
    i = 1, 2, …, m,j = 1, 2, 3, …, n.
  • Second Step: calculate weighted normalized ratings using Equation (9)
    V i j = W j   r i j
    i = 1, 2, …, m,j = 1, 2, 3, …, n.
  • Third Step: identify positive ( A * ) and negative ( A ) ideal solutions using Equations (10) and (11).
    A * = v 1 * , v 2 * ,   ,   v j * ,   ,   v n * = { ( m a x   V i j |   j     J 1 ) ,   ( m i n   V i j |   j     J 2 )   |   i = 1   , , m ) }
    A = v 1 , v 2 , ,   v j , ,   v n   = { m i n V i j |   j     J 1 , m a x V i j |   j     J 2   |   i = 1 , , m )
  • Fourth Step: calculate separation distances:
Positive ideal solution A * , shown in Equation (12).
S i * = j = 1 n ( v i j v j * ) 2
i= 1, 2, …, m j = 1, 2, 3, …, n.
Negative ideal solution A , shown in Equation (13).
S i = j = 1 n ( v i j v j ) 2
i = 1, 2, …, m j = 1, 2, 3, …, n.
Calculate similarities to the positive-ideal solution using Equation (14).
C i * = S i S i * + S i
i= 1, 2, …, m.

2.1.3. Clean Energy Approach (Government)

The government can develop clean energy to reduce carbon emissions of energy consumption. They can use an appropriate combination of renewable energies and the community’s contribution to meet energy demands and reduce carbon emissions. The clean energy approach consists of four steps, as follows [18,19,20]:
First Step: review and identify the data to build a national diversification economy based on innovations to help improve product efficiencies and deregulate energy policies and initiatives.
Second Step: obtain the community’s contribution using energy conservation and energy efficiency through the “building intervention” approach.
Third Step: evaluate energy performance for the country’s residential sector for a long period of time and identify the best intervention combinations that suit the country through a comprehensive evaluation of clean energy management performance using the gray relational analysis technique (GRA).
Fourth Step: the clean energy systems (e.g., PV power, wind turbines) should be investigated to suit the climate and replace the on-grid traditional energy powered that use fossil fuel system with clean energy sources based on the lifecycle costing analysis that will explain the government rule to create a healthy environment.
The possible clean energy sources are solar photovoltaic (PV), wind, fuel cells, geothermal, or combinations between two or more resources in a hybrid system. The renewable energy calculation used in this research can be found in Section 2.1.3 [21]. The following sections will present the calculation for PV power and wind turbine.

V Power Structure Calculation

Solar PV Power (PPV) is the annual energy output generated from the solar power plant to feed the grid. The solar energy is calculated using the following Equations (15)–(17) [22].
W = [ A h c o u n t r y / S × 1 + η s p × 1 + η i × 1 + η b × E   1 + η c c
P V = P W / 1000 × S  
P P V = P V × 365  
where:
W is the solar panel wattage that required for energy demand;
A h c o u n t r y is the total daily Ampere hour based on the country national annual average in the residential sector;
S is the number of hours that is required from useful sun within a 24-h day;
η sp is the solar panel losses;
η i is the inverter losses;
η b is the battery efficiency losses;
E is the voltage;
PV is the daily energy output generated for feeding in;
P is the annual energy output generated for feeding the grid by a photovoltaic solar power plant.

Wind Turbine Power Structure

Wind turbine power depends on the wind speed at hub height Equation (18) [21].
v v 0 = h h 0 γ
where:
v is the wind velocity at the hub height ( h ) ;
h is the hub height;
v 0 is the measured wind velocity at the reference height ( h 0 ) ;
h 0 is the measurement of the reference height;
γ is the ground surface friction coefficient;
The output power from a wind turbine is calculated using its manufacturing characteristic curve, which is expressed by adapting the curve fitting technique as shown in Equation (19).
P w   v = 0 f o r   v < v c a 1   v n     b 1   v 2 +   c 1 v + d 1 f o r   v c   v < v 1 a 2   v n     b 2   v 2 +   c 2 v + d 2 f o r   v 1   v < v 2 a 1   v n     b 1   v 2 +   c 1 v + d 1 f o r   v 2   v < v f a 1   v n     b 1   v 2 +   c 1 v + d 1 f o r   v > v f
where:
P w   v   is the output power of the wind turbine at wind velocity;
( v c ) and ( v f ) are the cut-in and the cut-off speeds of the wind turbine;
( v 1 ) and ( v 2 ) are the intermediate wind speed levels used to improve the accuracy of curve fitting;
a i , b i , c i , d i are the parameters of the model;

Multi-Criteria Decision Analysis: Grey Relational Analysis

Grey relational analysis (GRA) uses the ideal alternative through evaluation alternatives based on a relative relational coefficient to determine the best alternative [23]. An analysis will be completed for each residential building scenario, inputted into the grey relational analysis method. GRA uses the relative relation coefficient to calculate the ideal option in order to determine the best alternatives [24].
Additionally, we can identify the GRA as the method to measure the degree of closeness and relative distance, which makes it capable of making a more extensive comparison between two sets of data. Moreover, the main procedure of GRA involves converting the performance of all alternative into an identical sequence [23], as described in the following steps:
First Step: Decision matrix D consists of m alternatives and n criteria: energy, GHG emissions, and total cost.
The decision matrix D is normalized to D, Equation (20)
D = x 1 , 1 x 1 , j x 1 , n x i , 1 x i , j x i , n x m , 1 x m , j x m , n D = x 1 , 1 x 1 , j x 1 , n x i , 1 x i , j x i , n x m , 1 x m , j x m , n  
Second Step: Non-beneficial criteria are normalized in Equation (21)
x i , j = m i n   { x i , j |   i = 1 , 2 , , m } x i , j
X 0 = x 0 , j ;   j = 1 , 2 , 3 ,     ,   n .
Third Step: The grey relation coefficient in Equation (22)
ξ 0 i j = Δ m i n + ζ Δ m a x Δ 0 i j + ζ Δ m a x
Δ o i j = x 0 , j x i , j is relative grey relation space;
Δ m i n = m i n i m i n j   x 0 , j x i , j ; j = 1 ,   2 ,   ,   n ;   i = 1 ,   2 ,   ,   m ;
Δ m a x = m a x j m a x j   x 0 , j x i , j ; j = 1 ,   2 ,   ,   n ;   i = 1 ,   2 ,   ,   m ;
The ζ is the distinguishing coefficient, generally set at 0.5 between 0   ζ 1.
Fourth Step: The grey relation grade ε from Equation (23)
ε = j = 1 n ξ 0 i   j
The ζ is the distinguishing coefficient; generally set at 0.5 between 0   ζ 1.
Fifth Step: Consider the different weights of criteria using Equation (24)
ε = w j   j = 1 n ξ 0 i   j  
The ζ is the distinguishing coefficient; generally set at 0.5 between 0   ζ 1.

2.2. Framework Application

The community-government partnership framework for developing low-carbon energy in the residential sector has been applied to Saudi Arabia.

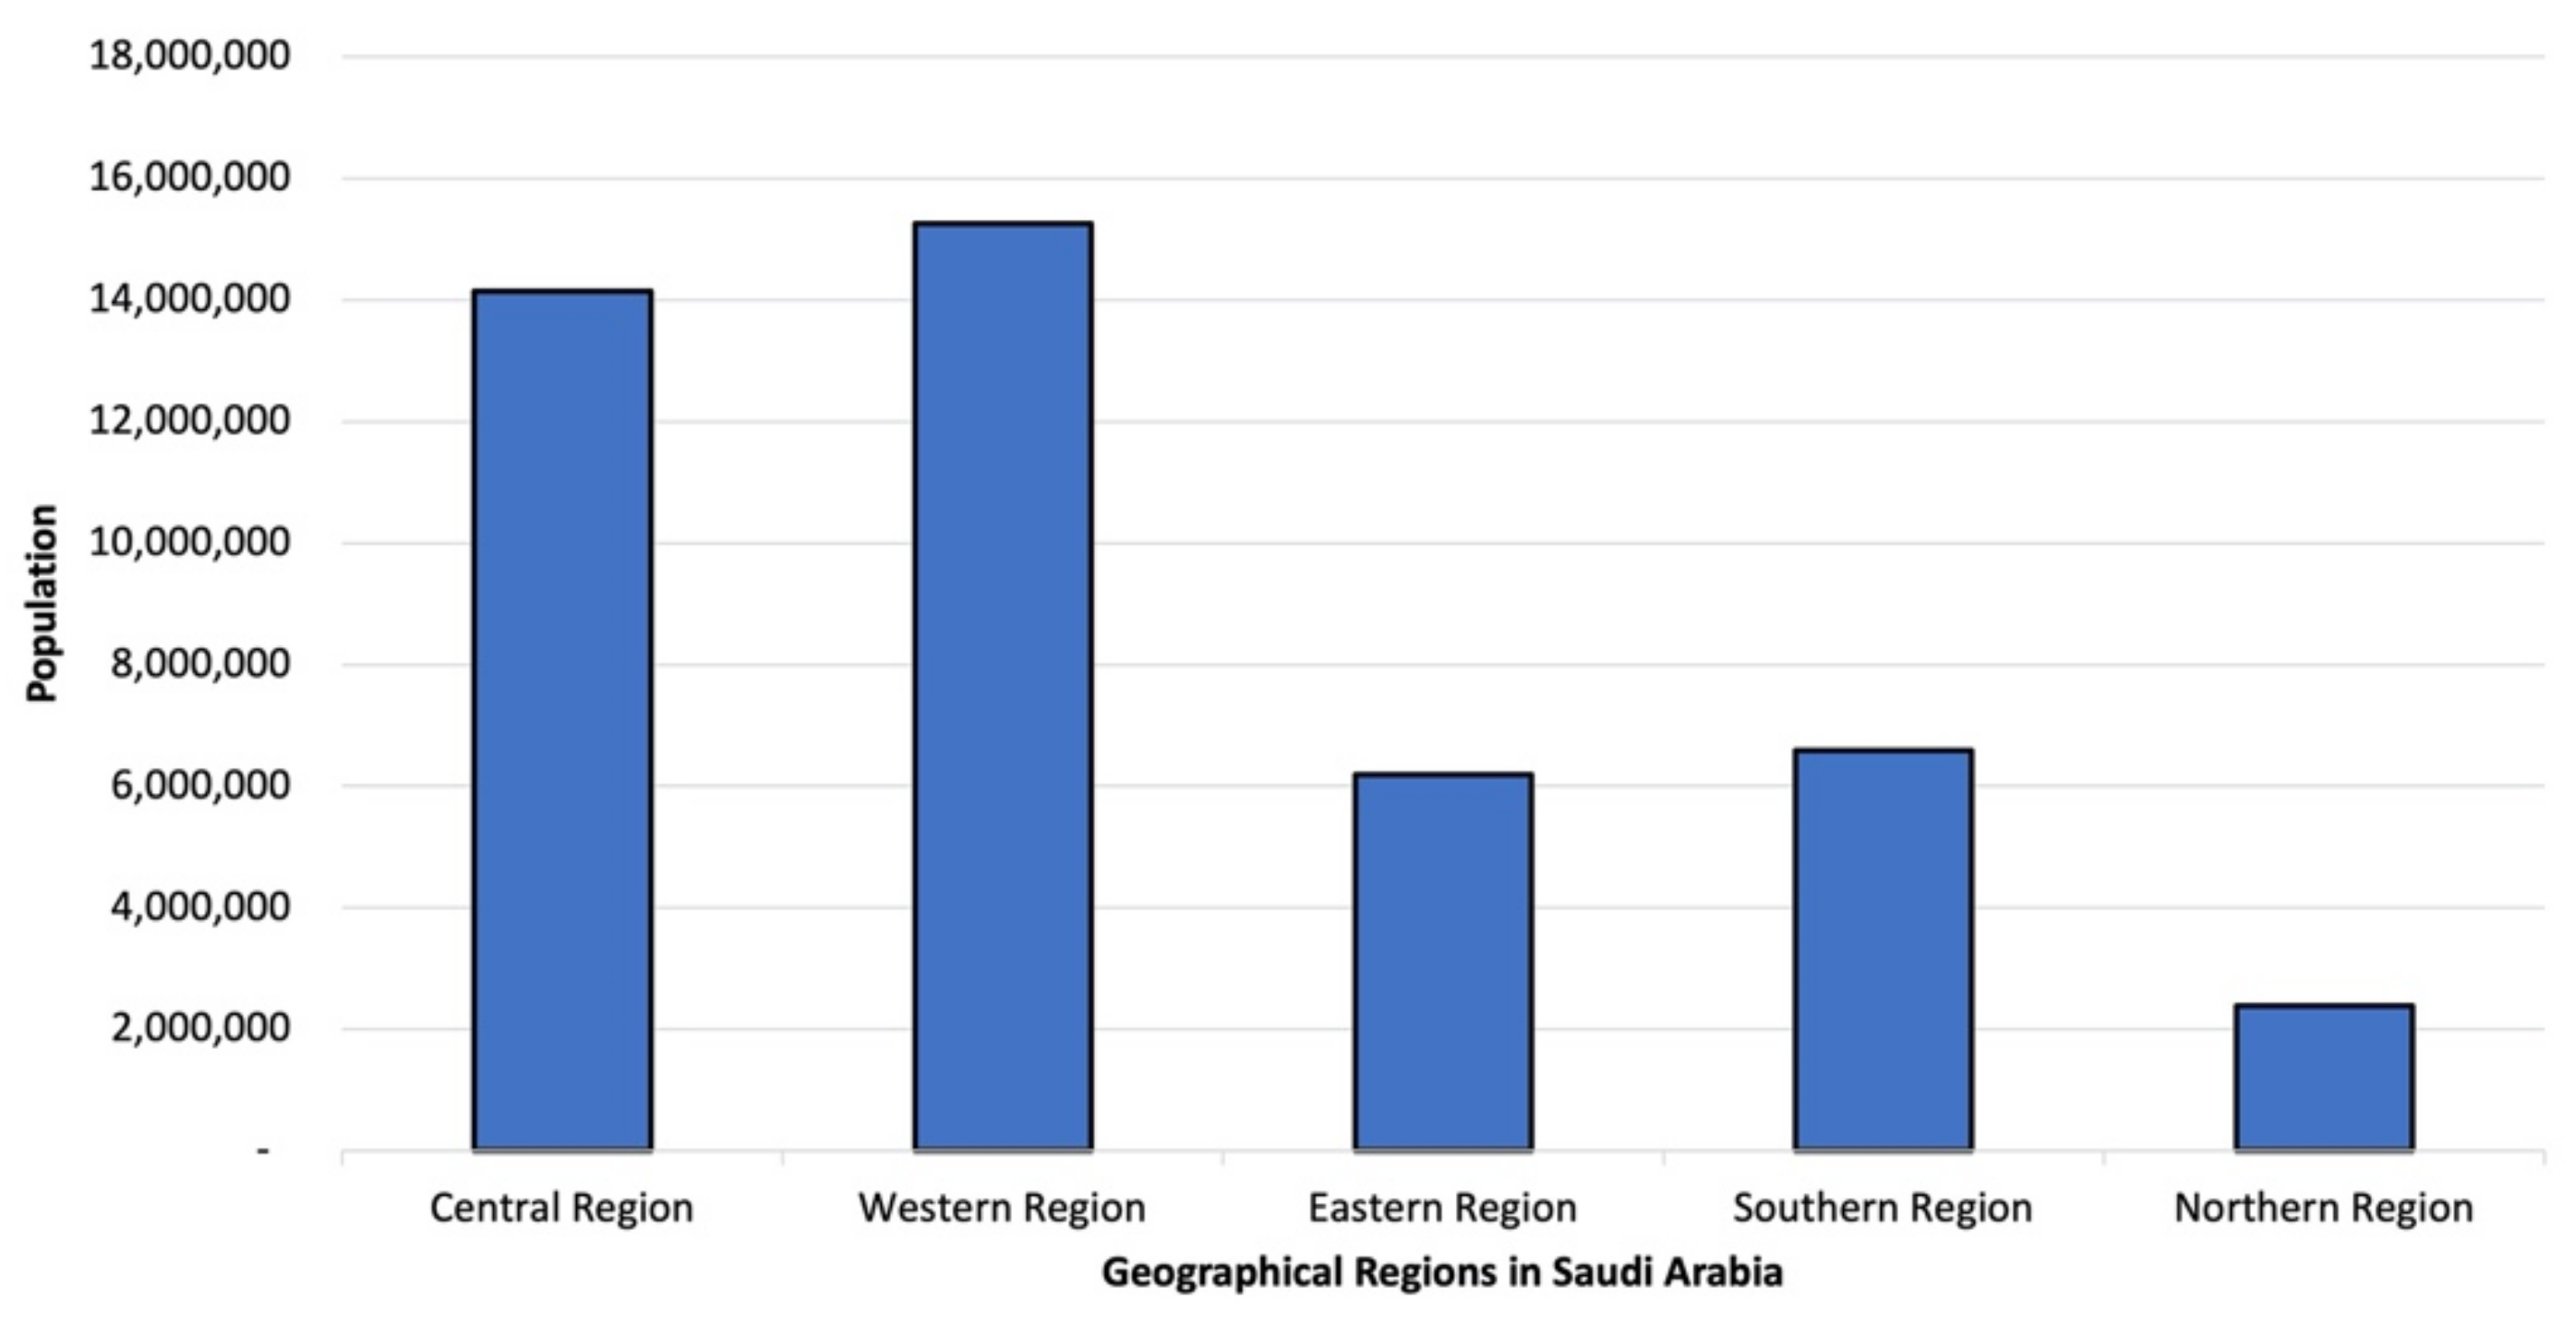
2.2.1. Study Area: Saudi Arabia

According to [4], the country is classified into five geographical regions: Central, Western, Southern, Northern, and Eastern. These five regions are divided into 13 administrative regions based on the government structure [25]. Where major administrative regions in the Central Region are Riyadh, Qassim, and Hail; the Western Region contains Makkah and AlMadena; the Southern Region contains Asir, Jazan, Najran, and AlBaha; the Northern Region contains Tabouk, AlJouf, and the Northern Borders; and finally, the Eastern Region contains Dammam, Alkhouber, and Dharan. In Saudi Arabia, the temperature variation range from 27 °C to 43 °C in the inland areas and 27 °C to 38 °C in coastal areas during summer. In the winter, the temperatures in the interior parts of Saudi Arabia range between 8 °C to 20 °C, while higher temperatures 19 °C to 29 °C have been reported in the coastal areas [26,27,28,29]. According to the statistic of the Saudi Arabian Commission, it is estimated that the Saudi population will grow to 44.5 million by 2050 compared to 34 million in 2019 [25]. The population growth rate is 2.58% yearly, according to the yearly change in the population prediction from 1955 to 2020 (explained in Appendix A).
The residential building distribution in Saudi Arabia depends on the population prediction, the population distribution in each geographical region, and the average household number size. It is estimated that Saudi Arabia will have 7,135,745 residential buildings by 2050, with an average size household number of 5.97 people according to the Saudi Arabia Statistic Commission in 2018 (General Authority for Statistics, 2018a), as described in Table 1 below.

2.2.2. Identification of National GHG Emissions Reduction Vision

The national policies, strategies, action plans, and programs related to energy and carbon emissions were reviewed through energy programs, smart meters, and smart grids by the King Abdullah City for Atomic and Renewable Energy (KACARE), the Ministry of Energy, Industry, and Mineral Resources (MEIM), the Energy Conservation and Awareness Department in MEIM, and the Saudi ARAMCO Carbon Management Division. Based on the review, the GHG emission reduction target was identified.

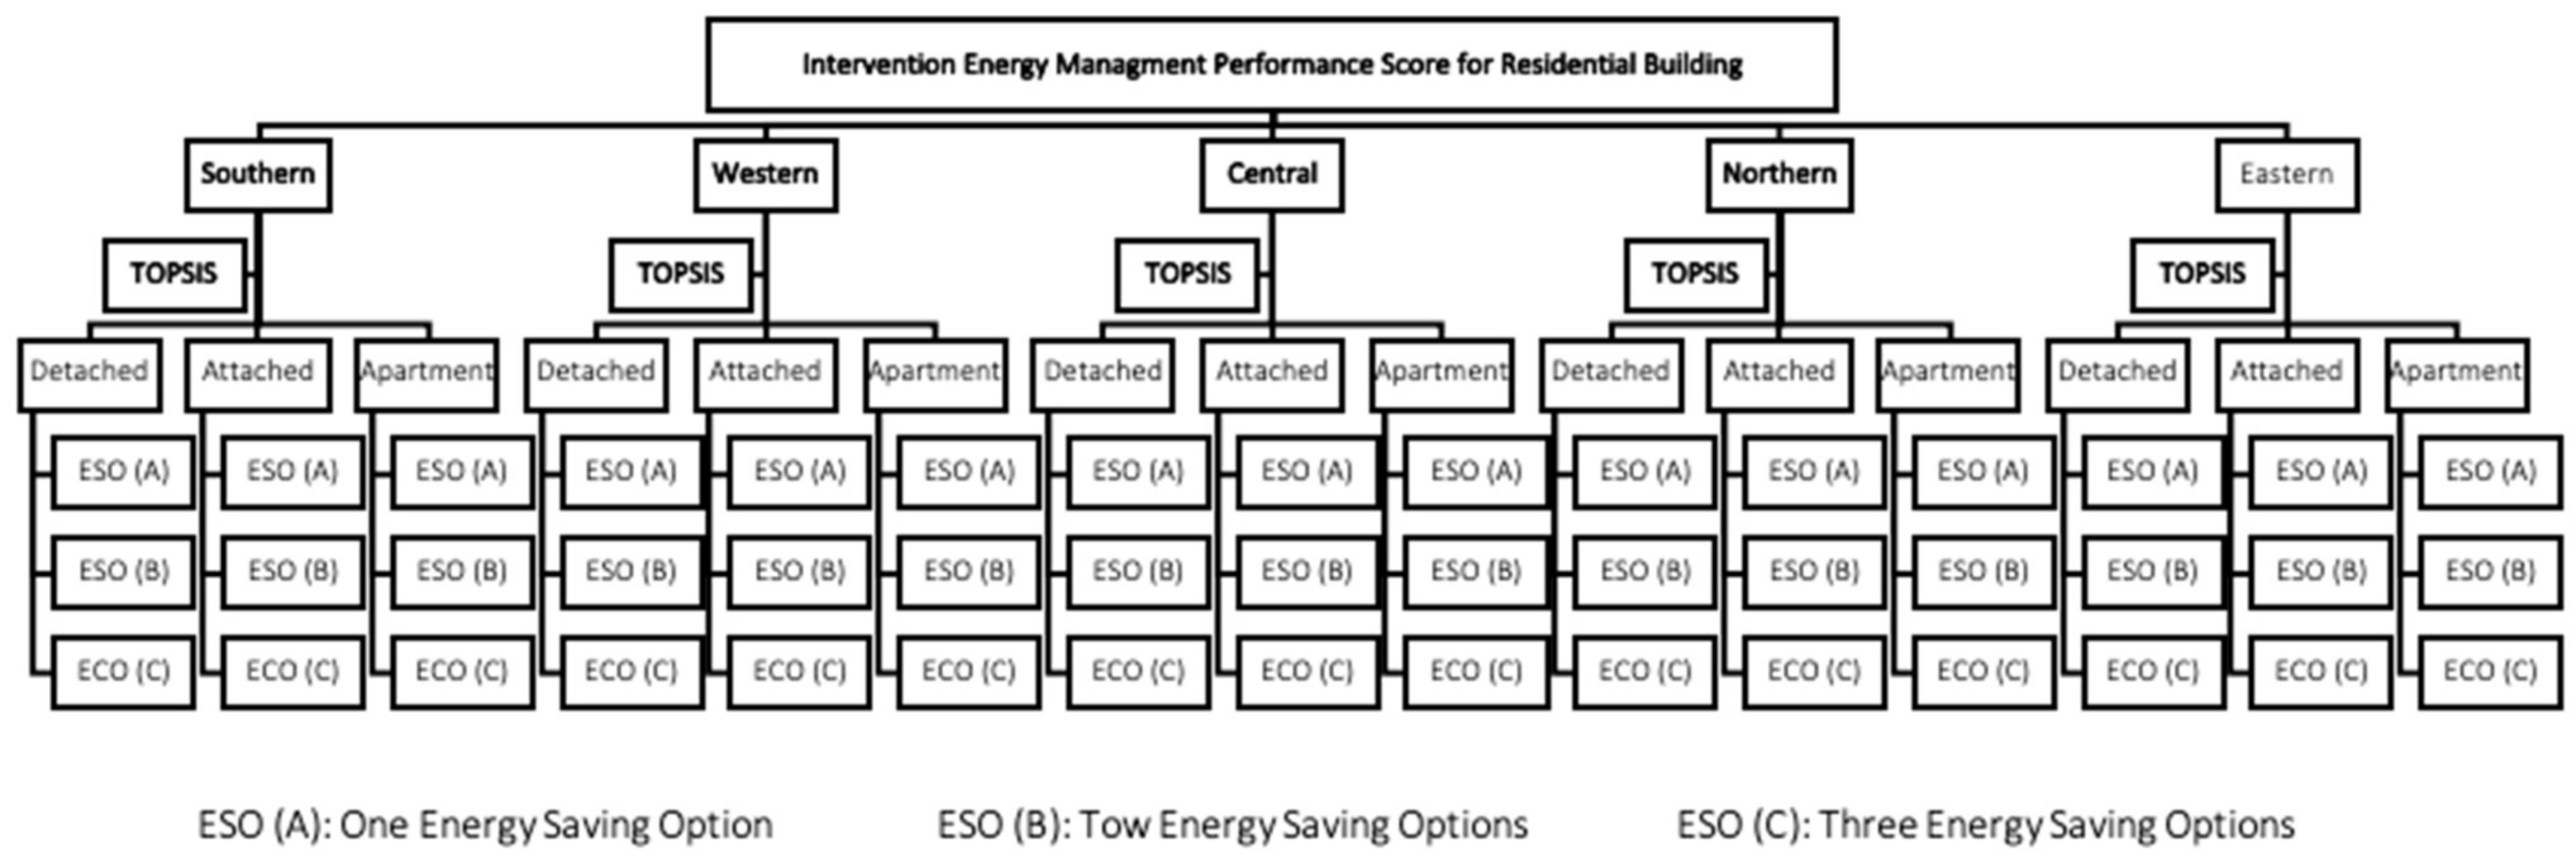
2.2.3. Communities’ Building Intervention Approach

Energy-Saving Options in Residential Building

The energy-saving options in the residential building are divided into three sections (i.e., design of the residential building, develop residential building energy modeling, and integration of intervention in the residential building energy modeling). The 2D design of the residential building was converted to a 3D design through Revit. The model was then developed considering the specific countries’ building code, structural decision, family size, local climate, and occupant behavior [4]. Finally, the integration of intervention in the residential building in the residential building energy modeling through applying a four common intervention: LED lighting, double-glazed window, triple-glazed window, and efficient split AC unit, in this research which considers 180 combinations that have to be processed for decision making [16].
The main three criteria in this research are energy use, carbon emissions, and total cost (cost of energy use and cost of investment intervention). Using the energy model, annual energy consumption was estimated. Based on the energy use, carbon emissions were estimated as the product of energy (electricity) use and GHG emission factor of electricity for each building and confirmed through LEAP. The total cost was estimated as the sum of energy cost and capital cost of interventions. The cost of energy and intervention was expressed in terms of the net present value (NPV), considering a period of 30 years. The electricity tariffs price for the residential sector and the rate of increase of electricity, and the calculation of net present value through average interest rate for the investment in the country. The cost of the capital investment in Energy Saving Options (ESOs) in different buildings was calculated [16]. Moreover, the MCDA was applied to evaluate the combined complexity of ESOs to define the ideal solution that suites the residential building.

Ranking Energy Interventions Using TOPSIS

TOPSIS was used to evaluate the energy consumption, GHG emissions, energy cost during the operational phase, and the cost of energy intervention (EI) in each selected geographical region in Saudi Arabia. It is a widely used method of multi-criteria decision-making. It is the method to identify the best ESO/intervention combinations of existing and newly constructed residential buildings for the next 30 years, with classified Energy Saving Option with One-ESO combination referred to as ESO (A), Energy Saving Option with Two-ESO combinations referred to as ESO (B), and Energy Saving Option with Three-ESO combinations referred to as ESO (c)) as explained in Figure 3.

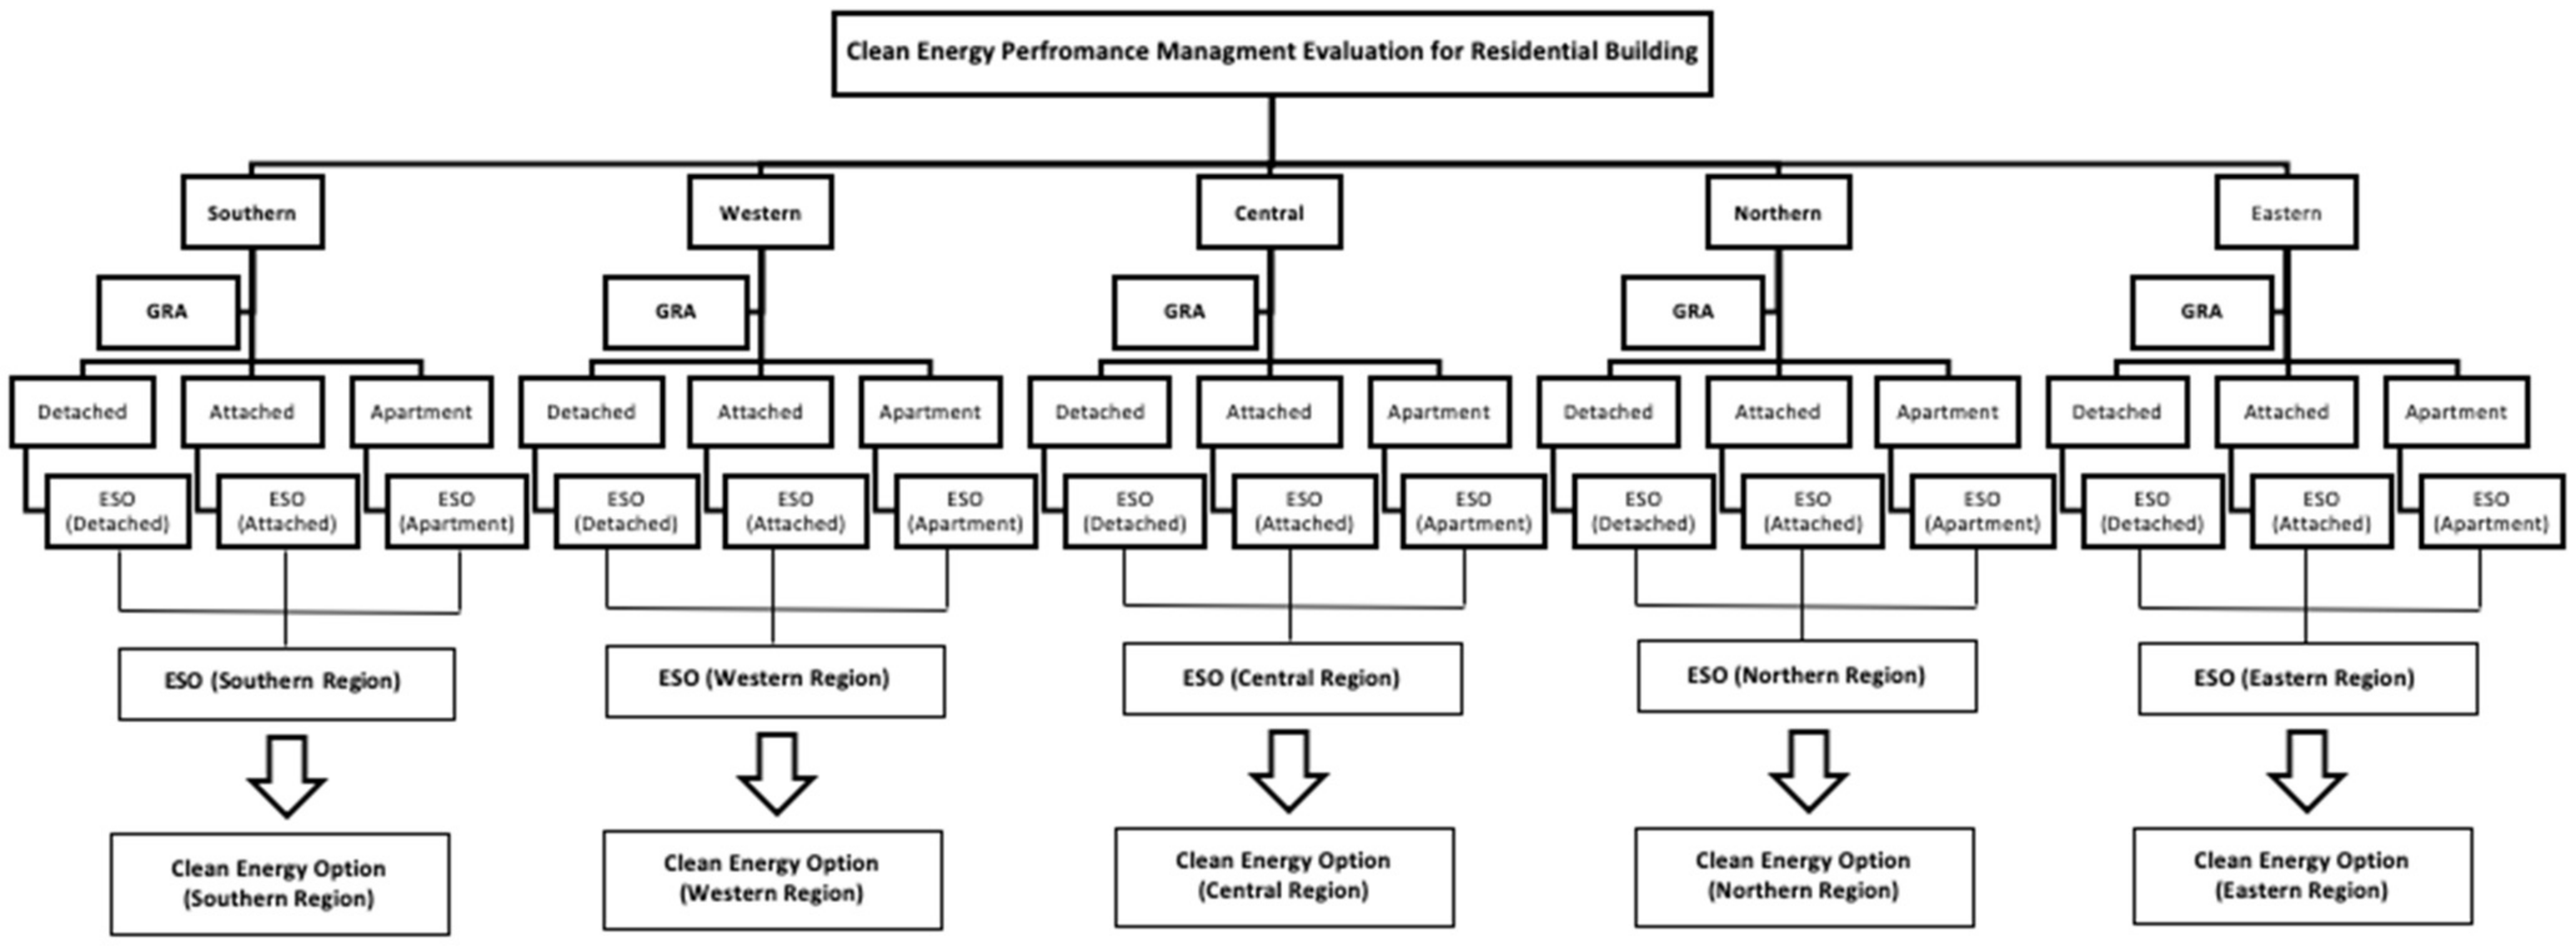
2.2.4. Government’s Clean Energy Approach

Clean Energy Options in Residential Building

The selected renewable energy systems depend on the load to be covered every hour for one year. The clean energy options should also meet cost-effectiveness (i.e., if minimum cost is considered an optimum configuration). This study has been located in five geographical regions in Saudi Arabia: the Southern, Western, Central, Northern, and Eastern regions.
In this research, the photovoltaic module is BP350 for $350 [30]. The solar panel technical specifications in terms of the solar panel wattage required for energy demand is 50. The nominal voltage of the battery in the solar panel (Vnominal) is 12 V; maximum power point (Vmp) is about 17.5 V; maximum power point (Imp) is about 2.9 A; the open-circuit voltage (Voc) is 21.8 V; and the short circuit current (Isc) is 3.17 A (bp Solar, 2020). The wind turbine module is BWCXL 1000, with a power rate of 1000 W and a cost of $2500. The technical specifications of the selected wind turbine are as follows: wind turbine cut-in speed (Vci) is about 2.5 m/s; and wind turbine cut-out speed (Vr) is about 11 m/s [21].
The storage system considered is either a battery bank or fuel cell and hydrogen tank. The specification of the battery is Concorde (PVX-2120L), with a cost of $465 [31]. Similarly, the initial capital cost is 3000 $/kW for fuel cells, and for hydrogen tank the initial capital cost is 1500 $/kg. The initial capital cost is 1000 $/kW required for either battery bank or fuel cell and hydrogen tank [21].

Weighting Scenarios

Two scenarios were defined: pro-economic and pro-environmental scenarios for the generation of the weights of energy consumption, GHG emissions, and cost using AHP. The pro-economic scenario considers the order of criteria importance as cost> GHG > Energy, whereas the pro-environmental scenario considers the order of criteria importance as energy > GHG > Cost. The pro-environmental scenario is in agreement with the performances of large residential buildings, where cost may not be the deciding variable in overall improvements [16]. Thus, since the comparisons are performed through export consultation or subjective judgments, some inconsistencies can be achieved. The resulting matrix (n) in the random index (RI) of AHP is 3, and RI has been calculated to be 0.58. Thus, the consistency ratio (CR) in both scenarios is <10% to ensure reasonable consistency of pairwise comparisons and ensure the judgments are consistent. Additionally, these weighting scenarios were applied to the Building Intervention Approach and Clean Energy Approach. Their specific weights were generated as shown in Table 2 and described in Figure 4.

Ranking Clean Energy Alternatives Using GRA

The clean energy alternative (CEA) was ranked using GRA after obtaining the required data from the energy model. The government’s clean energy approach depends on integrating ideal ESO analysis with a clean energy system chosen in this research, as shown in Figure 5. Figure 5 also describes the evaluation of energy, GHG emissions, and total cost to find the best ESO in each region and define the best clean energy technology system based on a selected set of ESO combinations and clean energy replacement investment in the gird to reach the GHG emissions target through applying the grey relation analysis technique.

3. Results and Discussion

3.1. Saudi Arabia’s GHG emissions Reduction Visions and Initiatives

3.1.1. GHG Emissions Reduction Vision

The nature of world cooperation to address climate change and its effects has been evolving since the 2015 Paris Agreement. The Paris Agreement represents a decentralized approach by embedding national carbon reduction goal visions towards an international framework to embrace collective action based on Nationally Determined Contributions (NDC) system in Saudi Arabia to identify its challenges and opportunities [32].
The NDC initiative was proposed to avoid carbon emissions by reforming energy and economic policies by supporting policy adaptation and accelerating economic diversification. Thus, the NDC department’s goal is to cut 130 million tons of CO2e emission by 2030. However, GHG emissions will rise by 70% with current economic and energy policies (i.e., above levels reported in 2015) [33]. Historically, the Kyoto Protocol insured 14% of global greenhouse gases (GHGs) reductions through a top-down approach [34]. This shortage falls substantially below the global GHG emissions reduction target in the Paris Agreement. After the Paris Agreement, Saudi Arabia has taken the following actions to mitigate GHG gases [35]:
  • In December 2017, it was reported that the country planned to minimize the fossil fuel subsidy to enhance the economy;
  • The National Renewable Energy Plan; Saudi Arabia is taking action to grow renewable electricity generation. The country has invested US$30bn to US$50bn in clean energy actions since 2017;
  • In 2018, the Saudi government took actions in the free market for importing electric vehicles and regulating light-duty vehicles.
The country’s GDP per capita is $52,227, which is higher by $20,790 than most G20 countries [35]. The Human development index in Saudi Arabia is 0.85, which is very high compared to G20 countries [36]. Furthermore, Saudi Arabia lags in fossil fuel subsidies by $29.66 billion in 2016 compared to the $7.87 billion average of other G20 countries. The country has low performance in renewable energy in power generation (almost 0% compare to the 24% with G20 countries). Additionally, the transport emission per capita (tCO2/capita) is 4.03 comparing to 1.13 average of G20 countries [35]. In 2015 the GHG emissions almost quadrupled (276%) to reach 643 MtCO2e. Thus, the GHG emissions per capita in Saudi Arabia are one of the highest for all G20 countries (20.1 tCO2e/capita to 8 tCO2e/capita G2 average) [35].

3.1.2. Energy Consumption Behavior and Energy-Saving Initiatives

According to the Carbon Dioxide Information Analysis Center, the CO2 emissions from fossil fuels in Saudi Arabia are about 118 million metric tons [37,38]. In 1990, the carbon dioxide emissions were 172.85 million tons, increasing to 625 million tons in 2018 mainly from fossil fuel products and industrial operations [3]. Saudi Arabia’s total energy consumption from fossil fuels was estimated at around 150 terawatt hour and 121 terawatt hour from natural gas [39]. Saudi Arabia aims to reduce carbon emission to 130 million tons of carbon dioxide or its equivalent [40].
The energy demand for the residential sector in Saudi Arabia is increasing, caused largely by population growth and the building of new communities. For instance, in 2017 it was reported that 70% of the total energy required for the residential sector in Saudi Arabia goes to the cooling systems (i.e., for the widespread use of air conditioning), which accounts for about 143 thousand GWh (equivalent to 30,000 M tons of CO2e) [4]. Table 3 defines the current energy-saving initiatives pursued in Saudi Arabia.

3.1.3. Carbon Capture, Utilization, and Storage (CCUS)

Several research and development initiatives have been considered in Saudi Arabia to reduce carbon dioxide emissions from industrial sources. The initiatives contribute to enhancing the national capacity of GHG emissions reduction trending as explained in following Table 4 and Appendix B.

3.2. Community Contribution: A Building Intervention Approach

3.2.1. Existing National Energy-Saving Regulation and Policy Actions

Initiatives have been introduced to lower energy demand through promoting and modifying energy efficiency standards and the design and structure of residential building. The table in Appendix D describes various essential aspects in regulating a framework for energy management and actions taken in the power generation sector, petroleum and petrochemical sector, and energy efficiency adaptation in the residential sector. These initiatives and their actions have limited resources (e.g., some are time consuming, use many resources, and need considerable funding, as explained in Appendix D).

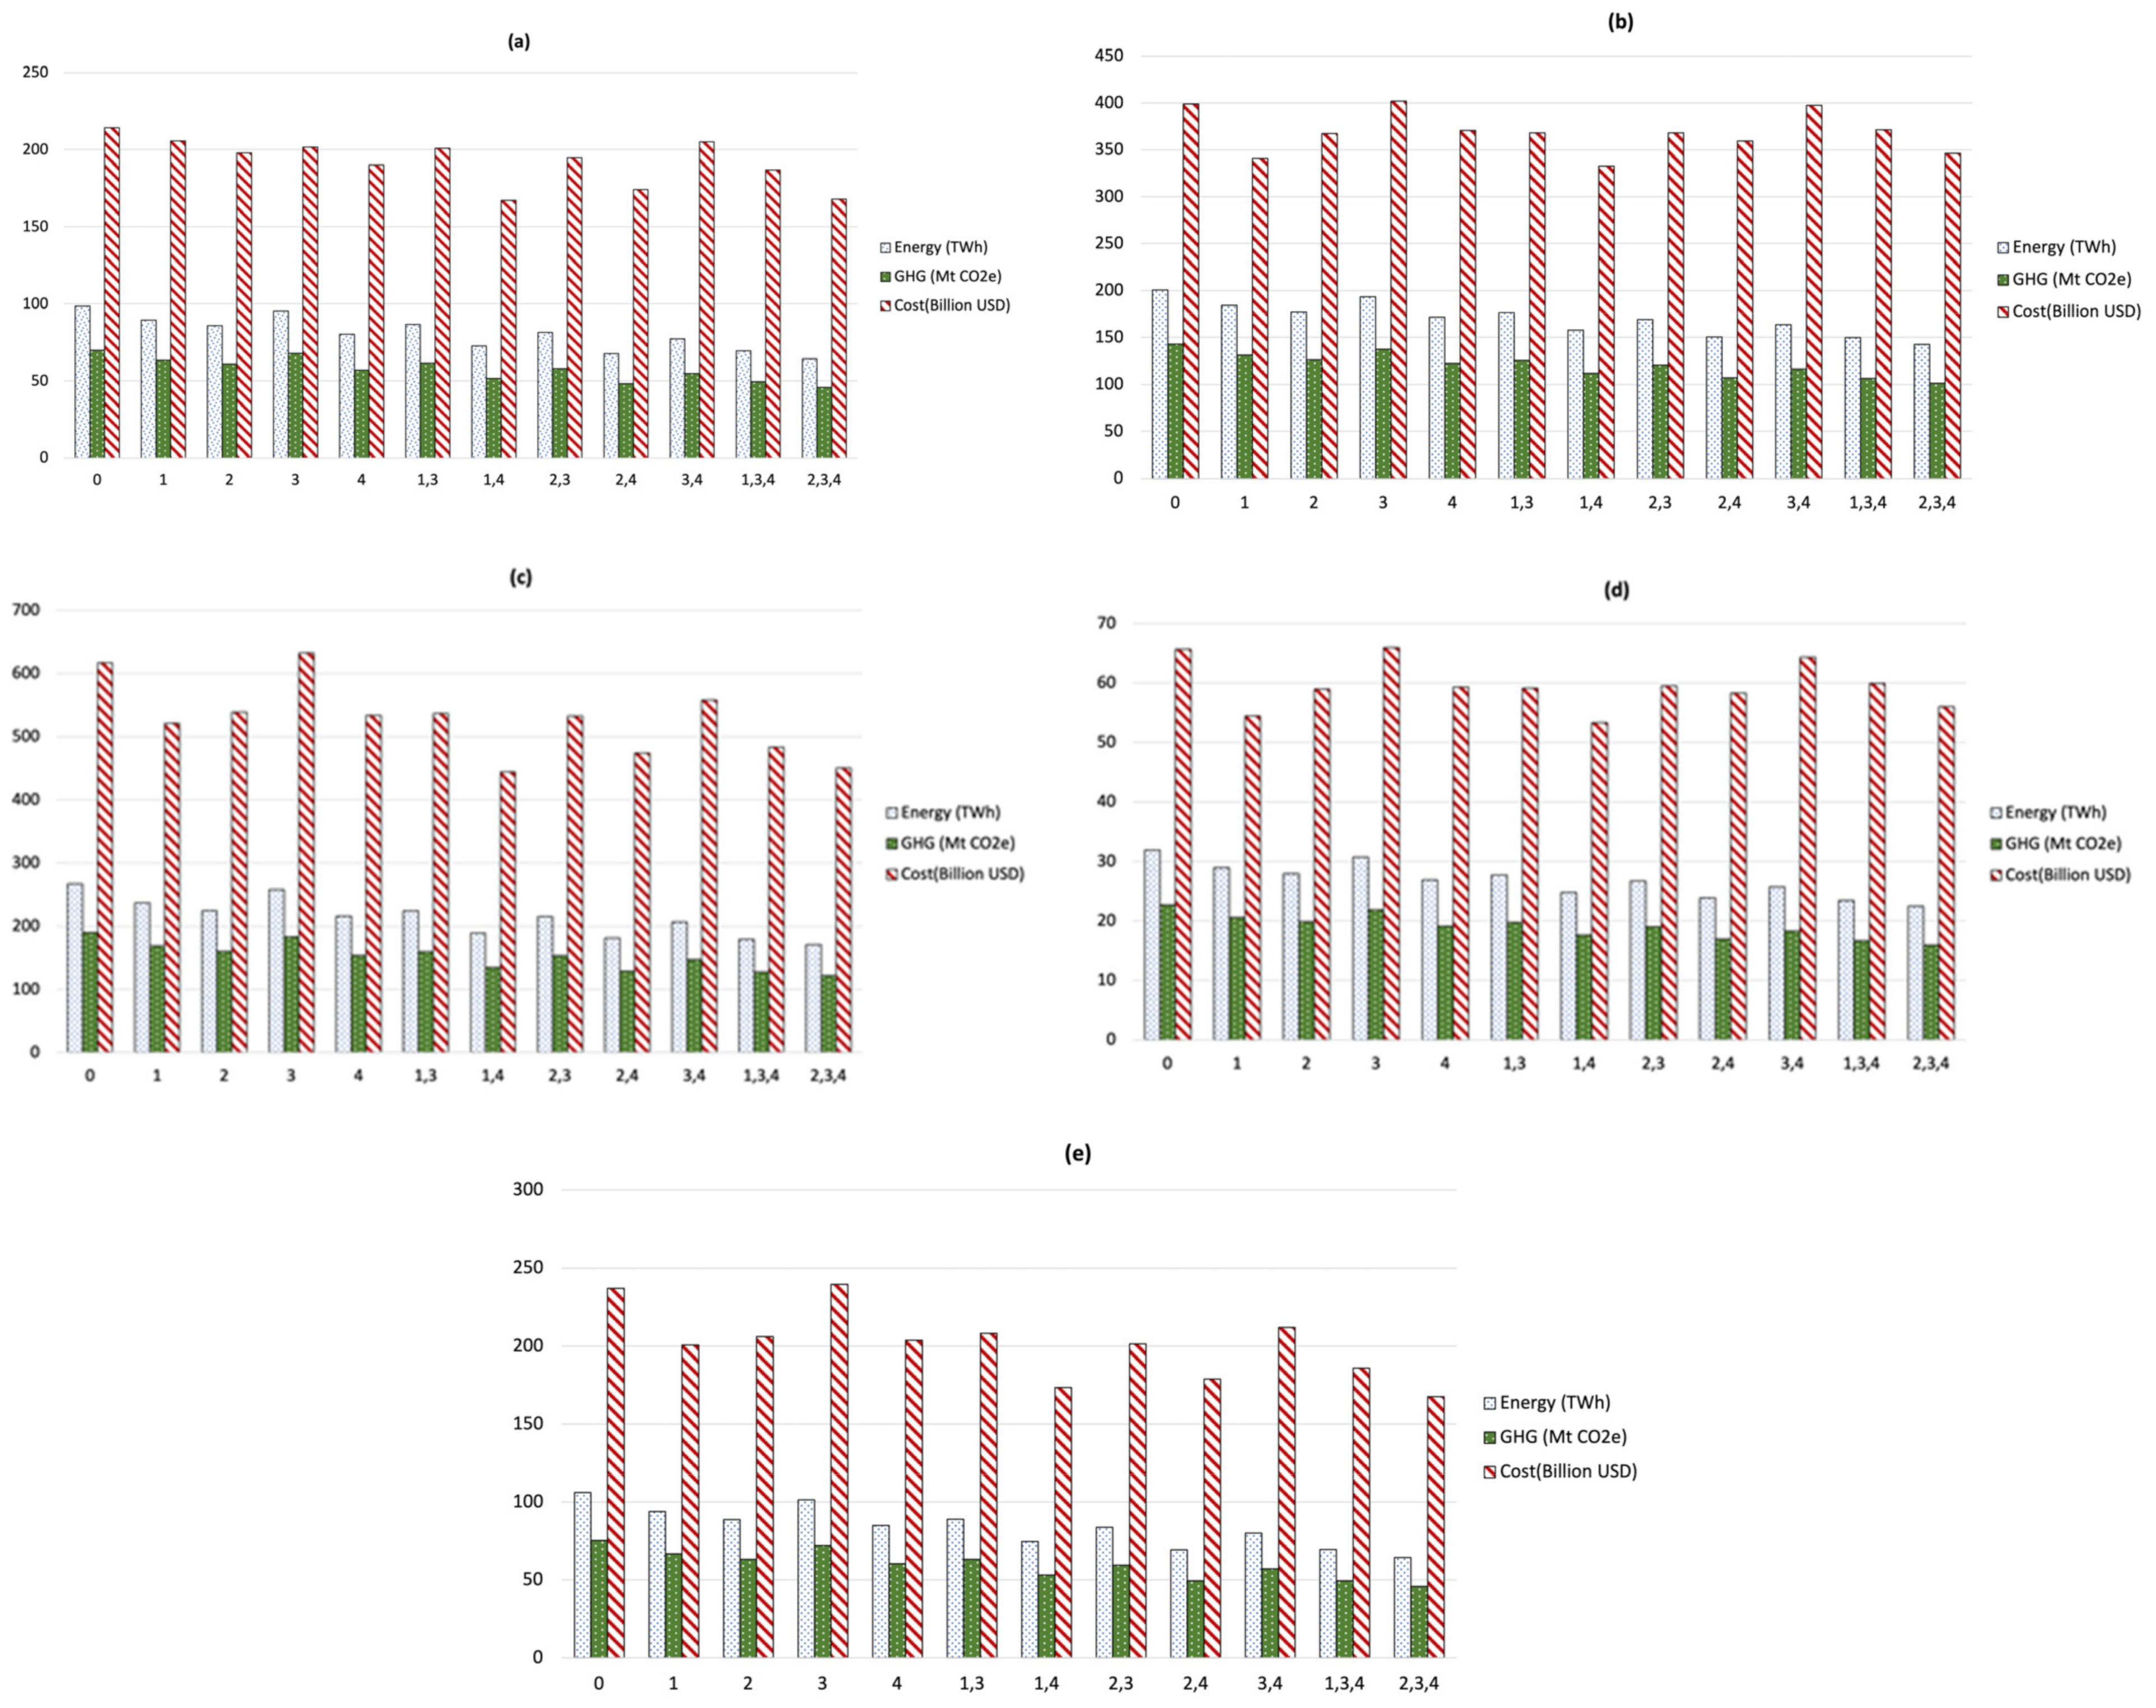
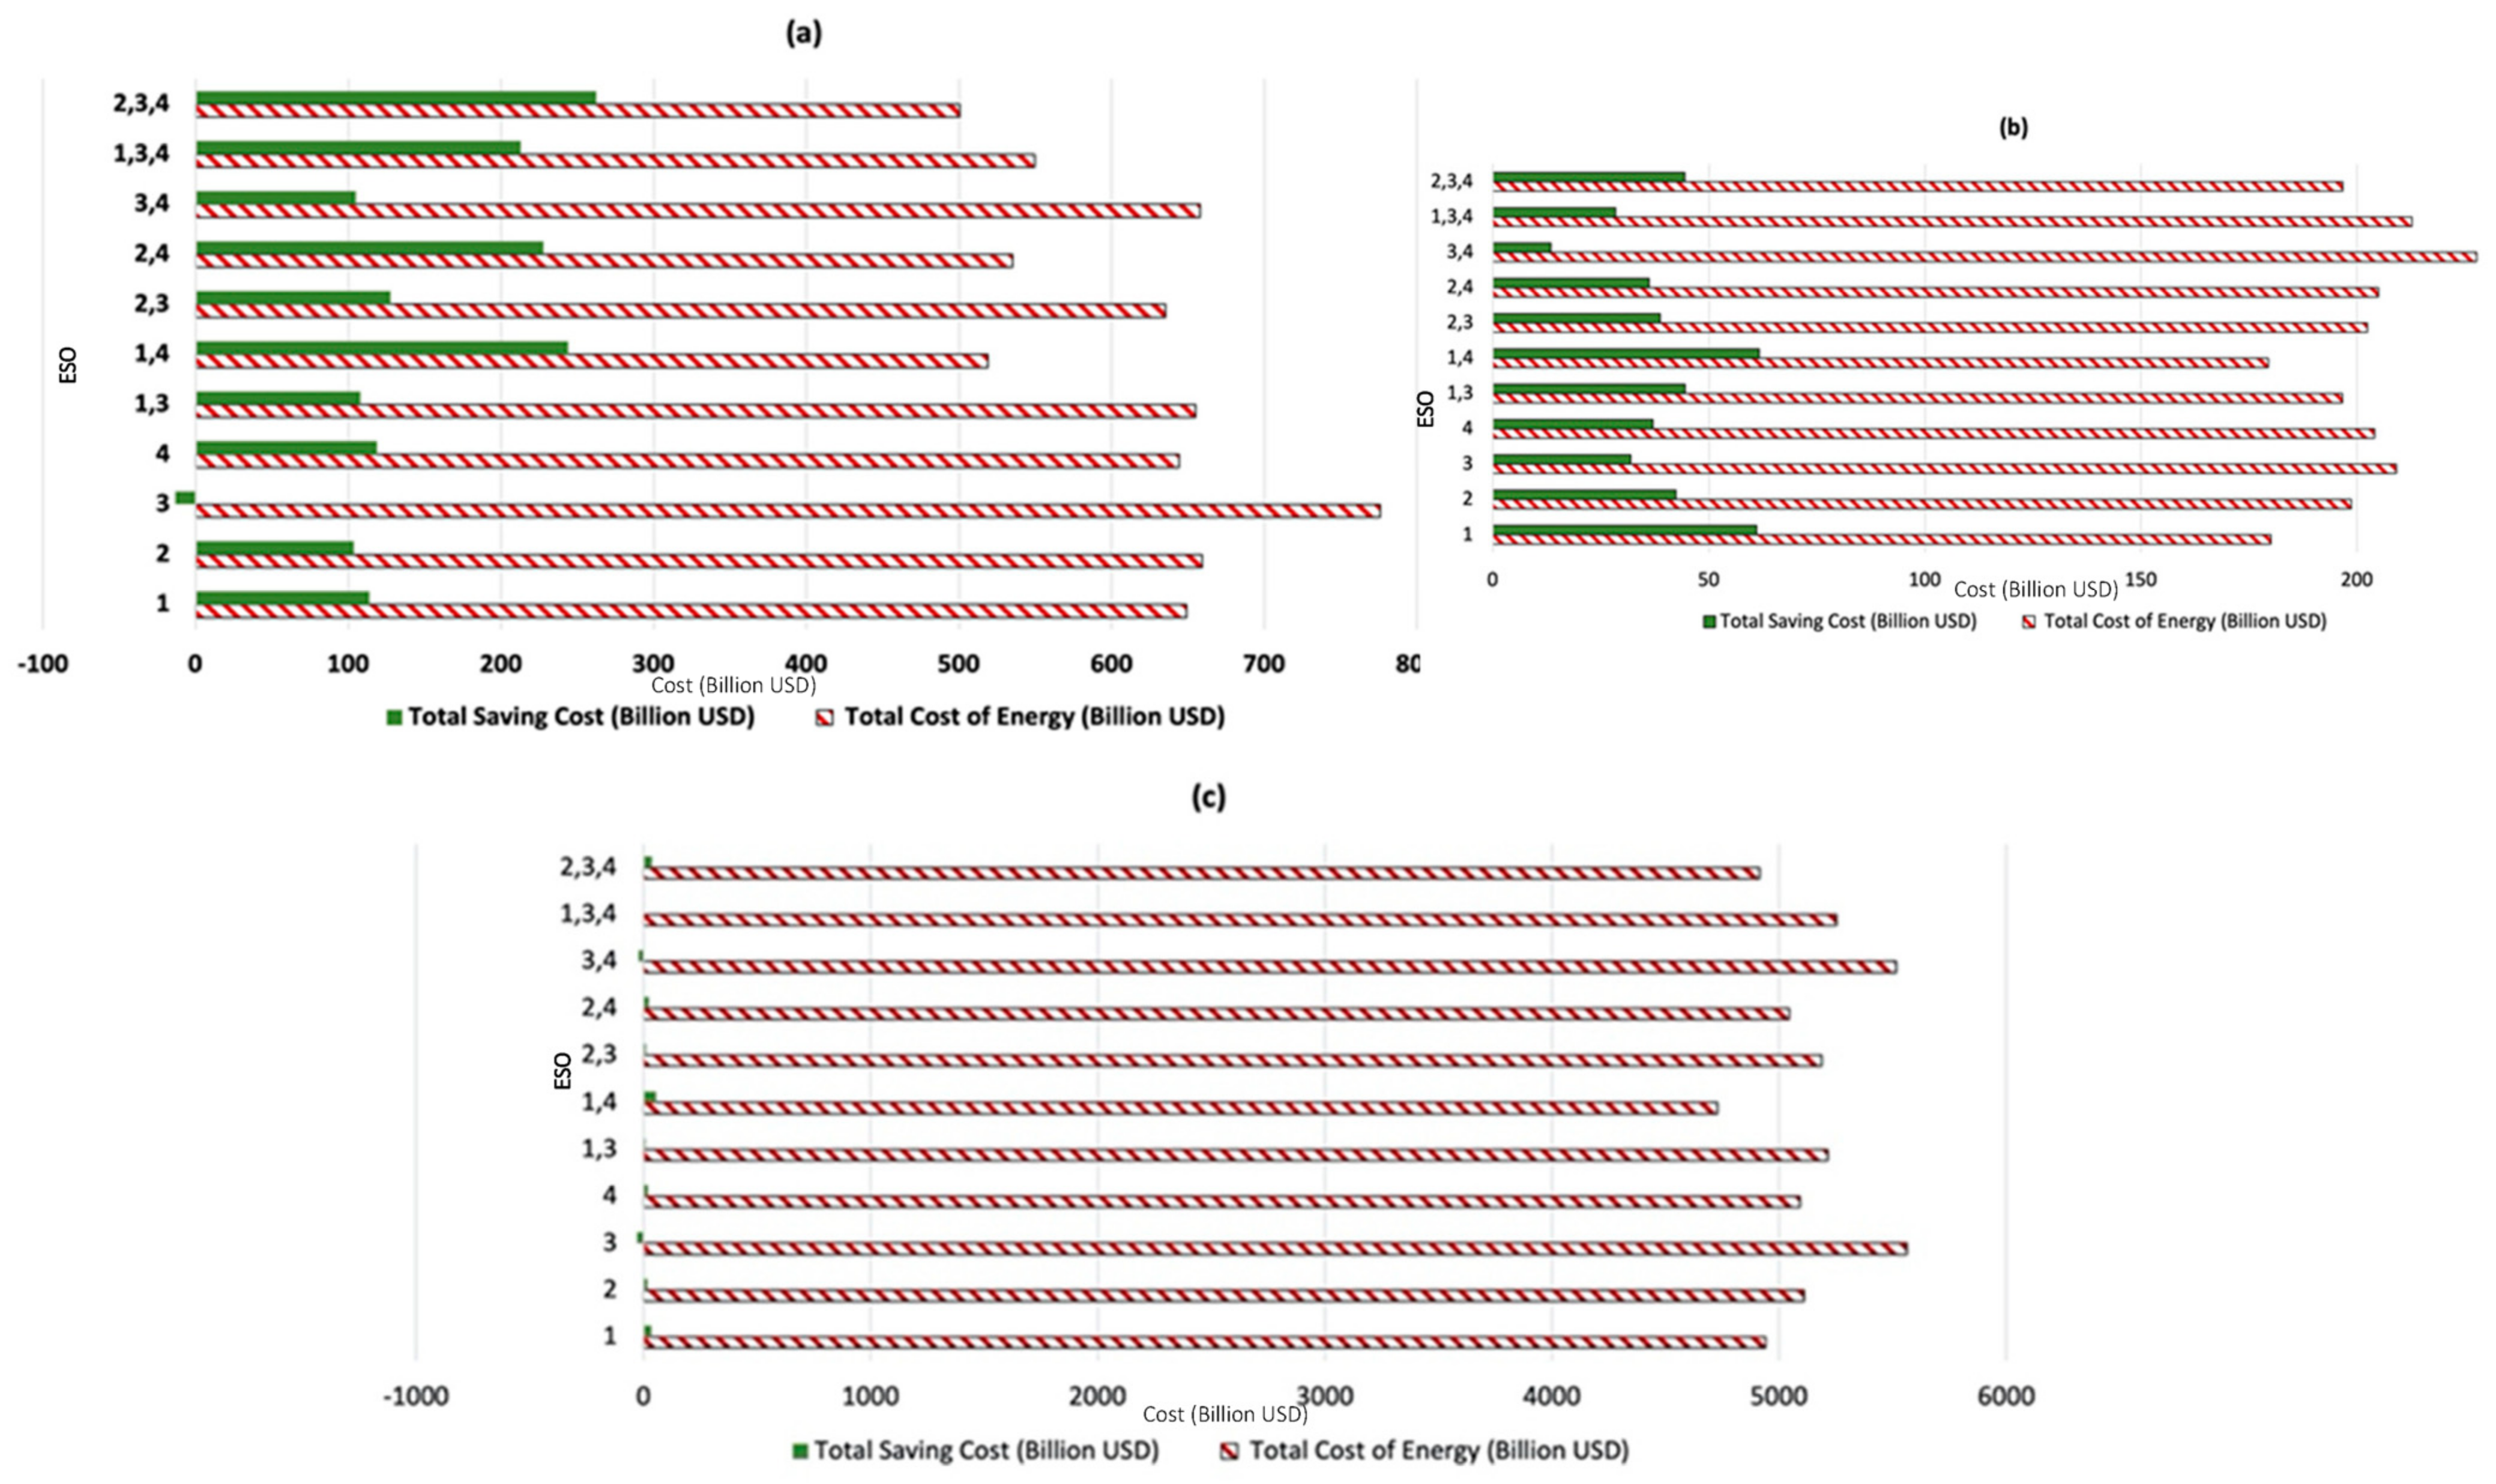
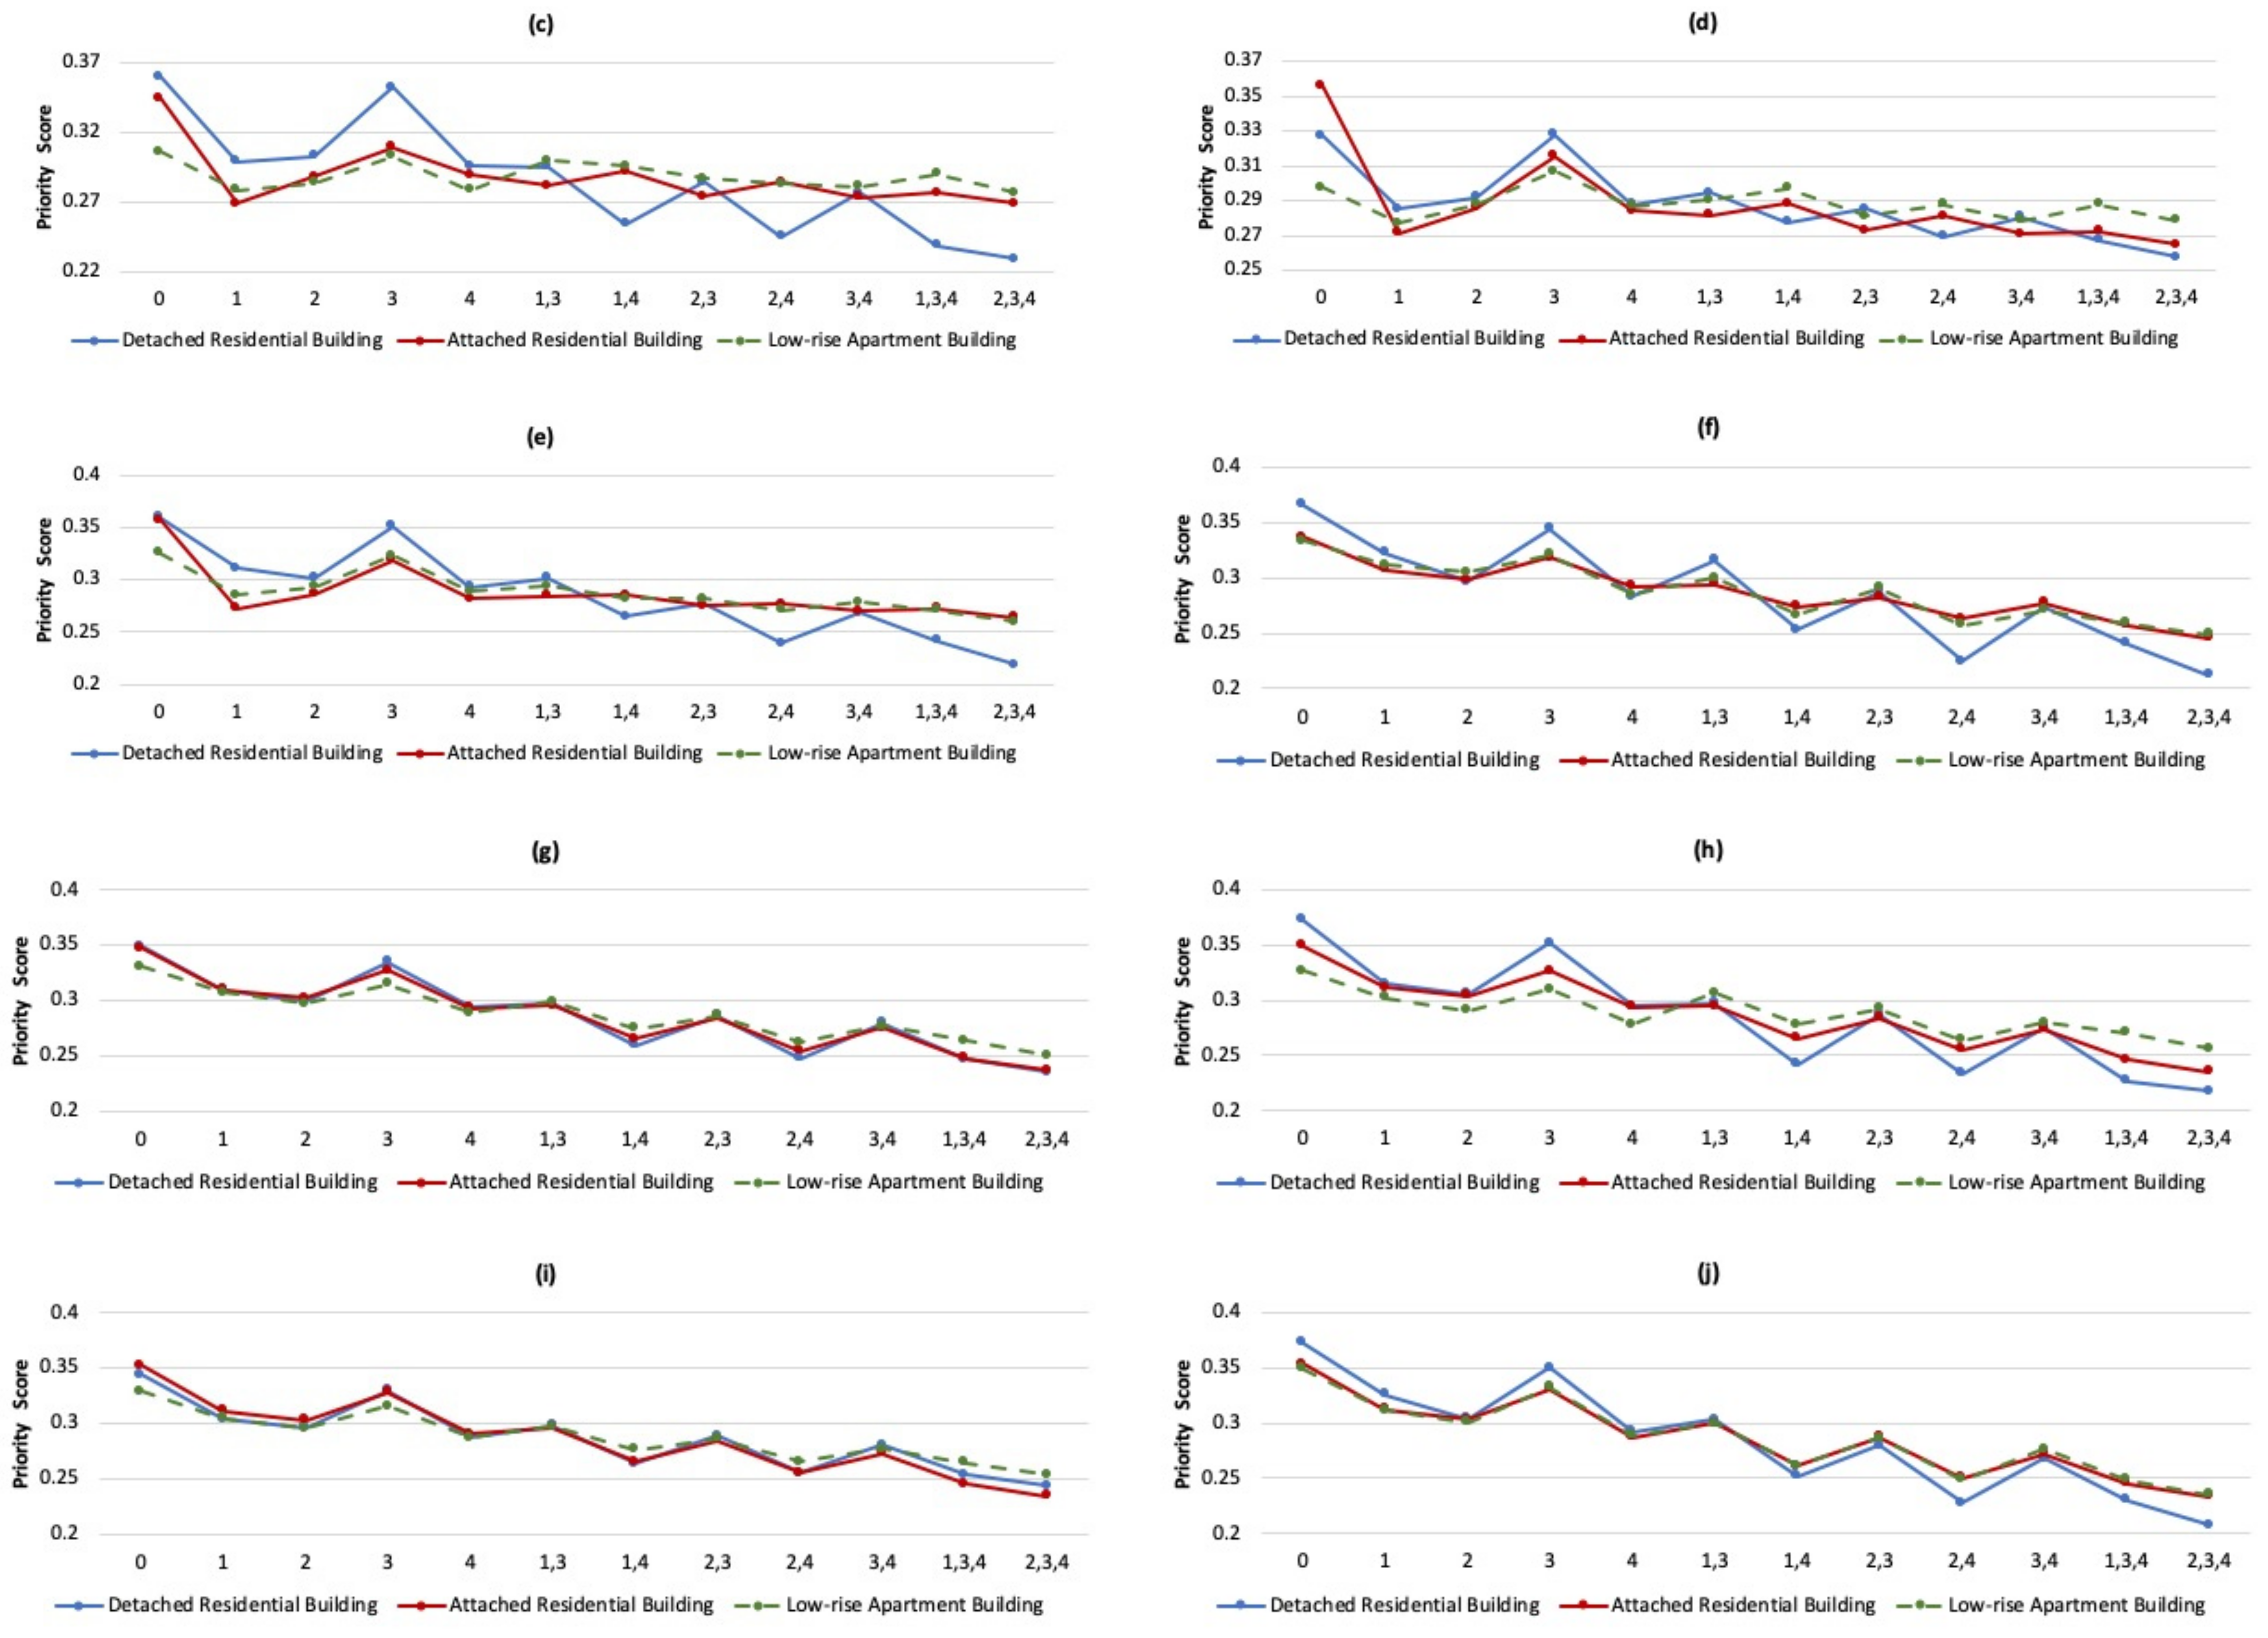
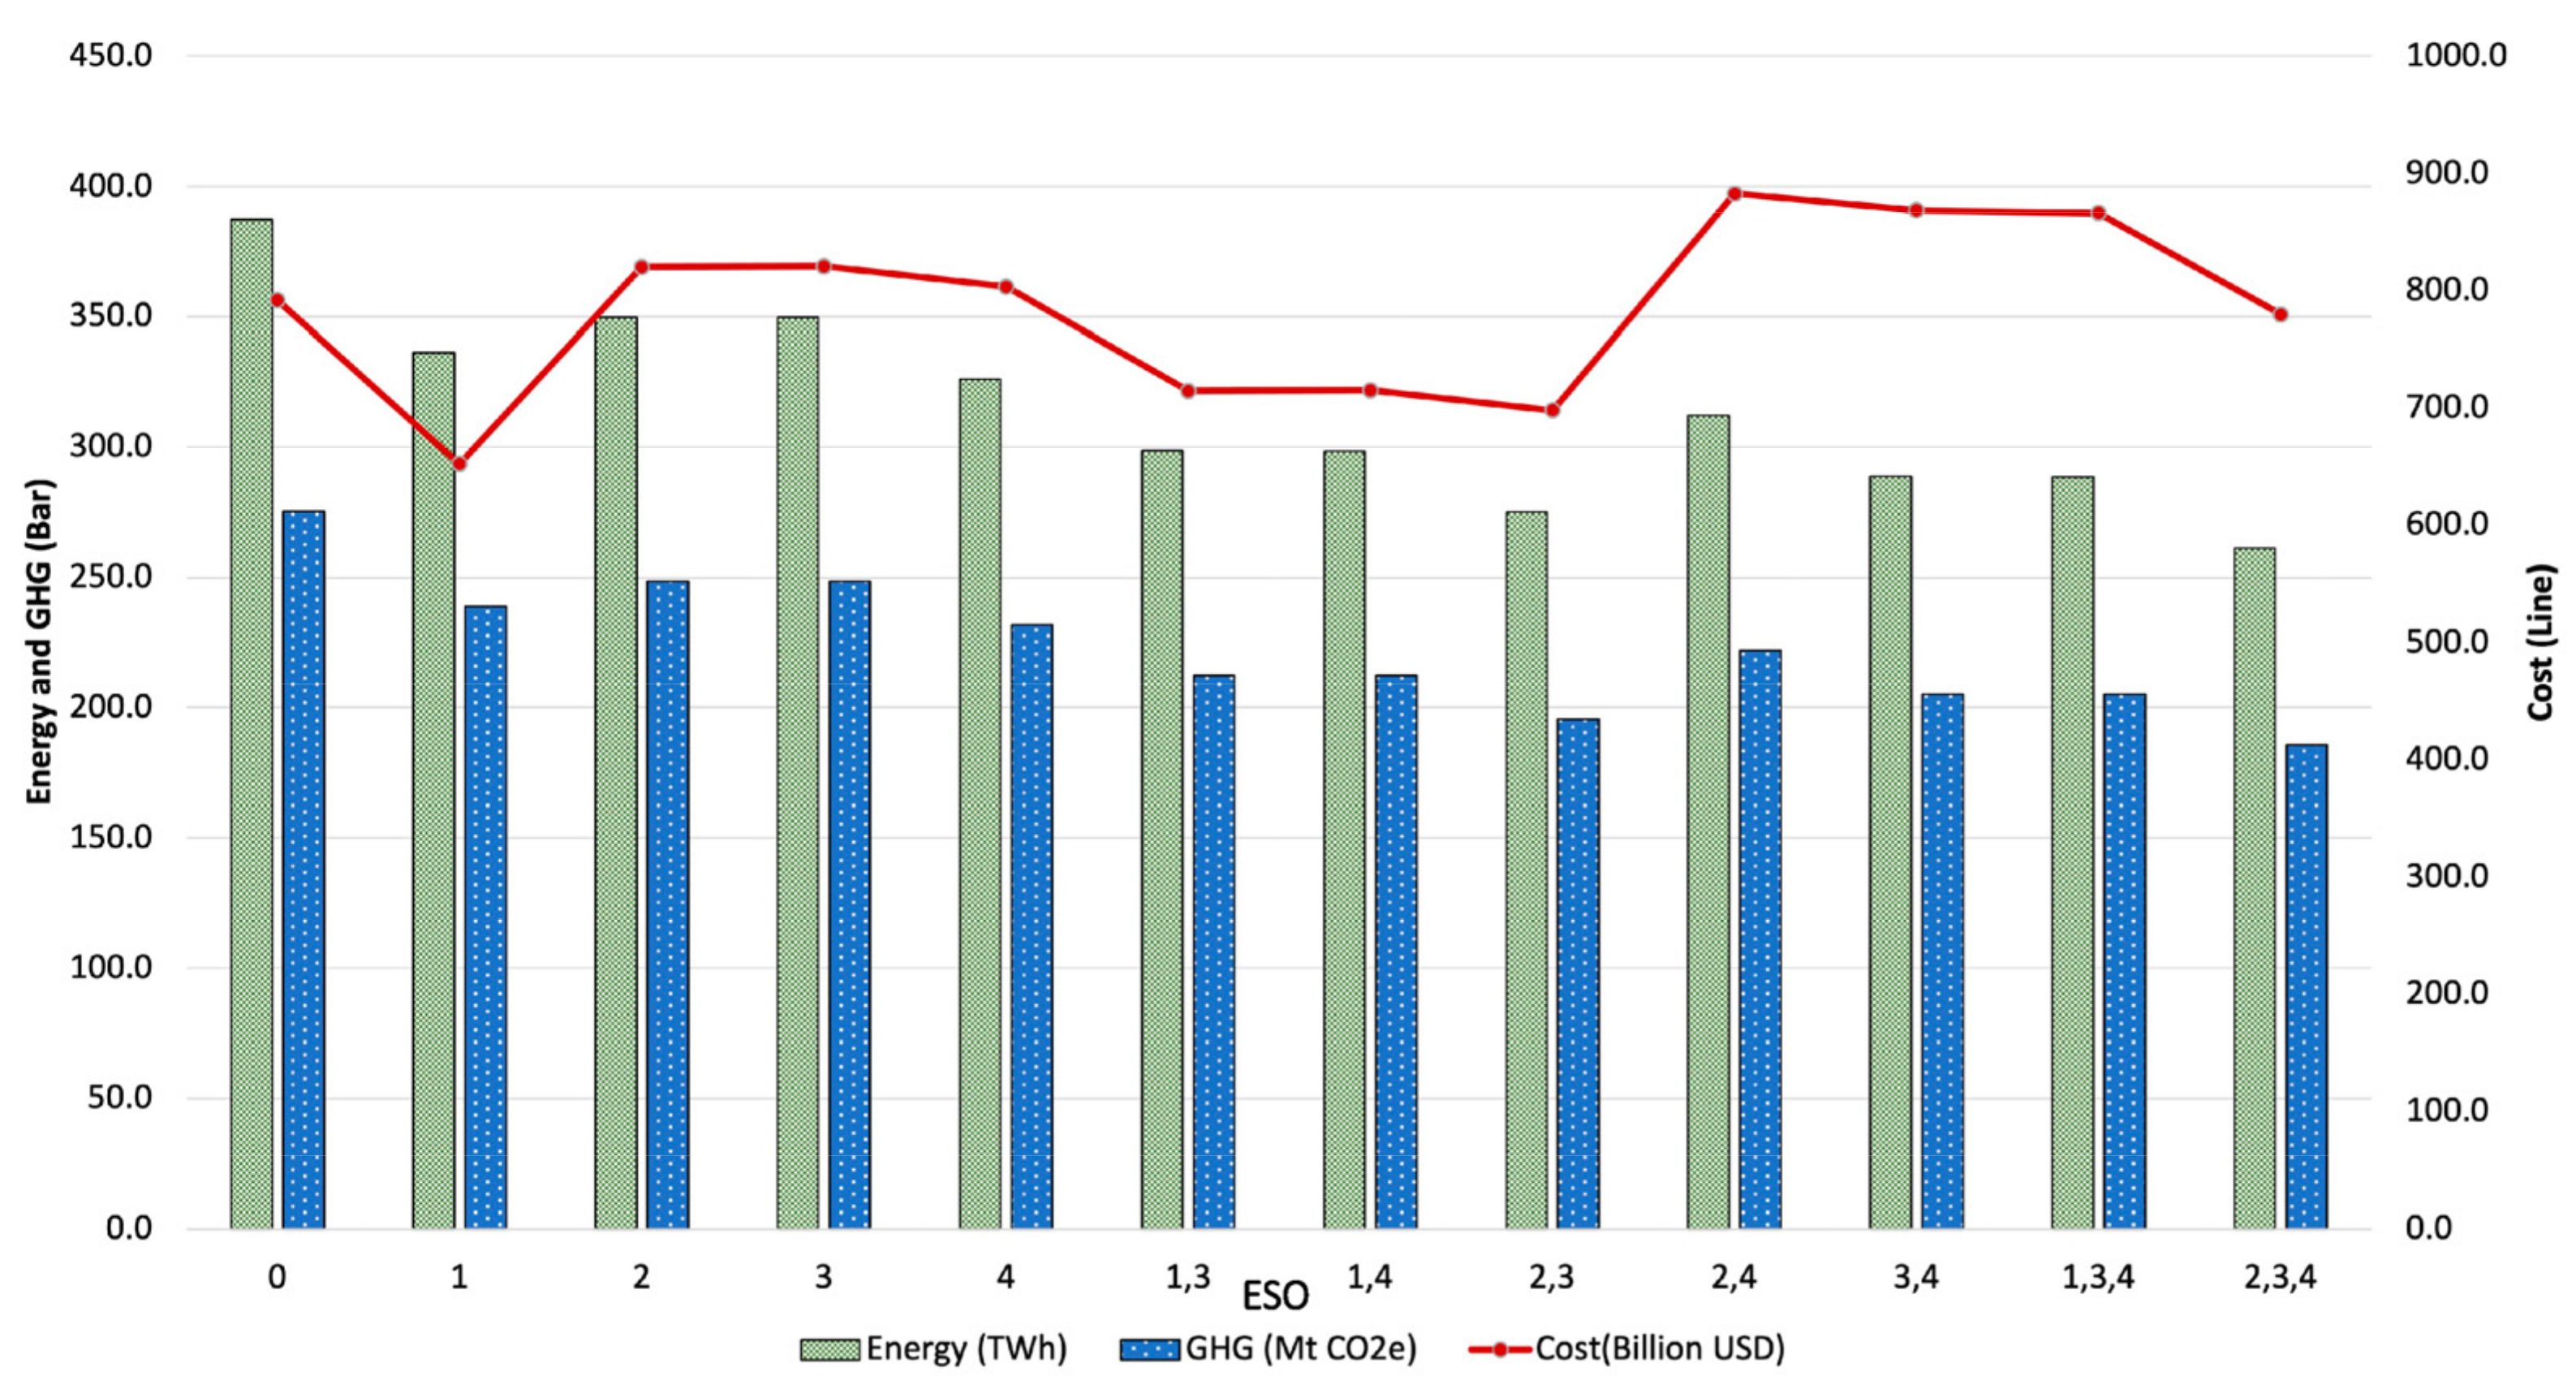
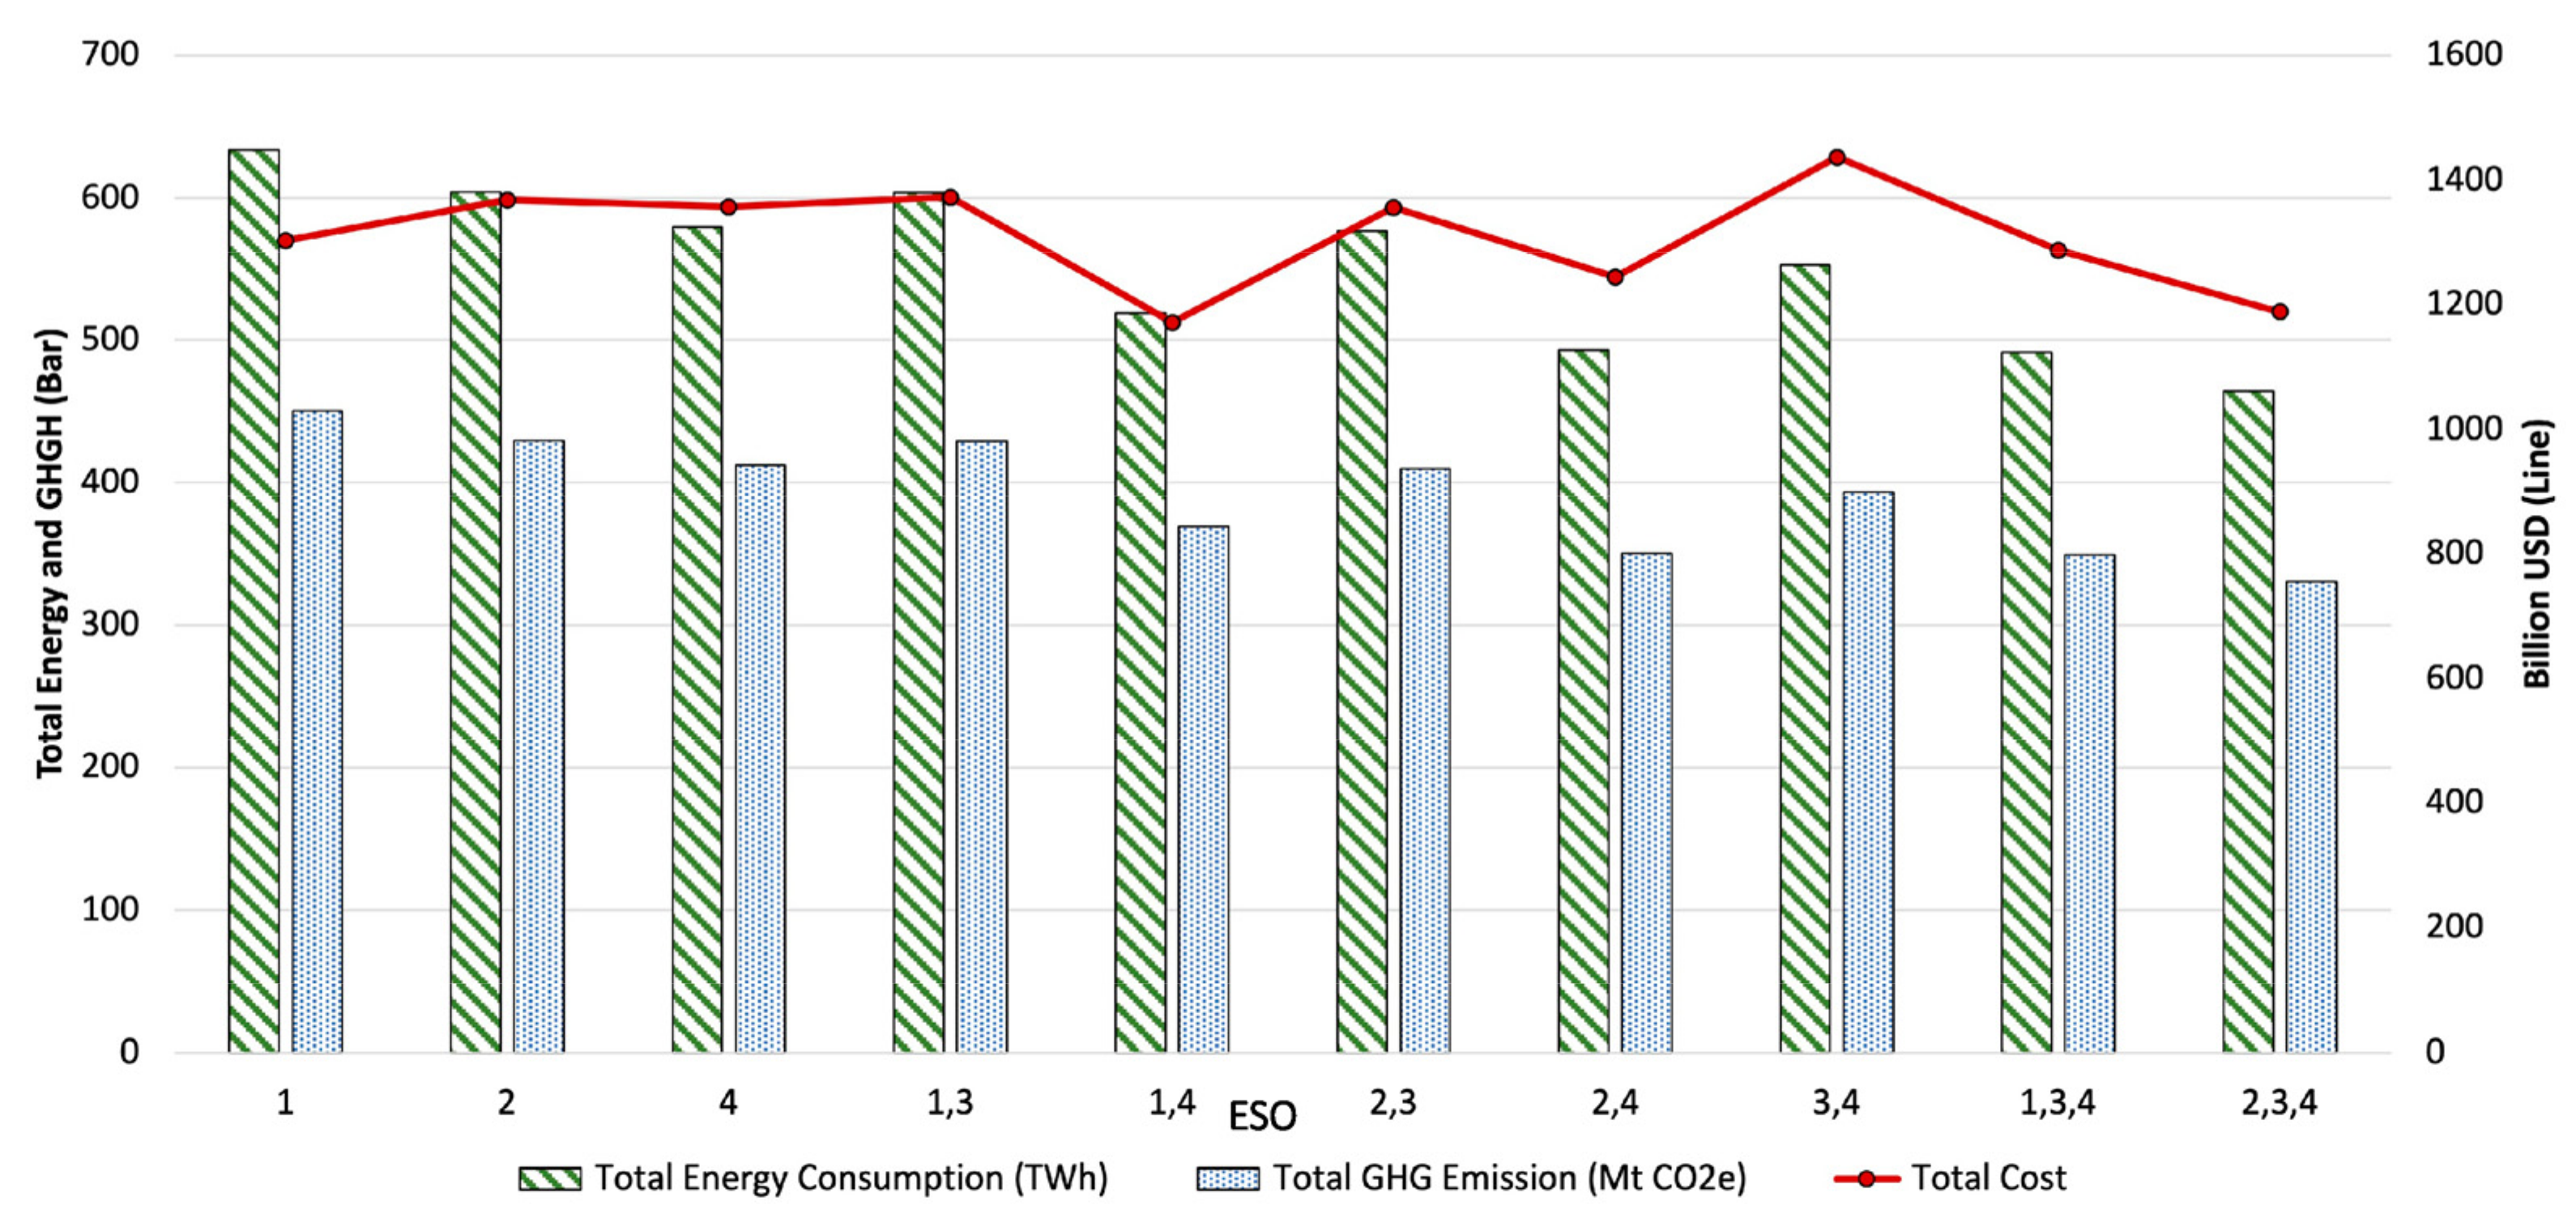
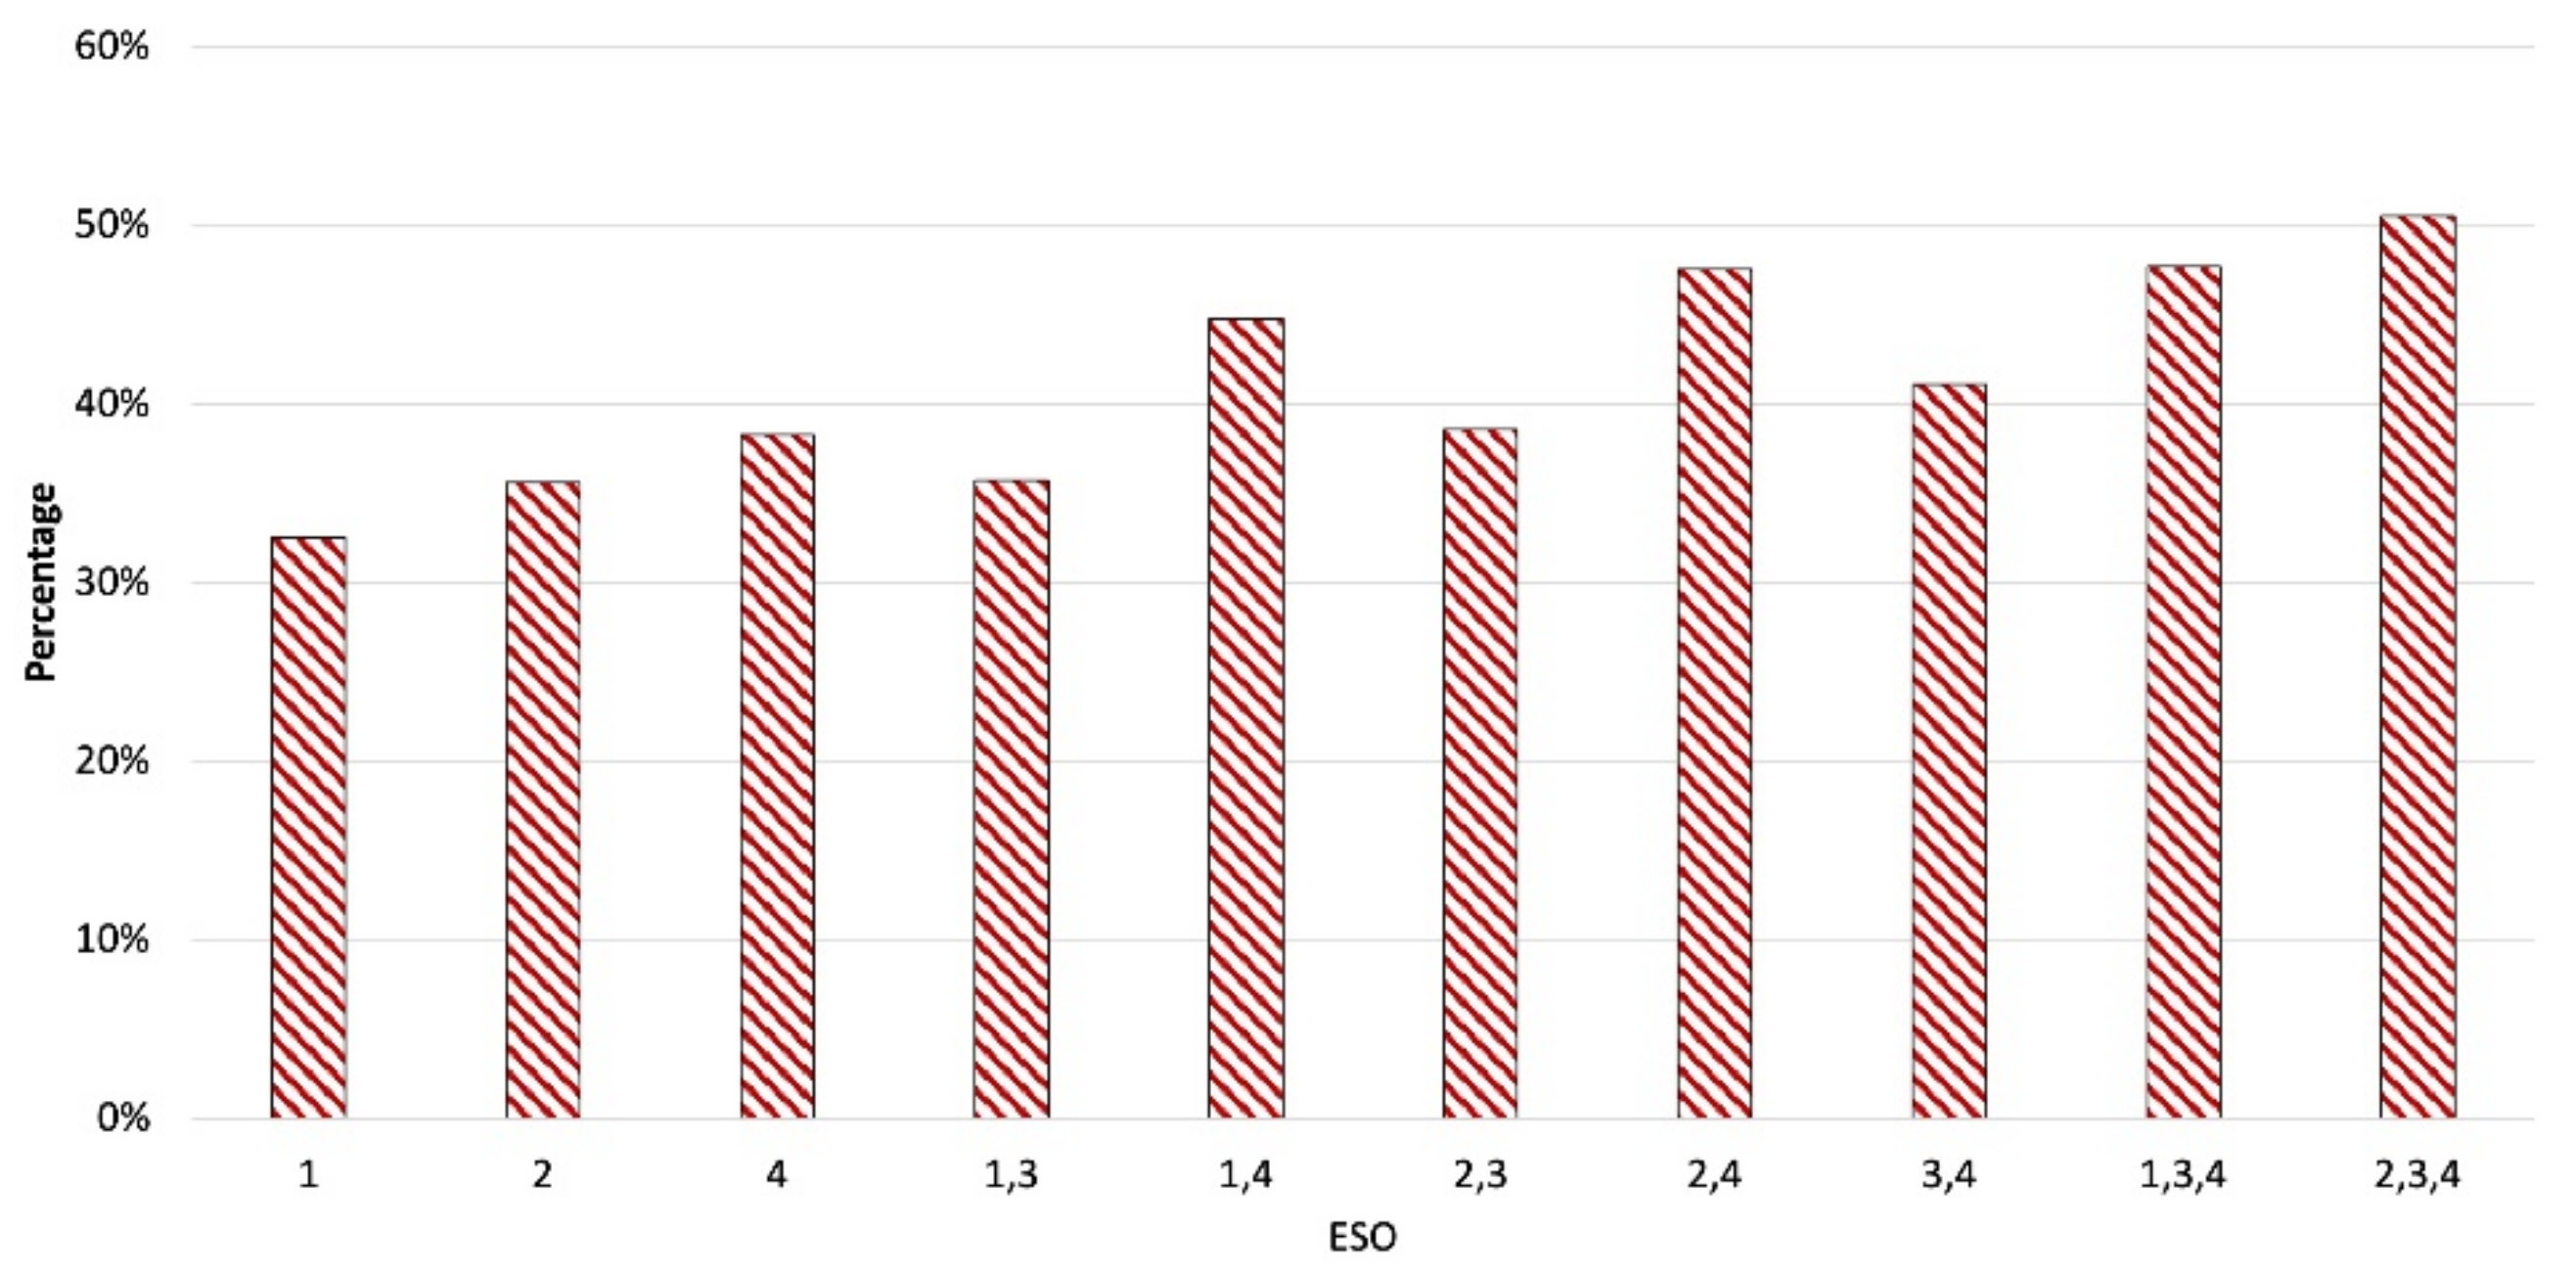
3.2.2. Evaluating the Performance of ESO Combinations Performance

The total energy consumption and GHG emissions by residential buildings consist of different combinations, namely one-ESO, two-ESOs, and Three-ESO based on four interventions (which are double-glazed windows, triple-glazed windows, LED lighting, and efficient split AC units, as shown in Figure 6). These figures show that the total energy consumption is significantly reduced when applying the intervention combinations in residential buildings. The total reduction amount reaches 5–35% of baseline carbon emissions by 2050 based on the number of interventions used as the combinations. Moreover, the Figure 6a–e shows the prediction of total energy consumption, the total GHG emissions, total cost of energy used, and the cost of intervention investment in each combination that impacts each geographical region in residential buildings. The results show that the highest total energy consumption for almost 7.135 million residential buildings in the Kingdom of Saudi Arabia among the three building types (i.e., detached, attached, low-rise apartment residential building) in all regions ranging from 30 TWh/year in the northern region to 290 TWh in the central region in 2050. This is mainly due to the rapid increase in population and housing demand in these regions. This may be because of the increase in the predicted housing number. The central region has the most significant number of 2.26 million residential buildings with the highest proportion of 890 thousand detached residential buildings, representing the highest energy consumption of residential building type.
Similarly, the GHG emissions reduction for three residential building types with different ESO combinations in each region is shown in Figure 6. The GHG emission reduction in the central region from 184 to 121 Mt CO2e, 137 to 101 CO2e in the western region, 72 to 46 CO2e in the eastern region, 68 to 46 CO2e in the southern region, and 22 to 16 CO2e in the northern region. The total cost of intervention combinations and total cost of energy use in each region is defined in Figure 6a–e e.g., the highest total cost is in the central region from $632 to $450 billion, and the lowest total cost is in the northern region from $66 to $56 billion.
Furthermore, the cost of energy used and total saving energy after applying intervention is based on building intervention energy of combinations in each residential building until 2050. The findings in the saving cost in Figure 7a,b have a positive impact, parallel with the government planning initiatives such as Saudi Energy Efficiency Center, Saudi Energy Efficiency Program, and Electricity and Cogeneration Regulatory Authority [40,42,47], and government GHG emissions reduction initiatives such as The National Capacity and Saudi ARAMCO Carbon Management Division [44,48]. However, applying the interventions in Low-rise Apartment buildings is not an ideal solution based on the negativity of saving costs, as shown in Figure 7c.

3.2.3. Performance of Building Energy Use

The sustainability of building energy performance is evaluated for existing and newly constructed residential buildings. Residential buildings were classified into three categories based on the number of interventions (Energy Saving Options ESOs), namely either One-ESO, Tow-ESOs, and Three-ESOs used. The sustainability performance of building energy use is assessed by aggregating three criteria (energy, GHG emission, and cost) using the weighted sum method considering two scenarios (pro-economic and pro-environment). The priority scores of each ESO combination in each region is shown in Figure 8a–e for pro-economic scenario and in Figure 8f–j for pro-environmental scenarios. Based on Figure 8, the best ESO combination in each building type in each region under each weighting scenario. Based on the estimated priority scores, ESO234 is the best option among all ESO combinations in each building type in all regions under the pro-environmental scenario since ESO234 has sufficient energy saving and reduces GHG emissions. Thus, the ESO234 needs more investment in interventions, but it is sufficient for reducing the electricity bill in the long run. Under the pro-economic scenario, the same ESO234 is the most preferable among all ESO in each building type except in the attached residential buildings in the southern and western regions, where ESO1 is the best option as ESO1 has the lowest total cost in the attached residential building as shown in Figure 8a,b. From the cost perspective, the ESO1 is the best alternative option for attached residential building caused by high electricity bill for long term and cold and humidity climates, respectively, in these particular areas [16,27,28,49].
Thus, the TOPSIS method is based on the ranking of classified ESOs combinations. The tables below show the optimal solution for each scenario based on residential building and selected geographical region and Level of Energy Sustainability in Residential Building (LESRB). TOPSIS was used to generate a score and rank them, as shown in Appendix C.
LESRB is a degree of best solution intervention in the specific existing type of residential ranked based on their value which has been divided into four levels of importance based on the number of intervention and the effectiveness of cost-benefit analysis (for both the capital investment cost of interventions and cost of energy for a period of 30-year) and the maximum number of alternatives in the category. The LESRB solution importance values are defined below in Table 5.
Precisely, the TOPSIS technique can compare ideal alternatives based on calculating a similarity to the positive-ideal solution by aggregating the proximity to the positive-ideal solution and the farness from the negative-ideal solution. This method is a selected criterion to identify the optimal solution with the maximum similarity to the positive-ideal solution. Moreover, TOPSIS is a reliable technique for finding the best alternatives in the selected criterion due to its ability to consider an unlimited number of alternatives in the decision-making process [16].

3.3. Government Contribution: Clean Energy Approach

The National Renewable Energy Program (NREP) is a program that formulates Saudi Arabia’s National Transformation Program (NTP), which aims to generate 3.45 GW of renewable energy in 2020. Additionally, the country is expected to increase its total energy mix by renewable energy to reach 9.5 GW by 2023 [50]. The clean energy value chain in the Saudi economy is predicted to have a significant impact, and the government vision is to privatize a massive portion of this particular industry and developing legislation to allow the private sector to invest in the clean energy sector [50] (Ministry of Industry and Mineral Resources, 2018).

3.3.1. Existing Clean Energy Actions in Saudi Arabia

Several comprehensive studies on renewable energy options have been conducted for different parts of Saudi Arabia. These studies have been carried out by finding suitable combinations of alternative technologies that suit the country’s climate conditions. The table in Appendix E shows the clean energy actions and possible studies for future projects. No single energy storage system captures all requirement energy from renewable energy systems [51].
Saudi Arabia has the potential to be leading in clean energy especially using a solar radiation source. In contrast, one of the researchers found out the daily varies of solar radiation in Saudi Arabia is between 4 to 7.5 kWh/m2, which is 4 to 7 times counterpart in Europe by 1 kWh/m2. Thus, Appendix E describes several clean energy actions the Kingdom has considered for last years and emphasizes enhancing the environment by adapting more clean energy projects [52,53,54,55].

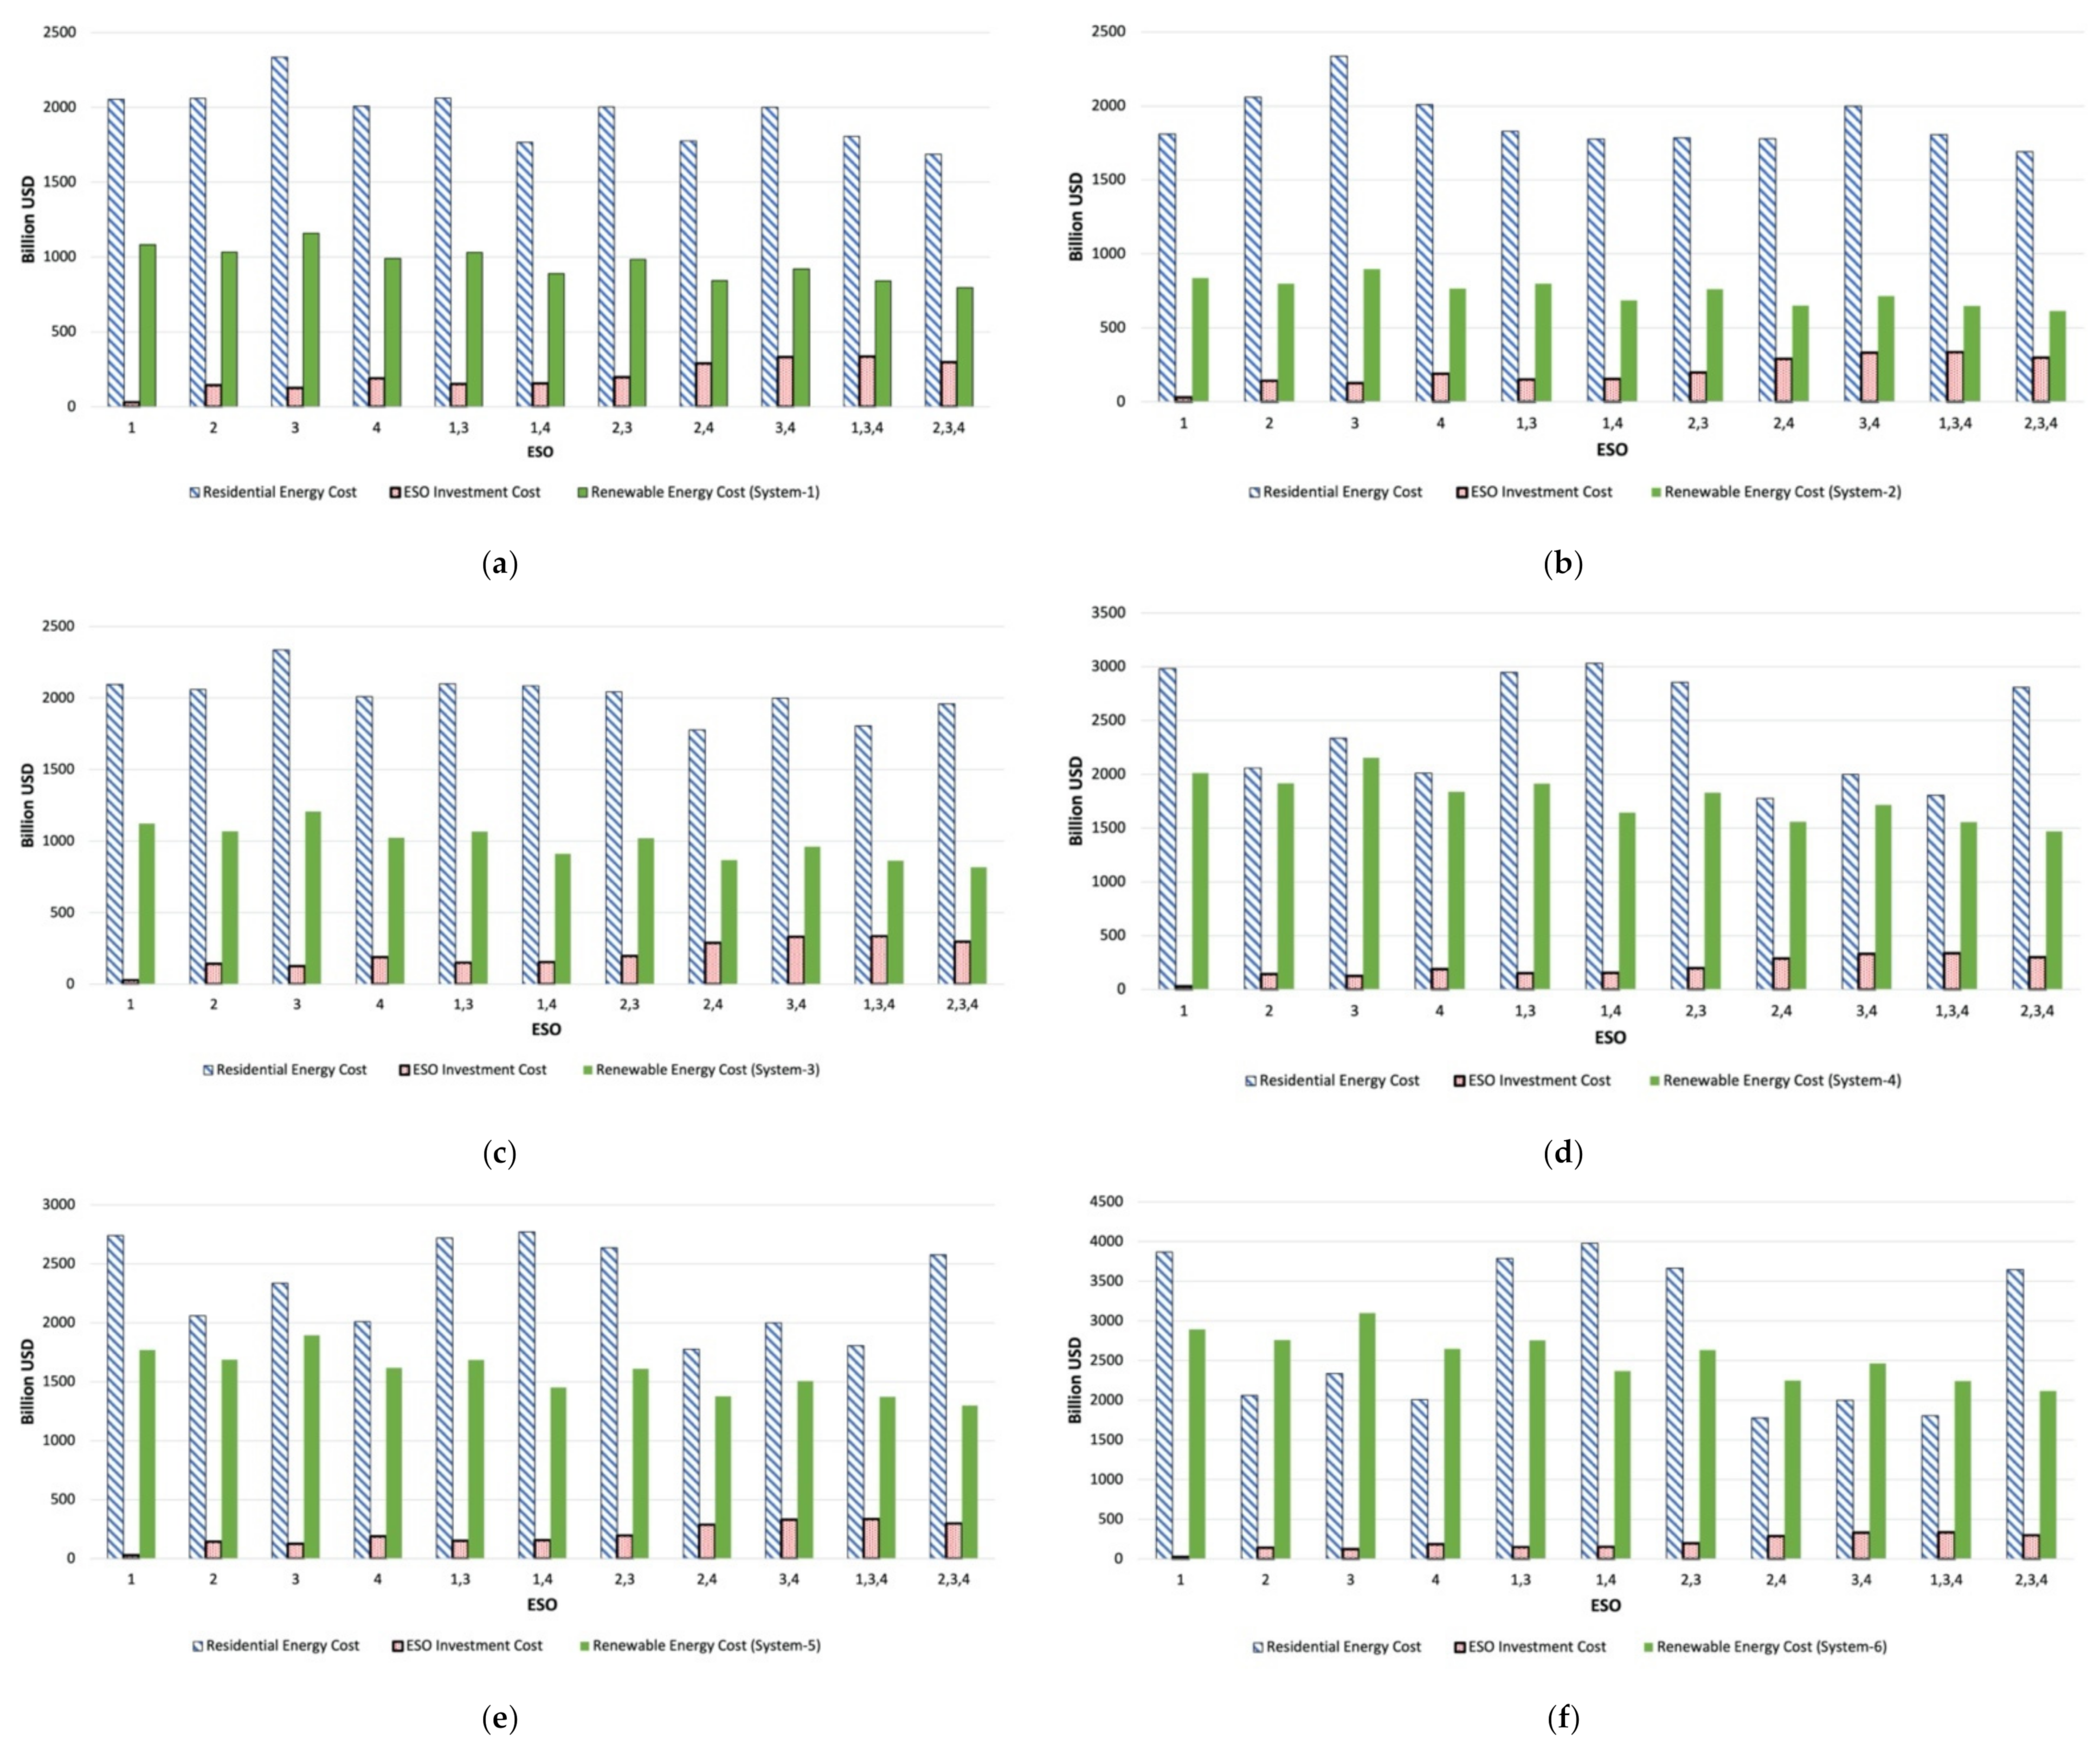
3.3.2. Renewable Energy Cost in Saudi Arabia

Saudi Arabia has developed an Energy Technology Program divided into seven rank technical areas as fallowing:
(1)
Renewable energy generation;
(2)
Conventional energy generation;
(3)
Electricity distribution and transmission;
(4)
Energy conservation and management;
(5)
Energy storage;
(6)
Fuel cell and hydrogen;
(7)
Combustion.
Thus, Saudi Arabia has supported several possible feasibility studies projects for clean energy, as described in Appendix F.

3.3.3. Identification of Clean Energy Alternatives

The clean energy approach is the process of approaching the GHG emissions reduction for the country and meeting its targets. It affirms its hold on its vision of a sustainable environmental future through the following four steps.
Thus, the first step has been addressed comprehensively in Appendix C and Section 3.3.4 and what can be summarized in this research includes:
  • The total energy for the residential sector in Saudi Arabia is 143,000 GWh;
  • The NDC’s goal is to cut 130 million tonnes of CO2e until 2030;
  • CO2 factor for fossil fuel in Saudi Arabia is 0.5454;
  • CO2 emissions of Fossil fuel in Saudi Arabia is 118 million metric tons of carbon;
  • Petroleum products consumed 64.2% of fossil fuels;
  • Residential building electricity tariff in Saudi Arabia is about 0.048 USD/kWh for energy consumption between 1 and 6000 kWh and 0.80 USD/kWh for energy consumption is more than 6000 kWh;
  • International utility fuel production cost is estimated to be $0.1678 per kWh, and Saudi Arabia’s government subsidies of the electricity tariffs are around US$0.0479, which means 19.1 billion from 128.9 billion goes toward energy subsidies.
The second step has been explained in terms of how much the public is willing to invest in the intervention and how much their contribution can reduce the GHG emissions in the residential sector, as shown in Figure 9. For instance, if the public decides to reduce the GHG emissions in the residential sector by replacing their home fluorescent lighting and other lighting with efficient LED lighting, the total cost will be around $8.5 billion. On the other hand, more GHG emissions reduction means more investment needs to be applied based on the simulation analysis and cost-benefit analysis. For example, if the public is willing to reduce the GHG emissions in the residential sector by around 50%, this means the overall public cost will be around $486 billion (which is a vast amount of investment to be considered for next 30 years). Thus, the third and fourth steps will explain the government rule to create a healthy environment that suits all nation aspects.
The findings of the CEMPE are shown in Figure 10. The evaluation considers two aspects that are intertwined, the estimated GHG emissions by 2050 (after considering around 7 million residential buildings with 45 million people in the country) and the baseline GHG emissions reported level (which is around 500 Mt CO2e). The Energy Saving Option Combinations that fit these aspects are ESO1, ESO2, ESO3, ESO4, ESO13, ESO14, ESO23, ESO24 ESO34, ESO134, and ESO234. These interventions are a grantee of GHG emissions reduction to be close to the level of GHG emissions in 2020.

3.3.4. Sustainability Performance of Clean Energy Alternatives

Al-Sharafi et al. [21] studied the alternatives of the GHG emissions reduction by using renewable energy such as solar panel, wind turbine, and their hybrid systems with the storage systems (e.g., battery bank storage system and fuel cell and hydrogen tank system to suit the environment of Saudi Arabia). The study considered the simulation of six different systems which are: system (1) which is a PV array with battery bank system; system (2) which is a wind turbine with battery bank system; system (3) which is hybrid system which is PV array and wind with battery bank system; system (4) which is a PV array with a combination of an electrolyze, fuel cell and hydrogen tank system; system (5) which is a wind turbine with a combination of an electrolyze, fuel cell and hydrogen tank system; and (6) which is a hybrid system of PV and wind with a combination of an electrolyze, fuel cell, and hydrogen tank systems. Each system has been repeated in five different geographical regions in Saudi Arabia. It has been repeated into ten chosen combinations ESO1, ESO2, ESO4, ESO13, ESO14, ESO23, ESO24 ESO34, ESO134, and ESO234 based on the cost-effectiveness of renewable energy need to invest.
As the fourth step of the clean energy approach, the Saudi Arabian government GHG emissions reduction target is 130 MtCO2e until 2030. This means that 20% of GHG emissions reach in 2015 643 MtCO2e (e.g., Saudi Arabia is planning to improve the networking system in smart meters and smart grids). Furthermore, the clean energy alternatives process has defined the best combinations the government needs to conclude into their consideration. At the same time, they will develop renewable energy systems that will replace the traditional energy supply (fossil fuel system) toward residential buildings in the country to meet the reduction vision.
Saudi Arabia will also fully deregulate energy efficiency in residential buildings across the country (e.g., by implementing SEEC energy efficiency standards and adapting “green building” concepts in the building sector). Applying clean energy technologies on-gird deliver the most significant CO2 emissions reduction in the residential building sector in Saudi Arabia. For example, Saudi ARAMCO is implementing a PV solar system around 26 GWh with different projects around the Kingdom and the General Authority of Civil Aviation is applying long term clean energy approach by implementing 9.3 GWh/year of PV solar system in GACA infrastructure. This study considered lower and upper total investment cost (e.g., if the Government decide to choose system (1) which is PV array with battery bank system the total investment cost between $1.922 to $2.462 trillion, or system (4) which is PV array with fuel cell and hydrogen tank system the total investment cost between $2.066 to $3.188 trillion) while also providing a 32% to 51% of total GHG emissions reduction from estimated GHG emissions increase by 2050, creating net economic benefit ecosystems through international investment, and developing new industry opportunities as illustrated in Figure 11 and Figure 12.
Furthermore, system (2) has the minimum renewable energy cost need to invest from the government and private sector (e.g., the Saudi Electricity Company is allowing the private sector to participate in new power generation projects that used renewable energy). Thus, the total investment value is between $0.6 and $0.9 trillion. On the other hand, systems (1) and (3) have higher cost-effectiveness, whereas the investment value is anywhere from $0.8 to $1.2 trillion and from $0.82 to $1.2 trillion, respectively. This approach achieves an excellent reduction in CO2 emissions. It results in favorable total saving costs while applying the chosen one-ESO and Tow-ESO classified combinations to the Saudi Arabian power generation sector. However, systems (4), (5), and (6) have the maximum renewable energy cost cause of the huge investment needed in the storage system (a combination of Electrolyzer, Fuel Cell, Hydrogen tank system). This investment is estimated to be between $1.5 and $2.2 trillion in system (4), between $1.3 and $1.9 trillion in system (5), and between $2.1 and $3.1 trillion for system (6), which is reflected in the substantial investment need in renewable energy to consider from all parties of the country for the next 30 years. This approach achieves a huge reduction in CO2 emissions and results in a negative total saving cost to the Saudi Arabian power generation sector, as shown in Figure 13. These can be achievable through the government being willing to invest in future clean energy alternatives in the national grid and to promote the use of renewable energy.

4. Conclusions

The challenges of moving towards economic diversification and low-carbon emission in an arid climatic country involves both proposition sides and inevitable sides. Extensive reform in the low-carbon energy framework for energy performance management is required on the proposition side. On the inevitable side there is economic diversification, deregulating energy policies and initiatives, and an awareness of the public opinion on climate change and global warming. Furthermore, creating a healthy environment for the industrial base to accelerate renewable energy innovations is a necessary transformation in the energy policy system through the low-carbon energy framework for energy performance management to lower carbon capture at the macro-community level (country level) in the effort toward achieving appropriate sustainable stability. Additionally, the integration of homeowners with financial institutions for long-term clean energy investment is necessary to complete the transition.
A community-government partnership framework has been proposed for low-carbon energy use in residential buildings in hot and arid regions. The framework comprises two approaches: the building intervention approach for the community and the clean energy approach for the government. Communities’ building intervention approach and the government’s clean energy approach are set to identify the best combinations of buildings (retrofits) and non-building (energy source) renewable energy options to meet the country’s GHG emissions reduction target. The clean energy approach considered six different renewable power generation systems (i.e., Solar PV array, wind turbine, and hybrid system with two types of storage systems (battery bank storage and a combination of electrolyzing, fuel cell, and hydrogen tank storage)). This study identified an appropriate partnership between communities and the government to meet the GHG target. This framework can lower carbon emissions at the country level by integrating micro-level (community) and macro-level (government) contributions. This framework manages a combination of different aspects used to understand energy consumption patterns and GHG emissions in residential buildings. This framework benefit is a possible way to avoid energy losses, acknowledge, execute the policies and necessity initiatives at all levels to protect the environment, and emphasize stakeholders (homeowner, developer, private sector, government) to build a better future.
The proposed framework fits technically with the current changing policies, vision, and national transformation panel toward clean energy in Saudi Arabia (e.g., the NEOM region, a future transformation area located in the northwest of Saudi Arabia). Saudi Arabia Vision sets the path toward self-economic sustainability and to enables the country to become a leading contributor to solar energy technologies worldwide (Neom, 2021). The proposed framework summarized the contribution into several systems were considered to develop and implement renewable energy replacement development. This process identified a suitable system with the best combinations that guarantee sustained improvement in the performance of the residential buildings in Saudi Arabia.
The future research in energy policy analysis concludes a possible further research through applying FIT policy that will contribute to reducing the CO2 emissions, enhancing the Saudi Arabia economy through developing the renewable energy industry, and eliminating electricity tariffs subsidies will provide a net economic benefit by $19.1 billion annually.
However, this paper has date limitations that need detailed data on occupant behavior and building properties. The variability in human behavior was not considered, and only a limited number of energy saving options or retrofits were considered.
Furthermore, Saudi Arabia could be a place for the worldwide clean energy industry for many reasons:
  • The solar radiation source is four to seven times greater than Europe;
  • Expanding renewable energy programs by $30 to $50 billion including feasibility studies, actual initiatives, clean energy action, and focusing on clean technology research areas have been conducted in renewable energy. This has transformed the country into a healthy land for long-term investors
  • Considering both the vertical and horizontal diversifications concepts toward renewable energy (e.g., using the vertical diversification concept) could lead to a potential development into a solar-to-renewable power generation plant in Saudi Arabia, which means utilizing the country’s mineral resources to expand in local renewable energy production and manufacture (Know-how) and exporting the outcome energy production to neighboring countries and Europe.

Author Contributions

Conceptualization, M.A.; methodology, M.A.; validation, M.A.; formal analysis, M.A.; resources, M.A.; data curation, M.A.; writing—original draft preparation, M.A.; writing—review and editing, M.A., G.C.-S. and K.M.N.; visualization, M.A.; supervision, R.S.; project administration, K.H. All authors have read and agreed to the published version of the manuscript.

Funding

The funding of this research through the author’s personal income.

Institutional Review Board Statement

Not applicable.

Informed Consent Statement

Not applicable.

Data Availability Statement

The authors have conducted the data from the simulation and engineering modeling and literature review articles.

Conflicts of Interest

The authors declare no conflict of interest.

Appendix A. Population Prediction

Table A1. Population prediction in Saudi Arabia (1955–2050).
YearPopulationYearly %YearlyUrbanUrban PopulationCountry’s Share ofWorld PopulationSaudi Arabia
ChangeChangePop %World PopGlobal Rank
205044,562,4760.42%182,72891.40%40,708,6240.46%9,735,033,99046
204543,648,8380.55%235,16190.30%39,396,4080.46%9,481,803,27447
204042,473,0310.67%279,93189.20%37,878,8110.46%9,198,847,24044
203541,073,3740.88%350,20788.10%36,170,0290.46%8,887,524,21341
203039,322,3381.09%414,68486.80%34,142,9750.46%8,548,487,40042
202537,248,9191.36%487,01085.50%31,842,6260.46%8,184,437,46042
202034,813,8711.88%619,24184.00%29,255,5760.45%7,794,798,73941
201934,268,5281.68%565,77283.80%28,700,3620.44%7,713,468,10041
201833,702,7561.82%601,57783.50%28,133,1380.44%7,631,091,04041
201733,101,1792.03%657,73283.20%27,543,6230.44%7,547,858,92541
201632,443,4472.29%725,78083.00%26,918,2140.43%7,464,022,04941
201531,717,6672.95%859,24182.80%26,249,2430.43%7,379,797,13941
201027,421,4612.86%721,05682.10%22,512,1010.39%6,956,823,60345
200523,816,1832.88%630,46881.30%19,358,6640.36%6,541,907,02747
200020,663,8432.08%405,01180.20%16,579,8260.34%6,143,493,82349
199518,638,7872.80%481,00079.10%14,739,5590.32%5,744,212,97948
199016,233,7854.35%622,95877.00%12,503,5130.30%5,327,231,06151
198513,118,9936.24%685,50373.00%9,581,5530.27%4,870,921,74052
19809,691,4765.49%454,39766.20%6,415,1240.22%4,458,003,51461
19757,419,4934.92%316,62158.40%4,334,5580.18%4,079,480,60671
19705,836,3893.80%198,55148.70%2,840,5060.16%3,700,437,04676
19654,843,6353.46%151,41938.80%1,877,8050.15%3,339,583,59784
19604,086,5392.81%105,67731.30%1,277,0540.13%3,034,949,74883
19553,558,1552.65%87,36426.00%923,9170.13%2,773,019,93684
According to a 2019 estimation by the United Nations, Saudi Arabia’s population is 34,140,662. The number has been growing ever since and will exceed 45 million people by 2050. Furthermore, the number of residential buildings distributed in 2018 in each administrative region are around five million houses (General Authority for Statistics, 2018b). As a result, the population distribution in each region in 2050 can be estimated based on the classified residential building, as described in the table below.
Table A2. Estimation of population prediction based on the geographical region 2050.
Geographical RegionDetached Residential BuildingAttached Residential BuildingLow-Rise Apartment BuildingTotal
VillaA Floor in VillaTraditional HouseA Floor in Traditional HouseOther
Central 3,499,2332,060,6441,196,786422,082765,4296,194,62314,138,797
Western726,678440,6253,479,207401,604630,5619,576,67215,255,347
Eastern1,274,349410,142455,301150,324213,4223,682,6216,186,159
Southern819,437740,3761,657,696322,766177,0452,874,9296,592,249
Northern186,155132,197629,28592,096152,7411,197,4482,389,923
Total6,505,8523,783,9847,418,2761,388,8721,939,19923,526,29344,562,476
The figure below has described the distribution of populations in each geographical region in 2050. Whereas the population of the western region is expected to be the largest region in the country, with about 15 million people, followed by the central region with about 14.1 million. Additionally, the southern and eastern regions will be estimated to have 6.58 and 6.18 million people by 2050, respectively. Finally, the Northern Region will be expected to have more than 2.38 million people, around 23% more than the population in 2018 [25].
Figure A1. Geographical regions discerption of population growth in 2050 in Saudi Arabia.
Energies 14 04954 g0a1

Appendix B. Energy Analysis Systems Suite the Environment in Saudi Arabia

Economic Diversification in Saudi Arabia
Economic Diversification and the Tenth Development Plan in Saudi Arabia
The 10th development plan of the Kingdom of Saudi Arabia (2015–2019) advised economic diversification through three major dimensions, namely vertical, horizontal and spatial diversifications, as discussed briefly below.
Vertical diversification: vertical diversification is based on local production, processing, and manufacturing of raw mining materials (Designated National Authority, 2018). On the other hand, Saudi Arabian industries are developing production and service activities in the oil industry that lead to a possible development into a crude oil-to-chemicals plant.
Horizontal Diversification: The objectives of horizontal diversification are to [56]:
(i)
Increasing production capacities of the industrial sector;
(ii)
Enhancing the quality of the services sector;
(iii)
Developing the non-oil based economic activities in non-oil sectors;
(iv)
Encourage the private sector to invest in energy sources projects;
(v)
Encourage non-oil exports;
(vi)
Developing low-water-consuming agricultural products and fishing products;
(vii)
Developing local and foreign strategic partnerships to introduce investment program that contributes into the economic diversification.
Spatial Diversification: The 10th development plan of the Kingdom is encouraging the provinces through boosting spatial diversification of economic activities based on the growth and development of industrial zone concepts and business-technology incubators in each region of the country. Several cities have implemented spatial economic diversification through developing industrial areas. For example, at Rabigh, Hail, Madinah, and Jazan, four new economic cities are due to be completed by 2020 with anticipated populations of 40,000, 80,000, 200,000, and 250,000, respectively [57]. Additionally, the Royal Commission of Jubail and Yanbu has approved the expansion at Jubail and Yanbu cities. Additionally, two new industrial areas have been developed in Ras Al-Khair in the Eastern Province and Waad Al-Shammal near Turaif in the country’s north.
Economic Diversification and Intended Nationally Determined Contribution (INDC) of Saudi Arabia under the UNFCCC.
Intended Nationally Determined Contribution (INDC) is part of Saudi Arabia’s commitment to UNFCCC principles listed in Article 3 and its specific commitment to economic diversification initiatives and adaptation measures as UNFCCC decision 24/CP.18 in Doha in 2012. Saudi Arabia will engage in actions and plans to pursue economic diversification that helps form greenhouse gas (GHG) emissions, which will assist in achieving its sustainable development objectives [58].
The steps taken by Saudi Arabia include:
(i)
Economic diversification initiatives;
(ii)
Climate change initiatives;
(iii)
R&D activities on climate change;
(iv)
Attempts to reduce impacts of international climate change policy responses.
The initiatives that mitigate co-benefits of economic diversification are [57]:
(i)
Energy efficiency & renewable energy;
(ii)
Carbon capture, utilization, and storage;
(iii)
Utilization of gas;
(iv)
Methane recovery;
The planning activities that measure the GHG emissions reduction are based on a degree of implementation and availability of funds as follows:
(i)
Water and wastewater management;
(ii)
Urban planning;
(iii)
Marine protection;
(iv)
Reduced desertification;
(v)
Integrated Coastal Zone Management Plan (ICZMP);
(vi)
Early Warning Systems (EWS);
(vii)
Integrated Water Management Plan (IWMP)

Appendix C. Research and Development in Saudi Arabia

Clean technology and the environmental issues have been the focus of many research areas, as described in the table below.
Table A3. Research and development in clean energy in Saudi Arabia.
Responsible SourceResearch ProposalLocationResearch Note
Saudi AramcoThe company established a fuel research center to develop more efficient combustion engines using modification petroleum formulations methods.Paris, France[59]
Saudi AramcoThe company established the Mobility Center to deploy and engage with automobile manufacturers in the USA to find suitable technological solutions to reduce the carbon emissions that cause by automobile products.Detroit, USA[59]
Ministry of EducationThe Ministry has initiated to established centers of research excellence in clean technologies.-Ministry of Education
King Abdulaziz City of Science and Technology (KACST)The center builds an infrastructure to support the scientific community through managing research grants, the availability of databases, and executing applied research.KACST[60]
King Abdulaziz City of Science and Technology (KACST)Establishing a long-term initial program to encourage local technology projects through the National Science, Technology, and Innovation Center.Technology Development Center, KACSTKACST
Massachusetts Institute of Technology (MIT) and KFUPMThe Center for Clean Water and Clean Energy was established to research desalination, low carbon energy, and applied research and manufacturing. The center granted achievement in the water field for more than 20 IPs and three new technologies.MITKFUPM
KACST and Advance Water Technology Company (AWTC)The institutions signed an agreement to study solar water desalination plants based on planning the design and construction. This plant production capacity of 60,000 cubic meters/day.Al Khafaji[57]
The center for Clean Water and Clean EnergyThe center collaborates between these two academic institutions to manage research for new technology to enhance freshwater production and low carbon energy.MIT and KFUPMKFUPM
Center of Research Excellence in Renewable EnergyThe center aims to collaborate with other institutions to enhance the science and technology related to renewable energy in significant solar cells, solar cooling, heating PV, and energy storage.KFUPMKFUPM
Part of Saudi Arabia’s government vision is to reduce its carbon emission by 130 million tons of carbon dioxide (or something equivalent) by promoting energy efficiency and renewable energy technologies. The government has established some programs (e.g., National Energy Efficiency Program (NEEP) through King Abdulaziz City for Science and Technology (KACST)) to support research and development tasks and provide consultation related to meet the country’s vision and enhance the national energy consumption patterns. The Government of Saudi Arabia also promotes another program to improve the energy efficiency for the residential sector and other sectors in 2010, Saudi Energy Efficiency Center (SEEC) [40]. However, the King Abdullah City for Atomic and Renewable Energy (KA-CARE) is planning to set a target to add 4% of renewable energy in total energy used in Saudi Arabia by 2020 [61]. According to the Climate Action Tracker, Saudi Arabia, its public investment fund is planning to locate the electric vehicle industry in Saudi Arabia by investing more than $1 billion to the United States-based electric vehicle manufacturer. Also, the government signed a memorandum with the SoftBank Group to build the most significant single solar project worldwide by the capacity of 200 GW Giga Watt in March 2018 [62].

Appendix D. Energy-Saving Regulation and Policy Actions in Saudi Arabia

Initiatives and actions for energy saving regulations that contribute from the different sectors in Saudi Arabia, as described in the table below.
Table A4. Energy, regulation, and policy actions in Saudi Arabia.
Initiative/Responsible SectorActions
National Strategy: smart meters and smart gridsImproving the reliability of the networking system and the quality of service. Also, increasing the efficiency of the option. Enhancing and utilizing assets, the benefits of the initiative are:
Reduce complaints
Reduce the cost of reading the meters
Providing additional services to consumers
The flexibility of renewable energy integration into the system [63]
King Abdullah City for Atomic and Renewable Energy (KACARE)ECRA conducted a framework study for electricity generation activities, a heat recovery steam generator, and water desalination by applying atomic and renewable energy [64].
Ministry of Energy, Industry, and Mineral Resources (MEIM)MEIM is seeking to reduce the peak demand to target the large air condition loads to incorporate thermal energy storage systems through establishing a demand-side management program [65].
Saudi Electricity Company The private sector contributes to the new power generation projects while reorganizing the electricity sector into three main sectors: generation, transmission, and distribution.
Energy Conservation and Awareness Department in MEIMThe department implements energy conservation initiatives:
Enabling commercial, governmental, agricultural, and industrial sectors to reduce energy consumption and shift peak loads.
Prohibition of irrigation during peak load times in the agriculture sector.
Initiate Energy Conservation and Load Management Consumers Guide.
Promoting Public awareness of energy conservation throughout workshops and meetings.
Promoting energy conservation procedures and load reduction tools to the primary consumers in the governmental sector [66].
Power Generation SectorAdapting combined-cycle operation through:
Can reduce the fuel consumption by converting inefficient single-cycle gas turbines to the combined- cycle [67]. Increase the electricity generation from 35 generators in 2005 to 74 generators in 2014. Thus the cogeneration entities’ capacities in 2013 were 15,375 MW of electricity, 5,240,001 m3/day of water, and 14,374 ton/hour of steam [64].
Petroleum Sector Reasonable use of energy resources:
Energy conservation savings program saves 112.81 thousand barrels eq. Per day between 2000 to 2010. Also, it saved approximately 170 million cubic feet of gas per day in 2013.
The energy conservation program is responsible for reducing 3% of refining energy intensity in 2014.
To eliminate gas flaring and liquid hydrocarbon by using zero-discharge technology at onshore and offshore well-site, it minimized the flaring from 0.89% to 0.72% in all upstream in 2013.
Resulting in a reasonable use in the operations sector by 160.85 thousand barrels of oil eq. Per day between 2002 to 2014 [68].
Petrochemical SectorImplementing SEEC’s energy efficiency standards:
Achieving reduction compare by 2010 and 2013 in GHG intensity by 2% to 5% energy consumption intensity, 5% water consumption intensity, and 10% material loss intensity [69].
Reduction in GHG emissions by 15% and 9% in energy consumption by retooling boilers and upgrading in the operational phase [69].
Reducing GHG emissions by 125,000 tonnes and saving 784,000 GJ of energy yearly by processing vent gas reutilization projects [70].
Saving 99 thousand ton/year of natural gas and 4.160 million GJ/year of energy consumption reduction and 229 thousand CO2e/year of GHG emissions reduction, and 1.040 million ton/year of additional steam through high-pressure steam extraction implementation [70].
Buildings Sector Adaptation of Green Building concept:
Recently, the country has more than 300 green building projects and 20 million m2 occupied area by green building in 2014.
The country plans to build 90,000 eco-environment mosques using renewable energy sources [12].

Appendix E. Clean Energy Technology in Saudi Arabia

Clean energy technology system that have been used in different locations and variance capacity in Saudi Arabia, as described in the table below.
Table A5. Clean energy actions in Saudi Arabia.
Clean Energy SystemResponsible SectorClean Energy ActionLocation/DateCapacityResource
Solar systemEnergy Project Development Office (REPDO) of Kingdom’s Ministry of Energy, Industry and Mineral Resources (MEIMR)The department has licensed several companies for this projectSakaka city, AlJouf300 MWKingdom’s Ministry of Energy, Industry and Mineral Resources (MEIMR)
solar thermal plant(REPDO) in (MEIMR)The department has qualified several companies for this projectRiyadh, 2012 25 MWhKingdom’s Ministry of Energy, Industry and Mineral Resources (MEIMR)
Solar systemThe General Authority of Civil Aviation (GACA)GACA established ground-mounted of the solar system for long term clean energy approachGACA, June 20139.3 GWh/yearThe General Authority of Civil Aviation (GACA)
Solar systemSaudi Electric Company (SEC) and Showa Shell Sekiyu Both companies commissioned a pilot Farasan Island, Jazan, 2011864 MWh/yearSaudi Electric Company (SEC)
Solar systemSaudi ARAMCO The car park mounted the system in the company location Saudi ARAMCO, 201217.5 GWh/yearSaudi ARAMCO
Solar systemSaudi ARAMCOThe company established the solar park and installed around 130 solars to powered lighting bollards and powered streetlight in the campus residential compoundKing Abdullah University of Science & Technology (KAUST)-Saudi ARAMCO
Solar systemSaudi ARAMCOThe company assigned a ground-mounted solar system King Abdullah Petroleum Studies and Research Center (KAPSARC), 20135.8 GWh/yearSaudi ARAMCO
Solar systemSaudi ARAMCOThe company assigned the second project the ground-mounted solar systemKing Abdullah Petroleum Studies and Research Center (KAPSARC), 20143 GWh/yearSaudi ARAMCO
Solar systemSaudi ARAMCOThe company assigned a solar rooftop-mounted arrayKing Abdullah Financial District Riyadh, 2012330 MWh/yearSaudi ARAMCO
Utility-scale solar plantSaudi Arabia Government The Government assign the project Makkah, 2018 385 GWh/yearSaudi ARAMCO
Wind systemSaudi Arabia GovernmentThe Government developed a renewable energy atlas for collecting wind resources monitoring data for developers, researchers, and stakeholder Saudi Arabia40 sites throughout the Kingdom[71]
Wind systemSaudi ARAMCOThe company planned to install the system at its facilityTuraif3.3 MWSaudi ARAMCO
Wind systemSaudi ARAMCOThe company planned to install two wind turbines to generate power for the communication towersTwo different remote location6 KWSaudi ARAMCO
Wind FarmEnergy Project Development Office (REPDO) of Kingdom’s Ministry of Energy, Industry and Mineral Resources (MEIMR)The Government has qualified several companies to build the systemMidyan 400 MWKingdom’s Ministry of Energy, Industry and Mineral Resources (MEIMR)
natural gas with solar systemsSaudi Arabian GovernmentThe Government planned to build a power plant of natural gas-fired integrated with solar combined cycle Saudi Arabia, 2017550 MW + 50 MWSaudi ARAMCO
Solar systemFirst Energy Bank and Vinmar International CompanyThe companies announced a plan to build a polysilicon plant to meet the growing demand for the systemSaudi Arabia7500 tons/yearSaudi ARAMCO
Solar systemIDEA Polysilicon Company and Solar Wafers CompanyThe companies will build high purity polysilicon plant and wafersYanbu Industrial City10,000 tons/yearSaudi ARAMCO
Solar systemKFUPMA research team at the institution won the World Solar Challenge in 2011 by manufacturing a solar vehicle. Australiacruising speed was 80 km/h with a max speed was 140 km/hKFUPM

Appendix F. Feasibility Study Projects for Future Clean Energy Technology in Saudi Arabia

Clean energy technology systems the county are willing to add in different locations with the expected cost estimation in Saudi Arabia, as described in the table below.
Table A6. Feasibility study projects for clean energy possibility in Saudi Arabia.
Clean Energy
System
Feasibility Study ProjectSystem LocationCost of Energy (COE)/Unit Energy Resources
PVBy using 2 kW convertors & 7 Batteries Yanbu Region, Saudi Arabia0.609 $/kWh[72,73]
wind-photovoltaic (PV)-fuel cell (FC) (Cost of Energy)-Abha Region, Saudi Arabia208 $/kWh[74,75]
Wind-PV-FC (Cost of Hydrogen)-Abha Region, Saudi Arabia43.1 $/kg[49,76]
Windeconomic feasibility study of 600 kW wind power plants in the coastal areasAl- Wajh, Jeddah, Yanbu and Jizan, Saudi Arabia0.0594 $/kWh[49,76,77]
Wind-PV with Diesel Hybrideconomic feasibility study of 500 kW of PV and 4 Diesel generators systemNorth-Eastern region, Saudi Arabia0.038 $/kWh[78]
Wind-PV with Battery StorageStudied the performance of loading demand of 1 kW for 12 h/day in 2 wind turbines-40PV modules-6 batteries systemDhahran, Saudi Arabia0.624 $/kWh[79]
Wind-PV with DieselFeasibility studied of 3-wind turbines each 600 kW/1000 kW PV panels/4-Diesel Generators systemThe village, Saudi Arabia0.212 $/kWh[73]
Wind-PV with Diesel Studied the electrical energy demand of 15,943 MWh yearly in the remote villageRawdhat Bin Habbas, Saudi Arabia0.118 $/kWh[80]
Wind-PVThe government initiate projects planningTen remote locations across Saudi Arabia300 MW[68]
WindProvided the data collection and in the western region through Global Wind EnergyRed Sea shore20 MW[81]
Geothermal Studies show that the Jazan province characteristic of high heat flow and high geothermal gradientJazan province134 × 106 kWh[82]
GeothermalThe study conducted there is a potential of geothermal resource Al-Kouba, Jazan17.847 MWh[83]
GeothermalThe location has the most potential geothermal resourceWadi Al-Lith1.713 × 1017 J + 26.99 MWh[84]

References

  1. Ahmed, W.; Fardan, H.; Asif, M. Integration of building energy modeling in the design process to improve sustainability standards in the residential sector—Case study of the Eastern Province of Saudi Arabia. In Proceedings of the 2017 IEEE International Conference on Smart Energy Grid Engineering (SEGE), Oshawa, ON, Canada, 14–17 August 2017; pp. 309–314. [Google Scholar]
  2. Alrashed, F.; Asif, M. Trends in Residential Energy Consumption in Saudi Arabia with Particular Reference to the Eastern Province. J. Sustain. Dev. Energy Water Environ. Syst. 2014, 2, 376–387. [Google Scholar] [CrossRef] [Green Version]
  3. Tiseo, I. Carbon Dioxide Emissions from Fossil Fuel and Industrial Purposes in Saudi Arabia from 1990 to 2018. 2020. Available online: https://www.statista.com/statistics/486065/co2-emissions-saudi-arabia-fossil-fuel-and-industrial-purposes/ (accessed on 20 February 2021).
  4. Alhashmi, M.; Haider, H.; Hewage, K.; Sadiq, R. Energy Efficiency and Global Warming Potential in the Residential Sector: Comparative Evaluation of Canada and Saudi Arabia. J. Arch. Eng. 2017, 23, 04017009. [Google Scholar] [CrossRef]
  5. Harris, J.; Diamond, R.; Iyer, M.; Payne, C.; Blumstein, C.; Siderius, H.-P. Towards a sustainable energy balance: Progressive efficiency and the return of energy conservation. Energy Effic. 2008, 1, 175–188. [Google Scholar] [CrossRef]
  6. Acemoglu, D.; Zilibotti, F. Was Prometheus Unbound by Chance? Risk, Diversification, and Growth. J. Politi Econ. 1997, 105, 709–751. [Google Scholar] [CrossRef] [Green Version]
  7. Dornbusch, B.R.; Fischer, S.; Samuelson, P.A. American Economic Association Comparative Advantage, Trade, and Payments in a Ricardian Model with a Continuum of Goods. Am. Econ. Rev. 1977, 67, 823–839. [Google Scholar]
  8. Södersten, B.; Burenstam-Linder, S. An Essay on Trade and Transformation. Èkon. Tidskr. 1961, 63, 284. [Google Scholar] [CrossRef]
  9. Office for Official Publications of the European Communities. Green Paper on Energy Eficiency or Doing More with Less; Document 52005DC0265; Office for Official Publications of the European Communities: Brussels, Belgium, 2005. [Google Scholar]
  10. Kuronen, M.; Junnila, S.; Majamaa, W.; Niiranen, I. Public-Private-People Partnership as a Way to Reduce Carbon Dioxide Emissions from Residential Development. Int. J. Strat. Prop. Manag. 2010, 14, 200–216. [Google Scholar] [CrossRef] [Green Version]
  11. Ruparathna, R.; Hewage, K.; Sadiq, R. Improving the energy efficiency of the existing building stock: A critical review of commercial and institutional buildings. Renew. Sustain. Energy Rev. 2016, 53, 1032–1045. [Google Scholar] [CrossRef]
  12. Zatari, T.M.; Alsarhan, M.A.; UNFCCC. Third National Communication of the Kingdom of Saudi Arabia. The United Nations Framework Convention on Climate Change. 2016. Available online: https://unfccc.int/files/national_reports/non-annex_i_natcom/application/pdf/saudi_arabia_nc3_22_dec_2016.pdf (accessed on 24 February 2021).
  13. Chhipi-Shrestha, G.; Hewage, K.; Sadiq, R. Impacts of neighborhood densification on water-energy-carbon nexus: Investigating water distribution and residential landscaping system. J. Clean. Prod. 2017, 156, 786–795. [Google Scholar] [CrossRef]
  14. Kuosmanen, T.; Kortelainen, M. Valuing environmental factors in cost–benefit analysis using data envelopment analysis. Ecol. Econ. 2007, 62, 56–65. [Google Scholar] [CrossRef] [Green Version]
  15. Crawford, R.H.; Czerniakowski, I.; Fuller, R.J. A comprehensive framework for assessing the life-cycle energy of building construction assemblies. Arch. Sci. Rev. 2010, 53, 288–296. [Google Scholar] [CrossRef] [Green Version]
  16. Alhashmi, M.; Chhipi-shrestha, G.; Ruparathna, R.; Nahiduzzaman, K.; Kasun, H.; Sadiq, R. Energy Performance Assessment Framework for Residential Buildings in Saudi Arabia. Sustainability 2021, 13, 2232. [Google Scholar] [CrossRef]
  17. Wang, C.; Zhang, S.H.; Wang, P.F.; Hou, J.; Zhang, W.J.; Li, W.; Lin, Z.P. The effect of excess Zn on mineral nutrition and antioxidative response in rapeseed seedlings. Chemosphere 2009, 75, 1468–1476. [Google Scholar] [CrossRef]
  18. Aljarboua, Z. The national energy strategy for Saudi Arabia. World Acad. Sci. Eng. Technol. 2009, 33, 501–510. [Google Scholar] [CrossRef]
  19. Goldenberg, S. Conservative Thinktanks Step Up Attacks Against Obama’s Clean Energy Strategy, 8–10. 2012. Available online: http://www.wwnw.org/uploads/home/Guardianstory050812.pdf (accessed on 12 January 2021).
  20. Kotzebue, J.R.; Weissenbacher, M. The EU’s Clean Energy strategy for islands: A policy perspective on Malta’s spatial governance in energy transition. Energy Policy 2020, 139, 111361. [Google Scholar] [CrossRef]
  21. Al-Sharafi, A.; Sahin, A.Z.; Ayar, T.; Yilbas, B.S. Techno-economic analysis and optimization of solar and wind energy systems for power generation and hydrogen production in Saudi Arabia. Renew. Sustain. Energy Rev. 2017, 69, 33–49. [Google Scholar] [CrossRef]
  22. Ko, W.; Al-Ammar, E.; Almahmeed, M. Development of Feed-in Tariff for PV in the Kingdom of Saudi Arabia. Energies 2019, 12, 2898. [Google Scholar] [CrossRef] [Green Version]
  23. Hu, G.; Mian, H.R.; Kaur, M.; Hager, J.; Hewage, K.; Sadiq, R. Optimization of Wastewater Treatment for Small Canadian Communities: An Integrated Fuzzy AHP and Grey Relational Analysis Approach; Technical Report; School of Engineering, University of British Columbia: Vancouver, BC, Canada, 2018. [Google Scholar]
  24. Esangbedo, M.O.; Che, A. Grey Weighted Sum Model for Evaluating Business Environment in West Africa. Math. Probl. Eng. 2016, 2016, 1–14. [Google Scholar] [CrossRef] [Green Version]
  25. General Authority for Statistics. Housing Bulletin Semi Annual; General Authority for Statistics: Riyadh, Saudi Arabia, 2018. [Google Scholar]
  26. Almazroui, M.; Islam, M.N.; Saeed, S.; Saeed, F.; Ismail, M. Future Changes in Climate over the Arabian Peninsula based on CMIP6 Multimodel Simulations. Earth Syst. Environ. 2020, 4, 611–630. [Google Scholar] [CrossRef]
  27. Environment Canada. Recent climate change in the Arabian Peninsula: Seasonal rainfall and temperature climatology of Saudi Arabia for 1979-2009. Climate 2016, 3, 578–626. [Google Scholar]
  28. Krishna, L. Long Term Temperature Trends in Four Different Climatic Zones of Saudi Arabia. Int. J. Appl. Sci. Technol. 2014, 4, 233–242. [Google Scholar]
  29. Almazroui, M.; Islam, P.D.M.N.; Jones, P.; Athar, H.; Rahman, M.A. Recent climate change in the Arabian Peninsula: Seasonal rainfall and temperature climatology of Saudi Arabia for 1979–2009. Atmos. Res. 2012, 111, 29–45. [Google Scholar] [CrossRef]
  30. bp Solar. 50 Watt Photovoltaic Module Bp 350. 2020. Available online: www.bpsolar.com (accessed on 1 January 2021).
  31. Sun Xtender. PVX-2120L Solar Battery (Volume 76). 2009. Available online: www.sunxtender.com (accessed on 19 February 2021).
  32. Wogan, D.; Carey, E.; Cooke, D. Policy Pathways to Meet Saudi Arabia’s Contributions to the Paris Agreement; Technical Report; The King Abdullah Petroleum Studies and Research Center: Riyadh, Saudi Arabia, August 2019; p. 28. [Google Scholar]
  33. Wogan, D.; Carey, E.; Cooke, D. Policy Pathways to Meet Saudi Arabia’s Contribution to the Paris Agreement; Technical Report; The King Abdullah Petroleum Studies and Research Center: Riyadh, Saudi Arabia, February 2019; p. 44. [Google Scholar]
  34. Alegana, V.A.; Atkinson, P.; Pezzulo, C.; Sorichetta, A.; Weiss, D.; Bird, T.; Erbach-Schoenberg, E.; Tatem, A.J. Fine resolution mapping of population age-structures for health and development applications. J. R. Soc. Interface 2015, 12, 20150073. [Google Scholar] [CrossRef] [Green Version]
  35. Climate Transparency. Brown to Green: The G20 Transition to a Low-Carbon Economy—Saudi Arabia. 2018. Available online: https://www.climate-transparency.org/wp-content/uploads/2019/01/2018-BROWN-TO-GREEN-REPORT-FINAL.pdf (accessed on 20 January 2021).
  36. Chen, C.; Noble, I.; Hellmann, J.; Coffee, J.; Murillo, M.; Chawla, N.R. University of Notre Dame Global Adaptation Index Country Index Technical Report; University of Notre Dame: Notre Dame, IN, USA, 2015. [Google Scholar]
  37. CDIAC. Saudi Arabia Fossil-Fuel CO2 Emissions. 2019. Available online: https://cdiac.ess-dive.lbl.gov/trends/emis/tre_sau.html (accessed on 23 January 2021).
  38. United States Environmental Protection Agency. Greenhouse Gas Equivalencies Calculator. 2020. Available online: https://www.epa.gov/energy/greenhouse-gas-equivalencies-calculator (accessed on 25 January 2021).
  39. International Energy Agency. Key World Energy Statistics 2014. Available online: https://www.oecd-ilibrary.org/energy/key-world-energy-statistics-2014_key_energ_stat-2014-en (accessed on 27 January 2021).
  40. Krarti, M.; Dubey, K.; Howarth, N. Evaluation of building energy efficiency investment options for the Kingdom of Saudi Arabia. Energy 2017, 134, 595–610. [Google Scholar] [CrossRef]
  41. Saudi Energy Efficiency Center About SEEC. 2020. Available online: https://www.seec.gov.sa/en/content/objective (accessed on 3 January 2021).
  42. Saudi Energy Efficiency Center About SEEP. 2020. Available online: https://www.seec.gov.sa/en/content/about-program (accessed on 3 January 2021).
  43. Electricity & Congeneration Regulatory Authority. Electricity Industry Restructuring Plan. 2020. Available online: https://www.ecra.gov.sa/en-us/AboutECRA/pages/Mission.aspx (accessed on 2 February 2021).
  44. Saudi Aramco. The Many Layers of Opportunity. 2016. Available online: https://www.aramco.com/-/media/publications/corporate-reports/2016-annualreview-full-en.pdf (accessed on 4 February 2021).
  45. Aramco, S. Energy Is Opportunity. Annu. Rev. 2013, 53, 1689–1699. [Google Scholar] [CrossRef]
  46. SABIC. Together for Success. 2017. Available online: https://www.sabic.com/assets/en/Images/SABIC_SR_FINAL_2018_tcm1010-18598.pdf (accessed on 6 February 2021).
  47. Saudi Arabian Monetary Authority. Saudi Arabia Short Term Interest Rate. 2020. Available online: https://www.ceicdata.com/en/indicator/saudi-arabia/short-term-interest-rate (accessed on 7 February 2021).
  48. Jun, H. Saudi Arabia’s Domestic Energy Situation and Policy: Focusing on Its Power Sector. Kyoto Bull. Islam. Area Stud. 2013, 6, 107–135. [Google Scholar]
  49. Alrashed, F.; Asif, M. Analysis of critical climate related factors for the application of zero-energy homes in Saudi Arabia. Renew. Sustain. Energy Rev. 2015, 41, 1395–1403. [Google Scholar] [CrossRef]
  50. Ministry of Industry and Mineral Resources. Saudi Arabia National Renewable Energy Program National Renewable Energy Program. 2018. Available online: https://ksa-climate.com/wp-content/uploads/2018/12/Saudi-Arabia-National-Renewable-Energy-Program.pdf (accessed on 13 February 2021).
  51. Rahman, F.; Rehman, S.; Abdul-Majeed, M.A. Overview of energy storage systems for storing electricity from renewable energy sources in Saudi Arabia. Renew. Sustain. Energy Rev. 2012, 16, 274–283. [Google Scholar] [CrossRef]
  52. El Khashab, H.; Al Ghamedi, M. Comparison between hybrid renewable energy systems in Saudi Arabia. J. Electr. Syst. Inf. Technol. 2015, 2, 111–119. [Google Scholar] [CrossRef] [Green Version]
  53. Eltamaly, A.M.; Mohamed, M.A.; Alolah, A.I. A novel smart grid theory for optimal sizing of hybrid renewable energy systems. Sol. Energy 2016, 124, 26–38. [Google Scholar] [CrossRef]
  54. Mas’ud, A.A. An optimal sizing algorithm for a hybrid renewable energy system. Int. J. Renew. Energy Res. 2017, 7, 1595–1602. [Google Scholar]
  55. Mohamed, M.A.; Eltamaly, A.M.; Alolah, A.I. PSO-Based Smart Grid Application for Sizing and Optimization of Hybrid Renewable Energy Systems. PLoS ONE 2016, 11, e0159702. [Google Scholar] [CrossRef] [PubMed]
  56. Designated National Authority. The First Biennial Update Report: Kingdom of Saudi Arabia. 2018. Available online: https://unfccc.int/sites/default/files/resource/FSV_Saudi%20Arabia_COP25_Madrid.pdf (accessed on 10 February 2021).
  57. Oxford Business Group. Expansion Ahead Ongoing Development Six Economic Cities Focus Non-Oil Growth. 2017. Available online: https://www.oxfordbusinessgroup.com/overview/expansion-ahead-ongoing-development-six-economic-cities-focus-non-oil-growth%0A (accessed on 14 January 2021).
  58. Defignated National Authority. The First Biennial Update Report Kingdon of Saudi Arabia. 2018. Available online: https://unfccc.int/sites/default/files/resource/18734625_Saudi%20Arabia-BUR1-1-BUR1-Kingdom%20of%20Saudi%20Arabia.pdf (accessed on 14 February 2021).
  59. Gaafar, A.; Iqniebi, A.; Sheereen, A.; Eldali, A.; Turpeinen, H.; Adra, C.; Al Meshari, K.; Al Hussein, K. Study of the cytokine polymorphisms in correlation to rejection and graft survival in renal allograft donors and recipients from a homogenous Saudi population. Transpl. Immunol. 2014, 30, 34–39. [Google Scholar] [CrossRef]
  60. Khorsheed, M.S.; Al-Fawzan, M.A.; Al-Hargan, A. Promoting techno-entrepreneurship through incubation: An overview at BADIR program for technology incubators. Innovation 2014, 16, 238–249. [Google Scholar] [CrossRef] [Green Version]
  61. Jadwa Investment. Natural Gas and the Vision 2030 Summary. 2016. Available online: http://www.jadwa.com (accessed on 2 February 2021).
  62. Climate Action Tracker. Saudi Arabia. 2019. Available online: https://climateactiontracker.org/countries/saudi-arabia/ (accessed on 5 January 2021).
  63. Ontario Power Authority. Look for These Energy-Efficient Features when Buying a New Home. 2007. Available online: https://www.saveonenergy.ca (accessed on 19 February 2021).
  64. Electricity and Cogeneration Regulatory Authority. Electricity Service Guide Saudi Arabia. 2019. Available online: https://www.ecra.gov.sa/en-us/ECRARegulations/Evidences/Evidences/Electricity%20Service%20Guide.pdf (accessed on 20 February 2021).
  65. Ministry of Energy, Industry, and M.R. Energy Action. 2020. Available online: https://www.meim.gov.sa/arabic/Pages/default.aspx (accessed on 10 February 2021).
  66. Saudi Energy Efficiency Center. Saudi Energy Efficiency Program. 2018. Available online: https://cdn.ymaws.com/www.linkme.qa/resource/resmgr/Presentations/Saudi_Energy_Efficiency_Prog.pdf (accessed on 22 February 2021).
  67. Matar, W.; Murphy, F.; Pierru, A.; Rioux, B.; Wogan, D. Efficient industrial energy use: The first step in transitioning Saudi Arabia’s energy mix. Energy Policy 2017, 105, 80–92. [Google Scholar] [CrossRef]
  68. Saudi Aramco. Annual Review. 2014. Available online: https://www.aramco.com/-/media/publications/corporate-reports/ar-2014-saudiaramco-english-full.pdf (accessed on 24 February 2021).
  69. SABIC. From Challenge to Achivement. 2013. Available online: https://www.annualreports.com/HostedData/AnnualReportArchive/s/sabic_2013.pdf (accessed on 25 February 2021).
  70. SABIC. VISION & PERFORMANCE. 2011. Available online: https://www.sabic.com/assets/zh/Images/SABIC-Annual-Report-ENGLISH_tcm11-12625.pdf (accessed on 26 February 2021).
  71. AlYahya, S.; Irfan, M.A. Analysis from the new solar radiation Atlas for Saudi Arabia. Sol. Energy 2016, 130, 116–127. [Google Scholar] [CrossRef]
  72. Mokheimer, E.M.A.; Al-Sharafi, A.; Habib, M.A.; Alzaharnah, I. A New Study for Hybrid PV/Wind off-Grid Power Generation Systems with the Comparison of Results from Homer. Int. J. Green Energy 2014, 12, 526–542. [Google Scholar] [CrossRef]
  73. Rehman, S.; Alam, M.; Meyer, J.; Al-Hadhrami, L.M. Feasibility study of a wind–pv–diesel hybrid power system for a village. Renew. Energy 2012, 38, 258–268. [Google Scholar] [CrossRef] [Green Version]
  74. Elhadidy, M. Performance evaluation of hybrid (wind/solar/diesel) power systems. Renew. Energy 2002, 26, 401–413. [Google Scholar] [CrossRef]
  75. Rehman, S. Wind energy resources assessment for Yanbo, Saudi Arabia. Energy Convers. Manag. 2004, 45, 2019–2032. [Google Scholar] [CrossRef]
  76. Shaahid, S.; Al-Hadhrami, L.; Rahman, M. Economic feasibility of development of wind power plants in coastal locations of Saudi Arabia—A review. Renew. Sustain. Energy Rev. 2013, 19, 589–597. [Google Scholar] [CrossRef]
  77. Brander, A.M. Overview: Global Tracking Framework. World Bank 2013, 2, 40. [Google Scholar]
  78. Rehman, S.; El-Amin, I. Study of a Solar Pv/Wind/Diesel Hybrid Power System for a Remotely Located Population near Arar, Saudi Arabia. Energy Explor. Exploit. 2015, 33, 591–620. [Google Scholar] [CrossRef]
  79. Mokheimer, E.M.; Sahin, A.Z.; Al-Sharafi, A.; Ali, A.I. Modeling and optimization of hybrid wind–solar-powered reverse osmosis water desalination system in Saudi Arabia. Energy Convers. Manag. 2013, 75, 86–97. [Google Scholar] [CrossRef]
  80. Shaahid, S.; El-Amin, I. Techno-economic evaluation of off-grid hybrid photovoltaic–diesel–battery power systems for rural electrification in Saudi Arabia—A way forward for sustainable development. Renew. Sustain. Energy Rev. 2009, 13, 625–633. [Google Scholar] [CrossRef]
  81. GWEC. Global Wind Energy Council Report 2018. Wind Global Council Energy, (April), 1–61. 2019. Available online: www.gwec.net (accessed on 17 January 2021).
  82. Rathnaweera, T.; Ranjith, P.; Perera, S.; Haque, A.; Lashin, A.; Al-Arifi, N.; Chandrasekharam, D.; Yang, S.-Q.; Xu, T.; Wang, S.; et al. CO2-induced mechanical behaviour of Hawkesbury sandstone in the Gosford basin: An experimental study. Mater. Sci. Eng. A 2015, 641, 123–137. [Google Scholar] [CrossRef]
  83. Lashin, A.; Al Arifi, N. Geothermal energy potential of southwestern of Saudi Arabia “exploration and possible power generation”: A case study at Al Khouba area—Jizan. Renew. Sustain. Energy Rev. 2014, 30, 771–789. [Google Scholar] [CrossRef]
  84. Hussein, Z.; Hertel, T.; Golub, A. Climate change mitigation policies and poverty in developing countries. Environ. Res. Lett. 2013, 8, 035009. [Google Scholar] [CrossRef]
Figure 1. Community–government partnership framework for using low-carbon energy in buildings.
Energies 14 04954 g001
Figure 2. GHG emissions approach roadmap adapted from [11].
Energies 14 04954 g002
Figure 3. Evaluation of energy building interventions for residential building in Saudi Arabia.
Energies 14 04954 g003
Figure 4. Weighting scenarios based on AHP in the residential building, Saudi Arabia.
Energies 14 04954 g004
Figure 5. Clean energy option evaluation for the residential building based on GRA.
Energies 14 04954 g005
Figure 6. Energy-GHG-Cost in (a) southern (b) western (c) central (d) northern (e) eastern regions of Saudi Arabia.
Energies 14 04954 g006
Figure 7. Comparison of cost of energy & ESO investment cost with saving cost between 2020 to 2050 in (a) detached residential building (b) attached residential building (c) low-rise apartment building.
Energies 14 04954 g007
Figure 8. Priority scores of ESO combination in (a) southern, (b) western, (c) central, (d) northern, (e) eastern, under pro-economic; and (f) southern, (g) western, (h) central, (i) northern, (j) eastern under pro-environmental.
Energies 14 04954 g008aEnergies 14 04954 g008b
Figure 9. Total energy consumption, GHG emissions, and cost in the residential sector in Saudi Arabia in 2050.
Energies 14 04954 g009
Figure 10. Energy reduction, GHG reduction, and investment required from communities by 2050 under ideal scenarios.
Energies 14 04954 g010
Figure 11. Total GHG emissions reduction in the residential building sector by government intervention through renewable energy.
Energies 14 04954 g011
Figure 12. Total investment cost in the residential building sector in Saudi Arabia by government intervention through renewable energy.
Energies 14 04954 g012
Figure 13. Cost of the system (1, 2, 3, 4, 5, and 6) as present (af) of clean energy in the residential building sector in Saudi Arabia.
Energies 14 04954 g013
Table 1. Classified residential building distribution by geographical region in Saudi Arabia.
Geographical RegionDetached Residential BuildingAttached Residential BuildingApartment
VillaFloor in VillaTotalTraditional HouseA Floor in Traditional HouseOtherTotal
Central560,329329,969890,297191,64067,588122,567381,795991,939
Western116,36270,557186,919557,12264,308100,971722,4011,533,503
Eastern204,06065,676269,73672,90724,07134,175131,153589,694
Southern131,216118,556249,771265,44551,68428,350345,479460,359
Northern29,80921,16950,977100,76714,74724,458139,972191,746
Total1,041,776605,9261,647,7011,187,881222,399310,5221,720,8023,767,242
Table 2. Environmental and economic criteria for weighting scenarios based on AHP.
Pro-Economic Scenario: Cost > GHG > EnergyWeights
Pair-Wise Comparison Matrix
CriteriaEnergyGHGCost
Energy10.330.149%
GHG3.0010.3324%
Cost73167%
Pro-Environmental Scenario: Energy > GHG > CostWeights
Pair-Wise Comparison Matrix
CriteriaEnergyGHGCost
Energy15773%
GHG0.201319%
Cost0.140.3318%
Table 3. Energy saving initiatives in Saudi Arabia.
Plan/ProgramInitiatives
Saudi Energy Efficiency Center (SEEC)Establishing a national energy efficiency program.
Recommended energy efficiency policies and regulations.
Promote awareness about energy efficiency [41].
Saudi Energy Efficiency Program (SEEP)SEEP is designing and implementing energy efficiency initiatives and focusing on three sectors: buildings, transport, and industry [42].
Improving Saudi Arabia’s energy efficiency using a bottom-up approach.
Involve all stakeholders from inception.
Enhancing setting targets of the collection of data and their enforcement.
Electricity and Cogeneration Regulatory Authority (ECRA) has a detailed restructuring plan which is Electricity Industry Restructuring Plan (EIRP).EIRP is mainly divided into three significant milestones as follows:
The opening market for generation and distribution by unbundling Saudi Electric Company SEC for a vertical integration entity.
Establishing a company in the generation, distribution, and retail businesses.
Creating the “Parallel Market” concept for customers and suppliers based on agreed prices and conditions [43].
Table 4. GHG emissions reduction initiatives in Saudi Arabia.
Plan/ProgramInitiatives
The National Capacity Initiatives are described in the following areas:
Identifying and monitoring the sources of CO2
Minimizing CO2 formation
Reducing CO2 emissions
Transportation Development
Storage system Development
Developing carbon capture technologies by using a metal-organic framework (MOF)
Applying biological process and chemical looping combustion to develop carbon capture technologies
Producing polycarbonates and polyurethanes, enhancing oil recovery by utilizing CO2.
Converting CO2 into valuable products [12]
Saudi ARAMCO Carbon Management DivisionSome of CCUS initiatives:
Saudi Aramco’s Uthmaniyah Carbon Dioxid Enhanced Oil Recovery (CO2-EOR) in Eastern Province of Saudi Arabia; it is a pilot project to capture approximately 800 thousand ton/year CO2 [44].
The Prototype vehicle has been presented 10% of its emissions and 20% of the second prototype in 2013 [45].
Building Ethylene Glycol plants to capture 500 thousand tons/year of CO2 in the industrial city of Jubail [46].
Table 5. LESRB solution definitions.
LIRRBDefinition
1Strong important solution
2Less strong important solution
3Essential important solution
4Less important solution
Publisher’s Note: MDPI stays neutral with regard to jurisdictional claims in published maps and institutional affiliations.

