
A Hybrid Simulation Model to Predict the Cooling Energy Consumption for Residential Housing in Hong Kong


Abstract
:
1. Introduction
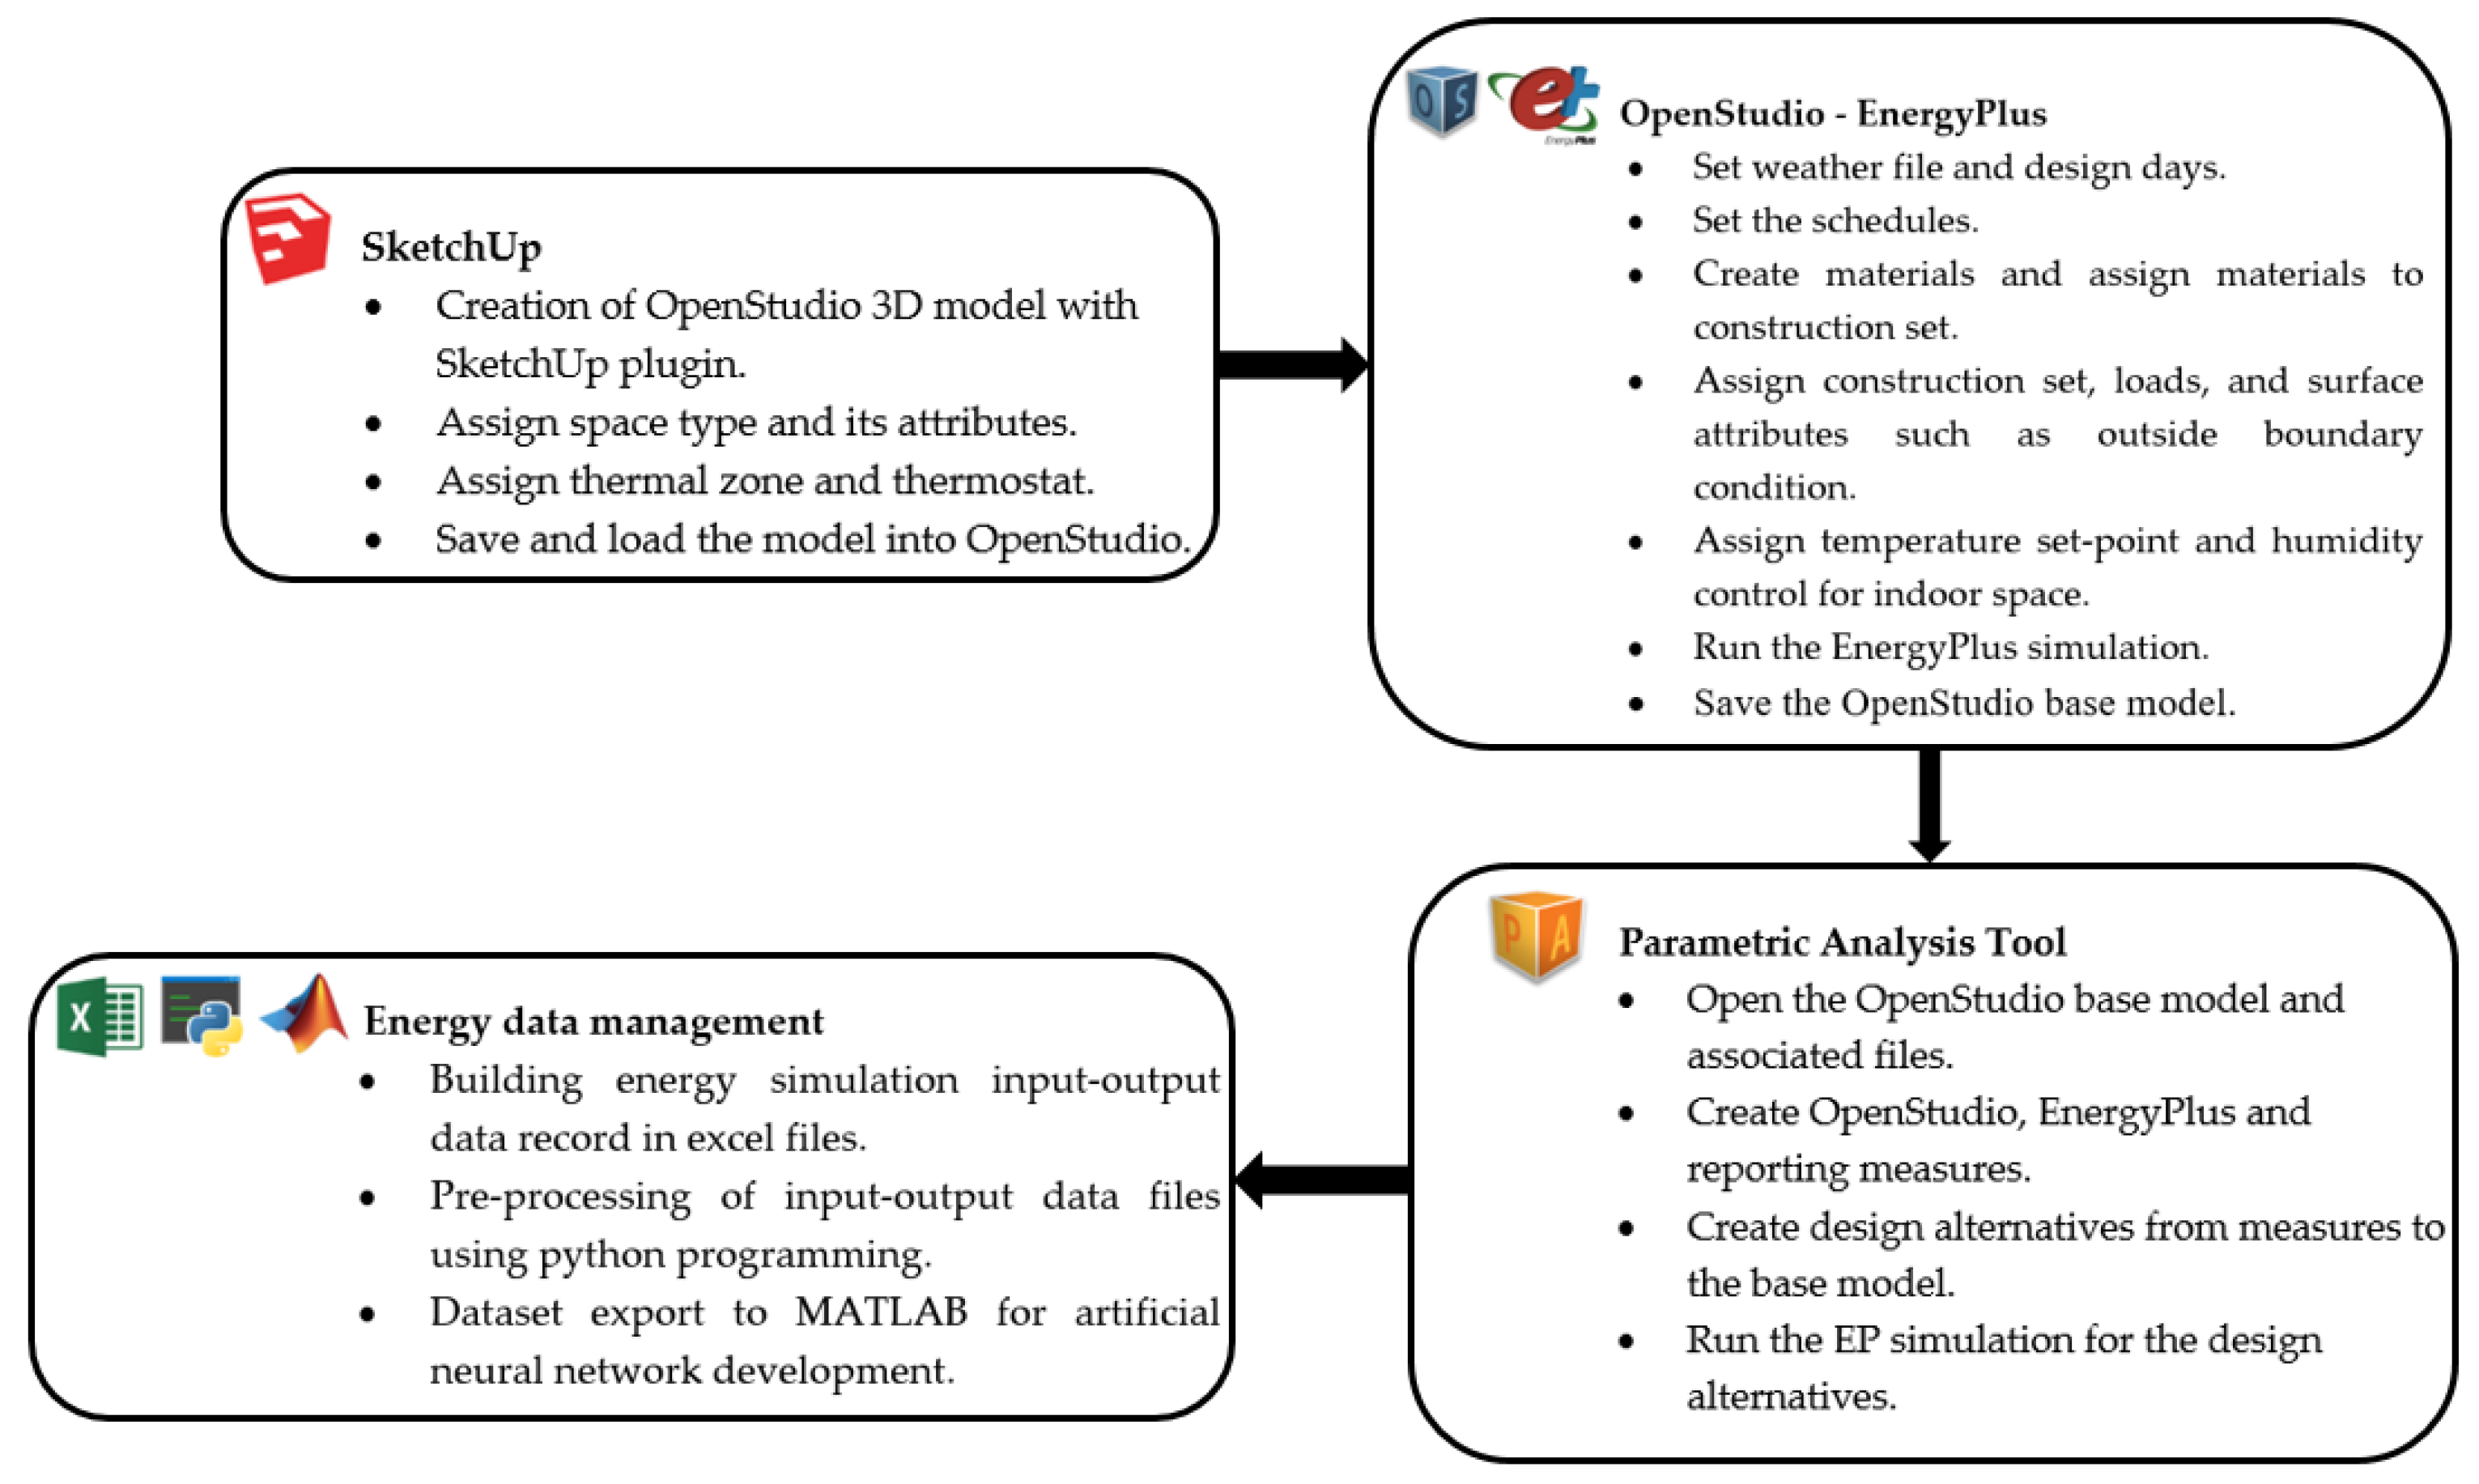
2. Methodology
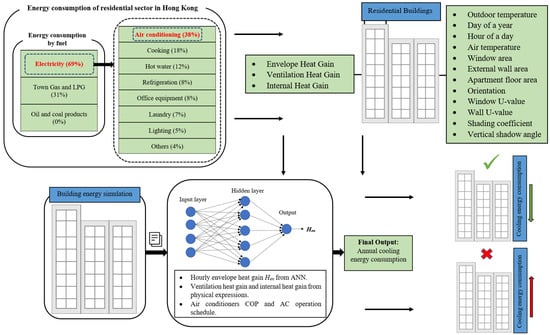
2.1. Cooling Energy Consumption
2.2. Prediction of Envelope Heat Gain through a White Box Model
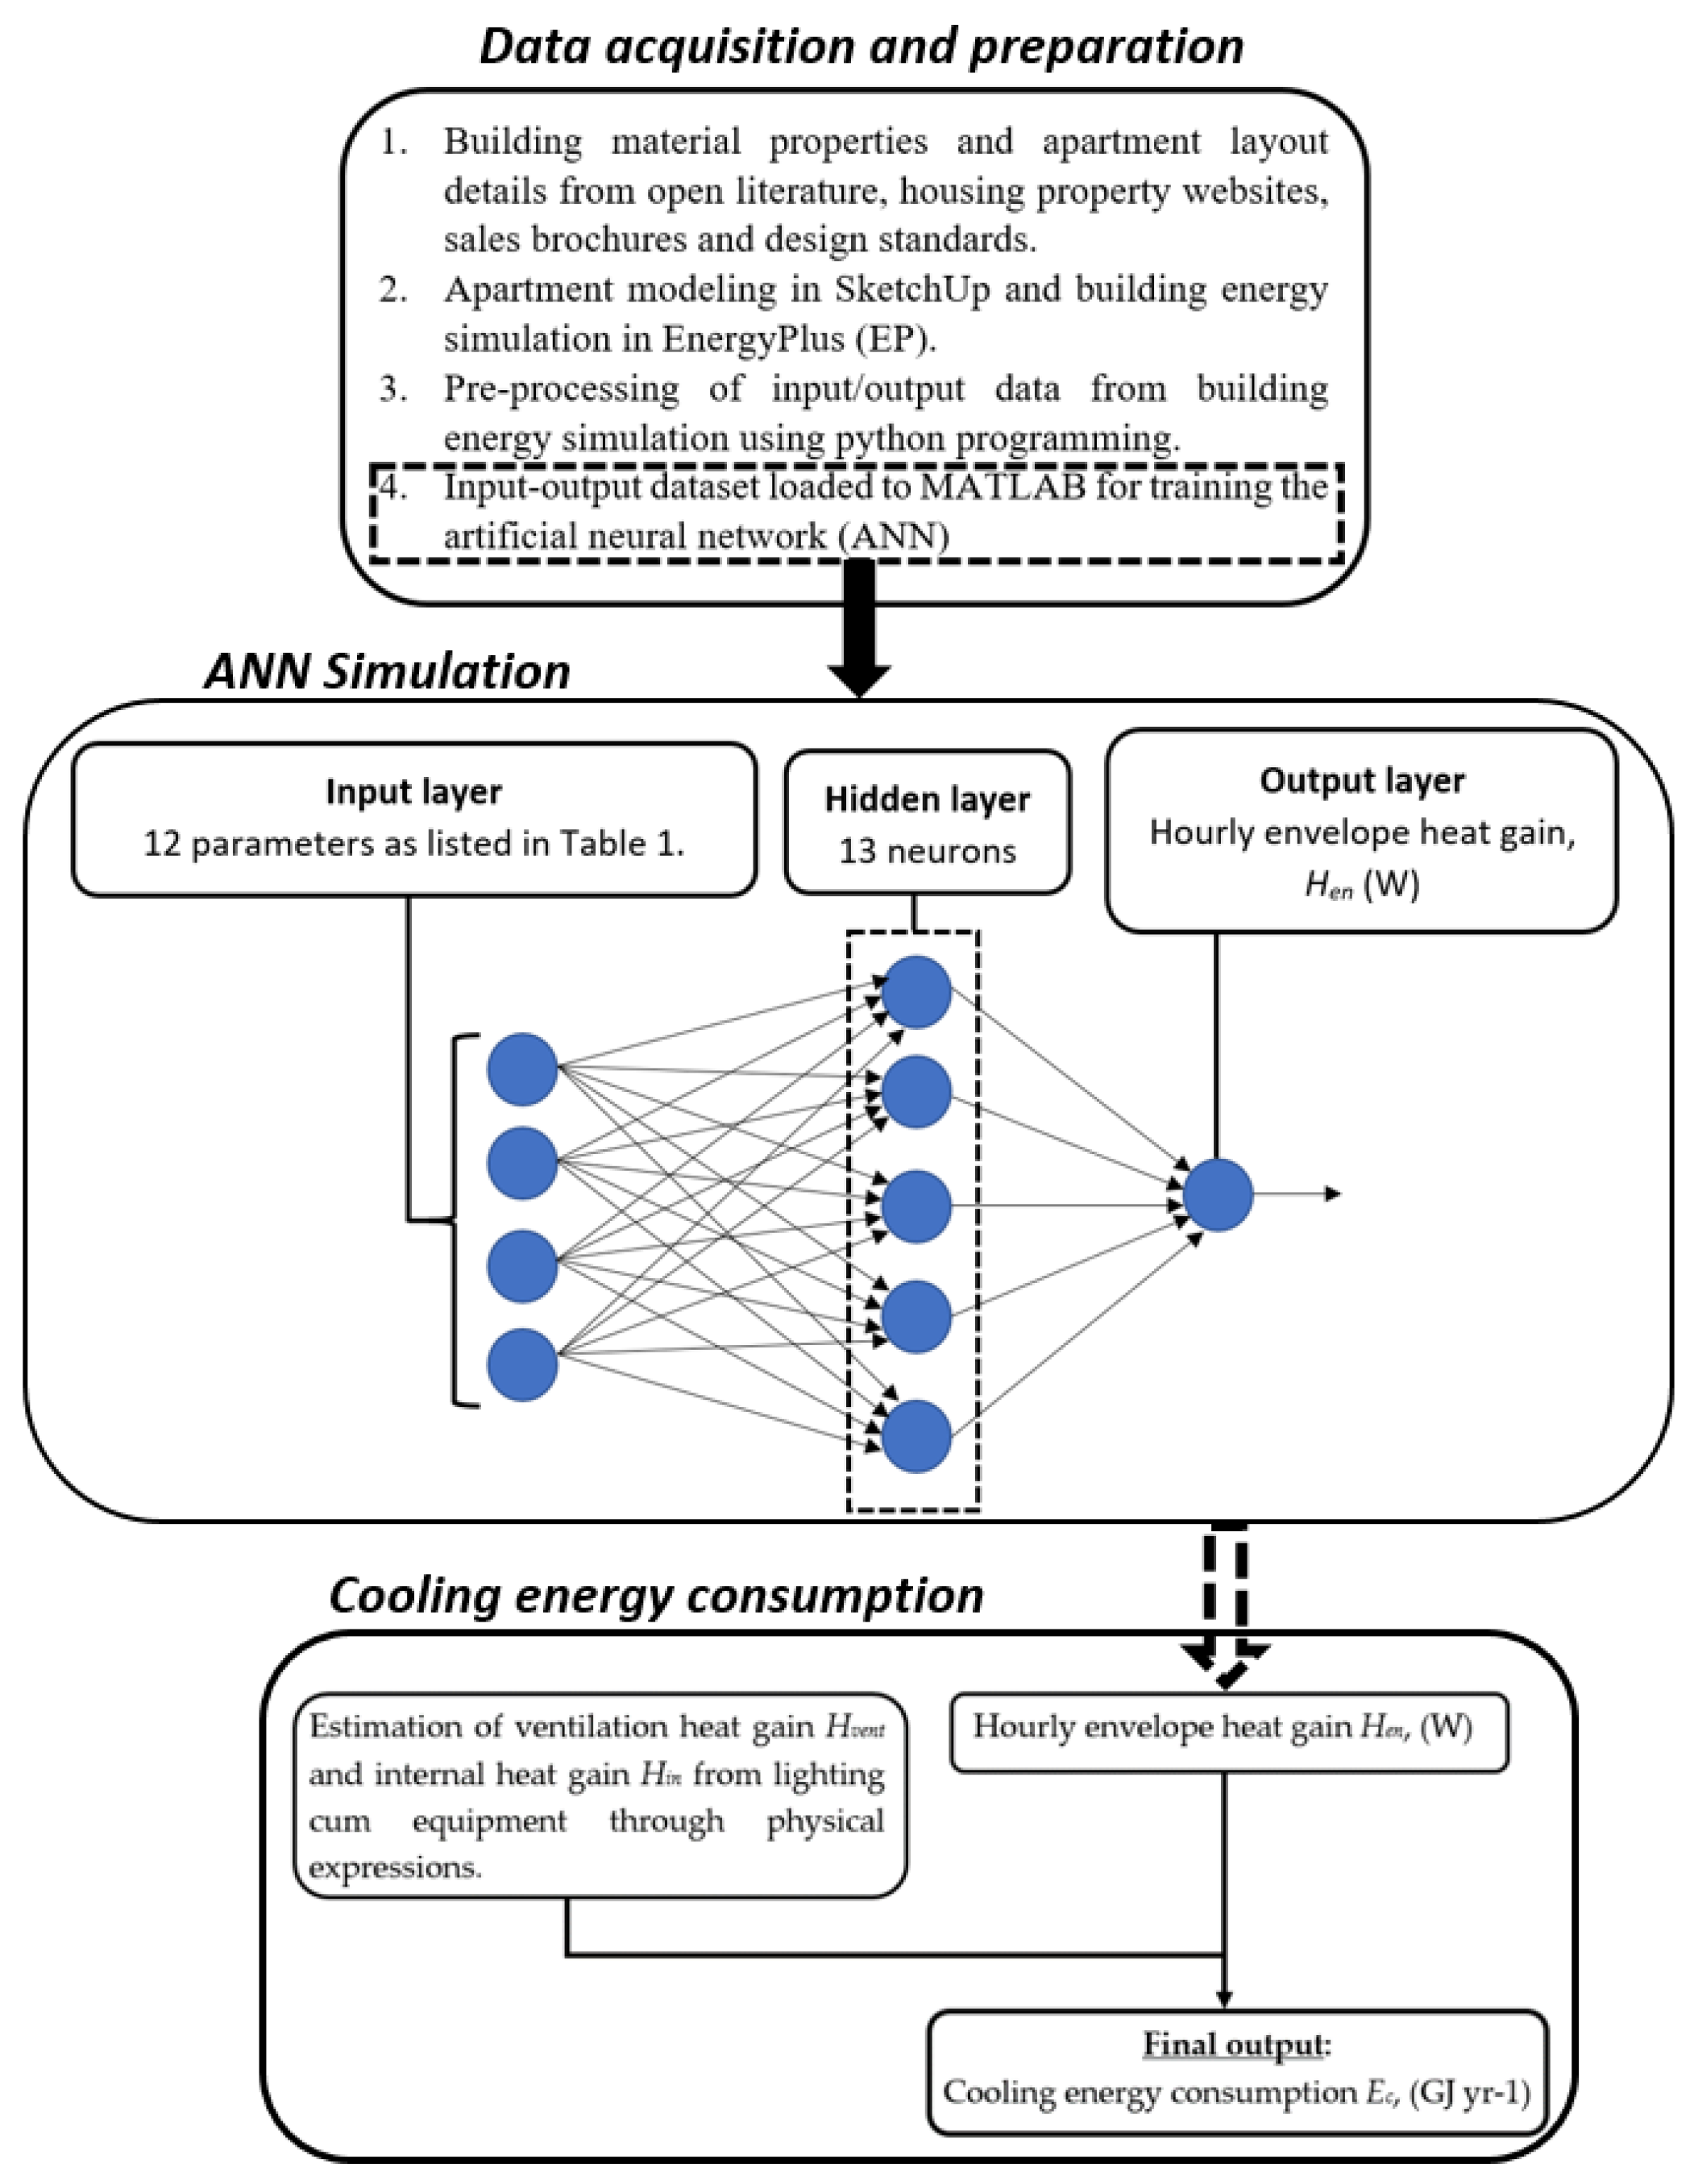
2.3. Neural Network
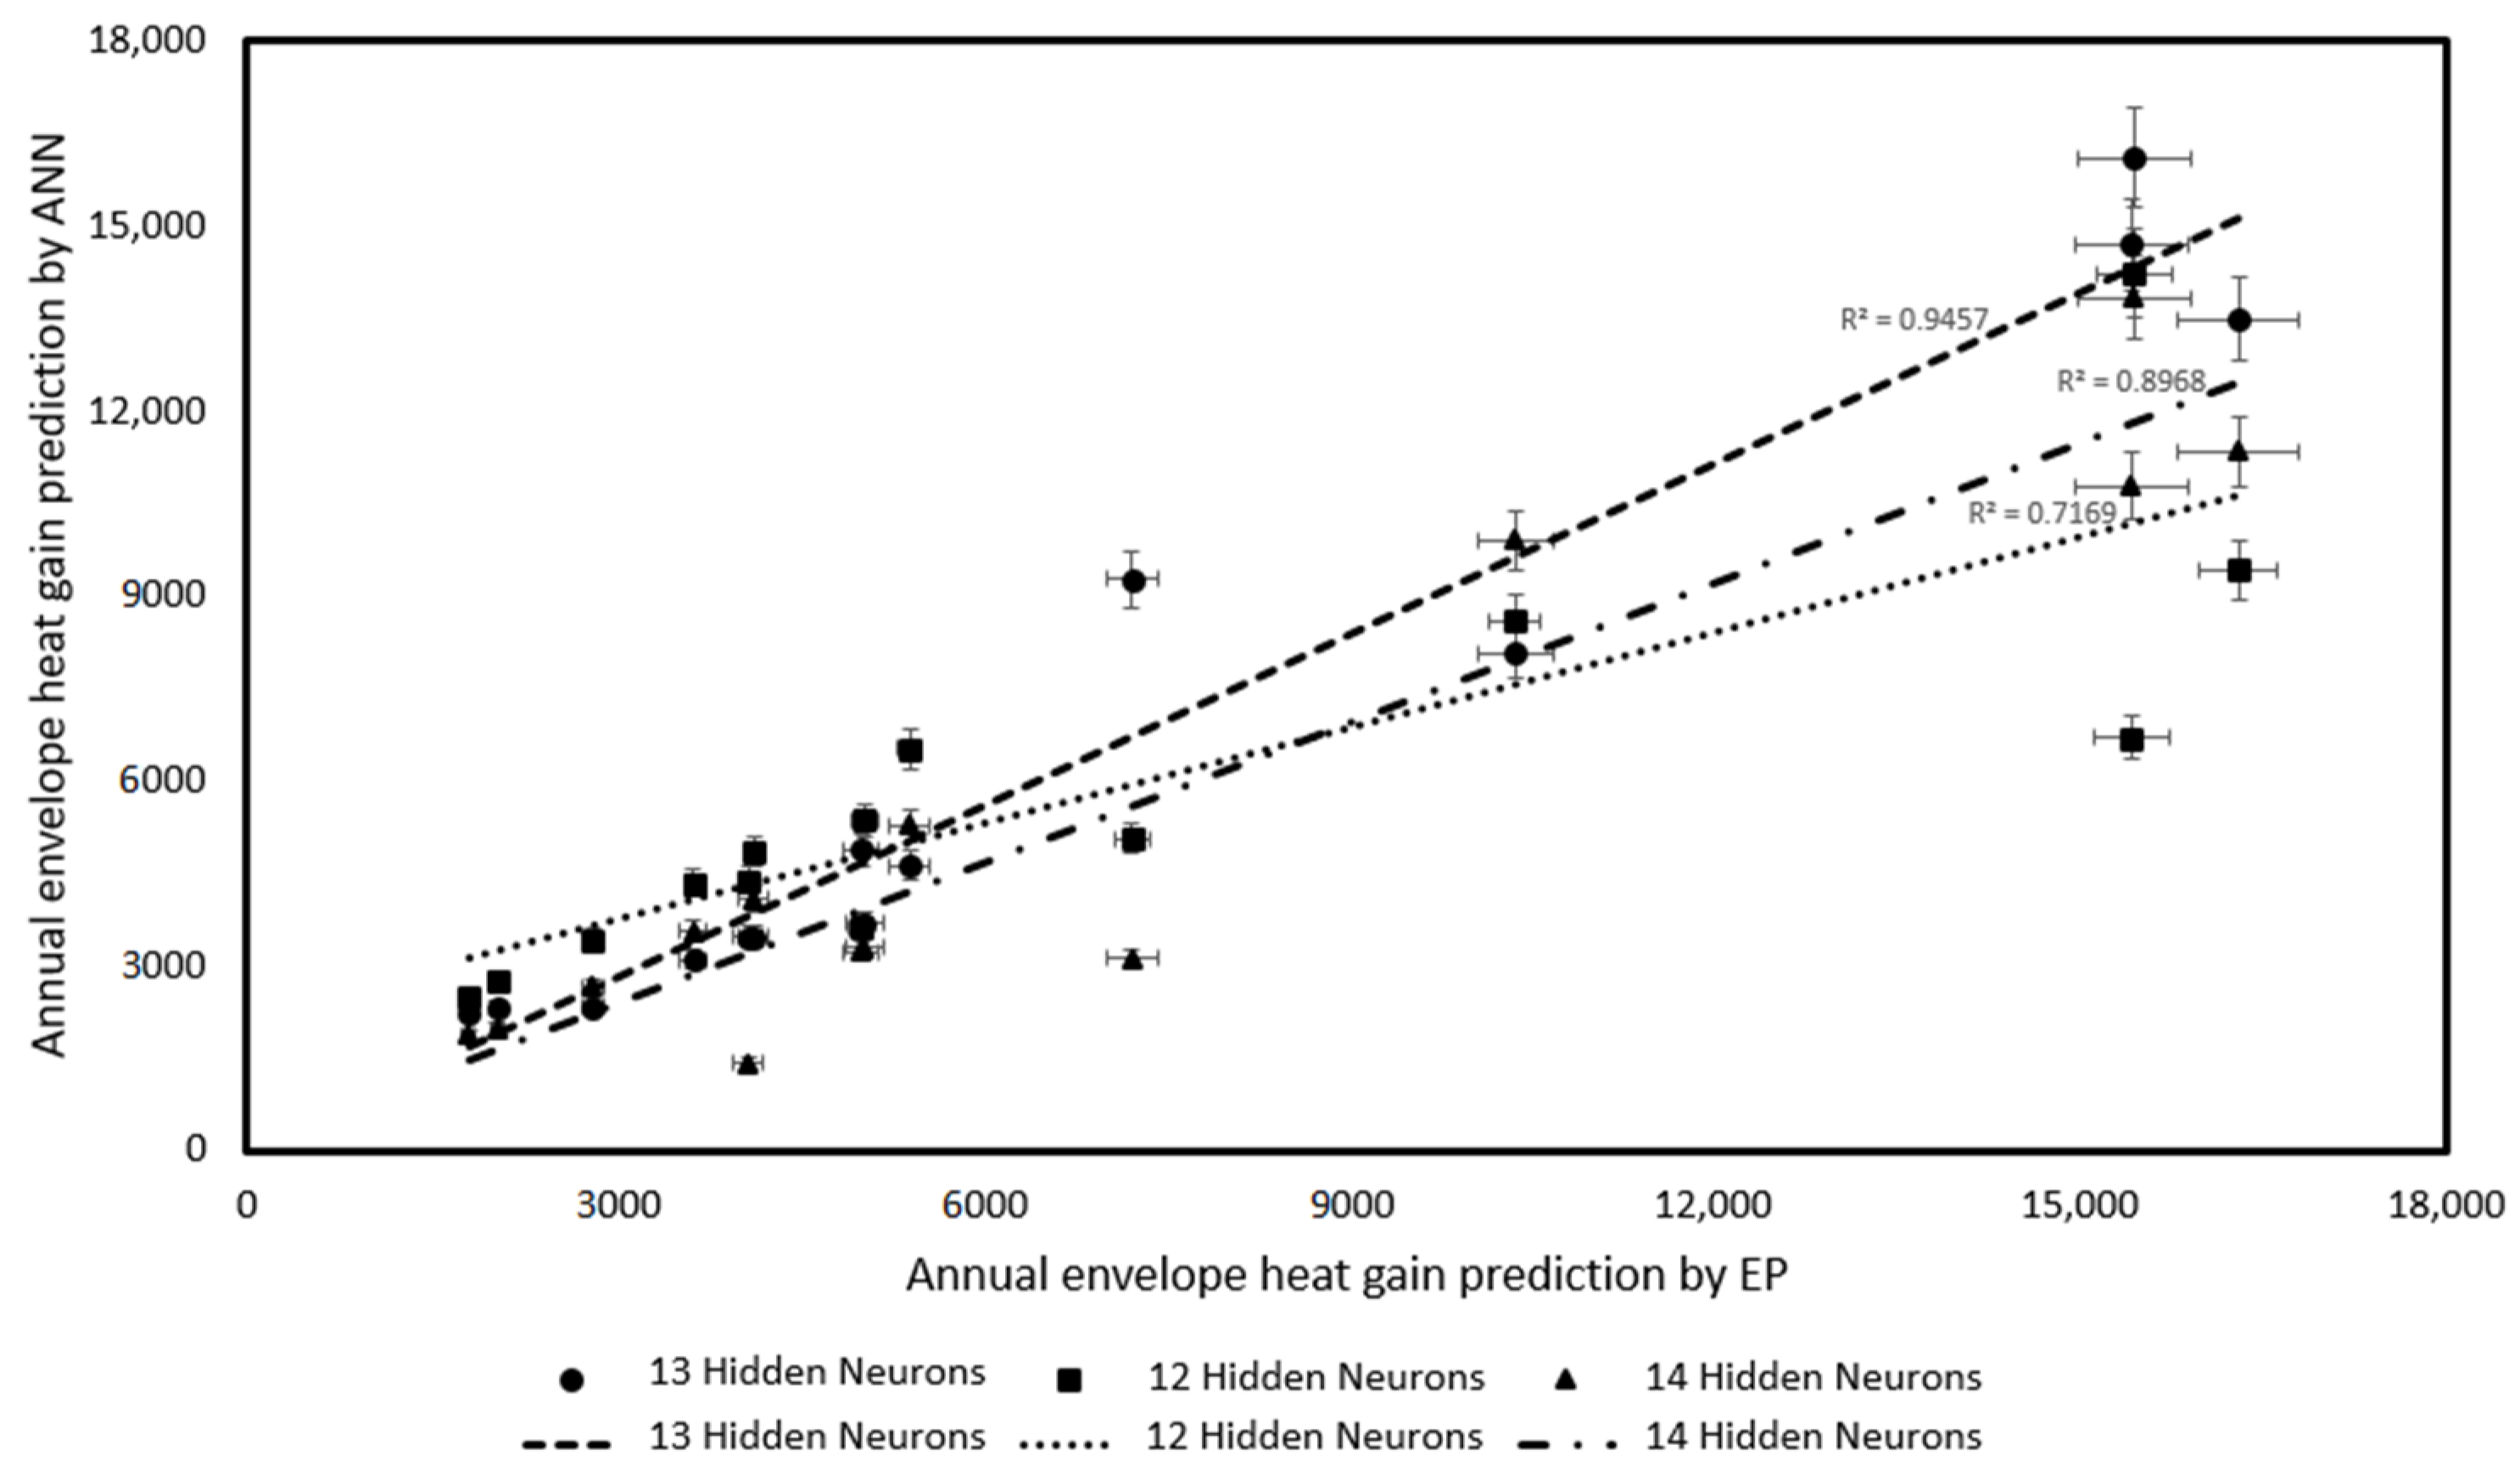
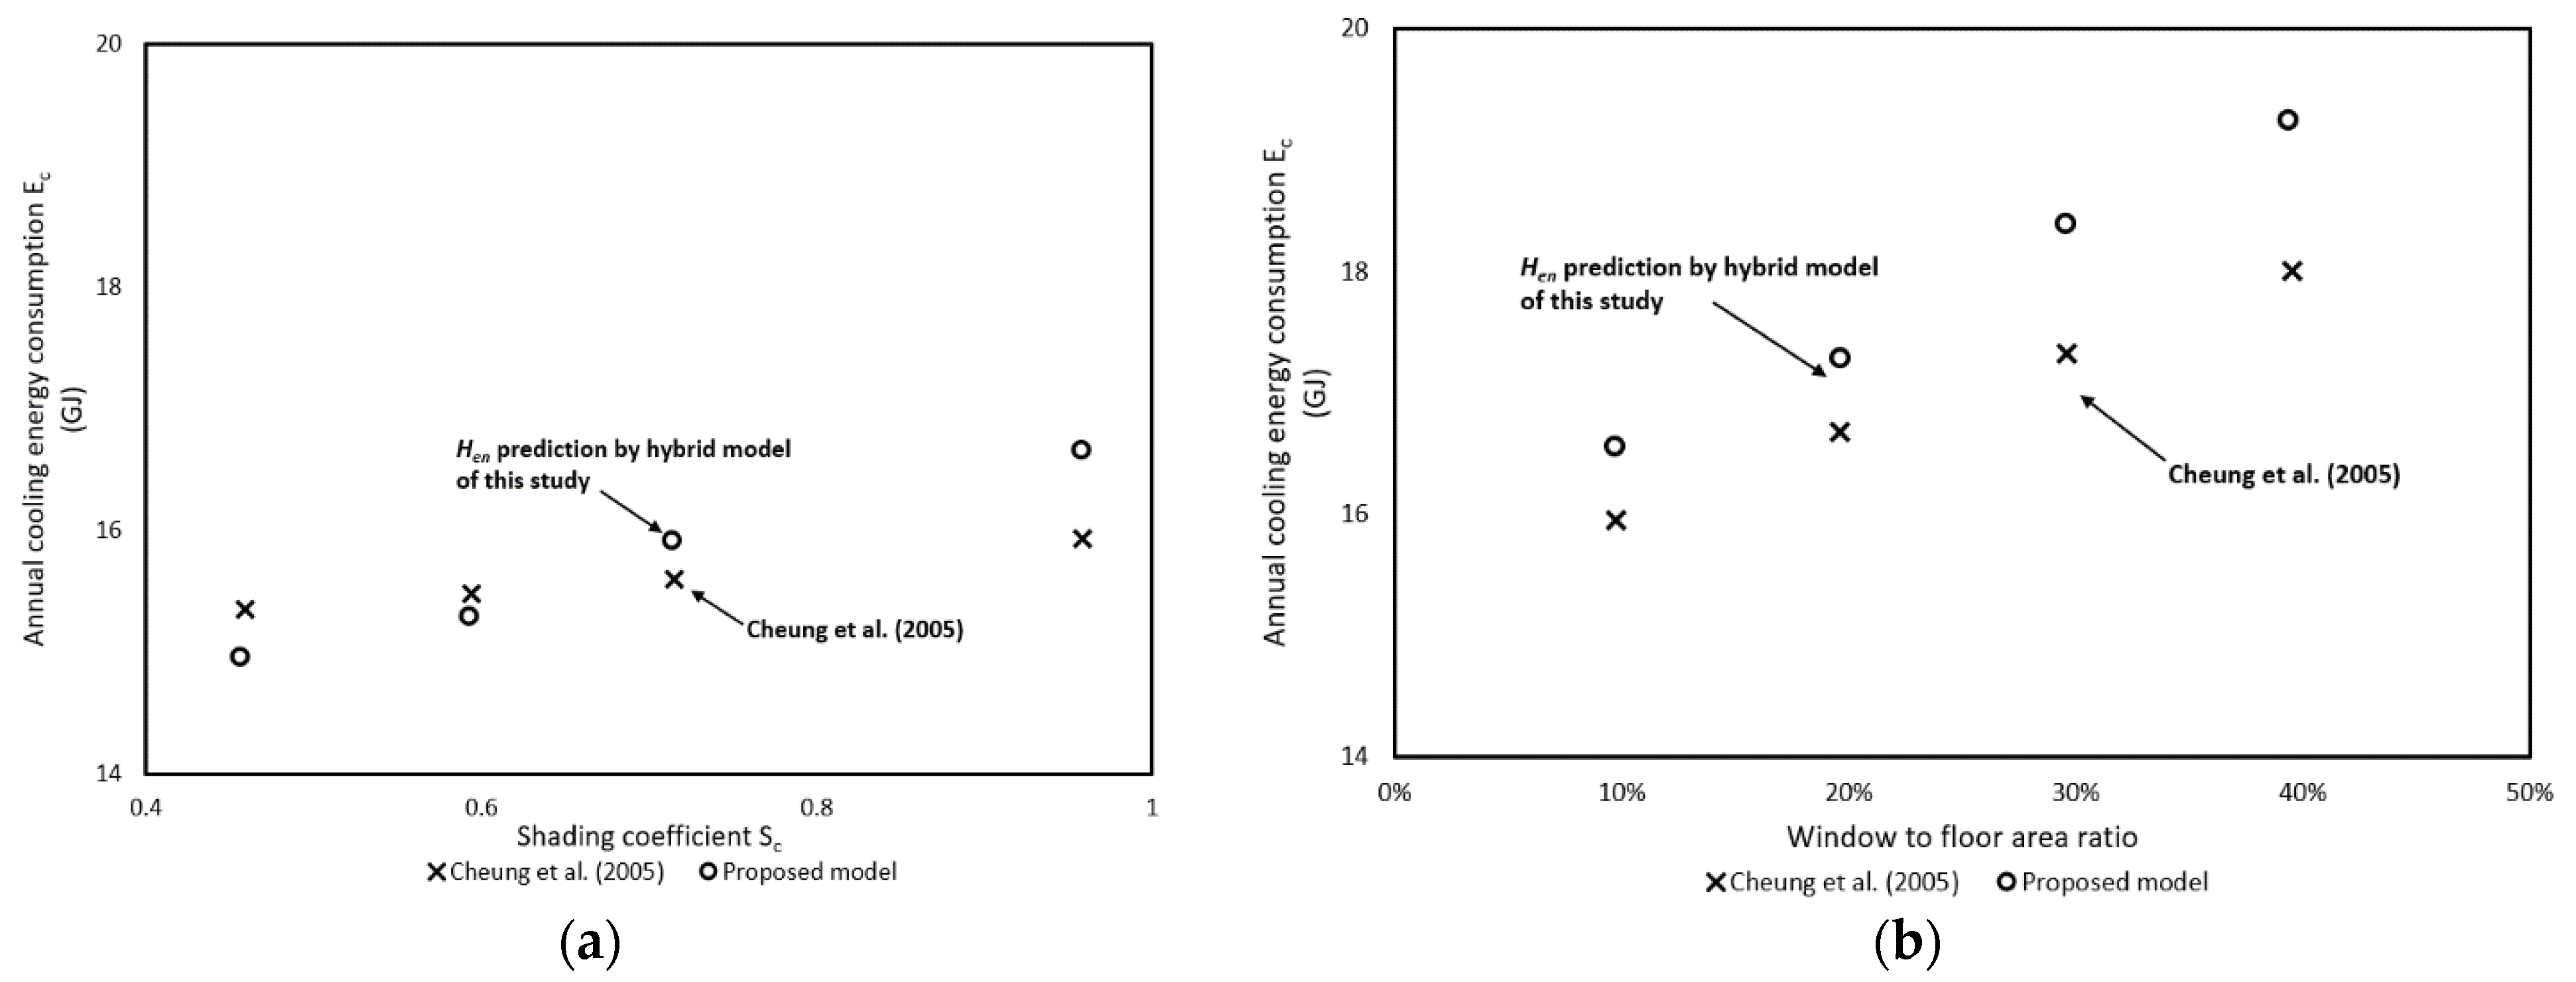
3. Model Validation
4. Results
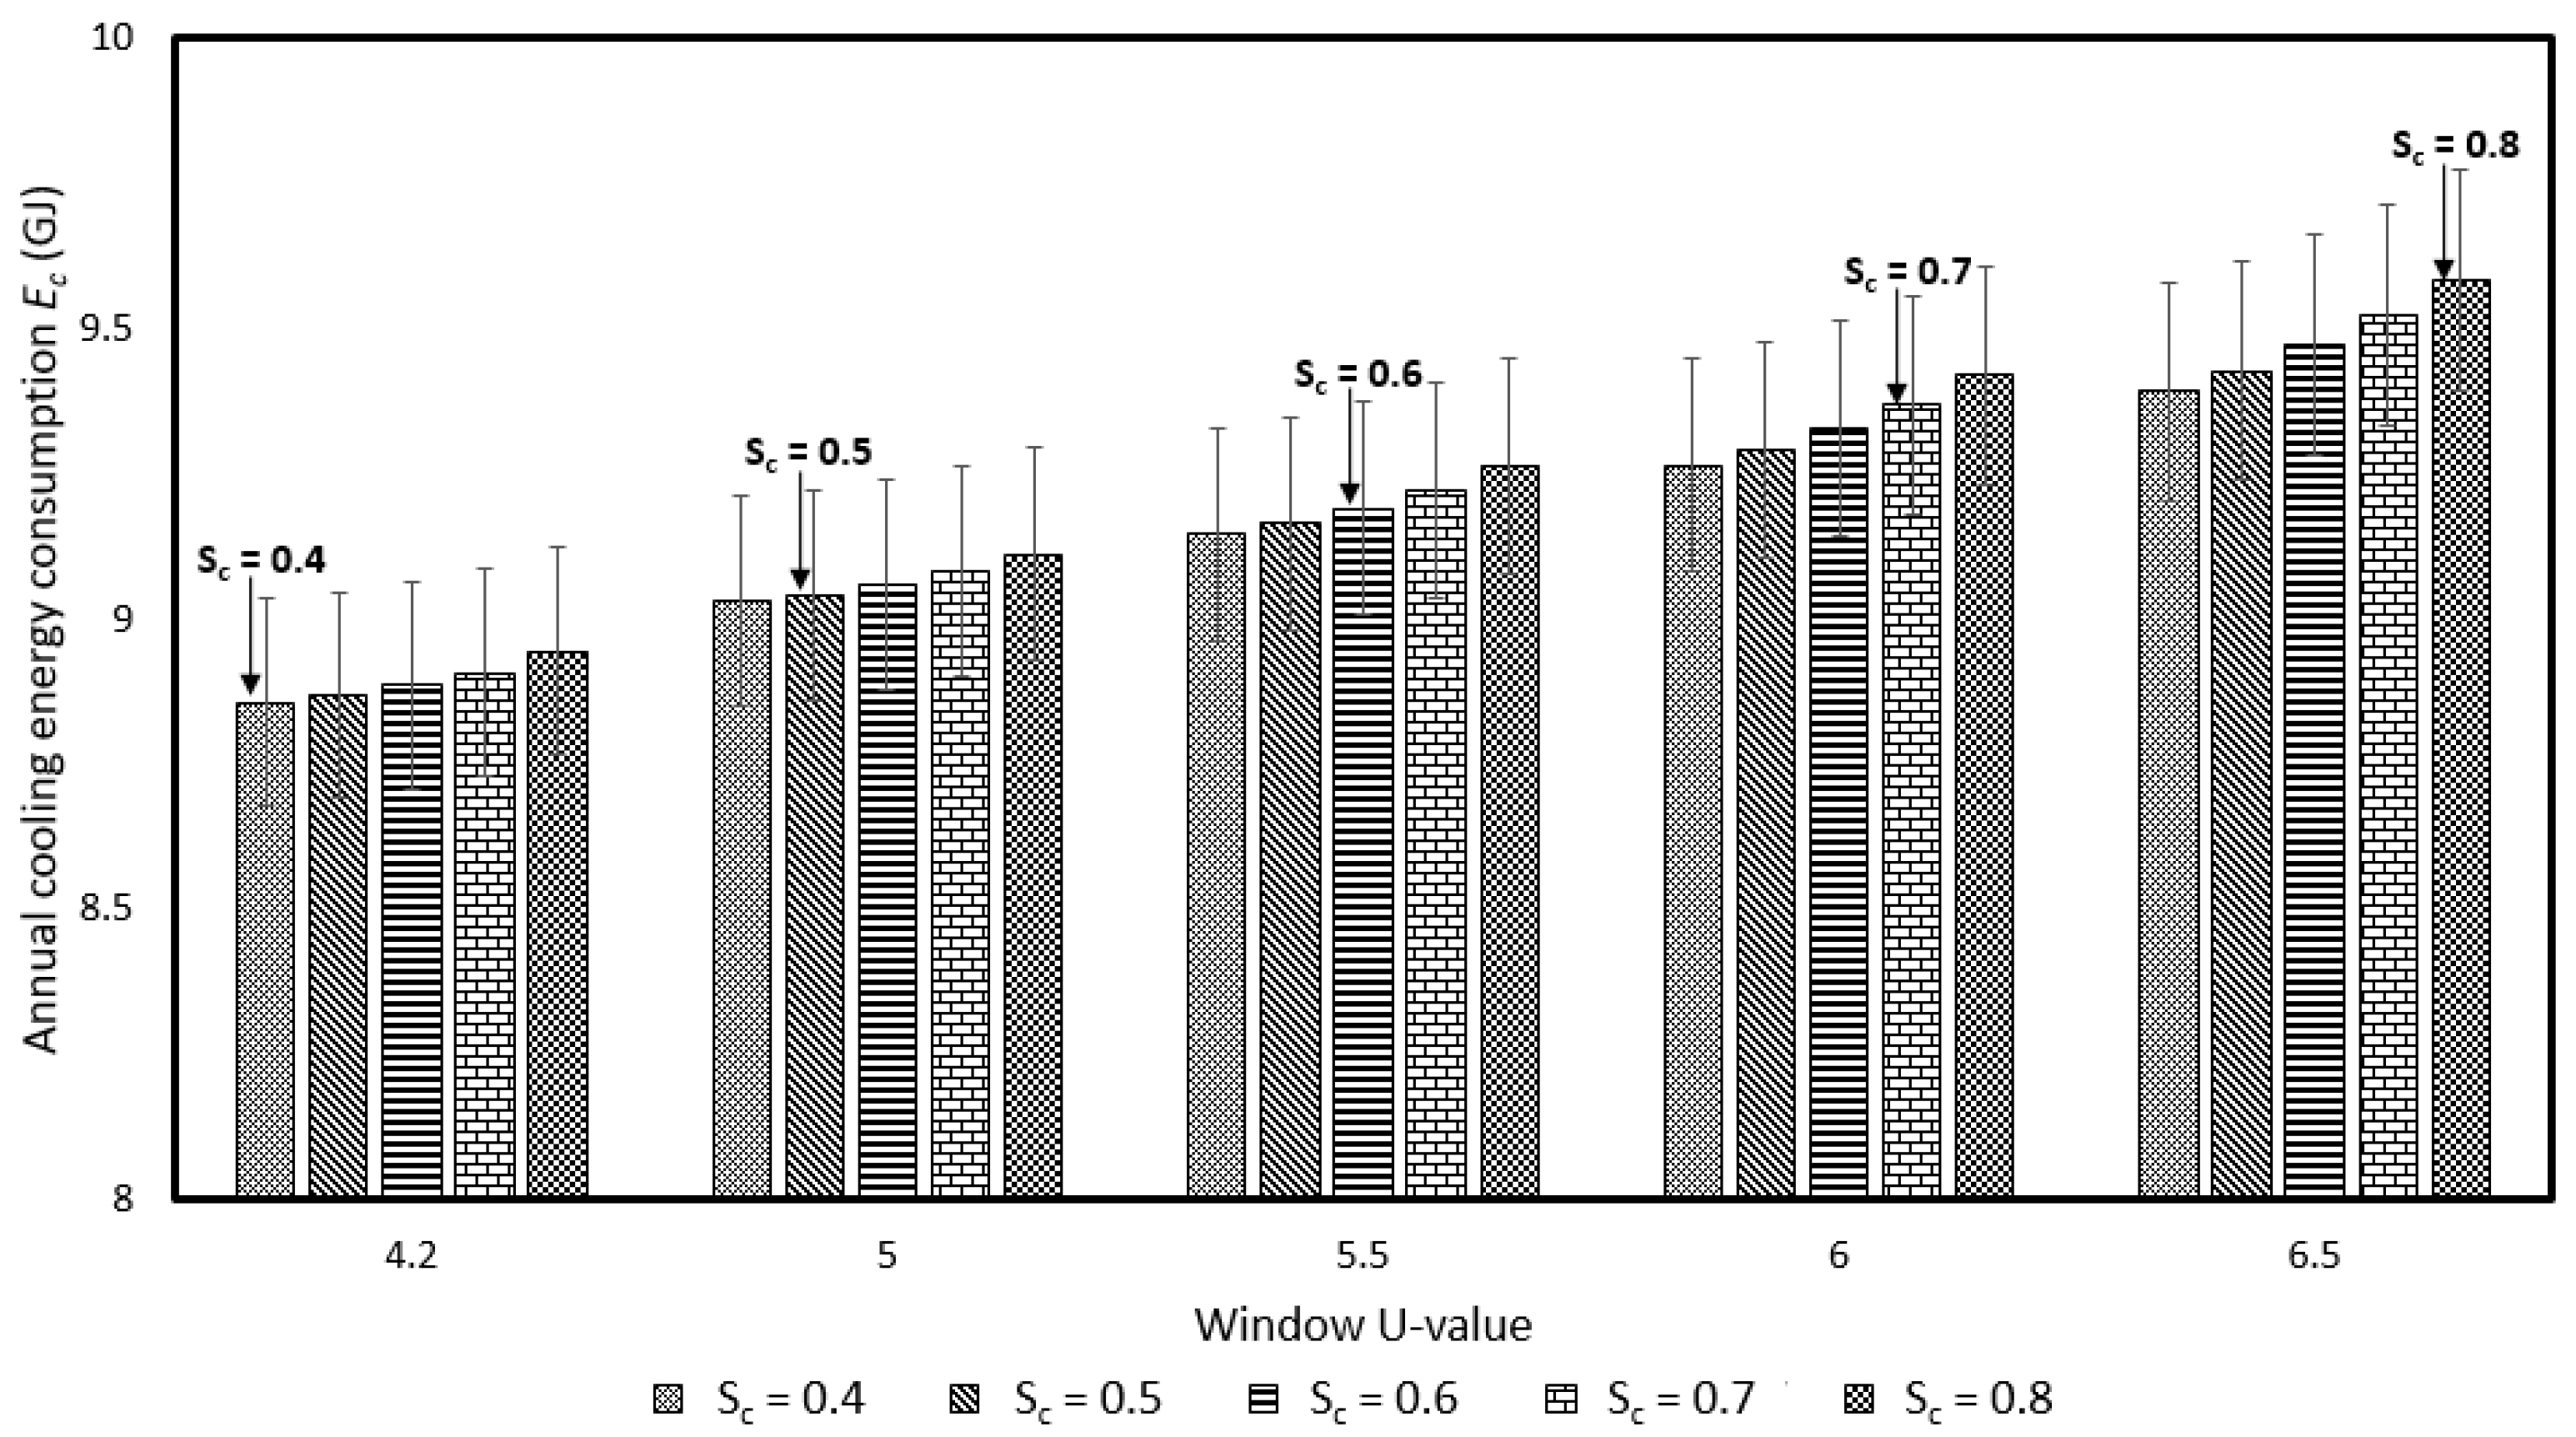
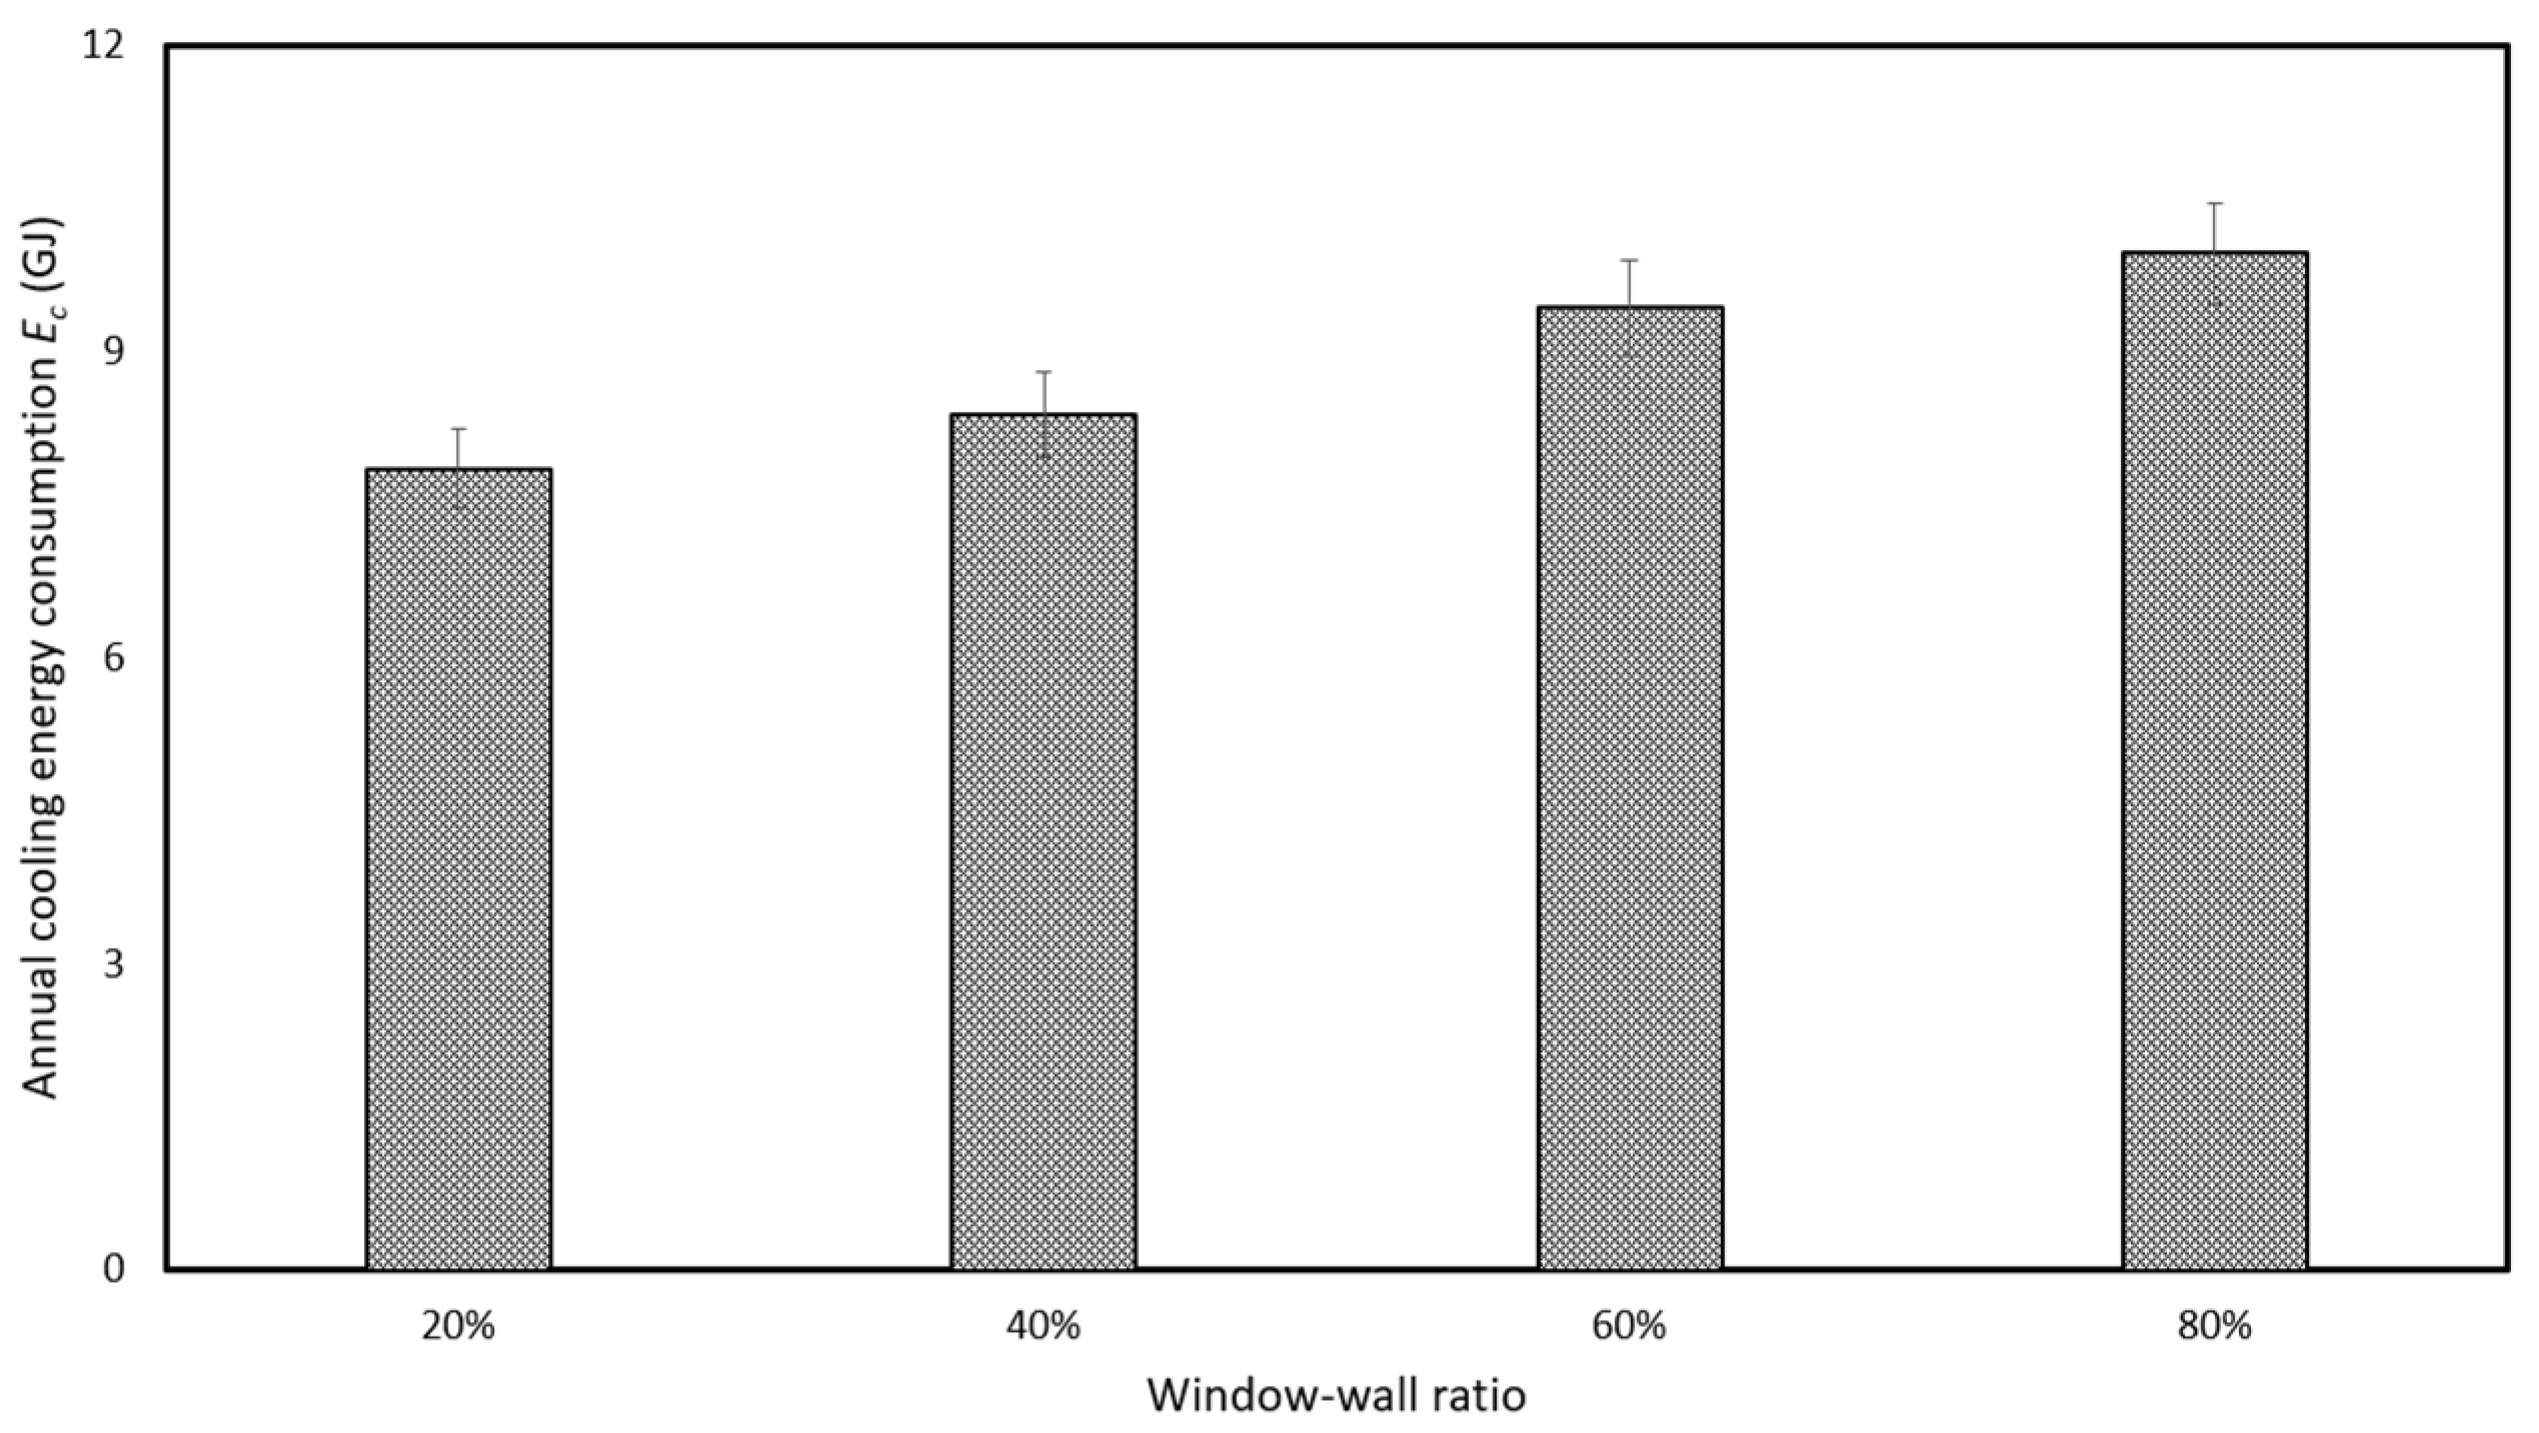
4.1. Impacts of Building Materials and Construction Solutions on Cooling Energy Consumption
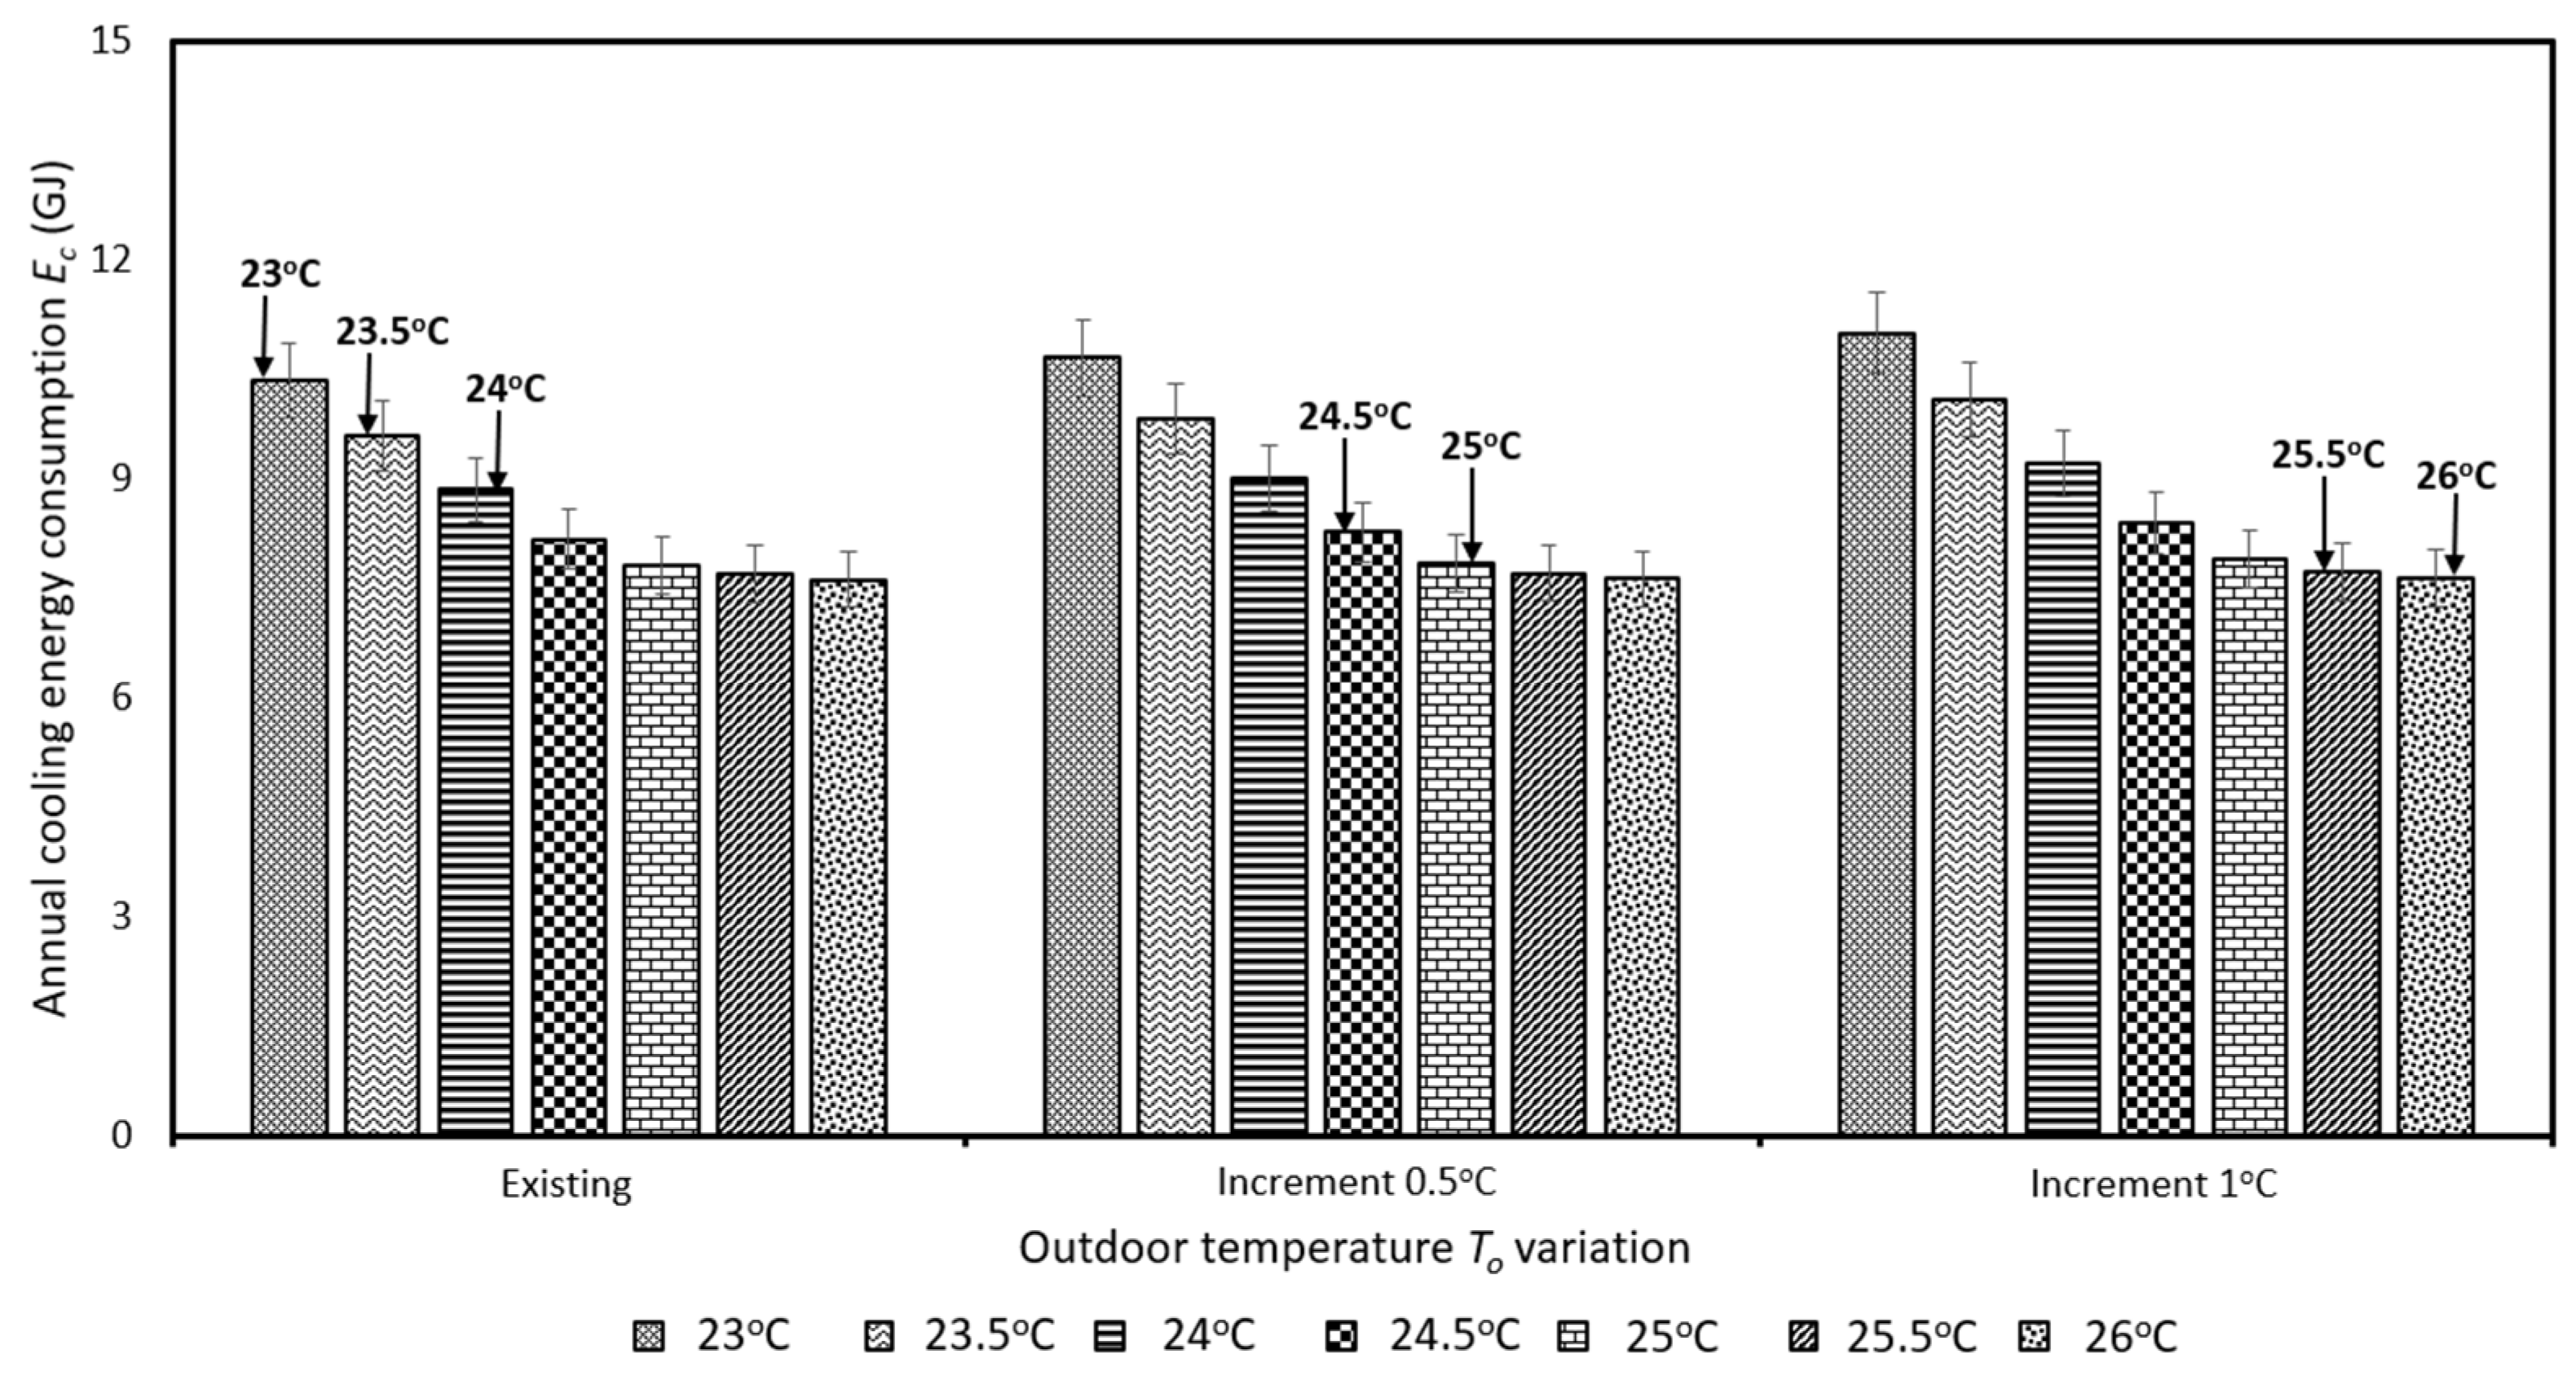
4.2. Indoor Temperature Set-Point against Global Warming
5. Discussions
6. Conclusions
Author Contributions
Funding
Institutional Review Board Statement
Informed Consent Statement
Data Availability Statement
Conflicts of Interest
References
- Luber, G.; Knowlton, K.; Balbus, J.; Frumkin, H.; Hayden, M.; Hess, J.; McGeehin, M.; Sheats, N.; Backer, L.; Beard, C.B. Climate change impacts in the United States: The third national climate assessment. In National Climate Assessment Report; U.S. Global Change Research Program: Washington, DC, USA, 2014; pp. 220–256. [Google Scholar] [CrossRef]
- Evens, A.; Garascia, M.; Isaacson, M. Utilities and health: Energy efficiency as a common link. Electr. J. 2017, 30, 10–14. [Google Scholar] [CrossRef]
- Spandagos, C.; Ng, T.L. Equivalent full-load hours for assessing climate change impact on building cooling and heating energy consumption in large Asian cities. Appl. Energy 2017, 189, 352–368. [Google Scholar] [CrossRef]
- Abergel, T.; Delmastro, C. Tracking Buildings 2020; International Energy Agency (IEA): Paris, France, 2020. [Google Scholar]
- Observatory, H.K. Climate Change in Hong Kong-Extreme Weather Events. Available online: https://www.hko.gov.hk/en/climate_change/obs_hk_extreme_weather.htm (accessed on 7 July 2021).
- Albadry, S.; Tarabieh, K.; Sewilam, H. Achieving net zero-energy buildings through retrofitting existing residential buildings using PV panels. Energy Procedia 2017, 115, 195–204. [Google Scholar] [CrossRef]
- Pérez-Lombard, L.; Ortiz, J.; Pout, C. A review on buildings energy consumption information. Energy Build. 2008, 40, 394–398. [Google Scholar] [CrossRef]
- Swan, L.G.; Ugursal, V.I. Modeling of end-use energy consumption in the residential sector: A review of modeling techniques. Renew. Sustain. Energy Rev. 2009, 13, 1819–1835. [Google Scholar] [CrossRef]
- Biswas, M.R.; Robinson, M.D.; Fumo, N. Prediction of residential building energy consumption: A neural network approach. Energy 2016, 117, 84–92. [Google Scholar] [CrossRef]
- CENSTATD. Hong Kong Population Projections 2020–2069; Census and Statistics Department Hong Kong: Hong Kong, China, 2020. [Google Scholar]
- World Population Prospects: 2018 Revision; Department of Economic and Social Affairs: New York, NY, USA, 2018.
- Housing; Legislative Council Secretariat: Hong Kong, China, 2016; ISSH09/16-17.
- Housing in Figures 2009–2013; Hong Kong Housing Authority, The Government of Hong Kong Special Administrative Region, China: Hong Kong, China, 2013.
- Hong Kong’s Climate Action Plan 2030+; Environment Bureau of the HKSAR Government and Steering Committee on Climate: Hong Kong, China, 2017.
- Hong Kong Special Administrative Region; Hong Kong Energy End-use Data 2020: Hong Kong, China, 2020.
- Zhao, H.-X.; Magoulès, F. A review on the prediction of building energy consumption. Renew. Sustain. Energy Rev. 2012, 16, 3586–3592. [Google Scholar] [CrossRef]
- Ahmad, T.; Chen, H.; Guo, Y.; Wang, J. A comprehensive overview on the data driven and large scale based approaches for forecasting of building energy demand: A review. Energy Build. 2018, 165, 301–320. [Google Scholar] [CrossRef]
- Robinson, C.; Dilkina, B.; Hubbs, J.; Zhang, W.; Guhathakurta, S.; Brown, M.A.; Pendyala, R.M. Machine learning approaches for estimating commercial building energy consumption. Appl. Energy 2017, 208, 889–904. [Google Scholar] [CrossRef]
- Li, Z.; Han, Y.; Xu, P. Methods for benchmarking building energy consumption against its past or intended performance: An overview. Appl. Energy 2014, 124, 325–334. [Google Scholar] [CrossRef]
- Catalina, T.; Virgone, J.; Blanco, E. Development and validation of regression models to predict monthly heating demand for residential buildings. Energy Build. 2008, 40, 1825–1832. [Google Scholar] [CrossRef]
- Chen, W.; Pourghasemi, H.R.; Kornejady, A.; Zhang, N. Landslide spatial modeling: Introducing new ensembles of ANN, MaxEnt, and SVM machine learning techniques. Geoderma 2017, 305, 314–327. [Google Scholar] [CrossRef]
- Ahmad, M.W.; Mourshed, M.; Rezgui, Y. Trees vs Neurons: Comparison between random forest and ANN for high-resolution prediction of building energy consumption. Energy Build. 2017, 147, 77–89. [Google Scholar] [CrossRef]
- Asadi, E.; da Silva, M.G.; Antunes, C.H.; Dias, L.; Glicksman, L. Multi-objective optimization for building retrofit: A model using genetic algorithm and artificial neural network and an application. Energy Build. 2014, 81, 444–456. [Google Scholar] [CrossRef]
- Ascione, F.; Bianco, N.; De Stasio, C.; Mauro, G.M.; Vanoli, G.P. Artificial neural networks to predict energy performance and retrofit scenarios for any member of a building category: A novel approach. Energy 2017, 118, 999–1017. [Google Scholar] [CrossRef]
- Kalogirou, S.A. Artificial neural networks in energy applications in buildings. Int. J. Low Carbon Technol. 2006, 1, 201–216. [Google Scholar] [CrossRef]
- Paudel, S.; Elmtiri, M.; Kling, W.L.; Le Corre, O.; Lacarrière, B. Pseudo dynamic transitional modeling of building heating energy demand using artificial neural network. Energy Build. 2014, 70, 81–93. [Google Scholar] [CrossRef] [Green Version]
- Guyot, D.; Giraud, F.; Simon, F.; Corgier, D.; Marvillet, C.; Tremeac, B. Overview of the use of artificial neural networks for energy-related applications in the building sector. Int. J. Energy Res. 2019, 43, 6680–6720. [Google Scholar] [CrossRef]
- Kalogirou, S.; Neocleous, C.; Schizas, C. Building heating load estimation using artificial neural networks. In Proceedings of the 17th International Conference on Parallel Architectures and Compilation Techniques, Ontario, ON, Canada, 25–29 October 2008; p. 14. [Google Scholar]
- Aydinalp, M.; Ugursal, V.I.; Fung, A.S. Modeling of the appliance, lighting, and space-cooling energy consumptions in the residential sector using neural networks. Appl. Energy 2002, 71, 87–110. [Google Scholar] [CrossRef]
- Yezioro, A.; Dong, B.; Leite, F. An applied artificial intelligence approach towards assessing building performance simulation tools. Energy Build. 2008, 40, 612–620. [Google Scholar] [CrossRef]
- Liu, Z.; Wu, D.; Liu, Y.; Han, Z.; Lun, L.; Gao, J.; Jin, G.; Cao, G. Accuracy analyses and model comparison of machine learning adopted in building energy consumption prediction. Energy Explor. Exploit. 2019, 37, 1426–1451. [Google Scholar] [CrossRef] [Green Version]
- Huang, H.; Chen, L.; Hu, E. A neural network-based multi-zone modelling approach for predictive control system design in commercial buildings. Energy Build. 2015, 97, 86–97. [Google Scholar] [CrossRef]
- Mihalakakou, G.; Santamouris, M.; Tsangrassoulis, A. On the energy consumption in residential buildings. Energy Build. 2002, 34, 727–736. [Google Scholar] [CrossRef]
- Chou, J.-S.; Bui, D.-K. Modeling heating and cooling loads by artificial intelligence for energy-efficient building design. Energy Build. 2014, 82, 437–446. [Google Scholar] [CrossRef]
- Gassar, A.A.A.; Cha, S.H. Energy prediction techniques for large-scale buildings towards a sustainable built environment: A review. Energy Build. 2020, 224, 110238. [Google Scholar] [CrossRef]
- Runge, J.; Zmeureanu, R. Forecasting energy use in buildings using artificial neural networks: A review. Energies 2019, 12, 3254. [Google Scholar] [CrossRef] [Green Version]
- Wong, L.T.; Mui, K.W.; Shi, K. Energy impact of indoor environmental policy for air-conditioned offices of Hong Kong. Energy Policy 2008, 36, 714–721. [Google Scholar] [CrossRef]
- Cheung, C.K.; Fuller, R.J.; Luther, M.B. Energy-efficient envelope design for high-rise apartments. Energy Build. 2005, 37, 37–48. [Google Scholar] [CrossRef] [Green Version]
- Lin, Z.; Deng, S. The outdoor air ventilation rate in high-rise residences employing room air conditioners. Build. Environ. 2003, 38, 1389–1399. [Google Scholar] [CrossRef]
- Residential Air Conditioning: An Energy Efficiency Guide; EMSD: Hong Kong, China, 2010.
- Kosar, D. Dehumidification system enhancements. ASHRAE J. 2006, 48, 48. [Google Scholar]
- Wong, L.T.; Mui, K.W. An occupant load survey for residential buildings in Hong Kong. Int. J. Hous. Sci. Appl. 2006, 30, 195–204. [Google Scholar]
- Tim Wong, L. Tiny affordable housing in Hong Kong. Indoor Built Environ. 2018, 27, 1159–1161. [Google Scholar] [CrossRef] [Green Version]
- Standard Block Typical Floor Plans; Hong Kong Housing Authority: Hong Kong, China, 2021.
- Aktacir, M.A.; Büyükalaca, O.; Yılmaz, T. A case study for influence of building thermal insulation on cooling load and air-conditioning system in the hot and humid regions. Appl. Energy 2010, 87, 599–607. [Google Scholar] [CrossRef]
- Feng, Y. Thermal design standards for energy efficiency of residential buildings in hot summer/cold winter zones. Energy Build. 2004, 36, 1309–1312. [Google Scholar] [CrossRef]
- Lam, J.C. Residential sector air conditioning loads and electricity use in Hong Kong. Energy Convers. Manag. 2000, 41, 1757–1768. [Google Scholar] [CrossRef]
- Energy Standard for Buildings Except Low-Rise Residential Buildings; Atlanta: American Society of Heating; Refrigerating and Air-Conditioning Engineers: Atlanta, GA, USA, 2010.
- Bojic, M.; Yik, F.; Wan, K.; Burnett, J. Influence of envelope and partition characteristics on the space cooling of high-rise residential buildings in Hong Kong. Build. Environ. 2002, 37, 347–355. [Google Scholar] [CrossRef]
- Wan, K.; Yik, F.H. Representative building design and internal load patterns for modelling energy use in residential buildings in Hong Kong. Appl. Energy 2004, 77, 69–85. [Google Scholar] [CrossRef]
- Fumo, N. A review on the basics of building energy estimation. Renew. Sustain. Energy Rev. 2014, 31, 53–60. [Google Scholar] [CrossRef]
- Hale, E.; Macumber, D.; Weaver, E.; Shekhar, D. Flexible Framework for Building Energy Analysis; National Renewable Energy Lab.(NREL): Golden, CO, USA, 2012.
- Long, N.; Ball, B.; Goldwasser, D.; Parker, A.; Elling, J.; Davis, O.; Kruchten, D. Leveraging OpenStudio’s Application Programming Interfaces; National Renewable Energy Lab.(NREL): Golden, CO, USA, 2013.
- Roth, A.; Goldwasser, D.; Parker, A. There’s a measure for that! Energy Build. 2016, 117, 321–331. [Google Scholar] [CrossRef] [Green Version]
- Goldwasser, D.; Macumber, D.; Parker, A.; Lee, E.; Guglielmetti, R.; Brackney, L. The life cycle of an openstudio measure: Development, testing, distribution, and application. Proc. SimBuild 2016, 6, 222–229. [Google Scholar]
- Fleming, K.; Long, N.; Swindler, A. Building Component Library: An Online Repository to Facilitate Building Energy Model Creation; National Renewable Energy Lab.(NREL): Golden, CO, USA, 2012.
- Mui, K.W.; Wong, L.T. Cooling load calculations in subtropical climate. Build. Environ. 2007, 42, 2498–2504. [Google Scholar] [CrossRef]
- Kumar, R.; Aggarwal, R.; Sharma, J. Energy analysis of a building using artificial neural network: A review. Energy Build. 2013, 65, 352–358. [Google Scholar] [CrossRef]
- Biswas, M.R.; Robinson, M.D. Performance estimation of direct methanol fuel cell using artificial neural network. In Proceedings of the ASME International Mechanical Engineering Congress and Exposition, Houston, Texas, USA, 13–19 November 2015; p. V06BT07A022. [Google Scholar]
- Tso, G.K.; Yau, K.K. Predicting electricity energy consumption: A comparison of regression analysis, decision tree and neural networks. Energy 2007, 32, 1761–1768. [Google Scholar] [CrossRef]
- Torrecilla, J.; Otero, L.; Sanz, P. Optimization of an artificial neural network for thermal/pressure food processing: Evaluation of training algorithms. Comput. Electron. Agric. 2007, 56, 101–110. [Google Scholar] [CrossRef] [Green Version]
- Hagan, M.T.; Menhaj, M.B. Training feedforward networks with the Marquardt algorithm. IEEE Trans. Neural Netw. 1994, 5, 989–993. [Google Scholar] [CrossRef]
- Demuth, H.B.; Beale, M.H. Matlab Neural Network Toolbox: User’s Guide; Mathworks: Portola Valley, CA, USA, 2010. [Google Scholar]
- Kayri, M. Predictive abilities of bayesian regularization and Levenberg–Marquardt algorithms in artificial neural networks: A comparative empirical study on social data. Math. Comput. Appl. 2016, 21, 20. [Google Scholar] [CrossRef]
- Chaipimonplin, T. Investigation internal parameters of neural network model for Flood Forecasting at Upper river Ping, Chiang Mai. KSCE J. Civ. Eng. 2016, 20, 478–484. [Google Scholar] [CrossRef]
- Gouravaraju, S.; Narayan, J.; Sauer, R.A.; Gautam, S.S. A Bayesian regularization-backpropagation neural network model for peeling computations. Arxiv Prepr. Arxiv 2020, 2006, 16409. [Google Scholar]
- Hirschen, K.; Schäfer, M. Bayesian regularization neural networks for optimizing fluid flow processes. Comput. Methods Appl. Mech. Eng. 2006, 195, 481–500. [Google Scholar] [CrossRef]


| Input Parameters | Ranges |
|---|---|
| Outdoor temperature, To (°C) | Weather data of Hong Kong 1989 |
| Day of a year | 1–365 |
| Hour of a day | 1–2 |
| Air temperature, Ta (°C) | 20–30 |
| Window area, Awd (m2) | 2.32–58.179 |
| External wall area, Aen (m2) | 5.659–133.63 |
| Apartment floor area, Afl (m2) | 12.624–150.04 |
| Orientation (°) | 0–360 |
| Window U-value, Uwd (W/(K·m2)) | 4.2–6.9 |
| Wall U-value, Uwl (W/(K·m2)) | 0.4–2.9 |
| Shading coefficient, Sc | 0.4–0.97 |
| Vertical shadow angle, σv (°) | 0.0–89.9 |
| Case | Floor Area (m2) | External Wall Area (m2) | Window Area (m2) | Indoor Set-point Temperature (°C) | Wall U-Value (W/(K·m2)) | Window U-Value (W/(K·m2)) | Shading Coefficient | Orientation (o) | Vertical Shadow Angle (o) |
|---|---|---|---|---|---|---|---|---|---|
| 1 | 30 | 22.8 | 12.3 | 22 | 0.5 | 5 | 0.9 | 180 | 0 |
| 2 | 35.8 | 31.9 | 7.6 | 24 | 2.9 | 6.9 | 0.97 | 45 | 75.3 |
| 3 | 65 | 36.1 | 15.5 | 26 | 1.5 | 5 | 0.9 | −90 | 40 |
| 4 | 30 | 22.8 | 12.3 | 24 | 1.5 | 5.8 | 0.7 | 90 | 70 |
| 5 | 110 | 63.8 | 36.9 | 22 | 1.5 | 4.2 | 0.9 | 0 | 70 |
| 6 | 30.4 | 30.4 | 4.2 | 24 | 2.9 | 6.9 | 0.97 | 45 | 75.3 |
| 7 | 145 | 75.2 | 40.5 | 24 | 1.5 | 5 | 0.7 | 0 | 70 |
| 8 | 23.9 | 32.8 | 5.1 | 27 | 2 | 4.2 | 0.7 | −45 | 40 |
| 9 | 35.9 | 40 | 9.2 | 24 | 2.9 | 6.9 | 0.97 | 45 | 75.3 |
| 10 | 15.1 | 21.1 | 4.6 | 24 | 2.9 | 6.9 | 0.97 | 45 | 75.3 |
| 11 | 120 | 70 | 35.1 | 28 | 0.5 | 4.2 | 0.5 | 180 | 0 |
| 12 | 135 | 48.3 | 63.2 | 26 | 0.5 | 5.8 | 0.7 | 0 | 70 |
| 13 | 52.1 | 46.4 | 11.5 | 26 | 0.5 | 5.8 | 0.5 | −90 | 75.3 |
| 14 | 19.7 | 17.6 | 3.7 | 24 | 2.9 | 6.9 | 0.97 | 45 | 75.3 |
Publisher’s Note: MDPI stays neutral with regard to jurisdictional claims in published maps and institutional affiliations. |
© 2021 by the authors. Licensee MDPI, Basel, Switzerland. This article is an open access article distributed under the terms and conditions of the Creative Commons Attribution (CC BY) license (https://creativecommons.org/licenses/by/4.0/).
Share and Cite
Mui, K.W.; Wong, L.T.; Satheesan, M.K.; Balachandran, A. A Hybrid Simulation Model to Predict the Cooling Energy Consumption for Residential Housing in Hong Kong. Energies 2021, 14, 4850. https://doi.org/10.3390/en14164850
Mui KW, Wong LT, Satheesan MK, Balachandran A. A Hybrid Simulation Model to Predict the Cooling Energy Consumption for Residential Housing in Hong Kong. Energies. 2021; 14(16):4850. https://doi.org/10.3390/en14164850
Chicago/Turabian StyleMui, Kwok Wai, Ling Tim Wong, Manoj Kumar Satheesan, and Anjana Balachandran. 2021. "A Hybrid Simulation Model to Predict the Cooling Energy Consumption for Residential Housing in Hong Kong" Energies 14, no. 16: 4850. https://doi.org/10.3390/en14164850
APA StyleMui, K. W., Wong, L. T., Satheesan, M. K., & Balachandran, A. (2021). A Hybrid Simulation Model to Predict the Cooling Energy Consumption for Residential Housing in Hong Kong. Energies, 14(16), 4850. https://doi.org/10.3390/en14164850