Article

Experimental Evaluation of Aging Indicators for Lithium–Iron–Phosphate Cells

Department of Energy, Systems, Territory and Constructions Engineering, University of Pisa, 56122 Pisa, Italy
*
Author to whom correspondence should be addressed.
Energies 2021, 14(16), 4813; https://doi.org/10.3390/en14164813
Submission received: 6 July 2021 / Revised: 4 August 2021 / Accepted: 5 August 2021 / Published: 7 August 2021
(This article belongs to the Special Issue Battery Aging and Fast Charging)

Abstract

:
Degradation mechanism of batteries has to be carefully studied when considering their utilization in electrical power systems. This paper presents the results of an extensive experimental campaign, through which three different lithium–iron–phosphate (LFP) cells were subjected to different electrical cycling stresses. The purpose of the campaign was to evaluate the cells’ aging, as well as to try to find parameters on the cell behavior before its end of life, able to act as state-of-life (SOL) (or aging) indicators. The considered stress consists of the cyclic repetition of fixed-duration discharge steps, followed by full charge phases. The three cells under study were subjected to the very same stress pattern but with three different discharge and charge power levels: low, medium, and high. The results showed that the end-of-discharge voltage and the cell internal resistance can be used as good SOL indicators. However, both are significant functions of the cell conditions, such as the state of charge (SOC) and the cell temperature.

1. Introduction

Lithium-based cells and batteries have become a de facto standard for many storage applications, either stationary or vehicular. Among the several available chemistries, lithium–iron–phosphate (LFP) cells are appreciated for their very good stability, low cost, reasonable specific energy, and energy densities, even though these densities are somewhat lower than other chemistries [1,2]. Lithium cells guarantee rather large number of cycles, in most cases a few thousands for stationary applications [1], around one thousand for vehicles [1]. However, it is well known that the cycle life depends on the cell utilization, typically increasing, in terms of the whole energy delivered throughout the cell’s life, when the usage involves shallower cycles [3]. The strong dependence of aging on the usage pattern makes it very difficult to predict it on the basis of a cell’s aging model alone, although good attempts in this direction have been made [4,5,6]. This paper takes a different approach: it tried to find, on the basis of experimental results, indicators of cell aging that could be used during a cell’s life to evaluate the so-called state of life (SOL), i.e., the nearness of the cell itself to its end of life. For this, a good opportunity for the authors was the SUMA project to which the department to which they belong participates. One of the goals of this project is to evaluate several aspects of electric vehicle charging in multifunctional structures (called SUMA themselves), which have some renewable generation (e.g., solar panels), electric vehicle supply equipment (EVSE) units, and electrochemical storage. In these structures, electrochemical storage has two purposes:
  • Compensating the power fluctuation of the renewable source;
  • Compensating the peak powers occurring at the first intervals of vehicle charging operations.
For the first purpose, an energy-oriented storage system is needed; for the second purpose, a power-oriented storage system is required. Although both purposes can be pursued with just one cell design using a well-designed battery, SUMA chose to consider in the installation of different storage systems, one for energy, the other for power services. To deliver power services, the chosen cell was an LFP one; this choice led to specific experimental tests to try to find aging indicators, or indicators of the so-called state-of-life (SOL), as well as to evaluate the cell’s cycle life under specified conditions, calibrated for the SUMA project [7]. A first paper on this was presented in [8], in which experimental tests were limited only to two cells; therefore, the analysis was performed on the basis of limited data only. This paper presents a more complete and comprehensive analysis. In particular, a third cell was added in order to increase the data to be analyzed, and to make a more complete analysis regarding the correlation between internal resistance and aging, which provided several interpretation issues in [8]. The extended approach and new data allow the paper to overcome the previous limits, as well as to evaluate which indicators, among the ones selected, can be used to make more precise cell aging evaluation.

2. The Test Procedure and Experimental Set-Up

2.1. The Reference Discharge Chosen

Inside the SUMA project, the purpose of the tested cells is to provide power services in order to compensate the peak power during relatively fast charge of vehicles. SUMA multifunctional structures are to be installed inside urban contexts, where on one hand space occupation must be limited, and on the other hand customers need only a relatively small recharge, simply to gain additional range for the remainder of the trip. Therefore, 15 min was chosen for the discharge duration. The actual kW and kWh size of the battery will depend on the SUMA size, in accordance with the number of cells contained in the battery pack, while the 15 min requirement was decided to be taken fixed. Moreover, to be nearer to real usage profiles, instead of using the more common constant-current charging/discharging profile, we chose constant power.

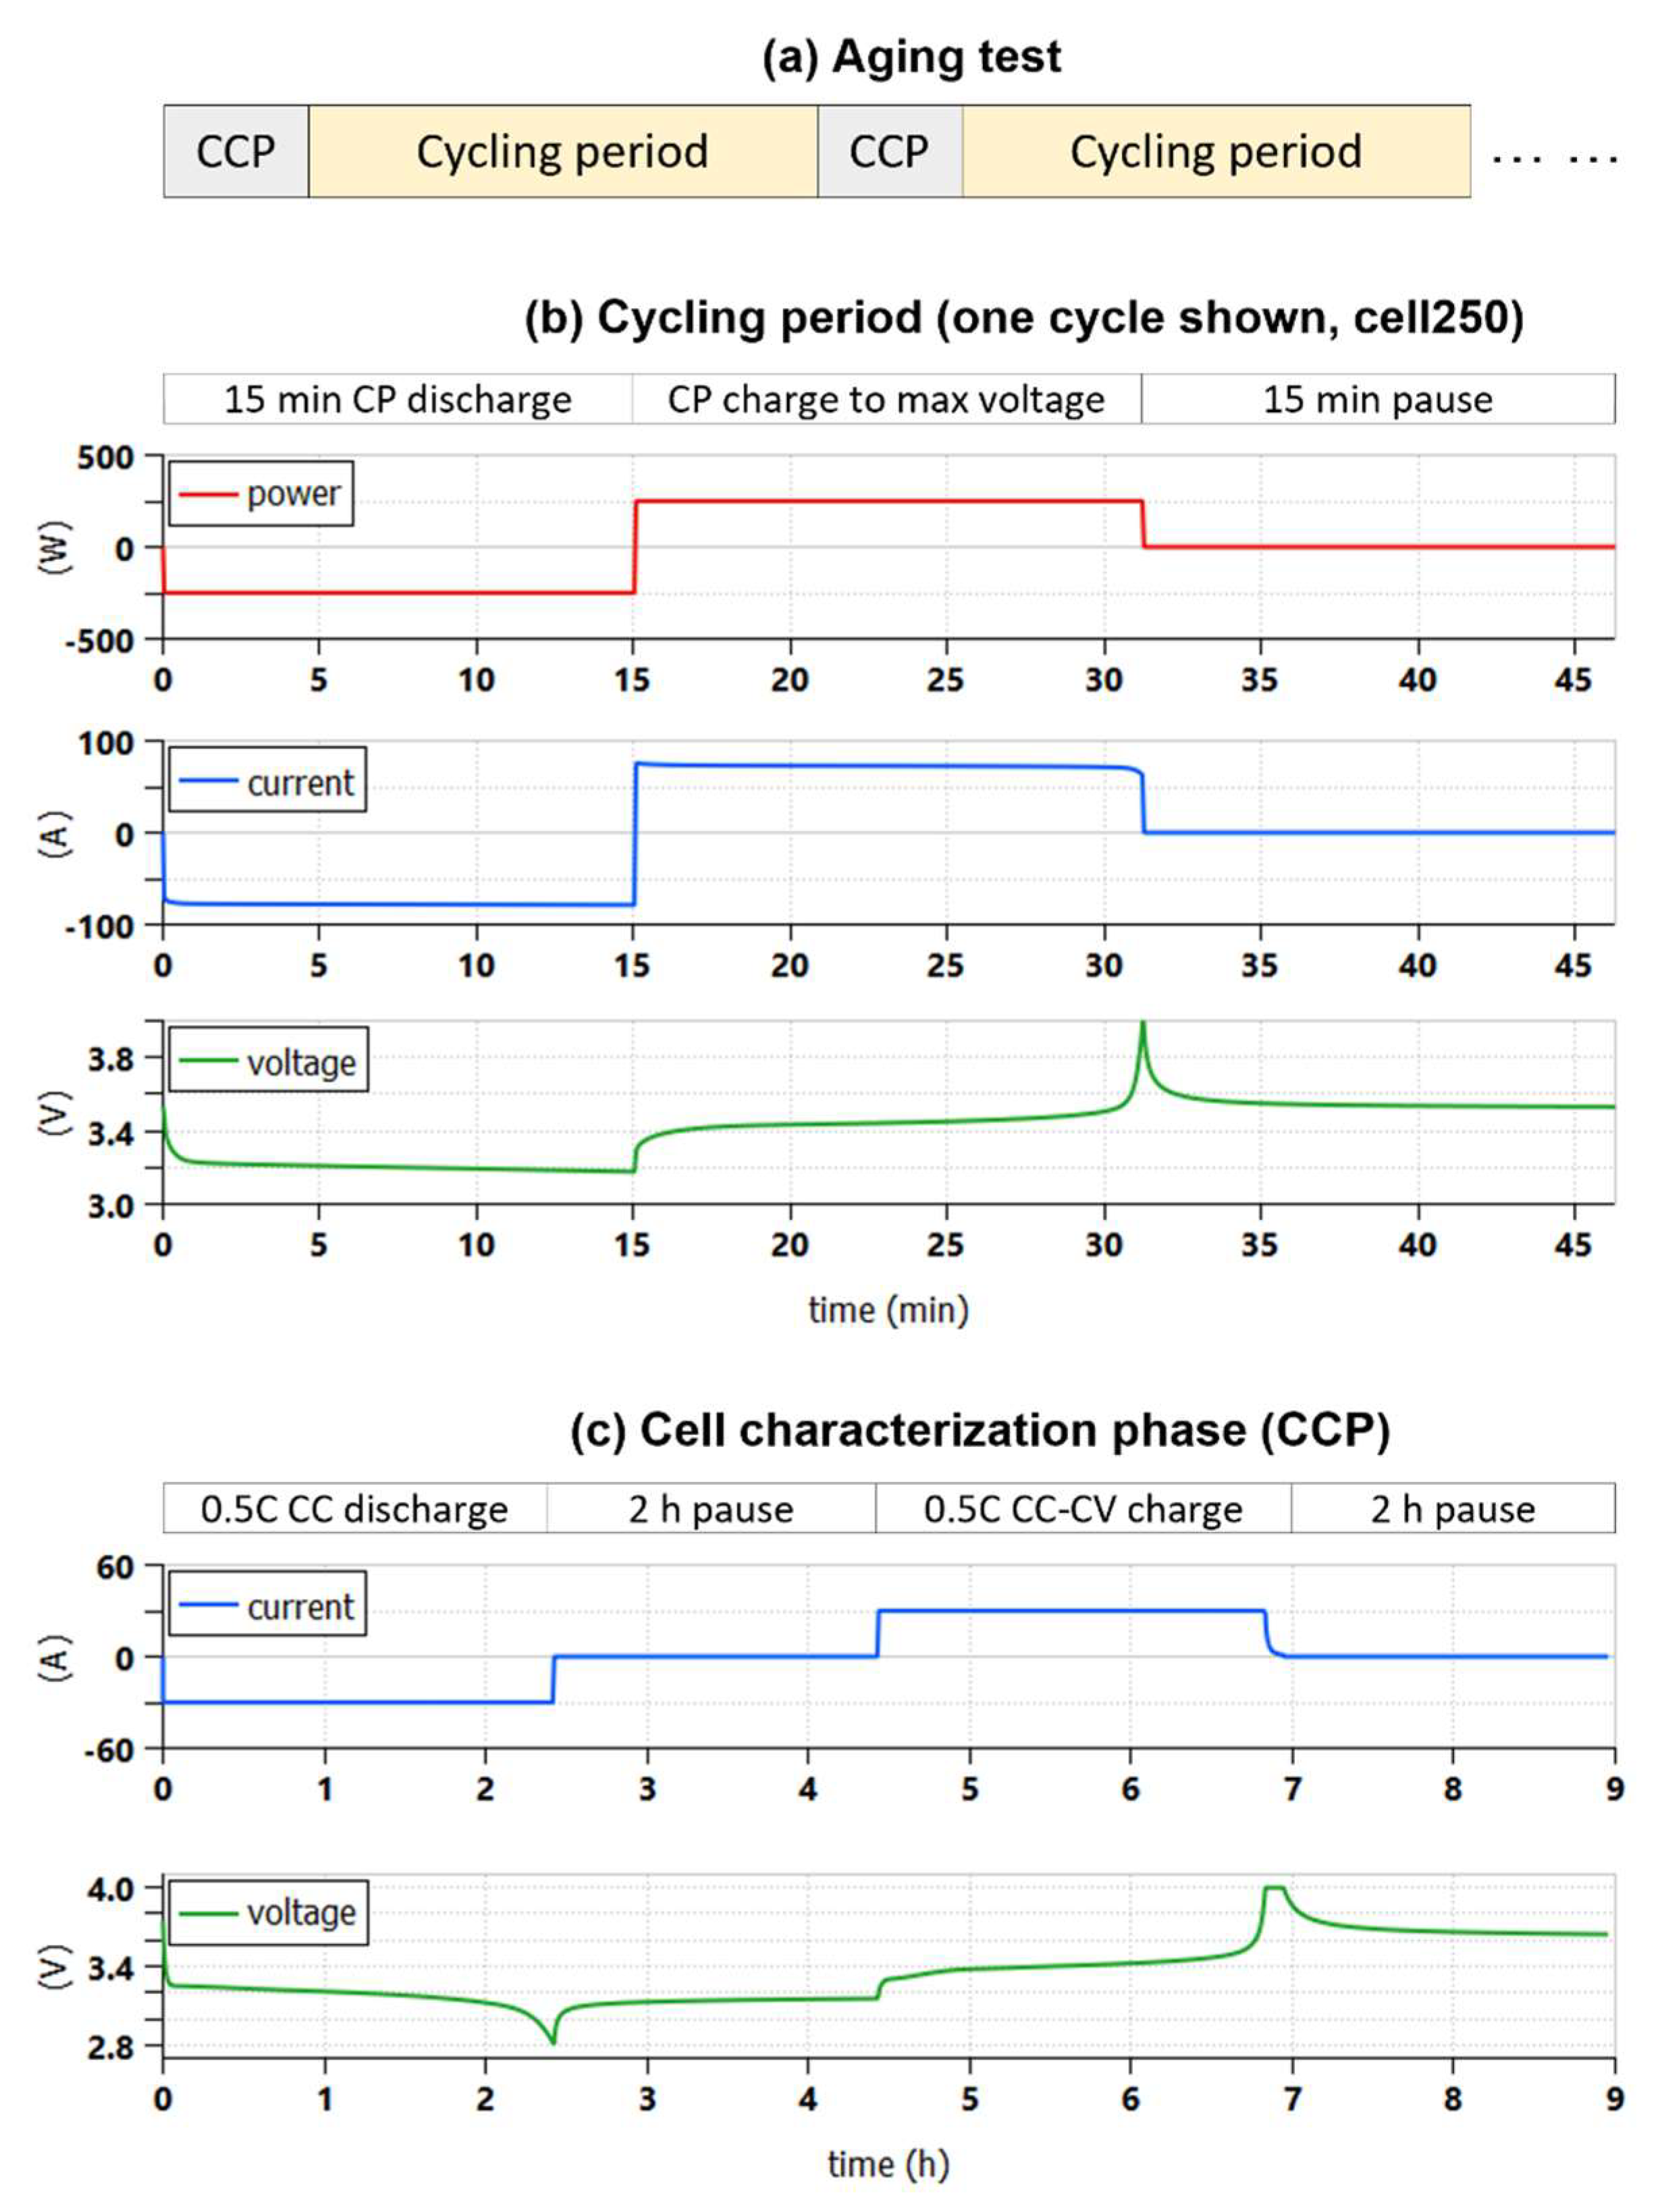
2.2. The Cycle-life Test Pattern

Since life tests last long period of time, typically months, an industrial device is needed in order to automate the test process, as well as to allow tests to be performed, without interruption, for several days or weeks. The considered test is shown in Figure 1a, and, as discussed earlier, is inspired by the common needs of an electric vehicle when charged for about 15 min [8]. All the aging tests are performed on single cells; therefore, the final results will also refer to the aging phenomena at the cell level.
Good information on the cell aging phenomenon is very important to infer; at a later stage of analysis, information of the aging of whole battery packs can be obtained.
Battery packs are, nearly always, equipped with sensors of all cell voltages and several temperatures (from which, using thermal models of the packs, individual cell temperatures can be evaluated). In this way, the results of this paper can be applied, with the obvious complication of having to run the pack thermal model, rather straightforwardly to packs. This leads to the issue of inhomogeneity of SOL of cells inside the same pack, as well as possible countermeasures, which are, however, out of the scope of this paper.
The test is composed of many cycling periods interspersed with cell characterization phases (CCPs). The cycling pattern, shown in Figure 1b, starts with a constant-power discharging followed by a constant-power charging, which ends when voltage reaches the maximum value allowed by the manufacturer of the cell (i.e., 4 V). The third phase is a pause (zero current). Charging and discharging phases are performed using the same power. The cell characterization phase (Figure 1c) consists of a 30 A (0.5 C) constant current discharge (end-of-discharge voltage 2.8 V) and a subsequent constant current-constant voltage charging performed at same 0.5 C (end-of-charge voltage 4.0 V), followed by a 2 h pause. The aging indicators, monitored and analyzed in terms of the function of the number of executed cycles, are as follows:
  • The cell available capacity Ca,n; measured during the nth CCP;
  • The cell internal resistances evaluated during the cycling periods, at the beginning and at the end of each discharge;
  • The cell case temperature, always measured;
  • The end-of-discharge voltage reached VEOD,n measured during the cycling periods at the end of every discharge.
The above-described test was applied to three identical cells, called cell250 cell375, and cell500, which were cycled at constant power equal to 250 W, 375 W, and 500 W, respectively. The 500 W level implies charge and discharge currents closer to the maximum admitted value of 180 A (3C)—this was chosen to determine the cell cycle life corresponding to the maximum realistic power usage pattern. The aging test was continued up to when the minimum voltage during the discharge phase reached the minimum allowed by the manufacturer. For the cells here tested, this value was set to 2.5 V (as will be displayed in Section 2.2, Table 1), but we decided to raise this threshold to 2.65 V for security reasons. This end-of-discharge condition was chosen because throughout the life test, the battery is subject to constant-duration discharges, which implies only partial discharges occur, which in turn implies the voltage will always stay above 2.65 V, except when, because of the reduced capacity due to aging, this threshold is reached.

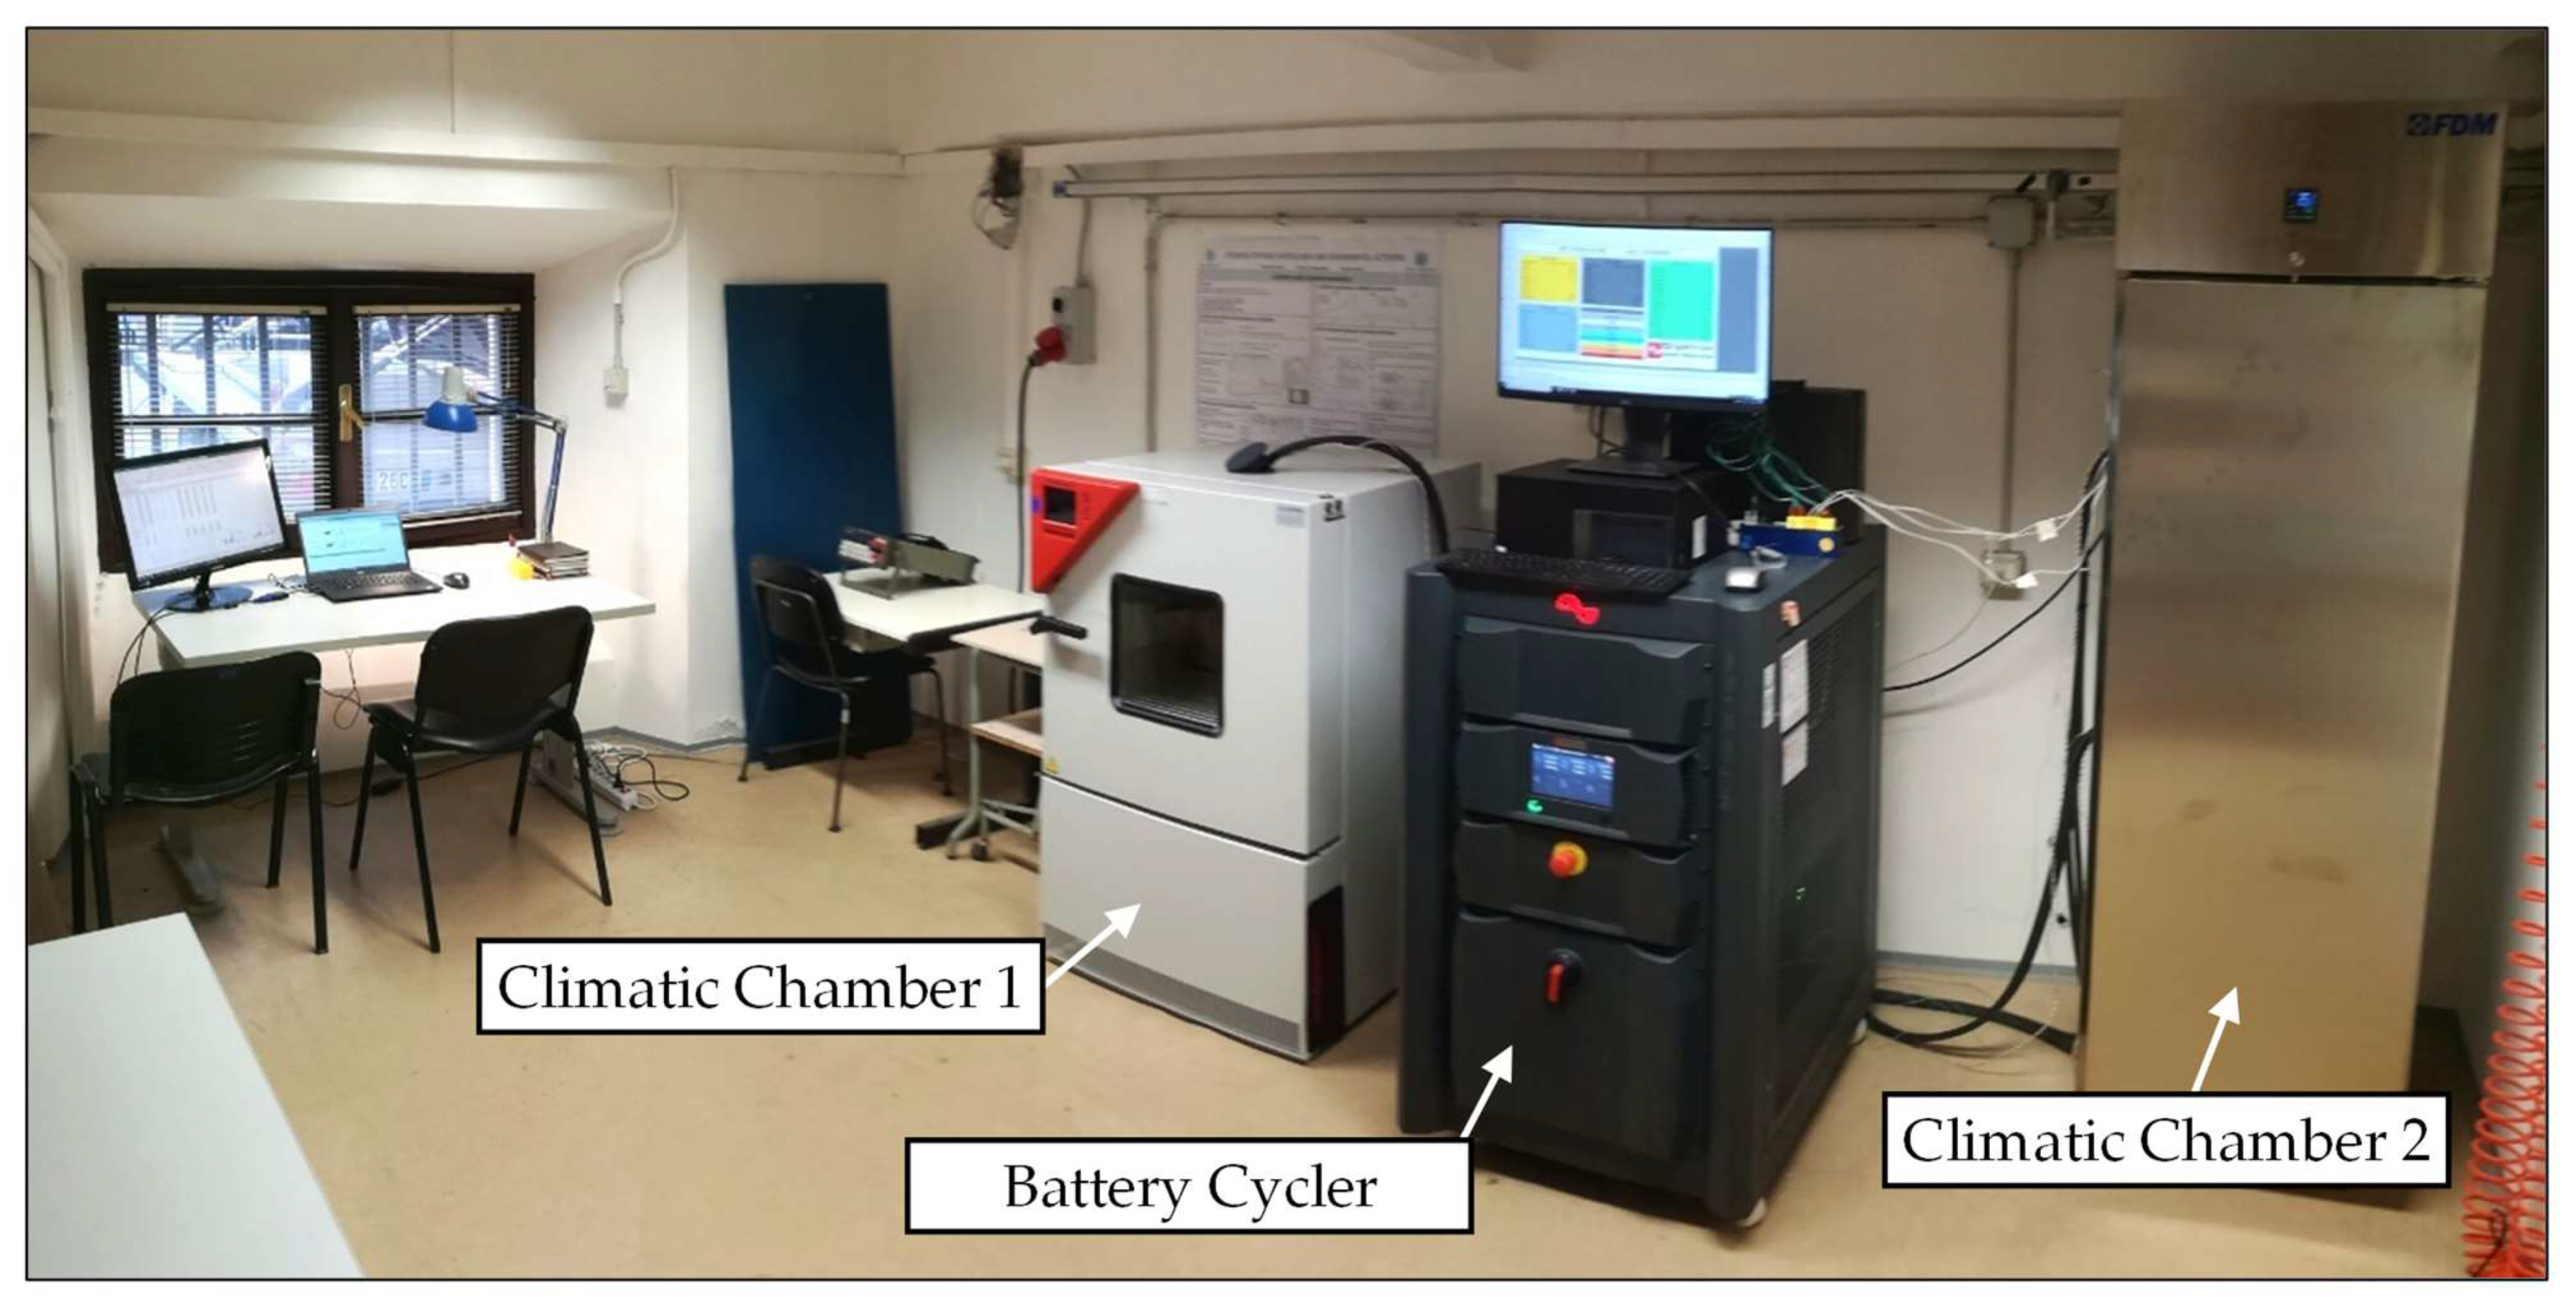
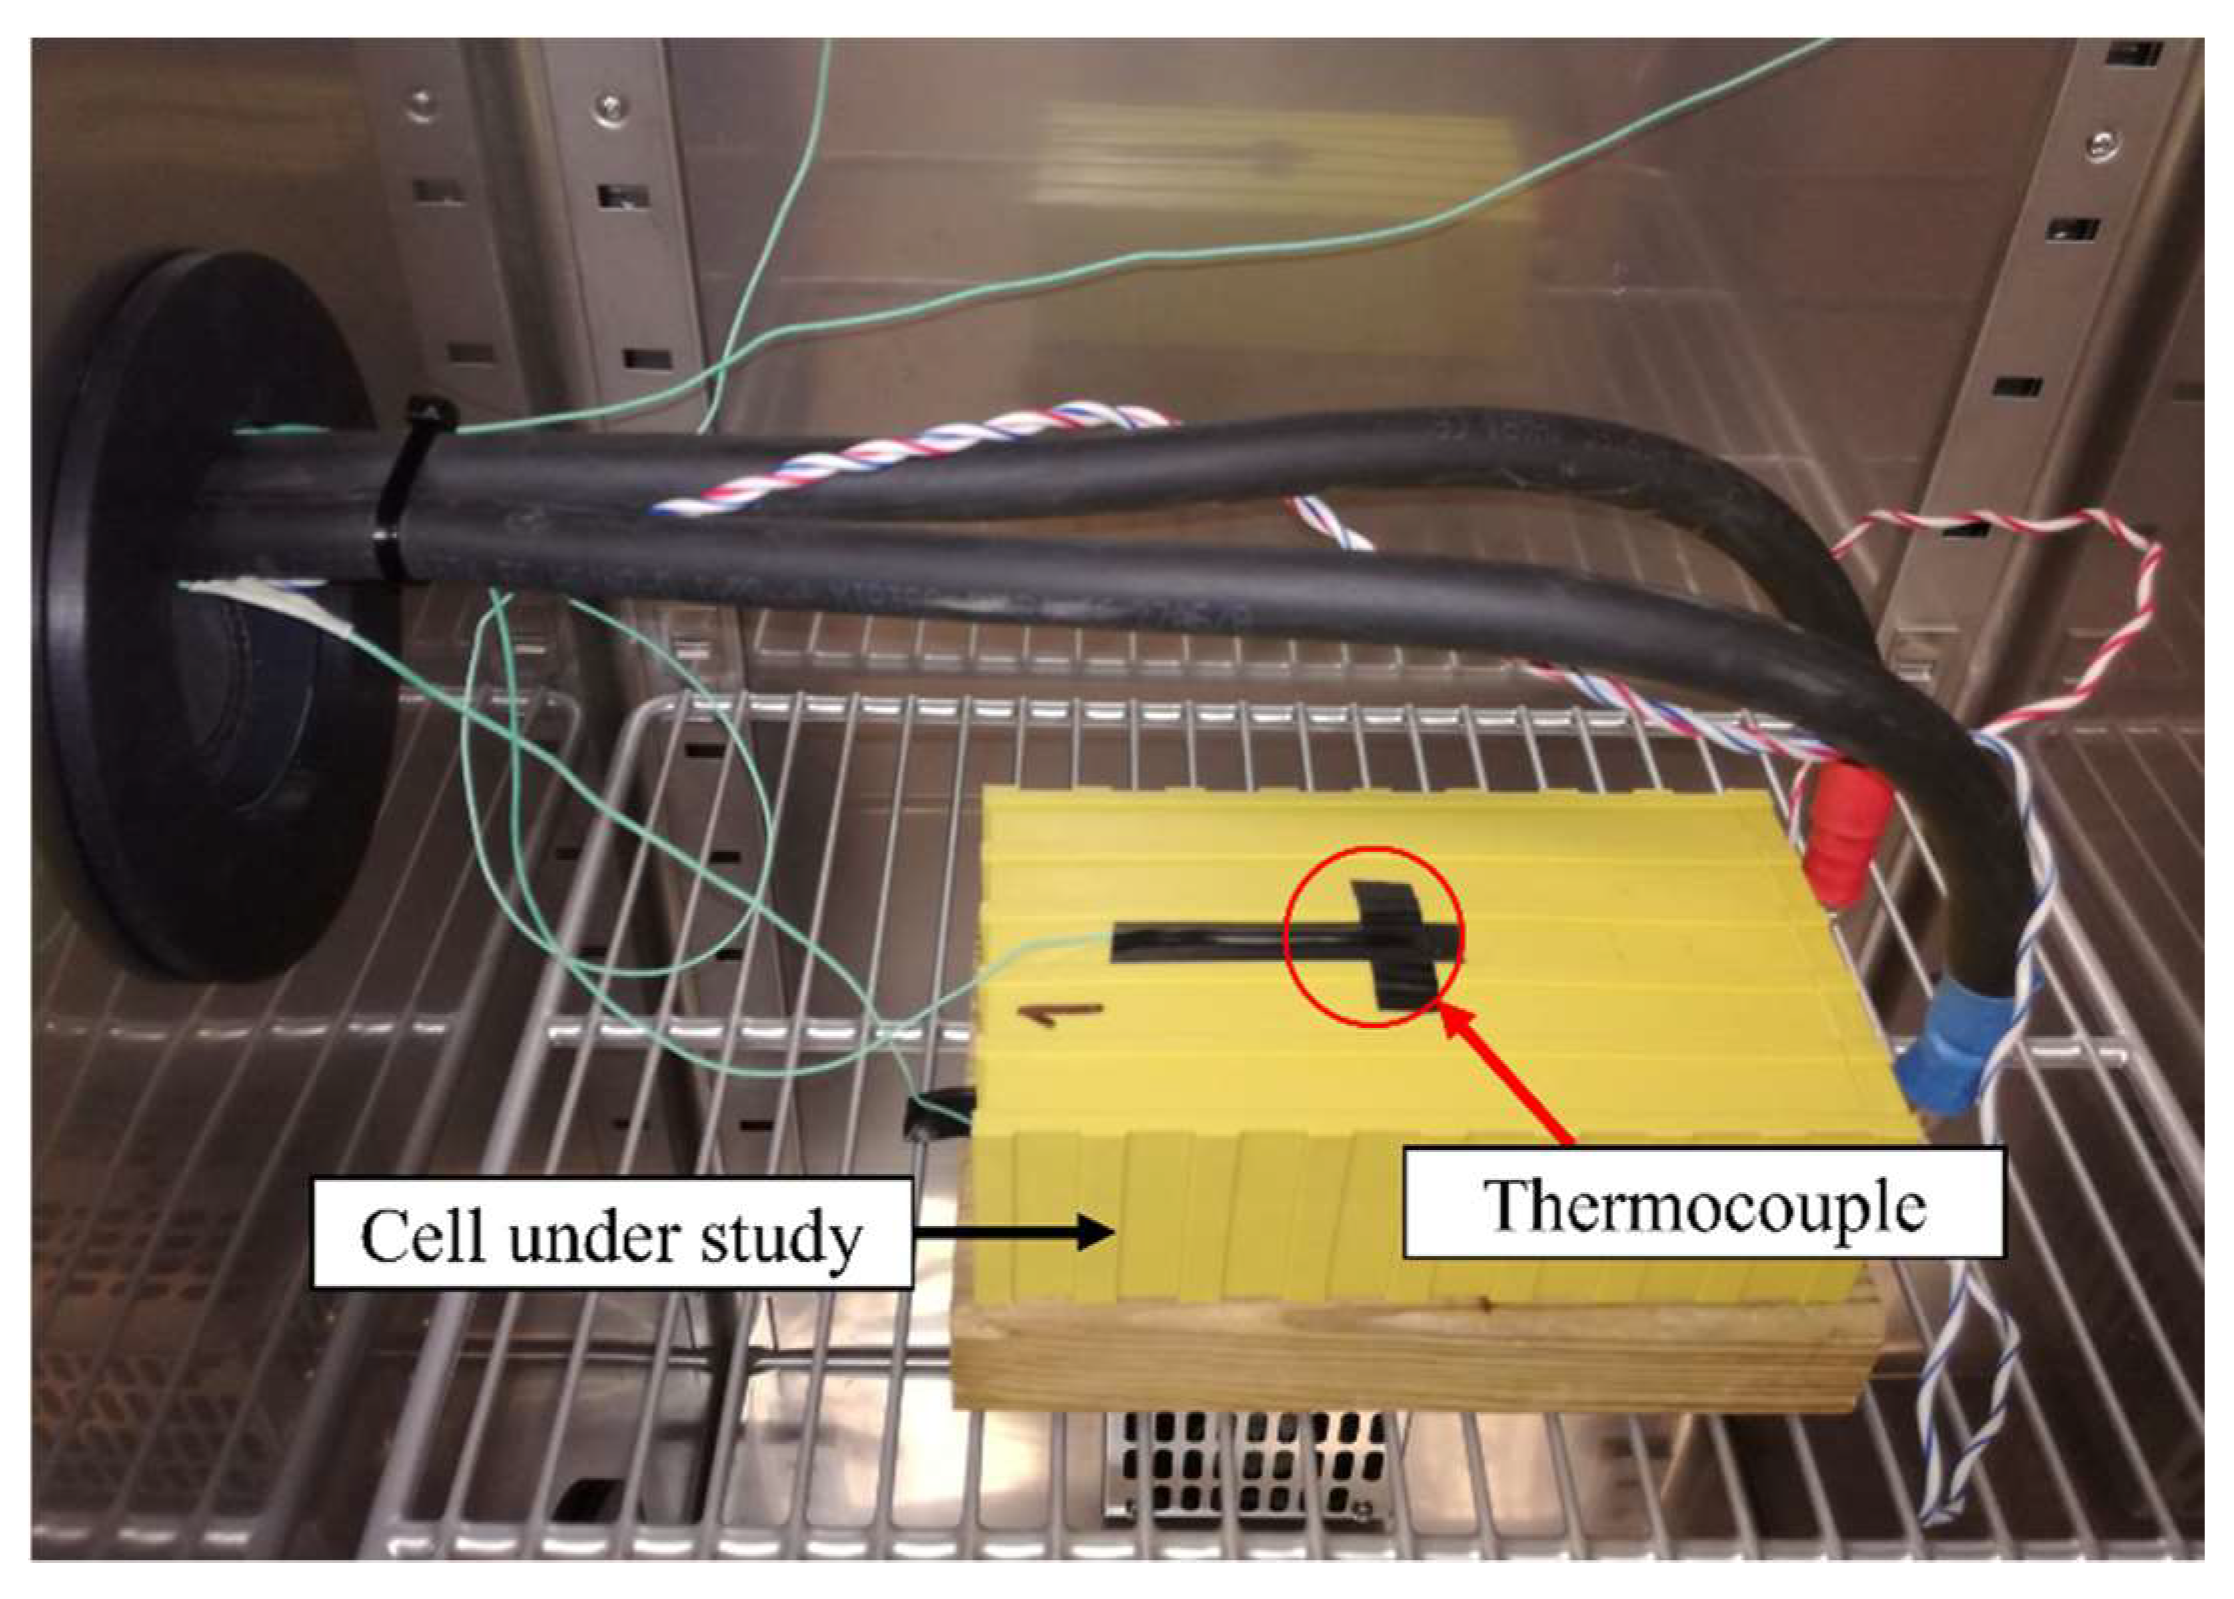
2.3. Experimental Setup

The test setup was composed of a charging and discharging system driven by a Digatron® battery cell tester and two thermostatic chambers, wherein the cells under testing were positioned, whose main characteristics are reported in Table A1 in the Appendix A [8,9,10]. A picture of the experimental setup inside the climatic chamber is found in Figure 2, while a picture of the laboratory is shown in Figure A1. In particular, it shows that the cells temperature was obtained by a thermocouple in close contact with the cell’s surface. During all tests, the surface cell temperature was continuously monitored, as well as the thermostatic chamber temperature, measured very far from the cell by the built-in chamber sensor.

2.4. Device under Test

The three LFP lithium cells tested were made by Winston Battery [11]; their datasheet is summarized in Table 1.

3. Aging Indicators

This paragraph shows how the four aging indicators are defined and evaluated through the aging test described in Figure 1 for each cell, as a in function of the number of cycles performed.

3.1. Available Capacity

The available capacity is defined as the charge extracted during the constant current discharging phase of each CCP (see Figure 1). This capacity can be expressed in Ah or as a ratio to the beginning-of-life capacity:
C p u = C a C B O L
This indicator is rather obvious, as it is well known that the clearest aging indicator is the reduction in the capacity the battery can deliver. However, in real-life applications, measuring the discharge capacity often requires conducting ad hoc tests, which have the disadvantage of interrupting the ordinary activity of the cell, and might imply requiring special hardware to be provided for in order to perform this constant-current discharge. Because of this, additional indicators are searched, which would in principle allow evaluation of the aging, i.e., the state-of-life (SOL) of the battery, while the battery is performing its business-as-usual operation.

3.2. Heat Generation

It is a common experience that, a far as cells age, their internal resistance increases, and because of this, the heat generation also increases. This was also observed during the tests reported in this paper. If the heat generation is sufficiently high, this can result in an increased overtemperature of the battery in comparison with its surrounding air. This could be easily measured real time in real-life applications. Thus, as an indicator of the cell internal heat generation, in our test, we measured the cell temperature through a measure of the temperature of its case. During this paper, tests were performed on all the cell cycles inside climatic chambers, for which thermostatic set-point temperature was always kept to 25 °C. This means that the results shown in this paper refer to cell temperatures over 25 °C. It is herein useful to anticipate that the maximum cell measured temperature increase will be of around 35 °C, recorded for cell500, letting the cell reach a temperature around 60 °C. Hence, the paper findings will correlate the cell aging indicators to cell temperatures between 25 °C and around 60 °C. This range is the typical temperature window at which lithium batteries typically operate, both in vehicular and stationary applications.
Tests such as the ones of this paper, inside lower temperature chambers, would produce information on the indicators when the cell is at a lower temperature, which might be useful in certain circumstances.
Repeating our tests at different room temperatures is therefore an interesting possibility, even though aging tests are very long and costly, and therefore their design and schedule must be carefully evaluated in terms of cost/benefit ratio.
It is noticeable that paper [12] discusses results similar to this paper’s, but at lower room temperatures.

3.3. End-of-Discharge Voltage

Another indicator potentially useful to understand the cell degradation effect is the cell voltage VEOD reached at the end of each discharging step during the cycling periods. When it goes below the allowed threshold value of 2.65 V, the cell is said to have reached its end of life. For this reason, in this paper, we use a definition of the state-of-life (SOL) of each cell based on the level of their end-of-discharge voltage. In this way, we can analytically define the SOL by the application of Equation (2), where V E O D B O L is the end-of-discharge voltage and is the very first VEOD measured (at the beginning of life), and the V t h is the minimum voltage threshold allowed (i.e., 2.65 V).
S O L = V E O D V t h V E O D B O L V t h

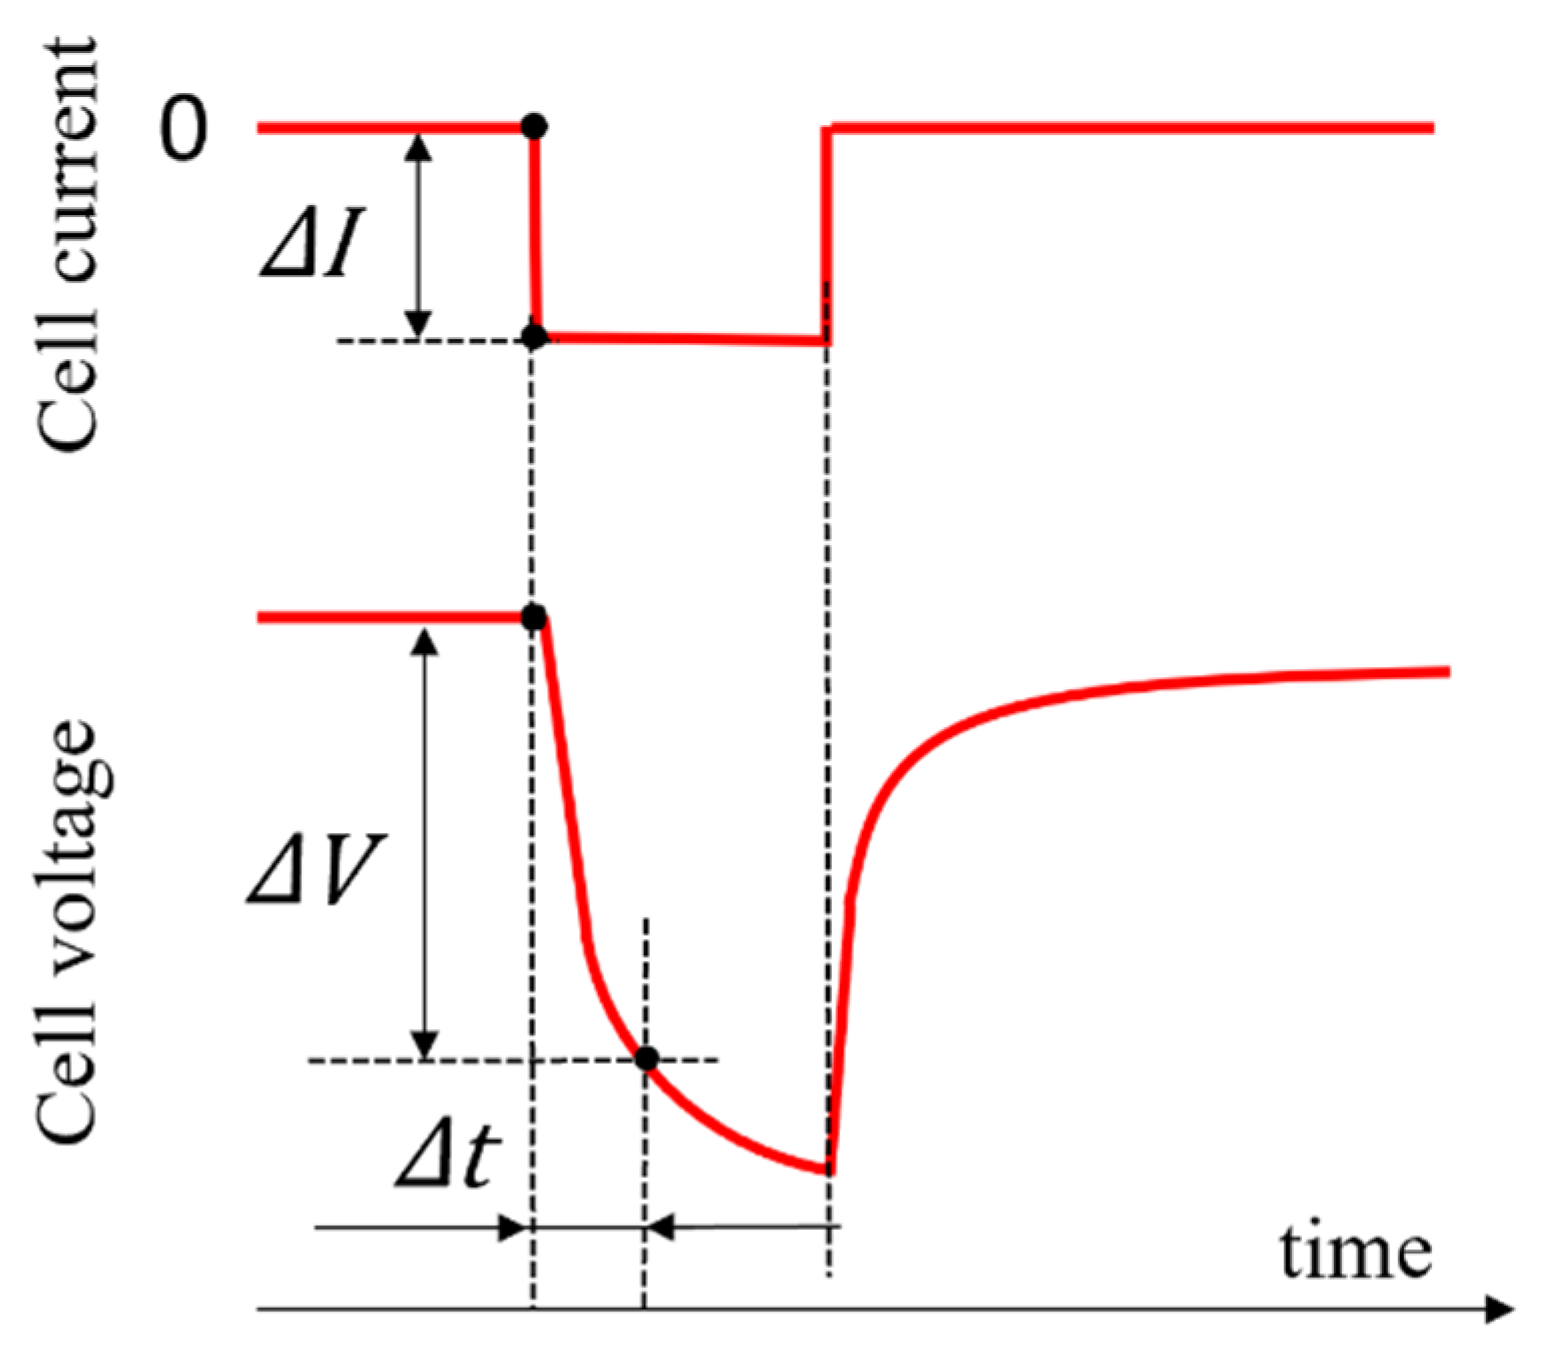
3.4. Internal Resistance

The internal resistance of lithium cells is one of the parameters that are more commonly found in the literature as an aging indicator [13,14,15,16]. This is because the most known aging phenomena, the thickening of the solid electrolyte interphase (SEI), can be directly correlated to rises in the physical ohmic behavior of the cells [17,18]. However, it is questionable as to what exactly the internal resistance is; the best way is to define it through a measurement procedure. Generally, the application of a current step is considered, as per ISO 12405-4:2018 and IEC 62660-1:2010 [19] and the representation in Figure 3.
The steps in the current shape are shown here to have vertical fronts; in actual tests, the fronts are not exactly vertical, but are acceptable as soon as their durations are much lower than the lowest value considered for Δ t . The cell internal resistance Rint is calculated as the ratio between the cell voltage variation (ΔV) and current variation (ΔI):
R int = Δ V Δ I
while the definition (3) must be complemented with the indication of the time interval (Δt) between the two voltage current samples taken.
Depending on how long this interval into the pulse of Equation (3) takes to be calculated, different physical phenomena occur; moving from a small-time interval to a larger one, three main resistances associated to the cell internal phenomena can be measured [17,20,21]. The first one is the pure ohmic cell response, often indicated by R0, which comprises the whole electronic resistance, as well as the bulk electrolyte ionic resistance of the cell. Ideally, the R0 calculation is the result of the application of Equation (3) with Δt tending to zero. Using a larger time interval, say 4–5 s, the very same ratio between ΔV and ΔI produces the calculation of the charge transfer resistance (RCT), which is attributed to a charge transfer reaction at the electrode/electrolyte interface. Finally, choosing an even larger time interval, in the order of 10 s, it is possible to evaluate the polarization cell resistance (RP), which accounts for ionic diffusion in the solid phase.
Separating all these phenomena is not an easy task, especially because the borders between the three aspects are not easily detected as they change as a function of the type of lithium cell, the cell size, state of charge, and temperature. For these reasons, in this study, we applied the very same approach of Equation (3) by evaluating the cell internal resistance as a function of the number of cycles performed, by adopting three different time intervals for each cell. The purpose is to find out if any of the time intervals chosen can outline a cell internal resistance that can be easily correlated to the cell aging level. Under this light, it will be also possible to discuss which kind of the three resistance cell phenomena can be associated to the cell degradation.
Our study was performed in correspondence with either a discharging or charging step, as well as at different states of charge. Inside the cycling period profile adopted, we used two current steps: one where the current moves from zero to a rather constant discharge value corresponding to the considered constant power (called start-of-discharge), and another where the current moves from the end-of-discharge value to the start-of-charge one (called end-of-discharge). The first step provides an indication of the internal resistance for nearly full cells, the second one of the internal resistance at the end-of-discharge, even though when using the larger powers, we discharged less than that of the lower.

4. Results

Table 2 shows some global parameters resulting from our cycle tests. The depth of discharge (DOD) was calculated according to (4), where t0 and t1 are the initial and the final times of the cycle discharge, respectively (Figure 1), and Cn is the nominal cell capacity. Average discharge currents were calculated at the beginning (cycle #10) and the end (cycle #4950, #1060, #430) of the cell life.
The three cells were tested according to powers that follow a linear progression. This reflected in a similar progression of the cell current, because of the very flat voltage trend of LFP cells. The shown average value of the discharging current indicated a very modest increase due to the reduction of the average discharge voltage as soon as the cell became old. Because the cycle patterns were unchanged between the cells and the duration of the cycling discharging steps was always the same, the different DODs also showed a nearly linear decrease with the charge/discharge power.
D O D = t 0 t 1 i ( t ) C n d t    

4.1. Aging Indicators

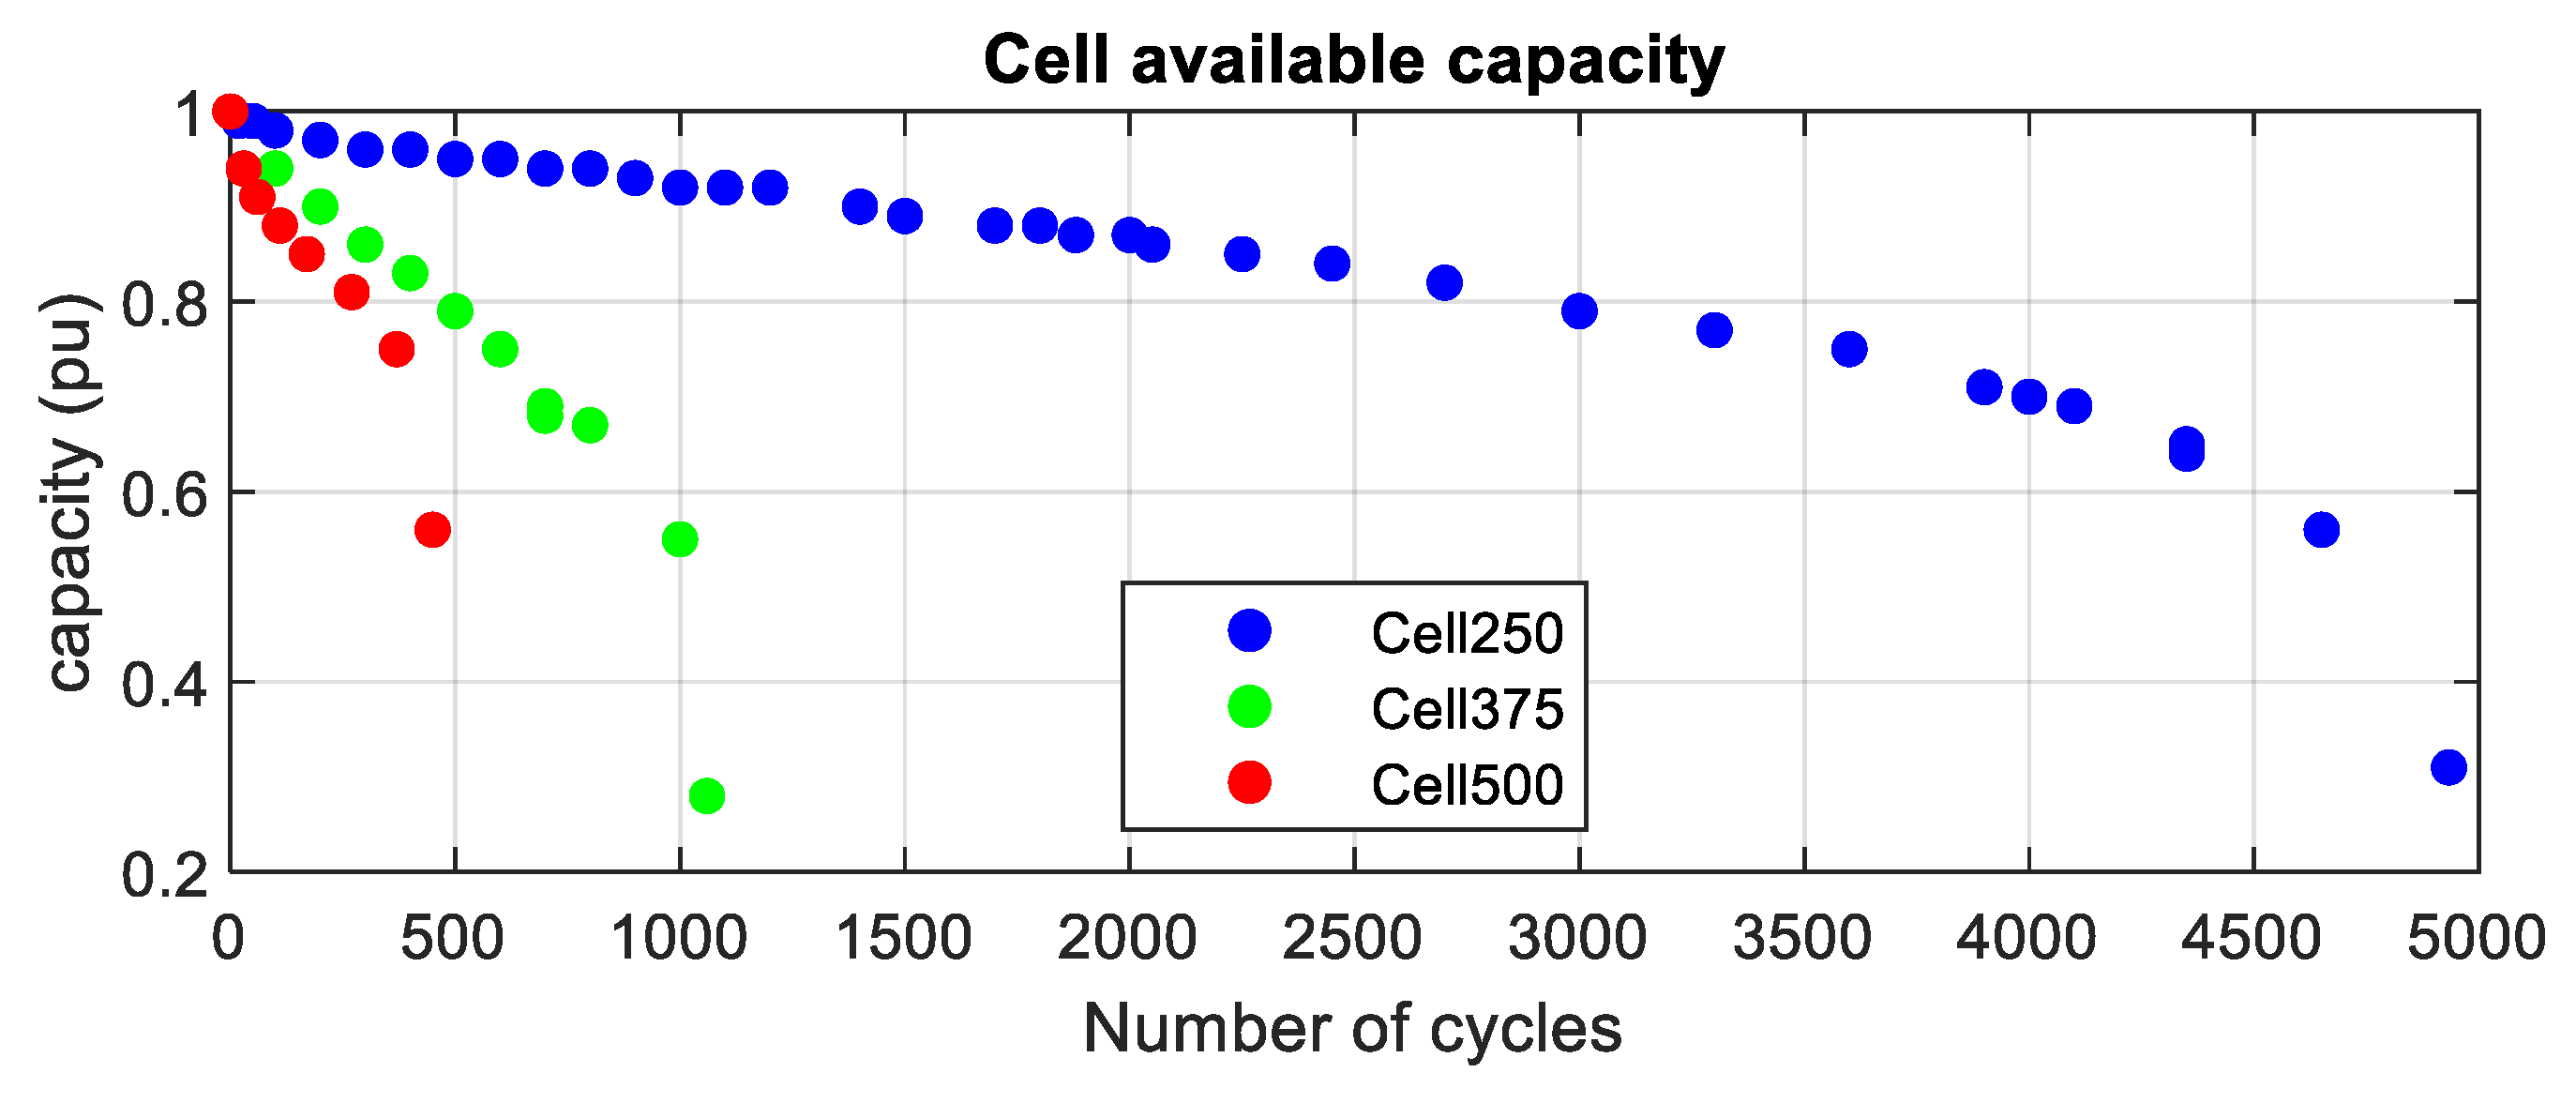
4.1.1. Available Capacity

Figure 4 shows the available capacity measured during the cell characterization phases, as a function of the number of cycles performed, for each cell under study. The capacity of each cell was normalized to the beginning of life value by the application of Equation (1).
Considering that each cycle implies the delivery of a known amount of energy, we have summarized the following data in Table 3.
As expected, the lifetime delivered energy increased dramatically as the power lowered. The data in the table suggest that power levels below 300 W may be considered for a real-life application in a recharging station. As discussed in Section 3.1, the available capacity is a rather obvious aging indicator, although very unpractical since it requires performing ad hoc discharges to get its value. However, the plots in Figure 4 are useful to obtain information of the shape of these curves over the cycle numbers, showing that the behavior was approximately linear up to roughly 80% of the cell total cycle life.

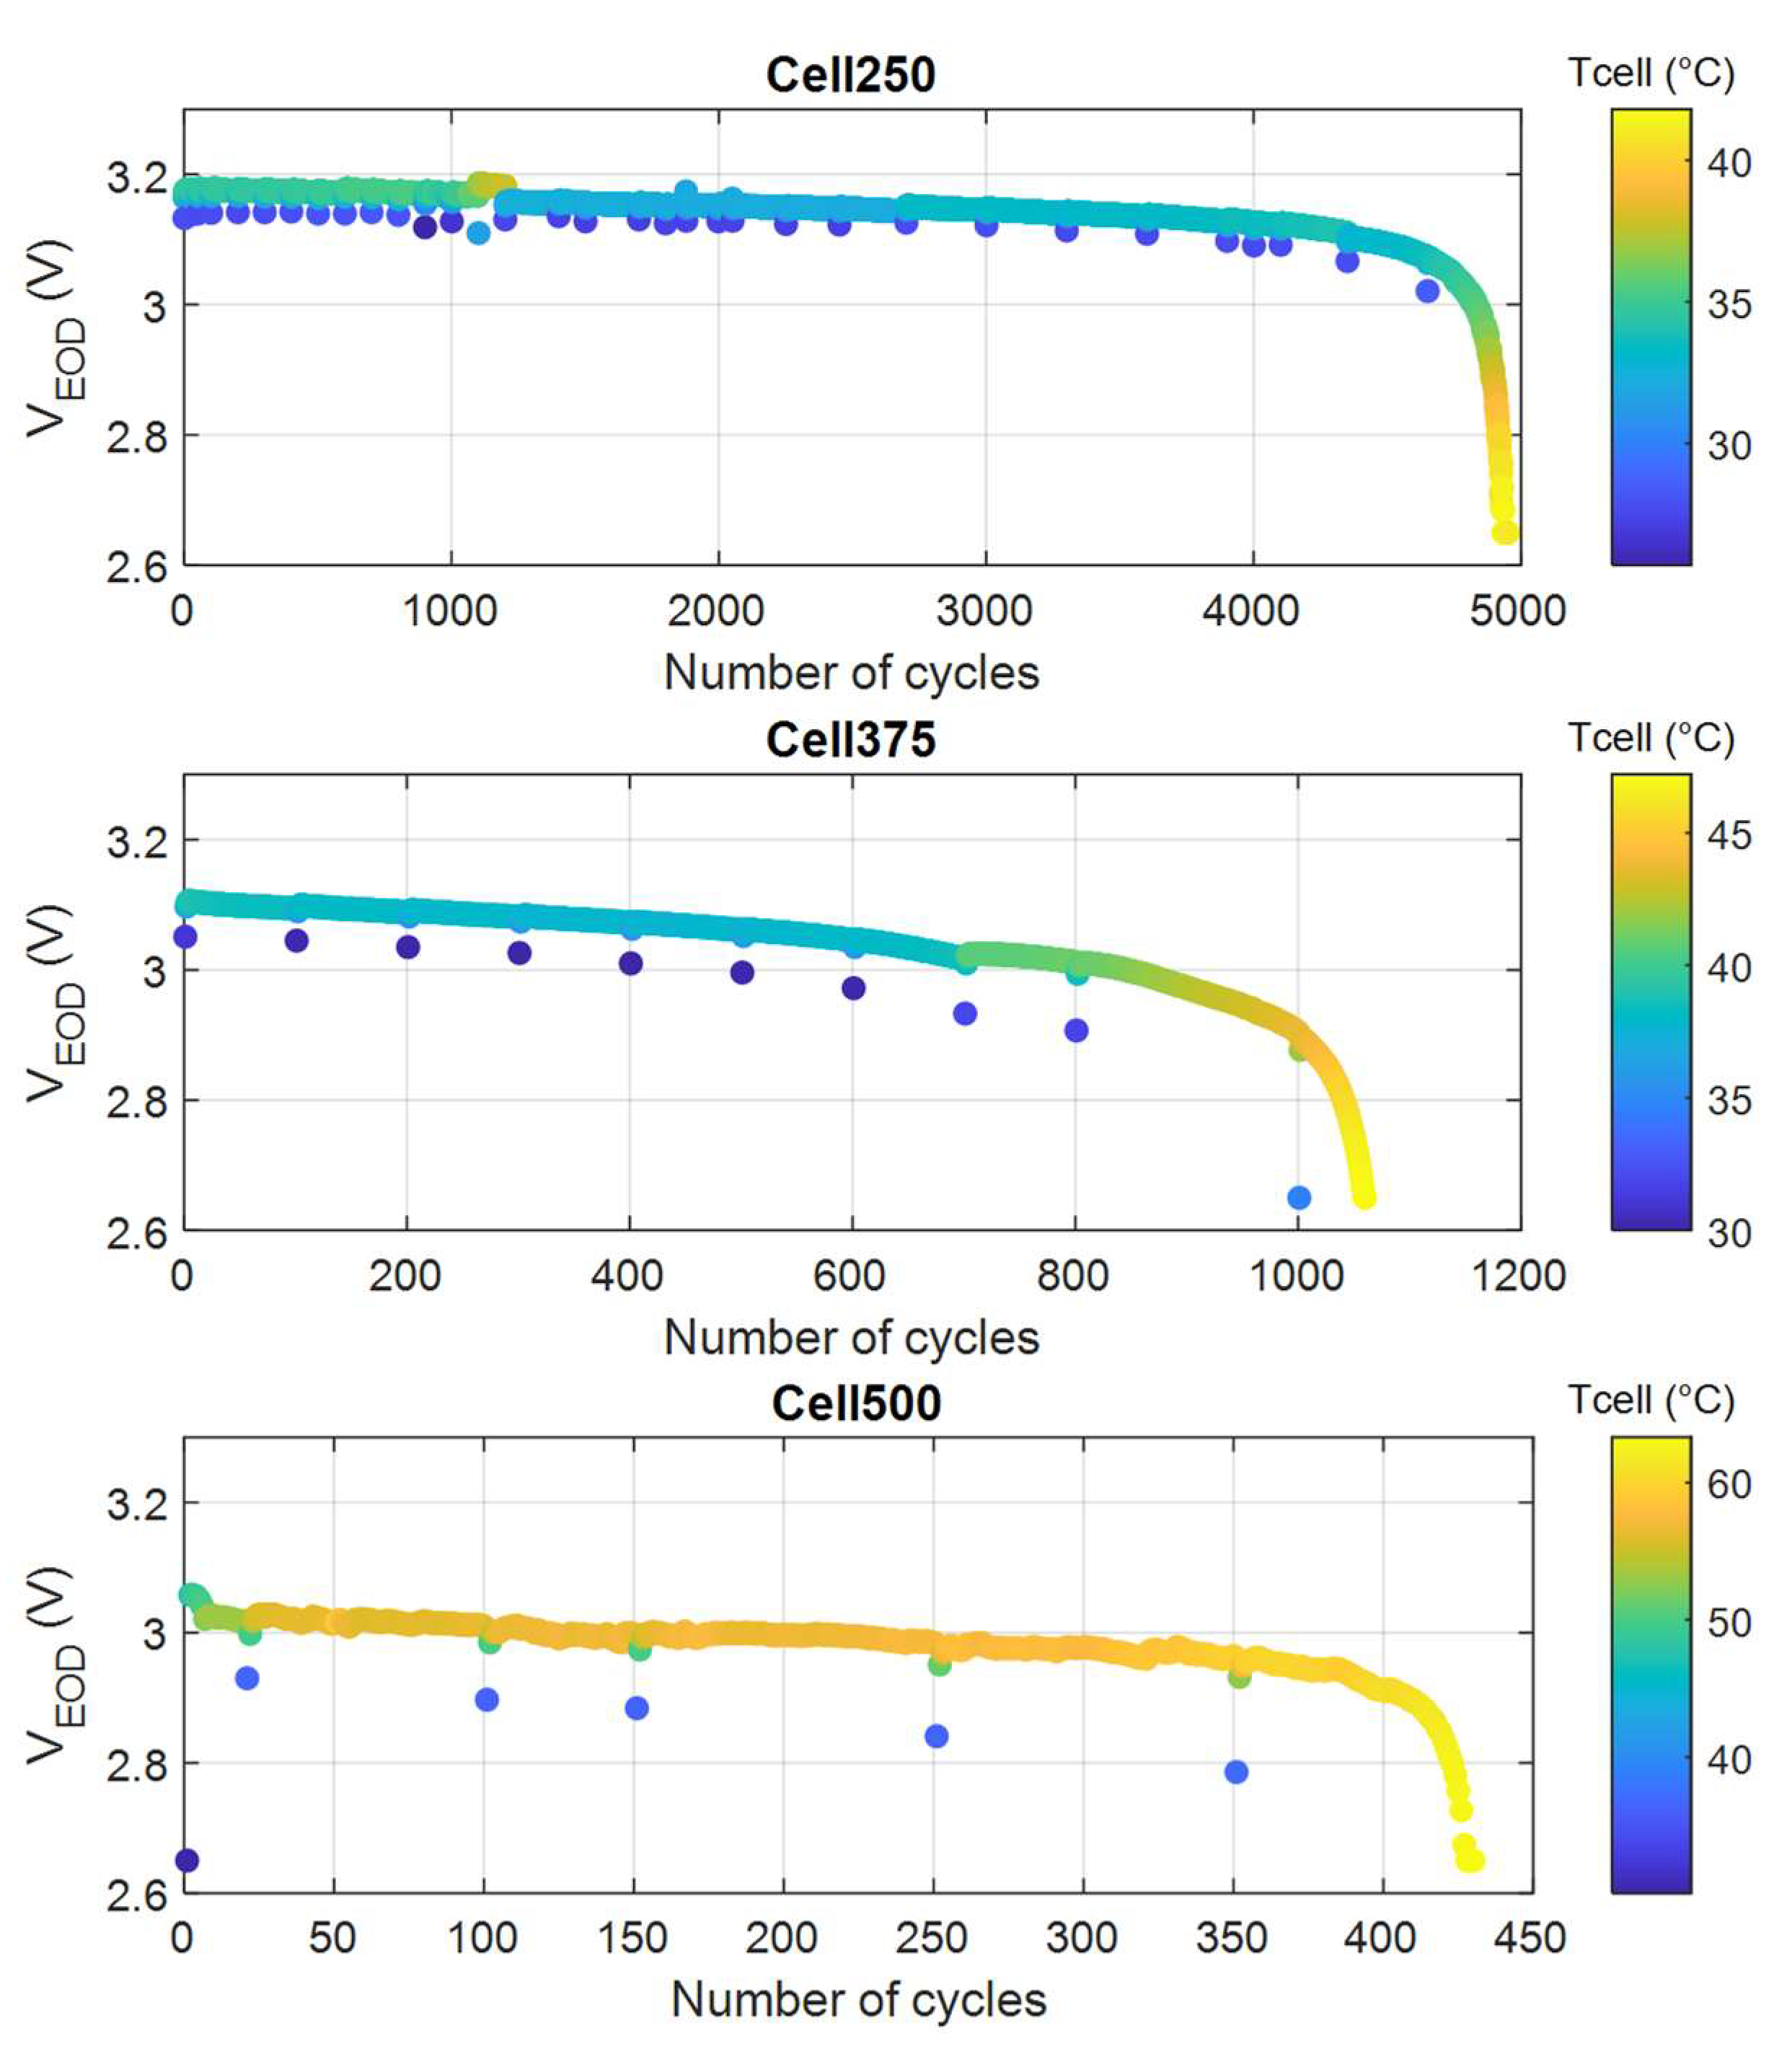
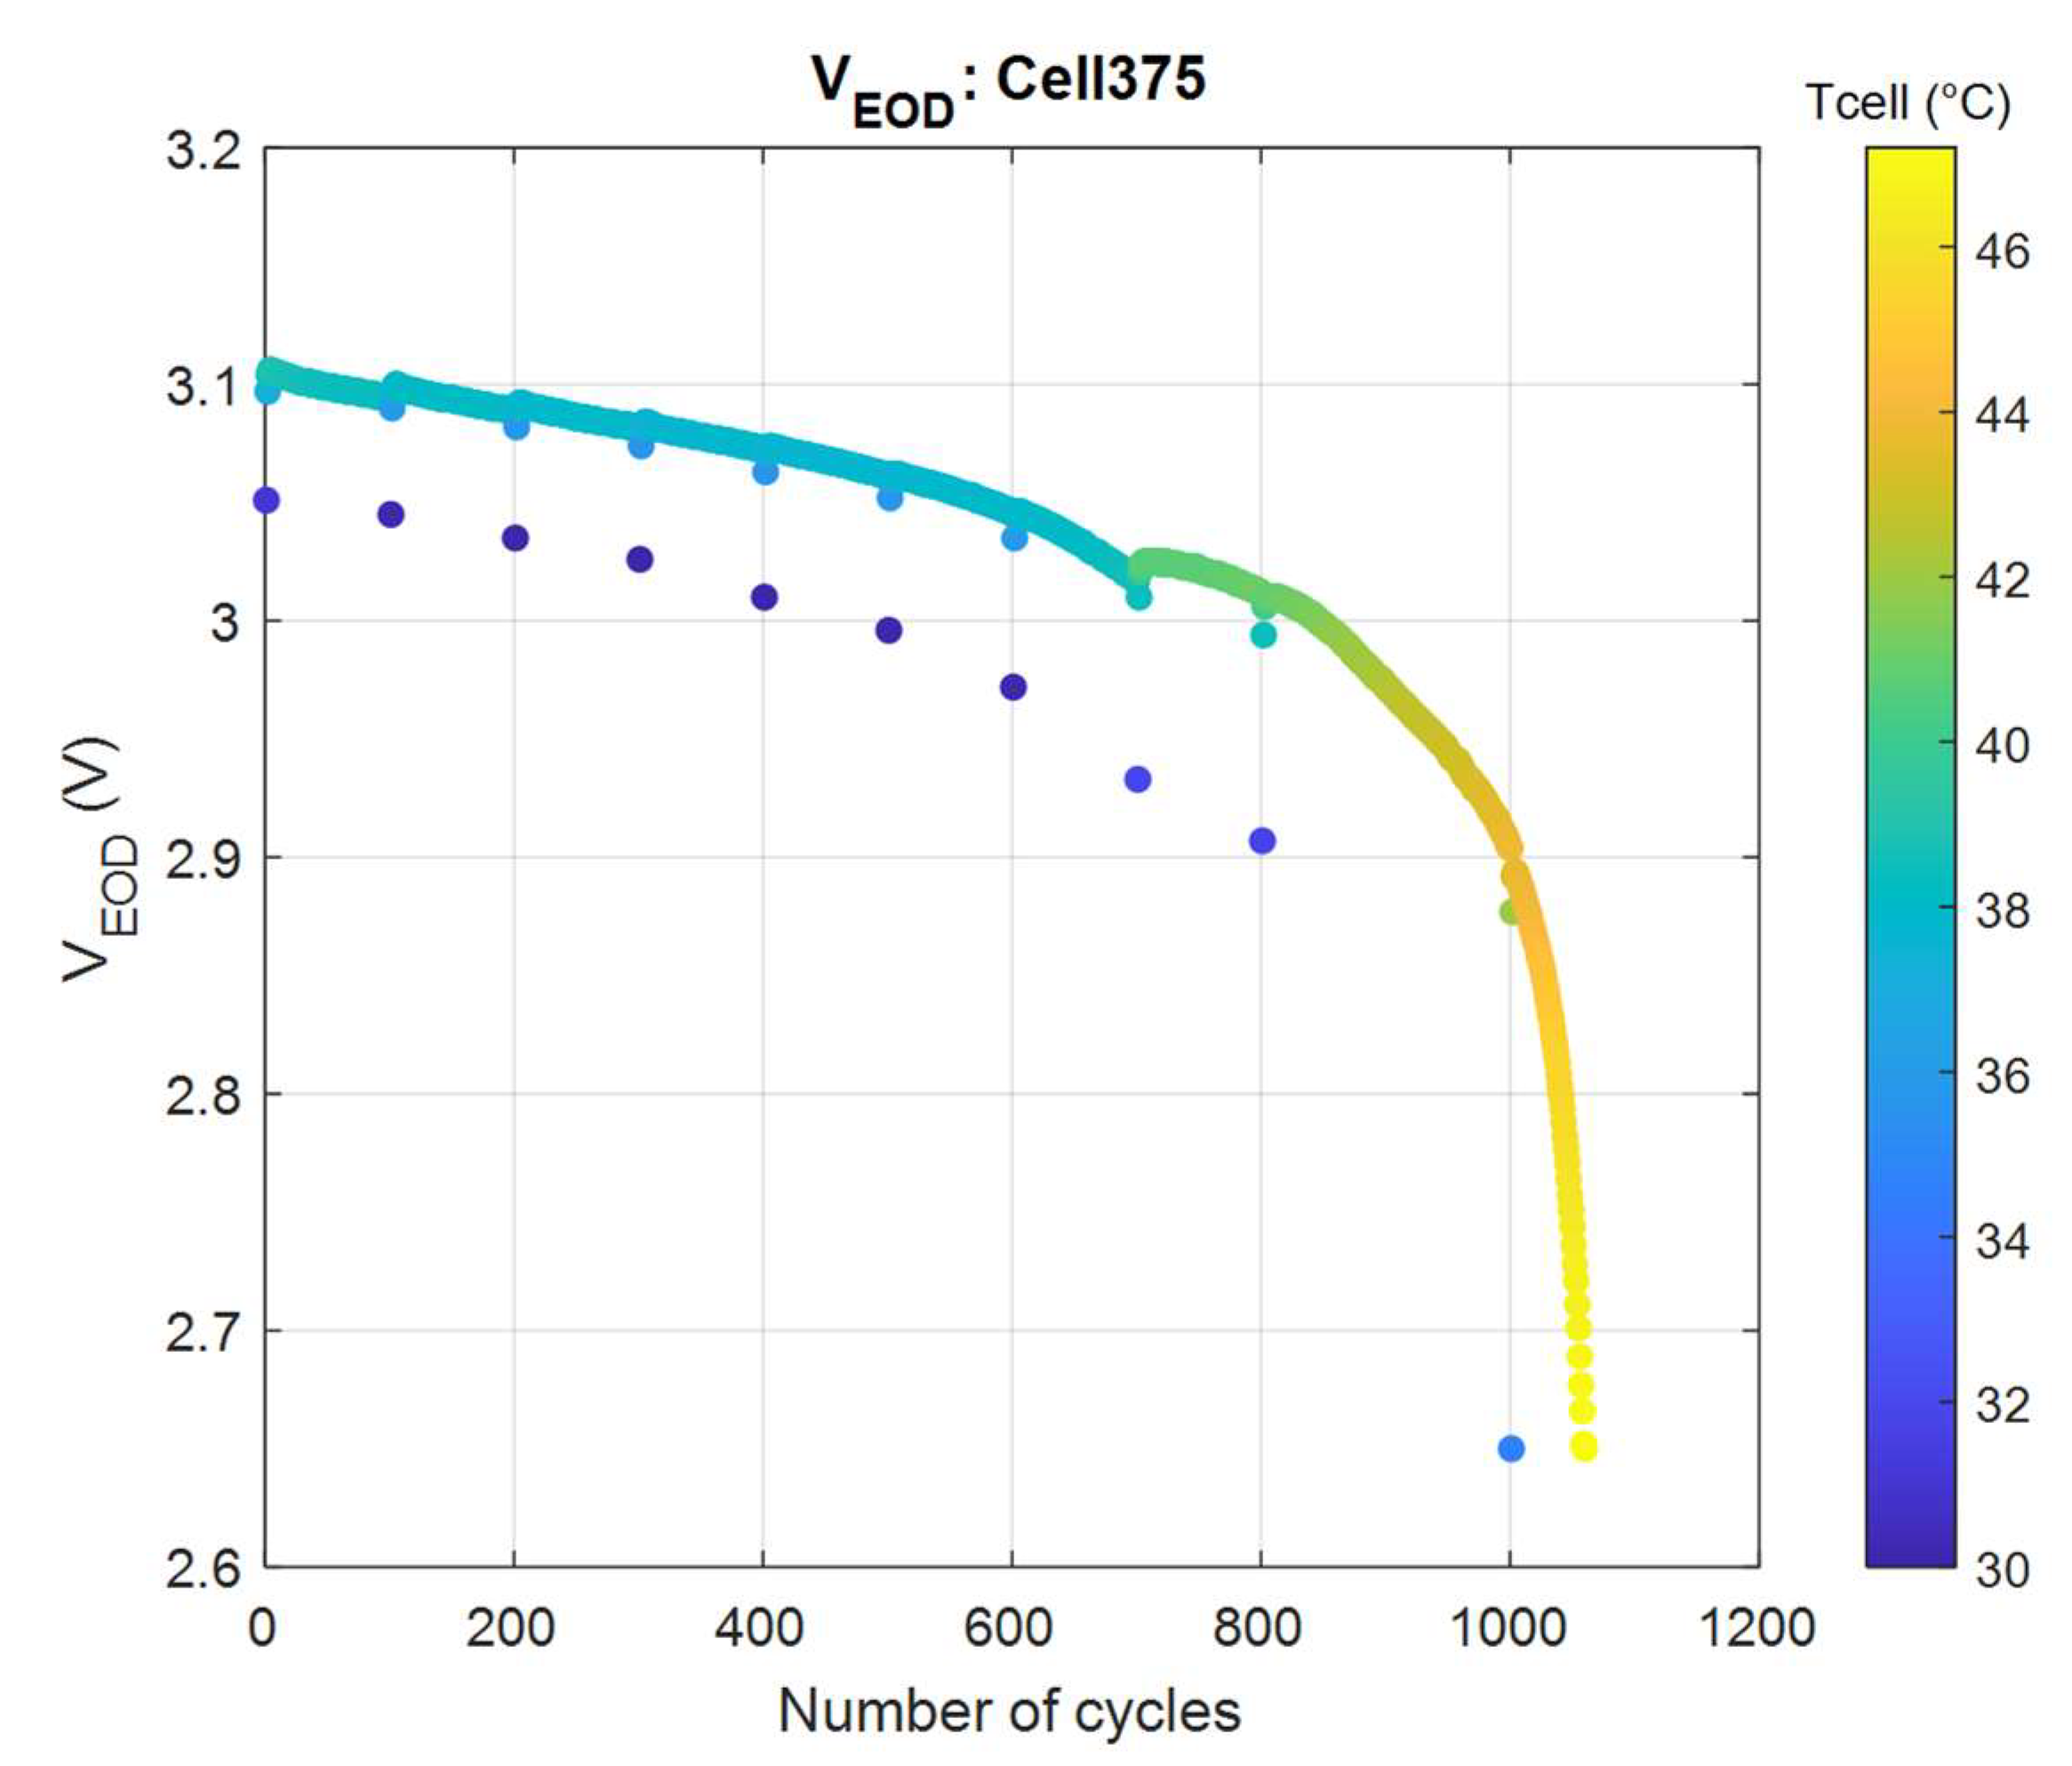
4.1.2. End-of-Discharge (EOD) Voltage and Heat Generation

The EOD voltage could in principle be much more practical in evaluating the cell’s SOL, since the discharge profile is programmed to be very much the same in nearly all the discharges. Moreover, the EOD voltage can be measured at the end of each 15 min power delivery, without the need of resorting to ad hoc tests to evaluate the SOL. Figure 5 shows the end-of-discharge voltages of all the cycles performed with the three cells.
Each dot in the plots is also characterized by the cell’s temperature since it was shown to have a substantial effect on this indicator. In fact, some of the discharges (namely, the first ones occurring after a CCP) happened to be performed at a lower temperature because every cycling period starts with the cells at room temperature, and it needs to take a few cycles before the thermal regime is reached. This causes the corresponding values to be out of the general curve trend (blue dots in the figure). It was also recommended that if we wanted to use the end-of-discharge voltage as an aging indicator, we must correlate it with the cell’s temperature: the lower the temperature, the lower the voltage. Even though this was not searched during the experimental tests, it is a nice result: not only the plots in Figure 5 show the VEOD trend when the cell was not in its regime temperature, but also its value at the lower temperature. We also note that at the end of life, the cell heat generation grew significantly. In fact, since the cell was still held in a thermostatic chamber, its higher temperature near the end-of-life indicated a larger heat generation. This fact agrees with the meaningful increase of the internal resistance of the cells in correspondence of the end-of-discharge experimentally measured (cf. Section 4.1.3). The results on VEOD showed additional interesting information obtained from zooming in on some of the curves in Figure 5. Consider, for instance, Figure 6.
By observing this figure, it is possible to extract the end-of-dicharge voltage information at different temperature ranges. This is a consequence of the fact that the very first cycle after a CCP finds the cell much cooler (by 7–8 °C), and the second one slightly cooler than the others. In this figure, a CCP occurs at each 100 cycles for the first 800 cycles, and each 200 cycles after, until reaching the end-of-discharge threshold of 2.65 V. Another interesting observation regarding this figure is that the rest time (a few hours) that occurred systematically between a CCP and the start of the subsquent cycling period had some effect on the cell’s ability to deliver power. In fact, at the beginning of each cycling period, we observed a larger end-of-discharge voltage, which cannot be explained on the bases of the temperatures we measured. We can only hypothesize that the rest allowed charge diffusion inside the cell, which favours subsequent discharges. This is consistent with what we know about electrochemical cells, which, after rests, show an increased ability to deliver charge. Nevertheless, the most important observation we can have on the figures in this section regards the ability of VEOD to perform as a SOL indicator. In this respect, we note that:
  • Throughout the entire cell cycle life, the end-of-discharge voltage is a good indicator of the cell’s SOL, and for a given temperature, a linear interpolation may be used;
  • At low SOLs (large cycle numbers), a significant temperature rise is a good indicator, in conjunction with a steep fall of VEOD of the imminent cell end-of-life.
In all cases, we note that the thermal chamber temperature was constantly held at 25 °C.

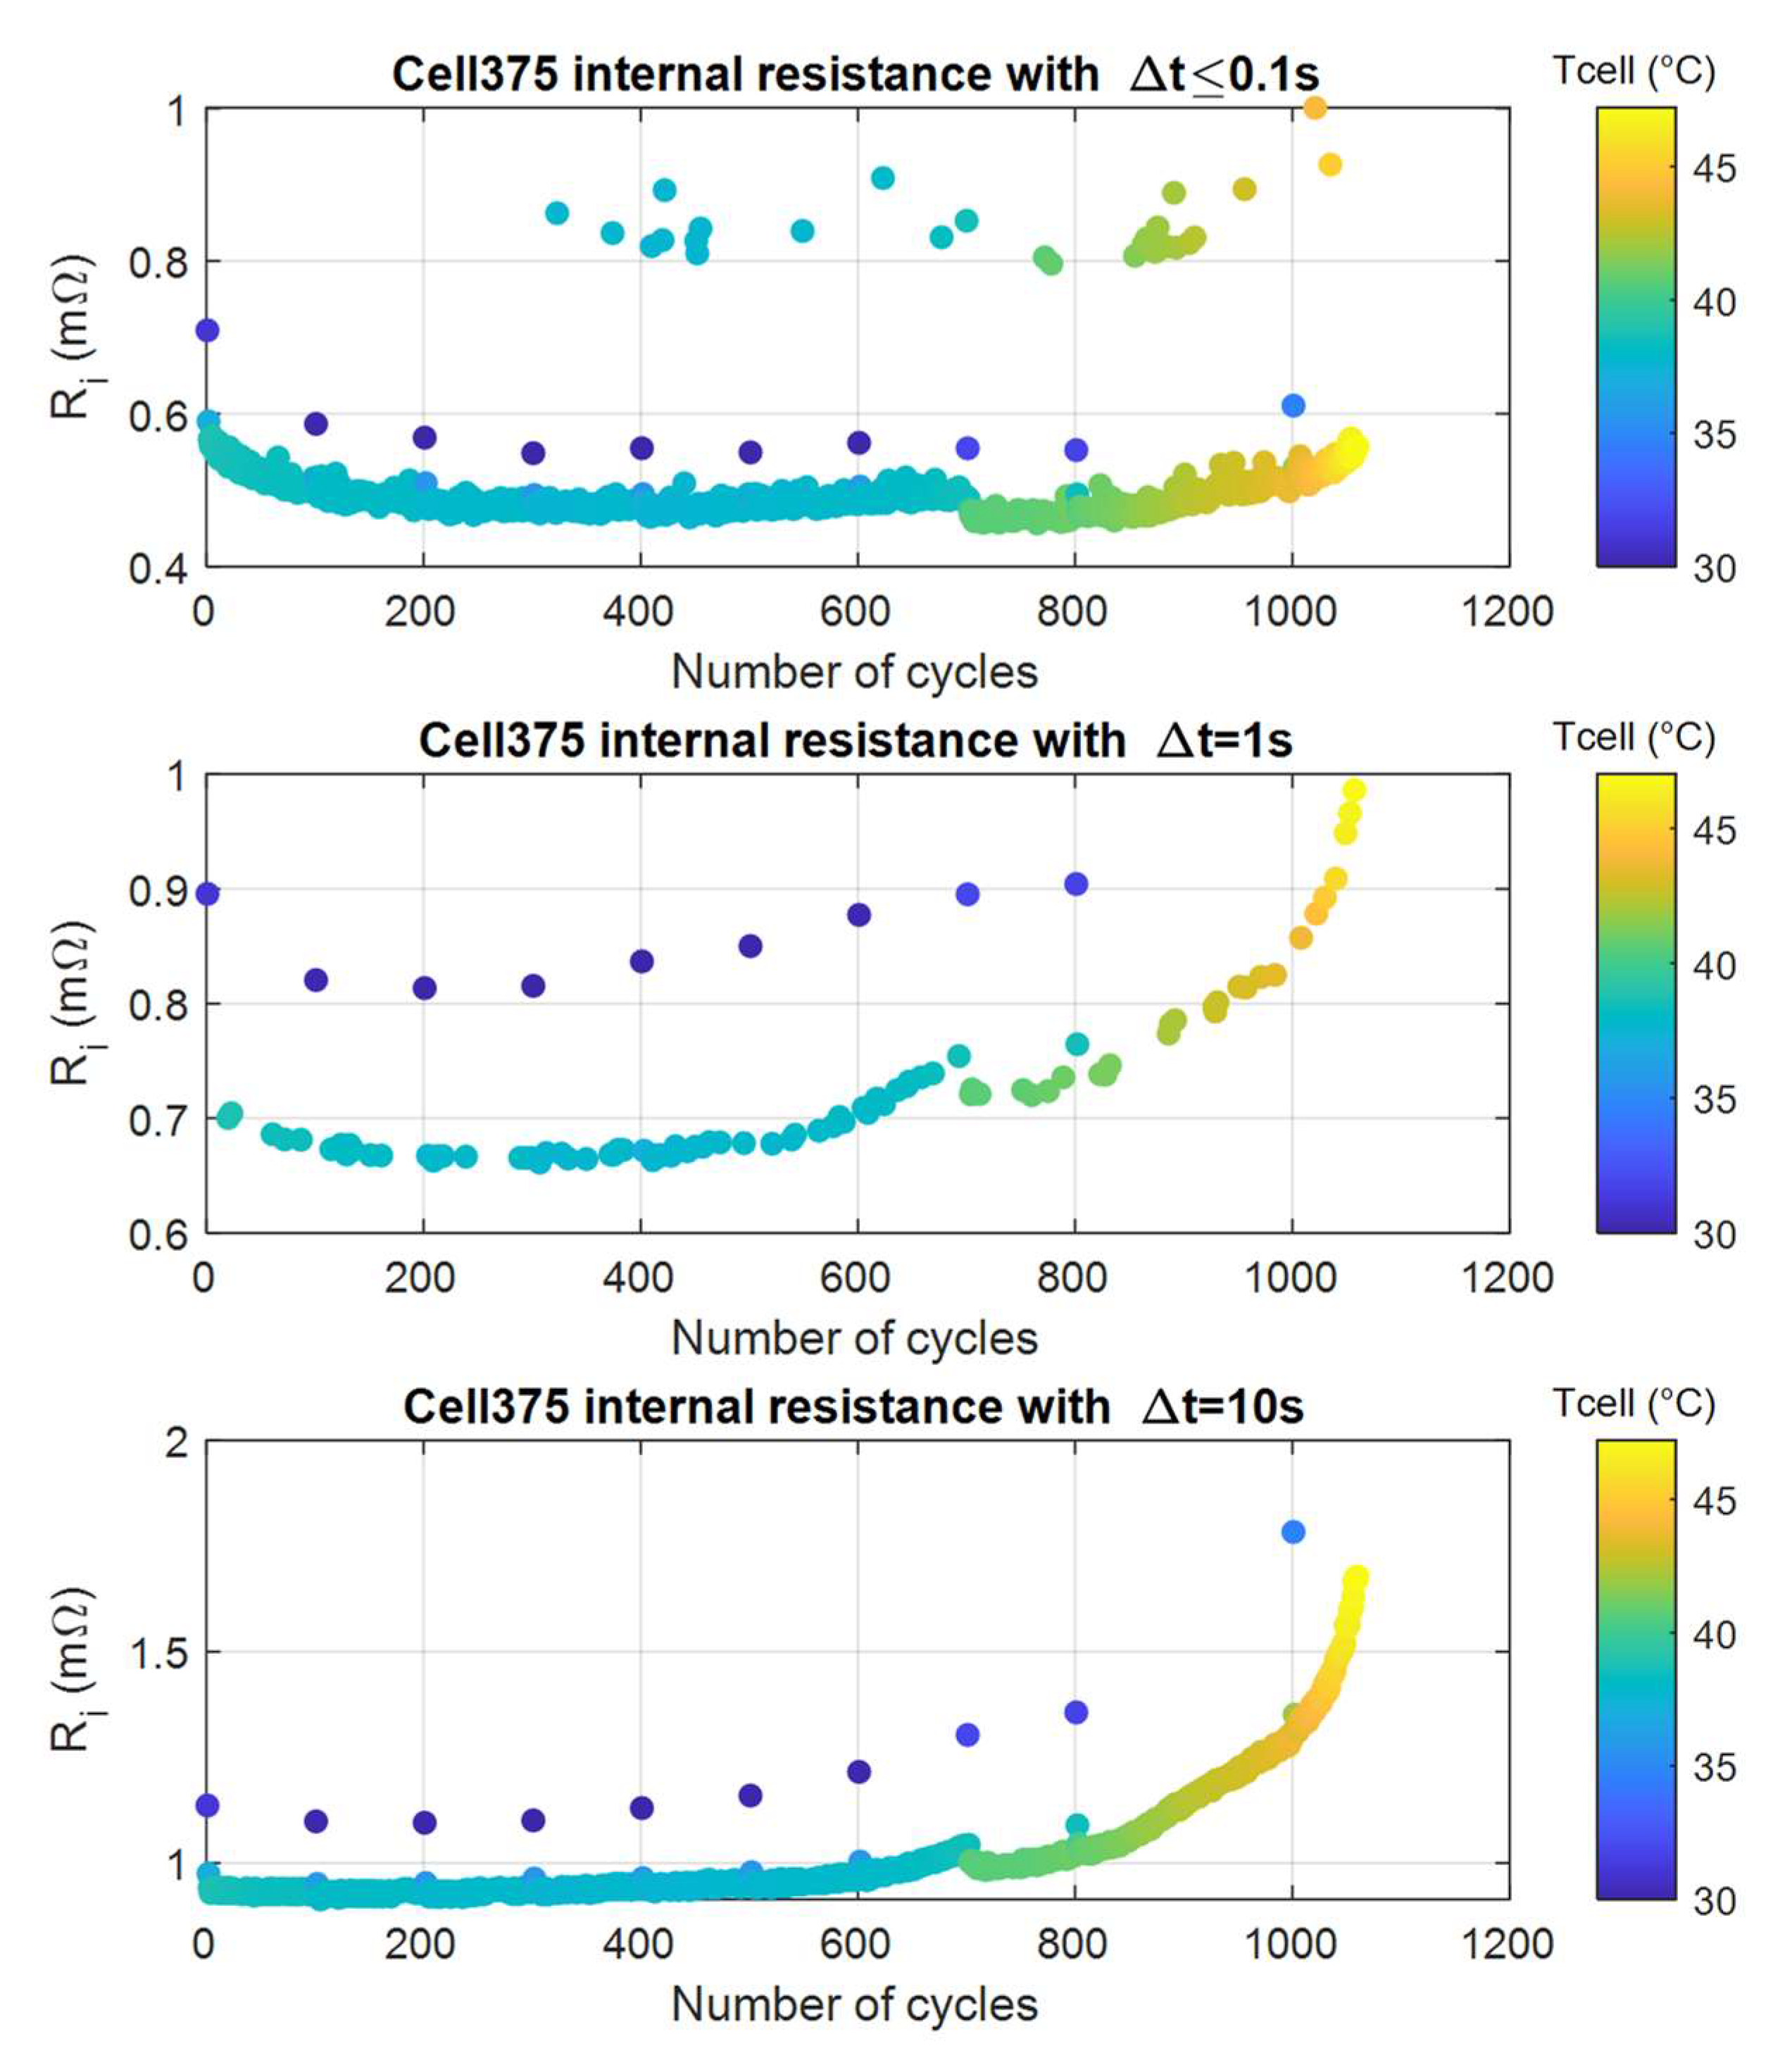
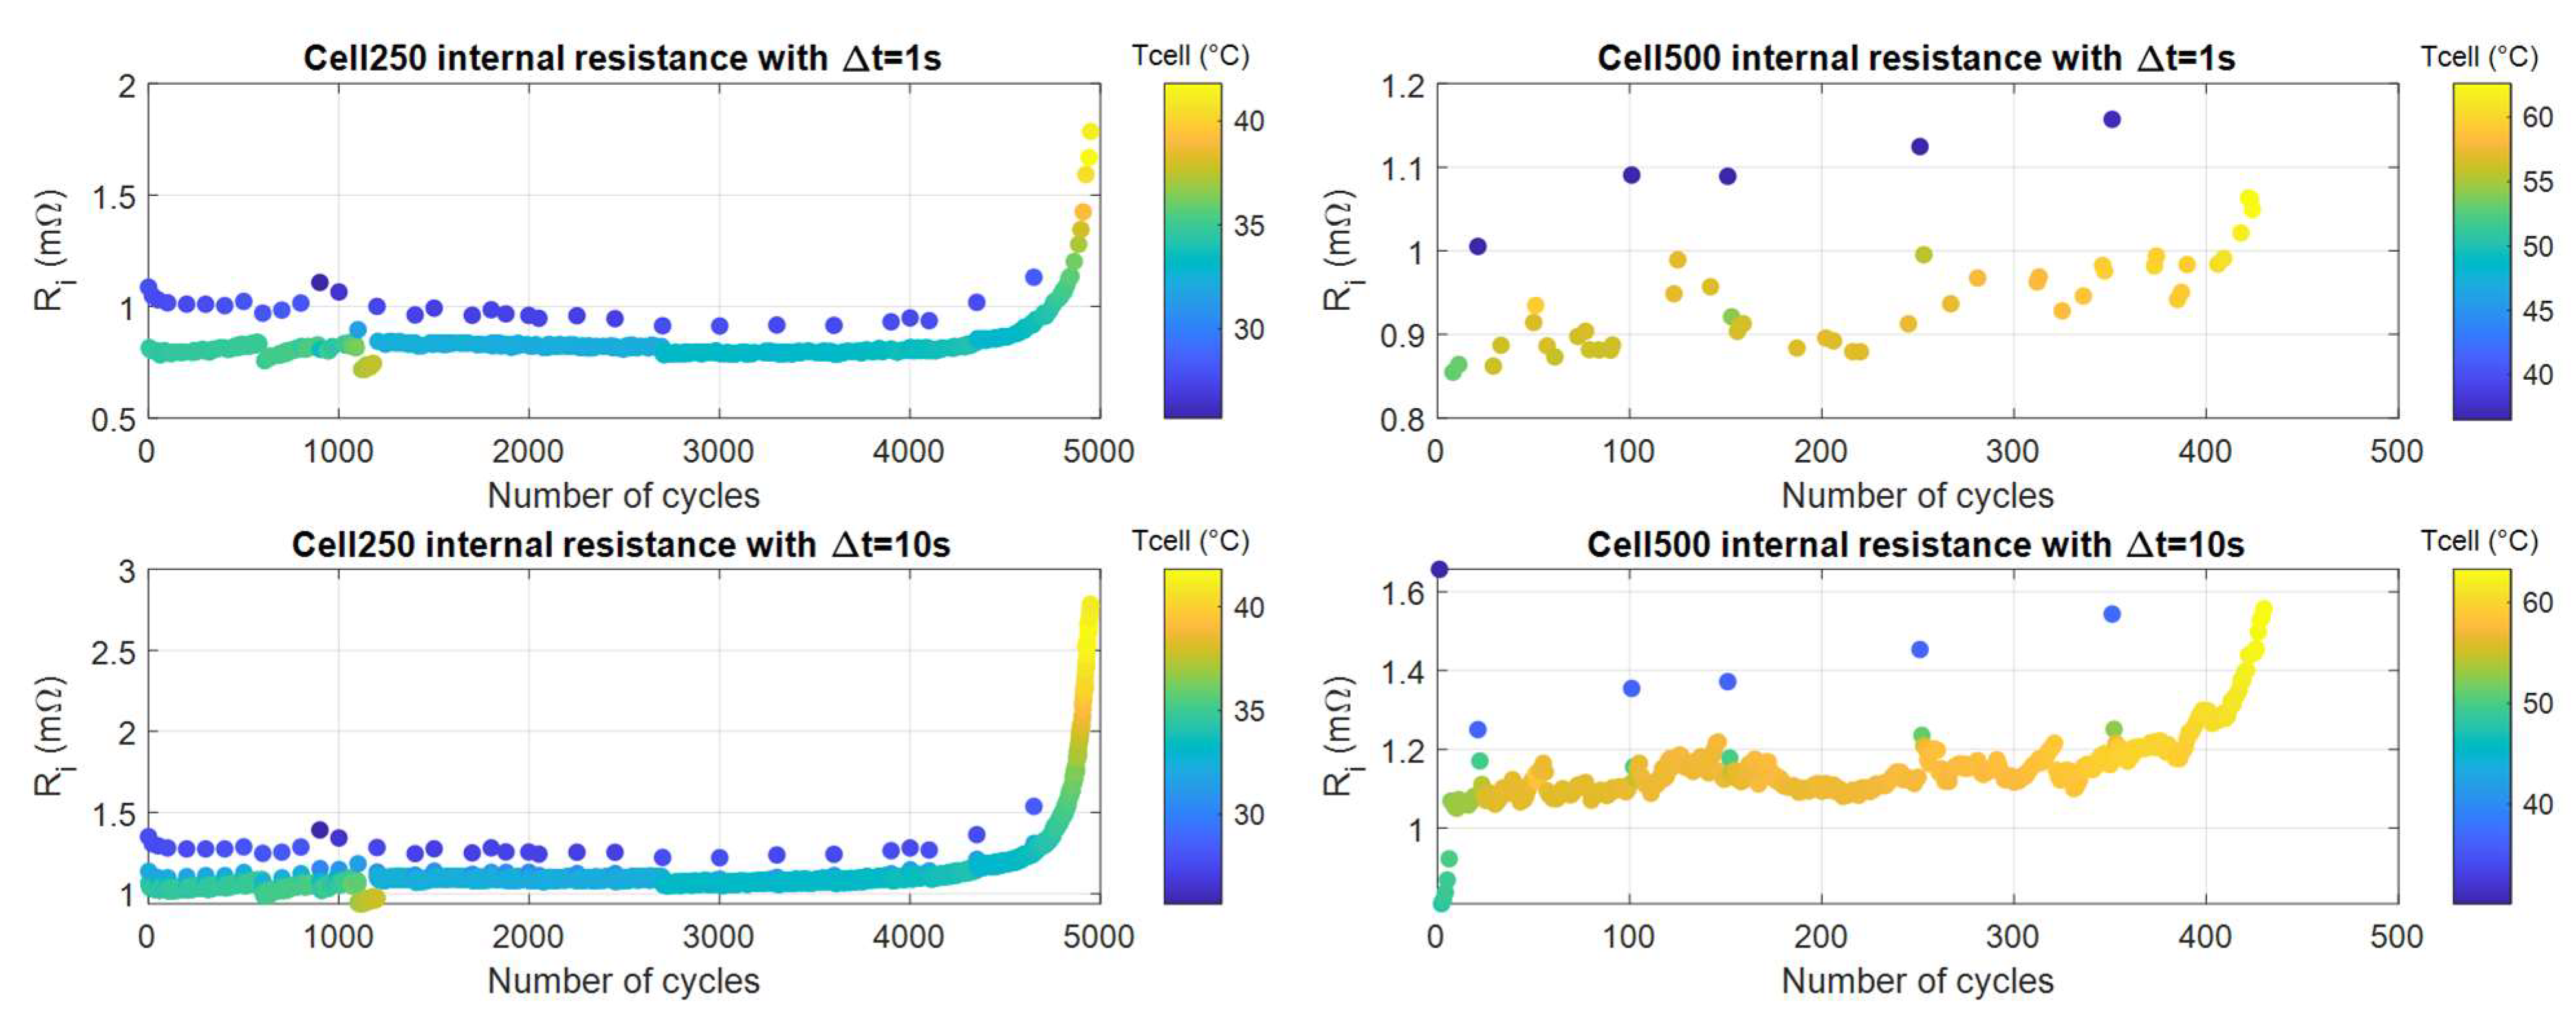
4.1.3. Internal Resistance and Heat Generation

The cell internal resistance we intended to measure was discussed in Section 3.4. By the application of Equation (3), we showed that the internal resistance value that we measure depends on the interval Δ t , at which voltage and current samples are taken. It also depends on the battery SOC. Therefore, we herein analyze the internal resistance trend at the two SOC levels available for each cell under study: start-of-discharge and end-of-discharge, by using different values for Δ t . It is here important to underline that the first SOC value is the same for every cell under study: i.e., SOC = 100%, because the beginning of every discharge phase starts with the cells fully charged. Hence, the second value depends on each cell, since the corresponding DODs are different (see Table 2, i.e., SOC = 67% for cell250, SOC = 50% for cell375, and SOC = 30% for cell500). Regarding Δ t , we chose to evaluate Equation (3) using three different time intervals: short, medium, and large. Figure 7 shows the internal resistance evaluation of cell375, in the case of evaluation at SOC = 100% (star-of-discharge). Since our cell tester did not allow for direct determination of Δ t , we filtered out the intervals we obtained from measurement. The actual intervals used for computations were 0.01   s Δ t 0.1   s for the upper plot in Figure 7, 0.9   s Δ t 1.1   s for the middle plot, and 9   s Δ t 11   s for the bottom plot. From Figure 7, we can infer some points:
  • The resistance evaluation must be paired with the cell case temperature. Because these values are taken immediately after a CCP, where, as already mentioned, the cell’s temperature is lower, the corresponding resistances are significantly larger.
  • There are some resistance changes after the cell has been rested without cycling. Indeed, during our tests, cell375 was left inactive for a few months after cycle number 700 and a few days after the 1000th cycle. Correspondingly, we saw a deviation from the previous trends, apparently due to internal battery state changes, not captured by temperature alone. It is reasonable to assume that the inactive periods between cycling phases impact the cell behavior by increasing the availability to deliver power.
  • If we do not consider the extra points mentioned in the first bullet, the measured resistance over time had a rather constant behavior. Its trend over the entire cycle life displayed meaningful variation only if Δt = 10 s was used. However, the usage of this value was tricky, since some battery rests offsets the larger life-related Ri change, as discussed in the previous bullet point.
Incredibly different internal resistance experimental trends were displayed by the very same Ri evaluation but performed at every end of discharge, in correspondence of intermediate SOC levels and not for fully charged cells. The corresponding DODs are shown in Table 2, and SOC = 1 − DOD. For this case, the internal resistances computed as R i = Δ V / Δ i with evaluation of deltas at different time intervals are shown in Figure 8, again for the case of cell375. The considered time intervals have exactly the same meaning as in Figure 7.
Now we can make the following comments:
  • The case with Δt = 0.1 s is rather useless. We had a cloud with resistances above 0.8 mΩ, which was probably due to some weakness of our data storing mechanism; moreover, we had some cool samples (blue dots) that were out of the bulk of the points. Even though we found an algorithm to take all these values out, the general trend of most of the points, the low curve, showed that the variation in resistance was not very large; moreover, rests in the battery operation (as we said the battery was at rest a few months at cycle number 700) caused significant changes in Δt = 0.1 s resistances.
  • The cases with Δt = 1 s and Δt = 10 s instead showed useful results. As with all the previous cases, we must combine the Ri measure with temperature, since the trend with resistance values measured immediately after CCP, where the cell was cooler, showed much larger resistances values (blue dots) than the others. Once we were able to select data that were thermally homogeneous (blue points discarded), we saw a significant variation of the internal resistance in function of the cell number of cycles, which was by far larger than the variation occurring due to cell resting, (e.g., after the cell rest at cycle number 700. Between the first and the last internal resistance values, the increase was 43% for the case Δt = 1 s and 79% for the Δt = 10 s. Therefore, the end-of-discharge resistance was a good indicator of the battery aging, especially when SOL was at least 60%.
Unfortunately, the situation was not as good for the other two cells, wherein the Δ t = 0.1   s was useless (again, probably due to limitation of our measuring hardware). In Figure 9, we also report the internal resistance trends for the cell250 and cell500, in the case of Δ t equal to 1 s and 10 s. The following observations were made:
  • The cell250 value showed a significant change only starting from 88% SOL.
  • The cell500 had less regular behavior and showed significant increase, for the best case with Δt = 10 s, starting from around 80% SOL.

5. Conclusions

In this paper, specific aging tests were performed on three identical LFP cells located in the same ambient conditions, with the aim of evaluating their cycle-life and trying to find aging indicators, which could help predictive maintenance. The stress to which the cells were subjected was defined as a function of the application of these batteries, and it consisted in 15 min constant-power discharge and subsequent constant-power charge.
The results showed that the use of 500 W constant power was very stressful for the cells, and implied only 430 cycles, with a lifetime delivered energy of roughly 54 kWh. The 375 W and 250 W constant powers were more adequate and implied 100 kWh and 310 kWh lifetime delivered energy, respectively.
The tests showed that, in addition to the obvious deliverable charge when subject to constant-current discharge, useful aging indicators are the end-of-discharge voltage and the internal resistance, even though their evaluation must be carefully coupled with cell temperature measurements.
The paper has also shown some details on how to measure the internal resistance in order to let it be a reasonably useful SOL indicator. In particular, in order to better correlate the cell internal resistance evaluation to the cell actual aging level, intermediate SOC levels are to be preferred to a 100% SOC.

Author Contributions

Conceptualization, M.C.; methodology, M.C.; validation, C.S.; investigation, M.C. and C.S.; data curation, C.S.; writing—original draft preparation, C.S.; writing—review and editing, M.C., C.S., G.L. and D.P.; visualization, G.L. and D.P.; supervision, G.L. and M.C.; project administration, M.C.; funding acquisition, M.C. All authors have read and agreed to the published version of the manuscript.

Funding

The study presented in this paper was funded by Italian Regione Toscana for the SUMA (Struttura Multifunzionale Urbana Attiva) project, BANDO “FAR-FAS 2014”—CUP 4421. 02102014.0720000220 and D51B18000740009.

Institutional Review Board Statement

Not applicable.

Informed Consent Statement

Not applicable.

Data Availability Statement

Data sharing not applicable.

Conflicts of Interest

The authors declare no conflict of interest.

Appendix A

Figure A1. Battery laboratory of University of Pisa, DESTEC Department.
Energies 14 04813 g0a1
Table A1. Laboratory instrument specifics.
Battery Cycler
ManufacturerDigatron
Voltage range (V)0 ÷ 6
Max current (A)250
Voltage accuracy (% of full scale)0.05
Current accuracy (% of full scale) 0.1
Min acquisition timestep (ms)10
Thermocouples
Type“K”
Expanded uncertainty (°C)0.3 (95%)
Climatic Chamber 2
ManufacturerBinder
Temperature range (°C)−40 ÷ +180
Internal volume (L)53
Max set-point temperature oscillation (°C)± 0.3
Climatic Chamber 1
ManufacturerFDM
Temperature range (°C)0 ÷ +70
Internal volume (L)370
Max set-point temperature oscillation (°C)±0.5

References

  1. Batteries Europe Strategic Research Agenda for Batteries 2020 Report. Available online: https://ec.europa.eu/energy/topics/technology-and-innovation/batteries-europe/news-articles-and-publications/sra_en (accessed on 6 August 2021).
  2. Warner, J. The Handbook of Lithium-Ion Battery Pack Design; Elsevier: Amsterdam, The Netherlands, 2015. [Google Scholar]
  3. Wikner, E.; Thiringer, T. Extending Battery Lifetime by Avoiding High SOC. Appl. Sci. 2018, 8, 1825. [Google Scholar] [CrossRef] [Green Version]
  4. Xu, B.; Oudalov, A.; Ulbig, A.; Andersson, G.; Kirschen, D.S. Modeling of Lithium-Ion Battery degradation for Cell Life Assessment. IEEE Trans. Smart Grid 2018, 9, 1131–1140. [Google Scholar] [CrossRef]
  5. Khalik, Z.; Bergveld, H.J.; Donkers, M.C.F. Ageing-Aware Charging of Lithium-Ion Batteries Using an Electrochemistry-Based Model with Capacity-Loss Side Reactions. In Proceedings of the American Control Conference (ACC), Denver, CO, USA, 1–3 July 2020; pp. 2213–2218. [Google Scholar]
  6. Motapon, S.N.; Lachance, E.; Dessaint, L.A.; Al-Haddad, K. A generic cycle life model for lithium batteries based on fatigue theory and equivalent cycle counting. IEEE Open J. Ind. Electron. Soc. 2020, 1, 207–217. [Google Scholar] [CrossRef]
  7. SUMA Project. Available online: https://www.destec.unipi.it/ricerca/progetti-nazionali-ed-internazionali/far-fas-2014/568-progetto-suma (accessed on 4 May 2021).
  8. Ceraolo, M.; Lutzemberger, G.; Poli, D.; Scarpelli, C. Experimental analysis of LFP lithium cells aging. In Proceedings of the IEEE International Conference on Environment and Electrical Engineering and 2020 IEEE Industrial and Commercial Power Systems Europe (EEEIC/I&CPS Europe), Madrid, Spain, 9–12 June 2020; pp. 1–6. [Google Scholar]
  9. Digatron Official Site. Available online: https://www.digatron.com/en-us/Solutions/Battery-Laboratory (accessed on 4 May 2021).
  10. Binder Official Site. Available online: https://www.binder-world.com/it (accessed on 4 May 2021).
  11. Winston Batteries Official Site. Available online: http://en.winston-battery.com/ (accessed on 4 May 2021).
  12. Jaguemont, J.; Boulon, L.; Venet, P.; Dubé, Y.; Sari, A. Low temperature aging tests for lithium-ion batteries. In Proceedings of the IEEE 24th International Symposium on Industrial Electronics (ISIE), Rio de Janeiro, Brazil, 3–5 June 2015; pp. 1284–1289. [Google Scholar]
  13. Lee, H.; Park, J.; Kim, J. Comparative analysis of the SOH estimation based on various resistance parameters for LiCoO2 cells. In Proceedings of the IEEE Transportation Electrification Conference and Expo, Asia-Pacific (ITEC Asia-Pacific), Busan, Korea, 1–4 June 2016; pp. 788–792. [Google Scholar]
  14. Jarraya, I.; Loukil, J.; Masmoudi, F.; Chabchoub, M.H.; Trabelsi, H. Modeling and Parameters Estimation for Lithium-Ion Cells in Electric Drive Vehicle. In Proceedings of the 15th International Multi-Conference on Systems, Signals & Devices (SSD), Hammamet, Tunisia, 19–22 March 2018; pp. 1128–1132. [Google Scholar]
  15. Gurjer, L.; Chaudhary, P.; Verma, H.K. Detailed Modelling Procedure for Lithium-ion Battery Using Thevenin Equivalent. In Proceedings of the IEEE International Conference on Electrical, Computer and Communication Technologies (ICECCT), Coimbatore, India, 20–22 February 2019; pp. 1–6. [Google Scholar]
  16. Tan, X.; Tan, Y.; Zhan, D.; Yu, Z.; Fan, Y.; Qiu, J.; Li, J. Real-Time State-of-Health Estimation of Lithium-Ion Batteries Based on the Equivalent Internal Resistance. IEEE Access 2020, 8, 56811–56822. [Google Scholar] [CrossRef]
  17. Mathew, M.; Janhunen, S.; Rashid, M.; Long, F.; Fowler, M. Comparative Analysis of Lithium-Ion Battery Resistance Estimation Techniques for Battery Management Systems. Energies 2018, 11, 1490. [Google Scholar] [CrossRef] [Green Version]
  18. Barré, A.; Deguilhem, B.; Grolleau, S.; Gérard, M.; Suard, F.; Riu, D. A review on lithium-ion battery ageing mechanisms and estimations for automotive applications. J. Power Sources 2013, 2013, 680–689. [Google Scholar] [CrossRef] [Green Version]
  19. Ruiz, V. Standard for the Performance and Durability Assessment of Electric Vehicles Batteries; JRC Technical Reports; European Commission: Brussels, Belgium, 2018. [Google Scholar]
  20. Barai, A.; Uddin, K.; Widanage, W.D.; McGordon, A.; Jennings, P. A study of the influence of measurement timescale on internal resistance characterisation methodologies for lithium-ion cells. Sci. Rep. 2018, 8, 21. [Google Scholar] [CrossRef] [PubMed]
  21. Kim, J.H.; Lee, S.J.; Lee, J.M.; Cho, B.H. A New Direct Current Internal Resistance and State of Charge Relationship for the Li-Ion Battery Pulse Power Estimation. In Proceedings of the IEEE International Conference on Power Electronics, Daegu, Korea, 22–26 October 2007; p. 1173. [Google Scholar]
Figure 1. (a) Aging test structure: cycling periods interspersed with cell characterization phases (CCP). (b) Cycling period patterns: one single cycle shown, cell250 power, voltage, and current. (c) Cell characterization phase current and voltage.
Energies 14 04813 g001
Figure 2. Picture of the cell under test inside the climatic chamber.
Energies 14 04813 g002
Figure 3. Current voltage step test for cell internal resistance identification.
Energies 14 04813 g003
Figure 4. Cell capacity as a function of the number of cycles performed.
Energies 14 04813 g004
Figure 5. End-of-discharge voltage as a function of the number of cycles performed and of the cell case temperature.
Energies 14 04813 g005
Figure 6. A zoom on one of the end-of-discharge voltages shown in Figure 5.
Energies 14 04813 g006
Figure 7. Trend of the start-of-discharge internal resistance for cell375 at SOC = 100% as a function of the number of cycles and cell case temperature for different Δ t intervals.
Energies 14 04813 g007
Figure 8. Trend of the start-of-discharge internal resistance for cell375 at SOC = 50% as a function of the number of cycles and cell case temperature for different Δ t intervals.
Energies 14 04813 g008
Figure 9. Trend of the end-of-discharge internal resistance as a function of the number of cycles and cell case temperature for different Δ t   intervals, cell250 (left side) and cell500 (right side).
Energies 14 04813 g009
Table 1. LFP lithium cell characteristics.
ManufacturerWinston Battery
Model nameWB-LYP060AHA
ChemistryLFP
Nominal capacity (Ah)60
Nominal voltage (V)3.2
Operating voltage (V)max 4.0–min 2.8
Deep discharge voltage (V)2.5 (damage if below)
Optimal discharge current (A)30
Max discharge current (A)180
Max peak discharge current (A)600 (5 s max)
Optimal charge current (A)30
Max charge current (A)180
Max operating temperature (°C)80
Dimension (mm)114 × 203 × 61
Weight (kg)2.3
Table 2. Some global parameters of the cycle-life tests.
Cell under TestTest Power (W)DOD (%)Average Discharge Current (A)
Cell25025033Cycle #10Cycle #4950
78.084.9
Cell37537550Cycle #10Cycle #1060
118.1124.9
Cell50050070Cycle #10Cycle #430
161.0167.0
Table 3. Lifetime delivered energies.
Test Power (W)Number of Cycles PerformedLifetime Energy (kWh)
50043053.8
3751060100.3
2504950309.4
Publisher’s Note: MDPI stays neutral with regard to jurisdictional claims in published maps and institutional affiliations.

