
Effects of Recombination Order on Open-Circuit Voltage Decay Measurements of Organic and Perovskite Solar Cells


Abstract
:
1. Introduction
2. Materials and Methods
3. Results and Discussion
3.1. Analytical Expressions
3.2. Determination of the Charge Carrier Density
3.3. Experimental Examples
3.4. Deviations between Models and Experiments
4. Conclusions
Author Contributions
Funding
Institutional Review Board Statement
Informed Consent Statement
Data Availability Statement
Conflicts of Interest
Abbreviations
| PBDBT | Poly[[4,8-bis[5-(2-ethylhexyl)-2-thienyl]benzo[1,2-b:4,5-b′]dithiophene-2,6- |
| diyl]-2,5-thiophenediyl[5,7-bis(2-ethylhexyl)-4,8-dioxo-4H,8H-benzo- | |
| [1,2-c:4,5-c′]dithiophene-1,3-diyl]] | |
| CETIC-4F | Bis(2-ethylhexyl)-2,2′-(4,4-bis(2-ethylhexyl)-4H-cyclopenta[1,2-b:5,4-b′]- |
| dithiophene-2,6-diyl)bis(5-((Z)-(1-(dicyanomethylene)-5,6-difluoro-3-oxo- | |
| 1H-inden-2(3H)-ylidene)methyl)thiophene-3-carboxylate) | |
| PM6 | Poly[[4,8-bis[5-(2-ethylhexyl)-4-fluoro-2-thienyl]benzo[1,2-b:4,5-b′]- |
| dithiophene-2,6-diyl]-2,5-thiophenediyl[5,7-bis(2-ethylhexyl)-4,8- | |
| dioxo-4H,8H-benzo[1,2-c:4,5-c′]dithiophene-1,3-diyl]-2,5-thiophenediyl] | |
| Y6 | 2,2′-((2Z,2′Z)-((12,13-bis(2-ethylhexyl)-3,9-diundecyl-12,13-dihydro- |
| [1,2,5]thiadiazolo[3,4-e]thieno[2″,3″:4′,5′]thieno[2′,3′:4,5]pyrrolo- | |
| [3,2-g]thieno[2′,3′:4,5]thieno[3,2-b]indole-2,10-diyl)bis(methanyl- | |
| ylidene))bis(5,6-difluoro-3-oxo-2,3-dihydro-1H-indene- | |
| 2,1-diylidene))dimalononitrile | |
| OCVD | Open-Circuit Voltage Decay |
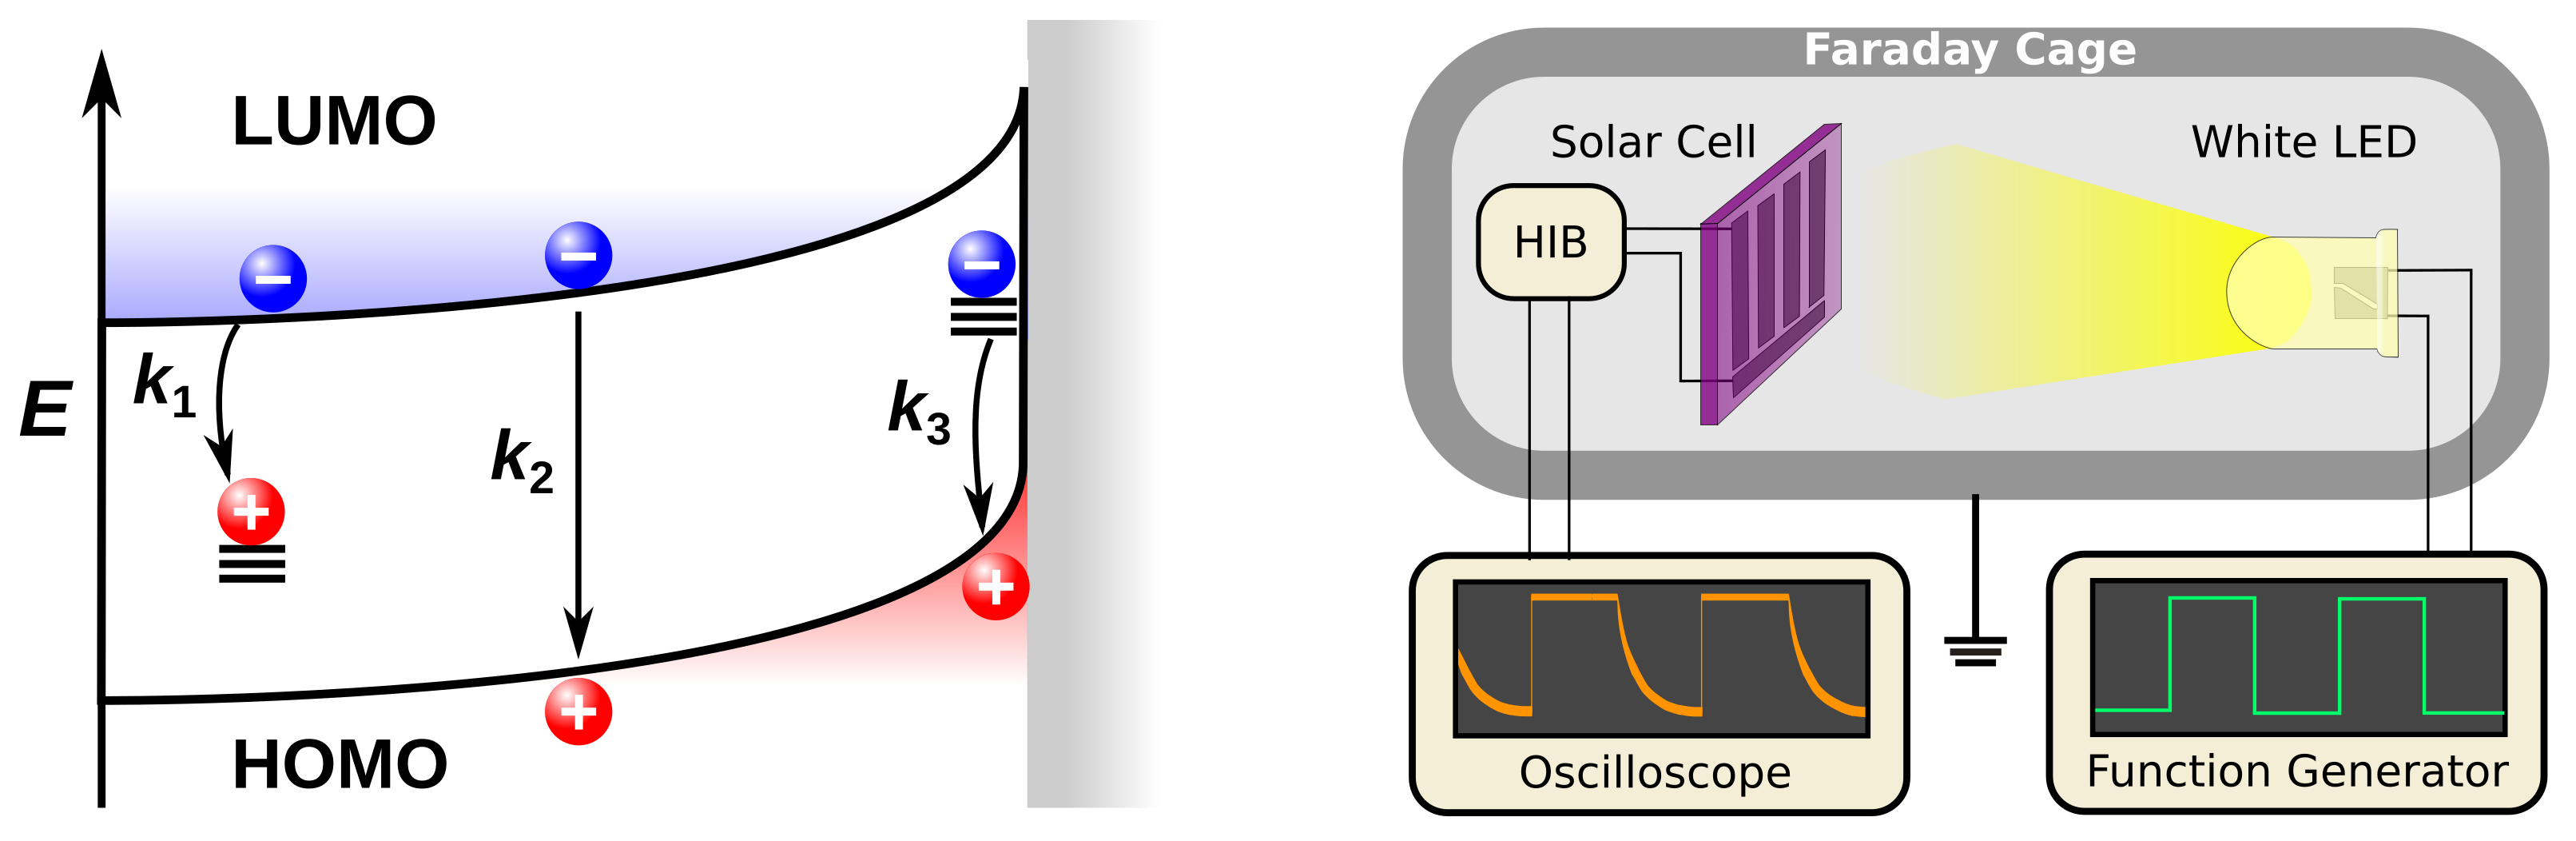
| LUMO | Lowest Unoccupied Molecular Orbital |
| HOMO | Highest Occupied Molecular Orbital |
| HIB | High Impedance Buffer |
| IS | Impedance Spectroscopy |
| VOC (V) | Open-Circuit Voltage |
| JSC (mA/cm2) | Short-Circuit Current Density |
| FF | Fill Factor |
| η (%) | Power Conversion Efficiency |
| CCT (eV) | Energy of the Charge Transfer State |
| q (As) | Elementary Charge |
| kB (J/K) | Boltzmann’s Constant |
| T (K) | Absolute Temperature |
| N0 (cm−3) | Effective Density of States |
| t (s) | Time after Turning Off the Light Source |
| n(t) (cm−3) | Time-Dependent Charge Carrier Density |
| n0 (cm−3) | Initial Charge Carrier Density at t = 0, either via OCVD or IS Approach |
| ni (cm−3) | Intrinsic Charge Carrier Density, either via OCVD or IS Approach |
| β | Recombination Order (β ≈ 1 − 3) |
| Rβ(t) (s−1cm−3) | Time-Dependent Recombination Rate of the Order β |
| R0 (s−1cm−3) | Initial Recombination Rate at t = 0 |
| k1 (s−1) | 1st Order Recombination Coefficient |
| k2 (cm−3/s) | 2nd Order Recombination Coefficient |
| k3 (cm6/s) | 3rd Order Recombination Coefficient |
| Rdiff (Ωcm2) | Differential Resistance |
| Rsh (Ωcm2) | Shunt Resistance |
| Rin (Ωcm2) | Internal Resistance |
| Jin (mA/cm2) | Internal Current Density |
| Jrec (mA/cm2) | Recombination Current Density |
| τ (s) | Recombination Lifetime |
| τ0 (s) | Initial Recombination Lifetime at t = 0 |
| τRC (s) | RC Time Constant |
Appendix A. Relationship between the Open-Circuit Voltage, Effective Density of States, and Intrinsic Charge Carrier Density
Appendix B. Calculation of the Initial Recombination Rate
Appendix C. Analytical Determination of Combined Recombination Mechanisms
References
- Bui, T.T.; Goubard, F.; Ibrahim-Ouali, M.; Gigmes, D.; Dumur, F. Thermally Activated Delayed Fluorescence Emitters for Deep Blue Organic Light Emitting Diodes: A Review of Recent Advances. Appl. Sci. 2018, 8, 494. [Google Scholar] [CrossRef] [Green Version]
- Kalyani, N.T.; Dhoble, S. Organic light emitting diodes: Energy saving lighting technology—A review. Renew. Sustain. Energy Rev. 2012, 16, 2696–2723. [Google Scholar] [CrossRef]
- Van Le, Q.; Jang, H.W.; Kim, S.Y. Recent Advances toward High-Efficiency Halide Perovskite Light-Emitting Diodes: Review and Perspective. Small Methods 2018, 2, 1700419. [Google Scholar] [CrossRef]
- Vollbrecht, J.; Wiebeler, C.; Bock, H.; Schumacher, S.; Kitzerow, H.S. Curved Polar Dibenzocoronene Esters and Imides versus Their Planar Centrosymmetric Homologs: Photophysical and Optoelectronic Analysis. J. Phys. Chem. C 2019, 123, 4483–4492. [Google Scholar] [CrossRef]
- Lill, A.T.; Cao, D.X.; Schrock, M.; Vollbrecht, J.; Huang, J.; Nguyen-Dang, T.; Brus, V.V.; Yurash, B.; Leifert, D.; Bazan, G.C.; et al. Organic Electrochemical Transistors Based on the Conjugated Polyelectrolyte PCPDTBT-SO3K (CPE-K). Adv. Mater. 2020, 32, 1908120. [Google Scholar] [CrossRef] [PubMed]
- Sirringhaus, H. 25th Anniversary Article: Organic Field-Effect Transistors: The Path Beyond Amorphous Silicon. Adv. Mater. 2014, 26, 1319–1335. [Google Scholar] [CrossRef] [Green Version]
- Surya, S.G.; Raval, H.N.; Ahmad, R.; Sonar, P.; Salama, K.N.; Rao, V.R. Organic field effect transistors (OFETs) in environmental sensing and health monitoring: A review. TrAC Trends. Anal. Chem. 2019, 111, 27–36. [Google Scholar] [CrossRef]
- Vollbrecht, J.; Oechsle, P.; Stepen, A.; Hoffmann, F.; Paradies, J.; Meyers, T.; Hilleringmann, U.; Schmidtke, J.; Kitzerow, H. Liquid crystalline dithienothiophene derivatives for organic electronics. Org. Electron. 2018, 61, 266–275. [Google Scholar] [CrossRef]
- Brus, V.V.; Lee, J.; Luginbuhl, B.R.; Ko, S.J.; Bazan, G.C.; Nguyen, T.Q. Solution-Processed Semitransparent Organic Photovoltaics: From Molecular Design to Device Performance. Adv. Mater. 2019, 31, 1900904. [Google Scholar] [CrossRef] [Green Version]
- Wadsworth, A.; Moser, M.; Marks, A.; Little, M.S.; Gasparini, N.; Brabec, C.J.; Baran, D.; McCulloch, I. Critical review of the molecular design progress in non-fullerene electron acceptors towards commercially viable organic solar cells. Chem. Soc. Rev. 2019, 48, 1596–1625. [Google Scholar] [CrossRef]
- Hu, Z.; Wang, J.; Ma, X.; Gao, J.; Xu, C.; Yang, K.; Wang, Z.; Zhang, J.; Zhang, F. A critical review on semitransparent organic solar cells. Nano Energy 2020, 105376. [Google Scholar] [CrossRef]
- Lee, J.; Ko, S.J.; Lee, H.; Huang, J.; Zhu, Z.; Seifrid, M.; Vollbrecht, J.; Brus, V.V.; Karki, A.; Wang, H.; et al. Side-Chain Engineering of Nonfullerene Acceptors for Near-Infrared Organic Photodetectors and Photovoltaics. ACS Energy Lett. 2019, 4, 1401–1409. [Google Scholar] [CrossRef]
- Pecunia, V. Efficiency and spectral performance of narrowband organic and perovskite photodetectors: A cross-sectional review. J. Phys. Mater. 2019, 2, 042001. [Google Scholar] [CrossRef]
- Tang, X.; Matt, G.J.; Gao, S.; Gu, E.; Almora, O.; Brabec, C.J. Electrical-Field-Driven Tunable Spectral Responses in a Broadband-Absorbing Perovskite Photodiode. ACS Appl. Mater. Interfaces 2019, 11, 39018–39025. [Google Scholar] [CrossRef] [PubMed]
- Huang, J.; Lee, J.; Vollbrecht, J.; Brus, V.V.; Dixon, A.L.; Cao, D.X.; Zhu, Z.; Du, Z.; Wang, H.; Cho, K.; et al. A High-Performance Solution-Processed Organic Photodetector for Near-Infrared Sensing. Adv. Mater. 2020, 32, 1906027. [Google Scholar] [CrossRef]
- Yeo, S.Y.; Park, S.; Yi, Y.J.; Kim, D.H.; Lim, J.A. Highly Sensitive Flexible Pressure Sensors Based on Printed Organic Transistors with Centro-Apically Self-Organized Organic Semiconductor Microstructures. ACS Appl. Mater. Interfaces 2017, 9, 42996–43003. [Google Scholar] [CrossRef]
- Pappa, A.M.; Parlak, O.; Scheiblin, G.; Mailley, P.; Salleo, A.; Owens, R.M. Organic Electronics for Point-of-Care Metabolite Monitoring. Trends. Biotechnol. 2018, 36, 45–59. [Google Scholar] [CrossRef] [Green Version]
- Pudzs, K.; Vembris, A.; Rutkis, M.; Woodward, S. Thin Film Organic Thermoelectric Generator Based on Tetrathiotetracene. Adv. Electron. Mater. 2017, 3, 1600429. [Google Scholar] [CrossRef] [Green Version]
- Huang, J.; Karki, A.; Brus, V.V.; Hu, Y.; Phan, H.; Lill, A.T.; Wang, M.; Bazan, G.C.; Nguyen, T.Q. Solution-Processed Ion-Free Organic Ratchets with Asymmetric Contacts. Adv. Mater. 2018, 30, 1804794. [Google Scholar] [CrossRef]
- Hao, J.; Lu, H.; Nanayakkara, S.U.; Harvey, S.P.; Blackburn, J.L.; Ferguson, A.J. Perovskite Electronic Ratchets for Energy Harvesting. Adv. Electron. Mater. 2020, 6, 2000831. [Google Scholar] [CrossRef]
- Roy, P.; Sinha, N.K.; Tiwari, S.; Khare, A. A review on perovskite solar cells: Evolution of architecture, fabrication techniques, commercialization issues and status. Sol. Energy 2020, 198, 665–688. [Google Scholar] [CrossRef]
- Li, N.; Niu, X.; Chen, Q.; Zhou, H. Towards commercialization: The operational stability of perovskite solar cells. Chem. Soc. Rev. 2020, 49, 8235–8286. [Google Scholar] [CrossRef]
- Riede, M.; Spoltore, D.; Leo, K. Organic Solar Cells—The Path to Commercial Success. Adv. Energy Mater. 2021, 11, 2002653. [Google Scholar] [CrossRef]
- Darling, S.B.; You, F. The case for organic photovoltaics. RSC Adv. 2013, 3, 17633–17648. [Google Scholar] [CrossRef]
- Guo, J.; Min, J. A Cost Analysis of Fully Solution-Processed ITO-Free Organic Solar Modules. Adv. Energy Mater. 2019, 9, 1802521. [Google Scholar] [CrossRef]
- Credgington, D.; Jamieson, F.C.; Walker, B.; Nguyen, T.Q.; Durrant, J.R. Quantification of Geminate and Non-Geminate Recombination Losses within a Solution-Processed Small-Molecule Bulk Heterojunction Solar Cell. Adv. Mater. 2012, 24, 2135–2141. [Google Scholar] [CrossRef] [PubMed]
- Shockley, W.; Read, W., Jr. Statistics of the Recombinations of Holes and Electrons. Phys. Rev. 1952, 87, 835. [Google Scholar] [CrossRef]
- Koster, L.; Mihailetchi, V.; Blom, P. Bimolecular recombination in polymer/fullerene bulk heterojunction solar cells. Appl. Phys. Lett. 2006, 88, 052104. [Google Scholar] [CrossRef] [Green Version]
- Brus, V.V.; Lang, F.; Bundesmann, J.; Seidel, S.; Denker, A.; Rech, B.; Landi, G.; Neitzert, H.C.; Rappich, J.; Nickel, N.H. Defect Dynamics in Proton Irradiated CH3NH3PbI3 Perovskite Solar Cells. Adv. Electron. Mater. 2017, 3, 1600438. [Google Scholar] [CrossRef] [Green Version]
- Göhler, C.; Wagenpfahl, A.; Deibel, C. Nongeminate Recombination in Organic Solar Cells. Adv. Electron. Mater. 2018, 4, 1700505. [Google Scholar] [CrossRef]
- Vollbrecht, J.; Brus, V.V. On the recombination order of surface recombination under open circuit conditions. Org. Electron. 2020, 86, 105905. [Google Scholar] [CrossRef]
- Brus, V.V. Light dependent open-circuit voltage of organic bulk heterojunction solar cells in the presence of surface recombination. Org. Electron. 2016, 29, 1–6. [Google Scholar] [CrossRef]
- Yang, C.; Zhang, J.; Liang, N.; Yao, H.; Wei, Z.; He, C.; Yuan, X.; Hou, J. Effects of energy-level offset between a donor and acceptor on the photovoltaic performance of non-fullerene organic solar cells. J. Mater. Chem. A 2019, 7, 18889–18897. [Google Scholar] [CrossRef]
- McDowell, C.; Abdelsamie, M.; Toney, M.F.; Bazan, G.C. Solvent Additives: Key Morphology-Directing Agents for Solution-Processed Organic Solar Cells. Adv. Mater. 2018, 30, 1707114. [Google Scholar] [CrossRef] [PubMed]
- Shi, M.; Wang, T.; Sun, R.; Wu, Q.; Pei, D.; Wang, H.; Yang, W.; Wang, W.; Wu, Y.; Xie, G.; et al. Remove the water-induced traps toward improved performance in organic solar cells. Sci. China Mater. 2021, 1–16. [Google Scholar] [CrossRef]
- Schwarz, K.N.; Geraghty, P.B.; Jones, D.J.; Smith, T.A.; Ghiggino, K.P. Suppressing Subnanosecond Bimolecular Charge Recombination in a High-Performance Organic Photovoltaic Material. J. Phys. Chem. C 2016, 120, 24002–24010. [Google Scholar] [CrossRef]
- Yi, Z.; Ni, W.; Zhang, Q.; Li, M.; Kan, B.; Wan, X.; Chen, Y. Effect of thermal annealing on active layer morphology and performance for small molecule bulk heterojunction organic solar cells. J. Mater. Chem. C 2014, 2, 7247–7255. [Google Scholar] [CrossRef]
- Bonasera, A.; Giuliano, G.; Arrabito, G.; Pignataro, B. Tackling performance challenges in organic photovoltaics: An overview about compatibilizers. Molecules 2020, 25, 2200. [Google Scholar] [CrossRef] [PubMed]
- Hoefler, S.F.; Rath, T.; Pastukhova, N.; Pavlica, E.; Scheunemann, D.; Wilken, S.; Kunert, B.; Resel, R.; Hobisch, M.; Xiao, S.; et al. The effect of polymer molecular weight on the performance of PTB7-Th: O-IDTBR non-fullerene organic solar cells. J. Mater. Chem. A 2018, 6, 9506–9516. [Google Scholar] [CrossRef] [Green Version]
- Karki, A.; Vollbrecht, J.; Gillett, A.J.; Xiao, S.S.; Yang, Y.; Peng, Z.; Schopp, N.; Dixon, A.L.; Yoon, S.; Schrock, M.; et al. The role of bulk and interfacial morphology in charge generation, recombination, and extraction in non-fullerene acceptor organic solar cells. Energy Environ. Sci. 2020, 13, 3679–3692. [Google Scholar] [CrossRef]
- Yao, J.; Qiu, B.; Zhang, Z.G.; Xue, L.; Wang, R.; Zhang, C.; Chen, S.; Zhou, Q.; Sun, C.; Yang, C.; et al. Cathode engineering with perylene-diimide interlayer enabling over 17% efficiency single-junction organic solar cells. Nat. Commun. 2020, 11, 1–10. [Google Scholar] [CrossRef] [PubMed]
- Brus, V.V.; Lee, H.K.; Proctor, C.M.; Ford, M.; Liu, X.; Burgers, M.A.; Lee, J.; Bazan, G.C.; Nguyen, T.Q. Balance Between Light Absorption and Recombination Losses in Solution-Processed Small Molecule Solar Cells with Normal or Inverted Structures. Adv. Energy Mater. 2018, 8, 1801807. [Google Scholar] [CrossRef]
- Koster, L.J.A.; Mihailetchi, V.; Xie, H.; Blom, P.W. Origin of the light intensity dependence of the short-circuit current of polymer/fullerene solar cells. Appl. Phys. Lett. 2005, 87, 203502. [Google Scholar] [CrossRef] [Green Version]
- Koster, L.J.A.; Mihailetchi, V.D.; Ramaker, R.; Blom, P.W. Light intensity dependence of open-circuit voltage of polymer: Fullerene solar cells. Appl. Phys. Lett. 2005, 86, 123509. [Google Scholar] [CrossRef] [Green Version]
- Cowan, S.R.; Banerji, N.; Leong, W.L.; Heeger, A.J. Charge Formation, Recombination, and Sweep-Out Dynamics in Organic Solar Cells. Adv. Funct. Mater. 2012, 22, 1116–1128. [Google Scholar] [CrossRef] [Green Version]
- Vollbrecht, J.; Brus, V.V. On Charge Carrier Density in Organic Solar Cells Obtained via Capacitance Spectroscopy. Adv. Electron. Mater. 2020, 6, 2000517. [Google Scholar] [CrossRef]
- Brus, V.V.; Proctor, C.M.; Ran, N.A.; Nguyen, T.Q. Capacitance Spectroscopy for Quantifying Recombination Losses in Nonfullerene Small-Molecule Bulk Heterojunction Solar Cells. Adv. Energy Mater. 2016, 6, 1502250. [Google Scholar] [CrossRef]
- Nakano, K.; Chen, Y.; Tajima, K. Quantifying charge carrier density in organic solar cells by differential charging techniques. AIP Adv. 2019, 9, 125205. [Google Scholar] [CrossRef] [Green Version]
- Vollbrecht, J.; Brus, V.V.; Ko, S.J.; Lee, J.; Karki, A.; Cao, D.X.; Cho, K.; Bazan, G.C.; Nguyen, T.Q. Quantifying the Nongeminate Recombination Dynamics in Nonfullerene Bulk Heterojunction Organic Solar Cells. Adv. Energy Mater. 2019, 9, 1901438. [Google Scholar] [CrossRef]
- Elliott, L.C.; Basham, J.I.; Pernstich, K.P.; Shrestha, P.R.; Richter, L.J.; DeLongchamp, D.M.; Gundlach, D.J. Probing Charge Recombination Dynamics in Organic Photovoltaic Devices under Open-Circuit Conditions. Adv. Energy Mater. 2014, 4, 1400356. [Google Scholar] [CrossRef]
- Phuong, L.Q.; Hosseini, S.M.; Sandberg, O.J.; Zou, Y.; Woo, H.Y.; Neher, D.; Shoaee, S. Quantifying Quasi-Fermi Level Splitting and Open-Circuit Voltage Losses in Highly Efficient Nonfullerene Organic Solar Cells. Sol. RRL 2021, 5, 2000649. [Google Scholar] [CrossRef]
- Vollbrecht, J.; Lee, J.; Ko, S.J.; Brus, V.V.; Karki, A.; Le, W.; Seifrid, M.; Ford, M.J.; Cho, K.; Bazan, G.C.; et al. Design of narrow bandgap non-fullerene acceptors for photovoltaic applications and investigation of non-geminate recombination dynamics. J. Mater. Chem. C 2020, 8, 15175–15182. [Google Scholar] [CrossRef]
- Karki, A.; Vollbrecht, J.; Dixon, A.L.; Schopp, N.; Schrock, M.; Reddy, G.M.; Nguyen, T.Q. Understanding the High Performance of over 15% Efficiency in Single-Junction Bulk Heterojunction Organic Solar Cells. Adv. Mater. 2019, 31, 1903868. [Google Scholar] [CrossRef] [PubMed]
- Neukom, M.; Züfle, S.; Jenatsch, S.; Ruhstaller, B. Opto-electronic characterization of third-generation solar cells. Sci. Technol. Adv. Mater. 2018, 19, 291–316. [Google Scholar] [CrossRef] [Green Version]
- Blom, P.W.; De Jong, M.; Vleggaar, J. Electron and hole transport in poly (p-phenylene vinylene) devices. Appl. Phys. Lett. 1996, 68, 3308–3310. [Google Scholar] [CrossRef] [Green Version]
- Armin, A.; Zarrabi, N.; Sandberg, O.J.; Kaiser, C.; Zeiske, S.; Li, W.; Meredith, P. Limitations of Charge Transfer State Parameterization Using Photovoltaic External Quantum Efficiency. Adv. Energy Mater. 2020, 10, 2001828. [Google Scholar] [CrossRef]
- Karki, A.; Vollbrecht, J.; Gillett, A.J.; Selter, P.; Lee, J.; Peng, Z.; Schopp, N.; Dixon, A.L.; Schrock, M.; Nádaždy, V.; et al. Unifying Charge Generation, Recombination, and Extraction in Low-Offset Non-Fullerene Acceptor Organic Solar Cells. Adv. Energy Mater. 2020, 10, 2001203. [Google Scholar] [CrossRef]
- Sakata, I.; Hayashi, Y. Open-circuit voltage decay (OCVD) measurement applied to hydrogenated amorphous silicon solar cells. Jpn. J. Appl. Phys. 1990, 29, L27. [Google Scholar] [CrossRef]
- Brus, V.V.; Lang, F.; Fengler, S.; Dittrich, T.; Rappich, J.; Nickel, N.H. Doping Effects and Charge-Transfer Dynamics at Hybrid Perovskite/Graphene Interfaces. Adv. Mater. Interfaces 2018, 5, 1800826. [Google Scholar] [CrossRef]
- Fu, F.; Kranz, L.; Yoon, S.; Löckinger, J.; Jäger, T.; Perrenoud, J.; Feurer, T.; Gretener, C.; Buecheler, S.; Tiwari, A.N. Controlled growth of PbI2 nanoplates for rapid preparation of CH3NH3PbI3 in planar perovskite solar cells. Phys. Status Solidi A Appl. Mater. 2015, 212, 2708–2717. [Google Scholar] [CrossRef]
- Volonakis, G.; Giustino, F. Ferroelectric Graphene–Perovskite Interfaces. J. Phys. Chem. Lett. 2015, 6, 2496–2502. [Google Scholar] [CrossRef] [PubMed]
- Dang, V.Q.; Han, G.S.; Trung, T.Q.; Jin, Y.U.; Hwang, B.U.; Jung, H.S.; Lee, N.E. Methylammonium lead iodide perovskite-graphene hybrid channels in flexible broadband phototransistors. Carbon 2016, 105, 353–361. [Google Scholar] [CrossRef]


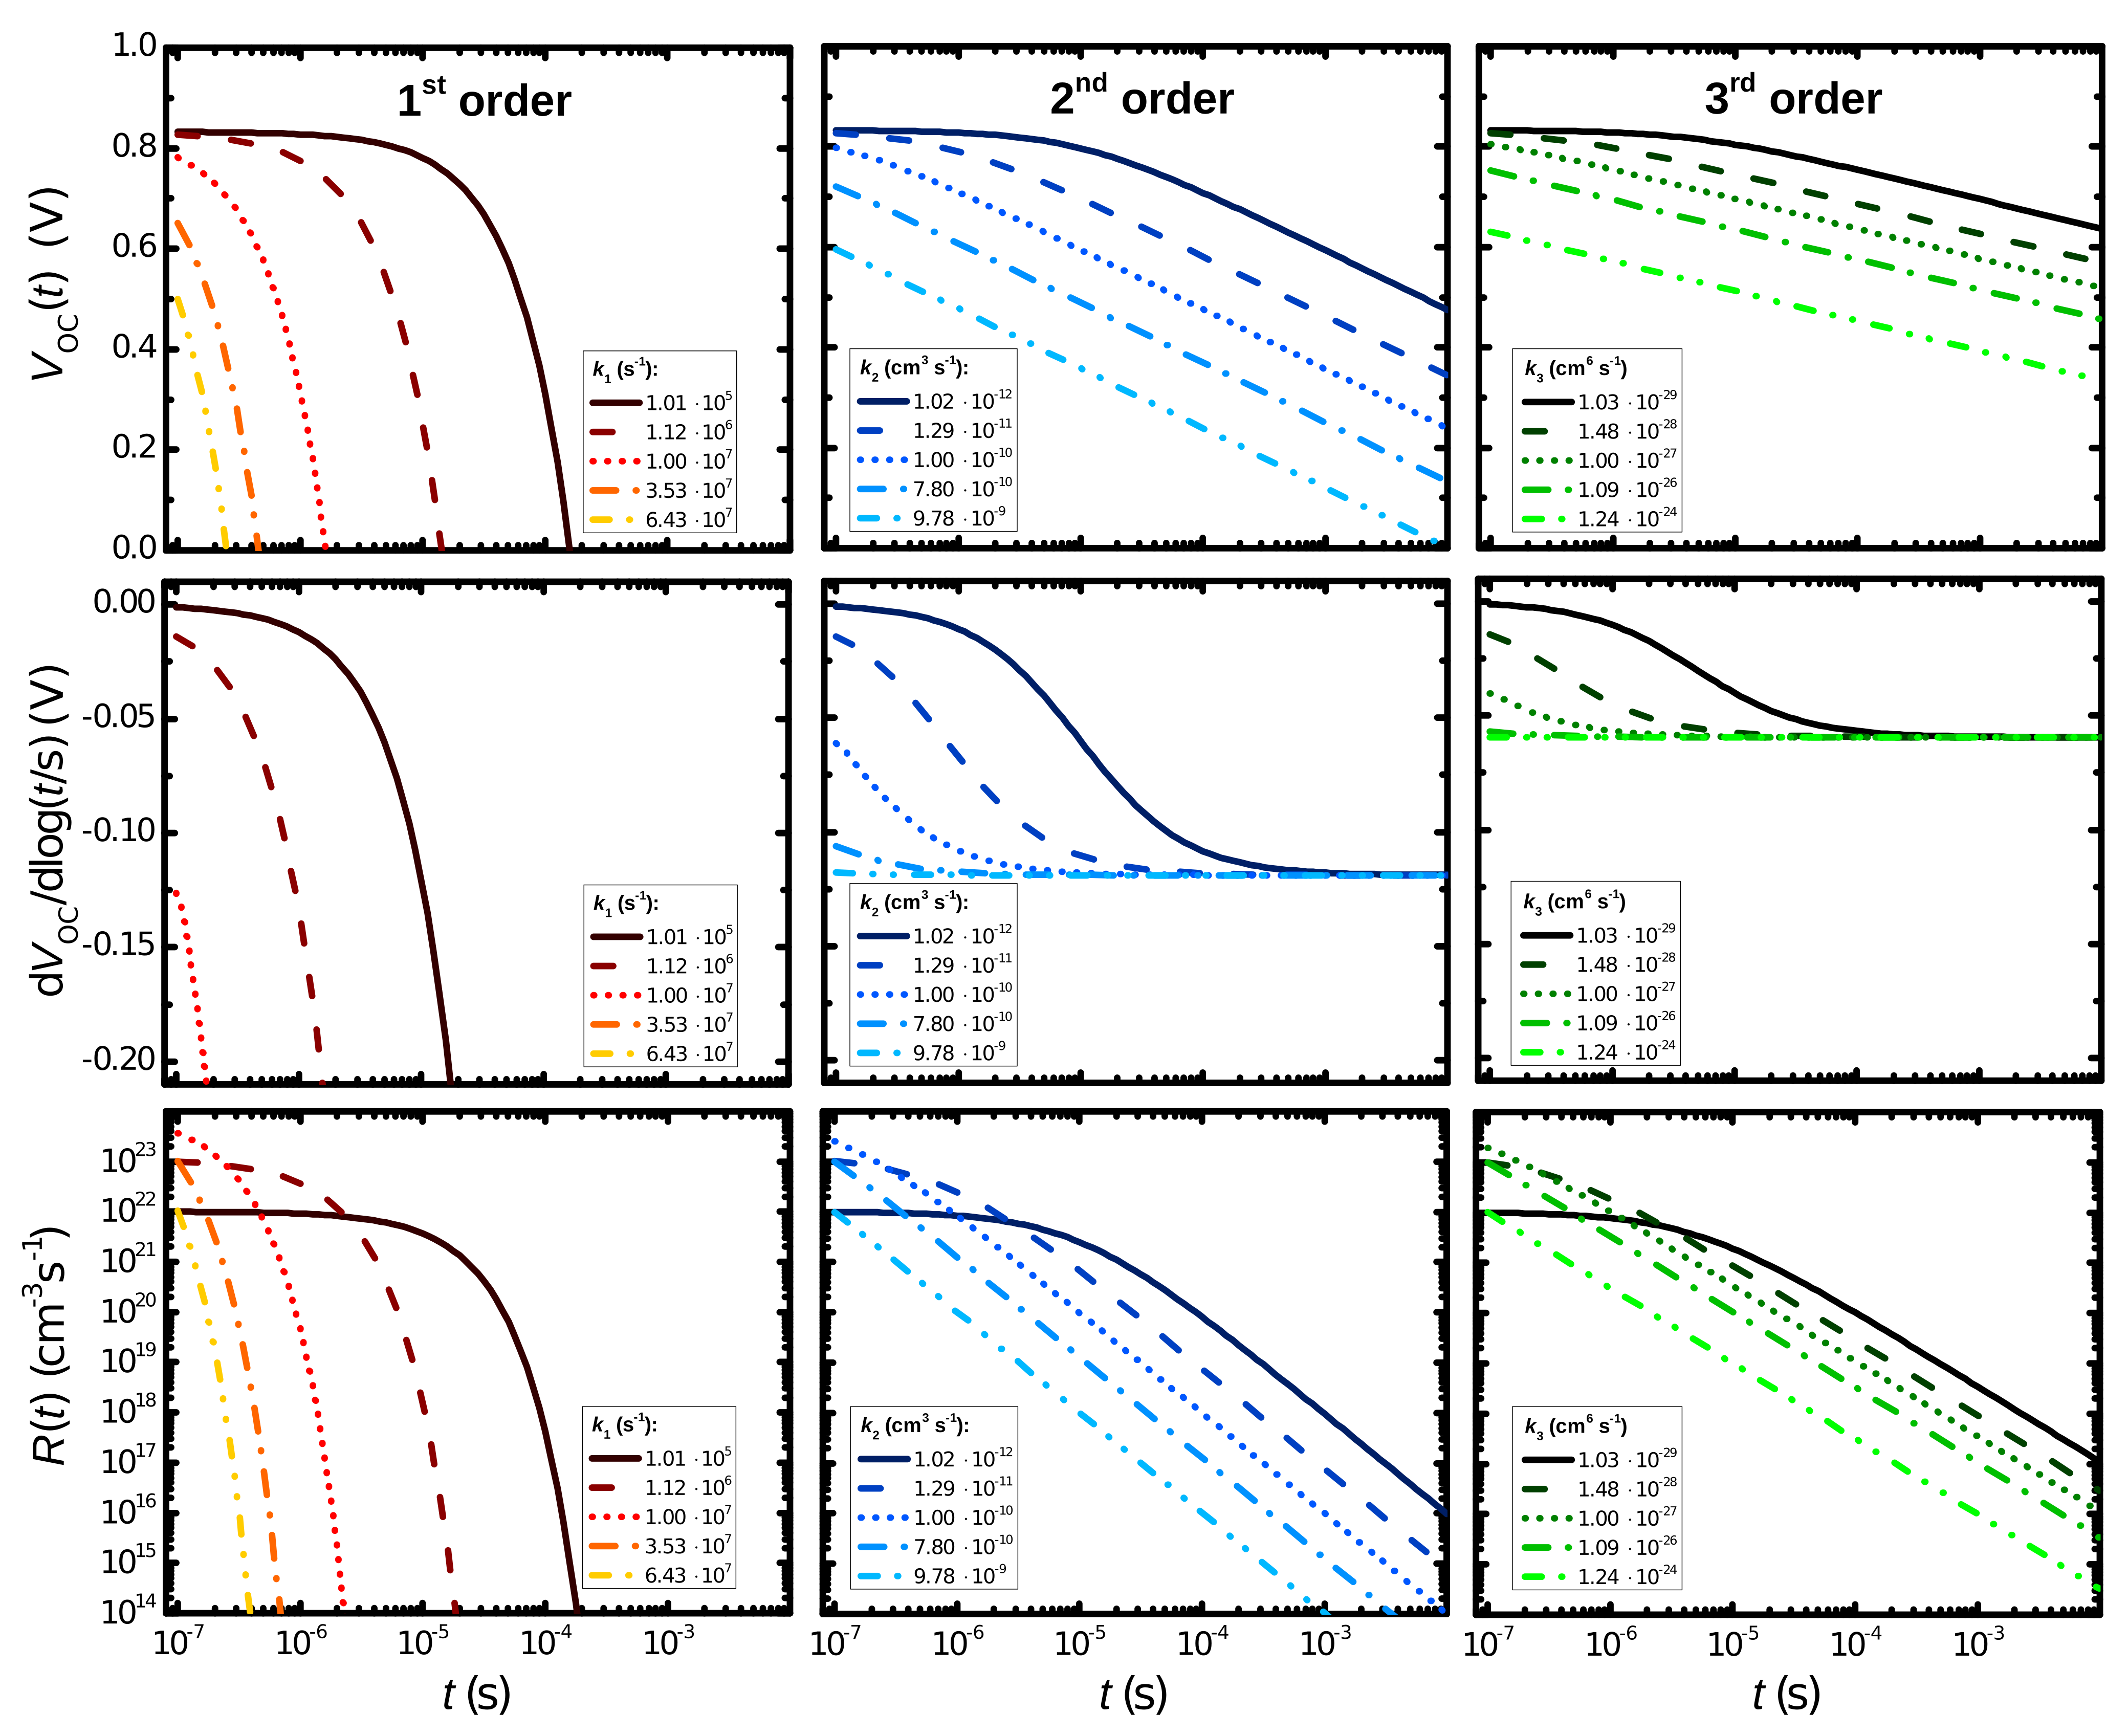
| Symbol | k1 () | R0 () | k2 () | R0 () | k3 () | R0 () |
|---|---|---|---|---|---|---|
 | 1.0 × 10⁵ | 1.0 × 10²² | 1.0 × 10⁻¹² | 1.0 × 10²² | 1.0 × 10⁻²⁹ | 1.0 × 10²² |
 | 1.1 × 10⁶ | 1.0 × 10²³ | 1.3 × 10⁻¹¹ | 1.0 × 10²³ | 1.5 × 10⁻²⁸ | 1.0 × 10⁻²³ |
 | 1.0 × 10⁷ | 3.7 × 10²³ | 1.0 × 10⁻¹⁰ | 2.5 × 10²³ | 1.0 × 10⁻²⁷ | 1.9 × 10⁻²³ |
 | 3.5 × 10⁷ | 1.0 × 10²³ | 7.8 × 10⁻¹⁰ | 1.0 × 10²³ | 1.1 × 10⁻²⁶ | 1.9 × 10⁻²³ |
 | 6.4 × 10⁷ | 1.0 × 10²² | 9.8 × 10⁻⁹ | 1.0 × 10²² | 1.2 × 10⁻²⁴ | 1.0 × 10⁻²² |
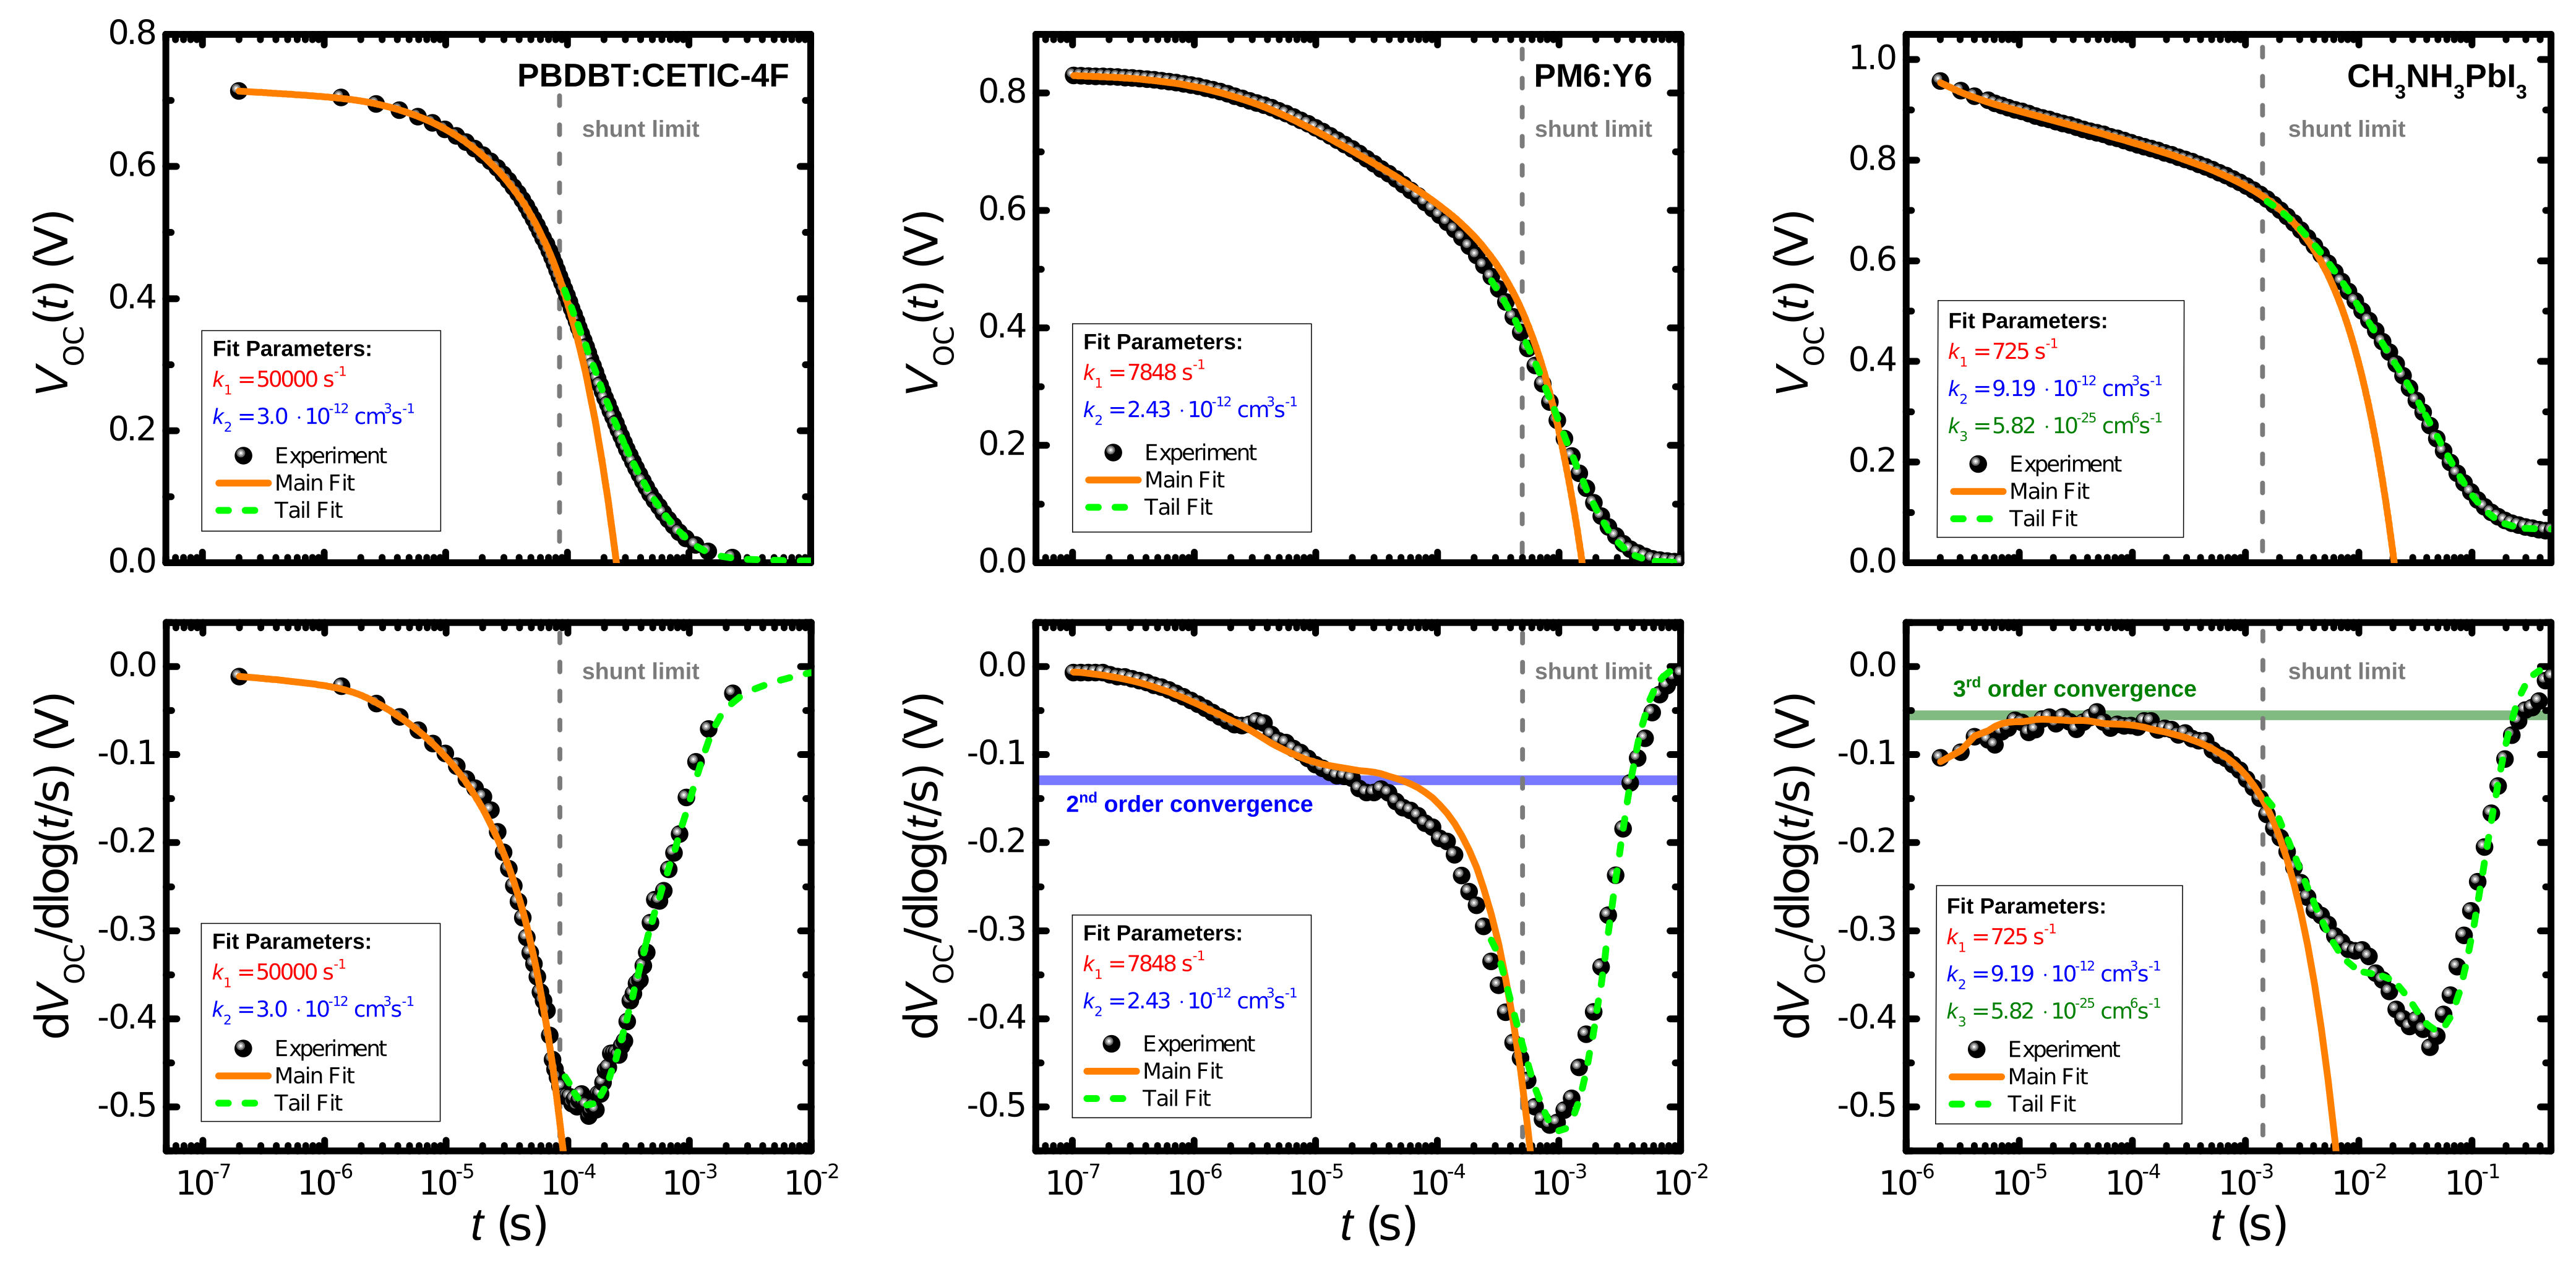
| Variable | Device: | PBDBT:CETIC-4F | PM6:Y6 | CH3NH3PbI3 |
|---|---|---|---|---|
| JSC | (mA·cm−2) | 15.6 | 25.2 | 8.7 |
| VOC | (V) | 0.71 | 0.83 | 0.96 |
| FF | - | 0.54 | 0.74 | 0.69 |
| η | % | 5.96 | 15.35 | 5.7 |
| L | (nm) | 99.0 | 90.0 | 350 |
| A | (cm2) | 0.22 | 0.22 | 0.16 |
| Cg | (nF) | 6.0 | 5.6 | 6.8 |
| ϵr | - | 3.05 | 2.58 | 38 |
| Rsh | (Ω · cm2) | 2.2 × 10⁴ | 5.0 × 10⁵ | 6.0 × 10⁶ |
| tsh | (s) | 9.0 × 10⁻⁵ | 2.5 × 10⁻⁴ | 1.5 × 10⁻³ |
| τRC | (s) | 6.0 × 10⁻⁴ | 1.3 × 10⁻² | 2.6 × 10⁻¹ |
| τ0 | (s) | 3.0 × 10⁻⁶ | 1.4 × 10⁻⁶ | 1.0 × 10⁻⁶ |
| n0,OCVD | (cm−3) | 3.1 × 10¹⁶ | 2.5 × 10¹⁶ | 1.5 × 10¹⁵ |
| n0,IS | (cm−3) | 3.8 × 10¹⁶ | 2.6 × 10¹⁷ | - |
| ni,OCVD | (cm−3) | 3.1 × 10¹⁰ | 2.6 × 10⁹ | 8.3 × 10⁶ |
| ni,IS | (cm−3) | 3.8 × 10¹⁰ | 2.1 × 10¹⁰ | - |
| k1 | (s−1) | 5.0 × 10⁴ | 7.9 × 10³ | 7.3 × 10² |
| k2 | (cm3 s−1) | 3.0 × 10⁻¹² | 2.4 × 10⁻¹² | 9.2 × 10⁻¹² |
| k3 | (cm6 s−1) | - | - | 5.8 × 10⁻²⁵ |
| τ1 | (s) | 4.6 × 10⁻⁴ | 1.0 × 10⁻³ | 5.7 × 10⁻³ |
| τ2 | (s) | 1.2 × 10⁻⁴ | - | 5.1 × 10⁻² |
| A1 | (V) | 2.7 × 10⁻¹ | 6.3 × 10⁻¹ | 2.3 × 10⁻¹ |
| A2 | (V) | 4.3 × 10⁻¹ | - | 6.5 × 10⁻³ |
| y0 | (V) | 2.3 × 10⁻³ | 1.0 × 10⁻³ | 6.7 × 10⁻² |
Publisher’s Note: MDPI stays neutral with regard to jurisdictional claims in published maps and institutional affiliations. |
© 2021 by the authors. Licensee MDPI, Basel, Switzerland. This article is an open access article distributed under the terms and conditions of the Creative Commons Attribution (CC BY) license (https://creativecommons.org/licenses/by/4.0/).
Share and Cite
Vollbrecht, J.; Brus, V.V. Effects of Recombination Order on Open-Circuit Voltage Decay Measurements of Organic and Perovskite Solar Cells. Energies 2021, 14, 4800. https://doi.org/10.3390/en14164800
Vollbrecht J, Brus VV. Effects of Recombination Order on Open-Circuit Voltage Decay Measurements of Organic and Perovskite Solar Cells. Energies. 2021; 14(16):4800. https://doi.org/10.3390/en14164800
Chicago/Turabian StyleVollbrecht, Joachim, and Viktor V. Brus. 2021. "Effects of Recombination Order on Open-Circuit Voltage Decay Measurements of Organic and Perovskite Solar Cells" Energies 14, no. 16: 4800. https://doi.org/10.3390/en14164800
APA StyleVollbrecht, J., & Brus, V. V. (2021). Effects of Recombination Order on Open-Circuit Voltage Decay Measurements of Organic and Perovskite Solar Cells. Energies, 14(16), 4800. https://doi.org/10.3390/en14164800