Article

Assessment on the Application of Facilitated Transport Membranes in Cement Plants for CO2 Capture

by
Maria-Chiara Ferrari
1,*,
Antonio Amelio
1,
Giuseppe Marino Nardelli
2 and
Riccardo Costi
2
1
School of Engineering, Institute for Materials and Processes, The University of Edinburgh, The King’s Buildings, Edinburgh EH9 3FB, UK
2
Colacem S.p.A., Via della Vittorina n. 60, 06024 Gubbio, Italy
*
Author to whom correspondence should be addressed.
Energies 2021, 14(16), 4772; https://doi.org/10.3390/en14164772
Submission received: 12 June 2021 / Revised: 9 July 2021 / Accepted: 16 July 2021 / Published: 5 August 2021
(This article belongs to the Special Issue Environmental and Energetic Valorization of Renewable Resources)

Abstract

:
Carbon dioxide capture from cement plant flue gas can play an important role in mitigating CO2 emission that lead to climate change. Among all the technologies evaluated, membranes have potential to be one of the most energy-efficient and low-cost CO2 capture option. In this work, a novel membrane technology, Facilitated Transport Membranes (FTMs), is assessed to further reduce energy demand and cost for CO2 capture in a cement plant. A new process that employs FTMs is simulated and applied to a real clinker production plant in Italy (Colacem, Gubbio). The process is then compared with other carbon capture technologies. Results show that the FTM technology can be competitive with other technologies despite the need of steam to operate the membrane. Despite the benefit in terms of specific emission compared to more established absorption with liquid amines process, further improvements on membrane performances are needed to gain also an economic advantage for carbon capture in the cement industry.

1. Introduction

Decarbonisation of industrial processes is a key step towards reach the net zero goals that are targeted from countries worldwide. Carbon Capture and Storage (CCS) applied to industrial plants has gained visibility in recent years with the recognition that switching to alternative low carbon processes is more challenging than in the power sector. In particular, cement industries has devoted large resources to research CCS solutions specific to cement plants in an effort to maintain the industry sustainable from both the environmental and the economic point of view. Cement production is responsible for around 7% of global CO2 emissions and the demand for cement is projected to increase by 12–23% above the 2014 level by 2050 sustained by a strong growth in Asian countries that will compensate the decline of the sector in China [1,2]. Measures that have been proposed to reduce the CO2 footprint of the industry include exploiting efficiency improvements, switching to less carbon intensive fuels, reducing the clinker to cement ratio, decarbonizing the electricity used by the plant and carbon capture and storage [3,4]. Among these, CCS has the highest potential for CO2 emission reduction [1] and is required to achieve the target of the Paris agreement of less than 2 °C increase in global temperatures [4]. Despite several studies and the technical viability of mitigation technologies proposed, few cement plants globally have started implementing these solutions [5].
The CO2 emissions from a cement plant can be divided in two categories: the first one comes from the fuel burned to provide heat to the process and could in theory be avoided by switching to a different form of energy [6]. This contribution typically amounts to 34% of the emission of a typical plant and in the case of the plant object of this study, it increases to 38% due to a lower proportion of renewable energy employed. The remaining emissions are inherently related to the clinker production, come from the reaction of calcium carbonate to calcium oxide and cannot be eliminated from the process. This part typically amounts to 66% of the emission of a typical plant and requires the application of carbon capture to be reduced [4].
In recent years, several research projects have explored CCS in the cement industry and solutions for both retrofit of existing plants or implementation in new building have been investigated extensively [7,8,9]. Several separation processes are proposed with a wide range of results in terms of techno-economic performance as, for example, absorption with liquid solvents absorption [7,10,11,12,13], solid adsorbents [14], calcium looping [7,8,15,16] and molten carbonate fuel cells [17].
Membranes have also been evaluated for carbon capture in cement plants. Lindqvist et al. compared different process designs and various membranes, including facilitated transport ones, and reported a cost of CO2 avoidance between 33 and 50 €/ton of CO2 [18]. Recently the Horizon2020 funded project CEMCAP evaluated different separation technologies for a cement plant retrofit. Among these, simple solution-diffusion membranes coupled with a liquefaction process (Membrane Assisted Liquefaction) were included with a cost of CO2 avoidance of 83.5 €/ton of CO2 compared to the 80.2 €/ton of CO2 for state-of-the-art absorption process [19,20]. Polymeric membranes were also evaluated by Baker et al. with the very positive prospective of a cost of capture of 40 $/ton of CO2, even if, as they mention, the economic estimation might be optimistic [21]. Recently Nanoporous Single Layer Graphene (NSLG) membranes were also evaluated for post-combustion including cement plants. These innovative high performance materials would introduce a capture penalty of 28 $/ton of CO2 even taking into account their very high cost compared to polymeric materials [22].
The lifetime of a cement plant is around 25 years and even with the steady demand of clinker currently foreseen, not many new plants will be built in Europe in the near future; therefore the efforts have been focusing on retrofitting existing plants where not only energy and economic considerations come into play but also layout, space and other factors come into play. This makes the retrofit of existing plants very dependent on the particular site and therefore this study focussed on a specific plant in Italy.
In this study a novel type of membranes is considered for the separation process. These are based on the facilitated transport mechanism that exploits the reaction of CO2 with carrier sites in the membrane and therefore enhances selectivity compared to conventional membranes. A first generation of these materials was already tested in a cement plant in Norway by prof. Hagg et al. [23] with promising results and a prediction of a significant reduction in the cost of capture if improved CO2 permeance was achieved. The new materials evaluated in this study were produced in the framework of the Horizon2020 funded project NANOMEMC2 and evaluated for a specific site in Gubbio, Italy where the materials were also tested experimentally [24,25].

2. Methodology

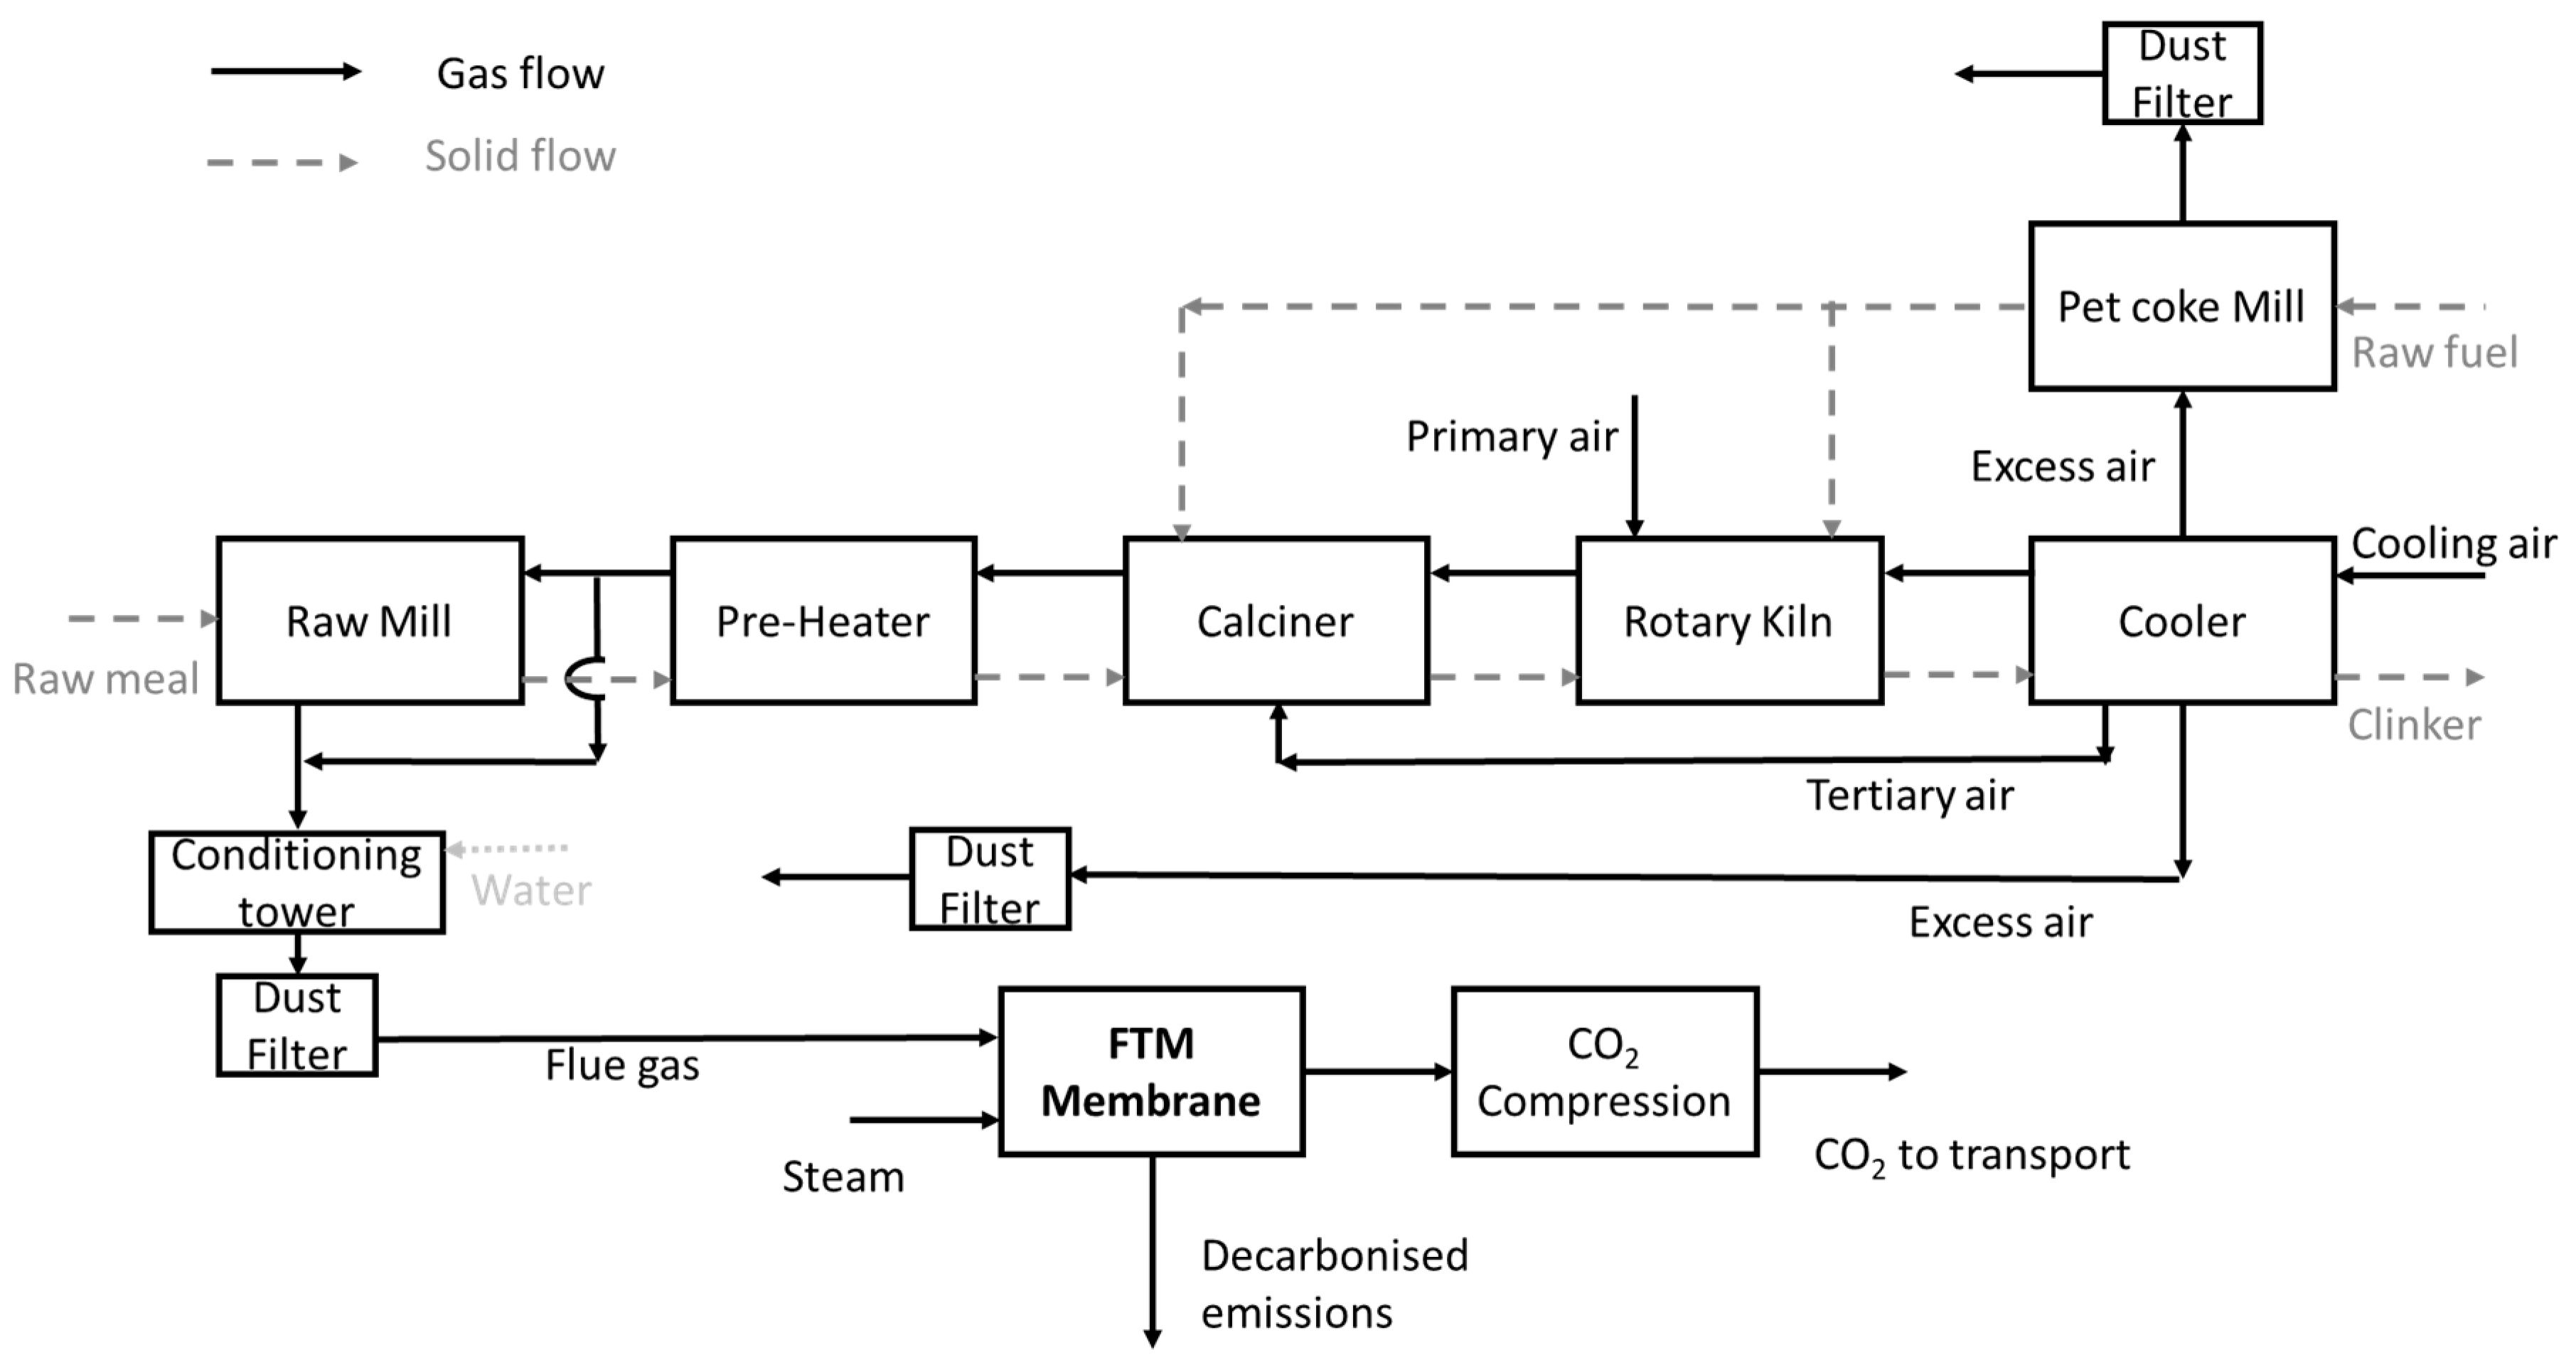
2.1. Process Description

The cement plant case studied is based on the Colacem cement plant in Gubbio (PG), Italy that employs the typical dry kiln process [26] and is designed to produce 1 Mton/year of clinker. The raw material enters the raw mill (R/M) where it is grinded and dried with hot flue gas. The gas and solid are separated in a dust filter (F/D) and the raw meal after storage and homogenization into a silo is extracted and sent to the preheater (PHE). The cyclone preheater operates with counter current streams of gas and solids. Five stages are arranged one above the other and the hot gases coming from the calciner and the rotary kiln are mixed with the solid to allow heat transfer and then separated due to centrifugal forces. The preheated raw meal is then sent to the calciner where 90% of the calcination reaction (decomposition of calcium carbonate to calcium oxide) is performed using around 60% of the total plant fuel. The calcination is completed in the rotary kiln where the clinker phase is also formed. The kiln is the core of the burning process with the solid reaching up to 1450 °C. After the formation of the clinker phase, the material is discharged from the kiln to a grate cooler (Cooler) that operates as a cross flow heat exchanger producing secondary combustion air and tertiary air that are sent to the kiln and to the calciner respectively. In the real plant, the excess air from the cooler is mixed with the gas from the raw mill and preheaters then sent to the conditioning tower and then to a dust filter before being released to atmosphere. The concentration of CO2 in this stream is around 11% vol. The block flow diagram of the real plant is reported in Appendix A.
For a pure retrofit configuration, with no modification of the production plant, the capture process would be applied to this stream. In order to favor the separation and maximize the CO2 concentration in the stream going to the capture section, in this work a modified process is considered: the excess air from the cooler is not mixed with the gas stream coming from preheaters and raw mill but it is treated separately; the membrane capture process is applied to the flue gas coming from the conditioning tower and dust filter treating the gas after the preheaters without gas from the cooler.
The molar CO2 content in this stream is around 28% and this makes the application of membranes quite attractive as the driving force for the transport through the membrane is related to the partial pressure. CO2 captured is compressed and liquefied to be sent for storage. A block flow diagram of the full process with the addition of the carbon capture plant is reported in Figure 1 while the technical data of the plant for the reference year 2016 are summarized in Table 1. The simulated plant produced results within 3% of the real plant.

2.2. Facilitated Transport Membranes

Facilitated transport membranes (FTMs) work on a different principle compared to conventional membranes. Current state-of-the-art materials are based on the solution-diffusion transport mechanism where the different species dissolve in the material, diffuse through and then desorb on the other side. In FTM, the transport is enhanced by a reactive mechanism: carbon dioxide reacts with groups inside the membrane to form complexes and therefore its transport is facilitated compared to non-reacting species leading to enhanced selectivity [27]. In the case of CO2, amine groups are usually exploited for this kind of mechanism. An important feature of these materials is that the mechanism is activated in presence of water and therefore a minimum value of Relative Humidity (RH) is necessary in the streams to be treated to ensure the improved selectivity. The complex that acts in the reaction mechanism can be mobile or fixed; in this study fixed carrier membranes based on PVAm (polyvinyl amine) are employed as developed in the NANOMEMC2 project [28]. The properties of the membranes chosen for the simulation are based on the results of the project and are reported in Table 2 [29]; an effective permeability approach is used for each component to lower the complexity of the simulation. Following reports in the literature [30], the minimum amount of water required to activate the facilitated transport is set to 60% RH and this is crucial for the development of the process flowsheet. The performance selected are similar to materials reported by other research groups that have already reached pilot scale [31]. FTMs have already been demonstrated in flue gas from cement plants with good stability over time even in the presence of impurities [23,24,25].
A single stage configuration is considered for the separation as shown in Figure 2. In order to meet the additional humidity constrain introduced by the facilitated transport membranes, a steam sweep stream is used on the permeate side; steam can also added on the feed side to maintain the humidity along the module. The presence of the sweep further improves the driving of the process lowering the partial pressure of the permeating components. Different steam grade can be used for this purpose and the temperature can be optimized in terms of separation efficiency. Another factor to consider in the choice of the steam temperature is the origin of the steam: three scenarios can be envisaged, one where steam is produced onsite using a natural gas boiler, one where the steam is imported from outside the plant and finally one where the steam is raised internally from waste heat and therefore the availability of suitable waste heat available needs also to be ensured.
After the membrane section, the concentrated CO2 is compressed to 110 bara. The compression train is also optimised in order to improve the separation obtained in the membrane module and reach the final 95% purity required for transport and storage.

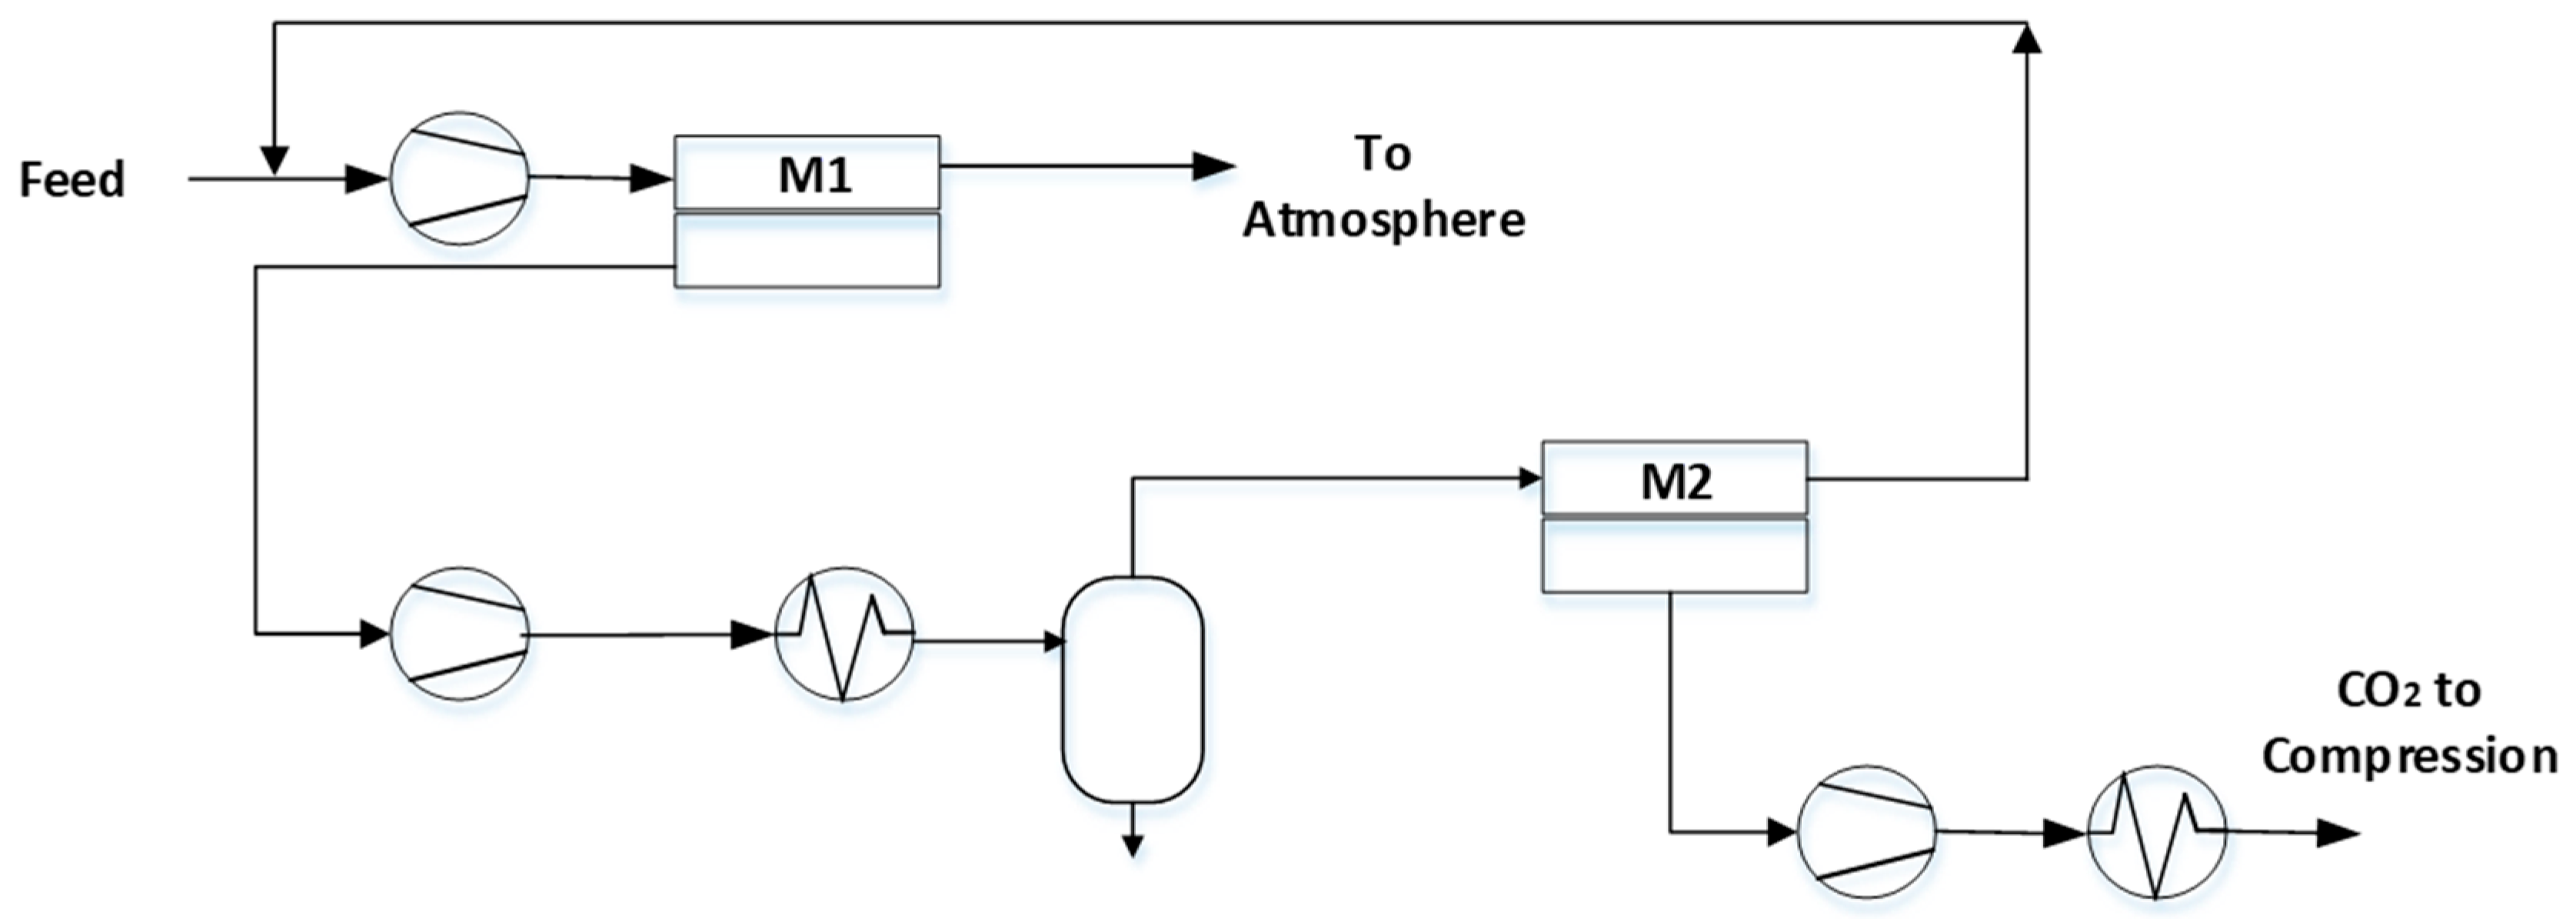
2.3. Solution Diffusion Membranes

A process based on solution diffusion membranes (S/D) was also simulated in order to compare the novel technologies to more established options. For S/D membranes, no water is required for the permeation to take place and therefore no steam sweep is needed. Also in this case the carbon capture process is a pure retrofit to the clinker production plant and is applied to the same flue gas stream. The process was designed using the membrane materials performance reported by Baker et al. [21] that can be found in Table 2; due to the low selectivity intrinsic to the solution diffusion membranes compared to FTMs, a two stages process with the recycle of the retentate from the second module was required to reach the 90% capture and 95% purity targets simultaneously. The process BFD is reported in Figure 3.
Even in this case, the concentrated CO2 after the membrane process is compressed to 110 bara.

2.4. Process Simulation and Membrane Module

In this work, the aforementioned process is simulated using the commercial engineering tool Honeywell Unisim Design® R400. Model simulation includes all the key unit operations and all key reactions that are taking place in the process of cement production. To be able to compare our results with published data, the main process assumption were extracted from the work published by the CEMCAP project [19]. The membrane modules are simulated using an in-house detailed membrane module simulator implemented in UniSim Design®, with the membrane unit as completely automated customised unit operations. The model simulates a hollow fiber module and was used for both membrane technologies (FTMs and S/D) changing the parameters for the permeance and selectivity accordingly. The model was reported and validated previously [32]. The model allows the user to select the geometrical parameters for the module (i.e: number of fibers and dimensions) and also the direction of flow (i.e: co-current or counter-current) and takes into account pressure drops along the module. For all the simulations the counter-current configuration was used without a sweep for S/D membranes and with a steam sweep for the FTMs. In the case of FTMs, an additional constraint was added for the relative humidity: if the RH dropped below the 60%, the permeance for CO2 would automatically reduce to the solution/diffusion value of PVAm as the facilitated transport would not be activated.

2.5. Economic Analysis

The assessment of the economic performance of the proposed technology is key in order to evaluate its potential against other options and guide decision making. Therefore the method employed is crucial for a fair comparison [33,34].
In this work, the economic analysis of the plants simulated is based on the estimation of investment cost, fixed and variable operation and maintenance cost for all cases and their comparison. The assessment mainly follow the assumptions of the CEMCAP project [20] and was performed using the spreadsheet published by the project [35].
The lifetime of the plant is estimated as 25 years with a plant construction period of 3 years with annual allocation of construction cost as 40%, 30% and 30% in the 3 years. The project is evaluated through a discounted cash flow approach with a real discount rate of 8%. The costs are calculated pre-taxation and no CO2 emission taxation is considered. Development and land costs are not considered in the capital expenditures.
The total direct cost (TDC) of the cement plant with no carbon capture is directly estimated scaling to the actual production based on the IEAGHG report [36]. The TDC is then summed to the Indirect costs to estimate the Engineering, Procurement and Construction Costs (EPC). The Indirect cost are considered as 14% of the TDC. Owner’s Costs and Contingencies (15% of EPC) are then added to the EPC to obtain the Total Plant Cost (TPC).
A different approach is used or the carbon capture and compression of the plant since these are added the cement plant end-of-pipe with no modification to the clinker production section. A Bottom-Up Approach (BUA) is used and the Total Equipment Cost (TEC) is calculated from the sum of all Equipment Cost in the plant. Major Equipment items on the plant are listed and their cost is estimated using exponential costing method based on values extracted from the mass and energy balance. The Process contingencies are estimated as a percentage of the TDC based on the maturity of the technology, (i.e., 15% of TDC for amines, 35% of TDC for FTMs).
For the evaluation of the operating cost, the fixed and variable operating cost are considered. The fixed component includes insurance and local property taxes as 2% of the TPC; the maintenance cost is assumed as 2.5% of the TPC while the labour cost include 100 persons Electricity, fuels, raw materials, cooling water are included in Variable Operating Costs and the unit cost considered are reported in Table 3. The membranes are considered under the variable operating cost and are replaced every 3 years. This is to take into account the potential degradation of the material exposed to the impurities of the flue gas.
The key indicators considered to evaluate the plant performance are:
  • Specific Primary Energy Consumptions (SPECCA), which is calculated from the sum of the direct and indirect specific primary energy consumption (Q) and the equivalent specific CO2 emissions (E) of the case without carbon capture (BAU) and the capture cases (CP) using Equation (1):
S P E C C A ( MJ kg CO 2 ) = Q C P Q B A U E B A U E C P ;
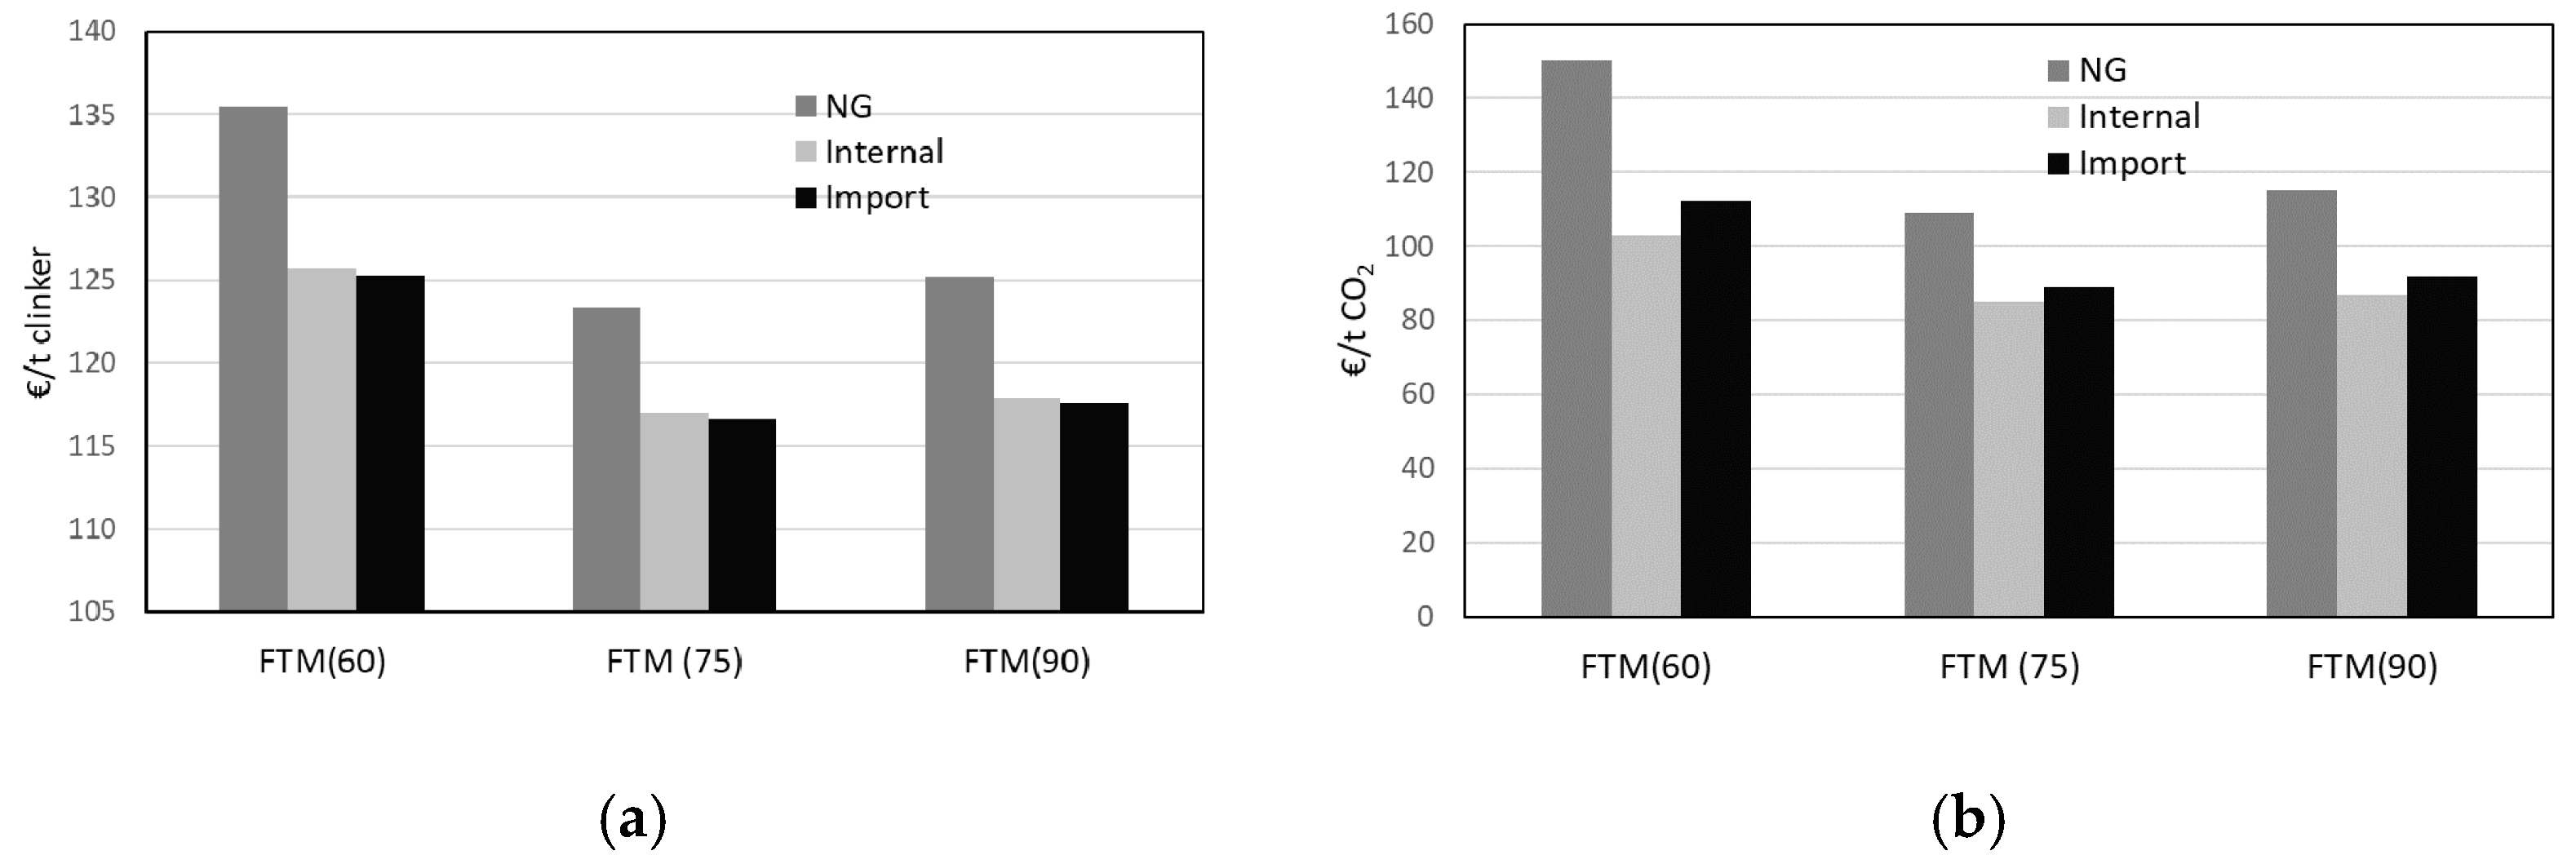
  • Cost of Clinker (COC), which is the sum of the contributions of annualized investment cost and of the operating costs referred to the amount of clinker produced;
  • CO2 avoidance cost, calculated from the cost of clinker and the specific CO2 emissions (E) of the case without carbon capture (BAU) and the capture cases (CP) using Equation (2):
C A C ( t CO 2 ) = C O C C P C O C B A U E B A U E C P .

3. Results and Discussion
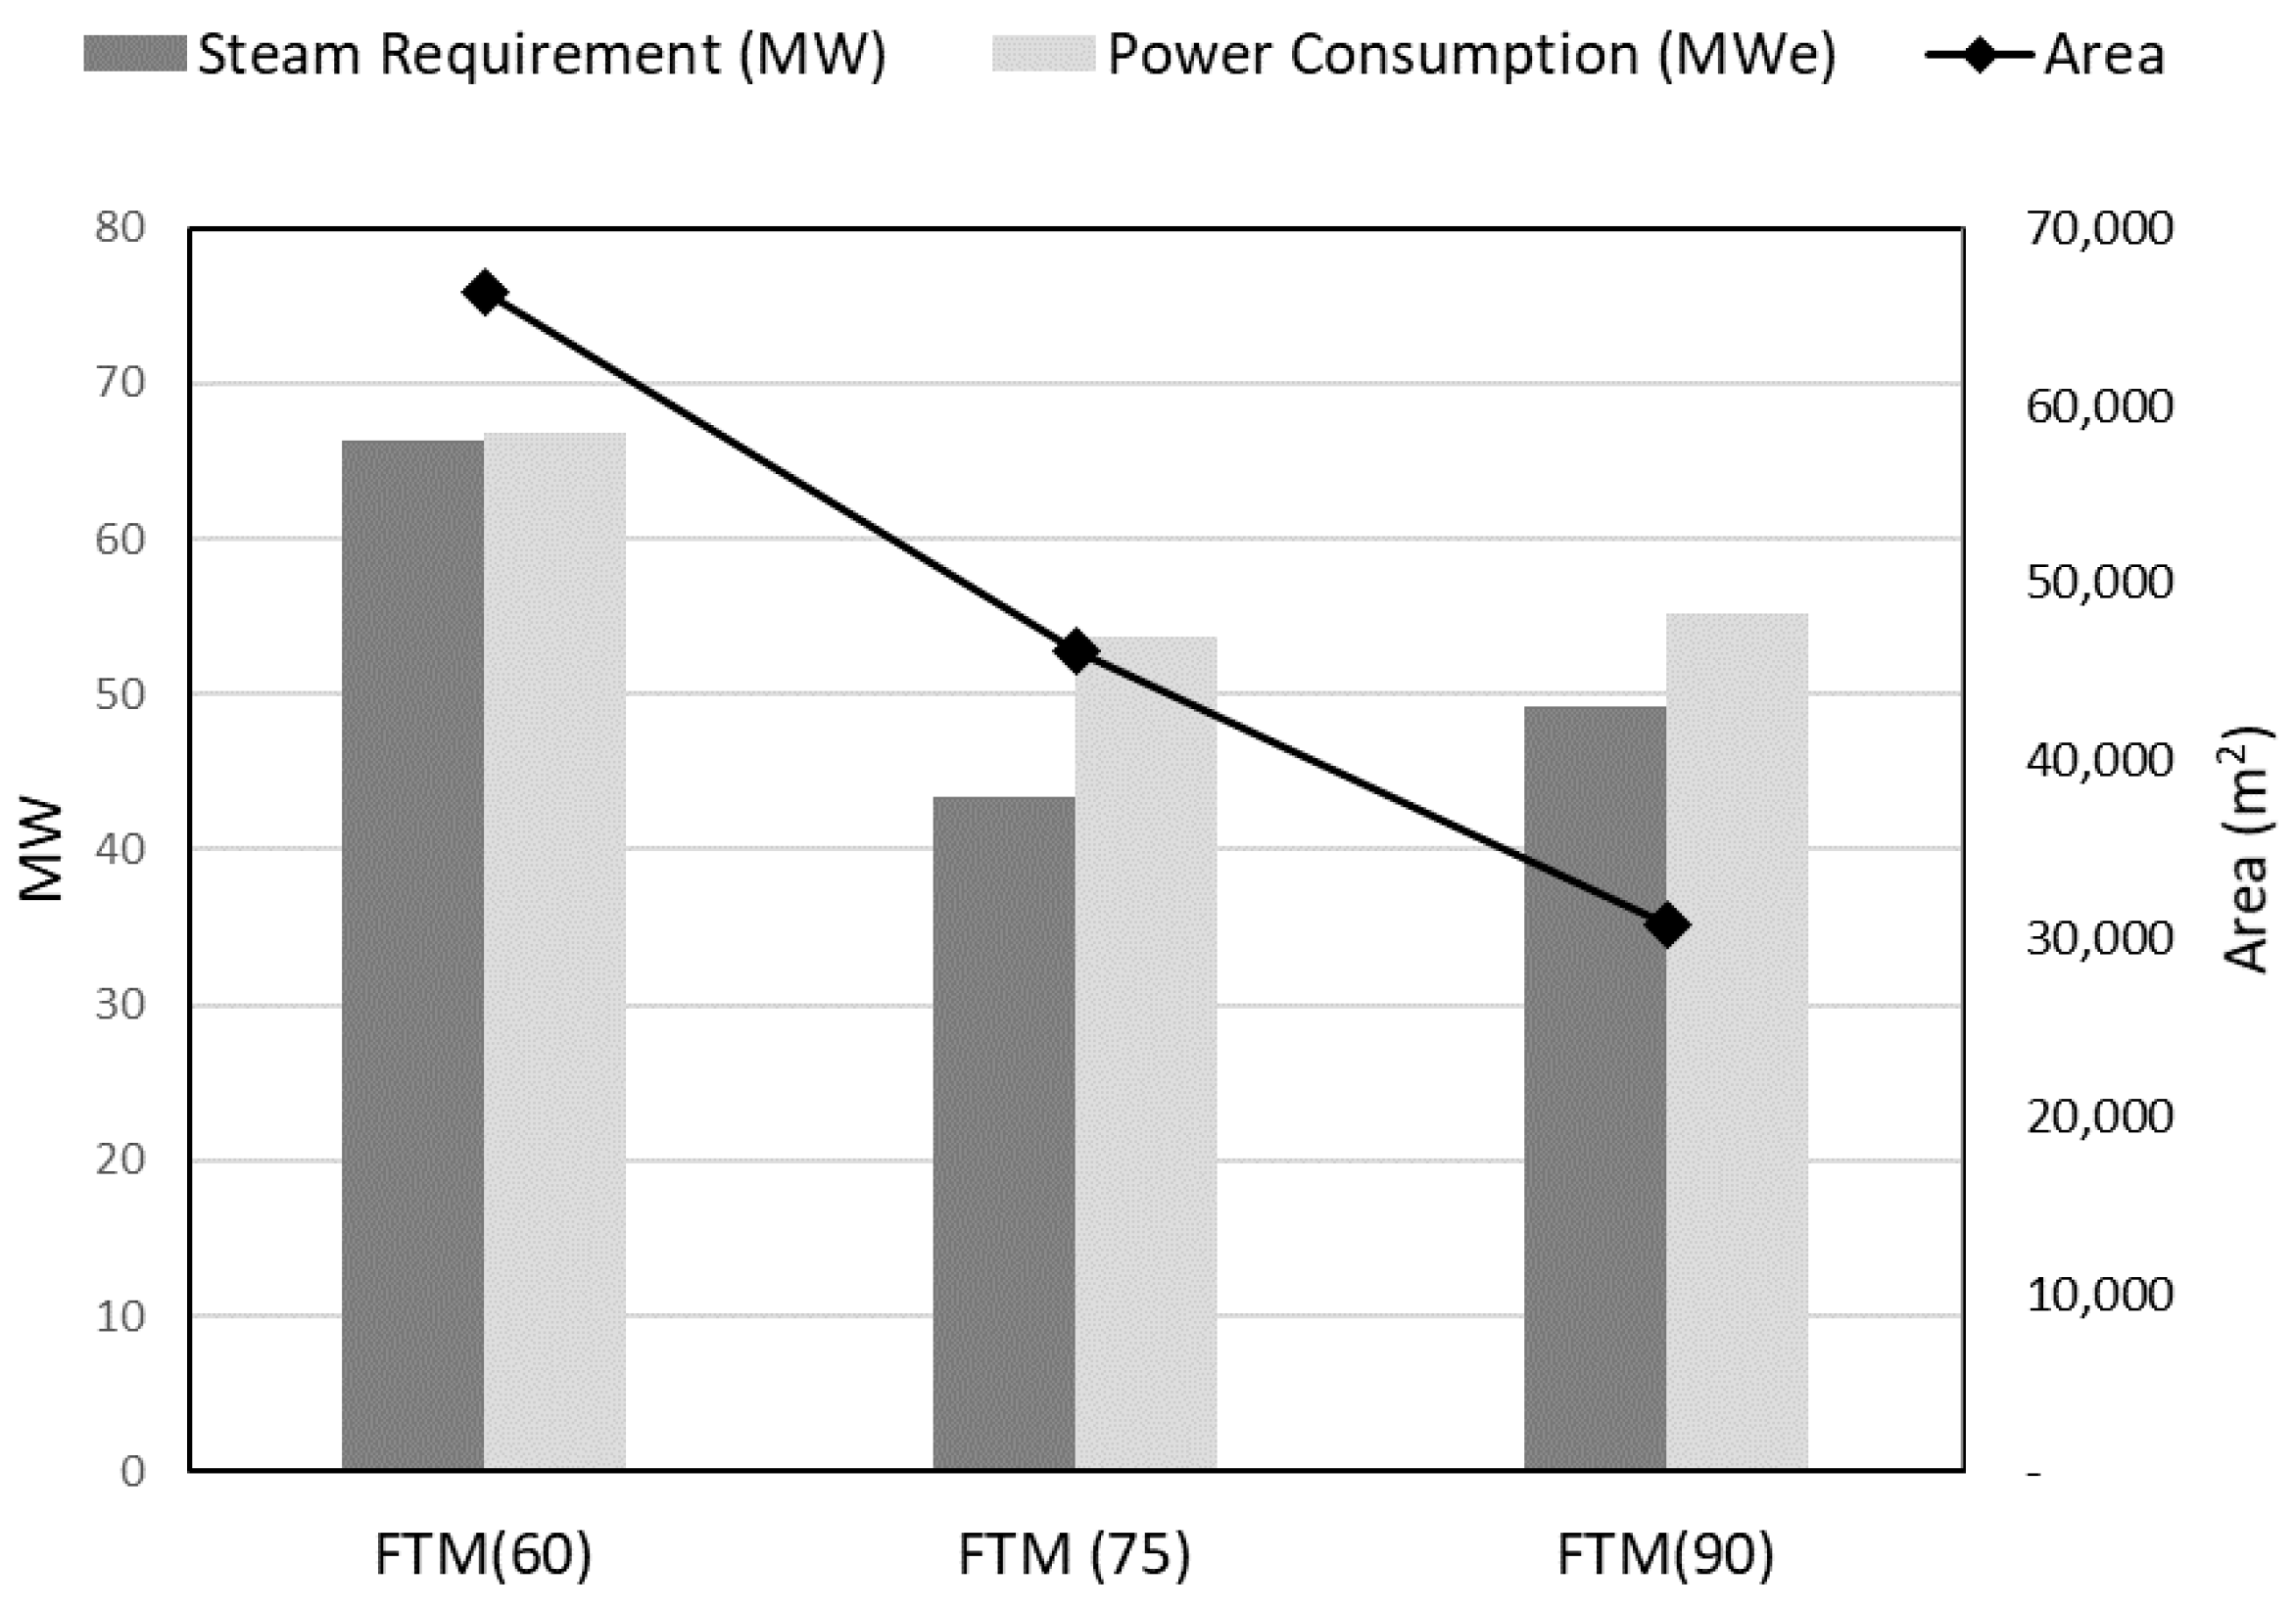
3.1. Steam Grade

Firstly, the quality of steam required for the sweep of the permeate side of the module was investigated in order to achieve the target of 90% capture at 95% purity of the final compressed CO2 stream. The streams table for the simulation of the optimised case at 75 °C can be found in Appendix B (Table A1).
Different levels of temperature and therefore pressure were investigated, in the range allowed by the membrane materials employed (Table 2). As shown in Figure 4, at lower temperature a larger membrane area is required to achieve the separation together with a very high amount of steam. Operating at low pressure would increase the driving force for the transport of all components while also introducing operational difficulties in maintaining vacuum in the lines. Regarding the energy required for the capture and compression plant, again the value is the highest at the lowest temperature while the total energy required is similar at 75 °C and 90 °C with a minimum in the steam flow rate at 75 °C.
From these results, it is already evident that using steam at the lowest temperature is not attractive due to the high area and high energy requirements but a full economic analysis is required in order to choose the most favorable configuration to be compared to different separation technologies. Table 4 reports the results for the three investigated temperatures considering steam imported from outside the plant together with the case with no carbon capture applied. The case at 75 °C is the most promising among the ones investigated with a CO2 avoidance cost of 89.11 €/ton CO2. The CAC is heavily dependent on the assumption behind the economic calculation and therefore it is hard to compare the values across publications. This explains the wide range of values presented in the literature and the difference between the calculation in this work and other reports as for example the one by Lindqvist et al. [18].
It must be noted that these calculations were performed considering the emission related to the production of electricity required by the membrane and compression section of the plant that is quite significant. The electricity was considered taken from an Italian energy mix (location of the site) with specific emissions 256.2 g CO2/kWhe [37]. Similar considerations can be applied to the steam that is a significant contributor to emissions; for this first analysis the steam was produced using an additional boiler with natural gas (224 g CO2/MWth) [38].

3.2. Steam Availability

A typical dry process cement plant has no requirement for steam for its operation and therefore no steam is directly available in the plant to be used as sweep in the membrane module. Three different scenarios can then been envisaged that can influence dramatically the economic analysis [34]: in the first one the steam is produced onsite using a natural gas boiler (NG); in the second one it is imported from outside the battery limits of the plant (Import) while in the third the steam is raised from waste heat around the plant (Internal). In reality the production plant is already highly integrated and therefore the best option to avoid affecting production is to use heat available in the capture plant. A new boiler and steam cycle in the plant are needed and therefore this option incurs in significant additional capital investment while reducing the operational costs. The cost were estimated using correlations found in literature [39]. In the case of NG or imported steam, the CO2 emission related to the production of steam were also included; considering that no power plant is located near the plant, the same value for emissions of steam produced from a natural gas boiler is considered (224 g CO2/MWth) [38].
The three scenarios were compared at the three different temperatures considered before (Figure 5). It can be seen that the NG option is not competitive while the other two cases appear close in terms of COC (116.69 €/ton clinker for the import case versus 116.96 €/ton clinker for the internal steam case). This is due to the fact that the higher OPEX contribution due to the imported is balanced by the higher CAPEX needed to raise steam internally. Looking at CAC for example case at 75 °C, we can see that the difference between the two cases is around 4% (89.11 €/ton CO2 for externally sourced steam versus 84.90 €/ton CO2 for the internally raised case) with an advantage for the internal case where there are no aadditional CO2 emissions related to the steam production. Considering the location of the plant in Gubbio, raising the steam internally would be more practical due to the lack of nearby providers of steam. For other location though, it might become more practical to import steam directly from nearby plants.

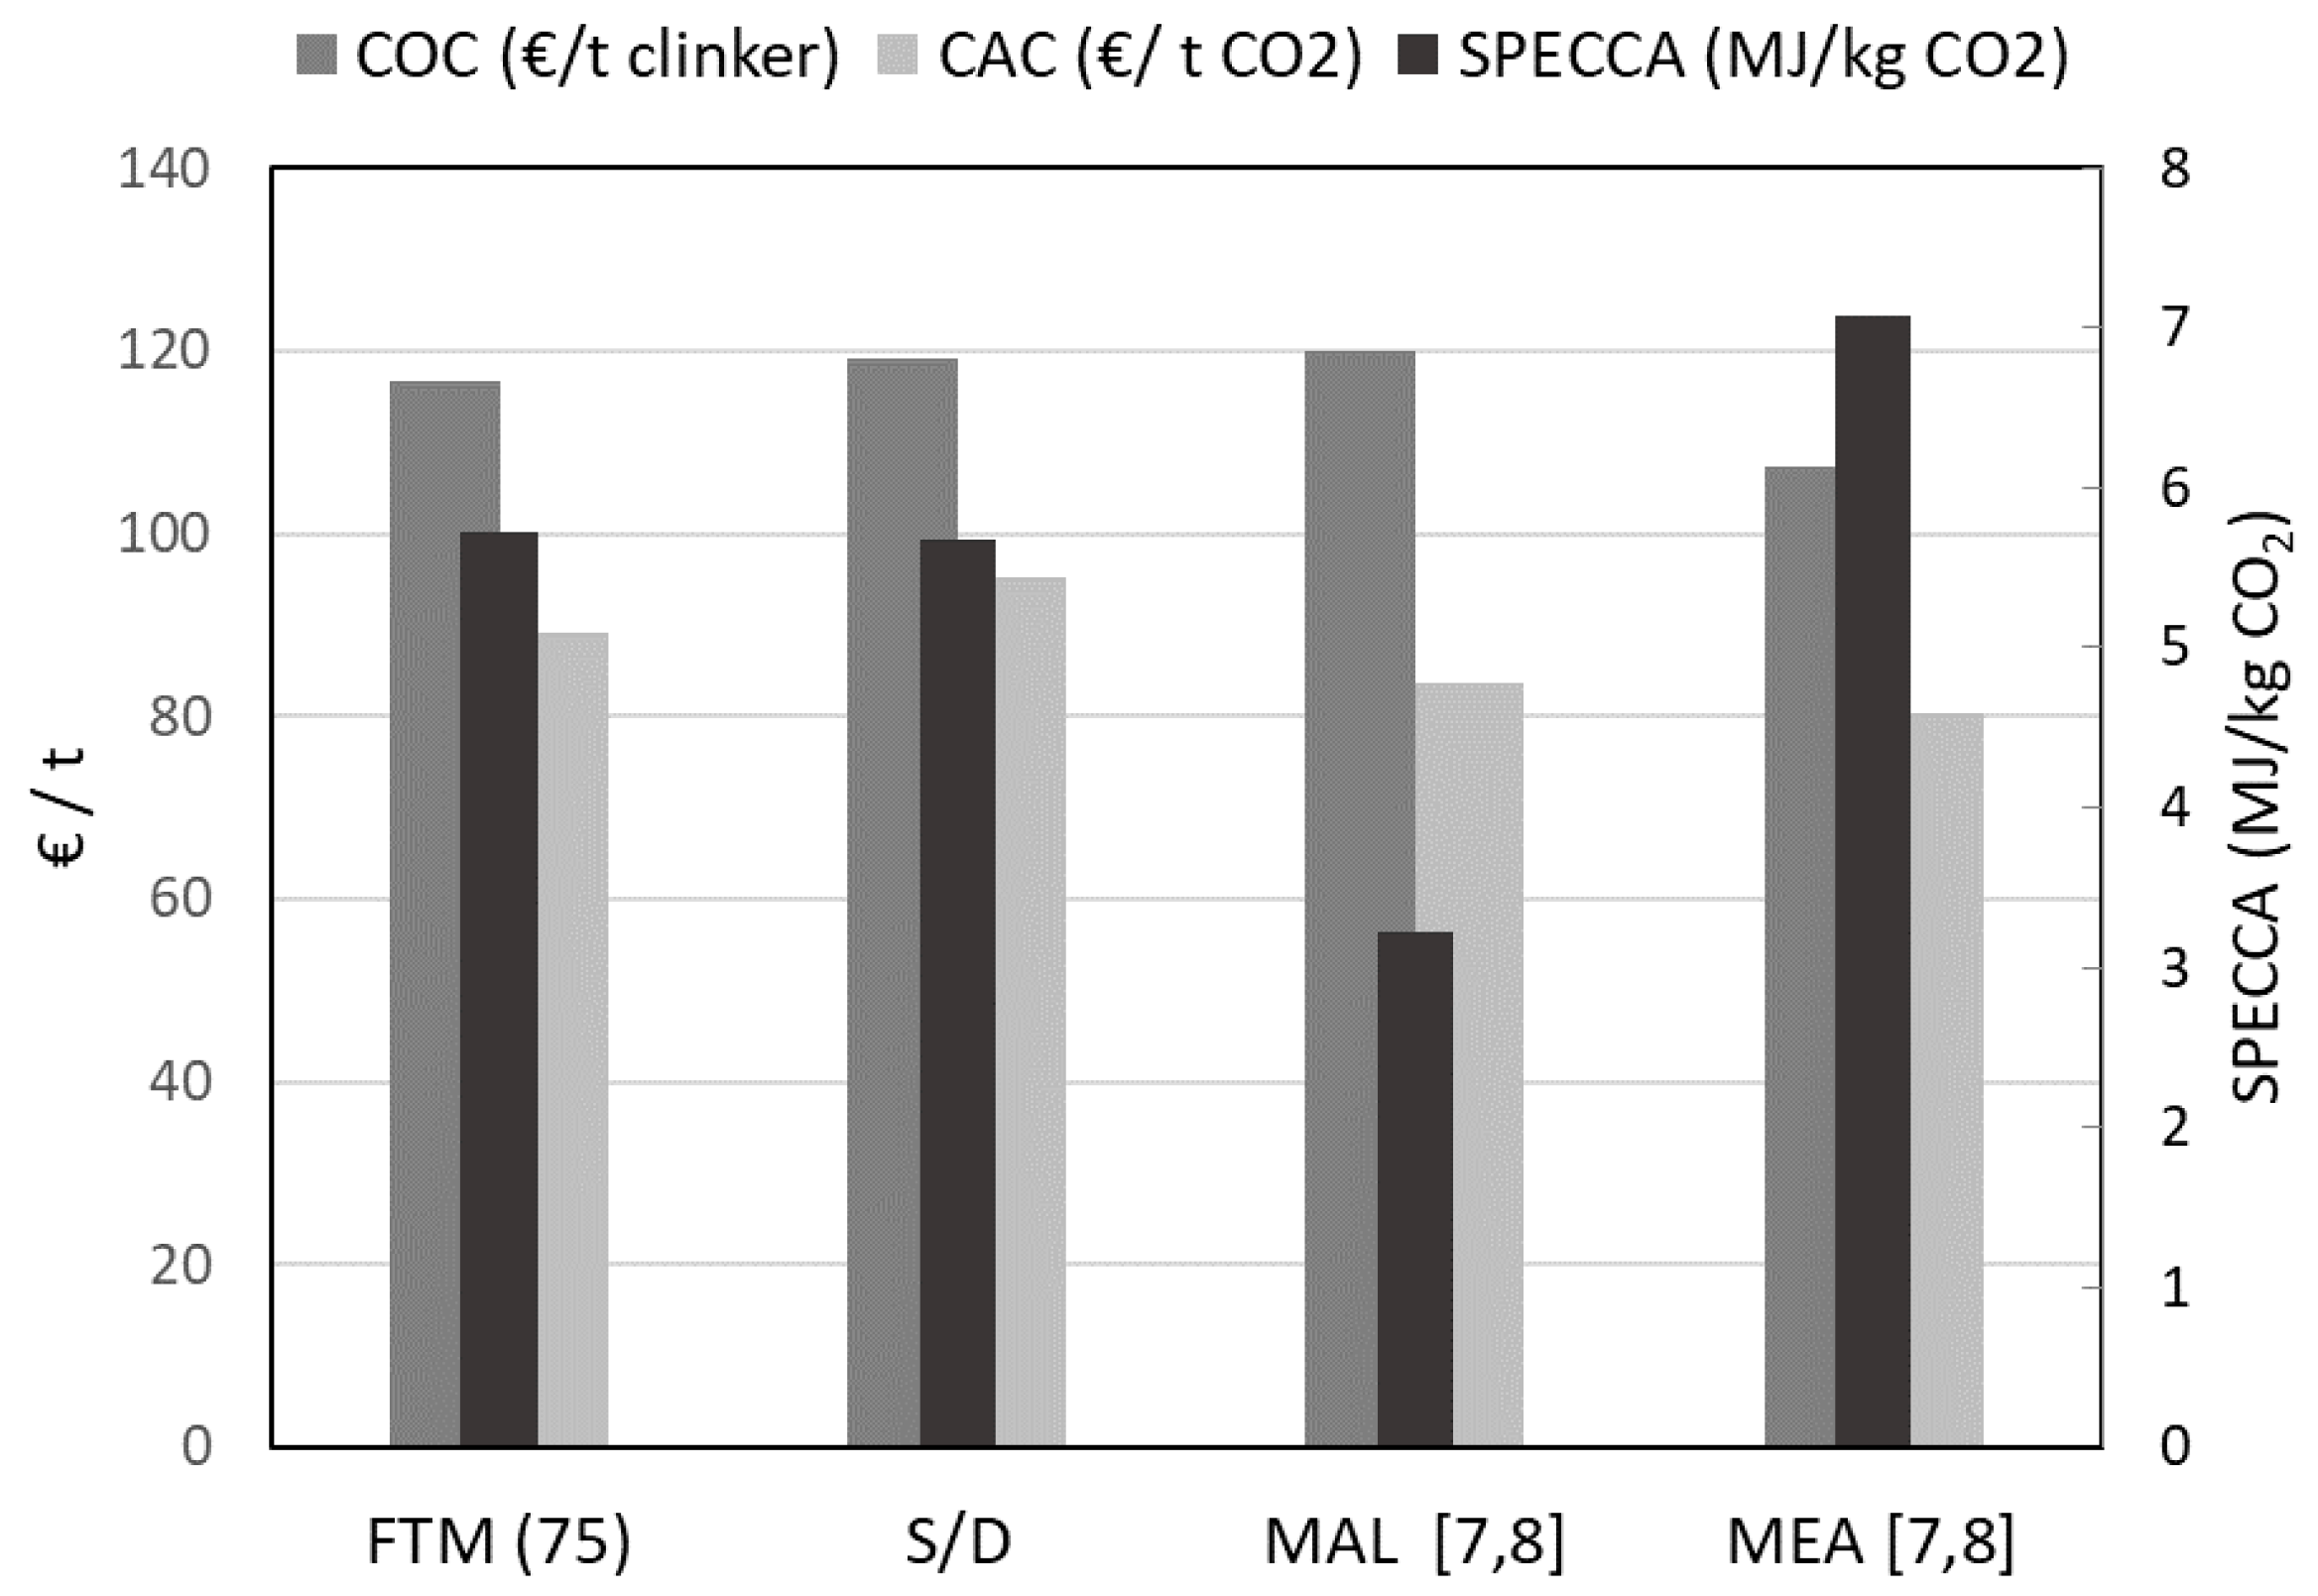
3.3. Comparison with Other Capture Technologies

Finally the potential of the optimized FTM process was evaluated in comparison with other separation technologies. A state-of-the-art absorption process based on Monoethyl amine (MEA) solvent and a Membrane Assisted Liquefaction (MAL) scheme were considered extracting data from the literature [19,20]. The economic analysis in this work is based on the same assumptions presented in the two references and therefore we can fairly compare the different technologies. Additionally a conventional solution diffusion membrane process based on materials reported by Baker et al. [21] was considered; due to the low selectivity intrinsic with the solution diffusion membranes compared to FTMs, a two stages process was required to reach the 90% capture and 95% purity targets simultaneously as presented in Section 2.3. The results can be found in Table 5.
The SPECCA for the different technologies has been calculated and is compared in Figure 6; it can be seen how FTM and S/D membranes have similar values (5.47 and 5.68 MJ/kg CO2) with a decrease of around 20% compared to MEA. MAL shows the lower SPECCA value at 3.22 MJ/kg CO2.
Looking more closely at the membrane cases simulated in this study for the specific plant in Gubbio, it can be seen that the increased selectivity of the FTM membranes allows to reduce the number of separation stages required from two to one compared to the conventional solution-diffusion membranes (S/D) and this allows to save significant capital and operational costs. This advantage is although almost completely lost due to the humidity constraints of the FTM membrane that introduce the additional complexity of a steam sweep stream and the two technologies have a final similar cost of clinker. In comparison the Membrane Assisted Liquefaction (MAL) considered in the literature has a slightly higher COC but with a lower CAC. The necessity to raise steam for FTM membranes significantly increases the complexity of the capture plant similarly to the amine case where steam is required to regenerate the solvent and release the captured CO2. The traditional optimized MEA processes though still remains advantageous.
These results indicate a clear direction for material development that should aim at increasing the performance at a reduced humidity content, but maintaining the high selectivity ensured by the facilitated transport mechanism. Pre-pilot tests in situ showed how the membranes could operate with a reduced humidity but with lower performances [24,25].

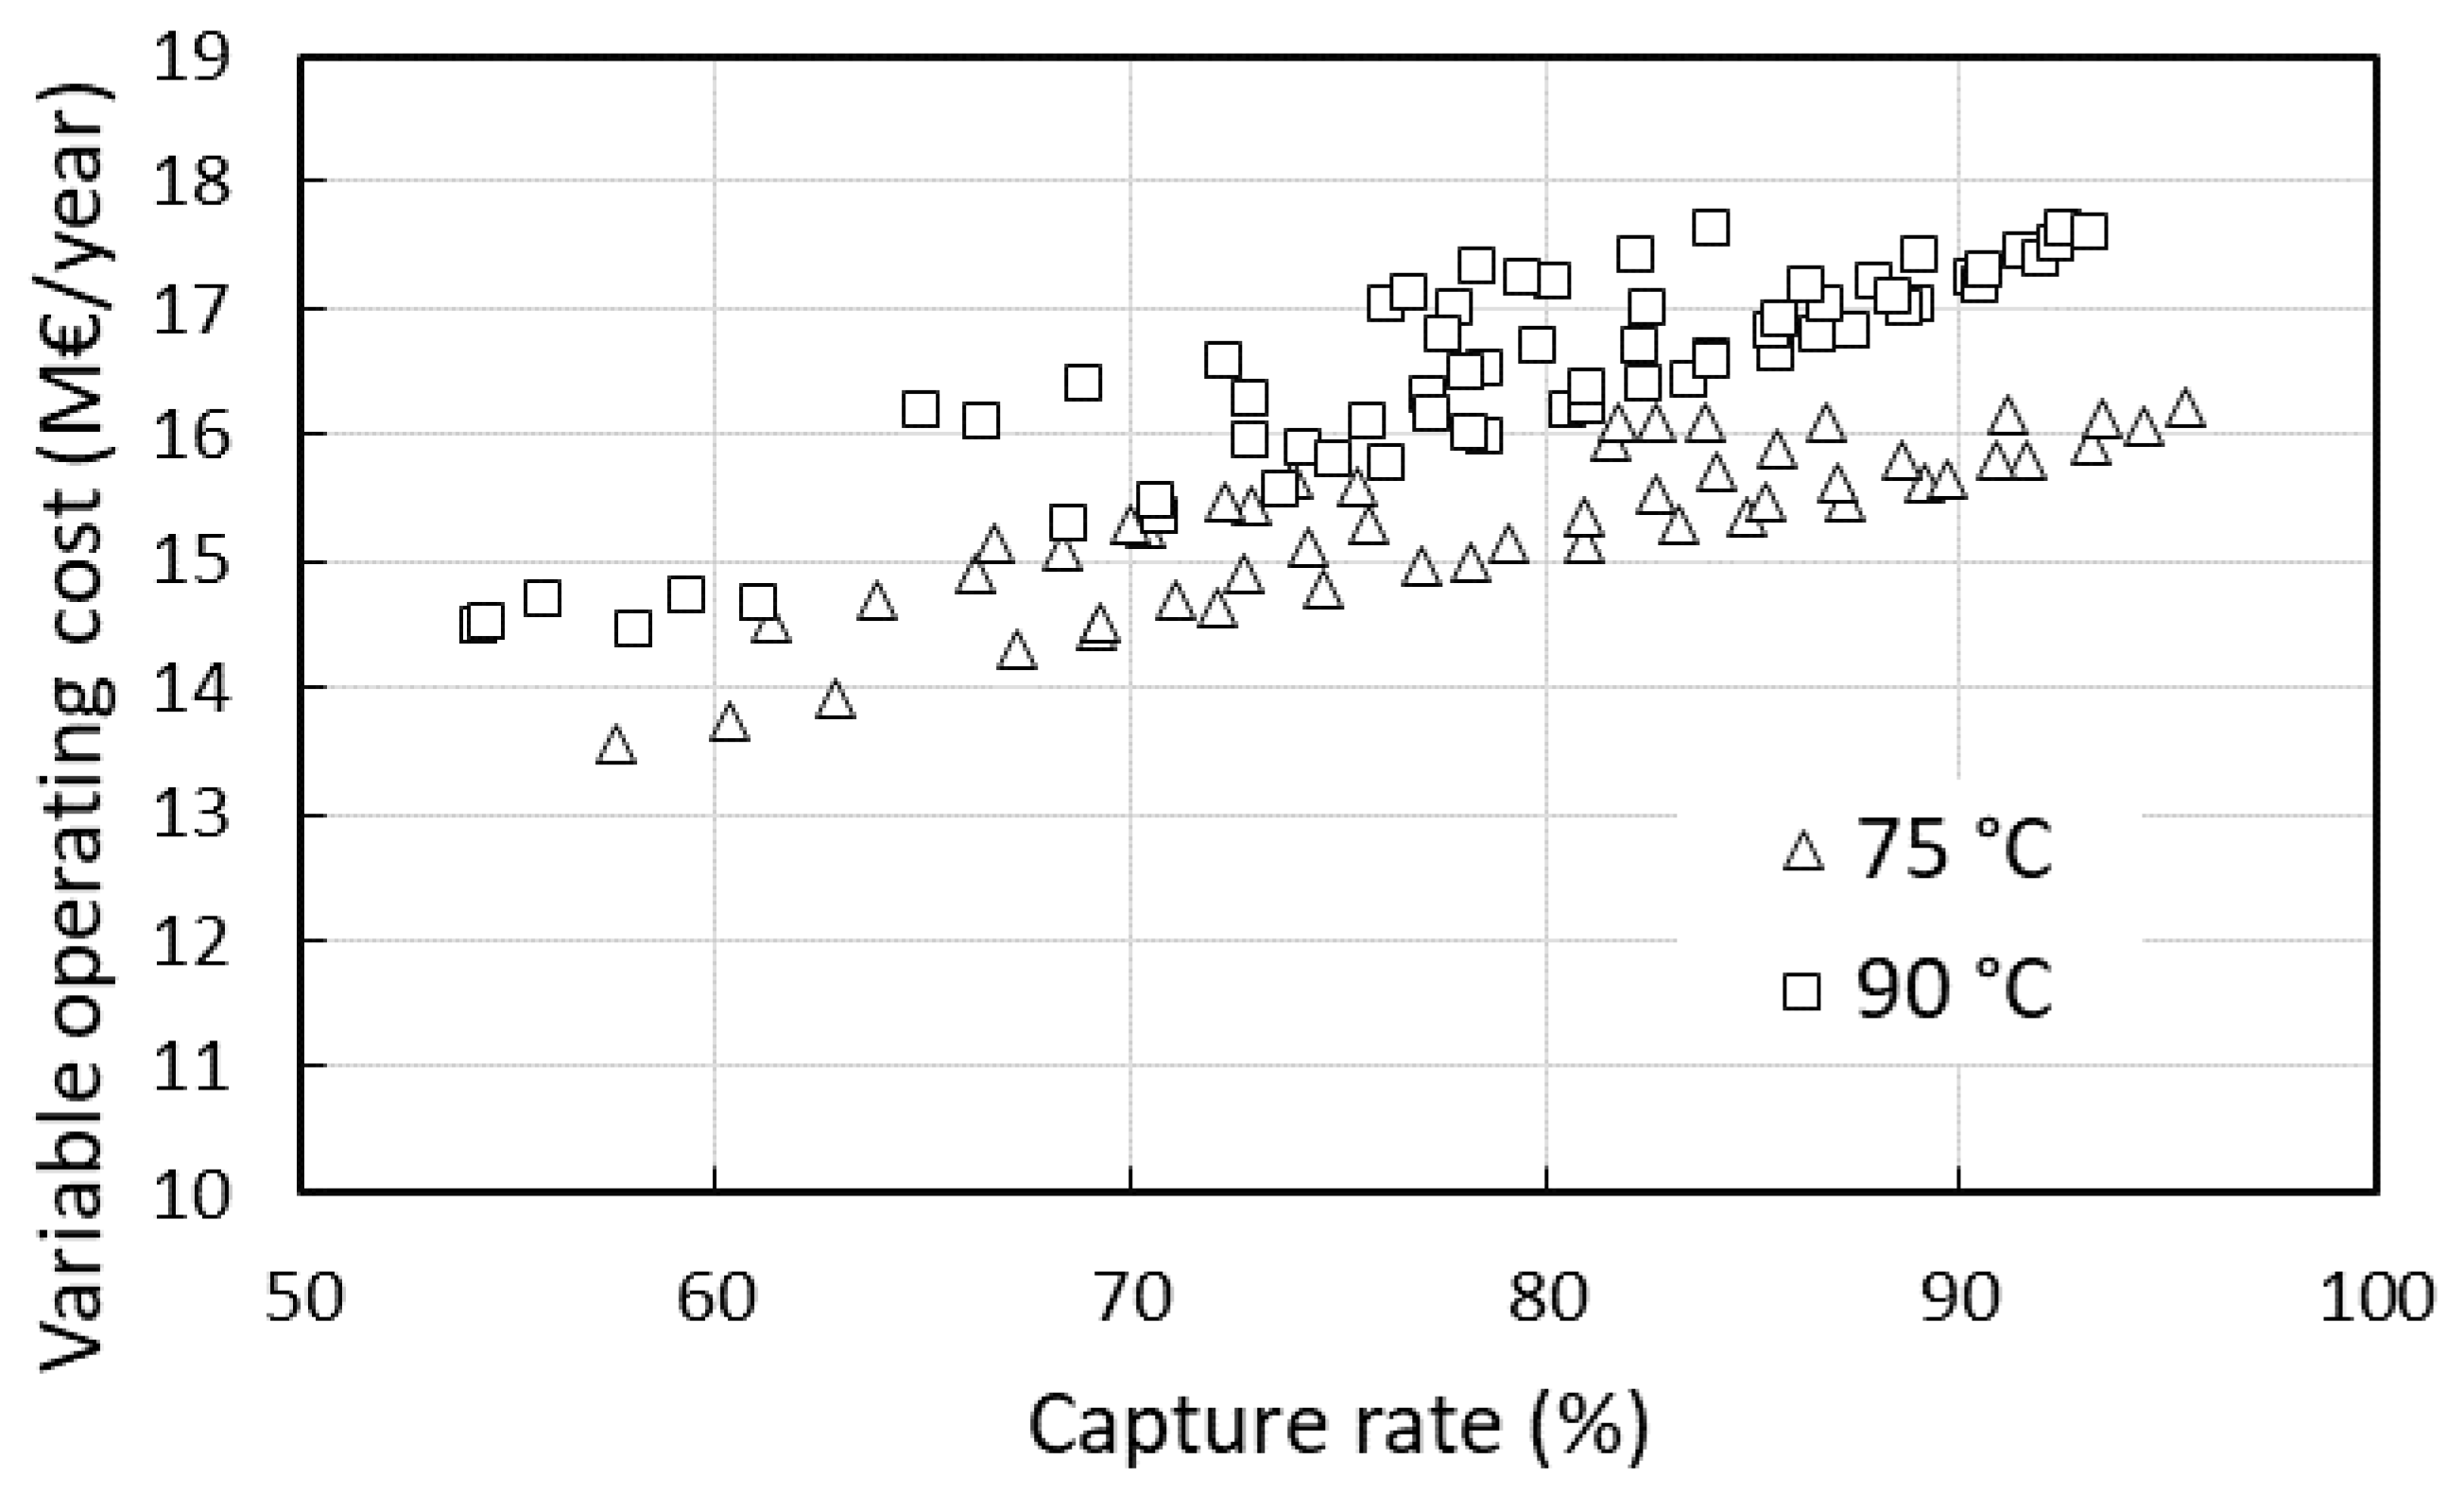
3.4. Sensitivity Analysis: Capture Rate

The effect of the sweep temperature can also be studied as a function of the capture rate. The lowest temperature of 60 °C was not considered since the cost was already very high in comparison to the other temperatures. The different cases were compared in terms of variable operative costs of the capture and compression sections of the plant including electricity to operate pumps and compressor, membrane replacement and steam consumption. Figure 7 shows the results for 75 and 90 °C where it is evident the increase of the cost of capture as the capture rates increases consistently with what already reported in the literature for cement plants [21].

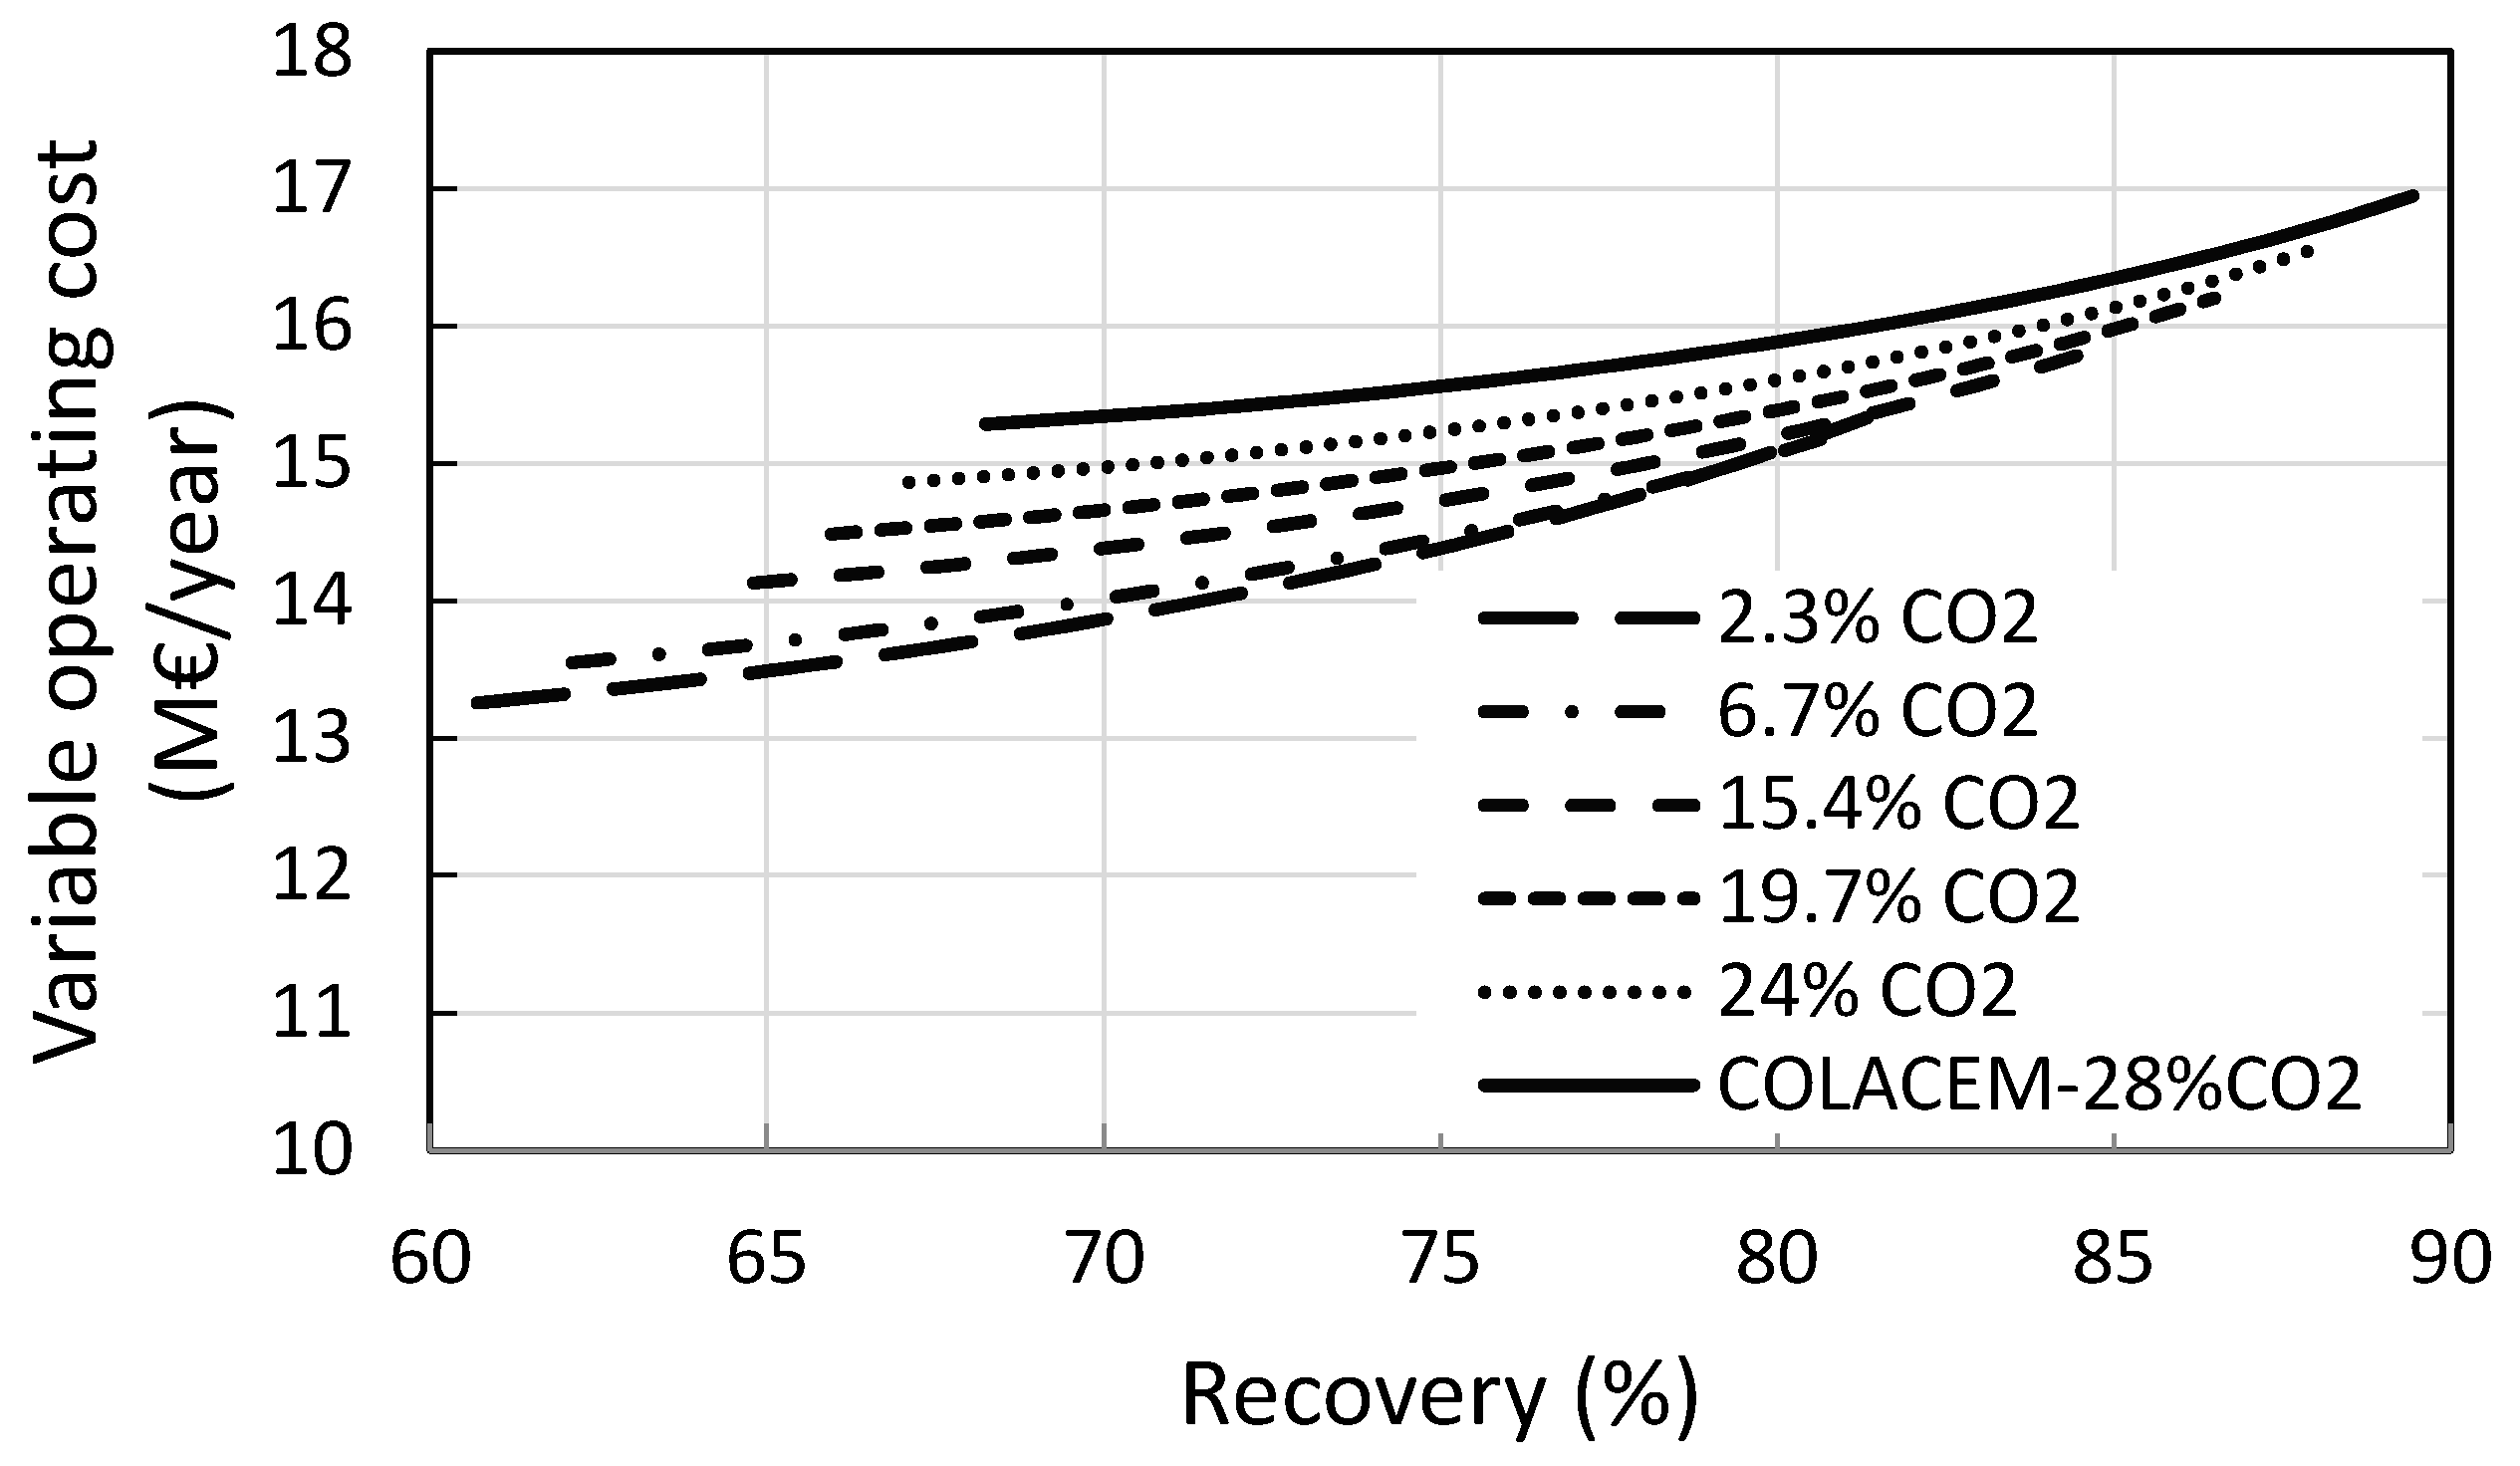
3.5. Sensitivity Analysis: Flue Gas Partial Pressure

The relatively high partial pressure of CO2 in the flue gas entering the membrane unit in the specific cement plant under investigation makes the application of membrane technologies particularly attractive. In an effort to extend the results of this study beyond the specific site, a sensitivity analysis was performed on the effect of concentration in the flue gas on the membrane process and the penalties introduce by the capture process at fixed steam flowrate. This also shows the results of retrofitting the FTM technology directly to the existing plant without any modification to the emissions treating section of the plant. The results for the variable operative costs of the capture and compression sections are reported in Figure 8 and show an increase of costs as a function of recovery and initial flue gas concentration. This is due to the smaller permeate stream that reduces the membrane are requirement and the size of the vacuum pump. At the same time, the retentate stream is larger and therefore allows to recover more energy with the expansion.

4. Conclusions

The application of novel facilitated transport membranes in a cement plant located in Gubbio, Italy has been investigated. The study supports the pilot plant testing of the membranes developed in the Horizon2020 funded project NANOMEMC2. The process simulation demonstrated how the membranes can be deployed to achieve different level of capture. Different temperatures were analyzed for the steam required as sweep by the technology; while all different grade of steam considered can be utilized to achieve a 90% capture rate, a full economic optimization is required to establish the more favorable scenario. The case at 75 °C using steam raised inside the plant demonstrated the best performance with a cost of clinker of 116.69 (€/ton clinker) and CO2 avoidance cost of 89.11 €/ton CO2 that is comparable with other proposed technologies. This cost is highly related to the amount of steam required to operate the membranes and therefore any improvement on this front would bring the cost down and benefit the plant. Three cases were considered for the steam: producing it onsite from natural gas, importing form adjacent plants and raising it from waste heat. This is crucial considering the location of the plant investigated where no steam facilities are available in the vicinity.

Author Contributions

Conceptualization, M.-C.F.; methodology, M.-C.F. and A.A.; validation, R.C. and G.M.N.; investigation, A.A.; writing—original draft preparation, M.-C.F.; writing—review and editing, M.-C.F., A.A., R.C. and G.M.N.; supervision, M.-C.F. All authors have read and agreed to the published version of the manuscript.

Funding

This research was funded by European Union’s Horizon 2020 Research and Innovation program under Grant Agreement No. 727734.

Institutional Review Board Statement

Not applicable.

Informed Consent Statement

Not applicable.

Data Availability Statement

Not applicable.

Conflicts of Interest

The authors declare no conflict of interest. The funders had no role in the design of the study; in the collection, analyses, or interpretation of data; in the writing of the manuscript, or in the decision to publish the results.

Appendix A

Figure A1. BFD (Block Flow Diagram) of the real clinker production plant in Gubbio, Italy.
Energies 14 04772 g0a1

Appendix B

Table A1. Stream table for FTM capture process at 75 °C.
FeedSteamFeed to MembraneOut TurbineSweep SteamPermeateTo Compression Train
Pressure (kPa)101.3101.30165101.3035.6135101.00
Flow (kmol/h)6474108077605556216646062130
Molar fractions
CO20.330.0000.2870.040.0000.440.95
O20.020.0000.0170.0250.0000.000.001
N20.600.0000.5220.720.0000.010.02
H2O0.041.0000.1740.21.0000.550.03

References

  1. IEA; CSI. Technology Roadmap—Low-Carbon Transition in the Cement Industry; IEA: Paris, France, 2018. [Google Scholar]
  2. Schneider, M. The cement industry on the way to a low-carbon future. Cem. Concr. Res. 2019, 124, 105792–105811. [Google Scholar] [CrossRef]
  3. Fennell, P.S.; Davis, S.J.; Mohammed, A. Decarbonizing cement production. Joule 2021, 5, 1305–1311. [Google Scholar] [CrossRef]
  4. Obrist, M.D.; Kannan, R.; Schmidt, T.J.; Kober, T. Decarbonization pathways of the Swiss cement industry towards net zero emissions. J. Clean. Prod. 2021, 288, 125413–125426. [Google Scholar] [CrossRef]
  5. Benhelal, E.; Shamsaei, E.; Rashid, M.I. Challenges against CO2 abatement strategies in cement industry: A review. J. Environ. Sci. 2021, 104, 84–101. [Google Scholar] [CrossRef]
  6. Gkiokchan, M.; Ryssel, M.; Zhao, L.; Markewitz, P.; Sattler, C.; Robinius, M.; Stolten, D. CO2 emission reduction in the cement industry by using a solar calciner. Renew. Energy 2020, 145, 1578–1596. [Google Scholar]
  7. CEMCAP. Available online: https://www.sintef.no/cemcap (accessed on 20 November 2020).
  8. CLEANKER. Available online: http://www.cleanker.eu/ (accessed on 20 November 2020).
  9. LEILAC. Available online: https://www.project-leilac.eu/ (accessed on 20 November 2020).
  10. Laribi, S.; Dubois, L.; De Weireld, G.; Thomas, D. Study of the post-combustion CO2 capture process by absorption regeneration using amine solvents applied to cement plant flue gases with high CO2 contents. Int. J. Greenh. Gas Control. 2019, 90, 102799–102810. [Google Scholar] [CrossRef]
  11. Nwaohaa, C.; Beaulieub, M.; Tontiwachwuthikula, P.; Gibson, M.D. Techno-economic analysis of CO2 capture from a 1.2 million MTPA cement plant using AMP-PZ-MEA blend. Int. J. Greenh. Gas Control 2018, 78, 400–412. [Google Scholar] [CrossRef]
  12. Roussanaly, S.; Fu, C.; Voldsund, M.; Anantharaman, R.; Spinelli, M.; Romano, M. Techno-economic analysis of MEA CO2 capture from a cement kiln—Impact of steam supply scenario. Energy Procedia 2017, 114, 6229–6239. [Google Scholar] [CrossRef] [Green Version]
  13. Pérez-Calvo, J.-F.; Sutter, D.; Gazzani, M.; Mazzotti, M. A methodology for the heuristic optimization of solvent-based CO2 capture processes when applied to new flue gas compositions: A case study of the Chilled Ammonia Process for capture in cement plants. Chem. Eng. Sci. X 2020, 8, 100074–100097. [Google Scholar] [CrossRef]
  14. Cloete, S.; Giuffrida, A.; Romano, M.C.; Zaabout, A. Economic assessment of the swing adsorption reactor cluster for CO2 capture from cement production. J. Clean. Prod. 2020, 275, 123024–123040. [Google Scholar] [CrossRef]
  15. De Lena, E.; Spinelli, M.; Gatti, M.; Scaccabarozzi, R.; Campanari, S.; Consonni, S.; Cinti, G.; Romano, M.C. Techno-economic analysis of calcium looping processes for low CO2 emission cement plants. Int. J. Greenh. Gas Control 2019, 82, 244–260. [Google Scholar] [CrossRef]
  16. Ozcan, D.C.; Macchi, A.; Lu, D.; Kierzkowska, A.; Ahn, H.; Muller, C.; Brandani, S. Ca-Cu looping process for CO2 capture from a power plant and its comparison with Ca-looping, oxy-combustion and amine-based CO2 capture processes. Int. J. Greenh. Gas Control 2015, 43, 198–212. [Google Scholar] [CrossRef] [Green Version]
  17. De Silvestri, A.; Stendardo, S.; Pietra, M.D.; Borello, D. Decarbonizing cement plants via a fully integrated calcium looping-molten carbonate fuel cell process: Assessment of a model for fuel cell performance predictions under different operating conditions. Int. J. Hydrog. Energy 2021, 46, 14988–15007. [Google Scholar] [CrossRef]
  18. Lindqvist, K.; Roussanaly, S.; Anantharaman, R. Multi-stage membrane processes for CO2 capture from cement. Energy Procedia 2014, 63, 6476–6483. [Google Scholar] [CrossRef] [Green Version]
  19. Voldsund, M.; Gardarsdottir, S.O.; Lena, E.D.; Pérez-Calvo, J.-F.; Jamali, A.; Berstad, D.; Fu, C.; Romano, M.; Roussanaly, S.; Anantharaman, R.; et al. Comparison of Technologies for CO2 Capture from Cement Production—Part 1: Technical Evaluation. Energies 2019, 12, 559. [Google Scholar] [CrossRef] [Green Version]
  20. Gardarsdottir, S.O.; Lena, E.D.; Romano, M.; Roussanaly, S.; Berstad, D.; Fu, C.; Voldsund, M.; Pérez-Calvo, J.-F.; Anantharaman, R.; Sutter, D.; et al. Comparison of Technologies for CO2 Capture from Cement Production—Part 2: Cost Analysis. Energies 2019, 12, 542. [Google Scholar] [CrossRef] [Green Version]
  21. Baker, R.W.; Freeman, B.; Kniep, J.; Huang, Y.I.; Merkel, T.C. CO2 Capture from Cement Plants and Steel Mills Using Membranes. Ind. Eng. Chem. Res. 2018, 57, 15963–15970. [Google Scholar] [CrossRef]
  22. Micari, M.; Dakhchoune, M.; Agrawal, K.V. Techno-economic assessment of postcombustion carbon capture using high-performance nanoporous single-layer graphene membranes. J. Membr. Sci. 2021, 624, 119103–119119. [Google Scholar] [CrossRef]
  23. Hägg, M.-B.; Lindbråthen, A.; He, X.; Nodeland, S.; Cantero, T. Pilot demonstration—Reporting on CO2 capture from a cement plant. Energy Procedia 2017, 114, 6150–6165. [Google Scholar] [CrossRef]
  24. Dai, Z.; Nardelli, G.M.; Costi, R.; Deng, L. Field test of a pre-pilot scale hollow fiber facilitated transport membrane for CO2 capture. Int. J. Greenh. Gas Control 2019, 86, 191–200. [Google Scholar] [CrossRef]
  25. Janikaram, S.; Santinelli, F.; Costi, R.; Lindbråthen, A.; Nardelli, G.M.; Milkowski, K.; Ansaloni, L.; Deng, L. Field trial of hollow fiber modules of hybrid facilitated transport membranes for flue gas CO2 capture in cement industry. Chem. Eng. J. 2021, 413, 127405–127416. [Google Scholar] [CrossRef]
  26. IEAGHG. “Deployment of CCS in the Cement Industry (Report 2013/19)” IEA Greenhouse Gas R&D Programme; IEAGHG: Cheltenham, UK, 2013. [Google Scholar]
  27. Rafiq, S.; Deng, L.; Hägg, M.-B. Role of facilitated transport membranes and composite membranes for efficient CO2 capture—A review. Chem. Biol. Eng. Rev. 2016, 3, 1–19. [Google Scholar]
  28. Dai, Z.; Deng, J.; Ansaloni, L.; Janikaram, S.; Deng, L. Thin-film-composite hollow fiber membranes containing amino acid salts as mobile carriers for CO2 separation. J. Membr. Sci. 2019, 578, 61–68. [Google Scholar] [CrossRef]
  29. NANOMEMC2 Project, WP2-WP3-WP5 Internal communication; European Commission: Brussels, Belgium, 2017.
  30. Belaissaoui, B.; Lasseuguette, E.; Janakiram, S.; Deng, L.; Ferrari, M.-C. Analysis of CO2 Facilitation Transport Effect through a Hybrid Poly (Allyl Amine) Membrane: Pathways for Further Improvement. Membranes 2020, 10, 367. [Google Scholar] [CrossRef]
  31. Chen, K.K.; Salima, W.; Han, Y.; Wu, D.; Ho, W.W. Fabrication and scale-up of multi-leaf spiral-wound membrane modules for CO2 capture from flue gas. J. Membr. Sci. 2020, 595, 117504–117515. [Google Scholar] [CrossRef]
  32. Ferrari, M.-C.; Bocciardo, D.; Brandani, S. Integration of Multi-Stage Membrane Carbon Capture Processes to Coal-Fired Power Plants using highly permeable polymers. Green Energy Environ. 2016, 1, 211–221. [Google Scholar] [CrossRef]
  33. van der Spek, M.; Roussanaly, S.; Rubin, E.S. Best practices and recent advances in CCS cost engineering and economic analysis. Int. J. Greenh. Gas Control 2019, 83, 91–104. [Google Scholar] [CrossRef]
  34. Garcia, M.; Berghout, N. Toward a common method of cost-review for carbon capture technologies in the industrial sector: Cement and iron and steel plants. Int. J. Greenh. Gas Control 2019, 87, 142–158. [Google Scholar] [CrossRef]
  35. De Lena, E.; Spinelli, M.; Romano, M.; Gardarsdottir, S.O.; Roussanaly, S.; Voldsund, M. CEMCAP Economic Model Spreadsheet. 2018. Available online: https://zenodo.org/record/1446522 (accessed on 8 November 2020).
  36. IEA Greenhouse Gas R&D Programme. Cost of CO2 Capture in the Industrial Sector: Cement and Iron and Steel Industries, 2018-TR03; IEAGHG: Cheltenham, UK, 2018. [Google Scholar]
  37. European Environmental Agency. 2017. Available online: https://www.eea.europa.eu/data-and-maps/indicators/overview-of-the-electricity-production-2/assessment-4 (accessed on 6 December 2020).
  38. Voldsund, M.; Anantharaman, R.; Berstad, D.; Cinti, G.; De Lena, E.; Gatti, M.; Gazzani, M.; Hoppe, H.; Martínez, I.; Monteiro, J.G.M.-S.; et al. CEMCAP Framework for Comparative Techno-Economic Analysis of CO2 Capture from Cement Plants (D3.2). 2018. Available online: https://www.zenodo.org/record/1257112#.W8hidapPpaR (accessed on 6 December 2020).
  39. Turton, R. Analysis, Synthesis, and Design of Chemical Processes; Prentice Hall/PTR: London, UK, 2003. [Google Scholar]
Figure 1. BFD (Block Flow Diagram) of the simulated cement plant with carbon capture and subsequent CO2 compression. The BFD for the production section is modified compared to the real plant as the excess gas from the cooler is not mixed with the gas stream form preheaters and raw mill; the carbon capture and compression sections are added in the simulation to this gas stream.
Energies 14 04772 g001
Figure 2. Simplified PFD of FTM technology for carbon capture considered in the simulation.
Energies 14 04772 g002
Figure 3. Simplified PFD of S/D technology for carbon capture considered in the simulation.
Energies 14 04772 g003
Figure 4. Effect of steam temperature on membrane area, steam flow rate and energy requirement at fixed 90% recovery and 95% purity of the captured CO2.
Energies 14 04772 g004
Figure 5. Comparison of economic performance of FTM processes for the three different steam scenario at three different temperatures: (a) Cost of Clinker (€/ton clinker); (b) CO2 avoidance Cost (€/ton CO2).
Energies 14 04772 g005
Figure 6. Comparison of optimized FTM process to other capture technologies: solution-diffusion membranes (S/D), Membrane Assisted Liquefaction (MAL) and MEA absorption (MEA).
Energies 14 04772 g006
Figure 7. Effect of capture rate on the variable operating costs of the plant at different steam grades.
Energies 14 04772 g007
Figure 8. Effect of CO2 molar fraction at the inlet of the membrane module on the variable operating costs at fixed sweep flow rate.
Energies 14 04772 g008
Table 1. Technical data of Colacem clinker production plant in Gubbio, Italy for reference year 2016.
Yearly Hours of Operation7920
Raw meal/fuel/air inlet temperature (°C)83/55/15
Fuel composition (wt. %) and heating value
C (%)86.5
H (%)3.53
S (%)5.12
Ash (%)0.2
H2O (%)0.5
LHV (MJ/kg)34.24
Raw meal composition (wt. %)
CaCO3 (%)77.4
SiO2 (%)13.78
Al2O3 (%)3.7
Fe2O3 (%)1.58
MgCO3 (%)2.37
Suspension Preheaters
Number of stages5
Cyclones efficiency, (%)98/56/76/63/77
Heat loss, (kJ/kgclk)100
Flow rate air (Nm3/hr)150–160,000
Flue gas temperature (°C)320
Precalciner (95% efficiency)
Fuel consumption, (kg/kgclk)0.041
Transport air, (kg/kgclk)0.0298
Tertiary air temperature (cooler outlet/calciner inlet), (°C)980/820
Tertiary air mass flow rate (kg/kgclk)0.49
Heat loss, (kJ/kgclk)100
Rotary Kiln
Fuel consumption, (kg/kgclk)0.061
Gas outlet temperature, (°C)1150
Transport air + primary air flow rate, (kg/kgclk)0.07
Secondary air temperature, (°C)1050
Secondary air mass flow rate (kg/kgclk)0.62
Clinker cooler
Clinker final temperature, (°C)106
Exhausts temperature, (°C)300
Heat loss, (kJ/kgclk)38
Table 2. Membrane characteristic used for the process simulation.
FTM [29]S/D [21]
CO2 Permeance (GPU)20002000
Selectivity N2 (-)300300
Selectivity H2O (-)0.30.3
Selectivity other components (-)200200
Minimum Relative Humidity for operation60%N/A
Operation temperature (°C)60–12035
Lifetime (yr)33
Table 3. Unit cost for variable operating costs calculation.
Variable OPEX ItemUnit Cost
Raw Meal (€/t_clinker)5
MEA Solvent (€/kg)1.45
Process Water (€/m3)6.65
Cooling Water (€/m3)0.39
Electricity (€/MWhe)58.1
Natural Gas (€/GJ)6
Fuel (€/GJ)3
Labour (k€/year)60
Other Variable Costs (€/t_clinker)1.09
Limestone (€/t)3
Steam (€/MWhth)25
Membrane (€/m2)42
Electricity (€/MWhe)58.1
Table 4. Techno-economic performance of cement plant without carbon capture and with carbon capture with FTM membranes using a sweep stream of imported steam at different temperatures.
No CaptureCapture with FTM Membranes
Steam temperature (°C)-607590
Steam pressure (bar)-0.200.390.70
Clinker production (Mton/yr)1111
Raw meal (Mton/yr)1.531.531.531.53
Fuel input (Mton/yr)0.0970.0970.0970.097
Fuel LHV (MJ/kg)34.2434.2434.2434.24
Electricity consumption (MWe)12.3622.7927.2228.15
Cooling Duty (MW) 44.0826.4227.00
Steam required (MW) 66.3443.4449.24
Membrane area (m2)-66,43046,23430,823
CO2 emissions (Mton CO2/yr)0.870.090.090.09
CO2 avoidance rate (%)-909090
CO2 emission rate (kg CO2/ ton clinker)831.8383.1883.1883.18
SPECCA (MJ/ kg CO2)-8.996.146.70
Total Plant Cost (M€)204387387387
Cost of Clinker, COC (€/ton clinker)61.45125.26116.69117.62
CO2 avoidance Cost (€/ton CO2)-112.0889.1191.91
Table 5. Comparison of different carbon capture alternatives.
No CaptureCarbon Capture
Capture Technology-MEA [19,20]MAL [19,20]S/D
Membranes
FTM (75)
Membranes
Clinker production (t/h)119120.7120.7119119
Electricity consumption (MWe)12.3629.55076.0553.62
Steam required (MW)-96.4--43.44
Membrane area (m2)--50,160185,71846,234
Equivalent specific CO2 avoided (kg CO2/ton clinker)-55968783.1883.18
SPECCA (MJ/kg CO2)-7.083.225.685.48
Total Plant Cost (M€)204280450340387
Fixed O&M Cost (M€/yr)18.4776 171 129.9629.36
Variable O&M Cost (M€/yr)22.13 56.6246.78
Cost of Clinker, COC (€/ton clinker)61.45107.4120119.03116.69
CO2 avoidance Cost (€/ton CO2) 80.283.595.2089.11
1 Total O&M costs (Fixed + Variable).
Publisher’s Note: MDPI stays neutral with regard to jurisdictional claims in published maps and institutional affiliations.

