Article

Impact of Technogenic Saline Soils on Some Chemical Properties and on the Activity of Selected Enzymes

by
Joanna Lemanowicz
1,*,
Kinga Gawlińska
2 and
Anetta Siwik-Ziomek
1
1
Department of Biogeochemistry and Soil Science, Faculty of Agriculture and Biotechnology, University of Science and Technology, Bernardyńska 6 St., 85-029 Bydgoszcz, Poland
2
Maj Institute of Pharmacology Polish Academy of Sciences, Department of Drug Addiction Pharmacology, Smętna Street 12, 31-343 Kraków, Poland
*
Author to whom correspondence should be addressed.
Energies 2021, 14(16), 4882; https://doi.org/10.3390/en14164882
Submission received: 15 June 2021 / Revised: 24 July 2021 / Accepted: 5 August 2021 / Published: 10 August 2021
(This article belongs to the Special Issue Environmental and Energetic Valorization of Renewable Resources)

Abstract

:
The study was based on saline soils with surface mineral layers impacted by the waste produced by the soda plant in Poland. The activity of selected enzymes (catalase CAT, alkaline AlP, and acid phosphatase AcP), pH in KCl, content of the clay, total organic carbon (TOC), total nitrogen (TN), total exchangeable bases (TEB), electrical conductivity (ECe), CaCO3, and concentration of available phosphorus AP were investigated in the soil next to the soda plant. Based on the enzyme activity, the following were calculated: enzymatic pH indicator AlP/AcP, the resistance index (RS), resilience index (RL), relative changes (RCh), and the time index (TI). The soil was sampled from the mineral horizon in spring and autumn from eight (S1–S8) soil sampling sites in the area of the soda plant and from the control point (C). Soil is characterized by alkaline reaction. Statistical analysis (ANOVA, η2 effect size) showed significant variation in parameters under the influence of different sites next to soda plant. The content of TOC ranged from 4.70 to 47.7 g kg−1, and TN from 19 to 4.36 g kg−1. ECe next to the soda plant ranged between 6.87 and 204 mS cm−1. The highest values were confirmed in the soil of S1 both in spring and autumn. Higher TEB values were noted in the soil in autumn. In the soil within the impact of the soda plant, the AP content decreased and in the soil from sites S1, S3, S6, and S8 (in spring), the lowest AP content was recorded at 1.20, 4.14, 5.98, and 0.99 mg kg−1, respectively. The highest activity of AlP in spring was noted at site S1 and in autumn at site S4. In the soil next to the soda plant, the activity of AcP decreased, as compared to the control which is seen from the negative values of the coefficient of relative changes (RCh). The analysis of RCh in the catalase activities showed that in the soil from sites S1, S2, S3, S4, and S5, the activity increased, as compared to the control. The lowest values of the resistance index (RS) for phosphatases were reported in the soil of S6. Research shows that the activity of enzymes and their indexes make it possible to conduct long-term monitoring and identify the processes in soil.

1. Introduction

Soil salinity is one of the major causes of environmental degradation and human health deterioration [1]. High salinity has negative effects on soil fertility. Salinated soils are formed by salts that are more easily soluble in cold water as compared to gypsum. They include saline soils (solonchak), sodium soils (solonetz), and saline–sodium soils [2].
Soil salinization occurs due to a high salt content, high Na+ accumulation, and high pH, often due to high CO32− content in soil [3]. Sodium accumulates in the sorption complex, affects the state of the soil dispersion, and affects its capacity for swelling increases while the soil water permeability decreases. As for an excessive salinity, the soil solution contains too many, as compared to the plants requirements, with such cations as: Mg2+, Ca2+, K+, Na+, and anions: NO3, SO32−, and Cl, (COO)22− [4].
According to Rengasamy [5,6], soil salinisation covers 932.2 Mha globally (representing about 7% of earth’s continental extent), with 38.4% in Australasia, 33.9% in Asia, 15.8% in Americas, 8.6% in Africa, and only 3.3% in Europe [1]. In Poland, saline soils occupy a small area of about 5400 ha (0.02%) [2]. The occurrence of saline soils in Poland depends on a constant supply of ground waters with a high degree of mineralization. However, it undergoes continuous modifications due to, e.g., the disappearance of mineral sources, precipitation, land improvement treatments, changes in use, industrial plants shut-downs, etc. The natural sources of soil salinity include sea waters [7] and mineral waters of various origins and natural processes, mainly including physicochemical weathering and transport geological deposits.
The anthropogenic sources cover mine waters, brine and industrial wastewater, solid industrial waste, winter road maintenance salts, industrial dusts, and mineral fertilizers. Soil salinity can be due to the inadequate storage of the so-called lime sludge in sedimentation tanks (soda industry) and tailings on heaps (salt mining and black coal mining) [8]. The industrial activity results in the formation of technogenic soils with a changed landscape, requiring revegetation. The properties of salt-affected soil by the soda plant are very different from the naturally salinated soil [9]. The problem of the occurrence of such soils was presented in the soil classification systems [10]. Technosols include soils strongly affected by the materials produced by man (e.g., the mined material) and their properties and pedogenesis are influenced by their technical origin [11,12]. Soils affected by the soda industry mostly involve the chemical properties of soils that were transformed, while soil morphology, texture, and physical properties were similar to the respective un-affected soils present in the neighborhood [13]. Soil reclamation can increase productivity and fertility as there is a need to monitor and enhance it in salt-affected soils. Tailing ponds of the soda plant require a very complex revegetation. According to Qadir et al. [14] and Qadir et al. [15], an integrated application of methods (e.g., salt leaching and drainage interventions, and the addition of sulphuric acid and S powder enriched by Thiobacillus bacteria) can be used to enhance the productivity of salt-affected soils. Yet, another method of recultivation of salt-affected soils is “phytoremediation”. It uses the plant root capacity for increasing the rate of dissolving of the calcite, thus increasing the level of Ca2+ ions in the soil solution, which effectively replaces Na+ in the cation-exchangeable complex. The method does not require high financial inputs for chemicals and simultaneously it increases the availability of nutrients after phytoremediation [16,17]. The addition of organic matter is the way for the reclamation of different degraded soils including salt-affected soils. The improvements of Tejada et al. [18] showed effects regarding physicochemical and biological characteristics with the use of SOM.
One of the soil monitoring methods concerns the use of the measurements of its enzymatic activity and multi-parameter enzymatic indicators to evaluate the soil quality [19]. Soil enzymes are natural catalysts of many soil processes connected to the decomposition of SOM. They participate in the processes of releasing inorganic minerals, making them available to the plant, and so on, in comparison to microbiological studies wherein enzymes are more sensitive indexes of soils evolution. [19]. The enzymatic activity is an early index of change in the range of the intensity of life processes and the degree of soil degradation, and usually it is correlated with its physicochemical properties [20,21]. Phosphatases, hydrolyzing organic P compounds, are the most frequently studied enzymes in soil considering they quickly reply to the environmental stress caused by natural and anthropogenic factors. The key sources of soil phosphatases are microorganisms, plant roots, and soil fauna, whereas catalase is an enzyme protecting organisms from the bad effects of oxidative stress. In the soil environment, catalase occurs in the cells of microorganisms using oxygen for respiration processes [22] and the activity of catalase plays an important role in the chemistry of soil solution, able to change the redox reaction of soil.
We have hypothesized that anthropogenic soil disturbance by CIECH Soda Polska S.A. changes the soil chemical and physical properties as well as the biological activity in the soil, thus reducing the total organic carbon, available phosphorus, and lowering the activity of some enzymes. Our objective was to study the alkaline, acid phosphatase, and catalase activity, in addition to the total organic carbon, total nitrogen, and available phosphorus concentration in soils in the territories adjacent to the soda plant. The aim of the study was also to assess whether in changed soil conditions, the enzymatic activities retain typical relationships with selected physical and chemical soil properties.

2. Materials and Methods

2.1. Study Area and Soil Samples

The research was carried out in the Notec River valley in the area adjacent to the CIECH Soda Polska S.A. (the soda plant founded in 1882) in Inowrocław. The city is located on the Inowrocław Plain in the Kujawsko-Pomorskie province (52°40′ N; 18°16′ E) (Central Poland), with dominant Mollic Gleysols and Gleyic Phaeozems (in Poland, known as black earths). The soils degraded by the technogenically induced salinization process in Inowrocław-Matwy can be classified as Mollic Technosols (Calcaric) [8]. In that area, the climate demonstrates to be cold and temperate. Inowrocław is a town with considerable precipitation. Even during the driest months, precipitation is high. The climate in that area has been classified as Dfb-compliant with the Köppen–Geiger system. The year-average temperature is 7.9 °C (from −3.2 °C to 18.1 °C) (Figure 1) and the year-average precipitation is 44.25 mm (Figure 2) (from 23 mm to 77 mm). The mean temperature of 18.1 °C makes July the hottest month of the year. Precipitation is lowest in February with an average precipitation of 23 mm and it mostly occurs in July (on average, 77 mm).
In the city center, the Cechsztyn salt dome (109 m a.s.l.) accumulates salt [23]. CIECH Soda Polska S.A. produces, e.g., precipitated calcium carbonate, light and heavy soda ash, and sodium bicarbonate, as well as silica gels, zeolites and molecular sieves, hopcalite, and fertilizer chalk. The plant satisfies 98% of the Polish demand for sodium carbonate, exporting a considerable part of the production. The Solvay method uses very high amounts of water and as a result, high amounts of wastewater are discharged through the pipeline into the Vistula River [23]. The waste used to be stored in the so-called sedimentation tanks without appropriate safety measures, which resulted in the percolation of salt to ground waters and thus in the salinity of fertile soils in the neighboring areas. The cause of soil salinity is also the emission of limestone dust and wind spreading around the waste from the surface of sedimentation tanks [24]. Ciech Soda Polska plants focus on green solutions. Such investments in Mątwy included, e.g., a post-production sludge dewatering system used for producing lime fertilizer, a flue-gas desulphurization system, barrier drainages at landfill sites protecting the land against flooding and salinization, and the insulation of waste ponds. About 90% of waste has been used for economic purposes (e.g., for the production of cement and lime fertilizer) and used-out waste ponds have undergone reclamation. Despite such actions, soil salinity remains at a relatively constant level. Some waste ponds were insulated with a foil screen, while others are found immediately on permeable land without any security measures. The construction of sedimentation tanks increased an undisturbed water table of ground waters, which has an unfavorable effect on soil properties (pH, ECe, the content of SOM and macronutrients, and sorption properties) [23]. According to Hulisz et al. [13], another factor affecting the soil salinity at the vicinity of Inowrocław is the breakdown of pipelines discharging wastewater and brine.
The soil was sampled from the mineral horizon (0–20 cm deep) in spring (April) and autumn (October) 2016 from eight sites in the area of the soda plant and from the control point (Figure 3).
The sites differed in their method of use, as follows. Site S1: up to year 2000 places flooded with post-soda sludge to be reclaimed with secondary succession (a natural process leading to the recovery of primary qualities of the natural environment); site S2: flooded with post-soda sludge and with a deficiency of natural succession; site S3: the places around the clarifying–cooling “pond”, in which carbonates get precipitated as waste; sites S4 and S5: where technical (the relief was transformed; it was covered with a layer of fresh soil and drainage was performed) and agrotechnical (for the fastest turfing possible of the sedimentation tanks with a mixture of grasses and the Fabaceae including Italian ryegrass, orchard grass, red fescue, red clover, and white clover) reclamation was completed; site S6: at the dried pond for ash waters; site S7: an agricultural field in which spring barley (Hordeum vulgare L.) was grown 500 m away from the soda plant; site S8: the places in the vicinity of the waste dumping sites, sewage treatment plant, and soda plant (with numerous communities of halophytes, mainly with Salicornia europaea); and site C: the control site. Soil control is defined as very fertile uncultivated soils (Mollic Gleysols) away from the soda plant impact site
In each test area, 12 individual samples were taken using a random sampling design. The core samples were mixed to get the weight of about 1 kg of a representative sample for each site [25].

2.2. Chemical and Biochemical Analysis of Soil Samples

In the air-dried soil samples, sieved through ø 2 mm, some physical and chemical properties were determined: the content of the clay was assayed with the laser diffraction method applying the Masterssizer MS 2000 analyzer; pH in 1M KCl was measured potentiometrically [26]; total organic carbon (TOC) was assayed with the analyzer Vario Max CN, provided by Elementar (Germany); total nitrogen (TN) using the Kjeldahl method with the Kjeltec analyzer; total exchangeable bases (TEB) with the Kappen method [27]; and the electrical conductivity (ECe) in the soil paste. CaCO3 content was measured with the Scheibler’s volumetric method. The content of available phosphorus (AP) was determined with the Egner–Riehm DL method [28].
The activity of the enzymes was assayed in fresh, moist, and sieved soil. The activity of the redox enzyme, namely catalase (CAT) [E.C. 1.11.1.6], in the soil with the Johnson and Temple method [29] was measured by applying the manganometric titration of the surplus of H2O2 under acidic conditions.
The analyses of the enzyme representing the class of hydrolases, namely alkaline phosphatase [E.C. 3.1.3.1] (AlP) and acid phosphatase [E.C. 3.1.3.2] (AcP), were performed with 1 g of soil samples with the Tabatabai and Bremner method [30]. It is based on the colorimetric assaying of the released substrate p-nitrophenylphosphate (pNP) after the incubation of soil with MUB (modified universal buffer) at pH 11.0 for alkaline phosphatase and at pH 6.5 for acid phosphatase samples for 1 h at the temperature of 37 °C.
With the values of the activity of alkaline and acid phosphatase reported, the enzymatic index of the soil was calculated [31]:
pH   ( AlP / AcP )
The resistance index (RS) and resilience index (RL) determined according to the activity of enzymes in the soil was calculated using the formulas proposed by Orwin and Wardle [32]:
R S = 1 [ 2 | D 0 | C 0 + | D 0 | ]
where D0 = C0 − P0, C0 is the parameter value in the control, and P0 is the parameter value in the disturbed soil.
R L = 2 | D 0 | ( | D 0 | + | D x | ) 1
where D0 is the difference between the control (C0) and the disturbed soil (P0) in the soil sampled in spring, and Dx represents a difference between the control and the disturbed soil with regard to time (soil sampled in autumn). The value of the resistance and resilience index is bounded by −1 and +1.
The mean values of the enzyme activities were also used to calculate the relative changes (RCh) according to the formula defined by Chaer and others [33]:
R C h = ( T C 1 ) 100
where T is the mean enzymatic activity in the soil next to the soda plant and C is the mean value obtained for the control.
Based on the results, the time index (TI) [34] was calculated:
T I = t 2 t 1
where t1 is the content of the element in spring and t2 is the content of the element in autumn. TI > 1 represents an increase, while TI < 1 represents a decrease in the content of some elements and the activity of the enzymes studied.

2.3. Statistical Analysis

An ANOVA test was performed with the results and analyses were conducted using Statistica 12 for Windows. One-way analysis of variance (ANOVA) was conducted to determine the effect of different sites on soil physical and chemical properties (clay, pH in 1 M KCl, CaCO3, TOC, and NT). A two-way analysis of variance was conducted to examine the main effect of different sites and the months of study on the enzymatic activities and the content of phosphorus. The relations between the CAT, AlP, and AcP activity, and the physical and chemical parameters were estimated with a correlation analysis based on Pearson’s correlation coefficients (p < 0.05). The percentage share of the observable variability was calculated using the η2 indicator with the ANOVA variance analysis method.
Multivariate characterization (PCA: principal component analysis) was applied using data for soil CAT, AlP, and AcP activities, in addition to the clay, pH, ECe, TEB, content of CaCO3, TOC, TN, and AP to analyze the relationships between the variables observed. The first three principal components (PC1, PC2, and PC3) were selected for a further interpretation of the results. Hierarchical cluster analysis (CA) with Ward’s method [35] was used to identify the sampling similarity groups.

3. Results and Discission

3.1. Physicochemical Properties

The accumulation of clay fraction ranged from 4.22 to 14.8%. Soils are characterized by the alkaline reaction (pH in 1 M KCl 7.7–7.9 at the sites of influence of the emitter and 7.1 in the control). There was a significant variation found in the content of CaCO3 (from 3.88% to 48.3%) and 1.85% in the control soil (Table 1).
C, N, and P are the three macroelements that are necessary for plant growth and soil quality. The content of TOC ranged from 4.70 to 47.7 g kg−1 (control 22.0 g kg−1) (Table 1). The concentration of TOC varied significantly depending on the soil sampling site. The highest concentration of TOC was at S6 (at the dried pond for ash waters). However, no significant differences in the content of TOC at S1, S2, and S5 were identified. According to Peinemann et al. [36] and Wong et al. [37], salinity adversely affects the content of organic carbon in salt-affected areas by increasing the dispersion of aggregates, which intensifies SOC mineralization, and by increasing bulk density, which restricts access to the substrate for mineralization. Saline soils contain carbonates that complicate the C dynamics and are also subjected to increased losses of SOM due to dispersion and leaching.
The content of total nitrogen varied across the sites. The highest TN was observed in the soil of S8 (4.36 g kg−1), followed by S5 (3.29 g kg−1). As compared to the control, it was 120% and 67% higher than the control (C—1.96 g kg−1). The agricultural field (S7) showed a low TN value (1.77 g kg−1) (Table 1).
The value of TOC/NT ranged from 2.5 to 58.1 (control 1.1) (Table 1). The differences of TOC/NT (Table 1) demonstrate a varied rate of mineralization of organic C and N compounds. The narrow ratio of TOC/NT in the soils (S1, S2, S3, S4, S5, S7, S8, and C) indicates a very fast decomposition of organic matter by soil microorganisms, that nitrogen is more intensively mineralized, and that high amounts of N-NH+4 are not used by the plants and gets accumulated in the ground. In the soil of S6, the value above 20 was recorded. Then, nitrogen immobilization occured. According to Lu and others [38], this might be due to the higher cation contents in the S6 soil as confirmed by Dąbkowska-Naskręt and Bartkowiak [39].
The value ECe next to the soda plant ranged from 6.87 to 204 mS cm−1 (control 4.11–5.97 mS cm−1) (Table 2). Earlier research of those soils [40] showed that ECe was increasing with depth. The highest ECe value was found at a depth of 40–60 cm. The values varied significantly depending on the soil sampling site. The value ECe S7 (agricultural field) was 66.35 mS cm−1. The estimates show that by 2050, salinity will have affected 50% of all the global arable land [41]. Most crops are sensitive to salinity [1]. Crops grown in saline soils suffer due to the high osmotic stress and disturbed nutrients’ uptake, which decreases yields. According to Munns and Tester [42], soils are saline when ECe is 4 dS m−1 or more (131), which is approximately 40 mM NaCl. The highest values (p < 0.05) were found in the soil of S1 (up to 2000 places flooded with post-soda sludge), both in spring and autumn. The value ECe in the soil was changing throughout the season. A significantly higher EC
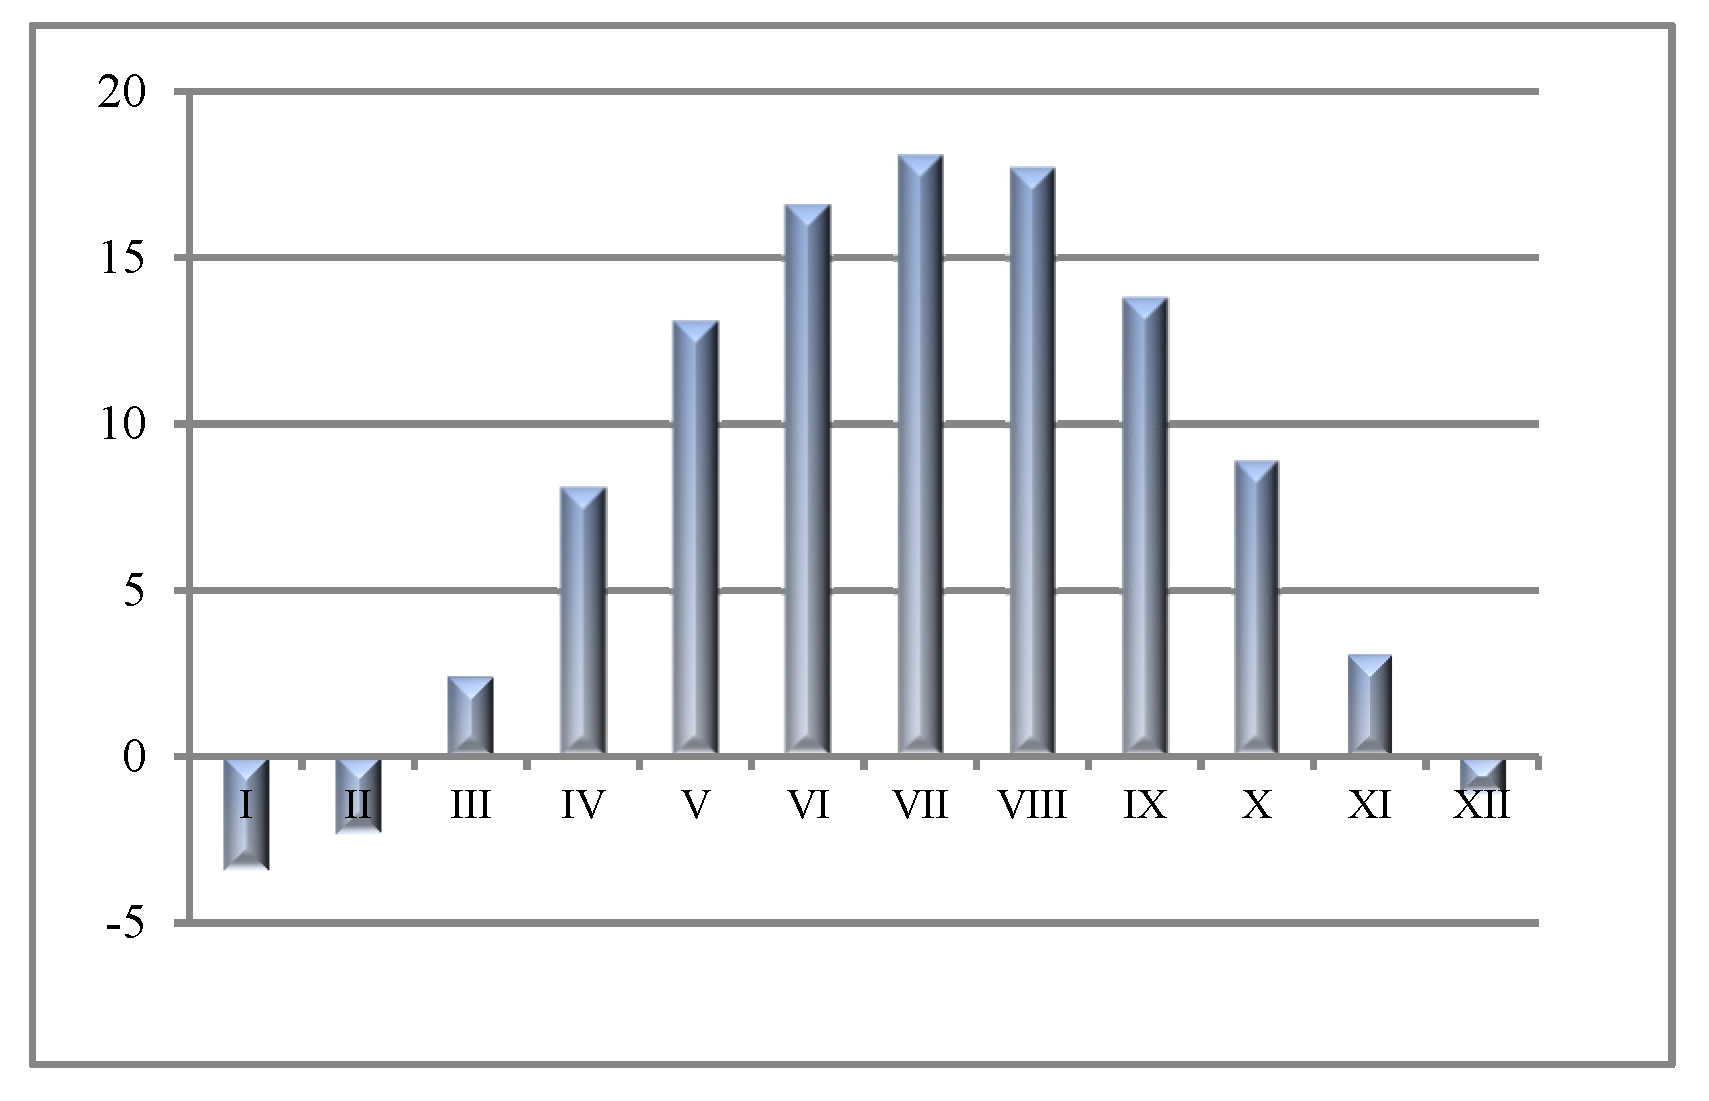
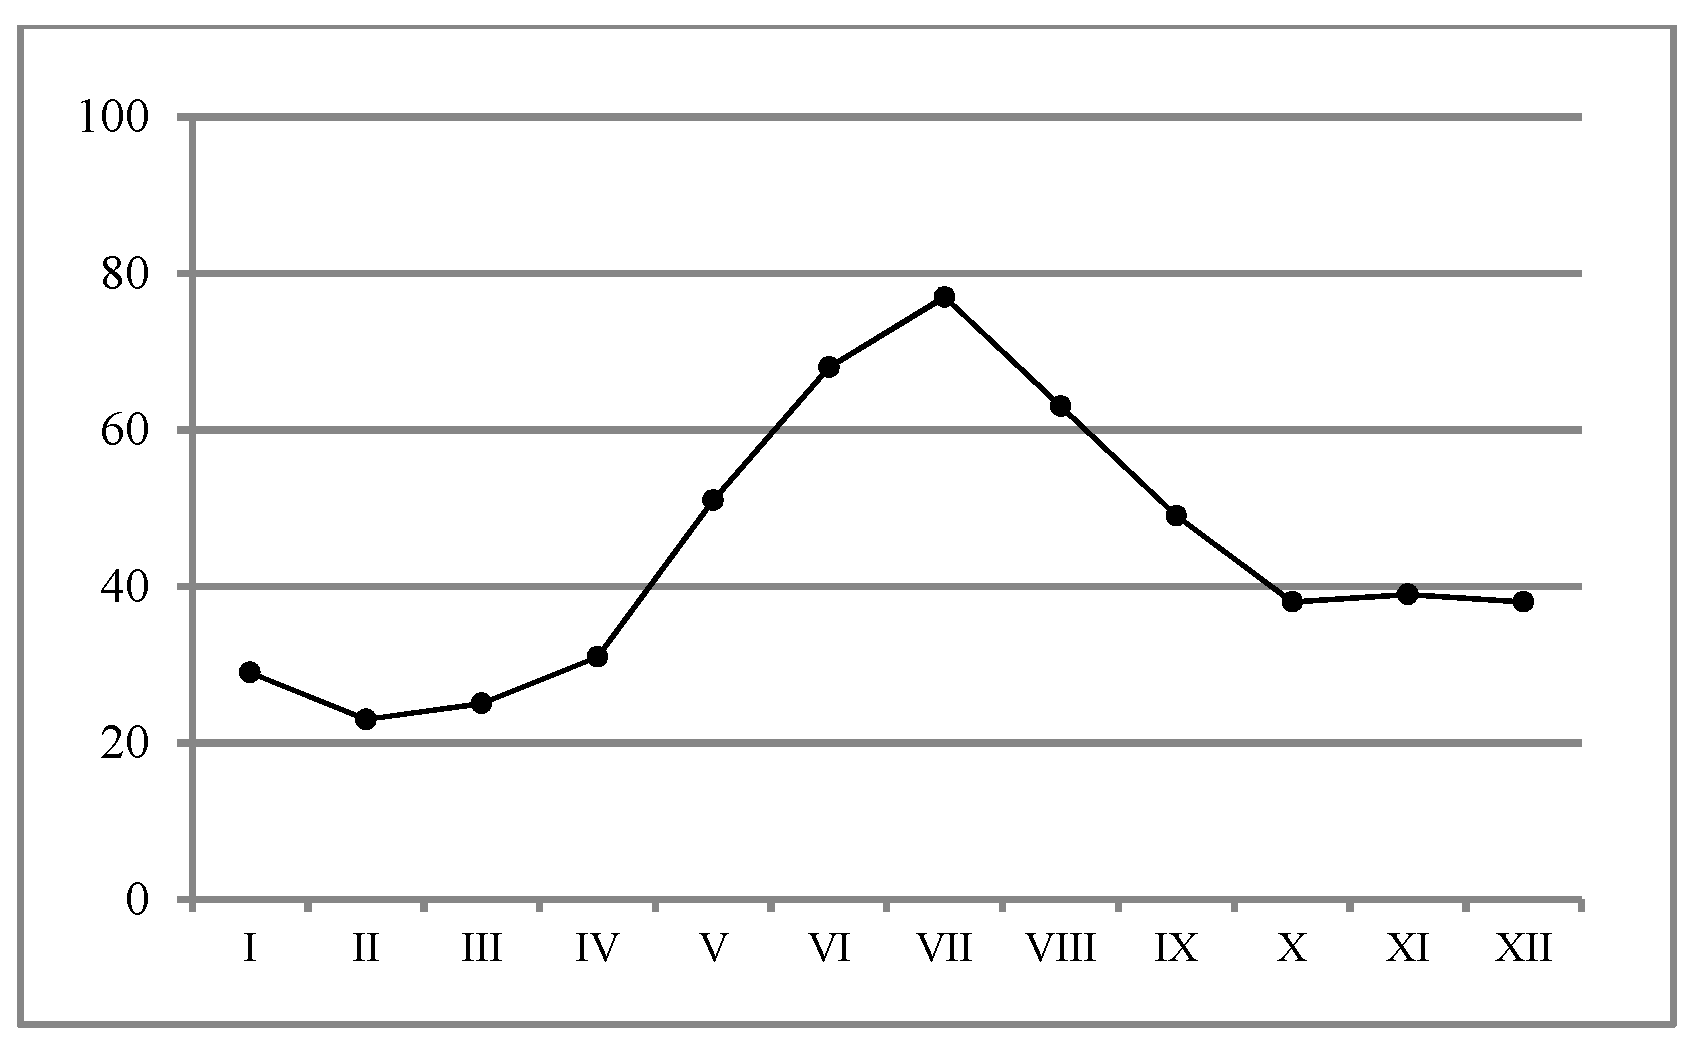
e value was recorded in spring compared to autumn. Changes in rainfall and evaporation are key factors in the content of salts in soil layers. During spring, there is less rain (April) than in autumn (October) in Inowrocław (Table 1); thus, previously available moisture evaporated, leaving the salts on the soil surface. This increases the value of ECe. Heavy rainfall can change the soil salinity (ECe) and macro and micronutrient status of the soil due to leaching.
Total exchangeable bases (TEB) in the soil were significantly modified by the soil sampling site (in spring) (Table 2). While higher TEB values were noted in the soil in autumn, there were no significant differences found in the TEB in the soils sampled from S1, S6, and S8.
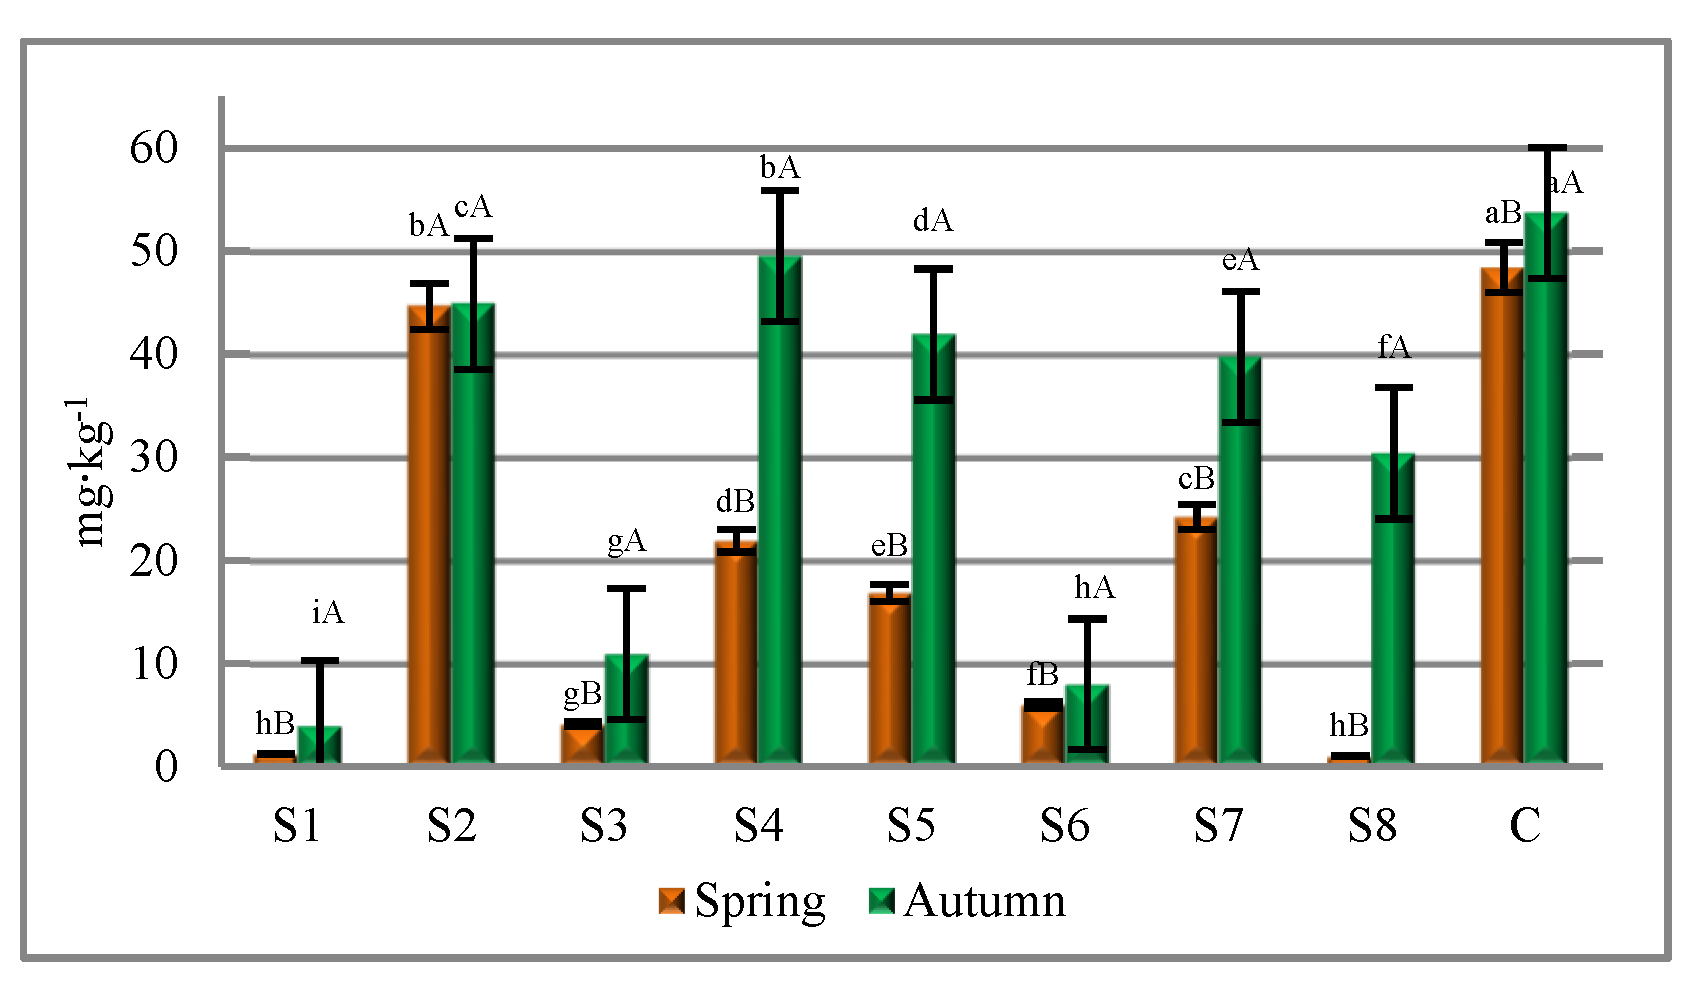
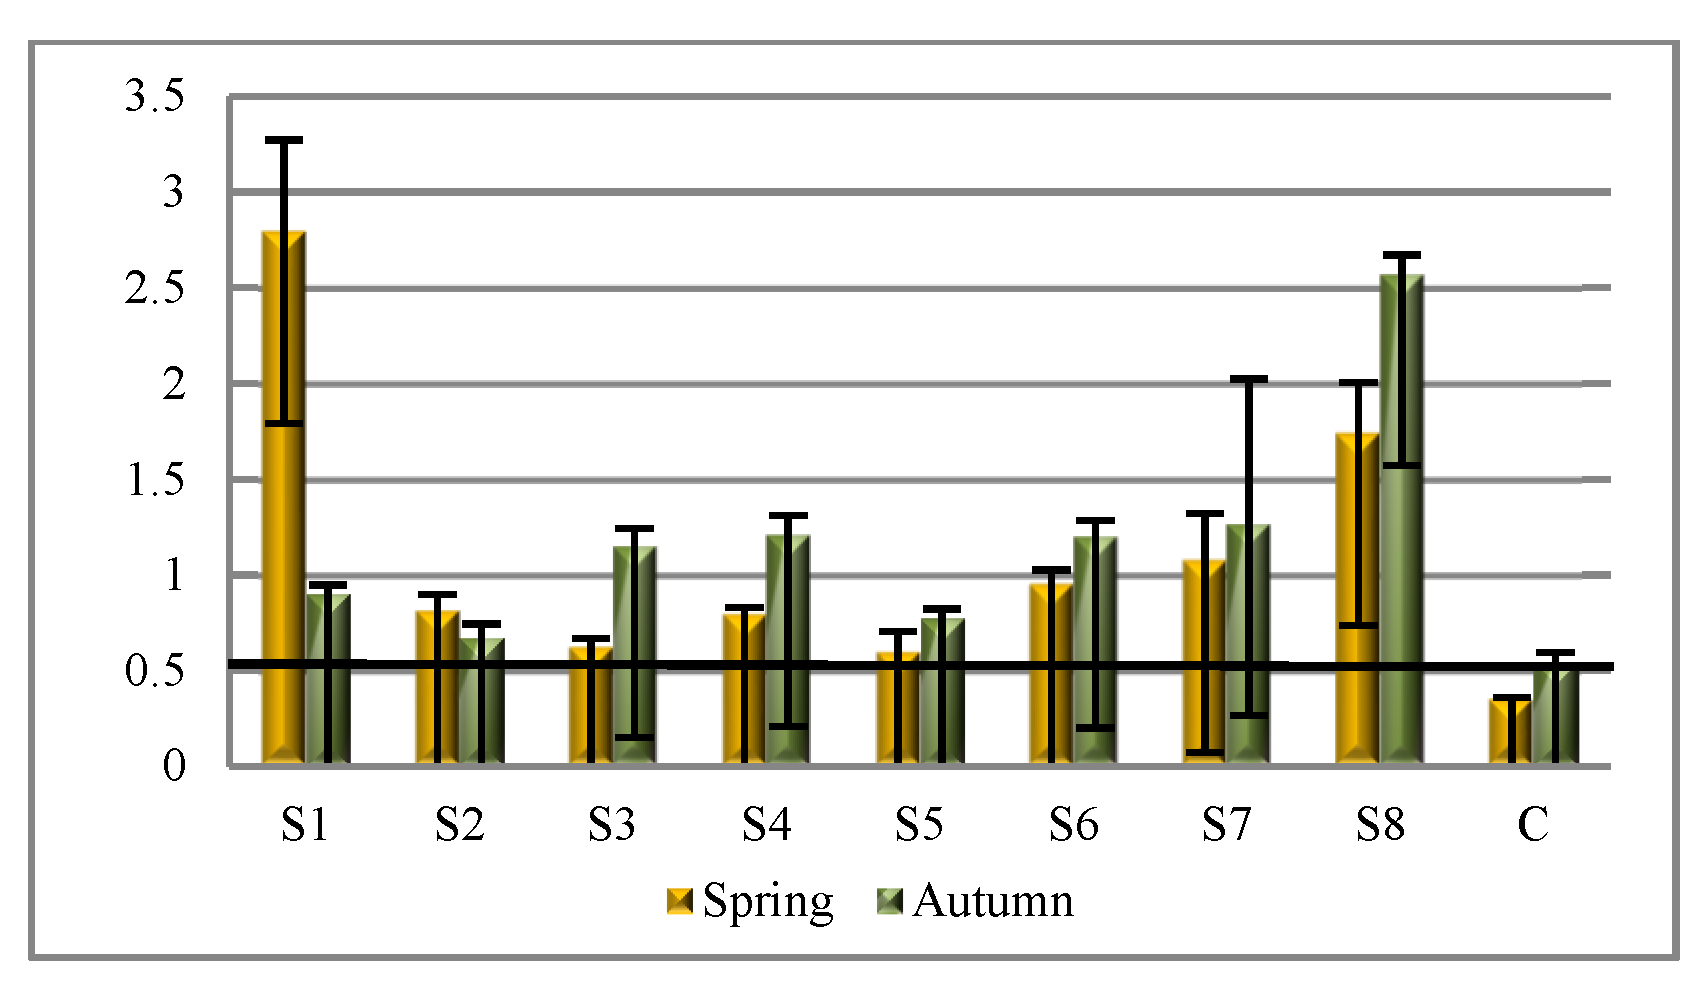
The content of AP in the soil ranged from 0.99 to 44.65 mg kg−1 (in spring) (Figure 4). In autumn, the content was significantly higher (p < 0.05) and ranged from 3.92 to 49.5 mg kg−1. The content of available phosphorus varied significantly depending on the soil sampling site. The highest accumulation was recorded for the control. In the soil within the influence of the soda plant, the AP decreased, and in the soil from the S1, S3, S6, and S8 sites (only in spring), the lowest AP content was recorded. The AP concentration was significantly negatively related to pH in KCl (r = −0.652, p = 0.0033) and ECe (r = −0.481, p = 0.0430). However, the two parameters only in 42.5% and 23.1% determined the variation in AP in the soil. The results of the investigations by Dąbkowska-Naskręt and Bartkowiak [39] in the soil near the soda plant showed that with the cations affecting salinity measured with ECe were calcium and, to a lesser extent, sodium. According to Fageria et al. [43], phosphate availability in saline soils is highly controlled by both sorption processes and the low solubility of Ca-P minerals. However, Artamonova, et al. [44] stated that in the case of salinization, the degree of Ca2+ saturation of the soil is reduced due to its replacement with Na+ and Mg2+. The toxic effect of Na+ increases in the presence of Cl, sharply reducing the absorption of N, P, and K. The regression equation shows that with an increase in pH in KCl by 1 unit, the content of P decreased, lined by 45.83 mg kg−1. According to Bano and Fatima [45], soil salinity and pH > 7.5 significantly reduces the plant P uptake as phosphate ions precipitate with Ca ions. However Pan et al. [46], Mahmood et al. [47], and Lemanowicz and Bartkowiak [20] reported that most saline soils are adequately supplied with P as the content of sodium ions may result in more soluble Na3PO4 being formed. In the soil from S7 (arable field), the content of AP was 24.2 mg kg−1 (spring) and 39.7 mg kg−1 (autumn), which classifies the soil as part of the IV (low) class of concentrations in P [48]. The soil showed higher AP contents in autumn as compared to spring. According to Lu et al. [38], the differences in seasonal nutrient changes across different sampling areas could have been due to the differences in plant uptake, soil properties, and hydrological conditions.

3.2. Soil Enzyme Activities

The enzymes’ activities at all the sites across the months are provided in Table 3. The activity of the enzymes is to the parameter specifying the quality soil (e.g., the content of organic matter and cycle of macronutrients including C, N, P, and S). Enzymes are involved in the breakdown of various types of pollutants (e.g., salinization and heavy metals). The impacts of the months and sites of the activities of soil enzymes varied. The months demonstrated the strongest effect on the activity of CAT (η2 33.54%) and AlP (η2 12.6%), and the weakest effect on the activity of AcP (η2 8.38%).
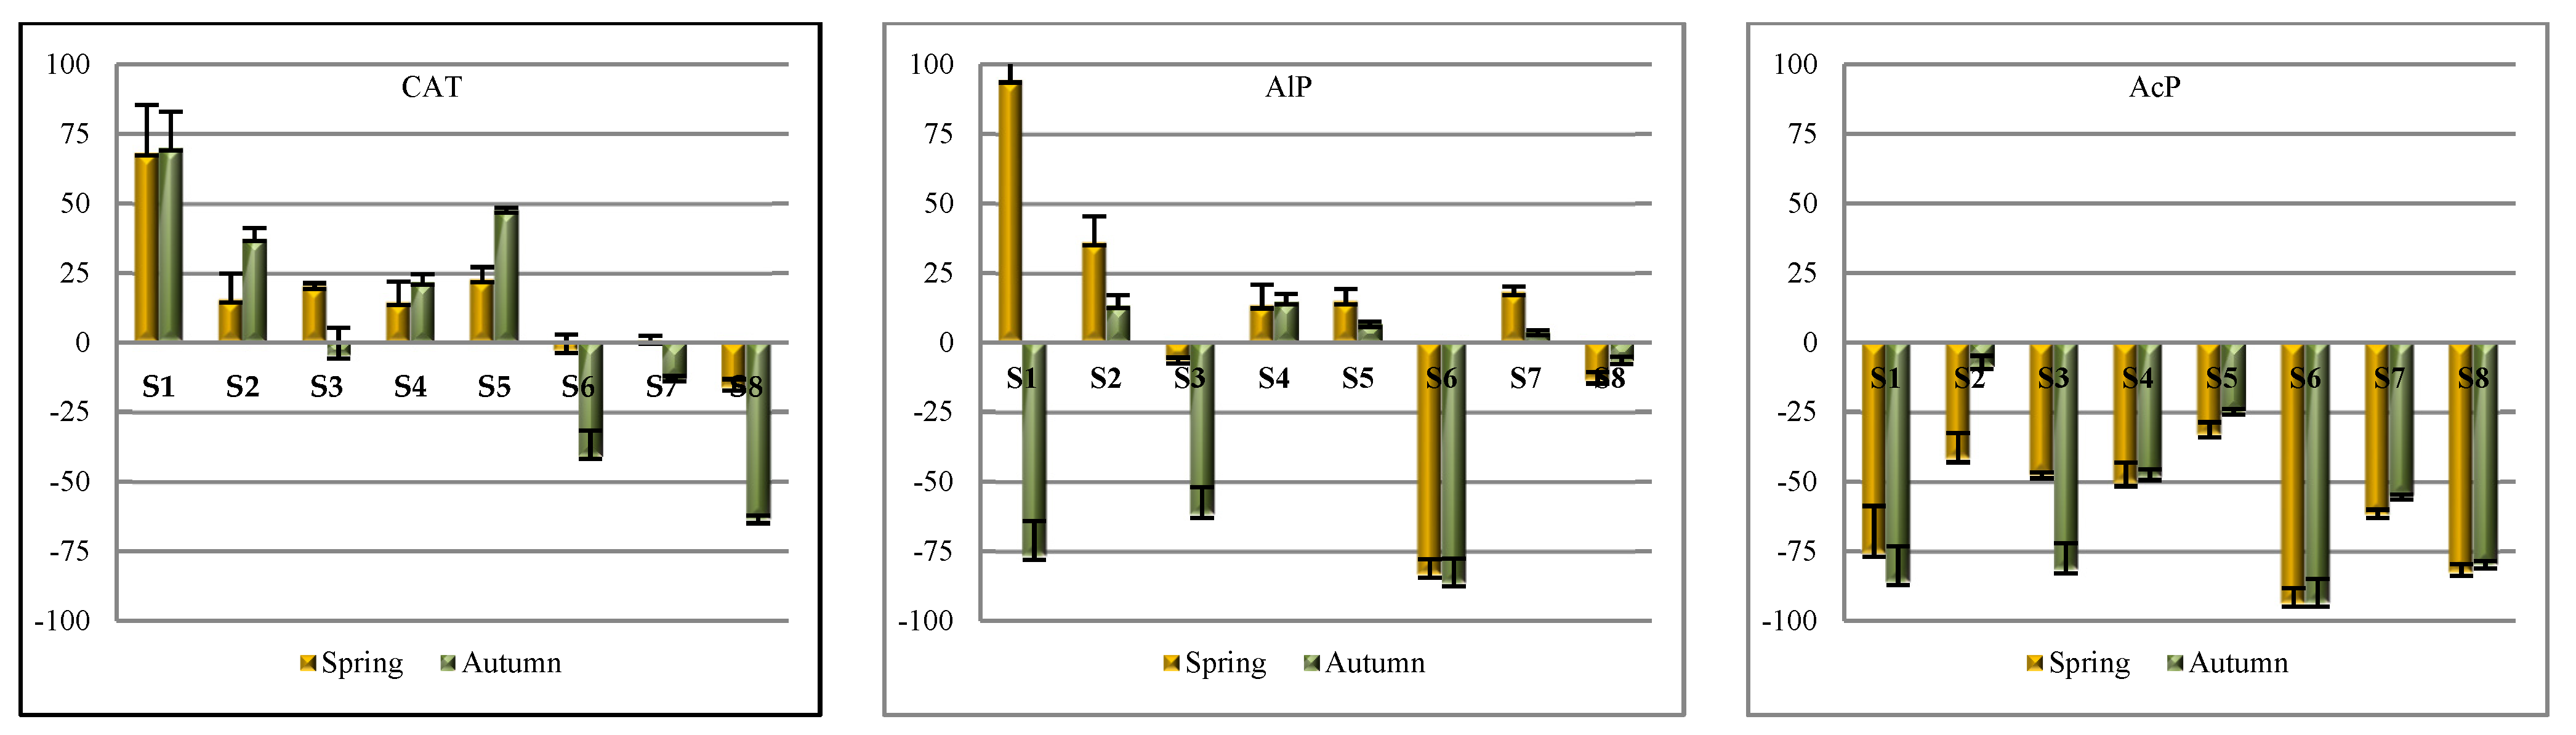
The activity of the other enzymes was higher in spring than autumn, which is also seen from the values of coefficient TI < 0 (except for the activity of AlP assayed at soil site 8) (Figure 5).
The seasonal changes in soil enzyme activity are a derivative of the hydrothermal conditions; the distribution of temperature and precipitation as the factors with the highest effect on the biological activity of soil [49]. Shao et al. [50] stated that the activity of some enzymes (urease, invertase, and alkaline phosphatase) had lower activity in winter and higher in summer. The analysis of coefficient η2 has demonstrated that the soil sampling around the soda plant accounted for the variation in the activity of enzymes (alkaline phosphatase accounted for 51%, catalase for 60%, and acid phosphatase for 75.57%) more considerably as compared to the research months (Table 3). There were no significant differences found in the activity of catalase in the soil at sites S2, S3, S4, and S5 (Table 3). The significantly highest activity of that enzyme was reported at site S1 and the lowest at site S8 (spring and autumn). The study of the RCh index of the catalase activities showed that in the soil from sites S1, S2, S3, S4, and S5, the activity increased in comparison to the control. In soil sites S6, S7, and S8, the decrease was greater, from 2.88% to 63.94% (Figure 6). The available literature shows that of all the soil enzymes, the ones most sensitive to salinization are oxidoreductases [51,52,53], especially catalase, which is also confirmed by the present study.
The ANOVA analysis indicated that alkaline phosphatase was affected by the method of use of the soil next to the soda plant (p < 0.05) (Table 4). The highest AlP activity in spring was reported in at soil site S1 (3.124 mM pNP kg−1 h−1) and in autumn (1.803 mM pNP kg−1 h−1) at soil site S4, whereas the activity of acid phosphatase was highest in the control in spring (4.645 mM pNP kg−1 h−1) and autumn (2.894 mM pNP kg−1 h−1). In the soil under the impact of the soda industry, the activity of AcP decreased as compared to the control, which is seen from the negative values of coefficient RCh (Figure 6). There were no significant differences identified (p < 0.05) in the activity of AcP across S2, S3, S4, and S5 (spring) (Table 4). The alkaline phosphatase activities did not exhibit a response to the salinity. Due to the concentration of ions Na+ and Cl in the soil solution, salting-out of enzymatic proteins occurred. This involved the reduction in enzyme solubility through dehydration, thus altering the enzyme ‘catalytic site’ and resulting in a decrease in the activity of enzymes [54]. In addition, this affects enzyme activities by denaturing proteins and decreasing their solubility. The study by Garcia-Gil, et al. [55] showed that soil salinity disperses the fraction clays, resulting in the enzymes becoming less protected and denaturated.
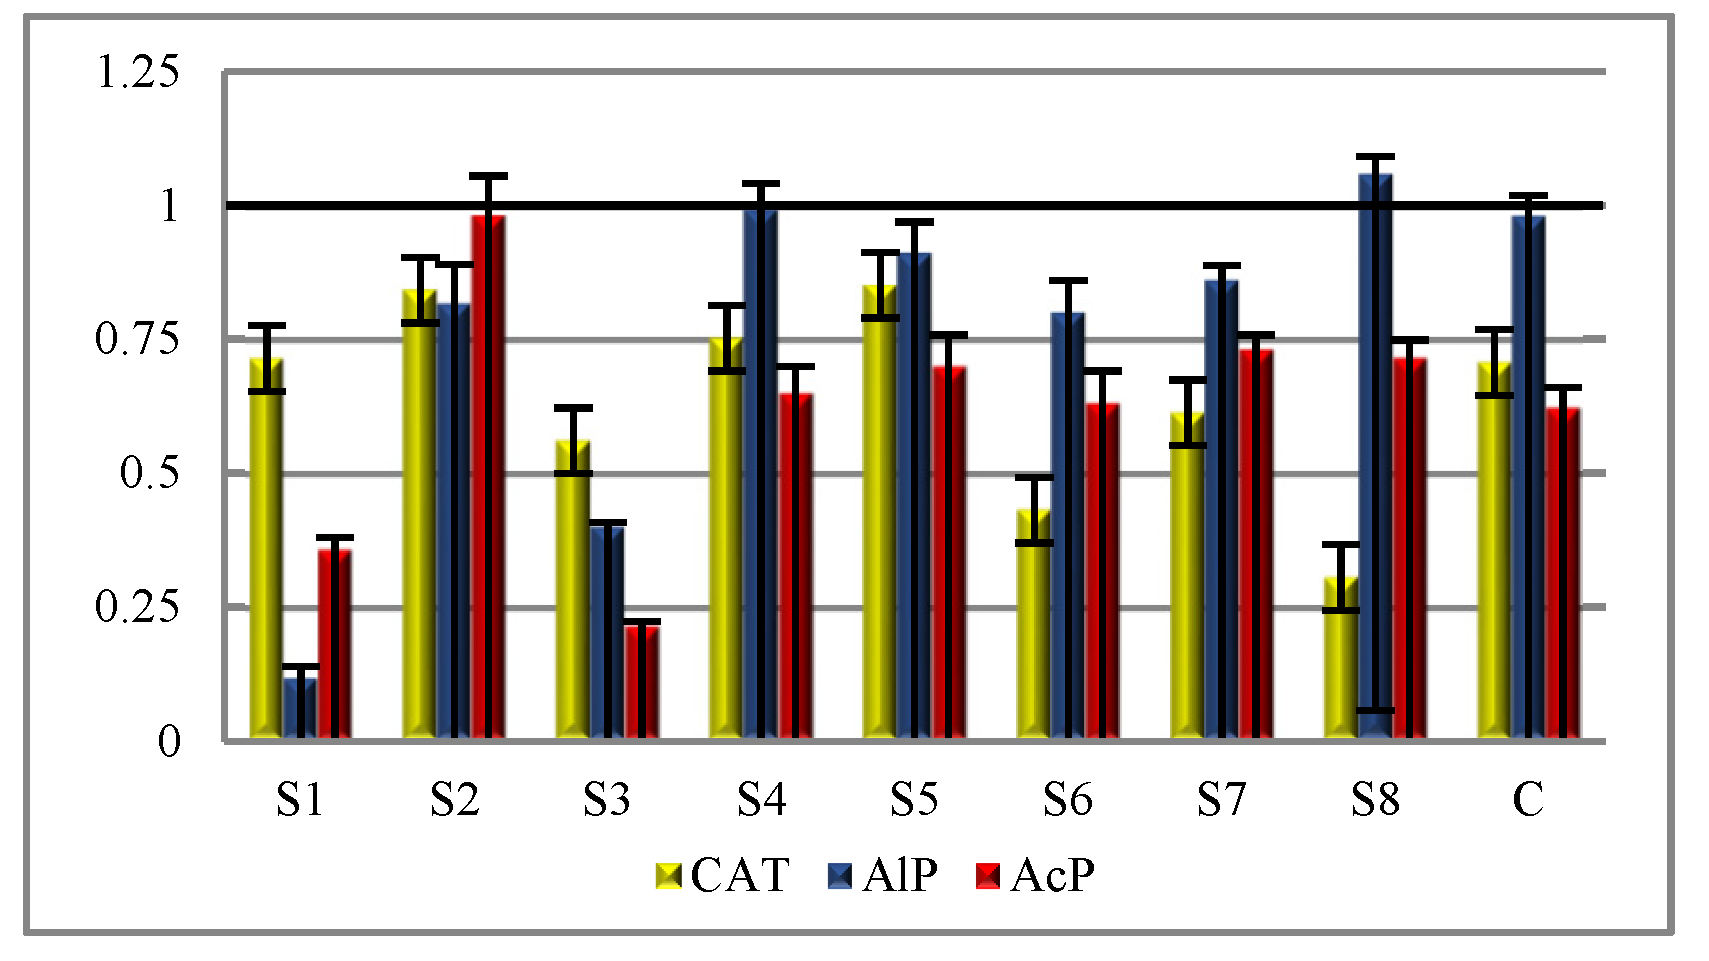
Based on the results of the activity of both phosphatases, the enzymatic pH index was calculated (Figure 7). The values at all the soil sampling sites within the impact of the soda plant exceeded the value of 0.5, above which we can consider the soil to be alkaline [31], which is confirmed by the values of pH in KCl. The highest values were recorded at S6, S7, and S8.
The resistance of saline soil is not covered in the literature. The resistance of soil and its ability to renew the balance is for important quality elements and basic indicators between the impact caused by salinization and the soil capacity for regeneration [56]. The RS values showed that the activities of enzymes varied in their sensitivity to the soil next to the soda plant. According to Orwin and Wardle [32], Borowik and others [57], and Bartkowiak et al. [53], the soil resistance factor is an effective measure of enzymatic responses to environmental stress. Higher values of index RS show that the disturbances had an inconsiderable effect (maximum resistance). The highest average RS value was noted for catalase (in spring) (RS = 0.702) and the lowest for acid phosphatase (in spring) (RS = 0.261) (Table 4). Low RS values are indicative of long-term toxic effects of salinity. The lowest values of RS for alkaline and acid phosphatase were recorded in the soil at S6. Regardless of the soil sampling site, enzyme resistance was generally lower in spring than autumn, excluding catalase, the resistance of which in spring was 29.6% higher than in autumn.
The resilience (RL) index is provided in Table 5. The study demonstrated the recovery of acid phosphatase activity (the mean RL = 0.288) and alkaline phosphatase (RL = 0.142), which was proven by the mean positive RL values. In some samples, especially for catalase, the soil resilience (RL) index was negative. According to Baćmaga et al. [58], it reflects the progressing harmful anthropogenic impact on soil biology from spring to autumn.
Statistical analysis correlation proved that the enzymes and AP in the soil were correlated with some parameters at p < 0.05 (Table 6). In our research, catalase proved to be more affectionate to soil salinization. With the analysis of the relation, there was a positive dependence found between the activity of catalase and ECe (r = 0.623, p = 0.0057), and a negative dependence with TEB (r = −0.523, p = 0.0258), while the inhibition of the activity of catalase depended on the increasing content of salt in the soil due to the introduction of sodium chloride as reported by Telesiński [52]. The activity of acid phosphatase was also negatively correlated with TEB (r = −0.497, p = 0.0355). According to Pan et al. [45], the enzyme activity related to the salinity of the soil varied depending on the type of enzyme and degree of salinization. Catalase takes part in the defense of the plants against external factors triggering oxidation stress in plants such as growing in saline soils. In saline soils, the process of protein salting-out occurs, therefore enzymes lose their biological activity. The study by Aechra et al. [59] revealed that the application of high soil salinity decreased the concentration of TP and AP, and the activity of DEH and AlP. In contrast, the study by Shirale et al. [60] demonstrated that the soils containing high amounts of Na+ hindered the microbial number under the restricted use of organic supplements, which resulted in a decrease in the activity of AcP of Mollic Gleysols.
Acid phosphatase activity was positively related with AP (r = 0.597, p = 0.0089), which indicates that the soil was more effectively organic P-mineralizing. The explanation of that phenomenon is complex because there is a probability of a long-term occurrence of soil enzymes in bonds with colloids. The activities of enzymes are correlated with soil organic matter concentration as they plays the key role as initiators for enzyme synthesis. However, in our study, the correlation between TOC and AcP was negative (r = −0.509, p = 0.0355). There was a negative correlation found between the content of CaCO3, the AlP (r = −0.595, p = 0.0092), and AcP (r = 0.527, p = 0.0244). However, according to Acosta-Martínez and Tabatabai [61], the alkaline and acid phosphatases react to lime differently because these enzymes are inductive and the intensity of their excretion by plant roots and microorganisms is determined by their requirement for orthophosphate, which is affected by soil pH. The research showed that CAT, AlP, and AcP were all positively significantly related with each other (Table 6), indicating that the enzyme activity can other the activity of another enzyme in the soil to a large extent. Another measure to evaluate the dependence of the activity of CAT, AlP, and AcP on physical and chemical soil properties is the regression equation and the R2. With the value of R2, it was found that the activity of catalase was only 38.8% dependent on ECe and 27.3% on TEB. Similarly, the activity of AcP was only 24.7% dependent on TEB and 25.9% on TOC, while about 75% can be accounted for by other soil parameters. In terms of the content of AP, only 23.1% was dependent onECe, 42.5% by pH KCl, and 37.2% by CaCO3. The regression equation shows that with an increase in pH by 1 unit, the content of AP decreased by 45.83 mg kg−1.
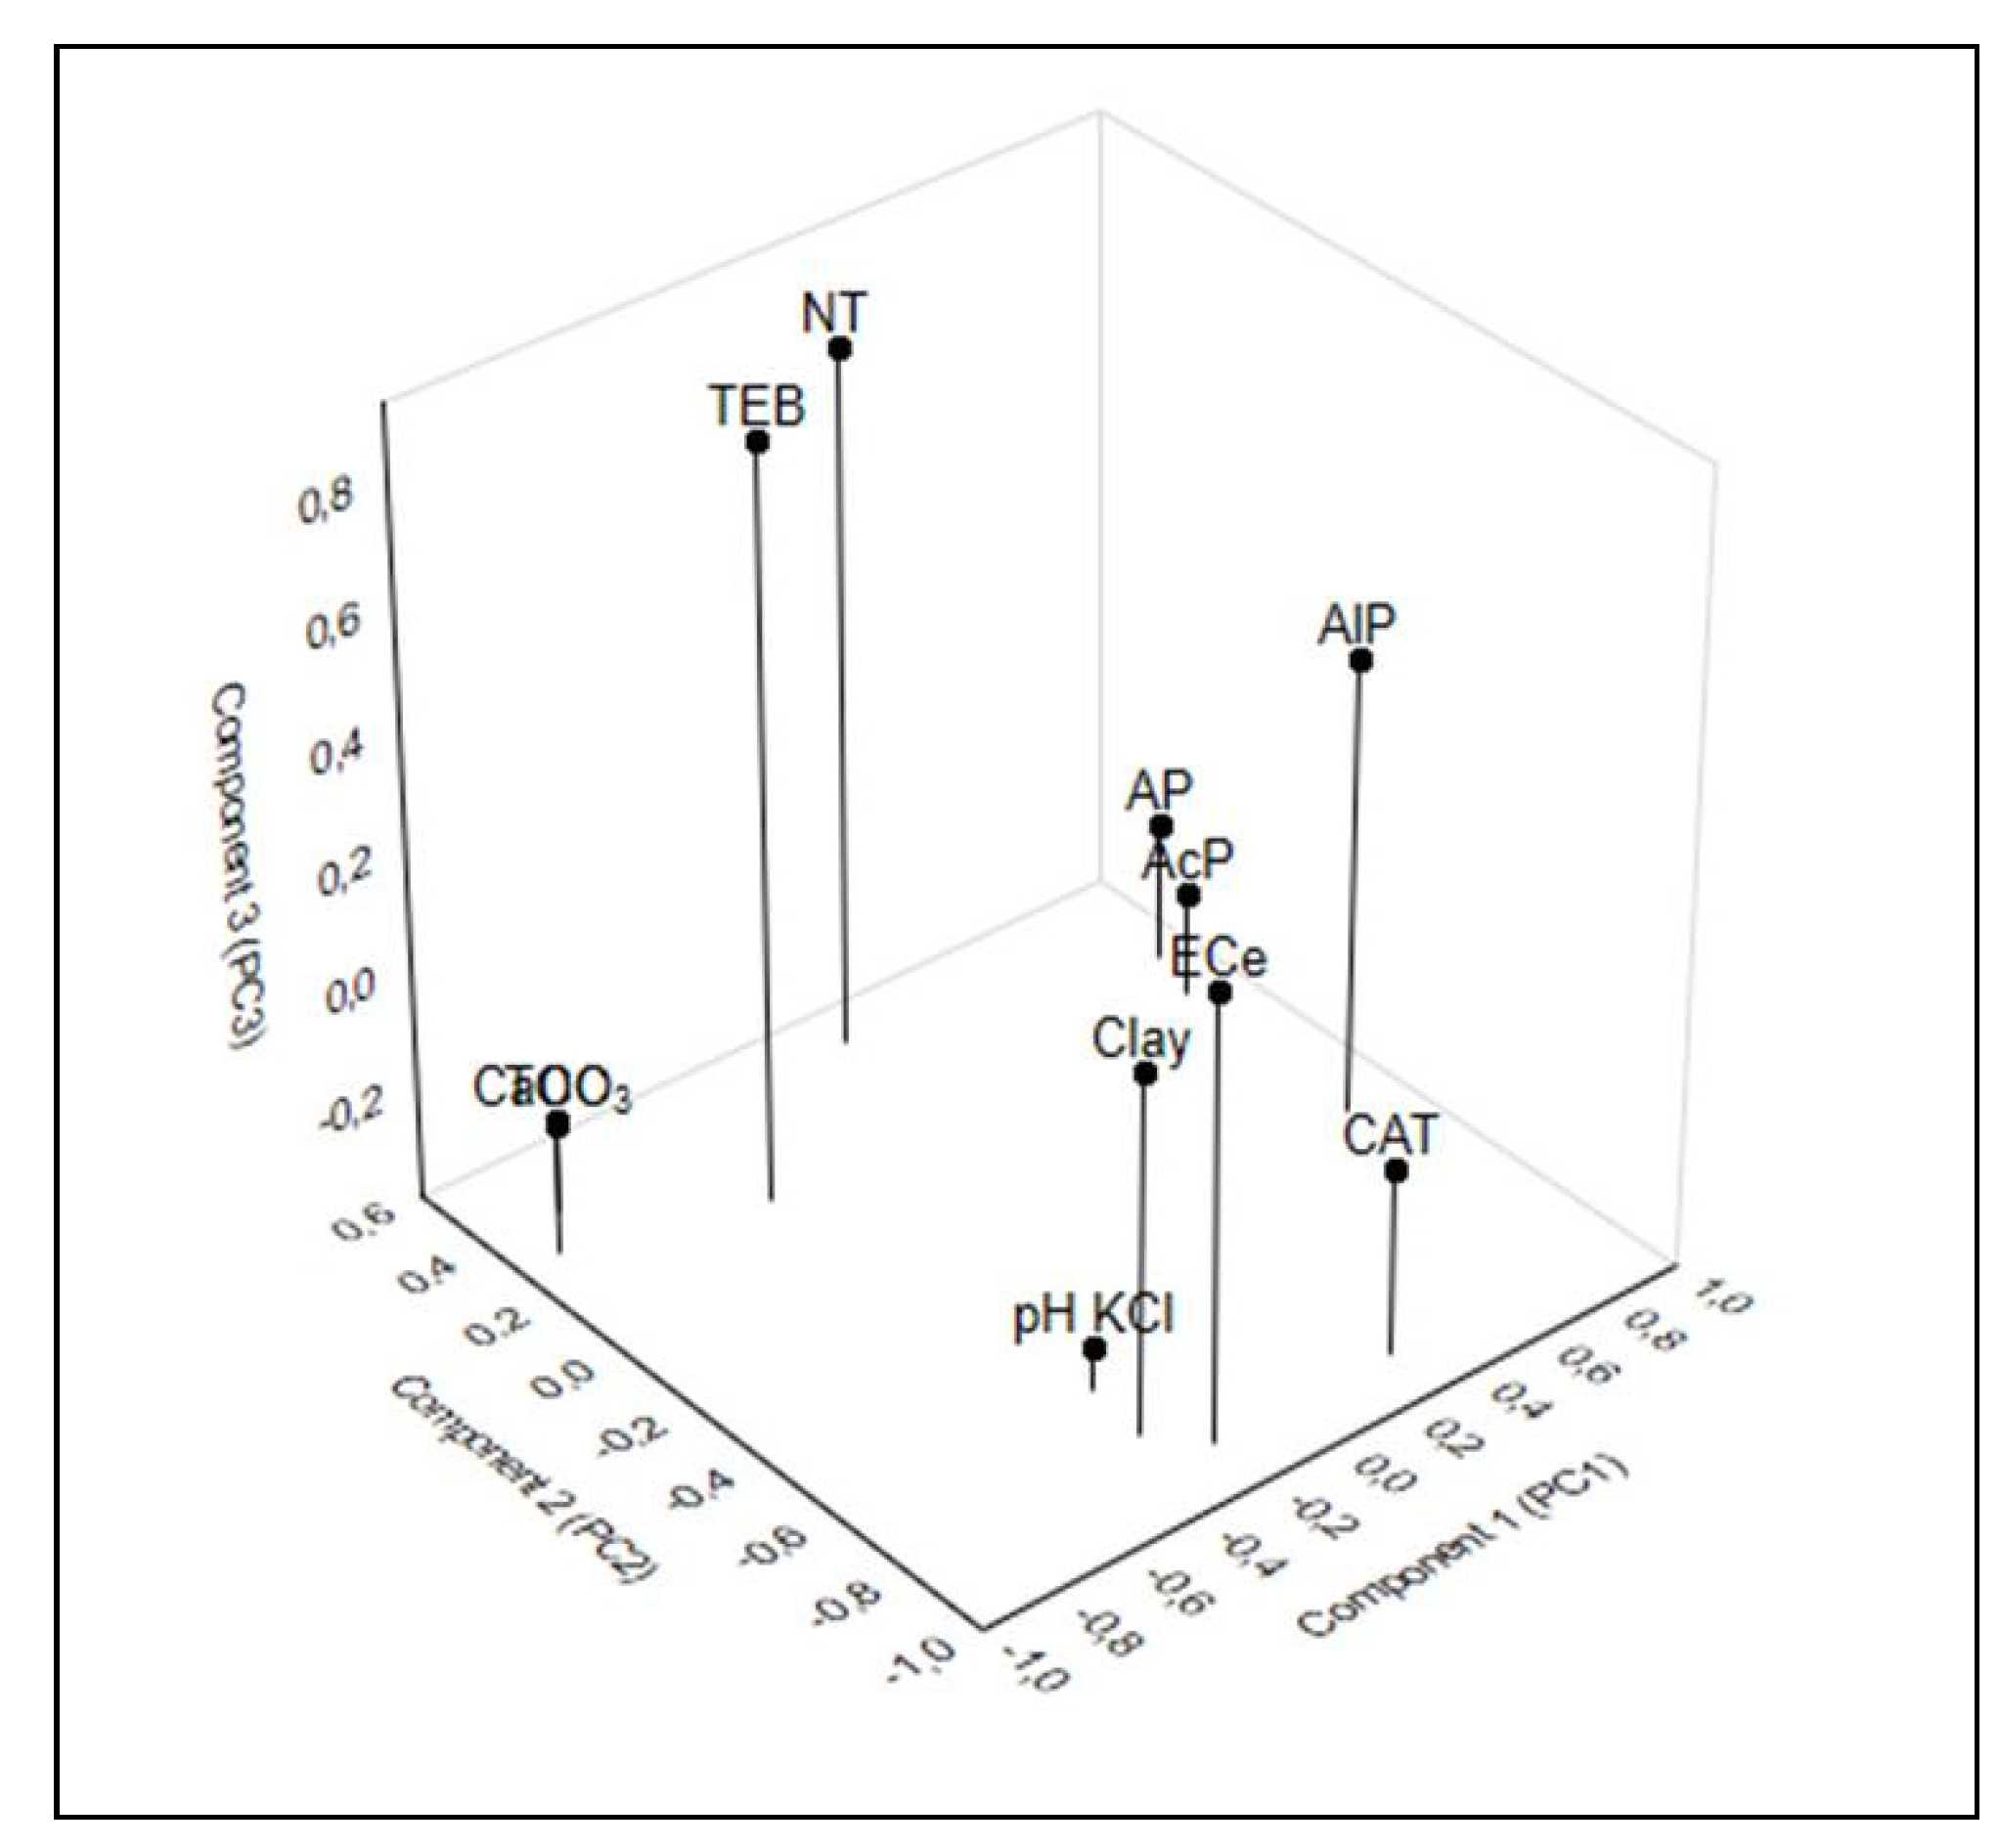
To define the nature and strength of dependencies of CAT, AlP, and AcP to the selected soil properties (grain size composition, pH in KCl, TOC, NT, AP, and TEB) and environmental variables, the principal component analysis (PCA) was applied. The drawing (Figure 8) shows that three principal hypothetical reasons of variation (PC1, PC2 and PC3) allowed to account for a total of 92.72% of the variation.
The PC1 conveys 41.37% of the information on the soil properties fitting into input variables. Most of the variance in the PC1 was negatively correlated with the content of TOC (−0.791) and CaCO3 (−0.887), and positively with the content of AP (0.901), AlP (0.833), and AcP (0.854) (Table 7). The PC2 accounts for 31.98% of the variable data. It showed a negative correlation with the activity of CAT (−0.865), ECe (−0.860), and clay (−0.758). The PC3 describes the role of NT (0.793) and TEB (0.859), and it accounts for 19.37% of the total variation (Figure 8). Research by Liu et al. [62] showed that these factors can be assumed as strong (>0.750). The use of the PCA is important in the interpretation of how the soil is used because it can identify soil-next-to-soda-industry variables that can be excluded to remove repetitive and difficult-to-measure information. PCA is found through the method for selecting more effective indexes in soil sustainability [63].
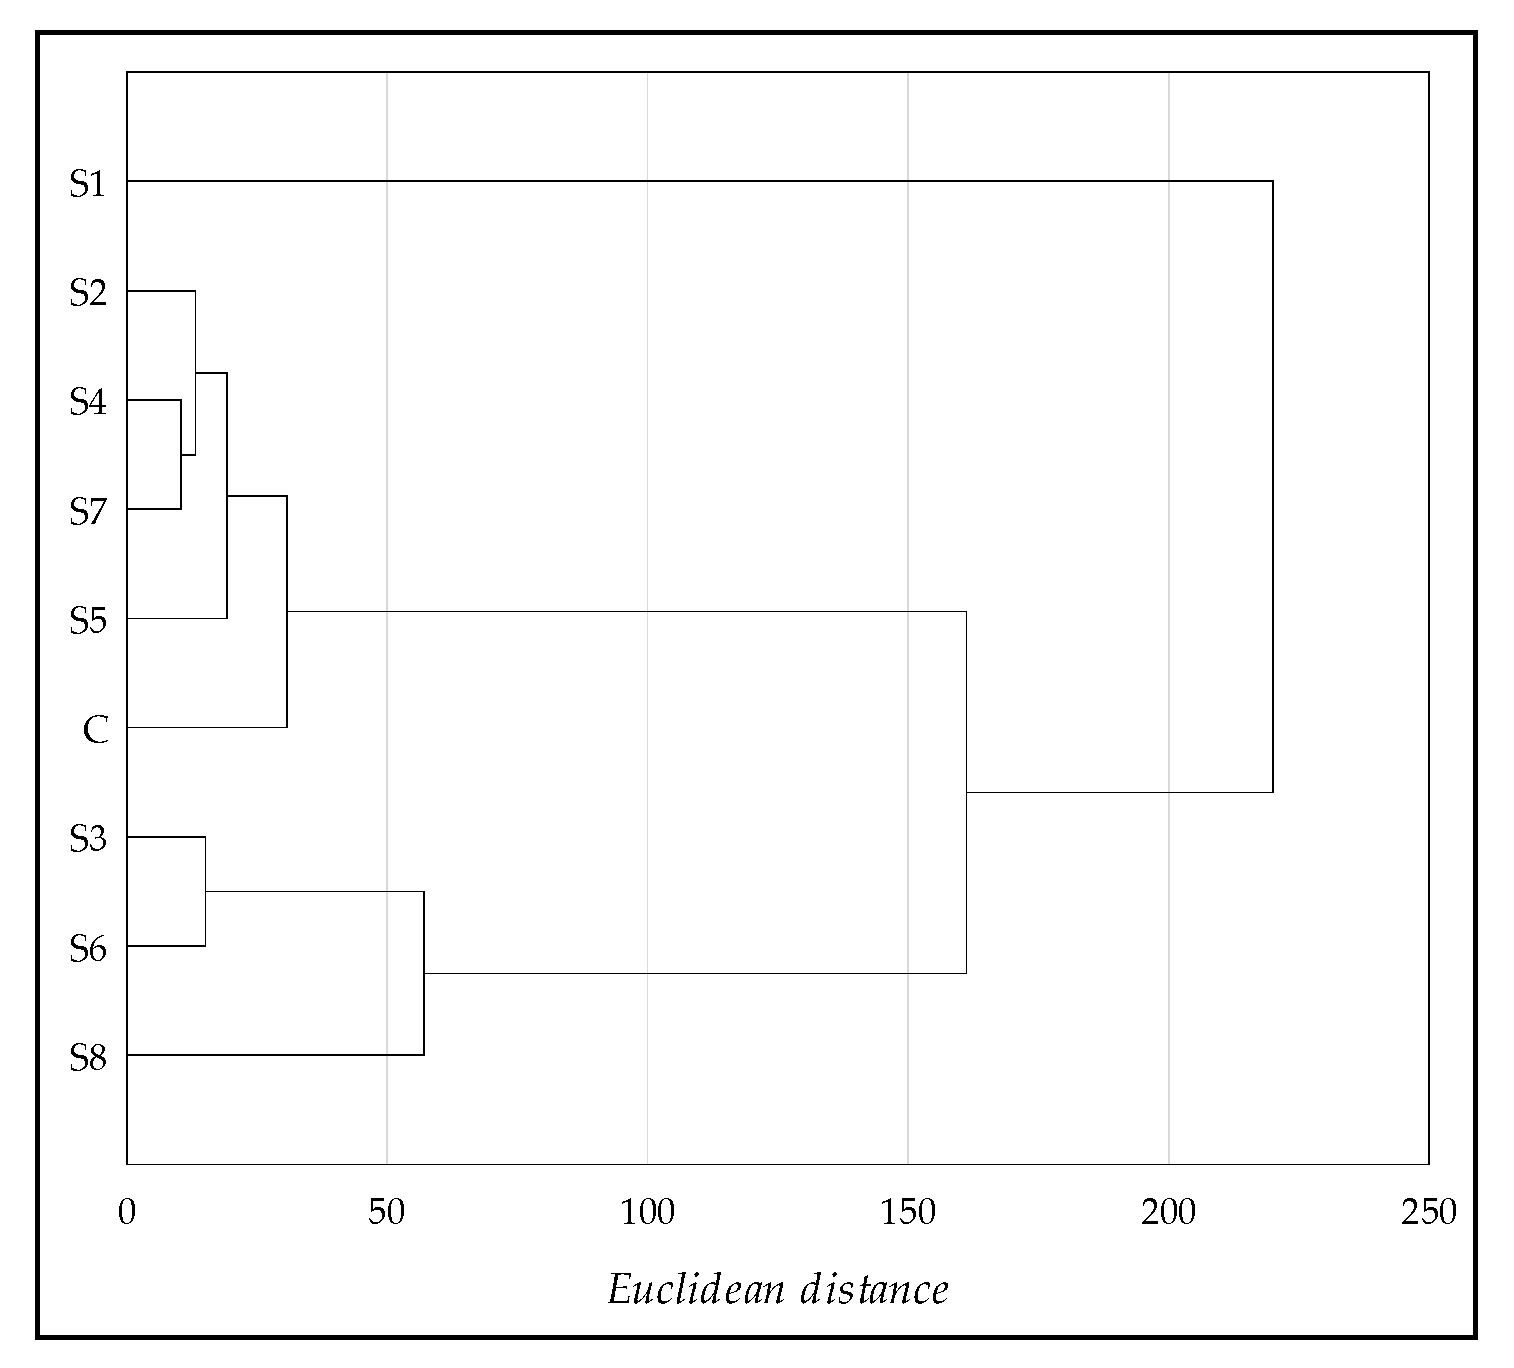
To determine the similarities across the eight sites next to the soda plant and the control, the grouping method by Ward [35] was used. Physicochemical and enzymatic soil properties were applied. The results of the cluster analysis (CA) are shown with the dendrogram in Figure 9. The grouping procedure differentiated two clusters with soils with similar properties and one outlier (S1 is the lowest phosphorus content and the highest ECe). Cluster 1 groups soils S2, S4, S5, S7, and the control (the highest phosphorus content and the lowest ECe), while cluster 2 groups soils S3, S6, and S8, which differed from the control soil in terms of the properties studied (the highest TOC, TEB, and CaCO3 content).

4. Conclusions

The seasonal dynamics of AP and the activity of AlP, AcP, and CAT were assessed in the area of sustained emissions of soda compounds. Technogenic salinization results in the formation of soils that have no natural counterparts. The presented research results have shown no one-way changes in the study parameters. The parameters differed depending on the soil sampling site. The values of coefficients RS, RL, RCh, and TI have demonstrated the direction of transformations of the enzymes depending on the anthropogenic and seasonal factors. The concentration of AP was lower in spring than autumn. Changes that occur in technogenic saline soils as a result of a constant supply of Na+ require continuous enhancement and further development of the knowledge on the activity of enzymes and P compounds in soil. This research shows that irrespective of the soil sampling locations, the mean values of RS allow us to arrange the enzymes in respect to their tolerance to the impact of anthropopression: in spring, CAT (0.702) > AlP (0.553) > AcP (0.261), and in autumn, AlP (0.553) > CAT (0.494) > AcP (0.299). The recovery of the activity (index RL), though, was demonstrated only by AcP (0.288) and AlP (0.142).
Dynamic transformation in the activity of soil enzymes are strongly related to the water content and temperature; however, they also coincide with anthropogenic activities and their consequences.
The present correlation study and multivariate analysis (CA and PCA) can help to select a few parameters that could be frequently measured to determine the status of soil and to take measures to prevent the deterioration of soil. It is important that the enzymatic activity in the salt-affected soils in this study are tested at a minimum of two consecutive years later, which may show that the soil properties have become more stable and therefore research should be continued.

Author Contributions

Conceptualization, J.L. and A.S.-Z.; data curation, J.L. and K.G.; formal analysis, J.L. and K.G; funding acquisition, J.L.; investigation, J.L.; methodology, J.L. and K.G.; project administration, J.L.; resources, J.L.; software, J.L., K.G. and A.S.-Z.; supervision, J.L., K.G. and A.S.-Z.; validation, J.L.; visualization, J.L.; writing—original draft, J.L. and K.G.; writing—review and editing, J.L. and A.S.-Z. All authors have read and agreed to the published version of the manuscript.

Funding

This research received no external funding.

Institutional Review Board Statement

Not applicable.

Informed Consent Statement

Not applicable.

Acknowledgments

This research was supported by statutory funds from the Sub-Department of Soil Science and Biochemistry, Faculty of Agriculture and Biotechnology, University of Science and Technology, Bydgoszcz, Poland.

Conflicts of Interest

The authors declare no conflict of interest.

References

  1. Shrivastava, P.; Kumar, R. Soil salinity: A serious environmental issue and plant growth promoting bacteria as one of the tools for its alleviation. Saudi J. Biol. Sci. 2015, 22, 123–131. [Google Scholar] [CrossRef] [Green Version]
  2. Hulisz, P. Proposals of systematics of polish salt-affected soils. Soil Sci. Ann. 2007, 58, 121–129. [Google Scholar]
  3. Daliakopoulos, I.; Tsanis, I.; Koutroulis, A.; Kourgialas, N.; Varouchakis, A.; Karatzas, G.P.; Ritsema, C. The threat of soil salinity: A European scale review. Sci. Total Environ. 2016, 573, 727–739. [Google Scholar] [CrossRef]
  4. Siddikee, A.; Tipayno, S.C.; Kim, K.; Chung, J.-B.; Sa, T. Influence of Varying Degree of Salinity-Sodicity Stress on Enzyme Activities and Bacterial Populations of Coastal Soils of Yellow Sea, South Korea. J. Microbiol. Biotechnol. 2011, 21, 341–346. [Google Scholar] [CrossRef]
  5. Rengasamy, P. Soil salinity and sodicity. In Growing Crops with Reclaimed Wastewater; Stevens, D., Kelly, J., McLaughlin, M., Unkovich, M., Eds.; CSIRO Publishing: Collingwood, Australia, 2006; pp. 125–138. [Google Scholar]
  6. FAO. FAO Land and Plant Nutrition Management Service. 2008. Available online: http://www.fao.org/ag/agl/agll/spush (accessed on 24 May 2010).
  7. Hulisz, P. Coastal marsh soils in Poland: Characteristics and problems of classification. Soil Sci. Ann. 2016, 67, 37–44. [Google Scholar] [CrossRef] [Green Version]
  8. Hulisz, P.; Piernik, A. Soils affected by soda industry in Inowrocław. In Technogenic Soils of Poland—Polish Society of Soil Science, Selected Aspects Research of Salt-Affected Soils in Poland; Charzyński, P., Hulisz, P., Bednarek, R., Eds.; SOP: Toruń, Poland, 2013; p. 40. [Google Scholar]
  9. Piernik, A.; Hulisz, P.; Rokicka, A. Micropattern of halophytic vegetation on technogenic soils affected by the soda industry. Soil Sci. Plant Nutr. 2015, 61, 98–112. [Google Scholar] [CrossRef] [Green Version]
  10. IUSS Working GROUP WRB. World Reference Base for Soil Resources, First Update 2007; World Soil Resources Reports No. 103; FAO: Rome, Italy, 2006; p. 132. [Google Scholar]
  11. Uzarowicz, Ł. Technogenic soils developed on mine spoils containing iron sulfides in select abandoned industrial sites: Environmental hazards and reclamation possibilities. Pol. J. Environ. Stud. 2011, 20, 771–782. [Google Scholar]
  12. IUSS Working Group WRB. World Reference Base for Soil Resources 2014, Update 2015: International Soil Classification System for Naming Soils and Creating Legends for Soil Maps; World Soil Resources Reports No. 106; FAO: Rome, Italy, 2015. [Google Scholar]
  13. Hulisz, P.; Pindral, S.; Kobierski, M.; Charzynski, P. Technogenic Layers in Organic Soils as a Result of the Impact of the Soda Industry. Eurasian Soil Sci. 2018, 51, 1133–1141. [Google Scholar] [CrossRef]
  14. Qadir, M.; Noble, A.D.; Schubert, S.; Thomas, R.J.; Arslan, A. Sodicity-induced land degradation and its sustainable management: Problems and prospects. Land Degrad. Dev. 2006, 17, 661–676. [Google Scholar] [CrossRef]
  15. Qadir, M.; Qureshi, A.S.; Cheraghi, S.A.M. Extent and characterisation of salt-affected soils in Iran and strategies for their amelioration and management. Land Degrad. Dev. 2008, 19, 214–227. [Google Scholar] [CrossRef]
  16. Qadir, M.; Oster, J.; Schubert, S.; Noble, A.; Sahrawat, K. Phytoremediation of Sodic and Saline-Sodic Soils. Adv. Agron. 2007, 197–247. [Google Scholar] [CrossRef] [Green Version]
  17. Meena, M.D.; Joshi, P.K.; Narjary, B.; Sheoran, P.; Jat, H.S.; Chinchmalatpure, A.R.; Yadav, R.K.; Sharma, D.K. Effects of municipal solid waste compost, rice-straw compost and mineral fertilisers on biological and chemical properties of a saline soil and yields in a mustard–pearl millet cropping system. Soil Res. 2016, 54, 958–969. [Google Scholar] [CrossRef]
  18. Tejada, M.; Garcia, C.; Gonzalez, J.; Hernandez, T. Use of organic amendment as a strategy for saline soil remediation: Influence on the physical, chemical and biological properties of soil. Soil Biol. Biochem. 2006, 38, 1413–1421. [Google Scholar] [CrossRef]
  19. Samuela, A.D.; Domutab, C.; Ciobanub, G.; Sandorb, M.; Ciobanub, C.; Brejeab, R. Enzymological study of the evolution of the technogenic soil submitted to biological recultivation in the Bauxite Mine from Padurea Craiului (Romania). J. Environ. Prot. Ecol. 2011, 12, 535–542. [Google Scholar]
  20. Lemanowicz, J.; Bartkowiak, A. Changes in the Activity of Phosphatase and the Content of Phosphorus in Salt-Affected Soils Grassland Habitat Natura 2000. Pol. J. Soil Sci. 2017, 49, 149. [Google Scholar] [CrossRef] [Green Version]
  21. Bartkowiak, A.; Lemanowicz, J.; Hulisz, P. Ecological risk assessment of heavy metals in salt-affected soils in the Natura 2000 area (Ciechocinek, north-central Poland). Environ. Sci. Pollut. Res. 2017, 24, 27175–27187. [Google Scholar] [CrossRef] [Green Version]
  22. Brzezińska, M. Impact of treated wastewater on biological activity and accompanying processes in organic soils. Acta Agrophys. 2006, 2, 1–164. [Google Scholar]
  23. Hulisz, P.; Krawiec, A.; Pindral, S.; Pawlikowska, K. The impact of environmental conditions on water salinity in the area of the city of Inowrocław (north-central Poland). Bull. Geogr. Phys. Geogr. Ser. 2017, 13, 5–15. [Google Scholar] [CrossRef] [Green Version]
  24. Hulisz, P. Chosen Aspects of Studies of Salt-Affected Soils in Poland; SOP: Torun, Poland, 2007; p. 40. (In Polish) [Google Scholar]
  25. ISO 10381-2:2007. Soil Quality—Sampling Part 2: Guidance on Sampling Techniques; ISO: Geneva, Switzerland, 2007. [Google Scholar]
  26. ISO 10390:2005. Soil Quality—Determination of pH; ISO: Geneva, Switzerland, 2007. [Google Scholar]
  27. Soil Survey Laboratory Methods Manual: Soil Survey Investigation Report; Natural Resources Conservation Service: Des Moines, IA, USA, 1996.
  28. Egner, H.; Riehm, H.; Domingo, W.R. Untersuchungen über die chemische Bodenanalyse als Grundlage für die Beurteilung des Nährstoffzustandes der Bőden: II. Chemische extraktionsmethoden zur Phosphor und Kalium bestimmung. K. Lantbr. Ann. 1960, 26, 46–61. [Google Scholar]
  29. Johnson, J.L.; Temple, K.L. Some Variables Affecting the Measurement of “Catalase Activity” in Soil. Soil Sci. Soc. Am. J. 1964, 28, 207–209. [Google Scholar] [CrossRef]
  30. Tabatabai, M.; Bremner, J. Use of p-nitrophenyl phosphate for assay of soil phosphatase activity. Soil Biol. Biochem. 1969, 1, 301–307. [Google Scholar] [CrossRef]
  31. Dick, W.; Cheng, L.; Wang, P. Soil acid and alkaline phosphatase activity as pH adjustment indicators. Soil Biol. Biochem. 2000, 32, 1915–1919. [Google Scholar] [CrossRef]
  32. Orwin, K.; Wardle, D. New indices for quantifying the resistance and resilience of soil biota to exogenous disturbances. Soil Biol. Biochem. 2004, 36, 1907–1912. [Google Scholar] [CrossRef]
  33. Chaer, G.; Fernandes, M.; Myrold, D.; Bottomley, P. Comparative Resistance and Resilience of Soil Microbial Communities and Enzyme Activities in Adjacent Native Forest and Agricultural Soils. Microb. Ecol. 2009, 58, 414–424. [Google Scholar] [CrossRef]
  34. Lemanowicz, J.; Krzyżaniak, M. Vertical distribution of phosphorus concentrations, phosphatase activity and further soil chemical properties in salt-affected Mollic Gleysols in Poland. Environ. Earth Sci. 2015, 74, 2719–2728. [Google Scholar] [CrossRef] [Green Version]
  35. Ward, J.H. Hierarchical Grouping to Optimize an Objective Function. J. Am. Stat. Assoc. 1963, 58, 236–244. [Google Scholar] [CrossRef]
  36. Peinemann, N.; Guggenberger, G.; Zech, W. Soil organic matter and its lignin component in surface horizons of salt-affected soils of the Argentinian Pampa. Catena 2005, 60, 113–128. [Google Scholar] [CrossRef]
  37. Wong, V.N.; Greene, R.S.B.; Dalal, R.; Murphy, B.W. Soil carbon dynamics in saline and sodic soils: A review. Soil Use Manag. 2009, 26, 2–11. [Google Scholar] [CrossRef]
  38. Lu, Q.; Bai, J.; Zhang, G.; Zhao, Q.; Wu, J. Spatial and seasonal distribution of carbon, nitrogen, phosphorus, and sulfur and their ecological stoichiometry in wetland soils along a water and salt gradient in the Yellow River Delta, China. Phys. Chem. Earth 2018, 104, 9–17. [Google Scholar] [CrossRef]
  39. Bartkowiak, A.; Dąbkowska-Naskręt, H. Magnesium status in soils under the impact of the soda industry. J. Elementol. 1970, 23, 299–308. [Google Scholar] [CrossRef]
  40. Lemanowicz, J.; Siwik-Ziomek, A.; Koper, J. Enzymatic variation of soils exposed to the impact of the soda plant in terms of biochemical parameters. Int. J. Environ. Sci. Technol. 2018, 16, 3309–3316. [Google Scholar] [CrossRef] [Green Version]
  41. Butcher, K.; Wick, A.F.; DeSutter, T.; Chatterjee, A.; Harmon, J. Soil Salinity: A Threat to Global Food Security. Agron. J. 2016, 108, 2189–2200. [Google Scholar] [CrossRef]
  42. Munns, R.; Tester, M. Mechanisms of Salinity Tolerance. Annu. Rev. Plant Biol. 2008, 59, 651–681. [Google Scholar] [CrossRef] [PubMed] [Green Version]
  43. Fageria, N.K.; Gheyi, H.R.; Moreira, A. Nutrient bioavailability in salt affected soils. J. Plant Nutr. 2011, 34, 945–962. [Google Scholar] [CrossRef]
  44. Artamonova, V.S.; Dits, L.Y.; Elizarova, T.N.; Lyutykh, I.V. Technogenic salinization of soils and their microbiological characterization. Contemp. Probl. Ecol. 2010, 3, 323–330. [Google Scholar] [CrossRef]
  45. Bano, A.; Fatima, M. Salt tolerance in Zea mays (L). following inoculation with Rhizobium and Pseudomonas. Biol. Fertil. Soils 2009, 45, 405–413. [Google Scholar] [CrossRef]
  46. Pan, C.; Liu, C.; Zhao, H.; Wang, Y. Changes of soil physico-chemical properties and enzyme activities in relation to grassland salinization. Eur. J. Soil Biol. 2013, 55, 13–19. [Google Scholar] [CrossRef]
  47. Mahmood, I.A.; Ali, A.; Aslam, M.; Shahzad, A.; Sultan, T.; Hussain, F. Phosphorus availability in different salt-affected soils as influenced by crop residue incorporation. Int. J. Agric. Biol. 2013, 15, 472–478. [Google Scholar]
  48. PN-R-04023, Chemical and Agricultural Analysis—Determination of the Content Available Phosphorus in Mineral Soils; Polish Standards Committee: Warszawa, Poland, 1996.
  49. Criquet, S.; Ferre, E.; Farnet, A.; Le Petit, J. Annual dynamics of phosphatase activities in an evergreen oak litter: Influence of biotic and abiotic factors. Soil Biol. Biochem. 2004, 36, 1111–1118. [Google Scholar] [CrossRef]
  50. Shao, X.; Yang, W.; Wu, M. Seasonal Dynamics of Soil Labile Organic Carbon and Enzyme Activities in Relation to Vegetation Types in Hangzhou Bay Tidal Flat Wetland. PLoS ONE 2015, 10, e0142677. [Google Scholar] [CrossRef] [Green Version]
  51. Shi, W.; Cheng, M.; Li, C.; Ma, G. Effect of Cl- on behavior of fertilizer nitrogen, number of microorganisms and enzyme activities in soils. Pedosphere 1994, 4, 357–364. [Google Scholar]
  52. Telesiński, A. The effect of salinity on some biochemical indices of soil fertility. Water Environ. Rural Areas 2012, 12, 209–217. [Google Scholar]
  53. Bartkowiak, A.; Lemanowicz, J.; Breza-Boruta, B. Evaluation of the content of Zn, Cu, Ni and Pb as well as the enzymatic activity of forest soils exposed to the effect of road traffic pollution. Environ. Sci. Pollut. Res. 2017, 24, 23893–23902. [Google Scholar] [CrossRef] [PubMed] [Green Version]
  54. Ouni, Y.; Lakhdar, A.; Scelza, R.; Scotti, R.; Abdelly, C.; Barhoumi, Z.; Rao, M. Effects of two composts and two grasses on microbial biomass and biological activity in a salt-affected soil. Ecol. Eng. 2013, 60, 363–369. [Google Scholar] [CrossRef]
  55. García-Gil, J.; Plaza, C.; Soler-Rovira, P.; Polo, A. Long-term effects of municipal solid waste compost application on soil enzyme activities and microbial biomass. Soil Biol. Biochem. 2000, 32, 1907–1913. [Google Scholar] [CrossRef]
  56. Lipińska, A.; Kucharski, J.; Wyszkowska, J. Activity of arylsulphatase in soil contaminated with polycyclic aromatic hydrocarbons. Water Air Soil Pollut. 2014, 225, 2097. [Google Scholar] [CrossRef] [Green Version]
  57. Borowik, A.; Wyszkowska, J.; Wyszkowski, M. Resistance of aerobic microorganisms and soil enzyme response to soil contamination with Ekodiesel Ultra fuel. Environ. Sci. Pollut. Res. 2017, 24, 24346–24363. [Google Scholar] [CrossRef] [Green Version]
  58. Baćmaga, M.; Kucharski, J.; Wyszkowska, J. Microbial and enzymatic activity of soil contaminated with azoxystrobin. Environ. Monit. Assess. 2015, 187, 615. [Google Scholar] [CrossRef] [PubMed]
  59. Aechra, S.; Yadav, B.L.; Ghosalya, B.; Bamboriya, J.S. Effect of soil salinity, phosphorus and biofertilizers on physical properties of soil, yield attributes and yield of cowpea [Vigna unguiculata (L.) Wilczek]. J. Pharmacogn. Phytochem. 2017, 6, 1691–1695. [Google Scholar]
  60. Shirale, A.O.; Kharche, V.K.; Zadode, R.S.; Meena, B.P.; Rajendiran, S. Soil biological properties and carbon dynamics subsequent to organic amendments addition in sodic black soils. Arch. Agron. Soil Sci. 2017, 63, 2023–2034. [Google Scholar] [CrossRef]
  61. Acosta-Martínez, V.; Tabatabai, M.A. Enzyme activities in a limed agricultural soil. Biol. Fertil. Soils 2000, 31, 85–91. [Google Scholar] [CrossRef]
  62. Liu, C.-W.; Lin, K.-H.; Kuo, Y.-M. Application of factor analysis in the assessment of groundwater quality in a blackfoot disease area in Taiwan. Sci. Total Environ. 2003, 313, 77–89. [Google Scholar] [CrossRef]
  63. Ghaemi, M.; Astaraei, A.R.; Emami, H.; Mahalati, M.N.; Sanaeinejad, S. Determining soil indicators for soil sustainability assessment using principal component analysis of astan quds- east of mashhad- Iran. J. Soil Sci. Plant Nutr. 2014, 14, 987–1004. [Google Scholar] [CrossRef] [Green Version]
Figure 1. Average monthly temperature (°C) for Inowrocław.
Energies 14 04882 g001
Figure 2. Average monthly precipitation (mm) for Inowrocław.
Energies 14 04882 g002
Figure 3. Location of the study area. S1: up to year 2000 places flooded with post-soda sludge to be reclaimed with secondary succession; S2: flooded with post-soda sludge and with a deficiency of natural succession; S3: the places around the clarifying–cooling “pond”, in which carbonates get precipitated as waste; S4 and S5: where technical and agrotechnical reclamation was completed; S6: at the dried pond for ash waters; S7: an agricultural field in the distance of 500 m from the soda factory; S8: the places in the vicinity of the city waste dumping sites, sewage treatment plant, and soda plant (with numerous communities of halophytes, mainly with Salicornia europaea); and C: the control site.
Energies 14 04882 g003
Figure 4. The content of the available phosphorus (AP) in the soil. Values followed by the same small or capital letter within each bar of the graph are not significantly different at p < 0.05. Different small letters indicate a comparison between sites and different capital letters indicate a comparison between months.
Energies 14 04882 g004
Figure 5. Index of changes in time (TI) for catalase (CAT), alkaline (AlP), and acid (AcP) phosphatase.
Energies 14 04882 g005
Figure 6. Mean relative changes (RCh) [%] of catalase (CAT), alkaline (AlP), and acid (AcP) phosphates activities in the soil.
Energies 14 04882 g006
Figure 7. Enzymatic pH index AlP / AcP in the soil.
Energies 14 04882 g007
Figure 8. PCA plotted in the three-dimensional space for the studied properties in the soil.
Energies 14 04882 g008
Figure 9. Dendrogram of cluster analysis among physical and chemical parameters and the activity of enzymes in the soil.
Energies 14 04882 g009
Table 1. The content of clay, pH in KCl, and CaCO3, and the total organic carbon (TOC), total nitrogen (TN), and TOC/TN values.
SitesClay %pH KClCaCO3 %TOCTNTOC/TN
g kg−1
S114.8 a ± 0.6367.9 a ± 0.0577.31 e ± 0.0288.21 de ± 0.7851.19 f ± 0.076.8 b ± 0.150
S24.22 d ± 0.0927.8 a ± 0.0425.55 f ± 0.0426.70 e ± 0.3961.27 f ± 0.0145.2 bc ± 0.071
S37.93 b ± 0.0287.6 b ± 0.17048.3 a ± 0.0715.80 ef ± 2.1922.03 cd ± 0.0072.90 c ± 0.566
S47.86 b ± 0.0077.7 a ± 0.0148.73 g ± 0.01410.5 d ± 0.4242.83 c ± 0.0143.7 c ± 0.071
S55.63 d ± 0.0287.7 a ± 0.0016.77 e ± 0.0498.10 e ± 0.5663.29 b ± 0.0352.5 c ± 0.035
S67.36 bc ± 0.0357.9 a ± 0.01439.7 b ± 0.49547.7 a ± 1.0610.820 g ± 0.00758.1 a ± 0.141
S74.86 d ± 0.0077.7 a ± 0.0283.88 g ± 0.0214.70 f ± 0.0641.77 e ± 0.0282.6 c ± 0.071
S86.62 c ± 0.0497.9 a ± 0.04325.1 c ± 0.35430.2 b ± 0.4954.36 a ± 0.0356.9 b ± 0.014
C8.18 b ± 0.0487.1 c ± 0.0551.85 h ± 0.02822.0 c ± 0.9901.96 d ± 0.0071.1 c ± 0.015
Arithmetic mean is values ± standard deviation (SD). Values followed by the same letter are not significantly different at p < 0.05. Different small letters indicate a comparison between sites.
Table 2. The content of the electrical conductivity (ECe) and total exchangeable bases (TEB).
SitesECe mS cm−1TEB mmol(+) kg−1
SpringAutumnSpringAutumn
S1204 aA ± 3.536183 aB ± 0.46121.9 bB ± 0.70749.6 aA ± 0.071
S258 fA ± 0.70755.3 cA ± 0.4108.99 gB ± 0.29749.7 aA ± 0.071
S3109 bA ± 2.82812.9 eB ± 0.62113.26 eB ± 0.19149.3 aA ± 0.071
S4110 bA ± 1.4147.98 fB ± 0.31115.2 dB ± 0.49549.8 aA ± 0.071
S578.25 dA ± 0.8848.64 fB ± 0.33911.34 fB ± 0.26249.7 aA ± 0.071
S6101 cA ± 1.4046.87 fB ± 0.35711.27 fB ± 0.00749.8 aA ± 0.071
S766.35 eA ± 0.31842.1 dB ± 0.16117.43 cB ± 0.34641.1 bA ± 0.071
S814.89 gB ± 0.57395.7 bA ± 0.56370.08 aA ± 0.36149.7 aB ± 0.005
C5.97 hA ± 0.0144.11 gA ± 0.02515.85 dB ± 0.52331.8 cA ± 0.636
η2 [%]
months9.7149.2
sites67.627.27
Values followed by the same small letter within each column are not significantly different at p < 0.05. Values followed by the same capital letter within each line are not significantly different at p < 0.05. Different small letters indicate a comparison between sites. Different capital letters indicate a comparison between months.
Table 3. The activity of the catalase (CAT) [mg H2O2 kg−1 h−1], alkaline (AlP), and acid (AcP) phosphatase [mM pNP kg−1 h−1] in the soil.
SitesCATAlPAcP
SpringAutumnSpringAutumnSpringAutumn
S10.350 aA ± 0.0160.250 aB ± 0.0143.124 aA ± 0.0030.360 eB ± 0.0141.119 cdA ± 0.0050.399 gB ± 0.001
S20.240 bA ± 0.0040.202 bB ± 0.0042.184 bA ± 0.0491.782 aB ± 0.0172.699 bA ± 0.0062.647 bA ± 0.030
S30.250 bA ± 0.0060.140 cB ± 0.0061.500 fA ± 0.0210.597 dB ± 0.0062.432 bcA ± 0.0080.519 fB ± 0.008
S40.238 bA ± 0.0050.179 bB ± 0.0061.819 dA ± 0.0111.803 aA ± 0.0102.299 bcA ± 0.0061.492 dB ± 0.045
S50.255 bA ± 0.0040.217 bB ± 0.0011.843 cdA ± 0.0141.677 bB ± 0.0133.110 bA ± 0.0492.173 cB ± 0.066
S60.202 cA ± 0.0050.087 dB ± 0.0050.263 hA ± 0.0040.210 fB ± 0.0010.278 dA ± 0.0060.175 hB ± 0.011
S70.209 cA ± 0.0010.128 cB ± 0.0011.896 cA ± 0.0081.630 bB ± 0.0431.768 cA ± 0.0061.290 eB ± 0.057
S80.174 dA ± 0.002 0.053 eB ± 0.0051.385 gA ± 0.0061.165 cB ± 0.0400.798 dA ± 0.0050.570 fA ± 1.442
C0.208 cA ± 0.0050.147 cB ± 0.0091.606 eA ± 0.0051.573 bB ± 0.0464.657 aA ± 0.0012.894 aB ± 0.059
η2 [%]
months33.5412.68.38
sites605175.57
Values followed by the same small letter within each column are not significantly different at p < 0.05. Values followed by the same capital letter within each line are not significantly different at p < 0.05. Different small letters indicate a comparison between sites. Different capital letters indicate a comparison between months.
Table 4. Changes of resistance indices (RS) for catalase (CAT), alkaline phosphatase (AlP), and acid phosphatase (AcP) in the soil.
SitesCATAlPAcP
SpringAutumnSpringAutumnSpringAutumn
S10.189 eA ± 0.0010.176 hB ± 0.0020.028 gB ± 0.0010.129 eA ± 0.0010.137 eA ± 0.0040.074 eB ± 0.002
S20.733 cA ± 0.0010.455 dB ± 0.0050.471 eB ± 0.0010.765 cA ± 0.0030.408 bB ± 0.0720.843 aA ± 0.003
S30.664 dB ± 0.0030.909 aA ± 0.0040.876 aA ± 0.0040.234 dB ± 0.0040.353 cA ± 0.0040.099 eB ± 0.013
S40.748 cA ± 0.0050.645 cB ± 0.0010.766 bA ± 0.0040.745 cB ± 0.0040.328 cA ± 0.0010.347 cA ± 0.004
S50.631 dA ± 0.0060.355 fB ± 0.0040.743 cB ± 0.0040.875 bA ± 0.0250.501 aB ± 0.0060.601 bA ± 0.013
S60.944 bA ± 0.0020.420 eB ± 0.0070.089 fA ± 0.0040.072 fB ± 0.0080.031 eA ± 0.0010.031 fA ± 0.002
S70.990 aA ± 0.0570.771 bB ± 0.060.694 dB ± 0.0020.930 aA ± 0.0070.234 dB ± 0.0670.287 dA ± 0.005
S80.719 cA ± 0.0070.220 gB ± 0.0070.758 bcA ± 0.040.872 bA ± 0.0060.094 eA ± 0.0020.109 eA ± 0.008
Mean0.7020.4940.5530.5780.2610.299
η2 [%]
months16 0.11 0.25
sites62.41 82.42 85.25
Values followed by the same small letter within each column are not significantly different at p < 0.05. Values followed by the same capital letter within each line are not significantly different at p < 0.05. Different small letters indicate a comparison between sites. Different capital letters indicate a comparison between months.
Table 5. Changes of resilience indices (RL) for catalase (CAT), alkaline phosphatase (AlP), and acid phosphatase (AcP) in the soil.
SitesCATAlPAcP
S10.159 b ± 0.0010.112 d ± 0.0040.173 f ± 0.001
S2−0.264 e ± 0.00050.469 b ± 0.0010.776 a ± 0.007
S30.714 a ± 0.0015−0.804 g ± 0.006−0.033 g ± 0.001
S4−0.032 c ± 0.001−0.038 f ± 0.0020.254 d ± 0.004
S5−0.197 d ± 0.0030.390 c ± 0.0210.364 b ± 0.004
S6−0.818 g ± 0.002−0.007 e ± 0.0030.234 e ± 0.002
S7−0.900 h ± 0.0060.671 a ± 0.0130.286 c ± 0.004
S8−0.469 f ± 0.0030.343 c ± 0.0160.248 de ± 0.006
Mean−0.2260.1420.288
Values followed by the same small letter within each column are not significantly different at p < 0.05. Different small letters indicate a comparison between sites.
Table 6. The Pearson correlations between physical and chemical properties and enzymes in the soil.
VariablesRegression EquationrR2P
yx
CATECey = 0.142 + 0.0007x0.6230.3880.0057
CATTEBy = 0.259 − 0.0019x−0.5230.2730.0258
CATAlPy = 0.124 + 0.0484x0.5120.2620.0297
AcPTEBy = 2.803 − 0.0316x−0.4970.2470.0355
AcPTOCy = 2.424 − 0.022x−0.5090.2590.0306
AcPAPy = 8.658 + 9.408x0.5970.3560.0089
AcPAlPy = 0.966 + 0.297x0.4970.2470.0089
AcPCaCO3y = 28.90 − 7.212x−0.5270.2780.0244
AlPCaCO3y = 36.533 − 13.595x−0.5950.3540.0092
APpH KCly = 372 − 45.83x−0.6520.4250.0033
APECey = 36.54 − 0.158x−0.4810.2310.0430
APCaCO3y = 36.567 − 0.705x−0.6120.3720.0070
NTpH KCly = 19.632x−0.5720.3270.0131
Table 7. Values of the three extracted components’ loadings (PC1, PC2, PC3) for 11 elements.
ElementsComponent Matrix
PC1PC2PC3
TOC−0.7910.404−0.236
NT0.1170.4890.793
AP0.9010.333−0.166
pH KCl−0.291−0.612−0.321
ECe−0.217−0.8600.354
TEB−0.3930.1930.859
CaCO3−0.8870.3030.174
Clay−0.316−0.7580.209
CAT0.291−0.865−0.081
AlP0.833−0.2680.377
AcP0.8540.209−0.219
Variation (%)41.3731.9819.37
Bold values are statistically significant.
Publisher’s Note: MDPI stays neutral with regard to jurisdictional claims in published maps and institutional affiliations.

