1. Introduction
More than half of the world’s total oil reserve is stored in carbonate reservoirs, and almost all are intensively fractured, characterized by low primary recovery. Several studies have examined the recovery mechanisms and driving forces in naturally fractured reservoirs [
1,
2,
3,
4]. Understanding the oil recovery mechanisms of these reservoirs depends on the magnitudes of the driving forces. Gravitational, viscous, and capillary forces control the stability and fluid saturation distributions in immiscible displacement processes. Gravitational and capillary forces have the leading roles in capillary continuity and reinfiltration processes. In the case of the stack of matrix blocks, capillary continuity and reinfiltration phenomena occur due to block-to-block interactions, which might lead to oil recovery reduction [
5,
6]. In the reinfiltration process, drained oil from upper blocks can be reimbibing into lower blocks through the liquid bridges and film flow across contact points between vertical blocks. Re-infiltration is affected by capillary and gravity forces. Conversely, capillary continuity in the vertical direction between matrix blocks can improve the oil recovery [
5,
6].
The injection fluid pressure gradient in fractures increases oil recovery due to the reduction of matrix capillary threshold height for gravity drainage. Such a situation governs viscous displacement and improves oil recovery [
7]. Although gravitational and viscous effects are the main forces affecting flow in conventional porous media, gravitational and capillary forces are dominated in the fracture–matrix system. Moreover, viscous and gravitational forces can be active in fracture under a particular state, such as the foam injection process [
6,
8,
9].
In the matrix blocks, where the oil is stored, the magnitude of capillary and gravitational forces affects oil recovery. The geometric and physical property of the matrix block, particularly the wetting state, governs the main recovery mechanisms [
10]. Spontaneous imbibition and gravity drainage are generally recognized as the primary recovery mechanism in matrix blocks [
11]. The wetting condition highly determines the rate of oil recovery by waterflooding in fractured reservoirs. If the matrix block is water wet, matrix pore-throat sizes, the exact wetting state, and the saturation state control the imbibition rate. The rate of capillary imbibition can be enhanced by surfactant and polymer injection. The gravitational forces dominate oil recovery at low IFT conditions for cocurrent flow in the capillary imbibition [
10,
11]. The oil displacement occurs under capillary imbibition forced by positive capillary pressure, which results in the flow of water into the matrix blocks and drains oil into the fracture system [
11]. However, most carbonate fractured reservoirs are preferentially oil wet and show a negative capillary pressure. Hence, water injection in these reservoirs has low efficiency, and spontaneous imbibition is insufficient. The major challenge in such a reservoir is the early breakthrough of water injection through fractures, which results in low oil recovery. Changing wettability toward water-wet conditions, and reduction of the interfacial tension can increase the rate of imbibition. In these situations, buoyancy and capillary pressure dominate oil recovery [
12]. Chemical addition such as surfactant and alkaline to the injected fluid has been proposed to overcome these issues. Likewise, although gas injection suggests better efficiency over water injection, it suffers from an unfavorable mobility ratio due to the injection gas’s low viscosity compared to the oil [
13,
14]. For gravity drainage induced by surfactant, oil recovery is dominated by wettability alteration at the early production time, and later, gravity becomes the primary driving force. In this imbibition process, gravitational and capillarity are significant forces for oil recovery, while the viscous force is small [
15].
In the oil-wet state, the gravity drainage mechanism takes advantage of density differences between the oil and the gas, where the gas is the displacement agent [
8,
16,
17]. Gravitational forces drive the oil displacement in the vertical direction between matrix blocks due to capillary continuity and reinfiltration. However, the oil reinfiltration between the matrix blocks can reduce oil recovery [
6]. Under gas injection, gravitational forces dominate the viscous force, and the gravitational-dominated flow regime controlling the oil drained to fractures. The pressure and type of injected gas control the gravity drainage in which oil recovery is enhanced by gravity-stable low-rate gas injection [
16]. In miscible gas injection mode, the gravity drainage rate is enhanced through the mixing process in the matrix, which results in higher oil draining in the fracture system. Conversely, gravity drainage rates decrease as a result of mixing in fractures.
Dimensionless numbers are crucial when considering pore-scale or simulation analysis. Some studies are claiming higher oil recovery achievement with minor change on those dimensional numbers relative to water flooding, while other studies described the dimensionless numbers to be not the sole parameter on which oil recovery depends. Hence, further studies are required for the quantification of the driving forces during the EOR processes in fractured reservoirs [
18,
19,
20].
The principle of quantifying the driving forces through dimensionless numbers during the EOR processes in fractured reservoirs motivated this research. The main considered driving forces are capillary, gravitational, and viscous forces. The viscous force plays a role during foam injection in the fracture system. The gravity drainage and spontaneous imbibition are the main recovery mechanisms for oil recovery from fractured reservoirs. These mechanisms are strongly dependent on rock wettability. In the case of gas injection, the effects of diffusion and reimbibition phenomenon on gravity drainage mechanisms should be considered. They might result in more oil recovery and a delay in breakthroughs [
21,
22]. The viscous drive mechanisms can assist the oil displacement from the matrix due to substantial pressure gradients of fracture flow, particularly for chemical injection [
23]. Water-alternating gas (WAG) injection, as a mobility control process, can improve sweep efficiency and oil recovery. This method aims to reduce viscous fingering, gravity override, and bypassed oil in the matrix blocks. However, the performance of the WAG process in fractured reservoirs depends on the acting forces in both the fracture and porous media [
24,
25]. Foam injection is another mobility control method employed to deal with frontal instability and minimize displacement problems by gas mobility reduction. Foam can increase the flow resistance and viscous pressure drop, which diverts injected fluids from fractures to the matrix blocks. Foam and WAG injection techniques can improve overall microscopic and macroscopic sweep efficiency in fractured reservoirs. They can also be used together as the foam-assisted WAG (FAWAG) scheme, taking advantage of both processes [
25,
26].
Evaluating the relative importance of competing forces through dimensional numbers may be the key in forecasting EOR performance [
24]. Dimensionless numbers can also serve as proxies for evaluating the influence of tunable parameters on incremental oil recovery and may be used to develop predictive correlations for the recovery factor [
25]. Quantifying the interactions of forces governing displacement mechanisms can delineate flow regions and characterize reservoirs’ dynamic states.
The main objective of this work is to quantify the performance of EOR methods in fractured carbonate reservoirs using dimensionless numbers, which are related to the governing forces and mechanisms in these reservoirs. Correlations between the recovery factor and dimensionless groups hold importance in optimizing and predicting the performance of EOR methods. Capillary number, gravity number, bond number, Peclet number, and trapping number are the most common dimensionless numbers used in water flooding and EOR processes [
27,
28,
29,
30,
31]. The dimensionless numbers can provide a basis for identifying flow regimes under gravity and viscous effects when they are used to evaluate the EOR processes in heterogeneous reservoirs. As with all dimensionless parameters, the capillary number has numerous mathematical forms stemming from its derivational state. Different formulations and modifications can account for additional parameters, such as the mobility ratio for improved flooding stability analysis. For fractured reservoirs, the dimensionless numbers have been modified to capture the presence of matrix–fracture system variations [
28].
The capillary number
holds a central place in reservoir engineering, especially for EOR processes. It captures the interplay of two of the most critical forces that govern flow in porous media—viscous and capillary forces. It is a powerful tool in describing the mechanisms of a displacement process and control on the performance that lends itself well to predicting oil recovery. The general form of the capillary number is given as
where
σ is the water–oil interfacial tension,
is the displacing phase viscosity, and
v is the superficial velocity of the injectant. For greater inclusivity, the conventional capillary number is modified for sandstone and chalk cores to consider the pore structure represented by capillary bundles, relating it to porosity and permeability [
31]. Recently, several dimensionless numbers have been introduced to study CO
2 flooding concerning the displacement mechanisms [
32]. The capillary number was found to be the most influential parameter in predicting oil recovery.
In the fractured reservoir, acting driving forces are different due to the matrix and fracture system coupling. The relative magnitude of these forces is defined for the matrix in terms of capillary over viscous forces ratio (
) and for the fracture in terms of gravity over viscous ratio
). These dimensionless numbers that build upon the conventional ones are generated for a simple heterogeneous reservoir adapted to accommodate the fracture network, as given by [
28],
where
L is the reservoir length,
pc* the characteristic transverse capillary pressure,
the average matrix permeability,
the average fracture permeability,
H the reservoir thickness,
the total Darcy flow velocity in the matrix,
the oil viscosity, and
M the mobility ratio (mobility of displacing fluid/mobility of displaced fluid). The modified dimensionless numbers have been complemented with geometrical and anisotropy terms to represent the magnitude of gravitational and capillary forces in the fracture direction relative to the viscous forces in the matrix pore structure. They contain the permeability-anisotropy-weighted shape factor implicitly. These averaged scaling properties are better suited to describing flow in fractured reservoirs.
Recently, a new capillary number (
Nca) was developed for a fracture system. The defined number account for the fracture geometry based on a force equilibrium on a trapped ganglion in a fracture system [
33]. The geometric term, which accounts for the effect of fracture roughness, was added to the conventional capillary number of Equation (1), which is defined for porous media, as shown in Equation (4).
where
is the hydraulic aperture,
is the minimum aperture (aperture at the throat),
is the aperture, and
is the ganglion length. The new number was validated with laboratory experiments using five geometric parameters for the distinctive model fractures. A similar geometric term was identified for the rock matrix based on the length of a ganglion in the definition of
[
34]. Although different fracture geometric aspects were considered in the new capillary number, its field-scale implementation requires further development and research, especially for heterogeneous carbonate reservoirs.
Modified Peclet numbers have also been introduced for the primary and EOR process to distinguish the effect of secondary fractures on oil recovery [
19]. High Peclet values reflect high advective transport within the fracture network, insinuating that primary and secondary fractures supply matrix blocks with water and engage in countercurrent imbibition. With decreasing Peclet values, the secondary fractures suffer a lower flow efficiency, and their ability to supply the matrix blocks with water was compromised. In the diffusion-dominated mode, the secondary fractures contributed to recovery through cocurrent imbibition from the primary fractures, providing flow paths and facilitating a more rapid oil recovery [
19]. The modified Peclet number is based on simplified, highly symmetric geometry. In naturally fractured reservoirs, the matrix block shapes are irregular and differ in size; hence, the rate at which fractures communicate with different blocks might be different. The effect of irregular shapes and diverse matrix block sizes require further study.
Dimensionless numbers can represent the equilibrium between governing forces as a recovery function in proxy modeling by surface response methodology. The acting forces in the matrix and the fracture and their equilibrium have been ignored in most published studies. The question is how dimensionless numbers can explain the EOR process performance under a particular dominant driving force. This paper addresses the performance of some of the EOR methods in fractured reservoirs using dimensionless numbers.
2. Methodology
Depending on the injection fluid and scheme, various mechanisms might occur while implementing EOR methods in fractured reservoirs. Typically, EOR methods include water injection or gas injection or a combination of both and with the addition of some chemicals [
37]. Therefore, the interaction of different forces might lead to efficient recovery mechanisms from matrix blocks. The methodology consists of the design of experiments, reservoir simulation, and response-surface modeling.
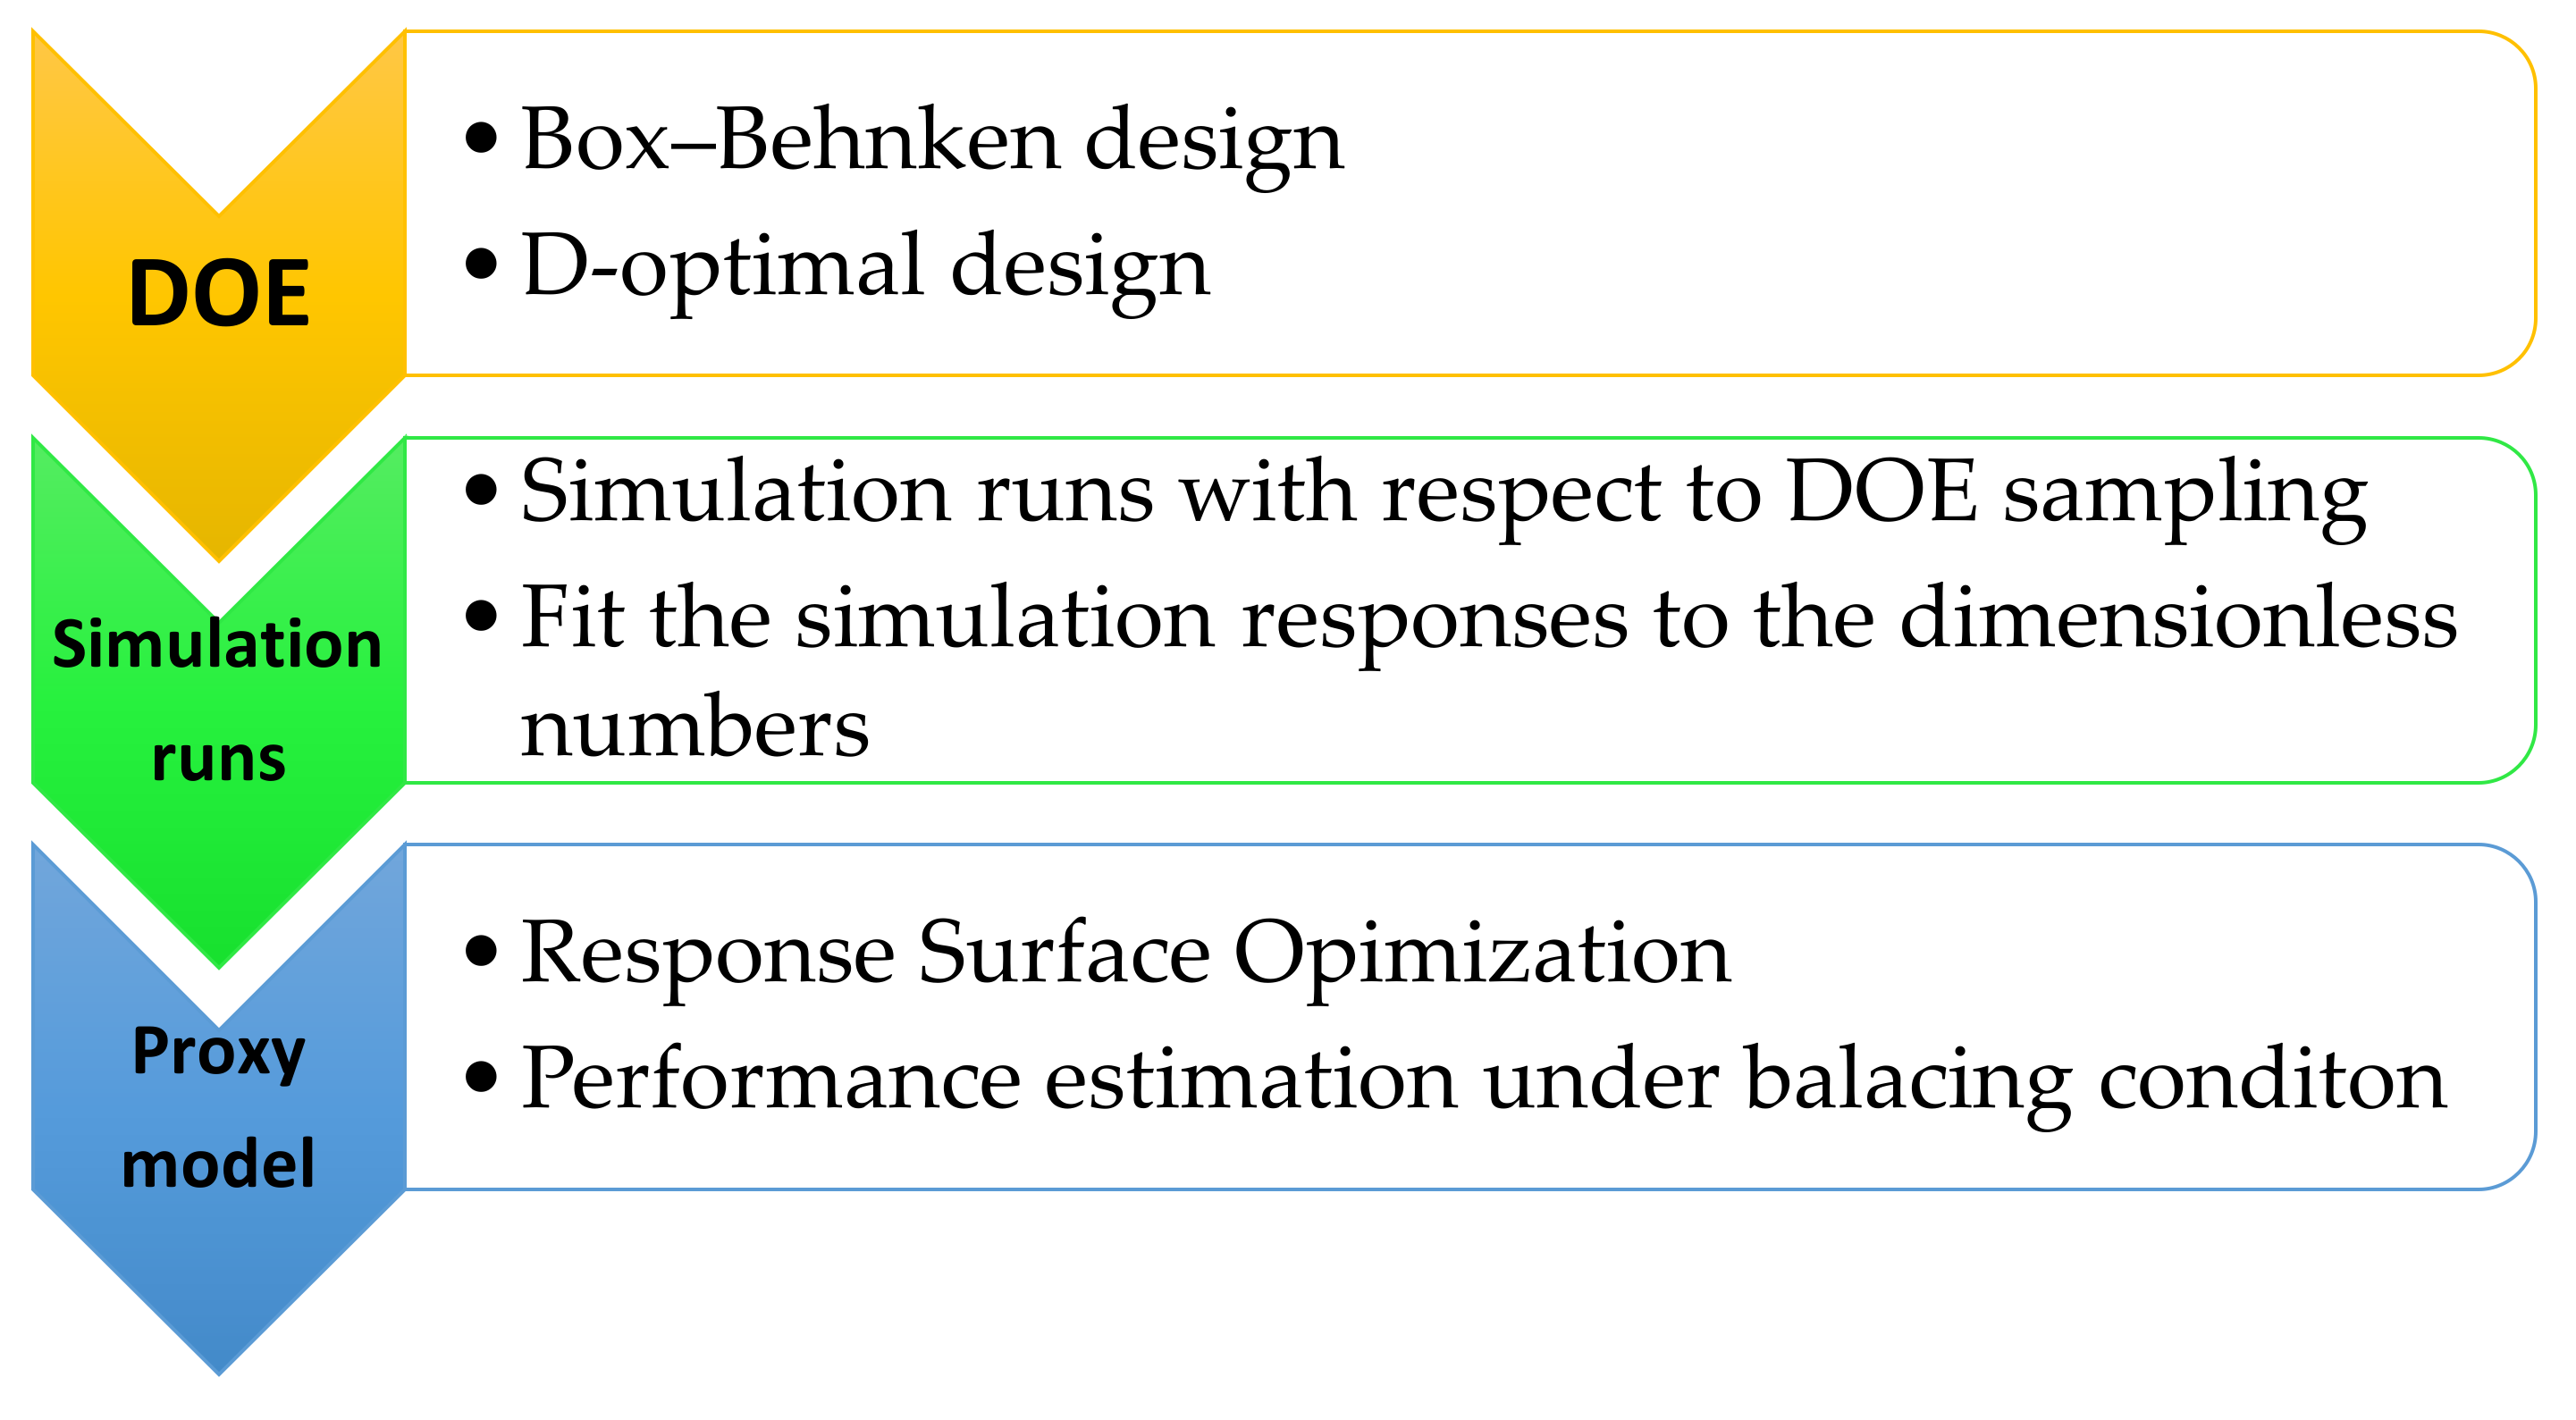
First, a dual-porosity sector model including one injection and one production well was selected as a base case for simulation runs. The experimental design was then employed to examine the uncertainty associated with fractured reservoirs in a series of scenarios. Next, the results were used to calculate dimensionless numbers for every scenario. Finally, the proxy model was constructed for decision making based on dimensionless numbers and associated recovery. The optimal state was used to find equilibrium forces in the fracture–matrix system, which resulted in higher oil recovery. The flowchart of the overall steps in the present research is illustrated in
Figure 1.
The experimental design includes two stages. The Box–Behnken design was performed first to determine the most influencing parameters by screening the main parameters and design simulation jobs with 10 factors [
35]. The D-optimal design was used in the second stage to select the best combination set [
35]. The objective of the optimal design was to determine the minimum number of simulations run. The range of the different input parameters used in the simulation is summarized in
Table 1. The Box–Behnken design with 10 parameters resulted in 170 experimental runs. In contrast, the D-optimal design was used for optimization designs to choose the best subset of experiment runs from a candidate set of 170 experimental runs. Overall, 38 runs were generated for the reservoir simulation tasks.
2.1. Simulation Model
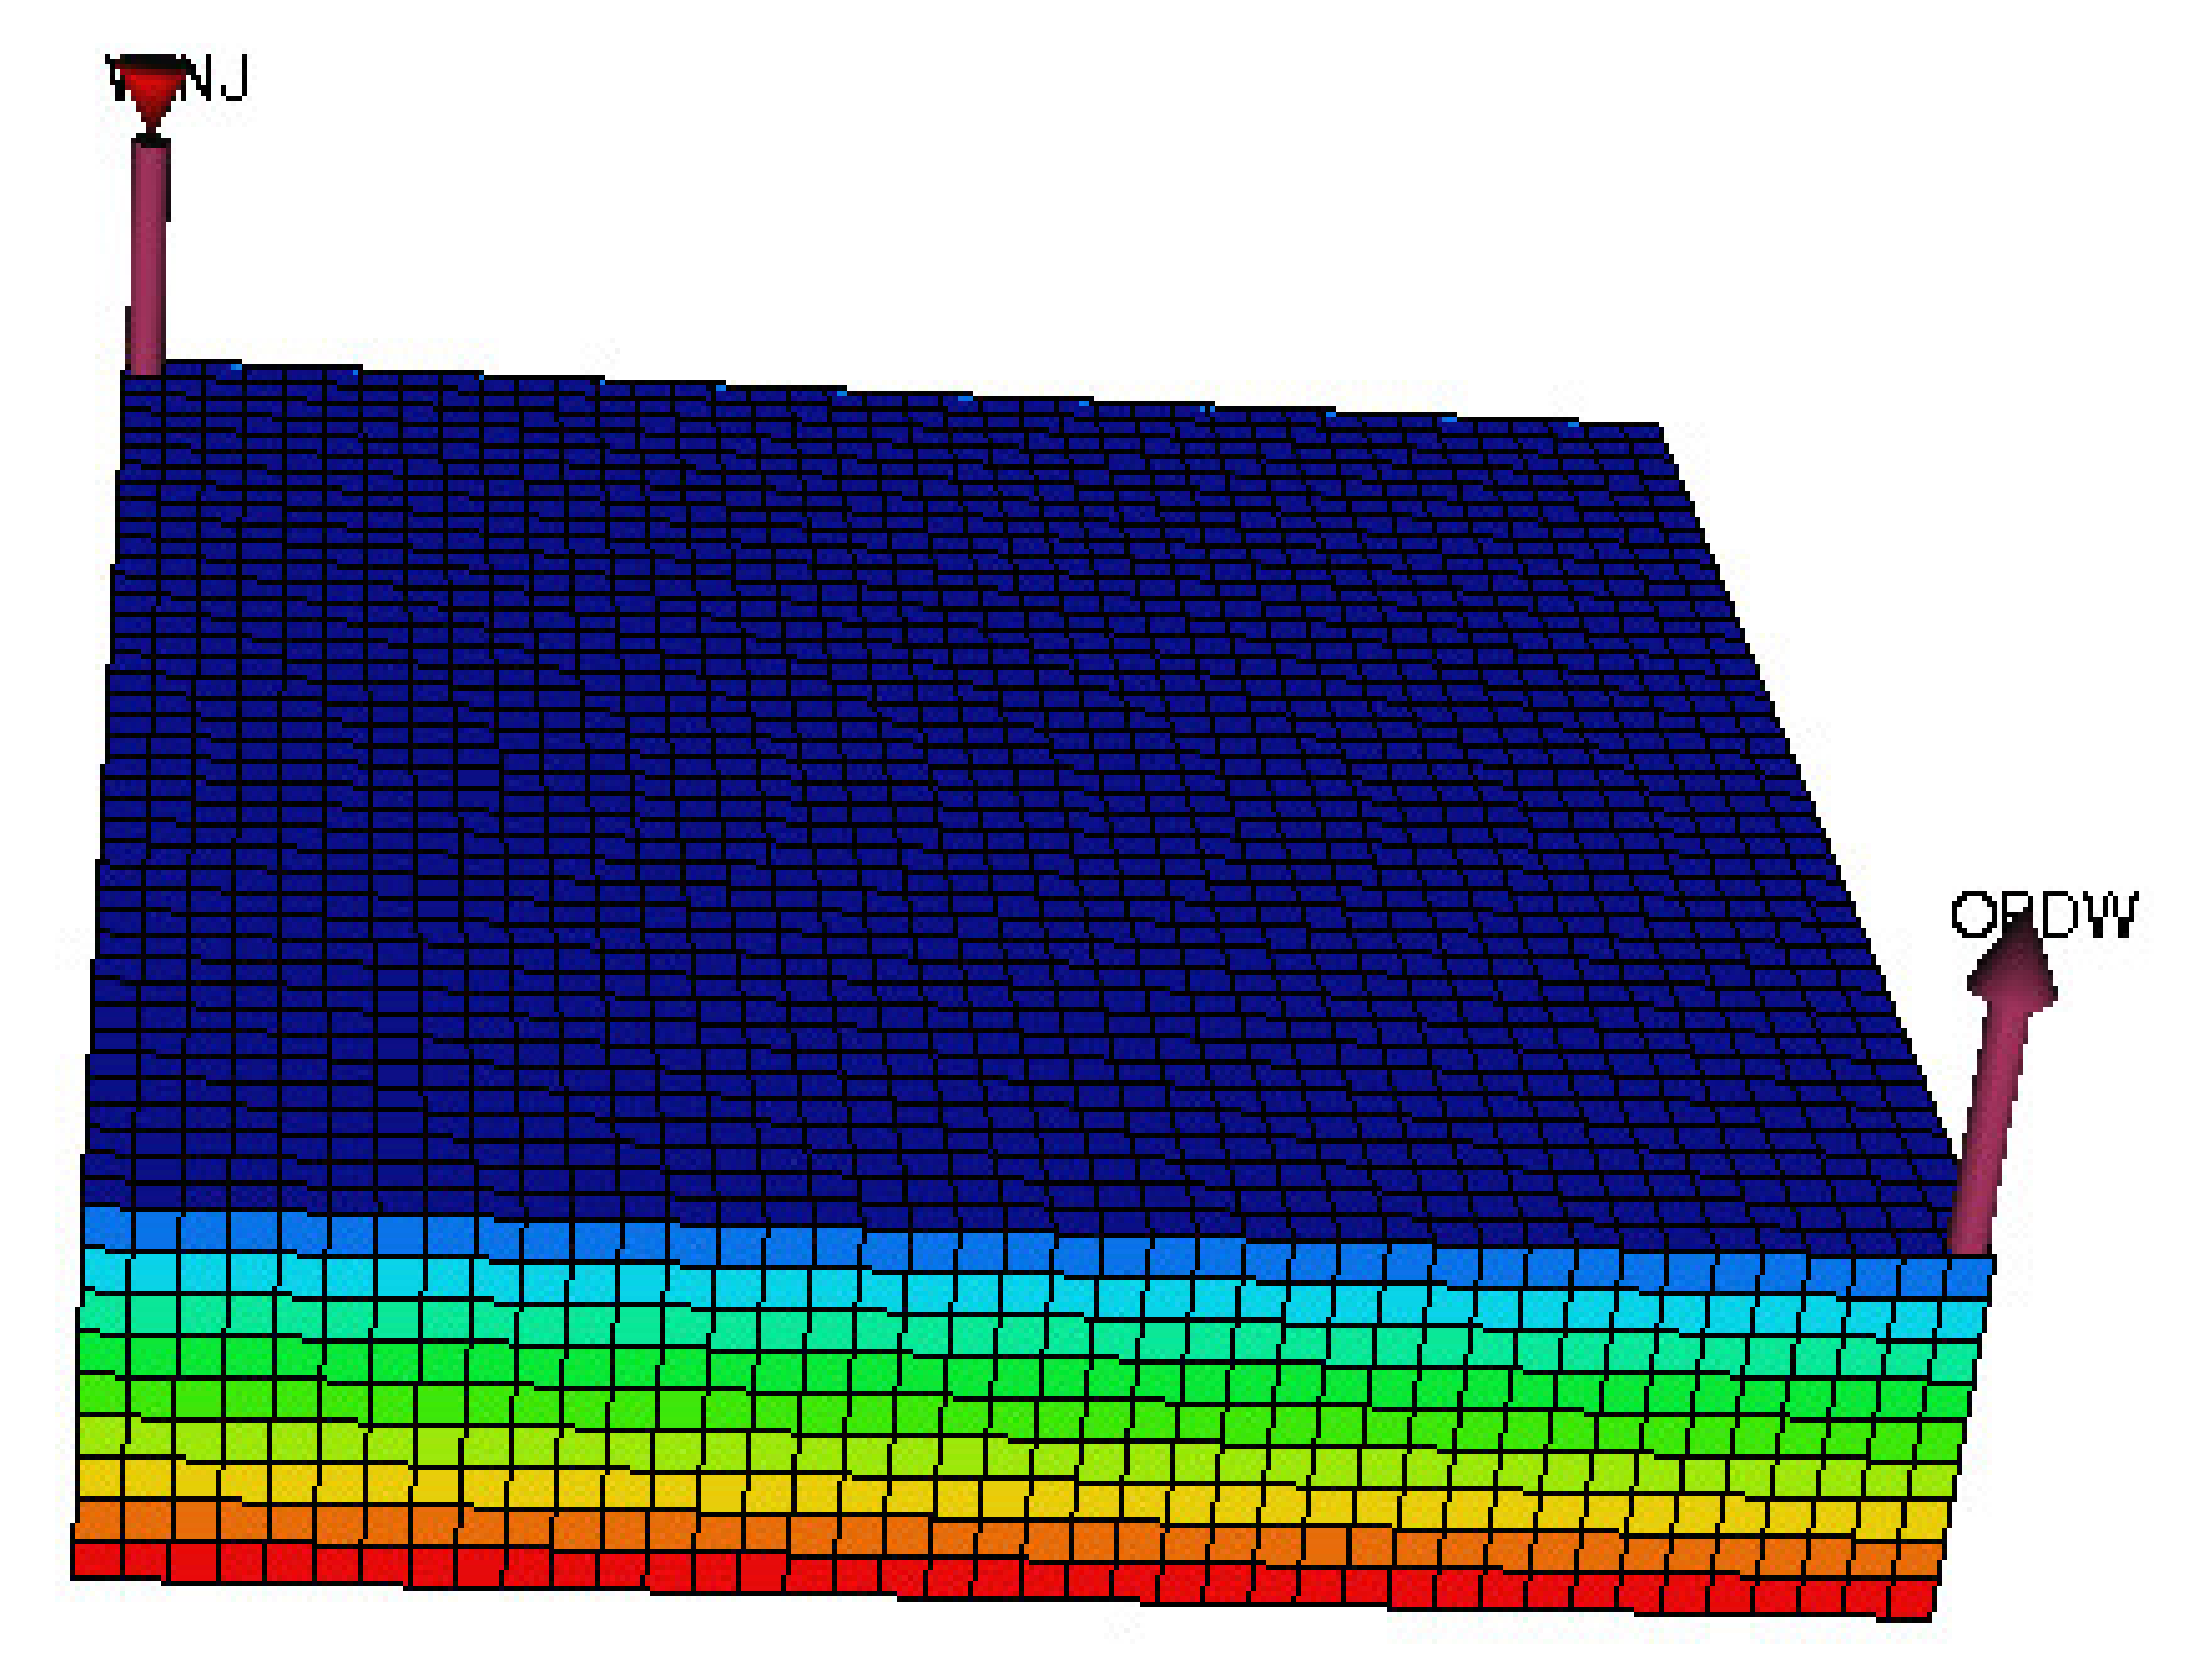
A dual-porosity model with a 40 × 40 × 20 Cartesian grid was constructed, representing a quarter of a 5-spot injection pattern with 10 layers, in which 16,000 grid blocks represented the matrix system, and 16,000 grid blocks were included for the fracture network. The fracture network’s grid blocks overlaid the grid blocks of the matrix system for each layer. The distance between the producer and injector (in each corner of the model) is 2332 .
There were 38 simulation runs for each EOR method, which was set up based on the D-optimal design. The 38 reservoir models with different properties were set up to conduct simulation runs. The sector model’s top view is shown in
Figure 2, with the color code indicating depth decreasing from the top (blue) to the bottom (red).
Molecular diffusion and gravity were accounted for in the simulation model. The uniform distribution of fractures throughout the reservoir model was applied to the calculated equivalent values assigned to fracture properties.
Table 2 presents a summary of reservoir properties for the base reservoir simulation model.
The fluid properties and PVT data for the base case model are given in
Table 3.
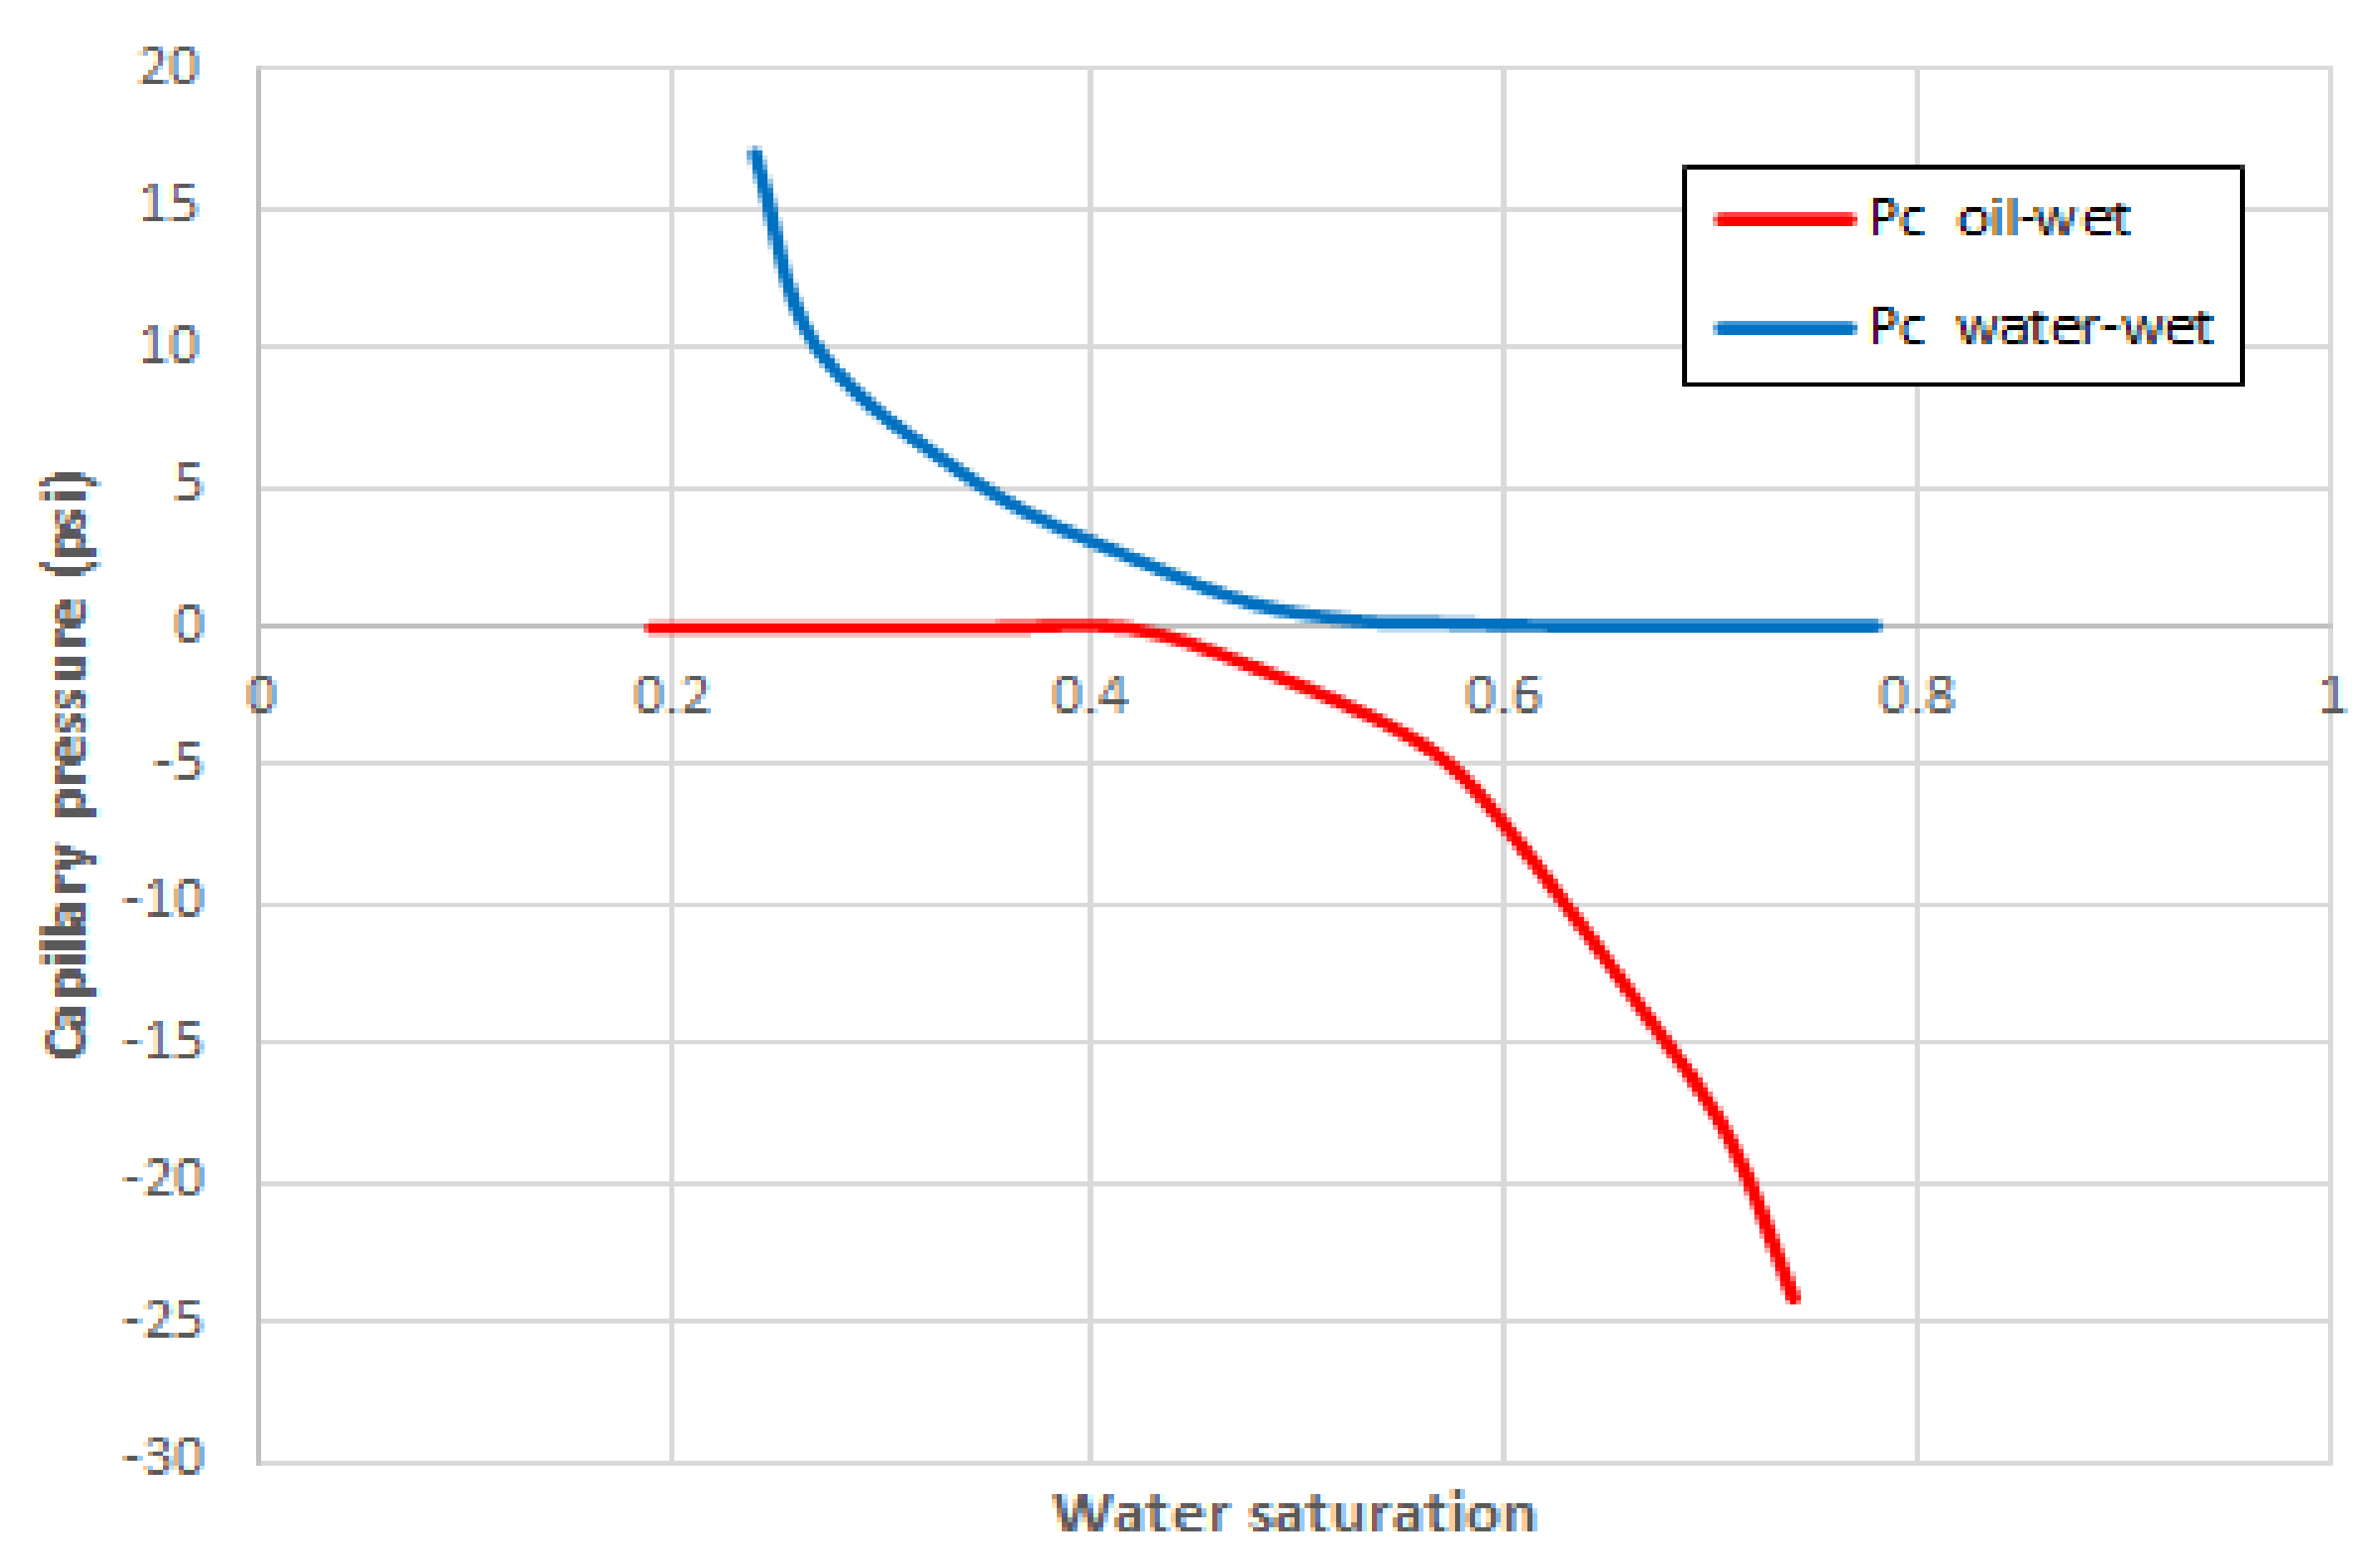
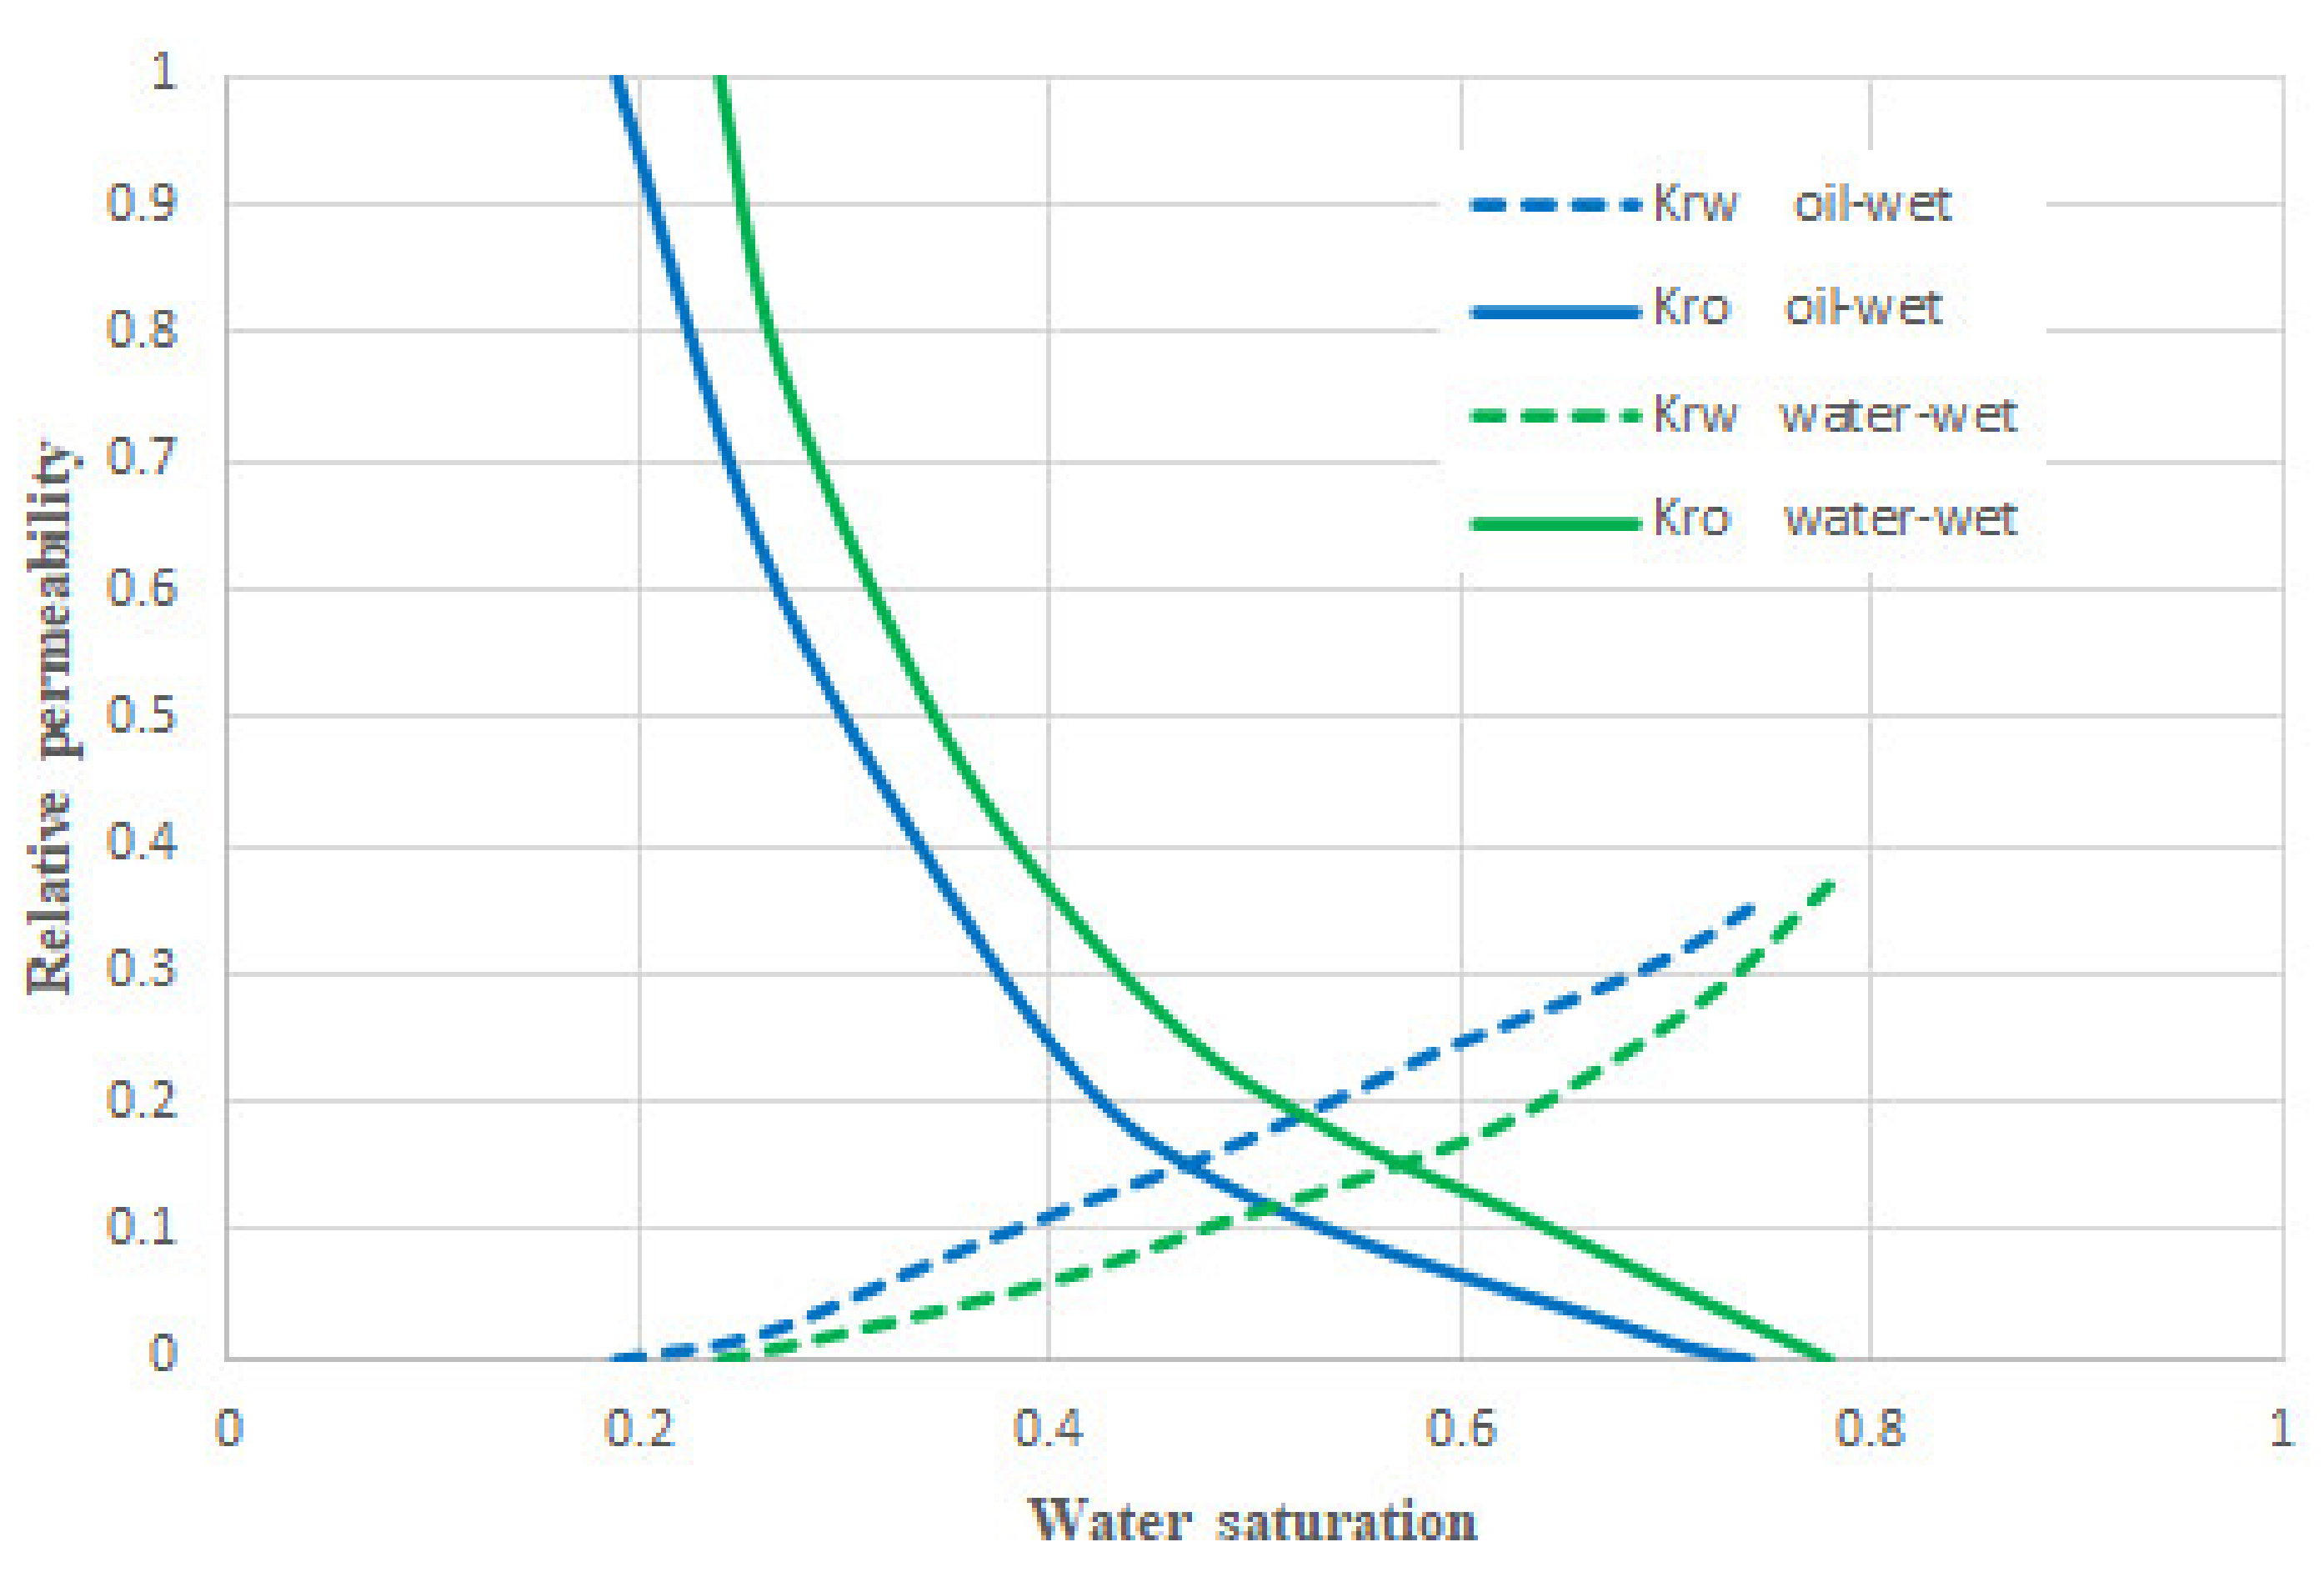
The relative permeability and capillary pressure set for an oil-wet reservoir used in the simulation can be seen in
Figure 3 and
Figure 4. For the fracture system, a straight-line relative permeability and zero capillary pressure were assumed.
The wettability alteration mechanism in the reservoir simulator was modeled based on the interpolation of the relative permeabilities for oil-wet and water-wet conditions.
Simulation strategies consisted of immiscible oil–water displacement, and oil–gas displacement was used to capture the imbibition and gravity drainage process in fractured reservoirs.
2.2. Dimensionless Number
The dimensionless numbers grasp how fracture, matrix, and fluid properties influence the EOR oil recovery for particular reservoir characterization and operating conditions. The reservoir performance and the EOR methods can be optimized based on the dimensionless numbers that identify the optimum oil recovery condition based on the dominating forces.
The capillary and gravity numbers related to matrix and fracture described in
Section 2 were used in this work. The application of Peclet and Bond numbers was not used in this work because of the deficiency of reservoir fracture characterization, particularly the lack of the capture of fracture characteristics on flow in a fractured reservoir in the simulator.
3. Results and Discussion
3.1. Simulation of Water Flooding
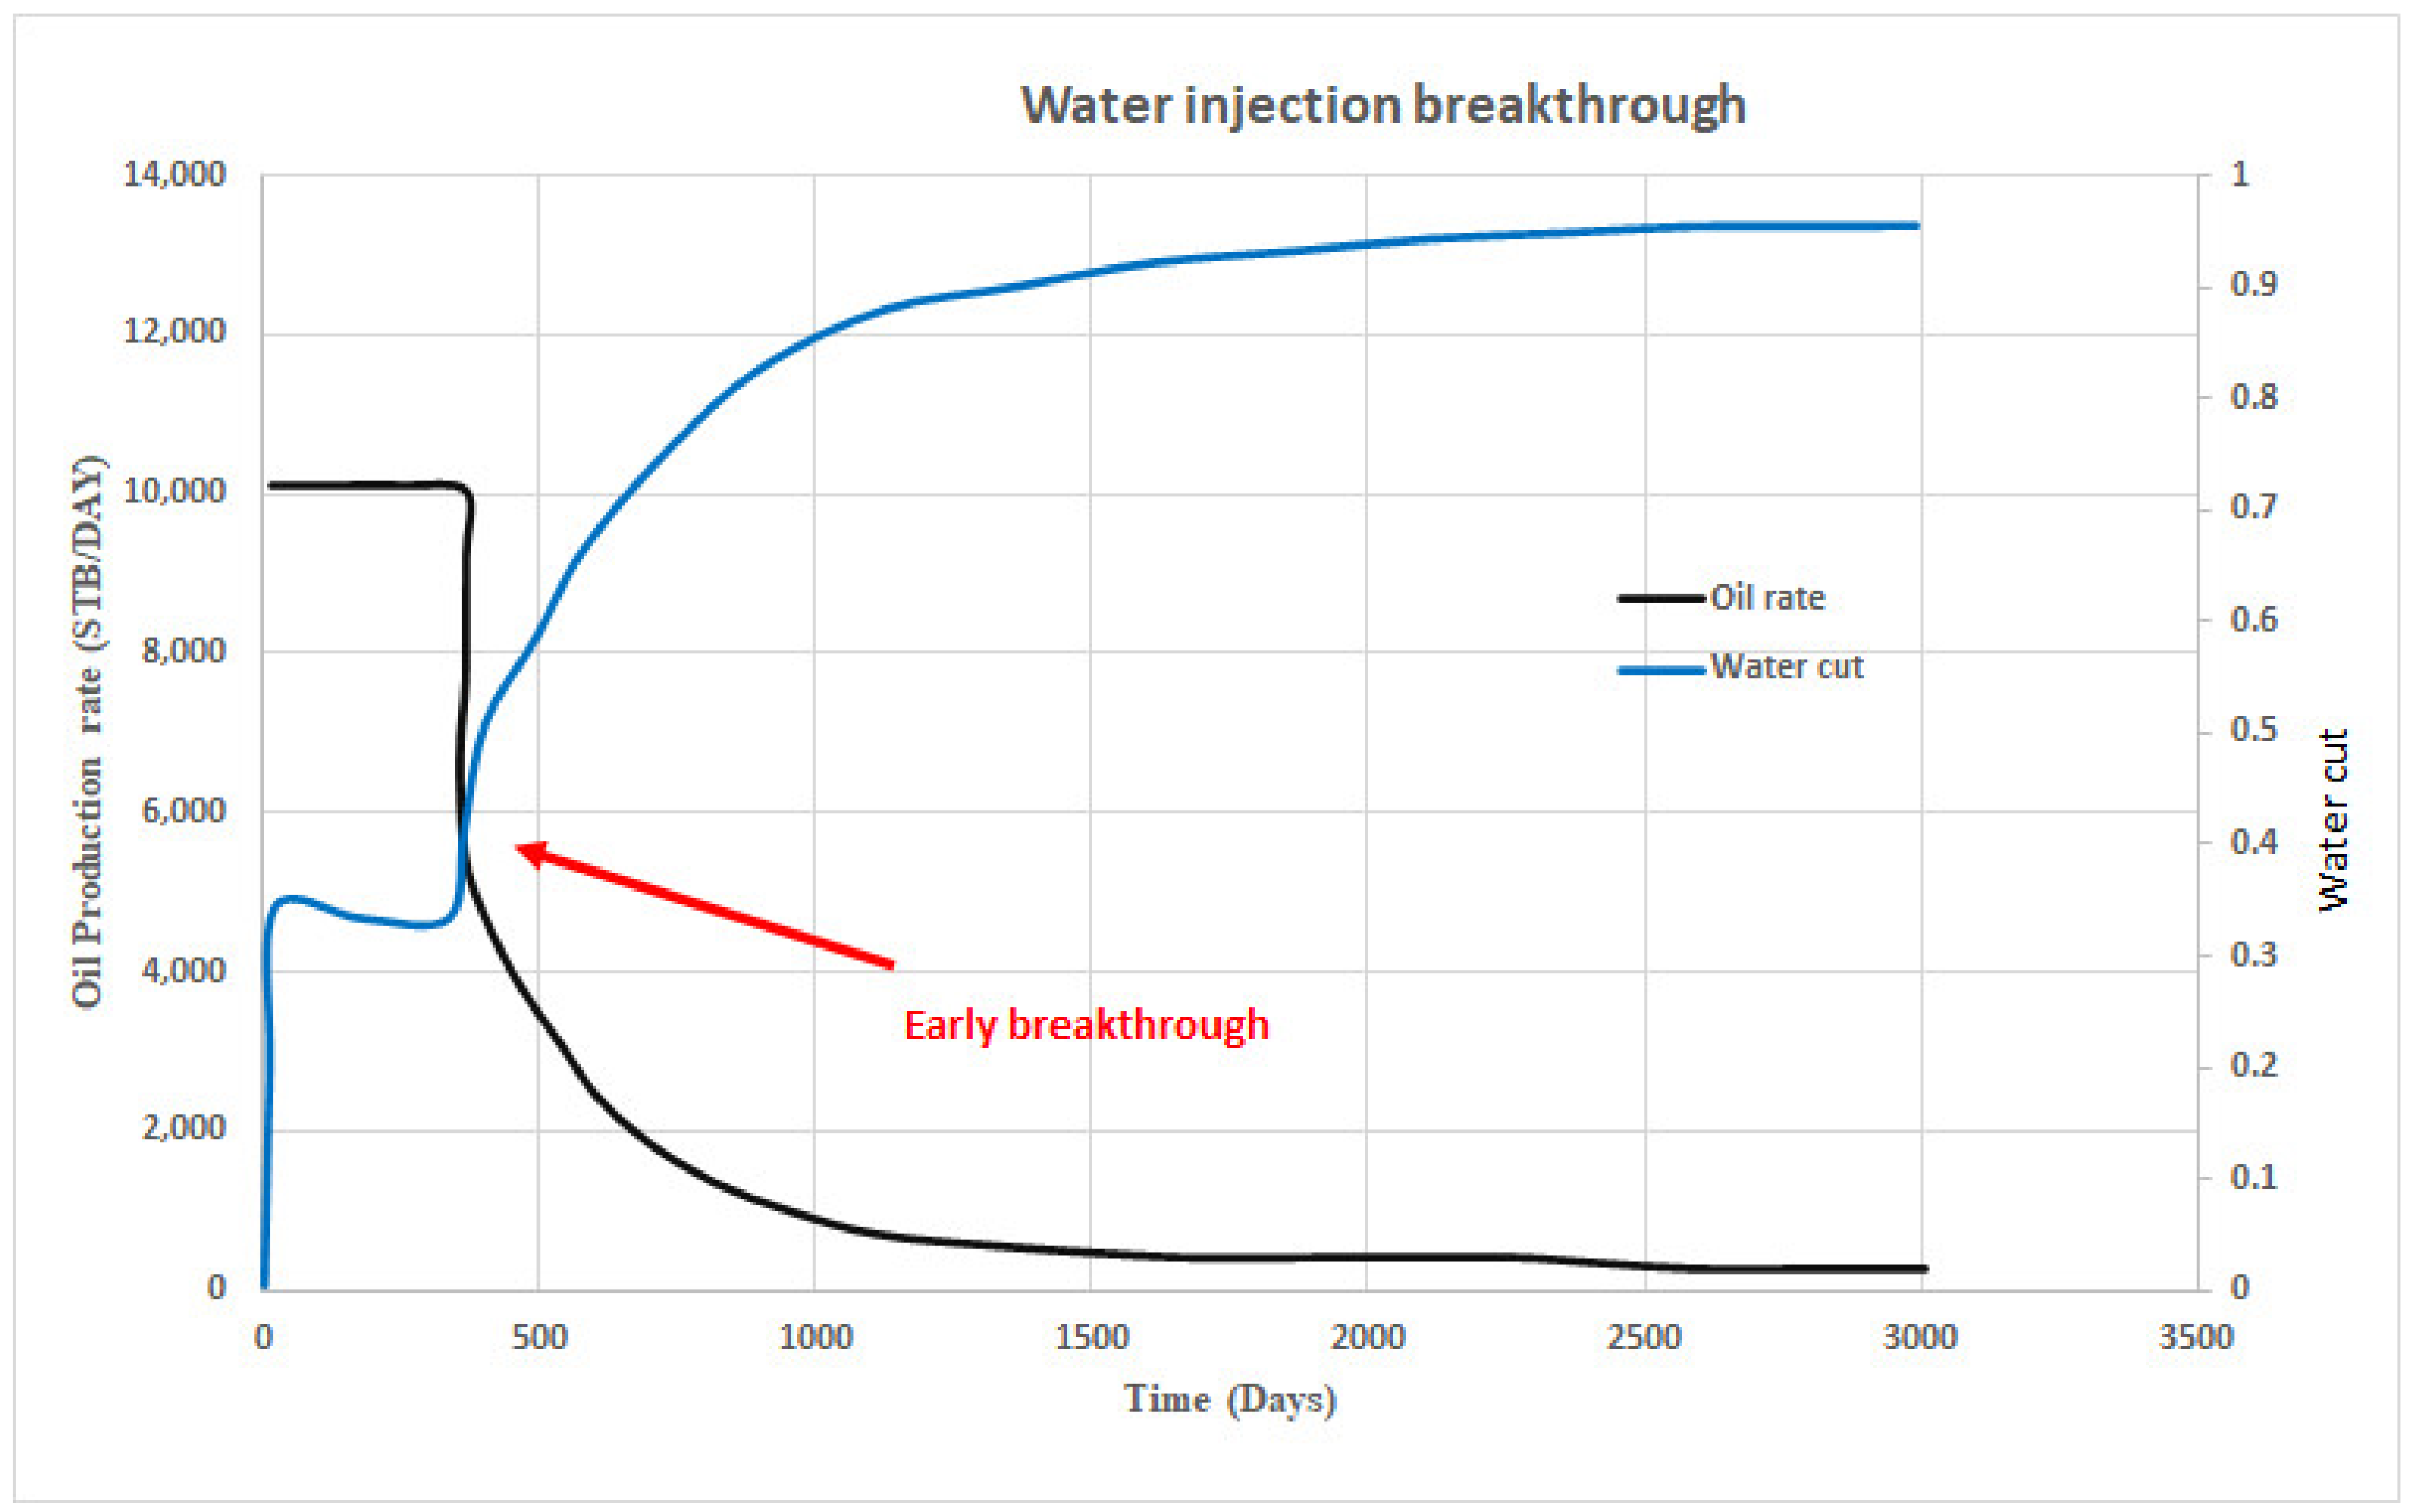
The matrix block was set to be an oil-wet condition using Pc and Kr saturation functions.
Figure 5 represents how oil rate production drops as breakthrough occurs and shows dependencies between matrix wettability and water injection performance. A sharp drop in oil production is observed due to the fracture’s water channeling, which resulted in early water breakthrough. The oil displaced by water imbibition is not dominating because of the low imbibition rate.
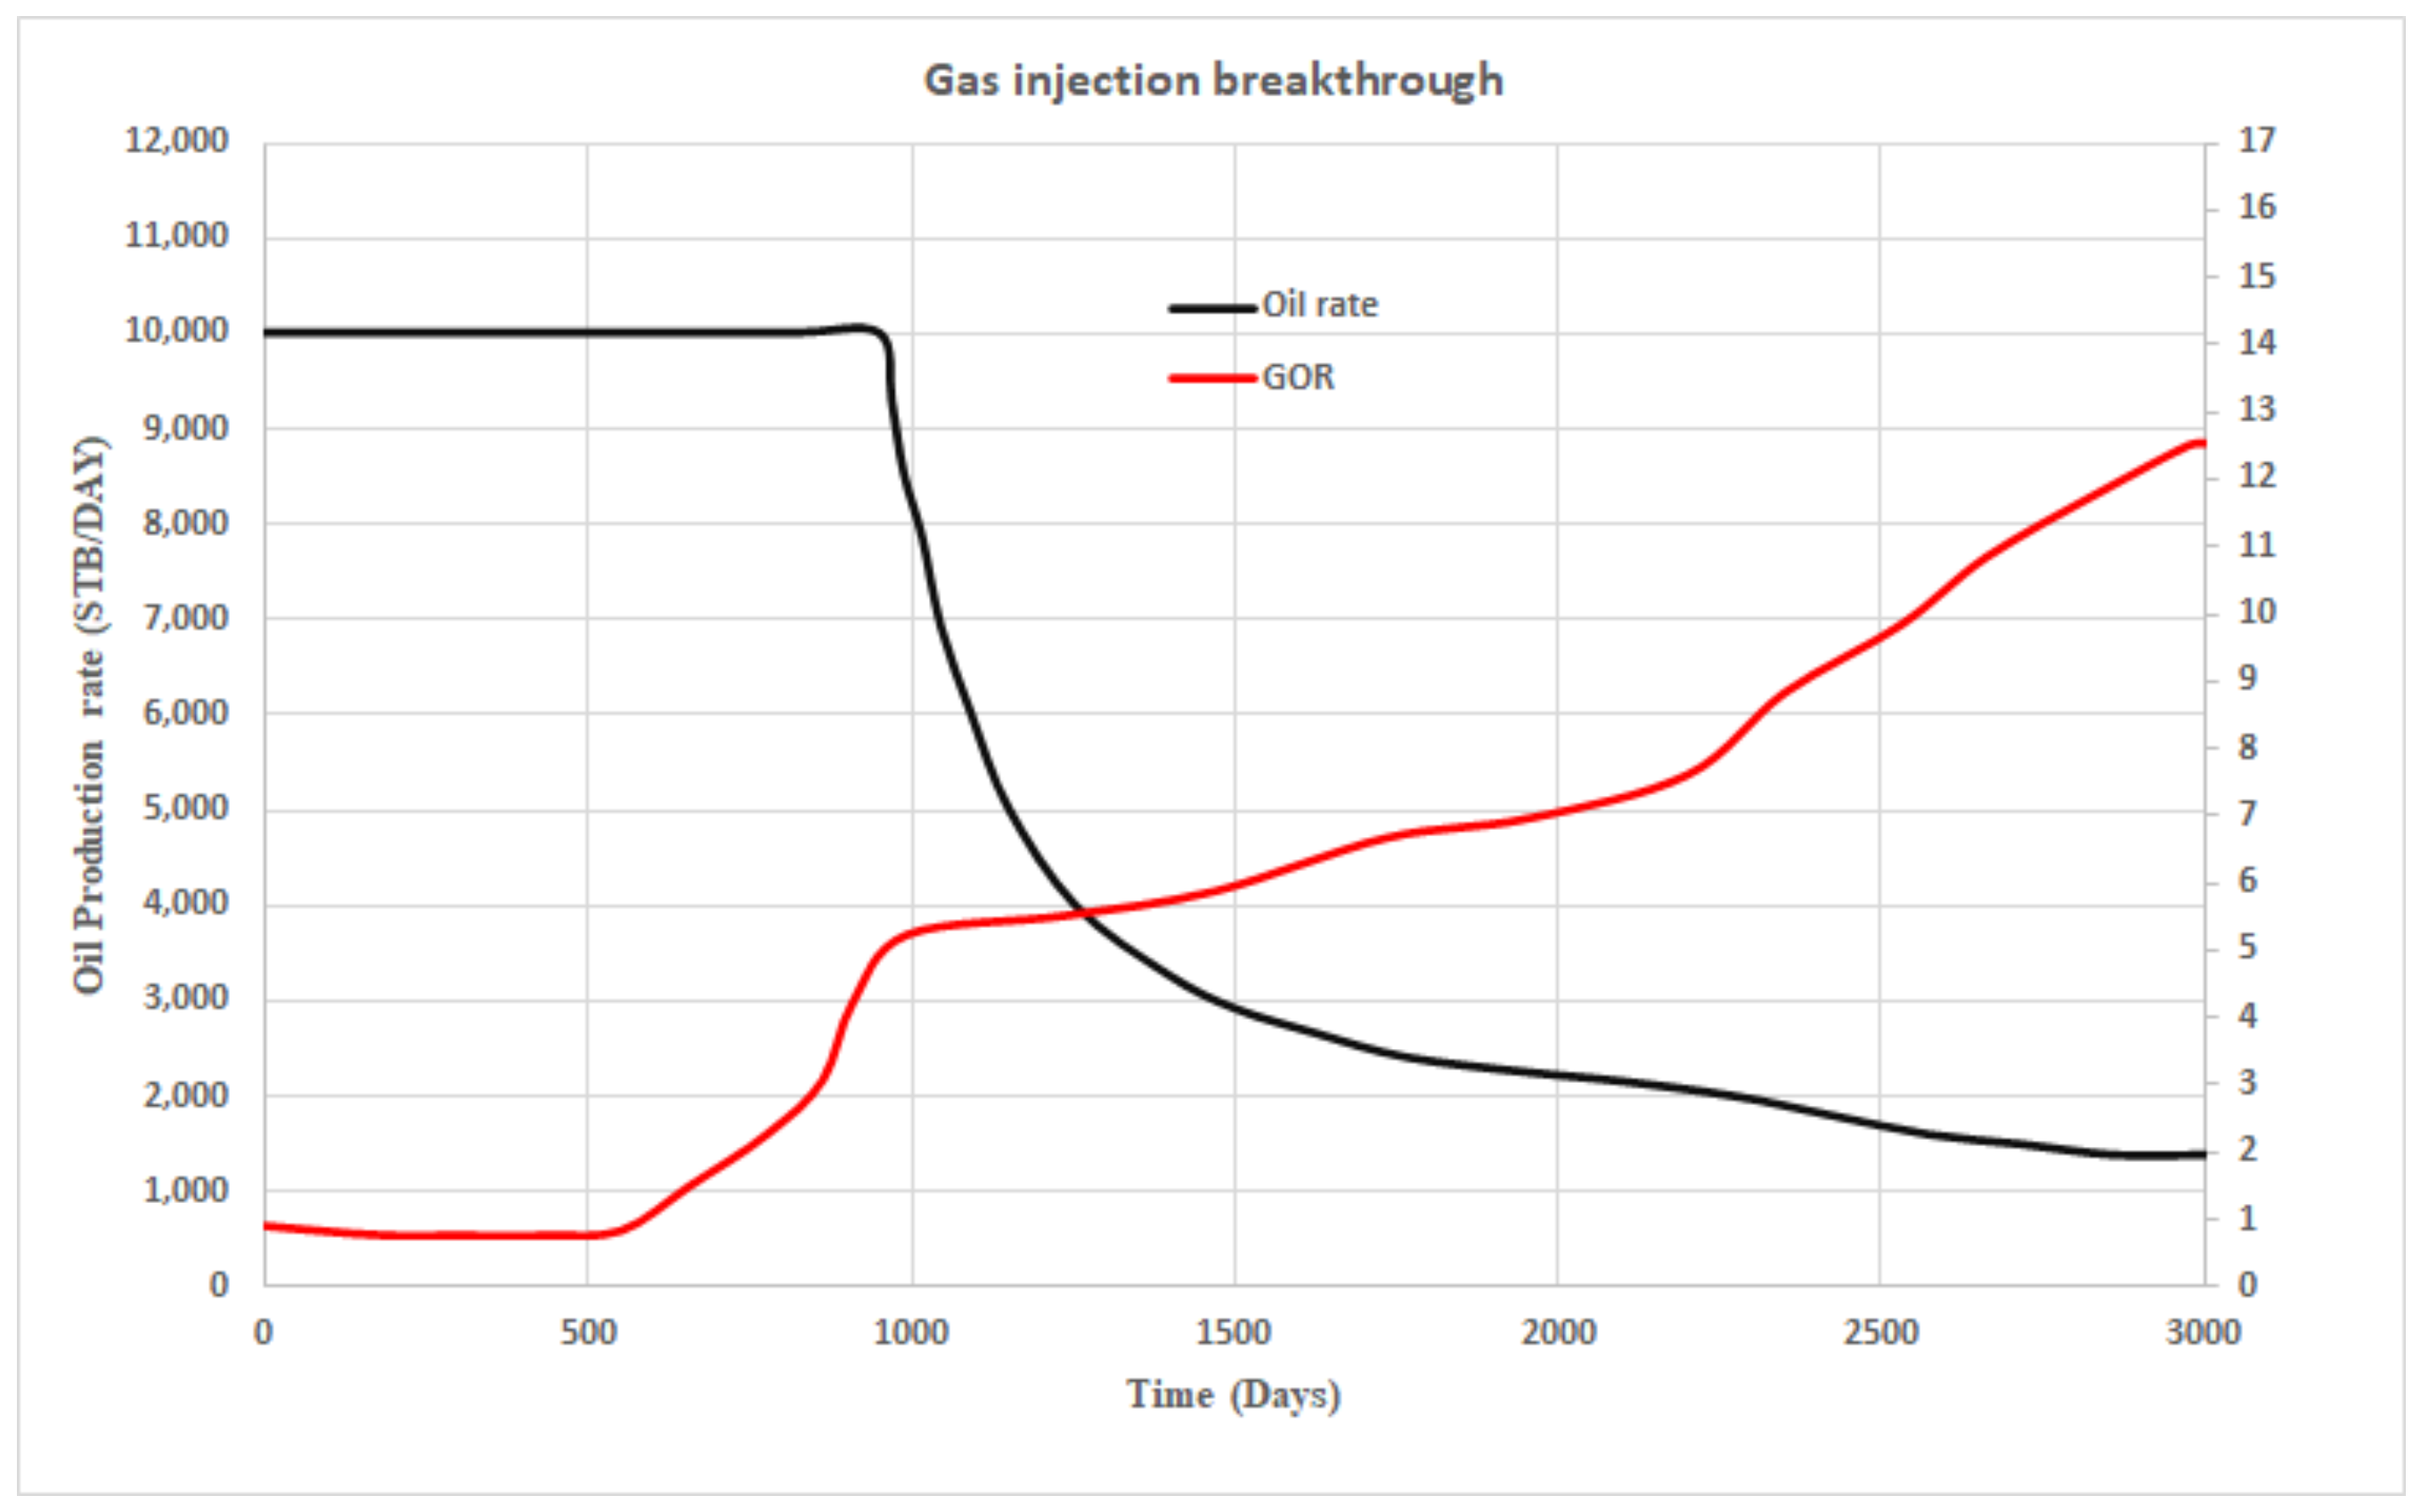
3.2. Simulation of Gas Injection
The gas–oil gravity drainage process is the dominant mechanism in the gas-invaded zone; thus, gas injection was adopted to accelerate the gravity drainage rate. The model was set under gravitational conditions where gravity drainage dominated through the rock, and fluid properties, namely, block height and vertical permeability. The gas injection method is usually accompanied by high gas–oil ratio (GOR) because of the early breakthrough and rapid gas production through high permeability fractures (
Figure 6). The recovery factor and the oil production rate for the gas injection method confirm the rapid breakthrough of injected gas. As shown in
Figure 7, the gas reaches the production well through the fractures due to the capillary forces’ domination. A large oil volume is left behind, in which the gas cannot enter the matrix block. In this case, it is anticipated that capillary forces suppress the gravitational forces; thereby, the oil recovery is low. The underlying reason for this lies in gravity drainage, which is dominated mechanism in the oil–gas displacement process.
3.3. EOR Scenarios
Different EOR methods were selected to overcome challenges such as rapid breakthroughs, which result in low oil recovery during the water and/or gas injection. Foam and water-alternating gas (WAG) injection was proposed to increase oil recovery compared to gas or water injection methods by controlling injection-fluid mobility. The following scenarios were simulated to collect results (dataset) for the proxy model:
- ‑
Foam injection;
- ‑
WAG injection (with 1/2 ratio);
- ‑
FAWAG injection (with 1/2 ratio).
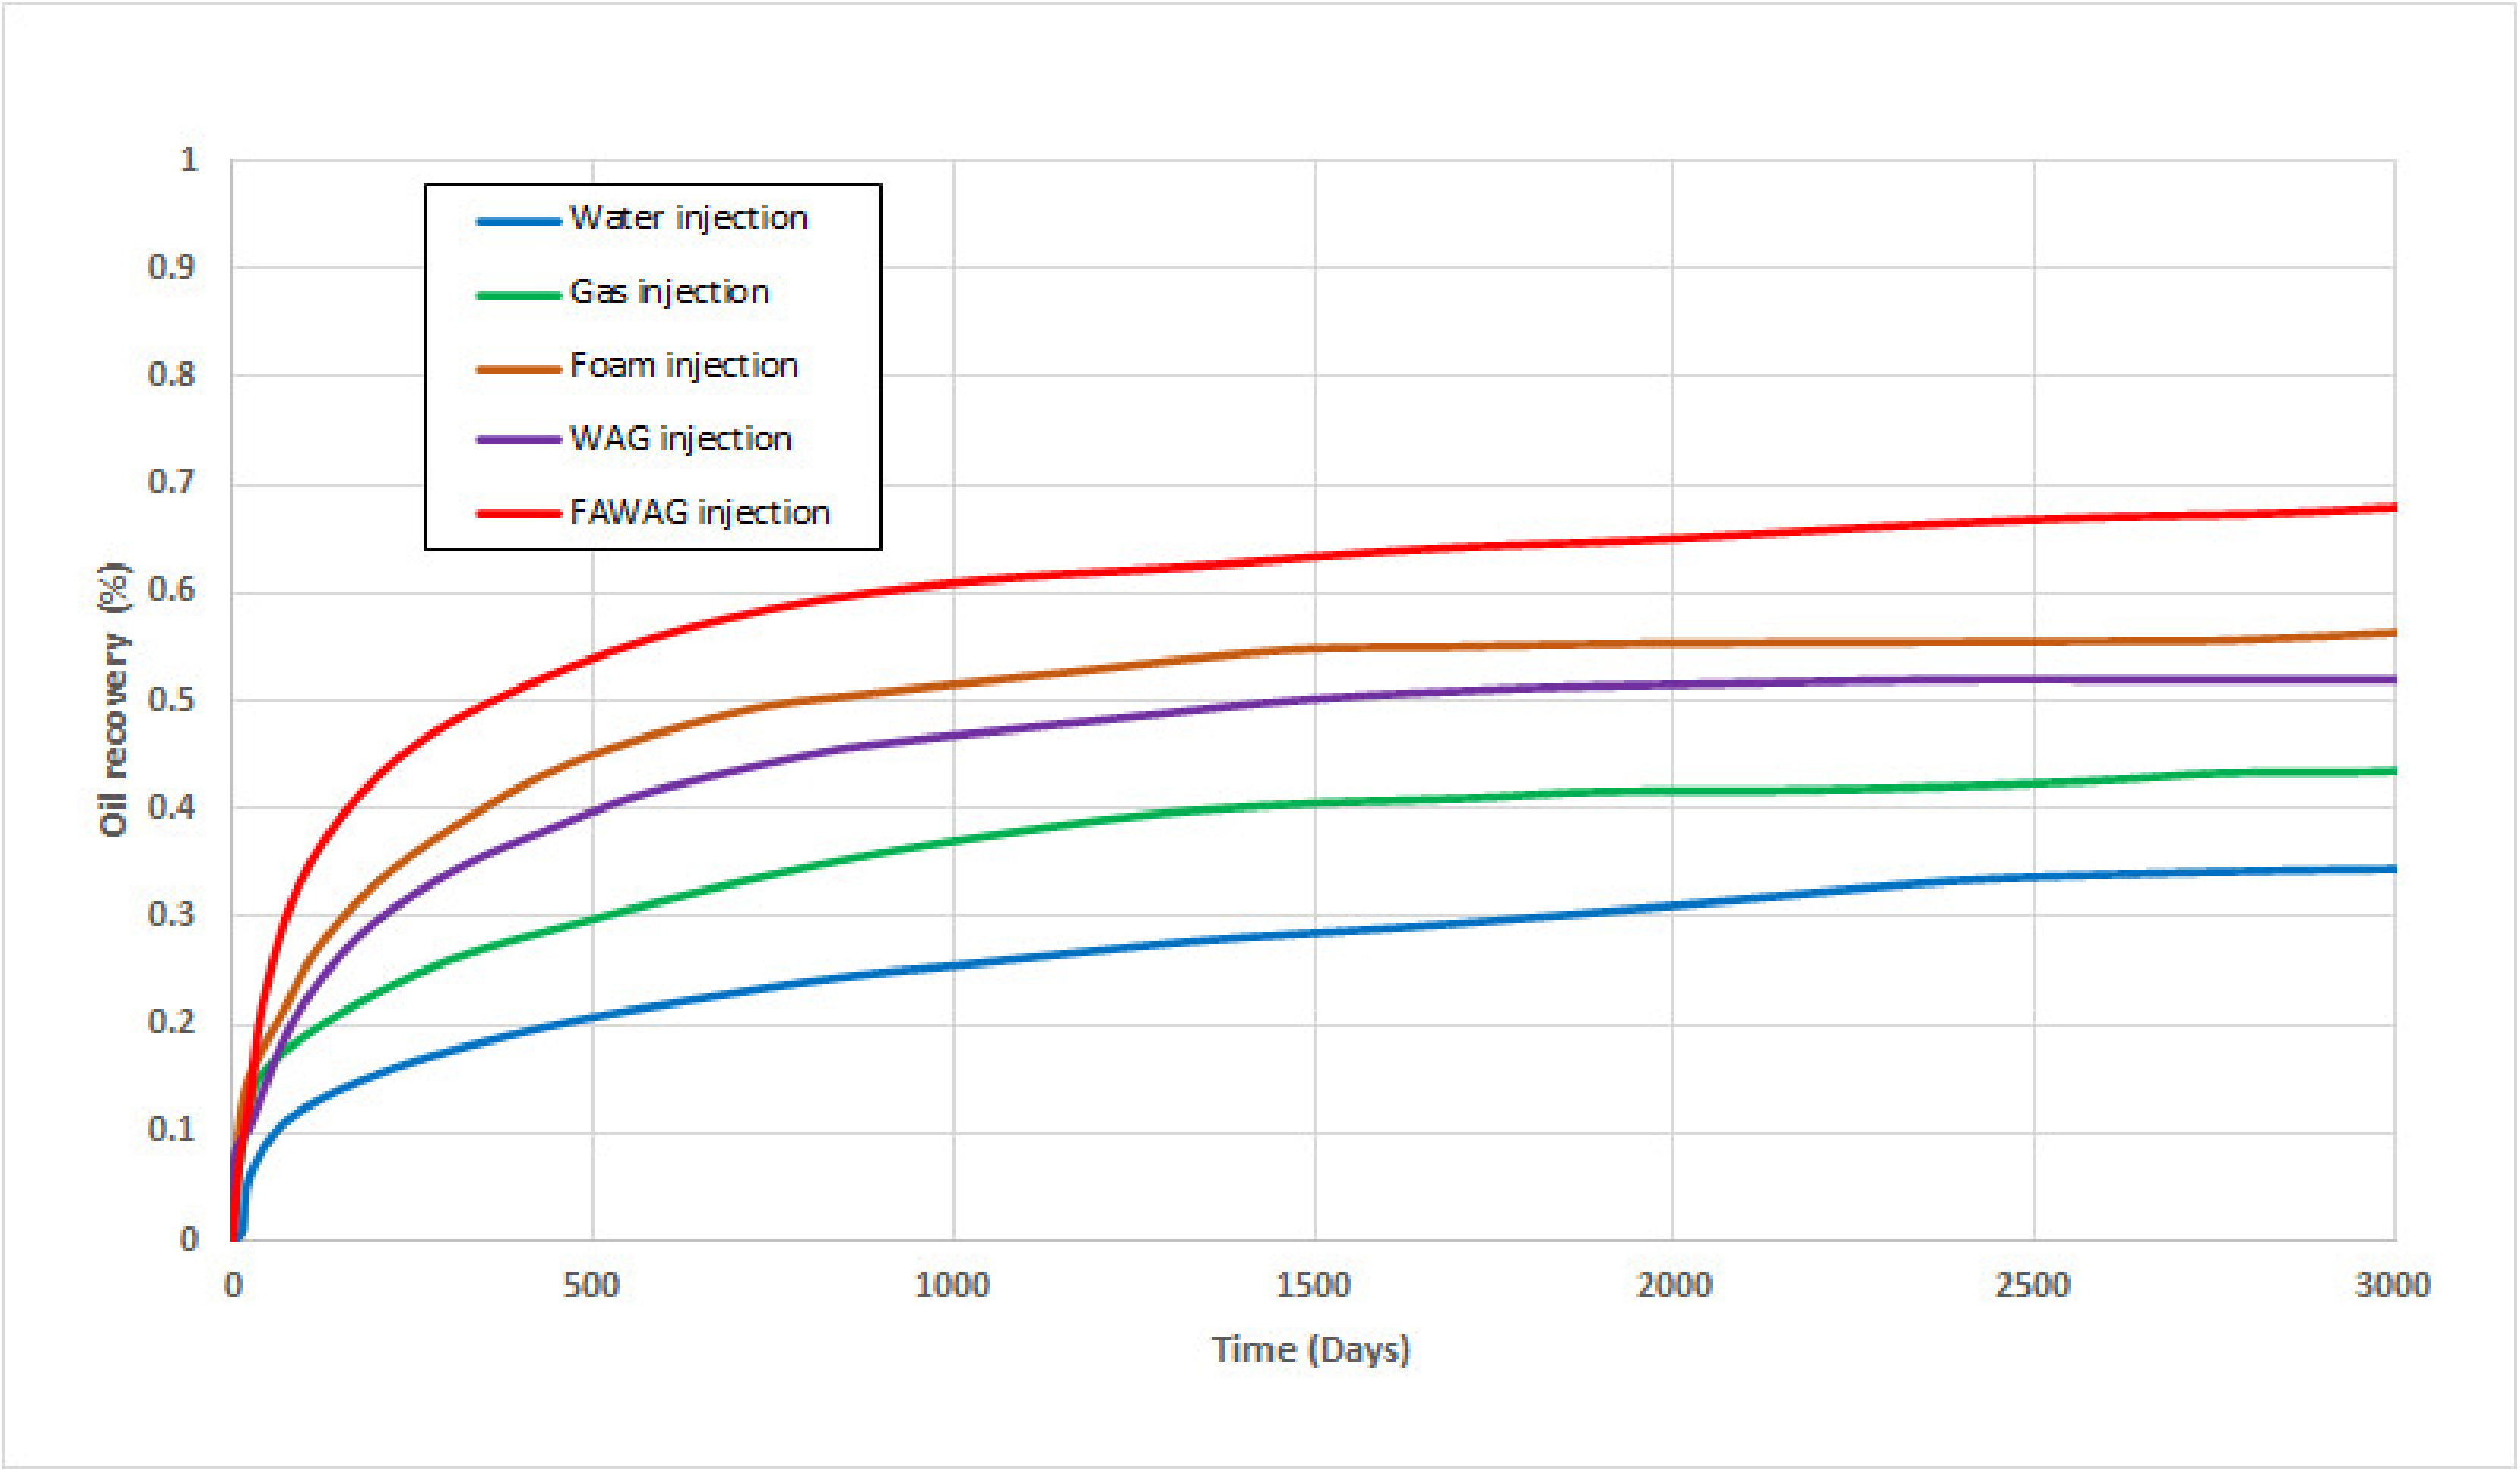
The results of the simulation for all scenarios were obtained to calculate the dimensionless numbers. A total of 38 simulation runs were conducted at this stage. The ultimate oil recovery factor for all cases is presented in
Figure 8.
The dimensionless numbers and ultimate recovery of the studied EOR scenarios are given in
Table 4. As expected, the lowest and highest recoveries are associated with water and FAWAG injection methods. As anticipated, the oil recovery for all methods is improved at a higher capillary number and lower gravity number. It is interesting to note that even the lowest recovery of the FAWAG method is higher than the water flooding’s maximum recovery. Different combinations of fracture, matrix, and fluid properties magnified in the dimensionless numbers are the main source for this wide range of oil recovery for the different processes.
3.4. Surface Response
The design of the experiment was used to provide sampling based on parameter space for simulation jobs. A dataset from simulation runs was then used to create a surface response model as the proxy model to discuss the optimum design of EOR performance. Equations (2) and (3) were used to calculate capillary and gravity numbers. The obtained range of capillary number, gravity number, and oil recoveries of the different EOR methods depend on the simulated reservoir’s input data, which can be different for other reservoirs. The highest capillary number of
was obtained for the FAWAG method (
Table 4). Due to the rock’s wettability, the lowest capillary number of 2.91 × 10
−7 was for the water injection method since the water injection mode was oil wet. Polynomial regression was employed to obtain the approximated relationship between driving force (i.e., the input) and oil recovery (i.e., the output). The surface plot for water, gas, foam, WAG, and FAWAG are given in
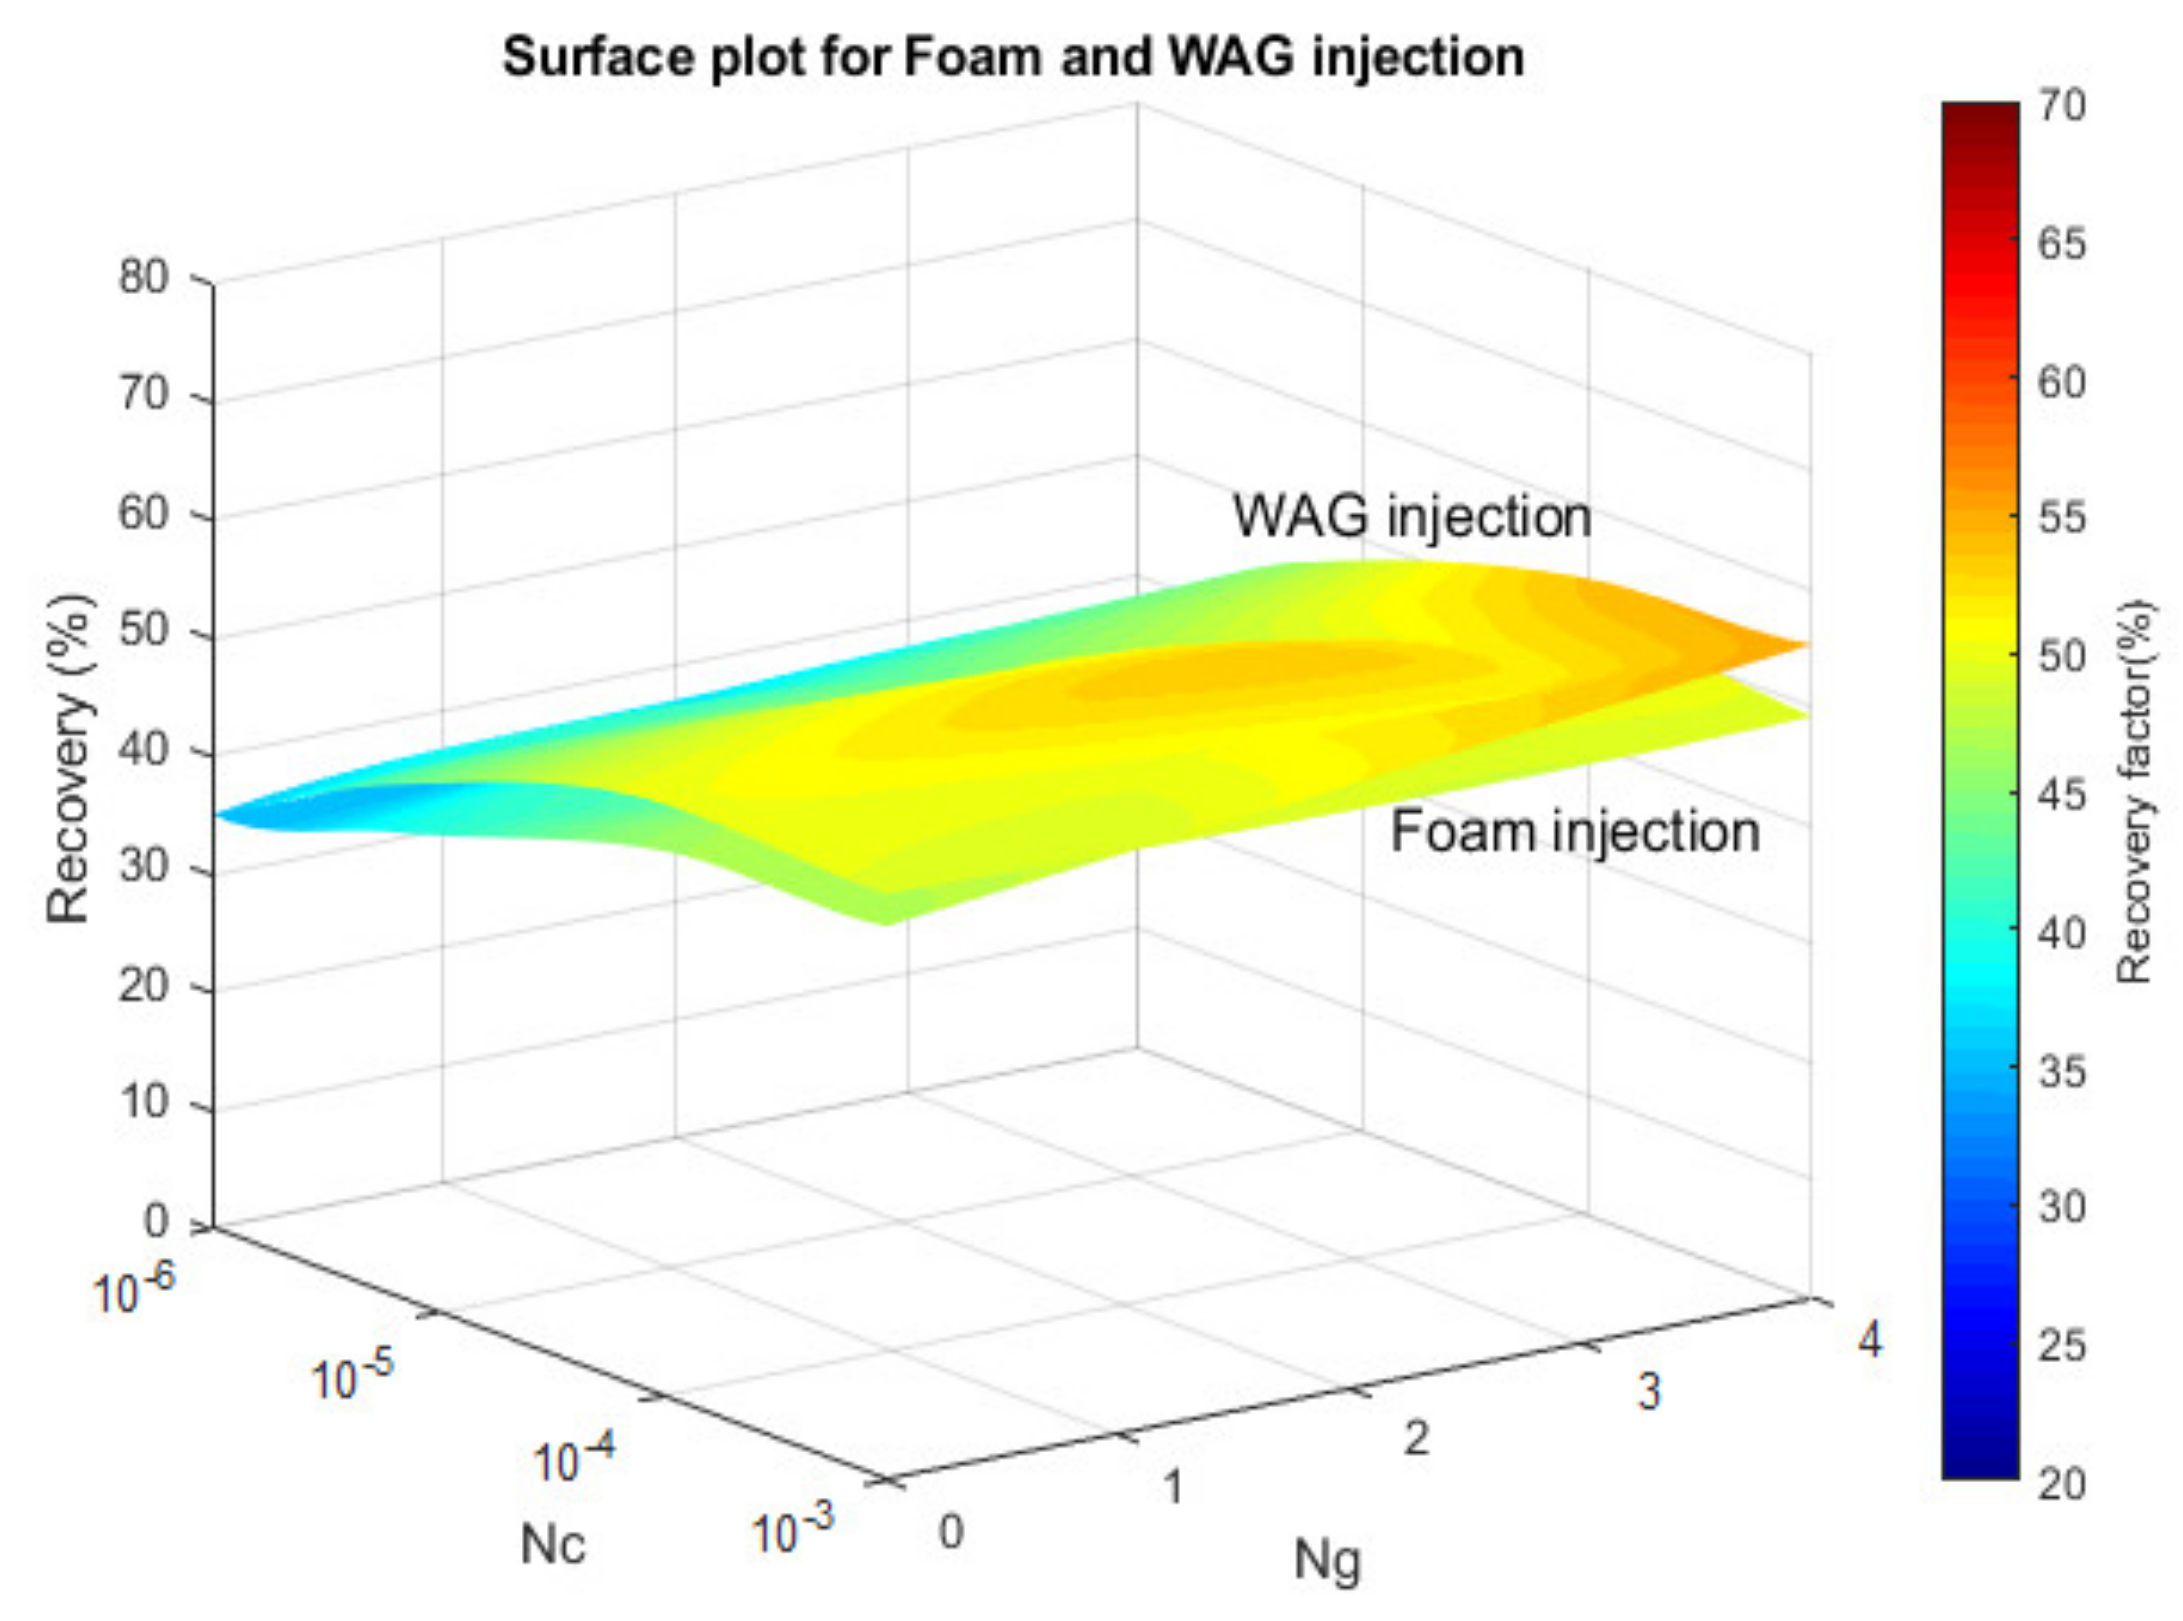
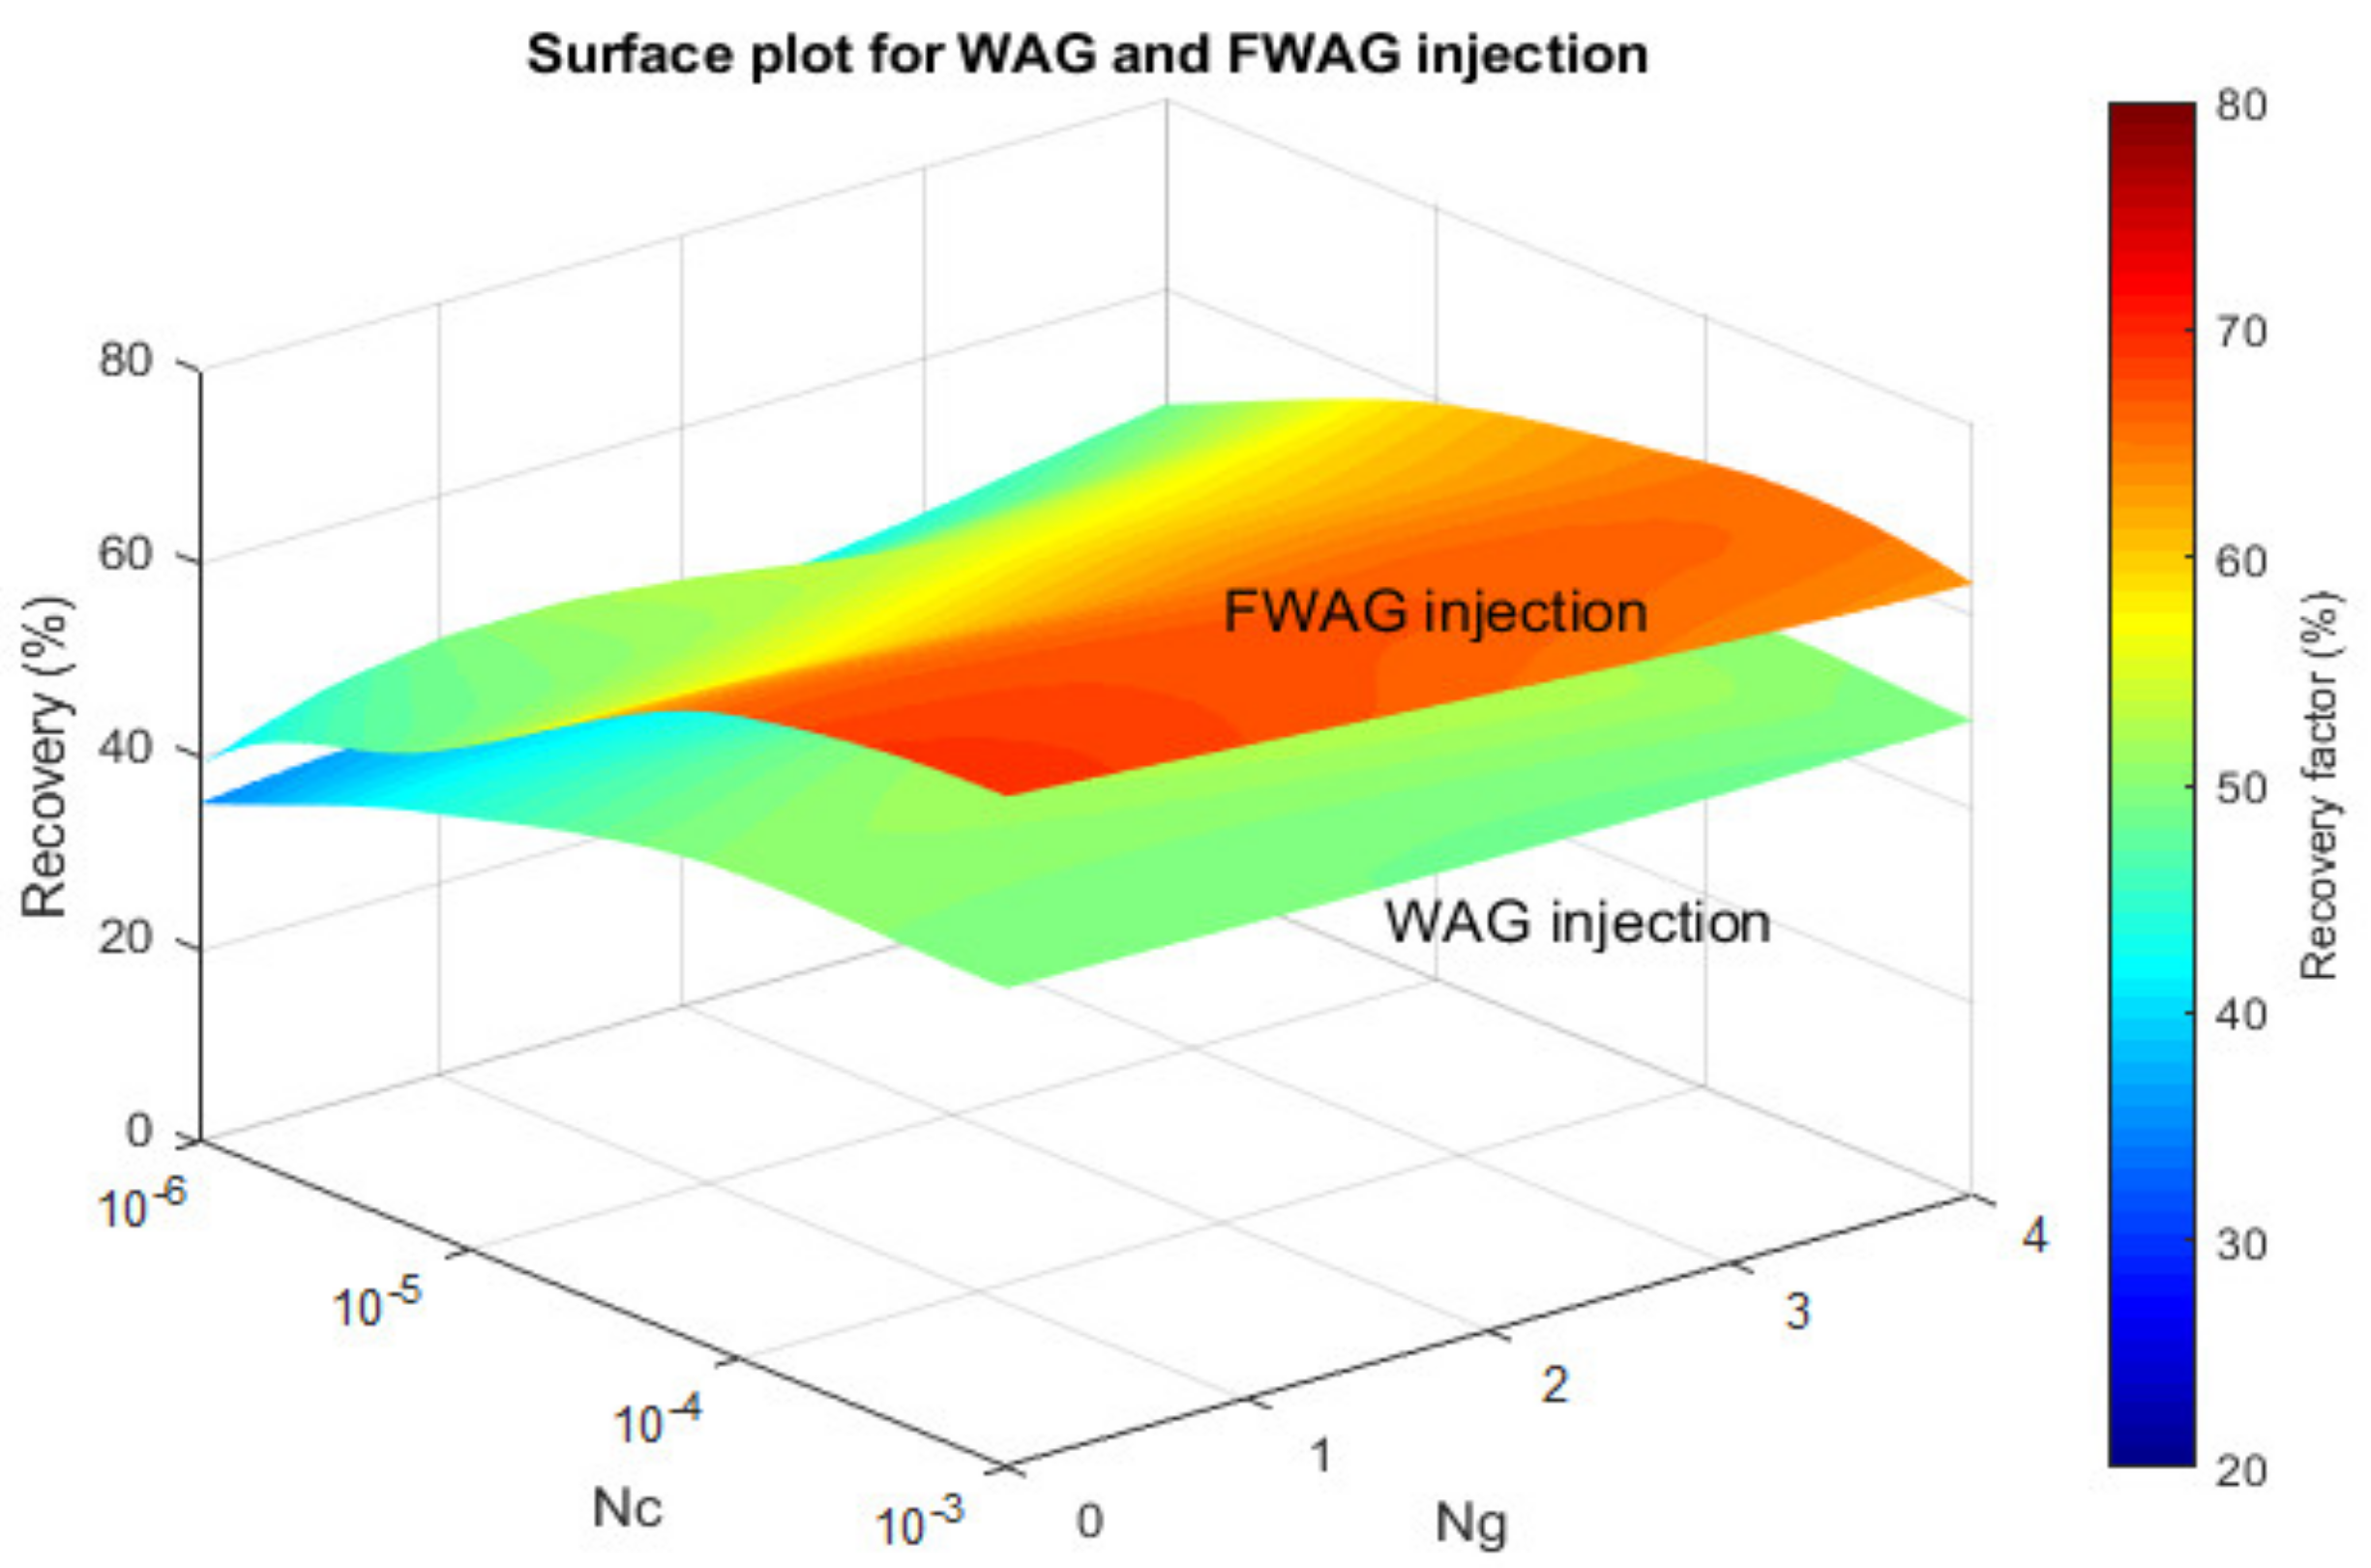
Figure 9,
Figure 10 and
Figure 11, respectively.
The highest recovery value for all processes is when the capillary number or gravity number dominates. In other words, both capillary and gravitational forces play an essential role in the overall recovery. Moreover, the dominance of either gravity or capillary forces can determine the magnitude and direction of flow into the matrix block during different EOR methods [
5,
6,
11,
16].
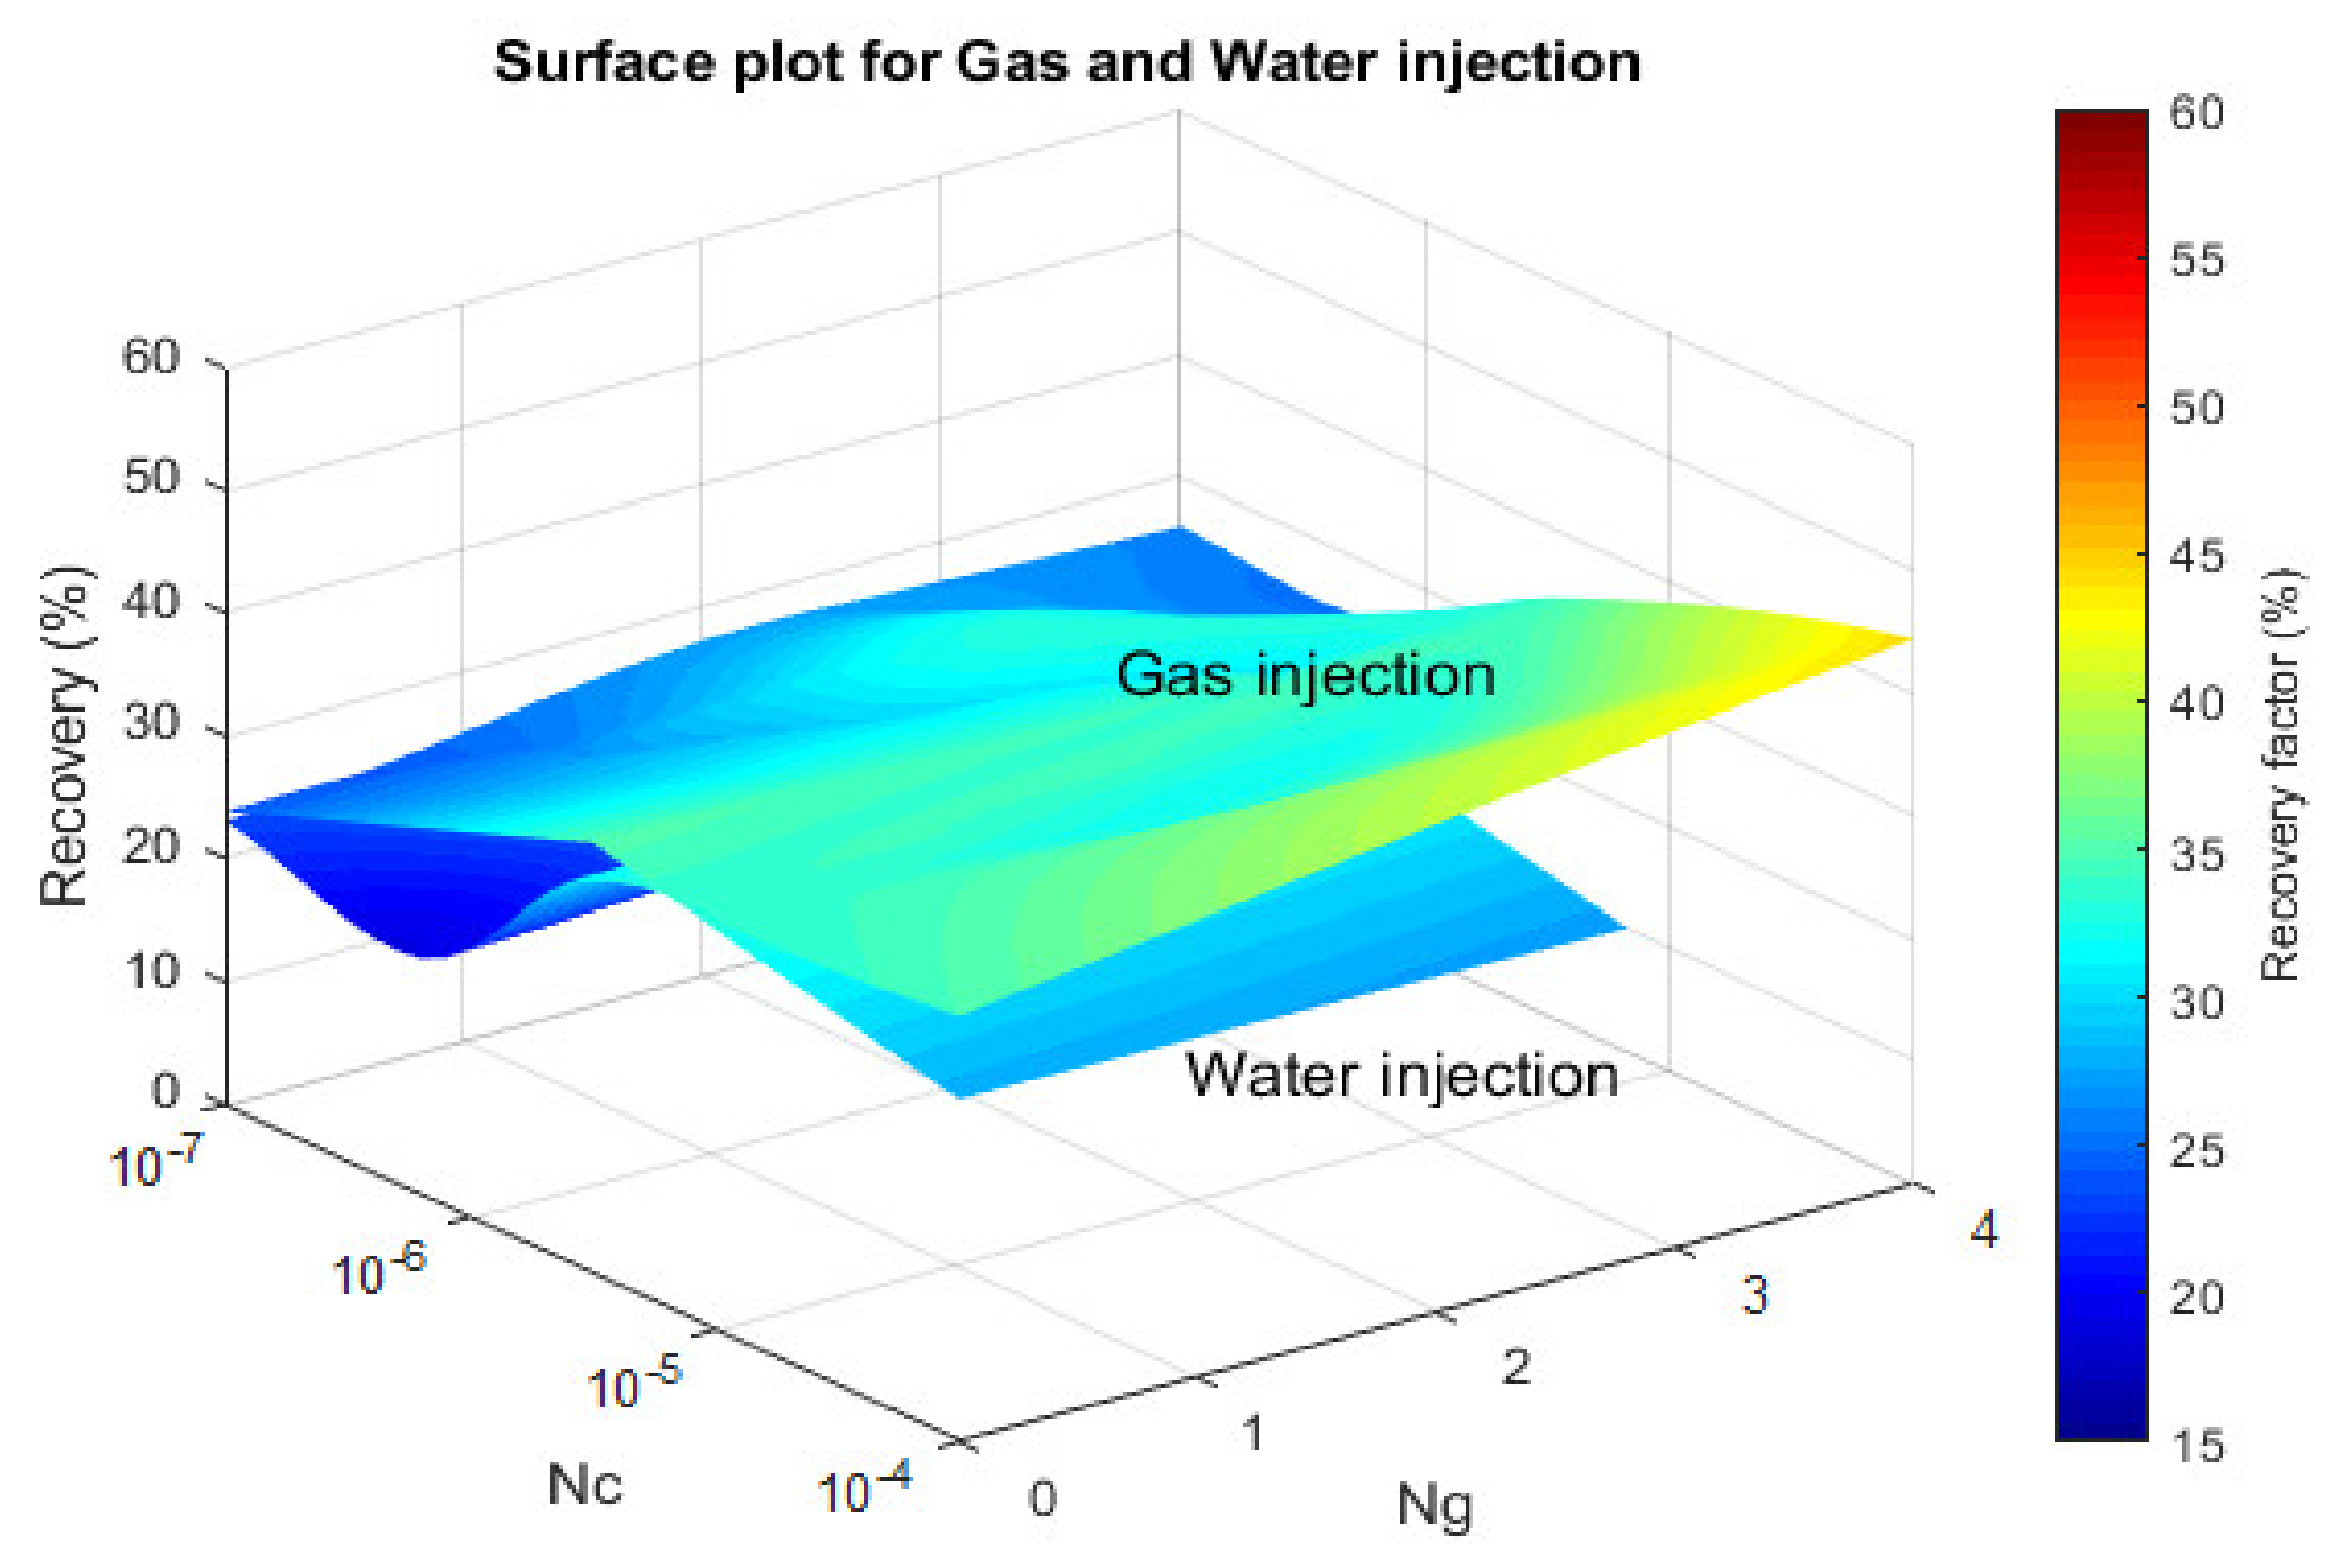
The highest recovery value is obtained in water flooding when the capillary forces are dominant (accelerate the imbibition rate), as seen from
Figure 9. Of course, the gravitational forces can be augmented for more recovered oil if the assisted imbibition solution such as surfactant injection processes takes into account. In gas injection, gravitational forces govern the recovery process, and capillary forces are less dominating (
Figure 9).
The foam injection results in higher recovery with respect to gas injection due to the less gravity override and less viscous fingering phenomenon. However, the equilibrium forces are essential in determining the optimum recovery. As shown in
Figure 10, the higher recovery corresponds to a lower capillary range and higher gravitational force.
One can assume that capillary and gravitational forces might play a role in the recovery process, as water and gas are injected into the alternative scheme. It may be expected that capillary forces assisted in gravitational forces as gas mobility is controlled by water in the WAG process (
Figure 10). Therefore, the highest oil recovery factor is obtained in the combination of capillary and gravitational forces. The injected water controls the mobility of the gas phase. It increases the effectiveness of gravitational forces rather than the capillary number, as others observed in the feasibility study of the WAG process of different WAG ratios for fractured reservoirs [
21].
Foam and WAG injection decrease gas mobility and increase the sweep efficiency and oil recovery over the gas injection. WAG can reduce gravity override because of the small density difference between water and oil. In this case, the capillary forces are more effective in WAG injection due to the water imbibition and late gas breakthrough, especially in the low permeability matrix. Previous studies reported that the balance of driving forces is a key determining factor in the performance of the WAG method in fractured reservoirs [
21]. Hence, the efficiency of WAG injection is highly dependent on matrix and fluid properties.
Foam can take advantage of gravitational and capillary forces to assist both gravity drainage and capillary imbibition process. Foam injection might result in IFT reduction and change the matrix’s wettability toward more wetness, accelerating the gravity drainage and imbibition process. Therefore, foam injection can divert the injected gas and increase sweep efficiency more than WAG (see
Table 4).
When the gravitational and capillary forces are in equilibrium, the gravity and capillary numbers for foam injection are slightly higher than WAG injection (
Table 4). Therefore, it seems that foam’s effectiveness for mobility control is more than WAG and its ability to diverts flow from fractures into matrix blocks. Consequently, the surfactant transportation during foam injection reduces IFT and changes the matrix’s wettability, improving the oil recovery.
Interestingly, the FAWAG recovery process results in higher recovery for all capillary and gravitational ranges than water flooding and gas injection (
Figure 11).
The low IFT accelerates both capillary imbibition and gravity drainage process, resulting in more oil recovery (
Table 4). The water injection has low recovery due to the early breakthrough as a result of oil-wet rock wettability. In the case of FAWAG injection, gravity drainage, along with diffusion and reimbibition, results in high capillary and moderate capillary numbers in which higher oil recovery is obtained.
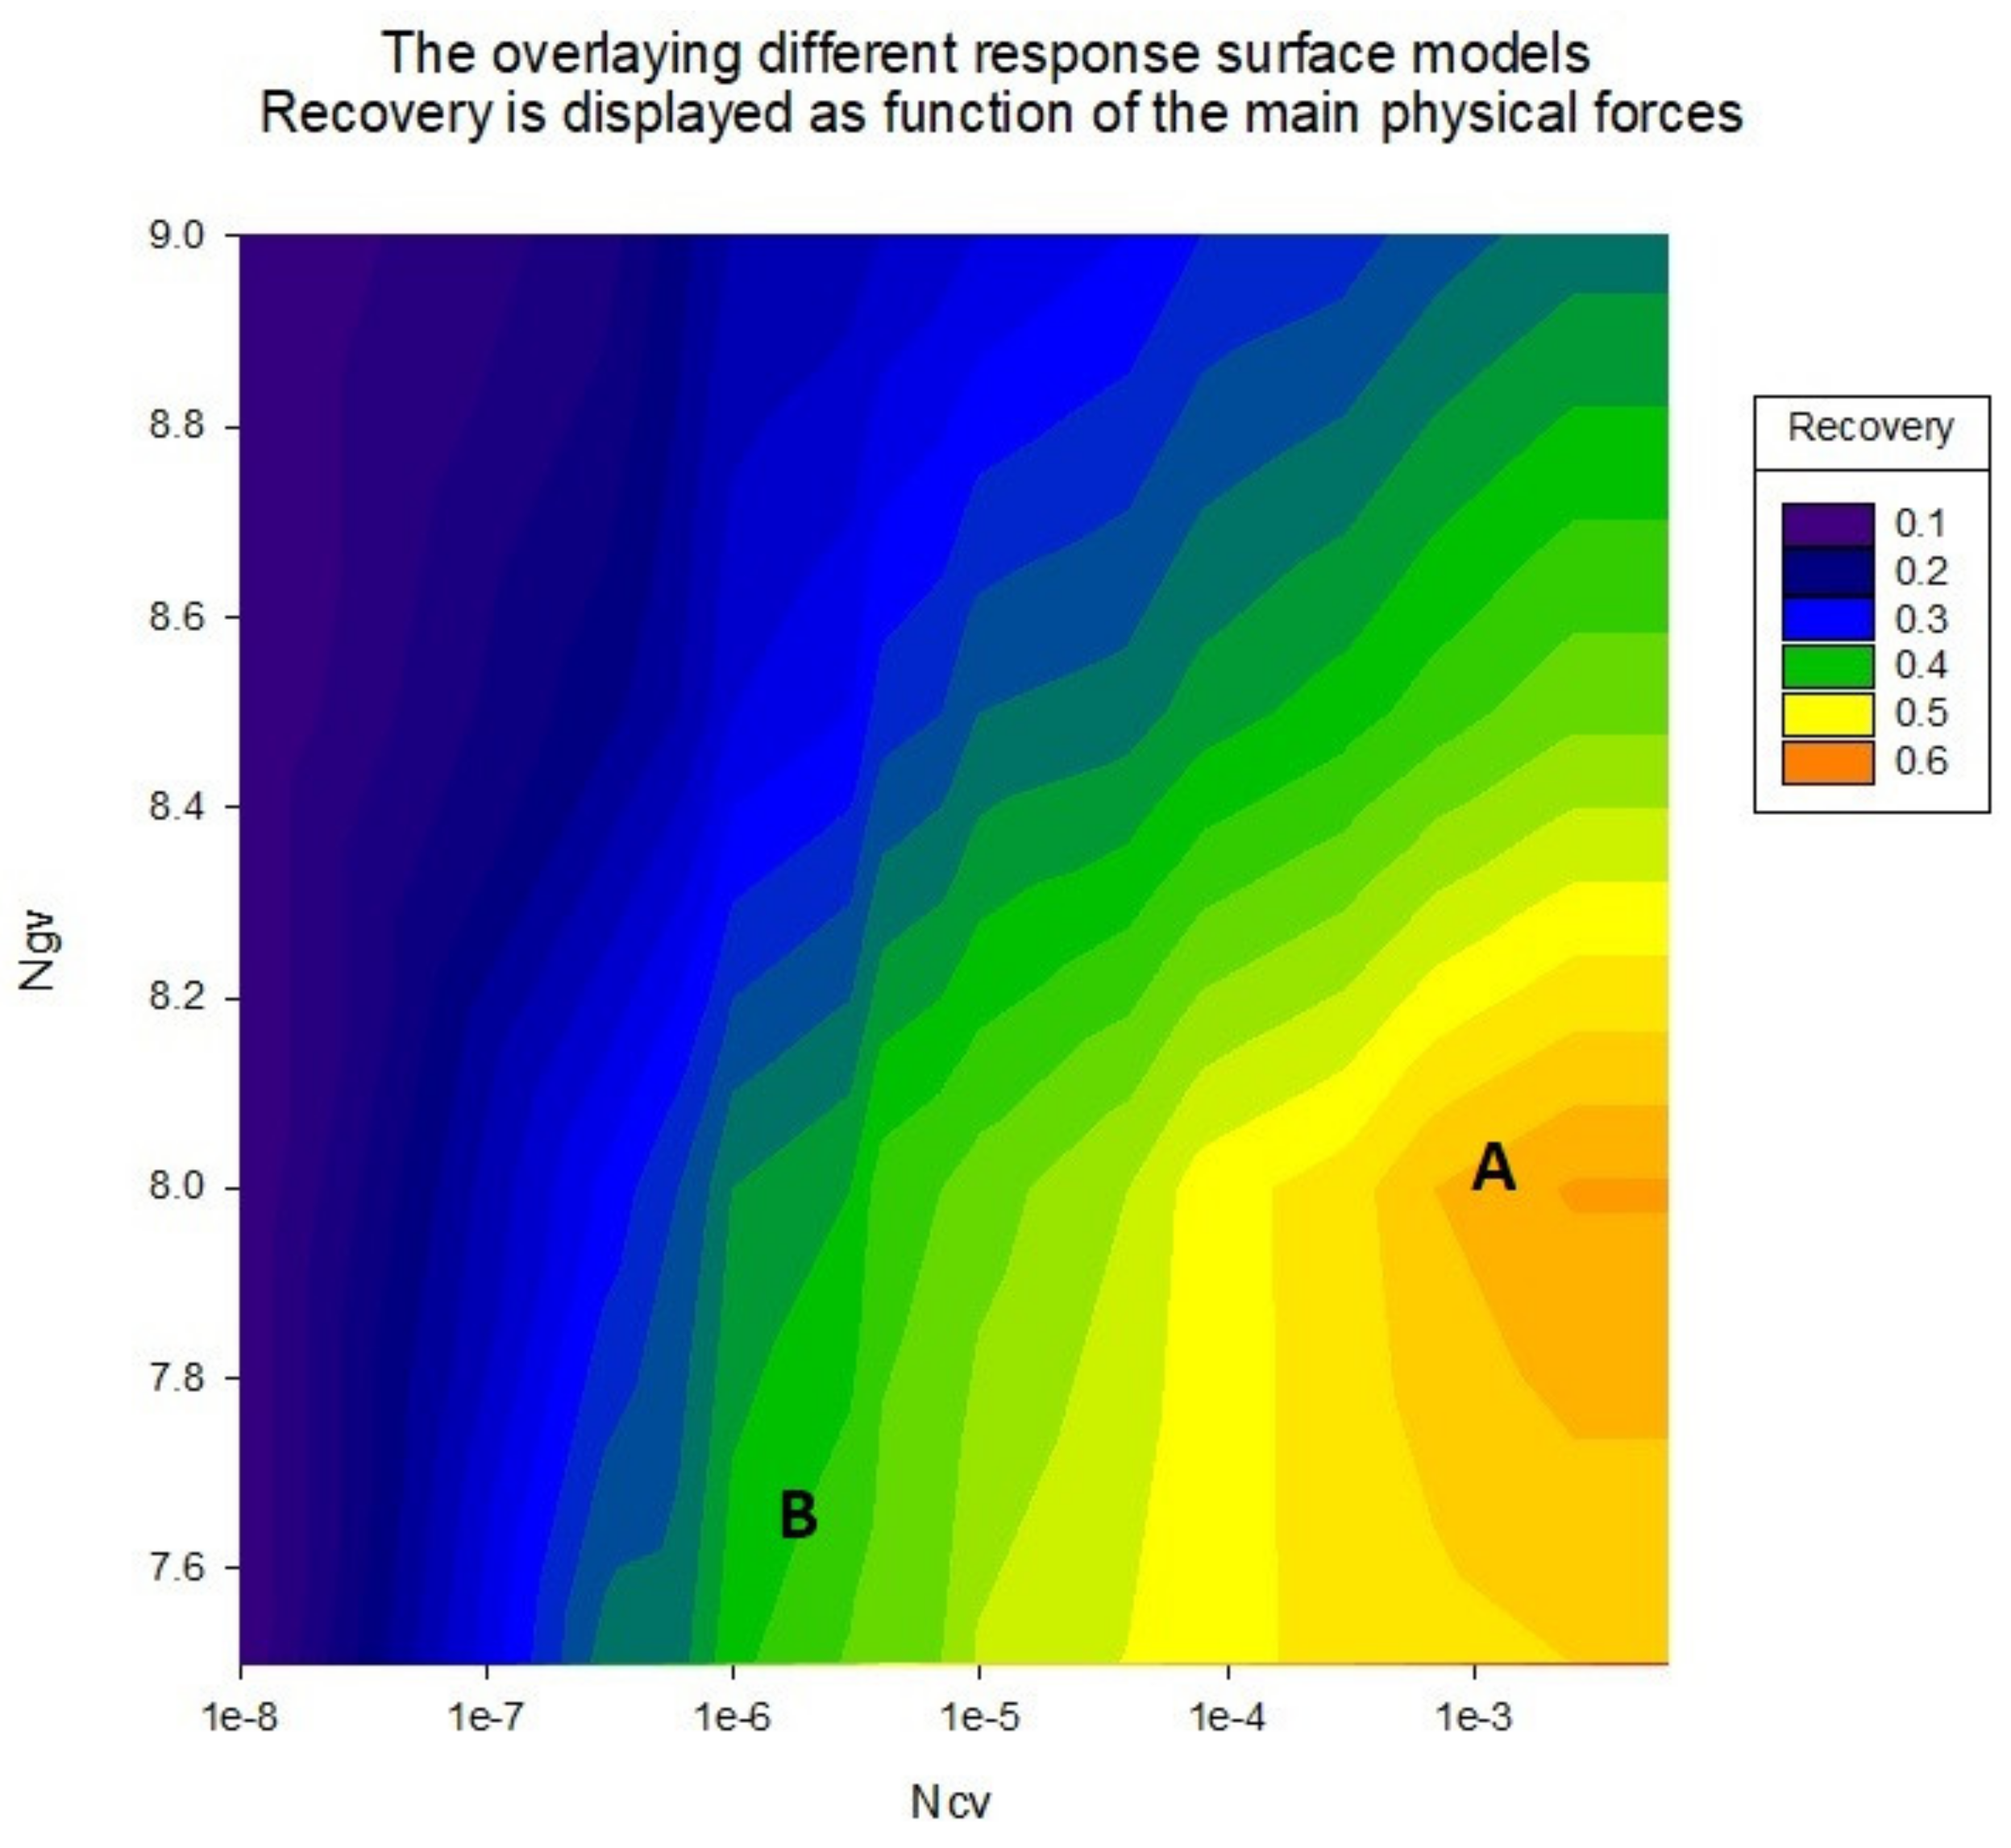
The top view of the overlaying response surface models of the five injection methods and their response surfaces are shown in
Figure 12. Points “A” and “B” were selected to compare the gas, WAG, and FAWAG injection performance under different conditions of driving forces. Point “A” expresses a gravity-driven condition, while point B is selected under a capillary-driven condition. The governing condition was established with fluid and rock properties.
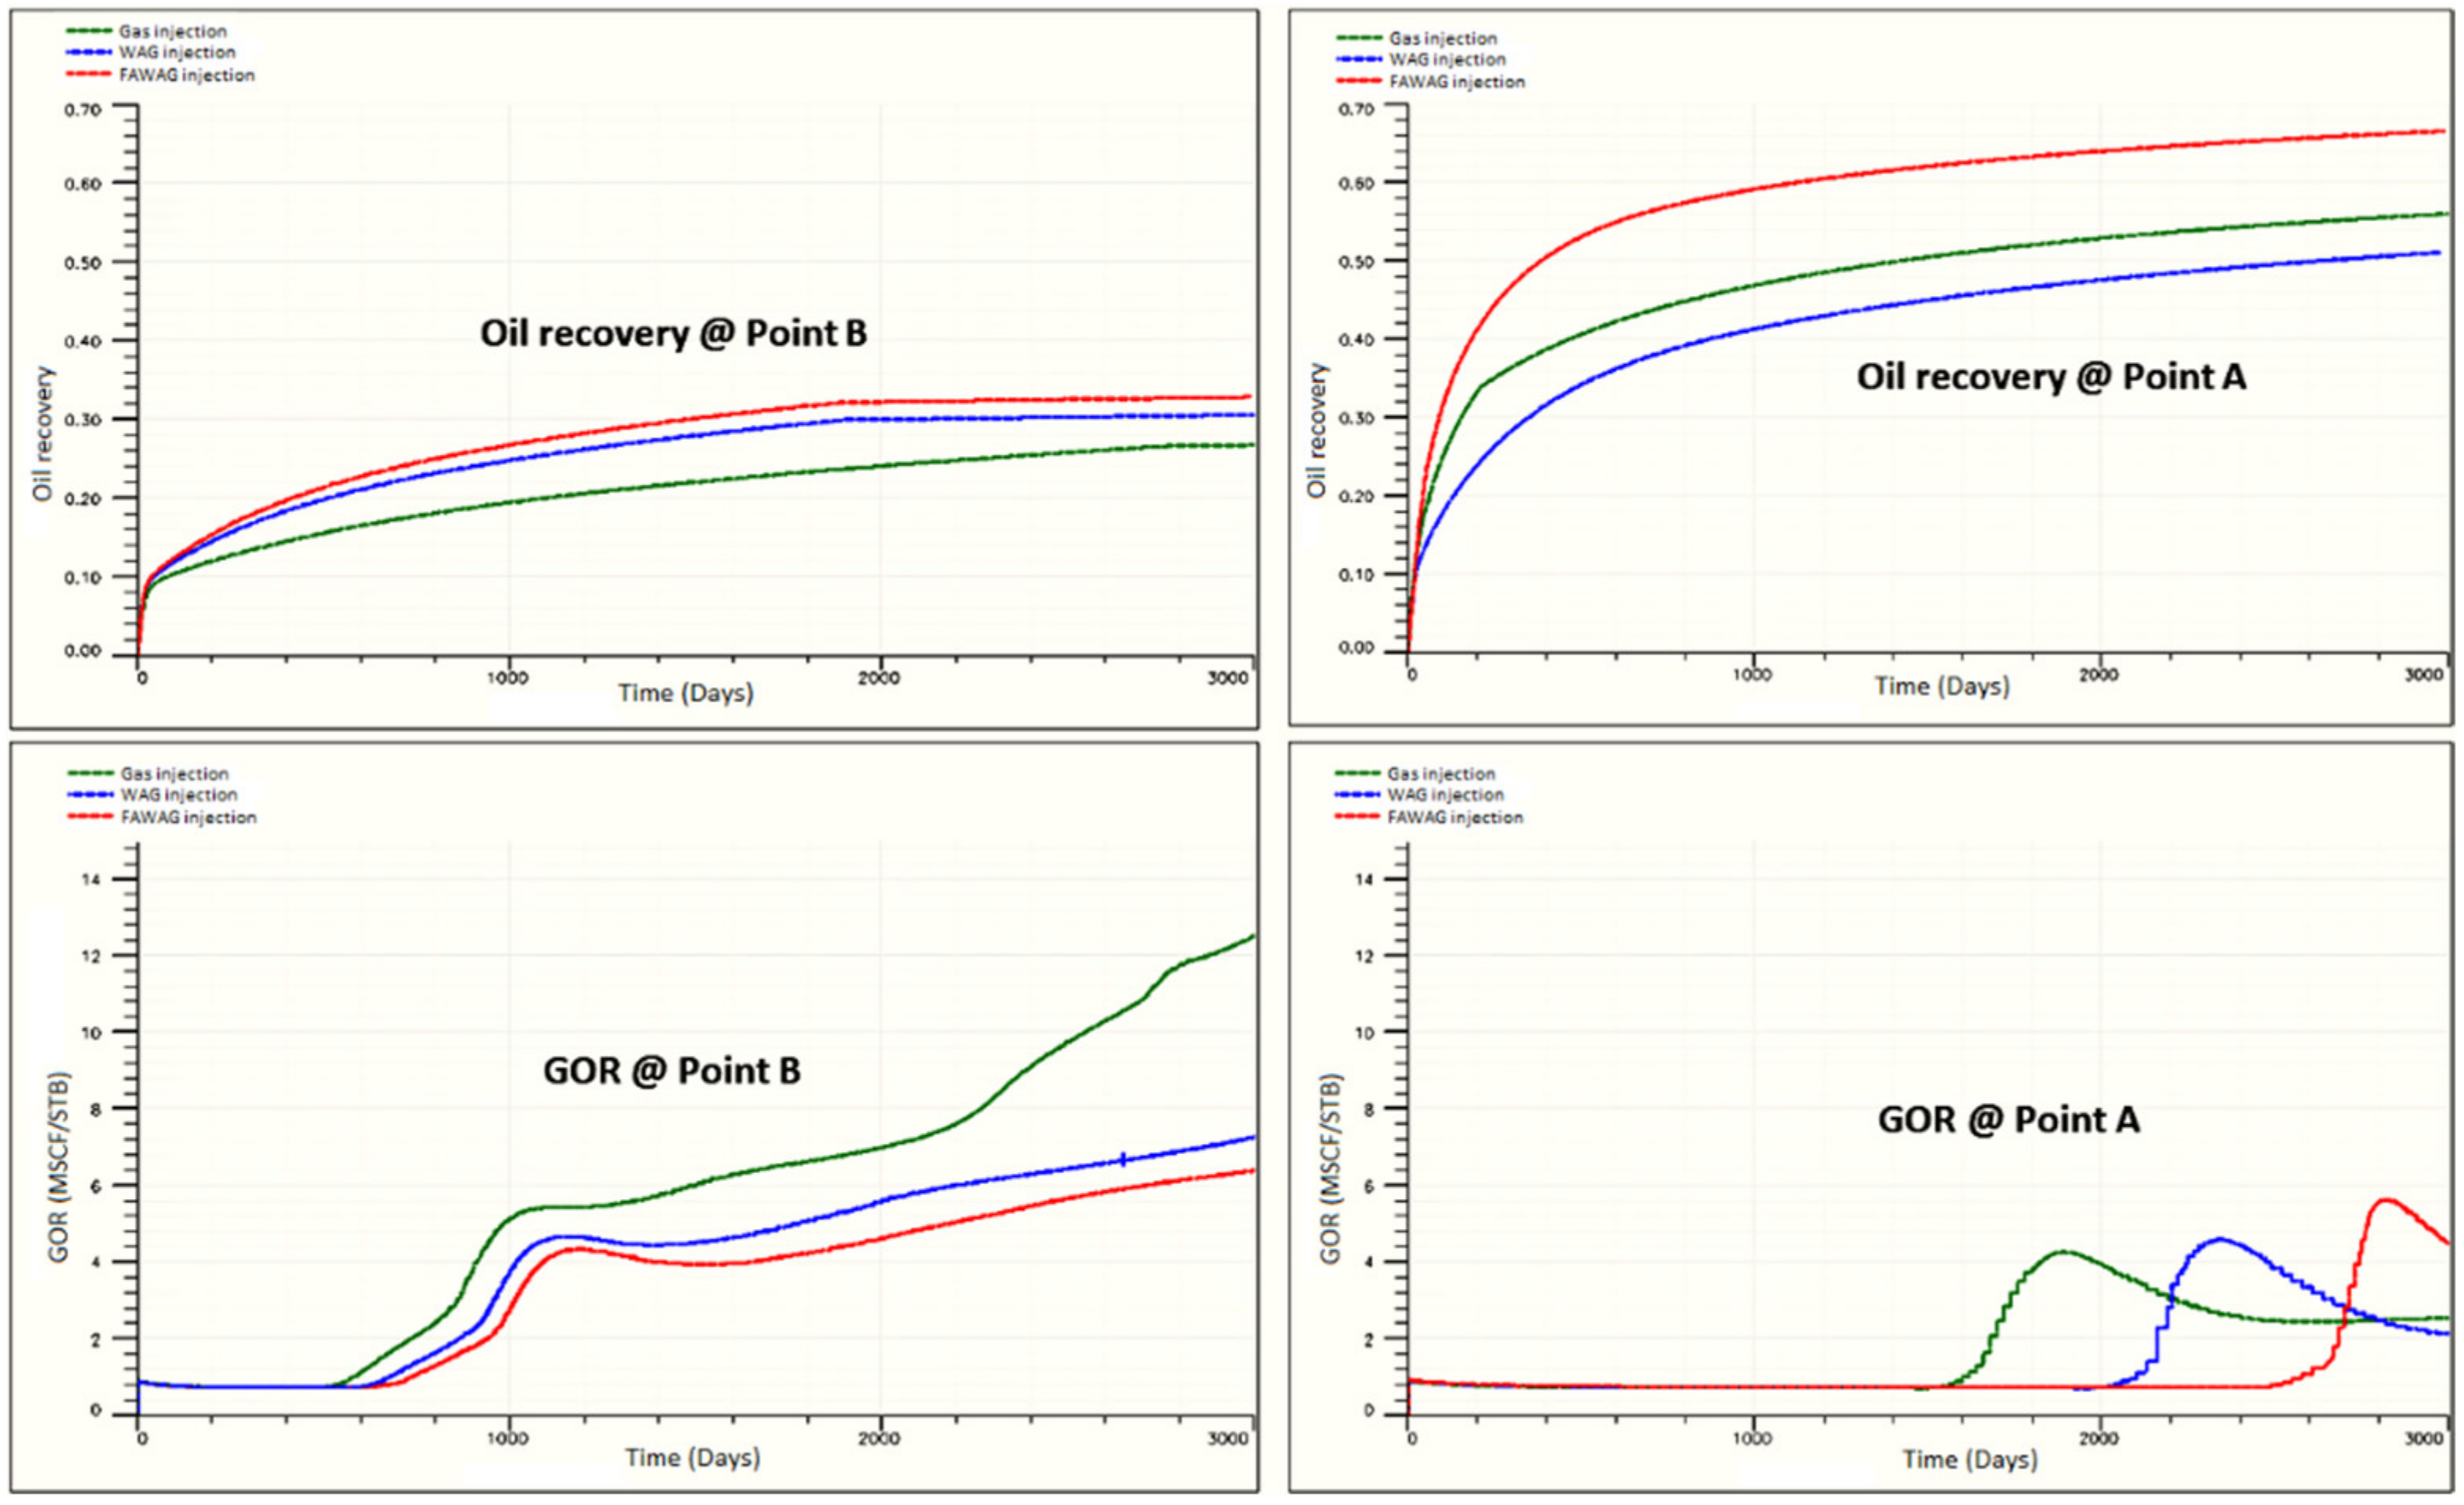
Figure 13 shows the oil recovery for the three processes for “A” and “B”.
In both cases, the FAWAG results in a higher recovery than the WAG and gas injection. However, the gas injection performs better than the WAG in the “A” due to the gravity govern capillary forces. In the case of point “B”, in contrast, the WAG recovery is higher than the gas injection and less than the FAWAG, as capillary forces dominate over gravitational forces. As mentioned earlier, WAG and FAWAG act as mobility control agents that improve gas injection sweep efficiency. The evidence of such an accomplishment can be proven by delay in gas breakthrough and recovery enhancement.
Figure 13 compares the gas–oil ratio of gas injection with WAG and FAWAG to show how much they made a delay in breakthroughs time. It can be assumed that when the gravitational forces dominate, more gas penetrates the matrix block, which reduces gas production. In the FAWAG process, the matrix properties such as matrix size and wettability control the displacement mechanism by capillary and gravitational forces.
Moreover, surfactant in the foam leads to more wetness conditions and IFT reduction, which plays a role in the oil recovery form matrix. Additionally, foam-assisted WAG injection can cause a viscous displacement that drives the gas into the matrix. Therefore, the FAWAG process takes advantage of several mechanisms that increase its performance. As an overall trend, a decrease in the gas–oil ratio is achieved when WAG or FAWAG injection takes into account, and a delay in breakthroughs is observed.
As shown in
Figure 13, FAWAG injection is more effective than WAG as it delays the breakthrough time for approximately 600 days. It might be due to the impact of foam-assisted WAG injection in further reduction of gas mobility.
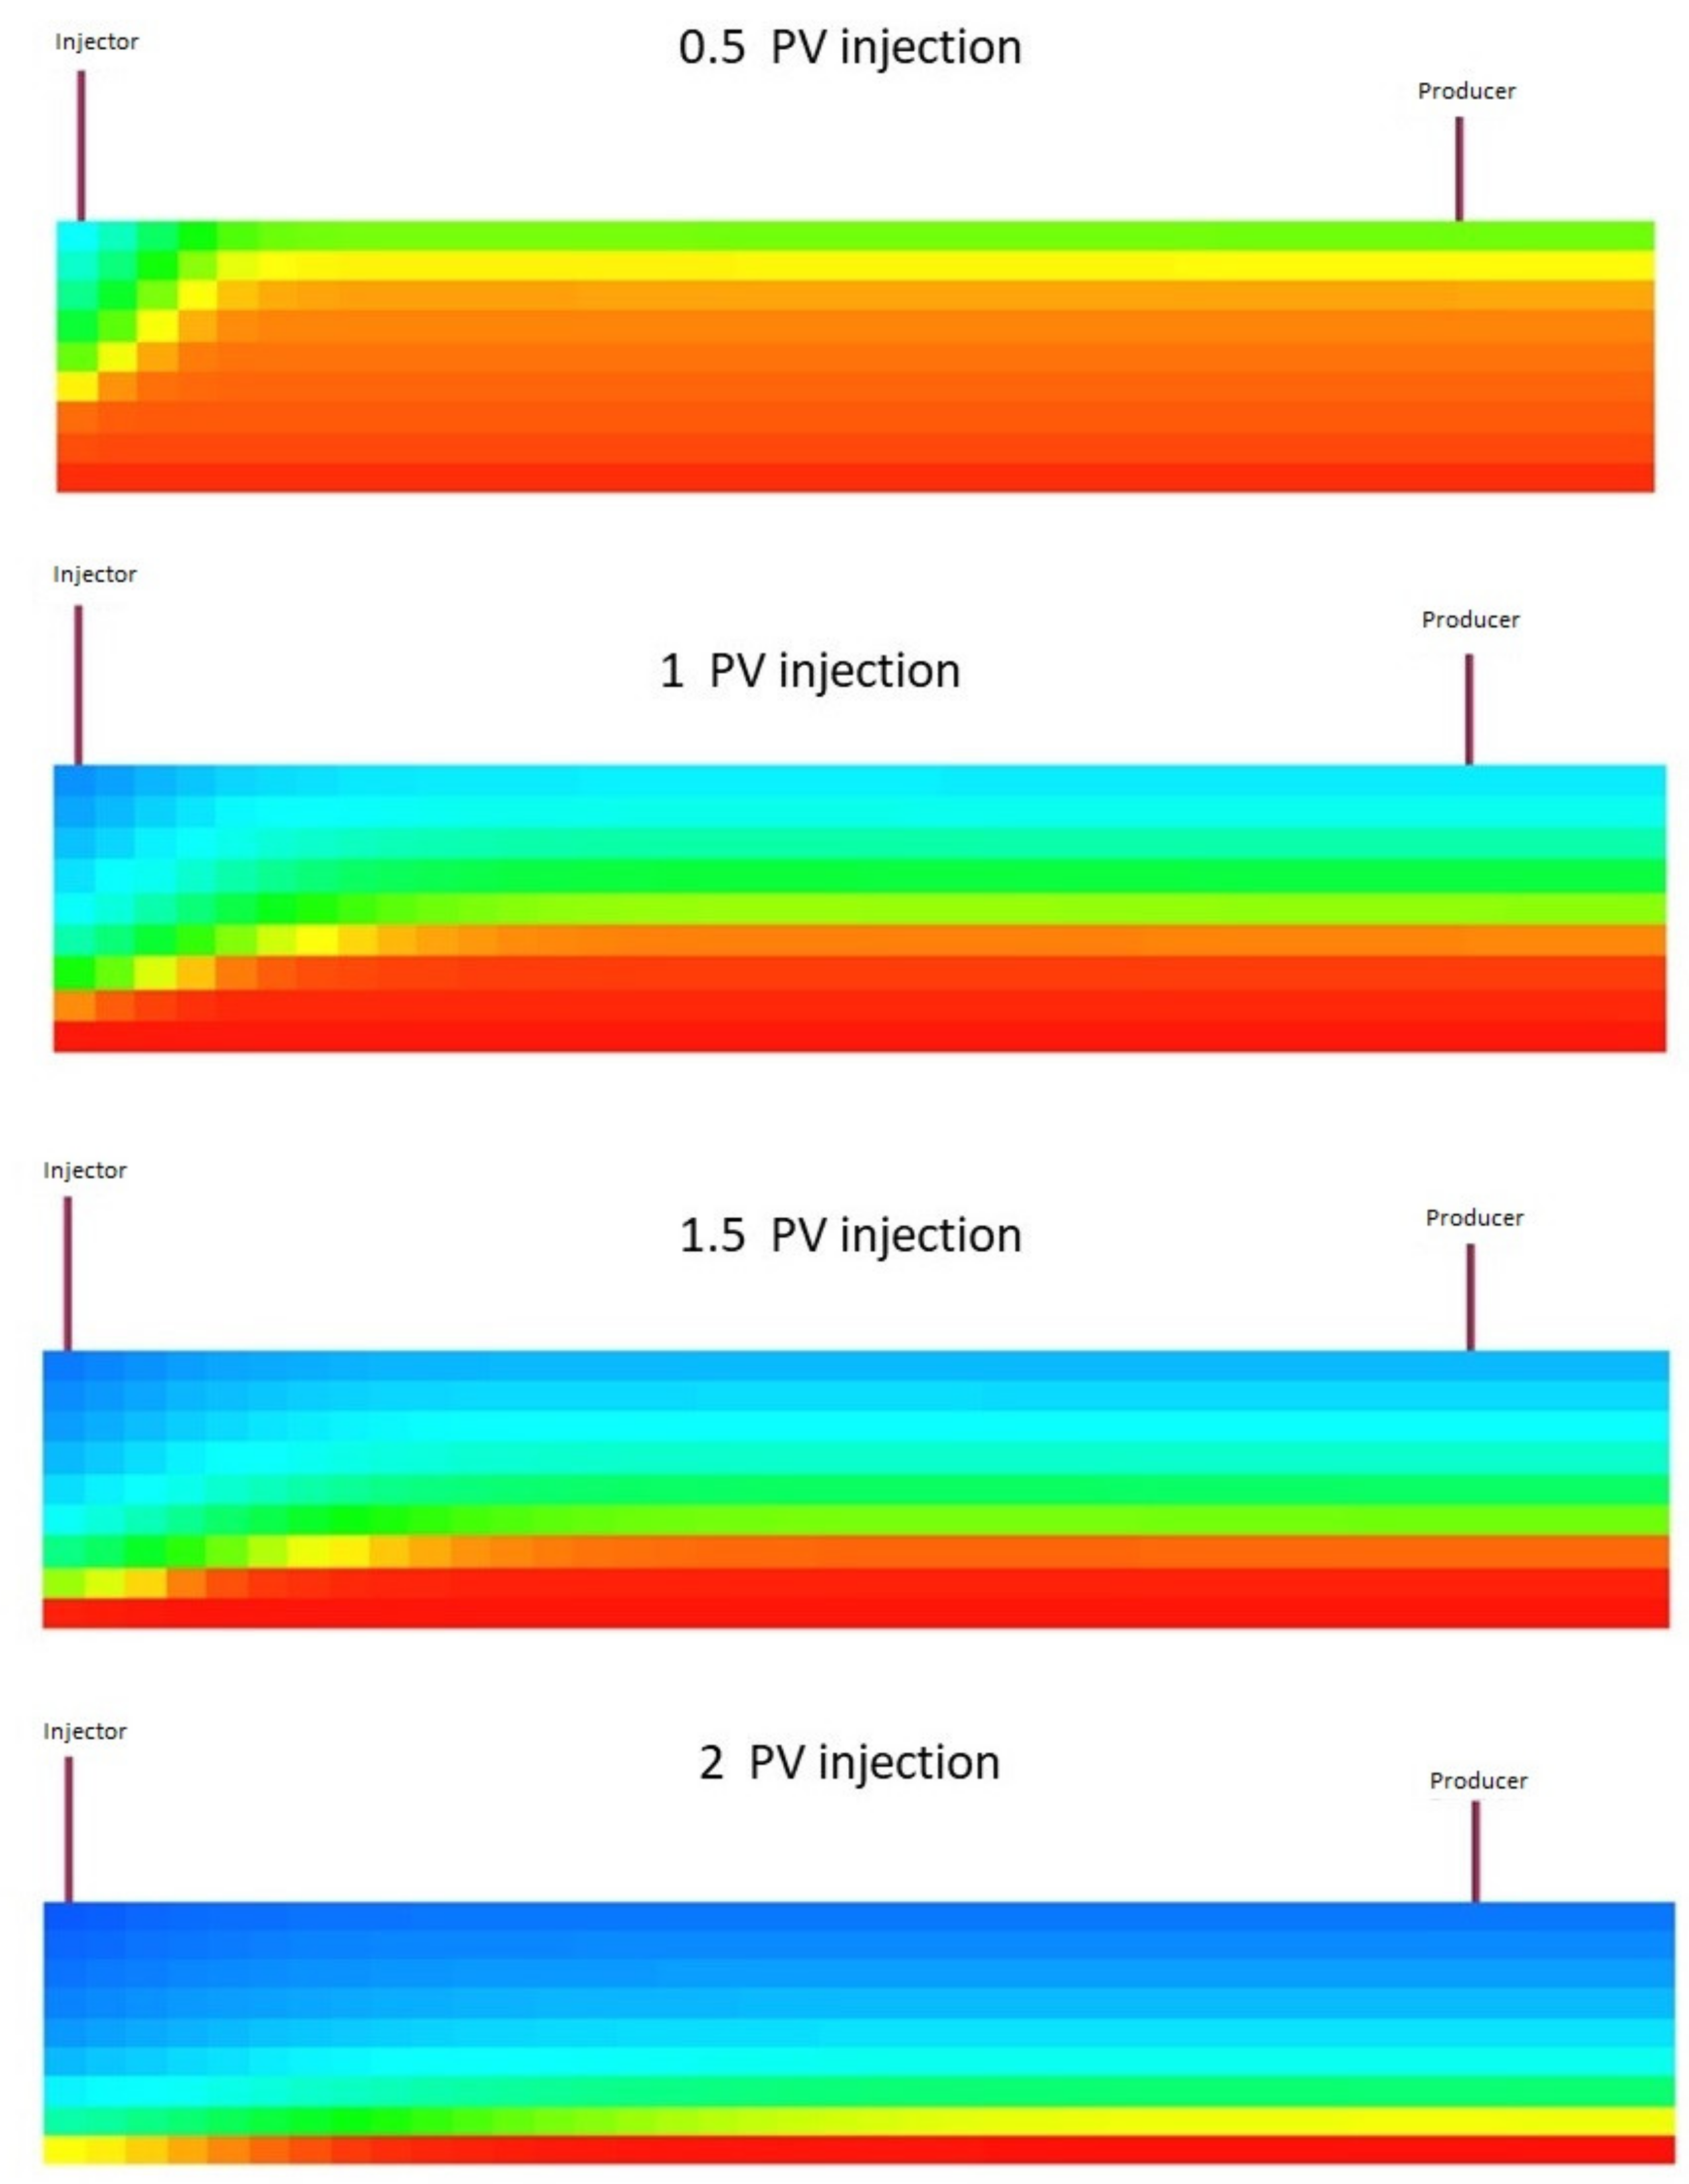
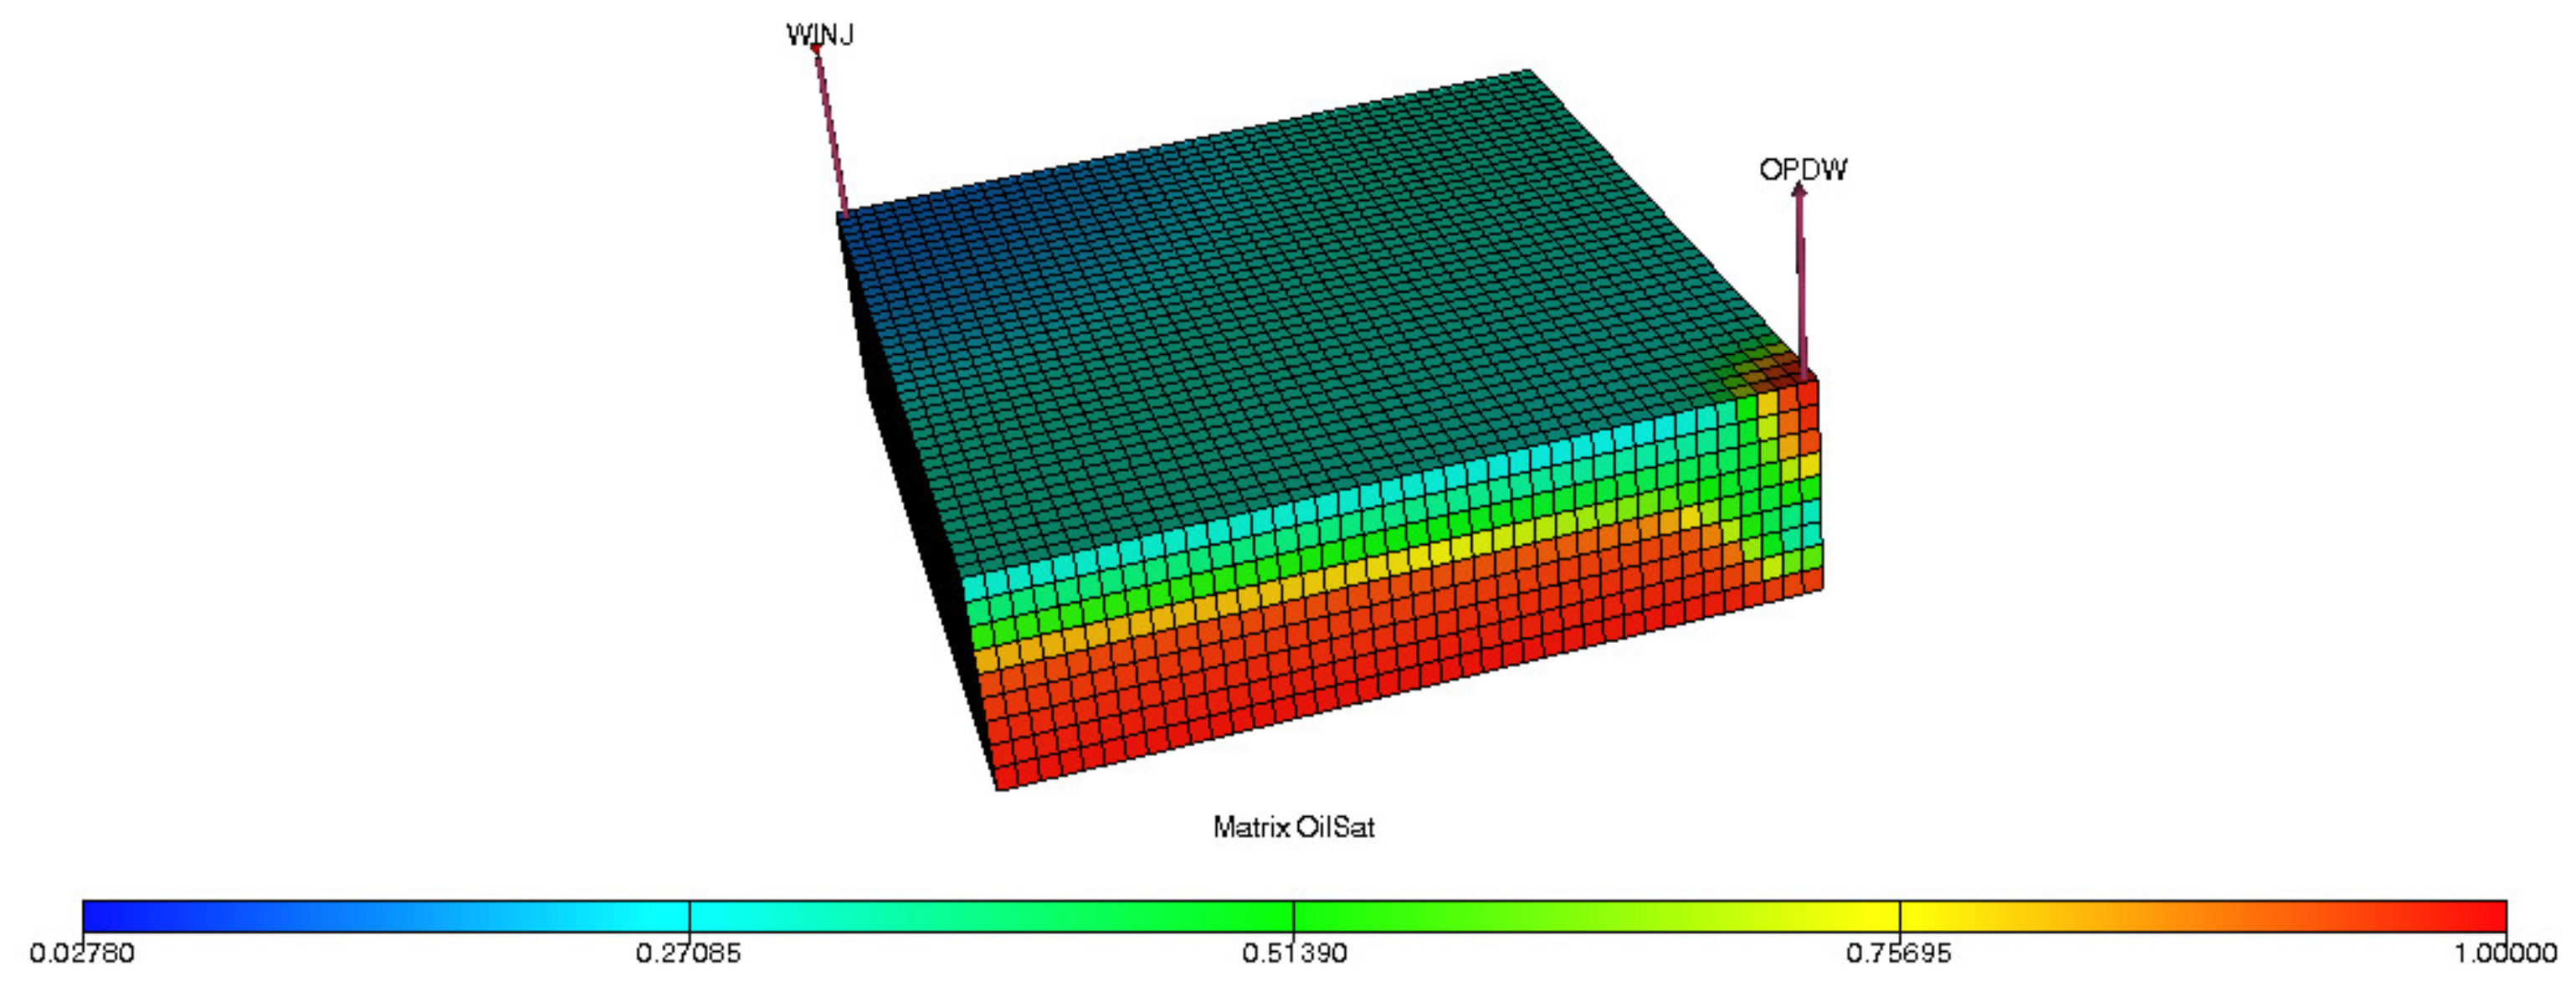
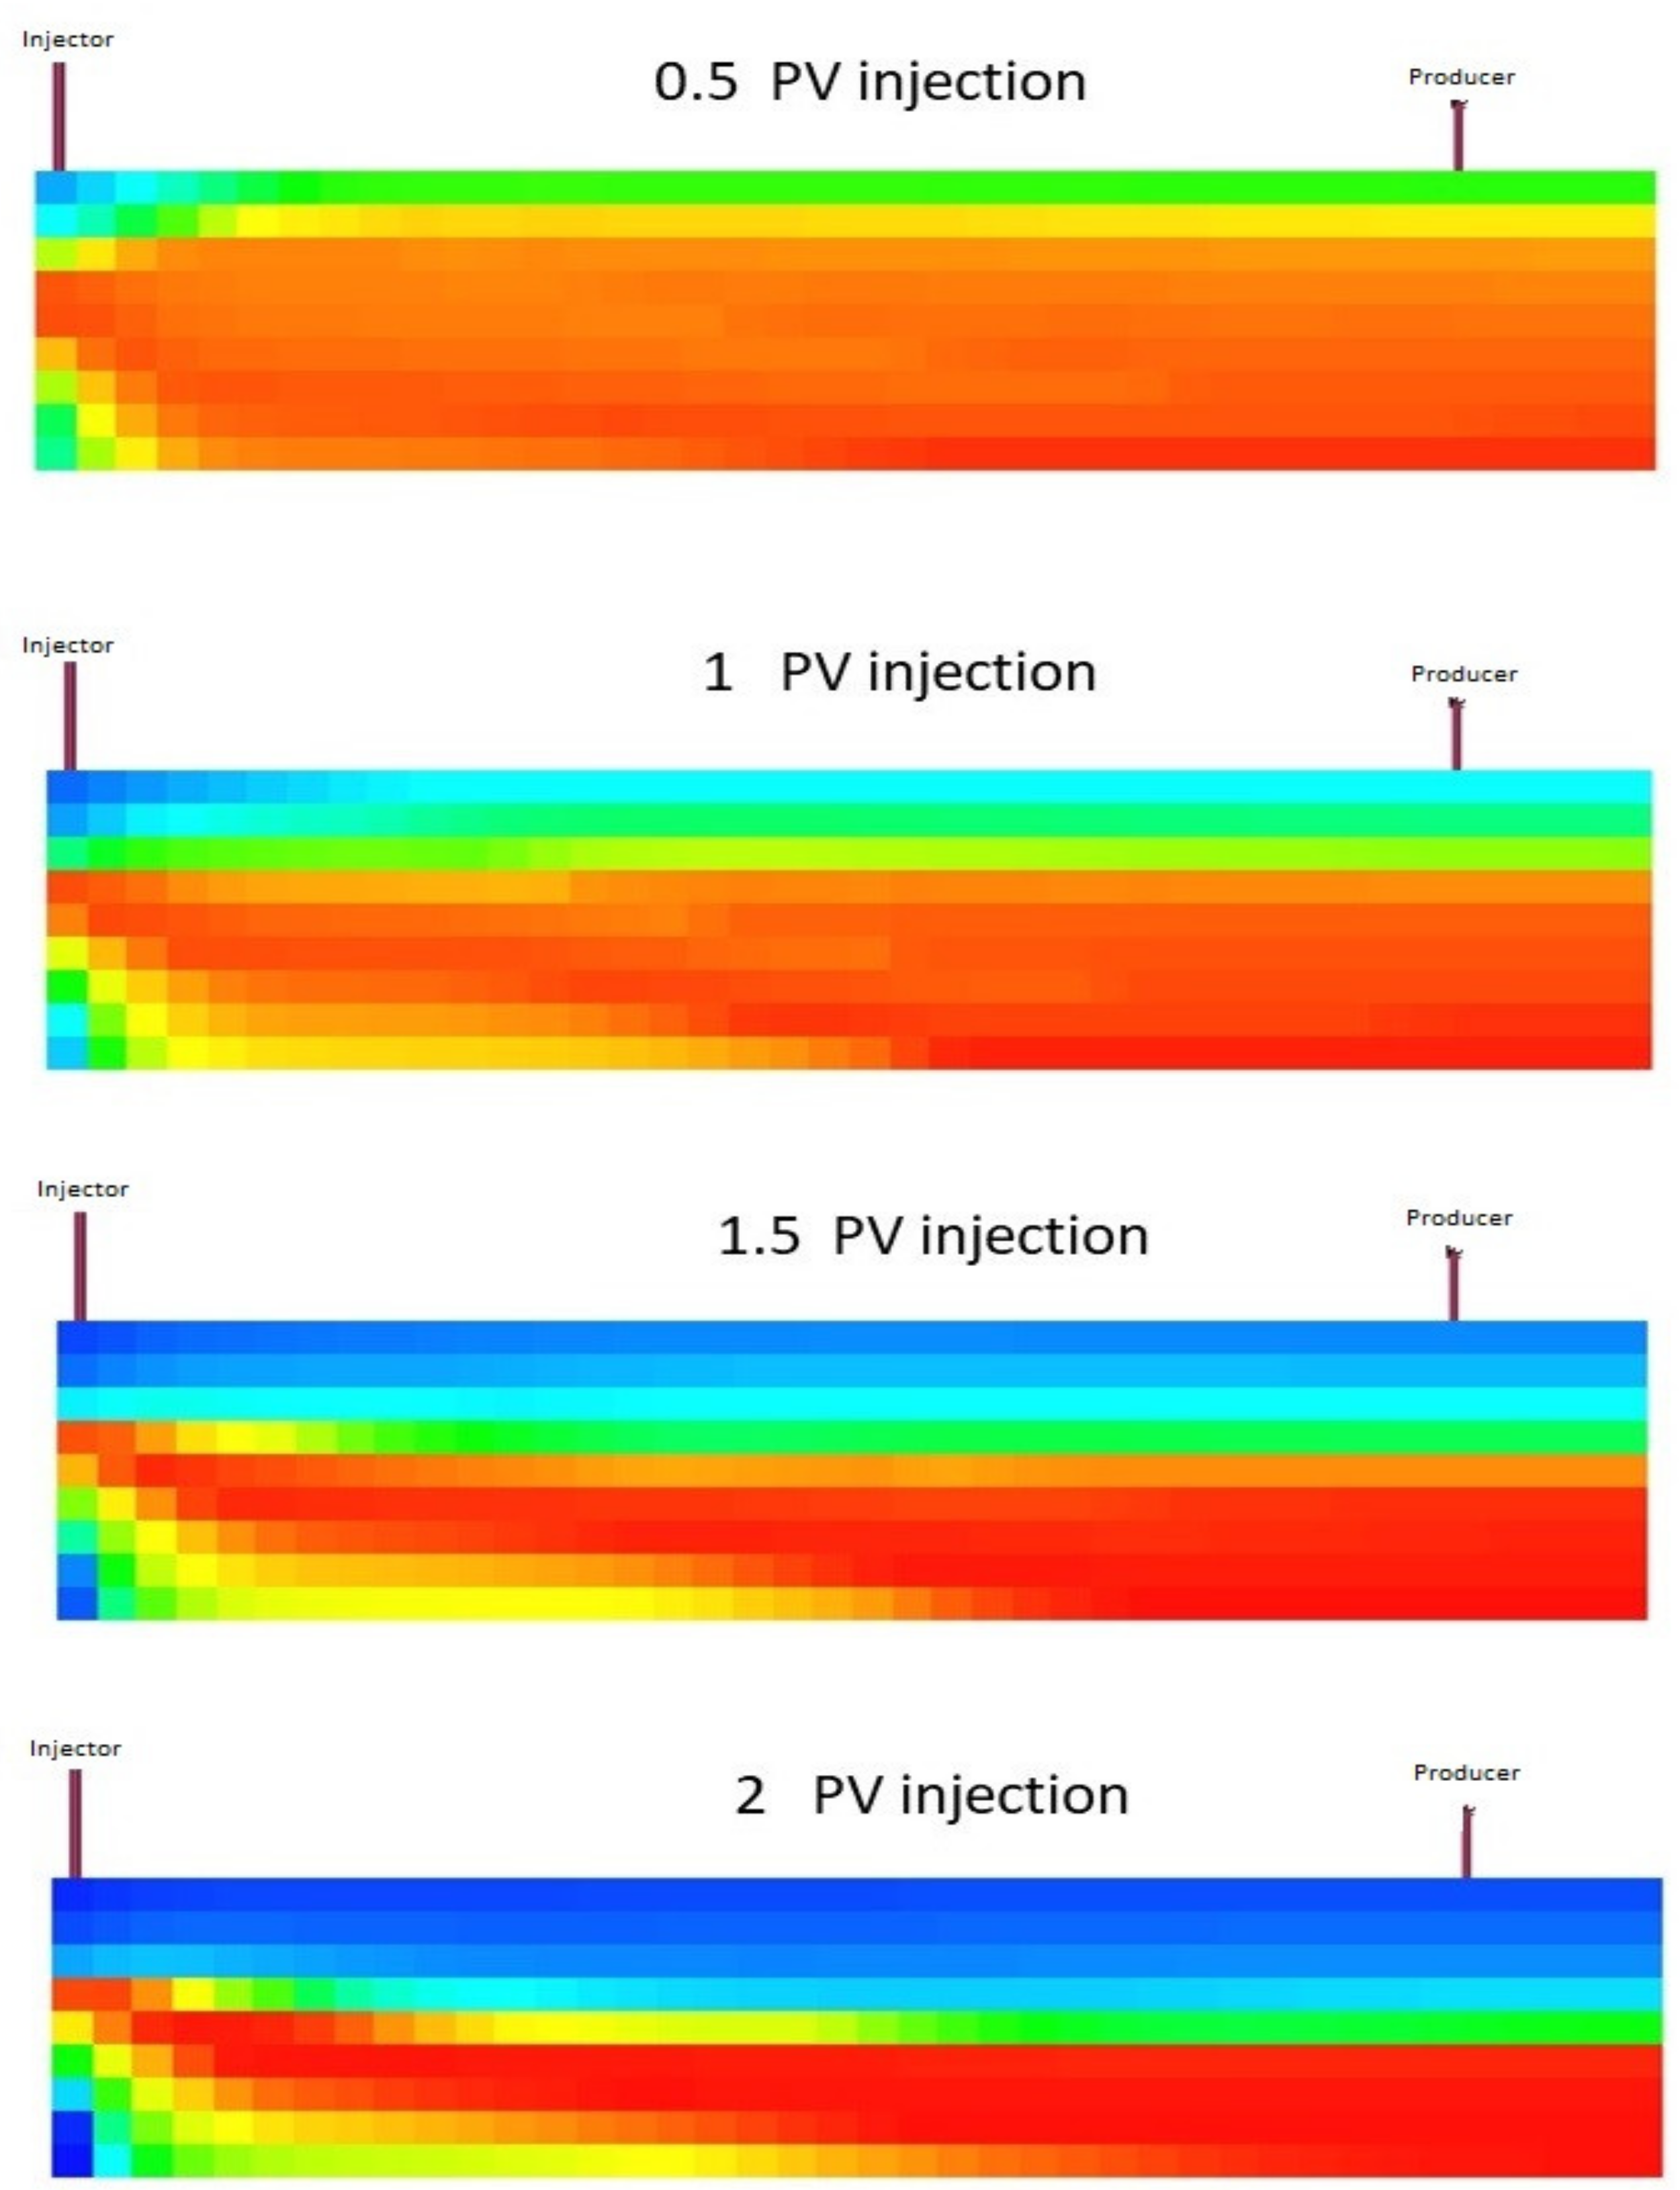
From the saturation profiles, the gravitational forces and capillary forces can be depicted in a visualization approach. The saturation profile at different pore volumes for the gas and FAWAG methods for these processes is shown in
Figure 14 and
Figure 15, respectively. When capillary forces are dominant, as in the case of gas injection, gas override occurs along with early breakthrough, which results in a minimum fluid exchange between the matrix and fracture; consequently, the oil recovery is low. When gravitational forces dominate, more oil will be recovered under natural depletion or by gas injection. The gas acts as the gravity-assisted oil recovery process. Foam and FAWAG injection can overcome capillary forces in case of adverse effects and cause gravitational force dominating through IFT reduction and mobility control of injected gas. As shown in
Figure 15, better displacement is obtained for the FAWAG case, which might be due to gravitational and capillary forces being in equilibrium conditions. In this case, less oil is left behind due to the mobility control of the injection front. Therefore, capillary and gravitational forces dominate the water and gas cycles due to fluid properties alteration schemes, which take advantage of numerous mechanisms. Hence, both forces contribute to draining oil from matrix blocks, resulting in the highest oil recovery.
Based on the obtained results in this work, the dimensionless numbers that incorporate relevant reservoir and fluid parameters are appropriately able to quantify the production mechanisms of EOR methods. In a fractured reservoir, reservoir parameters such as block size, block height, rock’s and fracture’s porosity and permeability, and fracture spacing have a detrimental effect on gravitational and capillary forces. Hence, to have a maximum recovery, the injection properties of EOR fluid should be considered, for example, viscosity, density, and IFT. Once the dominant forces are in equilibrium, the maximum oil recovery can be achieved for the different EOR processes. However, the optimum conditions for these forces are difficult to obtain during the EOR process because of the reservoir properties limitation. The resulting approach can be feasible in quantifying planned EOR methods and qualifying the expected flow behavior. These resulting predictions might provide the criteria for field applications and EOR design and optimization. The performance correlations based on dimensionless numbers can also be generated for reservoirs of varying degrees of modeling complexity that enable recovery estimations for given flow regions. However, the impact of fracture characteristics, matrix block size, and fluid communication necessitate new modified dimensionless numbers for fractured reservoirs. The layered dependence of displacement mechanisms for complicated systems means that the interpretation of flow behavior is inherently limited.
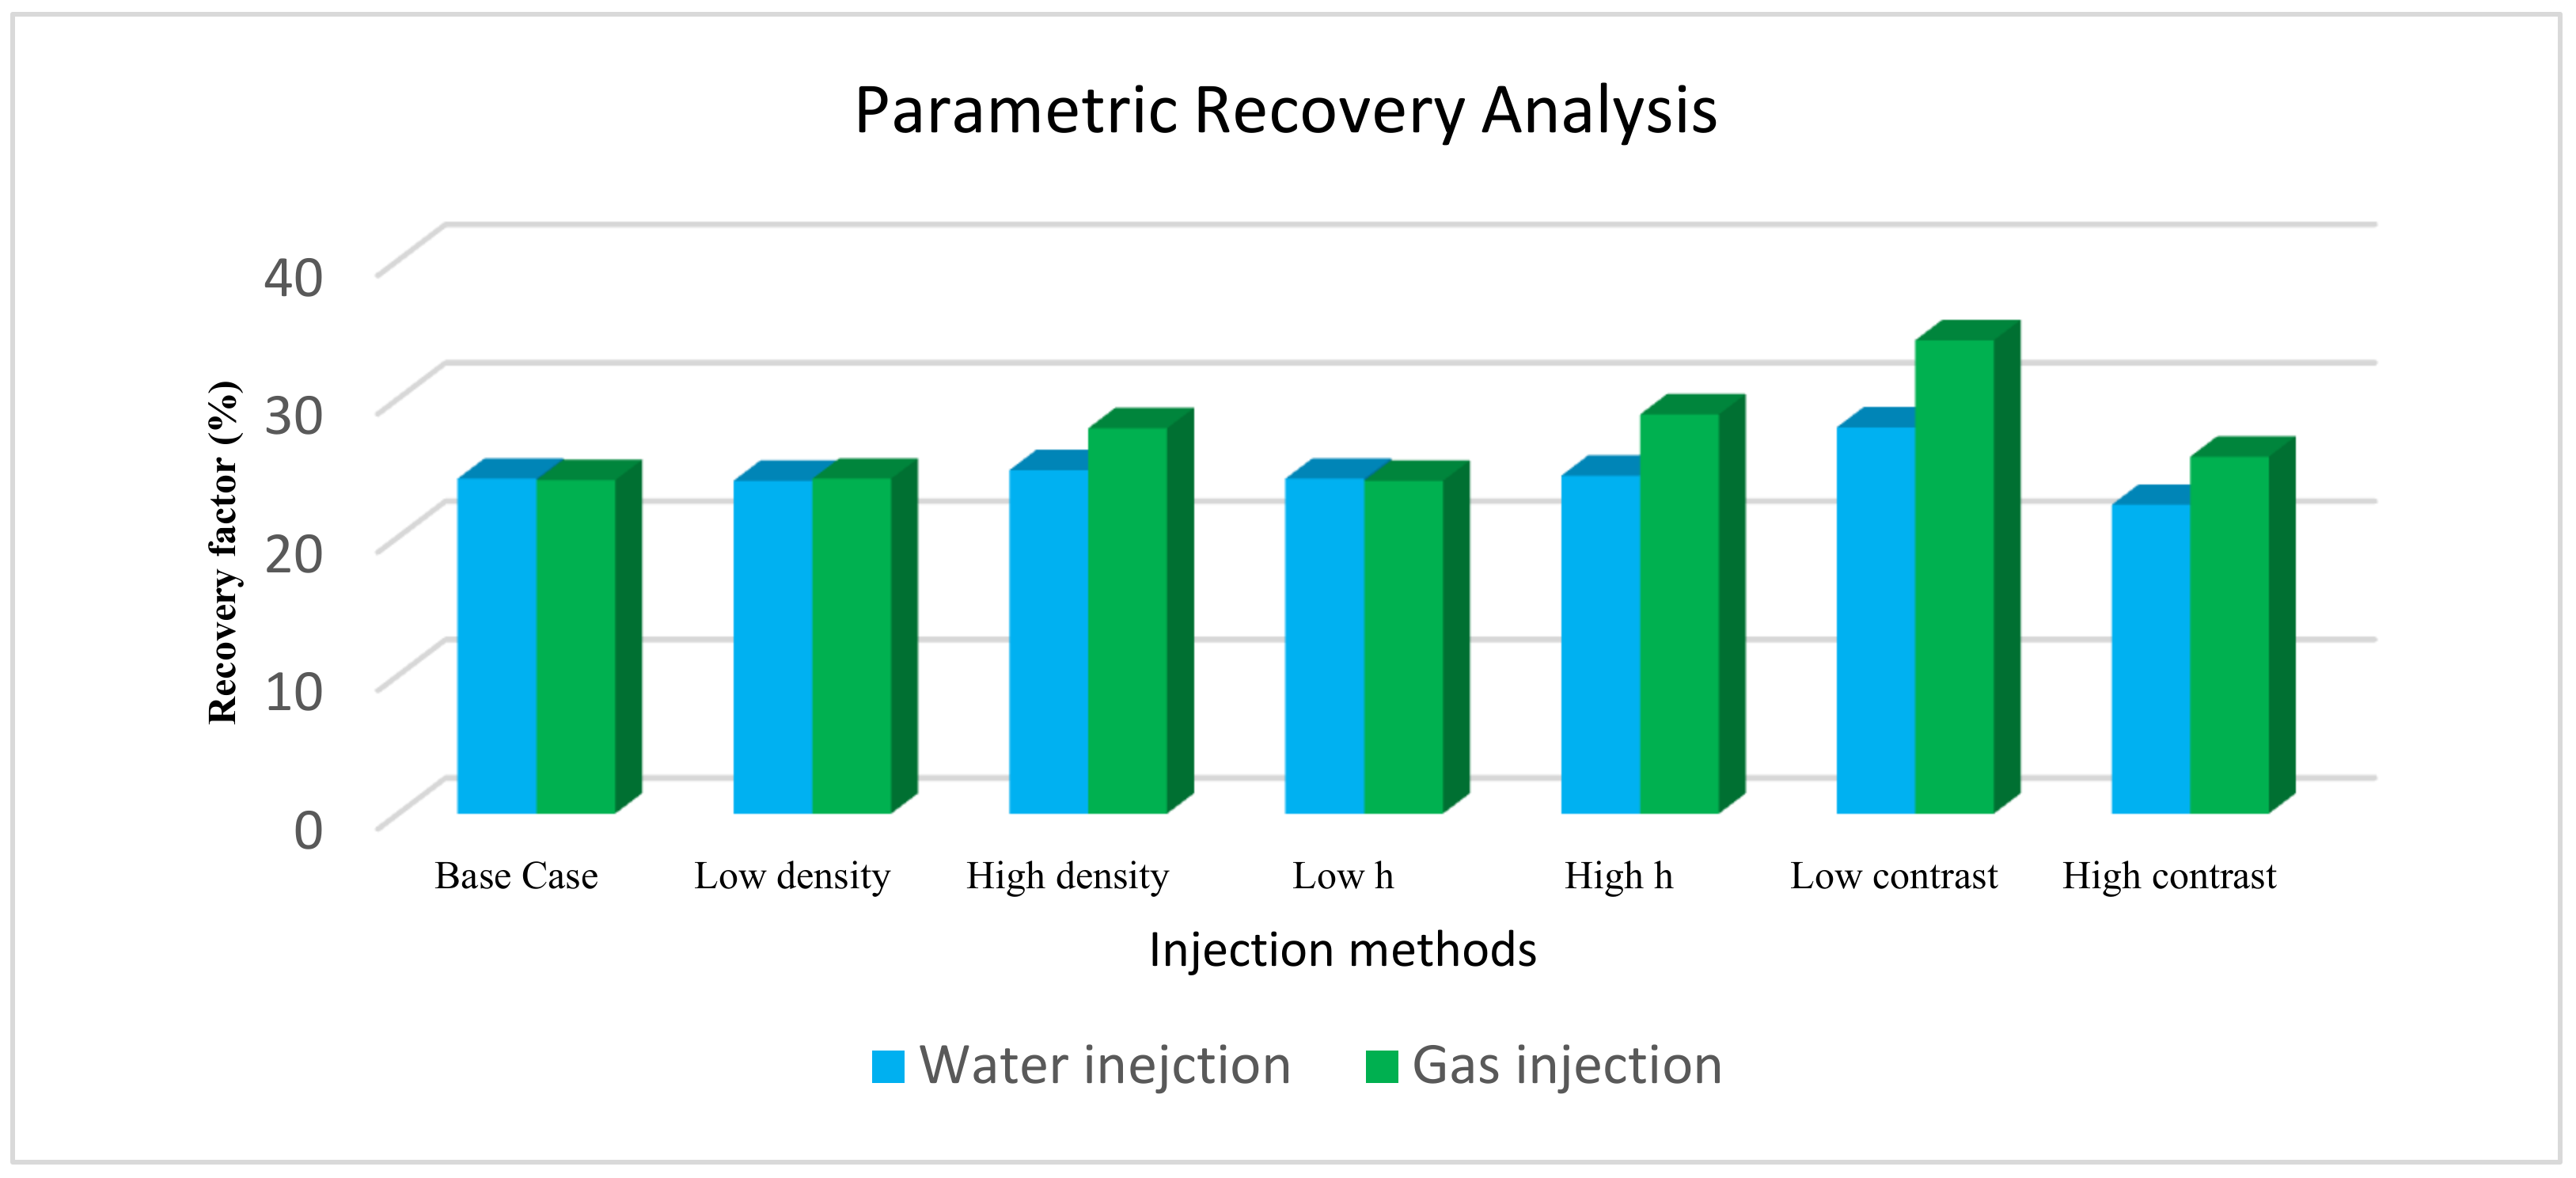
3.5. Analysis of Matrix–Fracture Interactions
The sensitivity of matrix–fracture interaction and properties on the performance of the EOR processes in naturally fractured reservoirs were considered. Fracture–matrix permeability contrast, density differences, and matrix block height were investigated (
Table 5).
Parametric recovery analysis for the above-mentioned was performed to understand how driving force acts in a cross fracture–matrix system during the EOR process.
Figure 16 shows the impact of different parameters of oil recovery for water and gas injection. The oil recovery for the base water and gas injection case was fixed by adjusting the injection rate for comparison purposes.
It is observed that permeability contrast between matrix and fracture significantly impacts oil recovery of both water and gas injection. While the density and matrix block strongly influence gas injection, they negatively impact water injection. Moreover, high-density differences cause capillary entry pressure for gas to be overcome by the gravitational head, which is improved the gravity drainage rate due to the entering more gas into the matrix.
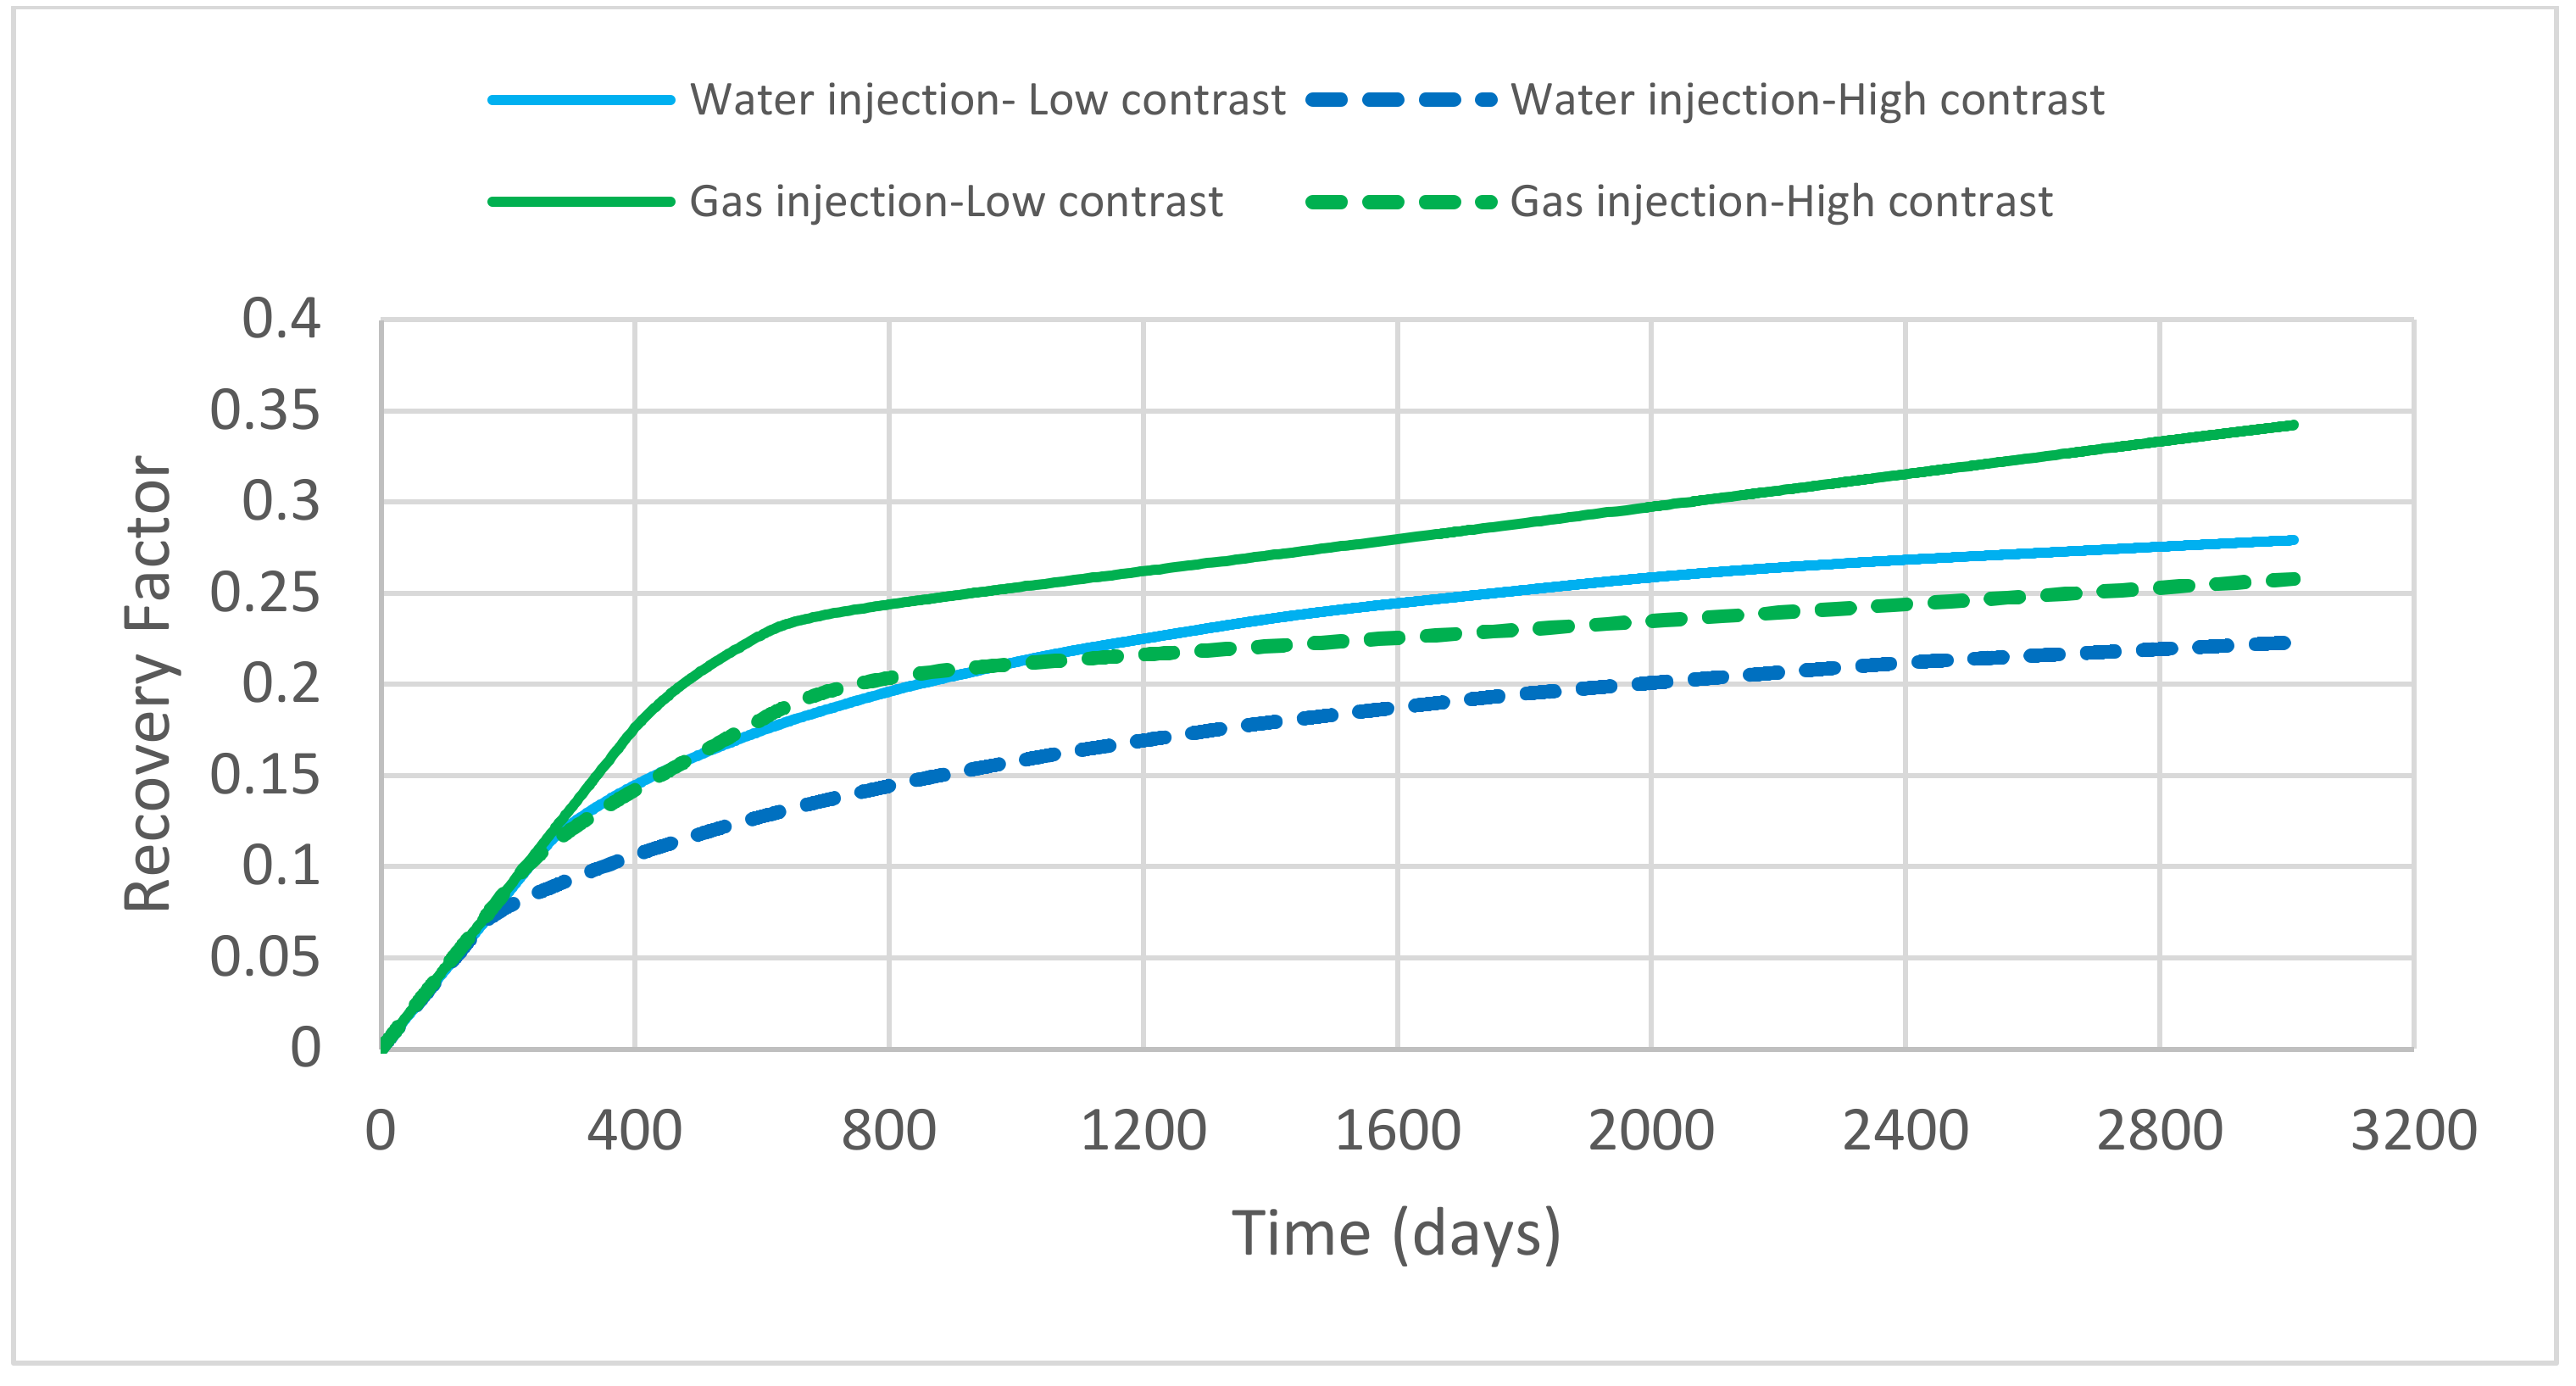
The impact of the matrix permeability has been reported as one of the most effective parameters on the ultimate recovery for the gas injection. However, no results were provided for the permeability contrast [
36]. The impact of permeability contrast on water and gas injection is presented in
Figure 17.
In water and gas injection, permeability contrast has more impact than other parameters in which a lower permeability contract results in more oil recovery. Conversely, a large permeability contract causes rapid breakthrough, notably in water injection (consider matrix is oil wet). When the contrast of permeability matrix and fracture systems is low, the gas breakthrough is delayed. Thus, viscous forces become more efficient and help gravity overcome the capillary forces.
In high-contrast permeability between fracture and matrix for gas and water injection, driving forces are not enough to displace oil in the matrix. Since capillary pressure is negative for the oil–wet matrix, water imbibition into the matrix is insufficient, and oil recovery is low. This large contrast and low viscosity of injected gas channeled it through the high permeability fractures and thereby early breakthrough. Therefore, the fracture–matrix boundary capillary forces and the fractures’ viscous forces are too small to sweep matrix oil. Both gas and water phases cannot provide enough viscous pressure drop in fractures, and they are not imbibing into the matrix blocks spontaneously due to the unfavorable wettability condition. Therefore, a significant focus on gravitational forces is needed.
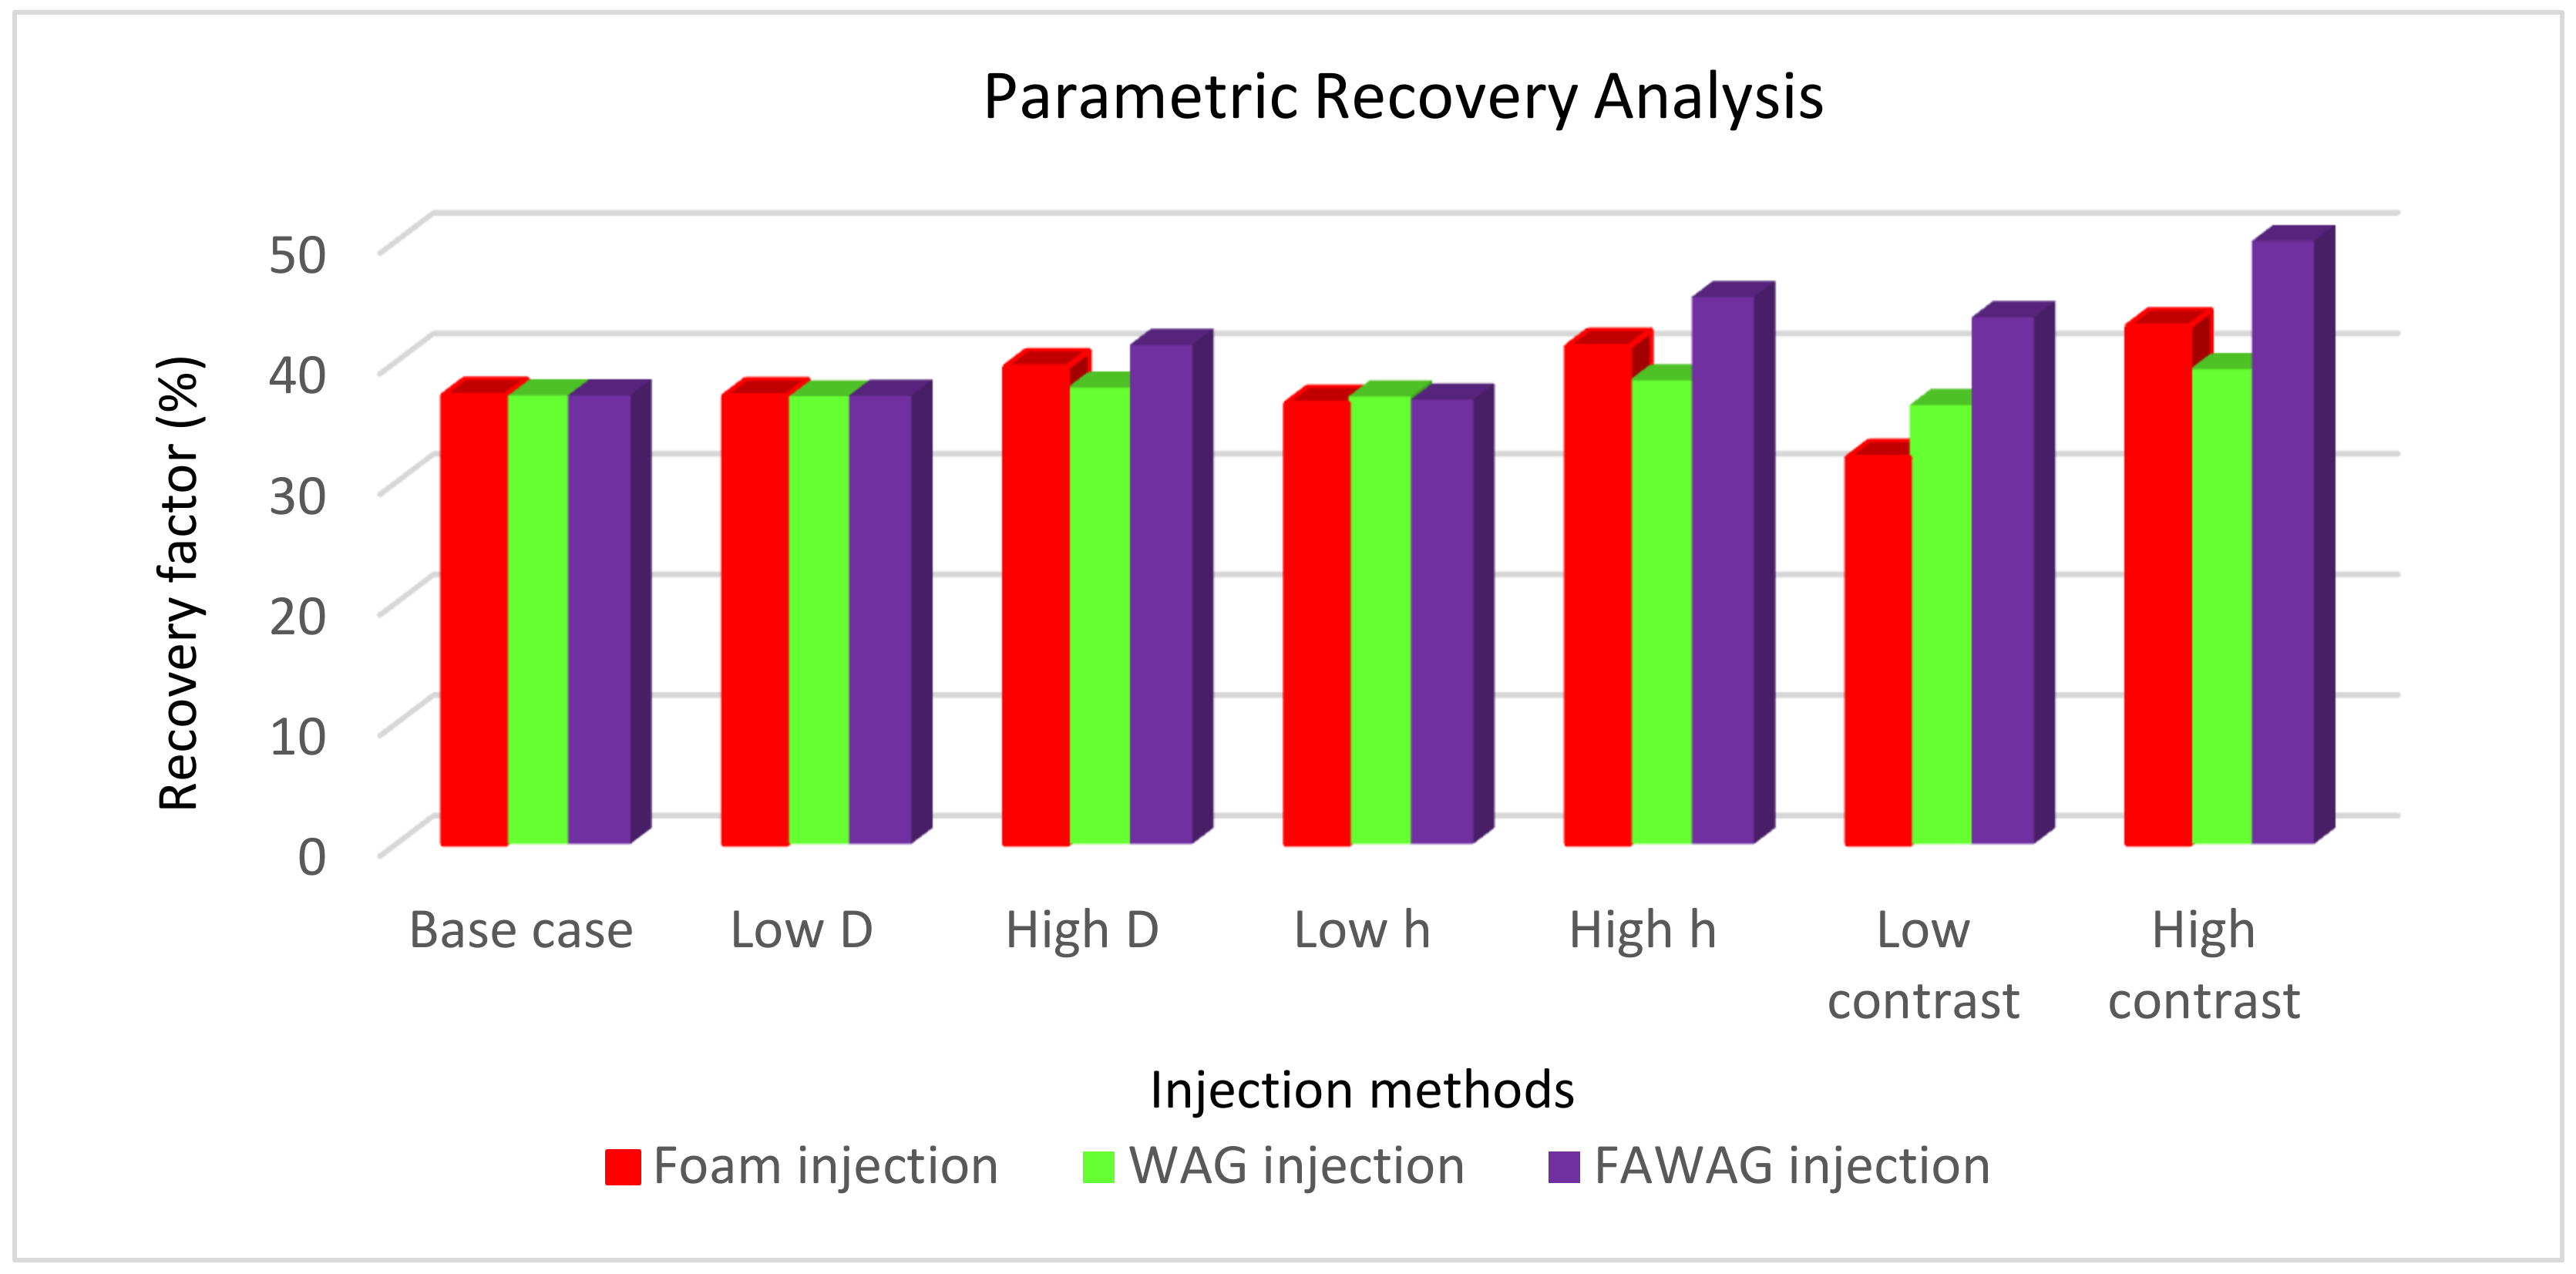
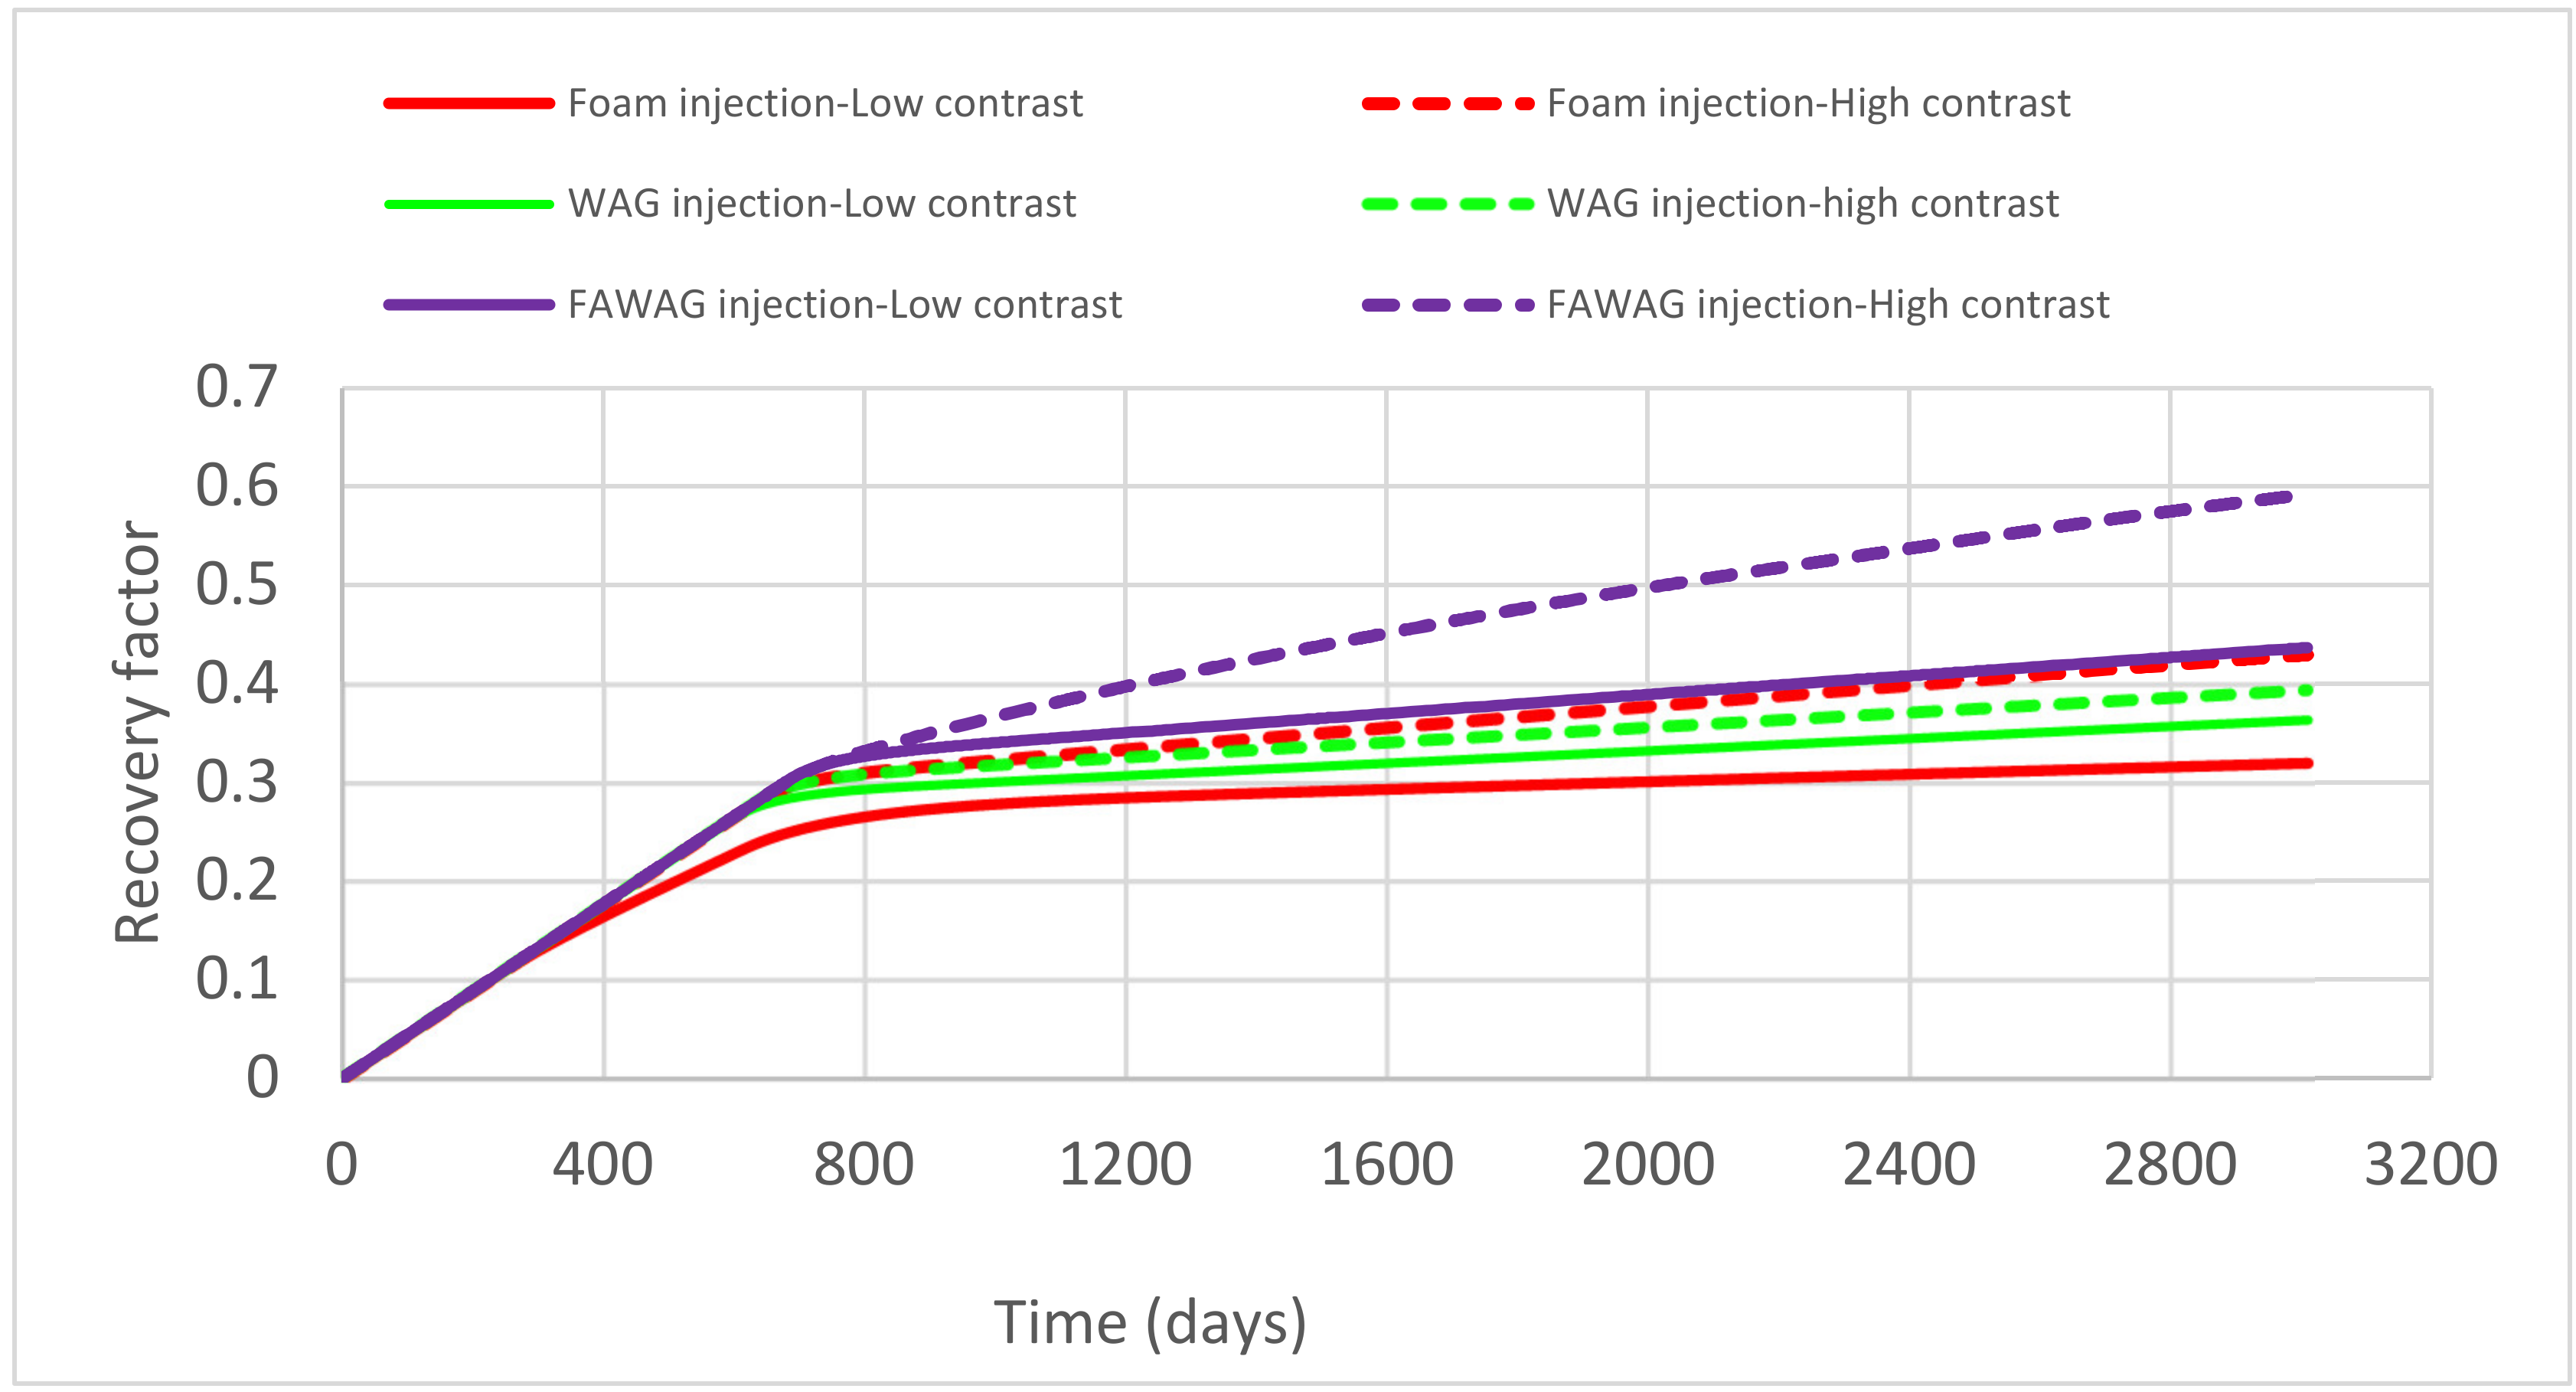
Figure 18 compares the oil recovery of foam, WAG, and FAWAG injection methods for different parameters. A gas injection case was selected as a base case for comparison in which foam and water cycle were added to the gas phase to simulate the foam, WAG, and FAWAG injection methods.
Foam and FAWAG injection methods were more sensitive to permeability contrast, density, and matrix block highs than WAG injection. Likewise, oil recovery was more sensitive to fracture–matrix permeability ratio in which low contrast adversely influences oil recovery, particularly for foam injection. Additionally, when the permeability contrast is large, the oil recovery for foam and FAWAG injection increases considerably, as shown in
Figure 19.
Although density differences and matrix block height positively affect oil recovery in foam and FAWAG processes, their impact on FAWAG injection is not as large as a gas injection.
The water phase in WAG and foam provides additional viscous forces in factures, thus overcoming capillary entry pressure, enhancing gravitational forces. In WAG injection, although water acts as a gas mobility control agent, the viscous term is minimal in fractures. Therefore, it is difficult to provide a significant gravitational and viscous driving for matrix oil displacement. The competition between the water and gas phases entering the oil–water matrix makes water less efficient due to low capillary forces at the fracture–matrix boundary.
Foam in fractures reduces gas mobility and creates a pressure gradient so that gas is diverted into the matrix displaces oil. Foam controls fracture–fluid mobility and forces more gas into the matrix, assisting gravity drainage rate. It is believed that strong and stable foam creates a viscous pressure drop in fractures by reducing the fracture conductivity. Since foam increases the pressure gradients across the fracture and matrix, gravitational forces become more effective.
These findings are in agreement with previous studies showing the ability of foam to divert either surfactant solution or gas flow into the matrix. The results of the experiment provide clear support for the gas-blocking capacity and foam transport in the matrix of carbonate reservoirs [
38,
39].


