1. Introduction
Europe is a continent with a very well-established building stock, which is characterized by large energy renovation needs, accounting for almost 50% of the building market [
1]. Increasing the buildings’ energy efficiency is therefore the subject of the Energy Performance of Buildings Directive (EPBD) [
2,
3]. There are many types of socio-economic dynamics that trigger energy renovation activities in buildings. They include government incentives, real estate investments, energy performance contracts (EPC), and standard maintenance processes. Each dynamic corresponds to various panels of actors and decision-making processes guided by value systems that differ in substantial aspects.
The professional field of real estate management raises specific operational issues. Like any management process, real estate management must take into account the cost of acquiring the information needed to support decisions.
The time and resource constraints that affect the typical energy refurbishment processes hamper the gathering of information for reliable building condition assessment. They also limit the development of the analytical models, which are used to get reliable predictions of the post-intervention performance. The literature shows that some effort has been made to speed up the current process of field inspection of buildings. However, the process is still a resource-demanding task [
4]. Residential and small commercial markets are particularly affected by such diseconomies of scale: “The energy auditing business in both the residential and small commercial markets is tough and, in some cases, prohibitive for both users and providers” [
5].
The analysis of the decision processes in building energy refurbishment is dealt with in the broader and more complex framework of the overall building refurbishment [
6,
7]. Current decision support tools are based on large stock analyses of buildings and are well suited for the strategic management of real estate investment [
8,
9]. These systems have been developed to speed-up the audit process in the context of large-scale energy efficiency policies. They use a simplified calculation method adopted in both EN 832 and EN-ISO 13790, which is based on the quasi-steady-state approximation, where the dynamic effect of internal and solar gains is considered through a simple utilization factor [
10,
11]. However, in professional settings, the best possible condition assessment and post-intervention estimates are required to approach call for tenders in a competitive way. This makes average appraisals, derived from the analysis of large building stocks, of little effectiveness.
Alternative approaches to decision support for improving the energy performance of buildings employ multi-objective optimization. In the real estate management perspective, multi-objective optimization has the undoubted advantage of finding the best solution among a set of competitive objectives. However proposed solutions do not seem to address the resource gap of implementing energy audit procedures. Carli [
12] in his overall procedure foresees a diagnosis phase which is left undetailed, while the design-oriented approach of [
6,
13] is based on a large set of parameters, whose cost of acquisition is not considered.
A further relevant issue concerns uncertainty. The practice of condition assessment by building inspectors yields variable results due to subjective perceptions of inspectors. Surveyor variability is defined as the situation where two or more surveyors, examining the same building, arrive at very different survey decisions [
14,
15]. Tian [
16] reports a detailed analysis of uncertainty affecting building condition assessment and identifies two basic types:
- -
The aleatory uncertainty that is due to system intrinsic or external dynamics;
- -
The epistemic uncertainty resulting from a lack of knowledge.
In the energy analysis of buildings, aleatory uncertainty is mainly related to human factors (e.g., usage profiles) and weather.
The epistemic uncertainty usually stems from time and economic limits that hinder a thorough analysis of the real building conditions. On-site surveys reduce such epistemic uncertainty but are very onerous in terms of human and economic resources.
Finally, professional operators possess a considerable wealth of knowledge gained from long experience in the field. It tacitly drives their decisions and must, therefore, be elicited for effective support.
In brief, the professional context places three main requirements for decision support systems:
A good degree of accuracy in building energy performance estimates can be achieved by combining two strategies: (i) deepening site investigations through targeted observation and, if possible, measurements, and (ii) using energy models calibrated to the available building data. On-site inspections aim at minimizing as much as possible the uncertainty present in the information concerning the actual building condition [
17], providing the most comprehensive basis on which to develop modelling and calibration. Model calibration compensates the limits of on-site inspections with the consistency introduced by the thermal physics equations of the model [
18]. This strategy mirrors on the operational plane the logic used in the
System Identification domain, where the parameters of a stochastic differential model are determined by means of maximum likelihood inference, due to its ability to estimate noise parameters [
19,
20].
Calibration of building energy models, however, might show some practical limits. Detailed energy models, typically used in the design phase, are too complex to be calibrated for already existing buildings. The high number of parameters, which on buildings of medium complexity can amount to thousands, does not allow a reliable management of the overfitting problem, which defeats the predictive capabilities of the model itself. The terms “overfitting” and “underfitting” are very well known in the system identification domain and describe the use of too complex and too simple a model, respectively [
21]. Giretti [
22] and Piccinini [
23] introduced a reduced order building energy model (ROEM) that can be profitably calibrated to obtain good accuracy in predicting energy performance. The practical value of such an approach is threefold:
- (a)
The reduced order model, although relatively abstract, is sufficiently expressive to produce energy performance predictions within ASHRAE accuracy boundaries [
24];
- (b)
The model can be implemented according to information obtained from inexpensive surveys, mostly based on visual inspection;
- (c)
The calibration process provides support in assessing the consistency of the surveyed data.
The objective of this article is the development of a decision support system for real estate management that mitigates the lack of information in the energy audit of buildings, while maintaining acceptable accuracy in the estimation of the energy performance. The paper aims at defining the best combination of technical solutions meeting the operational requirements of real estate management processes. The focus is on the operating conditions typical of the early stages of real estate investment appraisal, where the large number of buildings to be considered hinder detailed technical analysis. The paper discusses the issues of technical surveying and performance estimation from the perspective of business knowledge management. The analysis is limited to residential buildings and, at present, does not include a cost model, although it could easily be extended to buildings with other uses including refurbishment costs. The proposed system combines ROEM, Case Based Reasoning (CBR) [
25,
26] and probabilistic modelling approaches. ROEM is an effective performance estimation means and provides the information framework that is relevant for the building energy refurbishment management. CBR provides the conceptual framework to integrate the ROEM in the corporates’ knowledge cycle and is used to implement the knowledge repository. A Bayesian probabilistic model is used to mine the knowledge repository and to implement an index frame that provides decision support. Such a system can estimate building energy performance with different accuracy degree, depending on the available information, either through simulation or CBR. It can manage the process uncertainty through Bayesian inference. It can capitalize the corporate’s operational knowledge through CBR.
Section 2 describes the structure of the corporates’ knowledge cycle that the system is intended to support and the resulting requirements for the decision support system.
Section 3 briefly introduces the key features of the reduced order energy model that underpin the performance analysis.
Section 4 describes the architecture of the decision support system, and
Section 5 comments in detail examples of the inferences supported by the system. Finally,
Section 6 discusses the limitations of the present implementation and its future developments.
2. The Corporate Knowledge Cycle
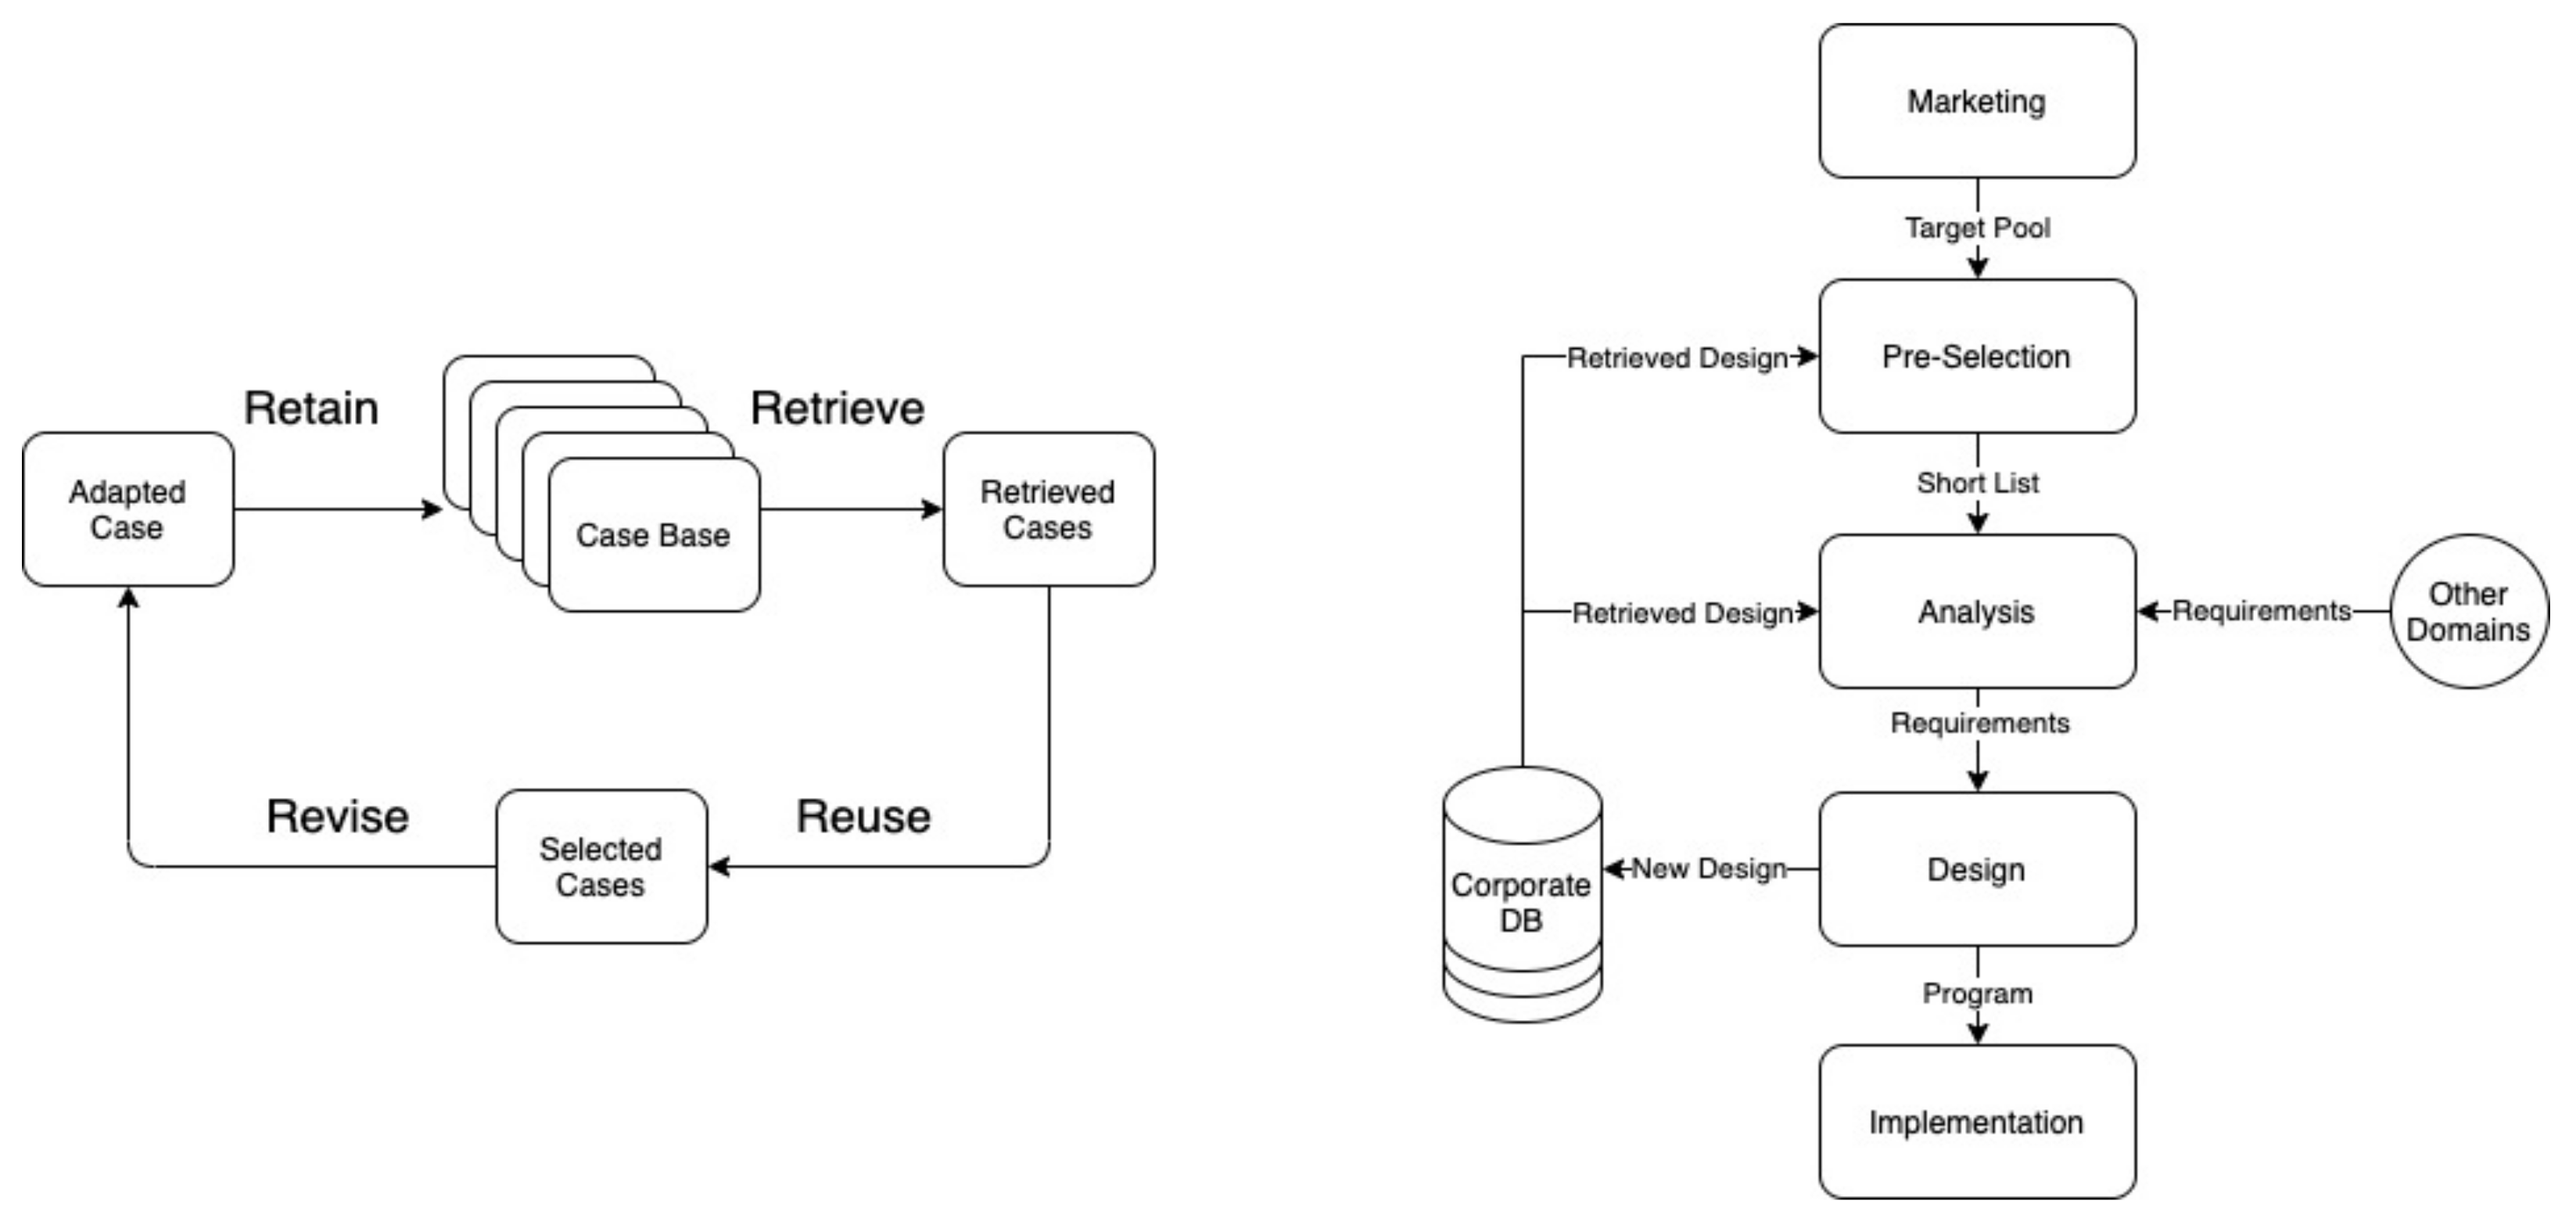
This section will explore the salient aspects of the knowledge workflow that characterize the decision-making process concerning the implementation of an energy refurbishment investment and introduces the CBR paradigm as the supporting computational means. The reference corporate process (
Figure 1—right) has been derived from [
6] and further expanded to reflect the work practice of the professional operators that collaborated on this research (see Acknowledgment Section). A brief description is given in the following points:
Marketing: The marketing department identifies a set of most promising buildings from the commercial point of view (Target Pool);
Pre-selection: An early pre-assessment phase reduces the number of buildings to be analyzed in more detail (Short List). The characteristics of each building in the target pool, obtained from a quick survey, are assigned as indexes, which are used to retrieve one or more similar cases from the corporate DB. The proposed solutions are evaluated, and a preferential ranking is defined;
Analysis: a selection from the short-list is made based on the estimated performances, largely using the corporate’s experience. In this phase the assessment is deepened through simulation and the results are possibly combined with requirements from other domains, such as architectural or structural. The analysis phase produces the overall list of requirements for the subsequent design phase;
Design: The design finally completes the technical development of the interventions. The resulting projects, which will guide the construction phase, are archived in the corporate DB.
CBR is a general problem-solving paradigm that operates from experience [
27]. In CBR a case is an example of a solution to a problem of any kind. CBR solves a specific problem using past solutions that show similarity to the problem under consideration (
Figure 1—left). CBR therefore assumes a memory model for remembering, indexing, and organizing past cases and a process model for retrieving and modifying old cases, and assimilating new ones.
CBR is a reasoning paradigm that can be naturally translated into the information flow of a real estate management corporate. Storing and retrieving past design cases in/from the corporate’s DB is a fundamental step of the corporate’s workflow. The conceptualization used for storing and retrieving designs, plays a fundamental role in supporting the corporate’s knowledge cycle. The index system must reflect this conceptualization and must be able to support the typical design inferences, such as: analysis (forward-deduction)-diagnosis (backward-abduction). Bayesian networks (see
Section 5) are very effective and efficient tools for the implementation of such an index system [
27]. Let it suffice for now to mention that a Bayesian network, through its typical learning process, can be used to generate a statistic on the corporate DB that encodes, in a single model, most of the corporate’s operational knowledge on a specific domain.
3. The Reduced-Order Energy Model
This section will briefly introduce the main features of the ROEM. For technical details please refer to [
22] where the ROEM, the calibration procedure and the predicting performance are discussed in detail and [
23] where the ROEM has been further developed. The conceptual framework of the reduced order model is an example of the third order model proposed by [
28]. A schematic representation of the model is shown in
Figure 2 using the same set of electrical symbols. A third-order model was chosen as recommended by [
29], with only the addition of the heat flux against the ground, implemented as the series of a constant temperature
Tground plus the resistance
Rg. Thus,
Rie is the average resistance of the opaque envelope,
Rea is the outdoor air-envelope coupling resistance,
Ria is the infiltration resistance,
Rm and
Cm are the resistance and heat capacity of the indoor partitions,
Ce and
Ci are the thermal capacity of the envelope and the thermal capacity of the indoor air, respectively. Unconditioned rooms are outside the model boundary. Hence, they are assumed to be either at
Tground or at
Tout depending on whether they are basement or summit respectively. Their influence is averaged in
Rg and
Rea. The thermal system is modelled as a variable heat gain Φ
h coupled with the environment by the thermal resistance
Rih and the capacity
Cih of the system. The photovoltaic system, if any, is modelled as an additional generator modulated by the weather data and coupled to the environment by the resistance
Rpv. The internal gains Φ
u, the solar radiation through the windows Φ
ws and on the opaque surfaces Φ
os are modelled as additional variable gains. Two schedules concerning system operation and occupancy, as well as the meteorological dataset, were added to provide the temporal dynamics of the external and internal gains. Finally, two feedback control signals were introduced to implement thermostatic control of the heating/cooling system over the internal temperature
Tin and the average temperature of the heating system
Tf.
ROEM require a relatively limited set of information that can be acquired during on-site surveys with a reasonably limited effort. The set of model variables is reported in
Table 1. For each variable, the source of information and the degree of datum reliability, if obtained in a survey operation without direct instrumental measurement, is described. The general strategy is to acquire as much as possible data in the survey phase with the highest level of reliability. Then, the best estimate of parameters with lower reliability will be carried out during the calibration phase, using the consistency constraints of the physical equations of the ROEM.
The calibration process is therefore a key point of the proposed approach, as it allows to create a reliable baseline for the assessment of any possible energy improvement option. The use of ROEM greatly facilitates the calibration process. As highlighted in [
22], the reduced number of parameters allow limiting the overfitting problems that plague detailed model calibration. The calibration process is based on a parameter ranking according to the level of certainty achieved during the on-site survey.
Figure 3 represents a typical calibration arrangement for residential buildings. The building energy consumption records of one or more past years is the baseline used for testing. The calibration process starts from the system parameters, then proceeds to the building parameters, and ends with usage aspects.
A Calibration Example
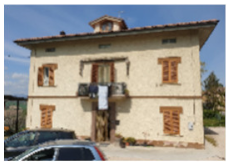
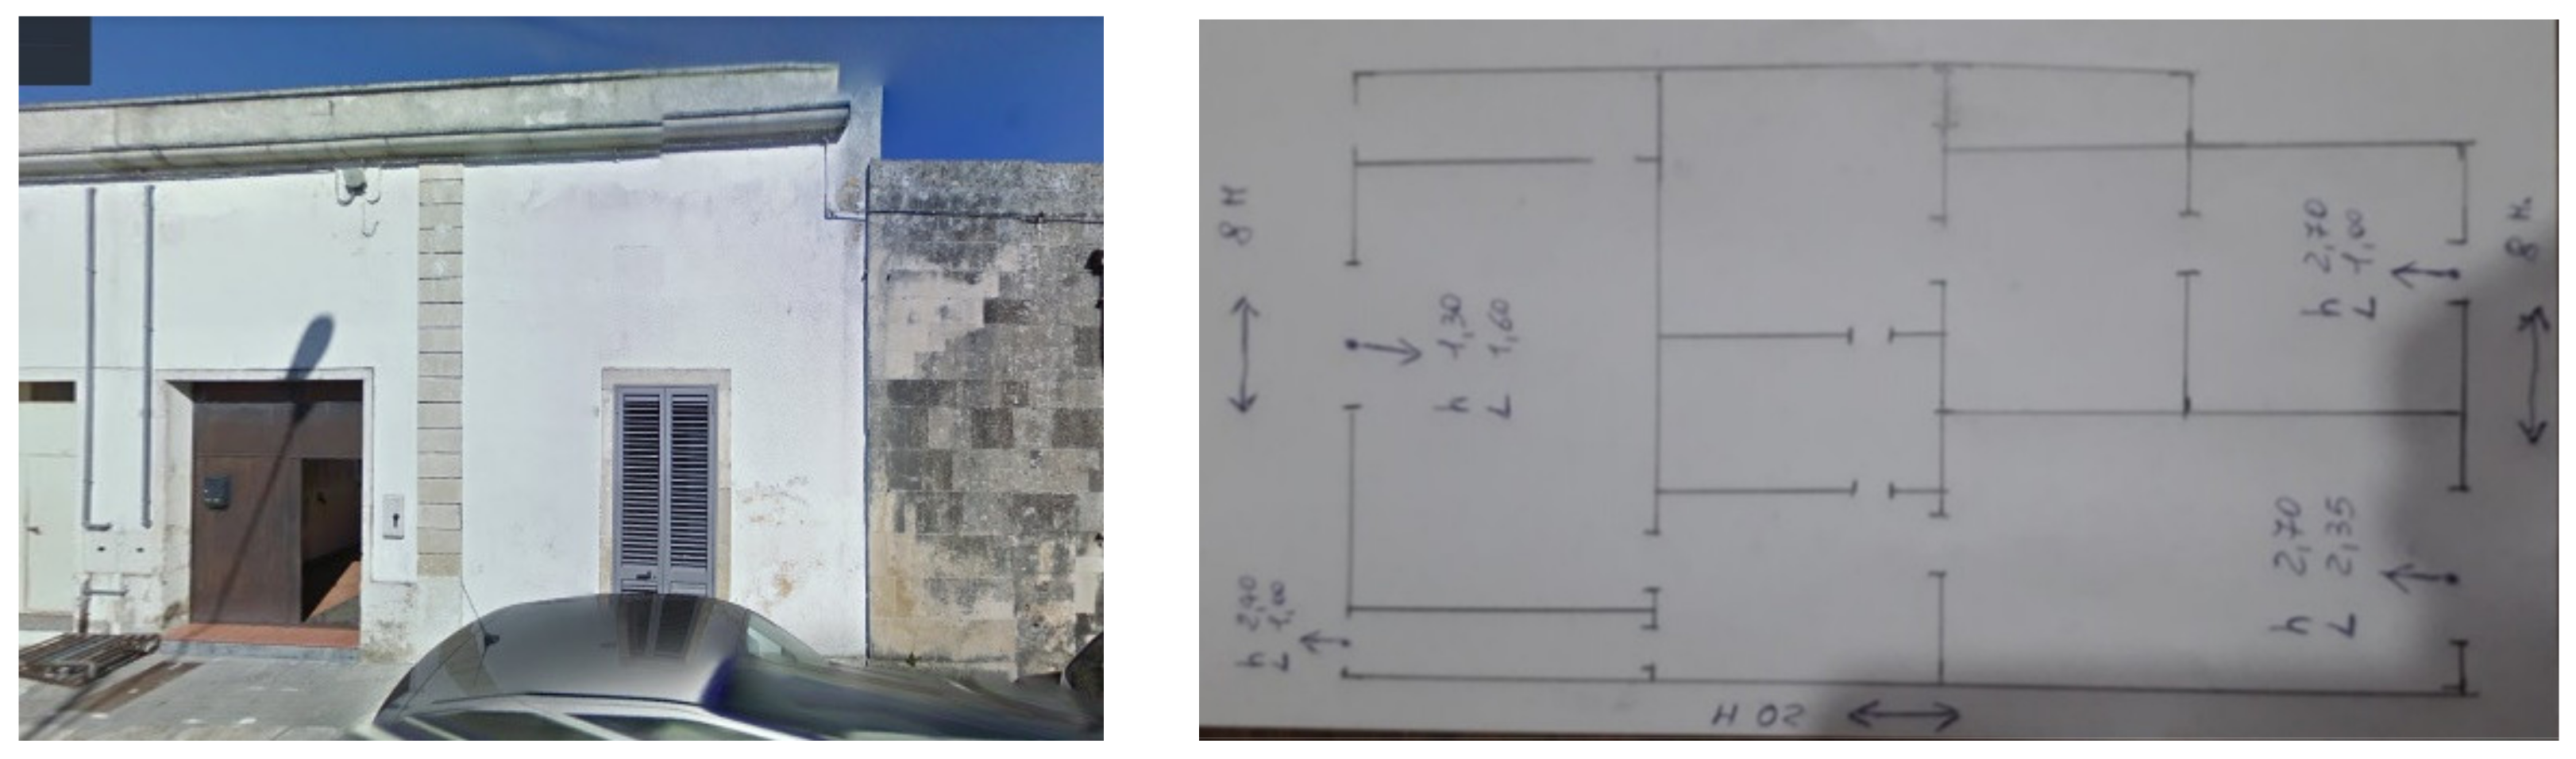
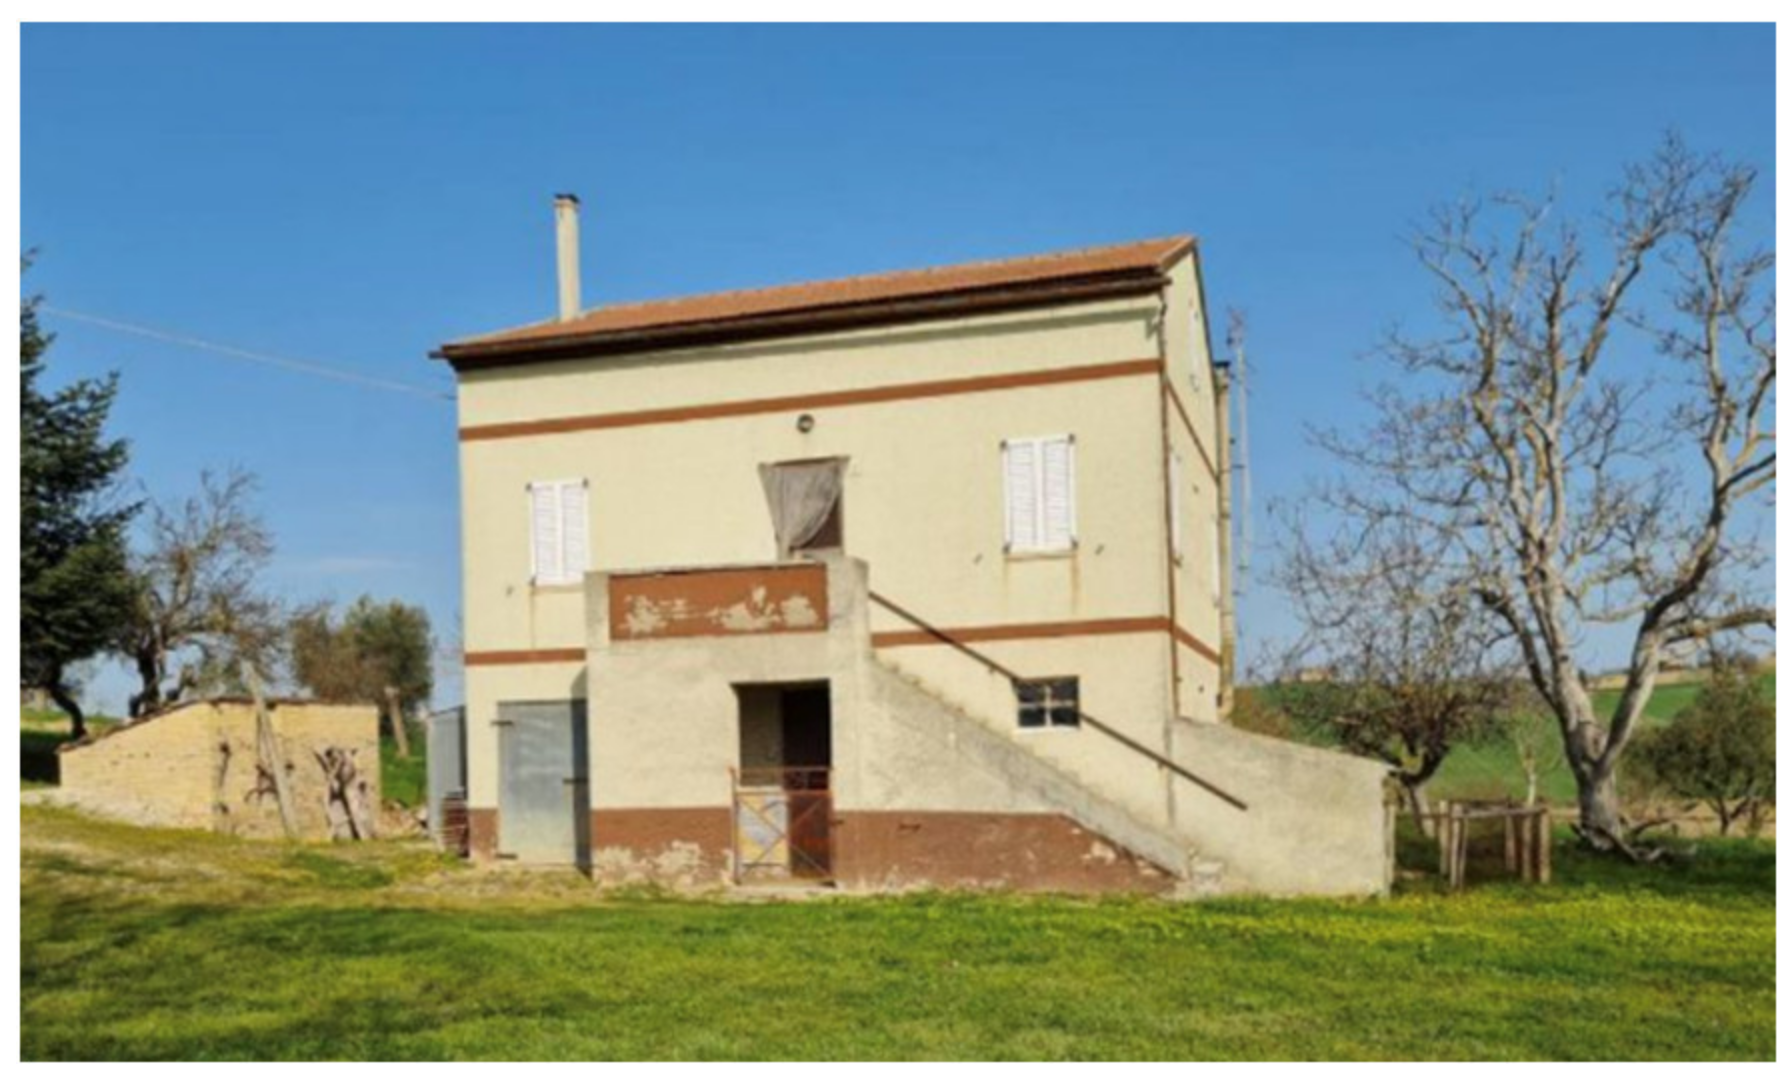
Consider, for example, the case of a real estate operator who must inspect several properties to guide a real estate investment. The daily tour includes the inspection of six properties in the Lecce area in the region of Puglia. One of the properties is shown in
Figure 4 and is an ancient dwelling built in the Muro Leccese, which has potentially many valuable aspects due to its history and the panoramic view of the rear side. As for every ancient dwelling the technical documentation, apart from the cadastral plans, is non-existent. It is therefore necessary to proceed, given the operator’s work schedule, to a preliminary visual inspection to guide a general energy audit. The inspection consists in the acquisition of documentary photos, the survey of the orientation, the metric survey of opaque and transparent surfaces and volumes, the acquisition of the data of the heating system, the evaluation of the air tightness class of the fixtures and, finally, the acquisition of the energy bills for the past year. The collected data are reported in
Table 2. The cumulated energy consumption for the year 2020 is 8712.36 KWh.
This is an extreme case where very little information is available, and it serves to highlight the process of generating the most plausible picture that explains current energy consumption. Detailed energy bills do not reflect real usage, as they are affected by the supplier company’s policy of averaging consumption. Therefore, the cumulative annual consumption is used as a benchmark. Surveys of envelope technologies are approximated, and the conditions of use are determined through interviews with owners, who provide broad indications.
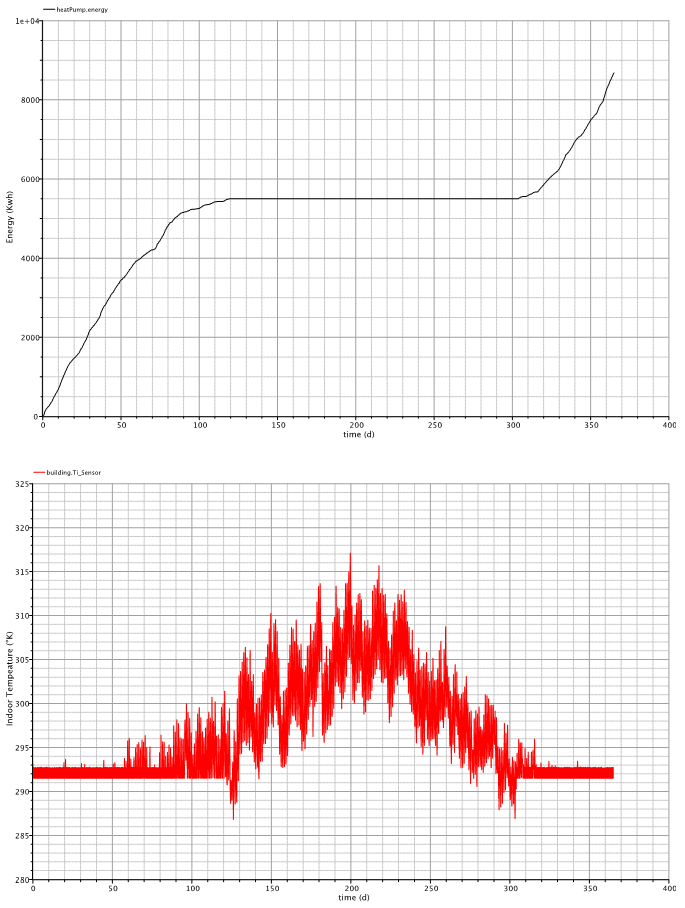
The calibration process starts with the calculation of the energy consumption based on surveyed data. The simulation reports a consumption of 7756 KWh/y. The simulation graphs (
Figure 5) show a consistent behavior of the consumptions and of the internal temperature. Since the estimated consumption is not satisfactory, an adjustment of the parameters is required. Simulation times are irrelevant, so many scenarios can be explored. For the sake of brevity, a simple scenario where only the parameters that have greater uncertainty, in our case
Lea and
Rih, are considered. Since
Rih shows greater sensitivity to energy consumption, it is selected for the first adjustment.
The Lea value is then doubled. The rationale of this choice depends on the fact that the initial value was calculated assuming class 1 for the windows, which appear anyway very old. It is therefore plausible to assume an initial underestimation of their permeability. Usually, the schedule of the heating system appears in the list of the most uncertain factors too. In this case, however, the interview with the owners gave sufficient certainty about the on-off switch dates. Doubling the value of Lea produces an over-estimation of the annual consumption of 9618 KWh/y. The final value of Lea is 0.69 Kg/s which corresponds to a consumption of 8682 KWh/y and amounts to 1.5 times the value for a class 1 window. This appears to be a plausible setting. This procedure is aimed at building a maximum likelihood explanation of the parameters values that are the result of the survey. Obviously, there is no certainty about any of the parameters that are not directly measured. However, in the inevitable condition of scarce information, this assessment framework is the one that is supported by the best justification within the operational constraints.
Giretti [
22] and Piccinini [
23] have demonstrated the predictive ability of this class of models using precise records of weather data, consumption, and usage profiles. The availability of such data would allow further validation of the model in this case as well. However, in this case such information was not available. Hence, parameters on
Table 2 with the adjusted
Lea represent the most likely setting provided by this process.
4. The Decision Support System
The decision support system consists of three components: the Case Base, the set of Model Views and the set of Index Frames (
Figure 6).
The Case Base stores design cases. In this prototypical implementation, the Case Base module is structured as simply as a relational data base in which tables are linked through unique case identifier. It consists of two tables containing general information, the parameters common to all supported decision processes and the metadata of files containing further unstructured information (e.g., technical specifications, plans, photos). Each decision process corresponds to one or more tables, the model views, which contain the parameters required by the related inferences. Finally, each model view is related to an index frame which exploits its statistics.
An index frame is a probabilistic model implemented by means of a Bayesian network. A Bayesian network [
30,
31] is an acyclic directed graph where
Nodes represent random variables characterized by a probability distribution over their domain, which can be discrete or continuous;
Links represent the presence of a significant correlation, often interpreted as a causal relationship, between the variables at the ends, and are implemented as conditional probability tables.
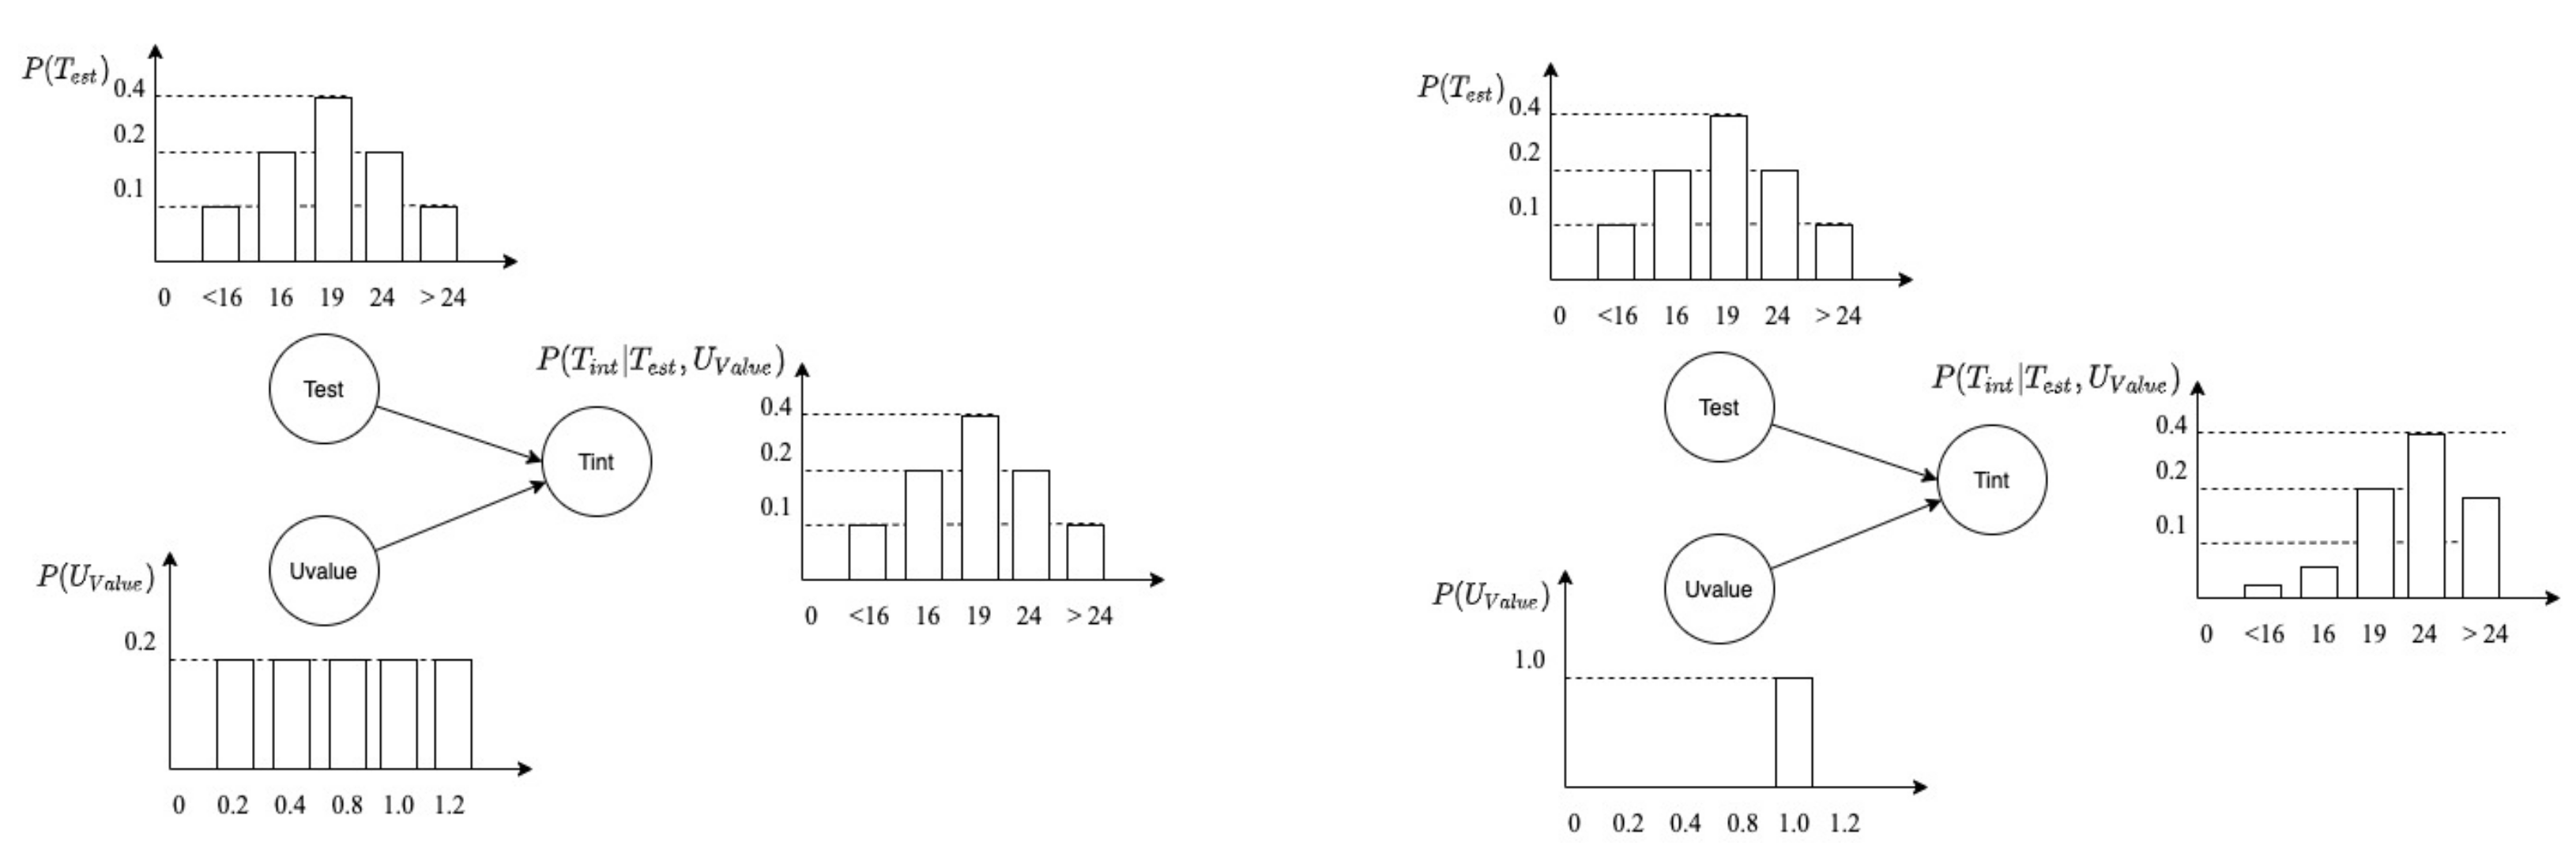
Figure 7 (left) shows a simple example of a Bayesian network that models the probability distribution of the internal temperature of a building
Tint in relation to the distributions of the external temperature
Test and the wall transmittance
Uvalue.
A Bayesian network supports different types of inference, which on a semantic level, can be classified as
- -
Forward, which proceeds from observing technical parameters to estimating performance;
- -
Backward, which proceeds from imposing a performance class and determining the most appropriate technical configuration.
At lower computational level, however, each form of inference corresponds to observing certain parameters values and propagating the observations through the network. Observing a parameter means assigning a particular probability distribution to the corresponding random variable. In case of perfect certainty, a 100% probability is assigned to the range of the discretized domain in which the observed value falls. The observation of a value at a node triggers the recalculation of the probability distributions of all nodes (
Figure 7—right). More generally, and this is perhaps the most interesting case, it is possible to assign a complex probability distribution that reflects an uncertain judgement over the values of the variable. We will see in the following paragraphs some examples of this possibility.
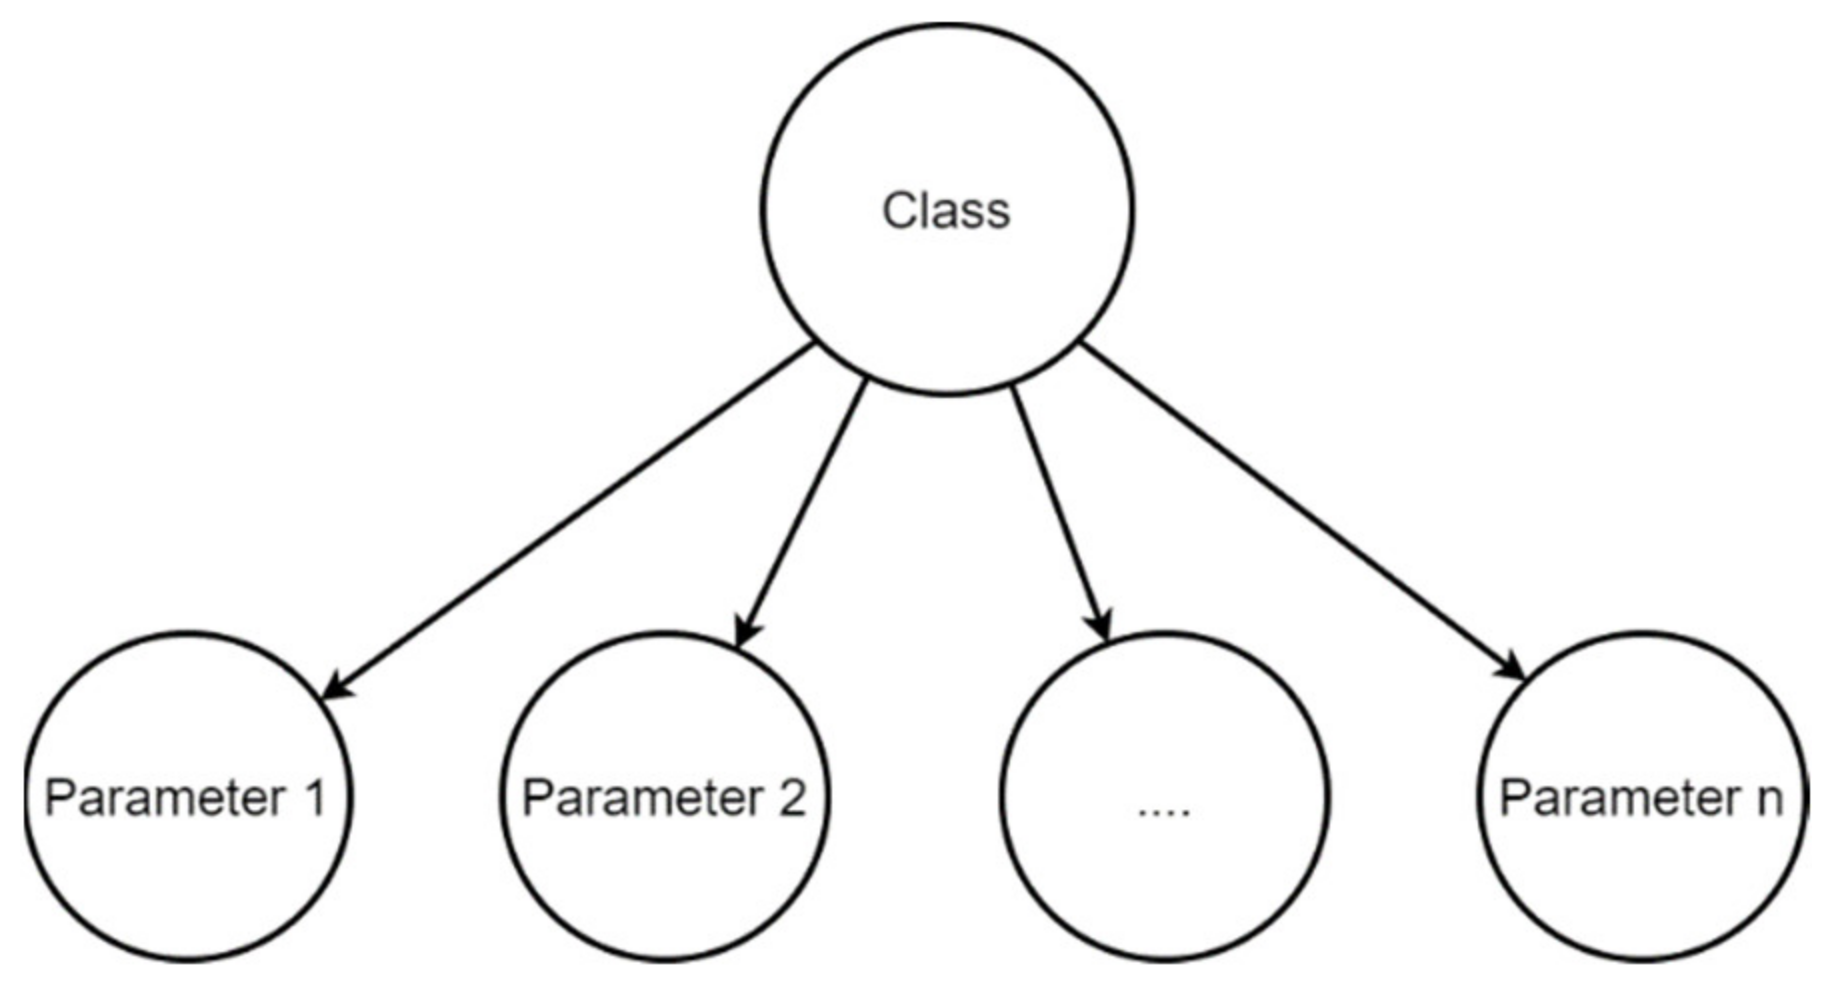
There are many possible topologies for modelling a given problem using Bayesian networks, and in fact there is no absolute best solution. However, an extremely simple topology known as the
Naive Bayes Classifier (NBC) proves effective in many situations. An NBC is a Bayesian network with a tree topology (
Figure 8), made of a root node whose domain is formed by the set of possible classes, connected to a set of leaf nodes representing the parameters whose values characterize the different classes.
One of the main features of Bayesian networks is their flexibility in integrating information sources of different nature while maintaining and/or explicitly highlighting their logical structure. Bayesian networks can be constructed by mapping the analytical equations that represent any process or system onto the probabilistic relationships between nodes, they can be built from qualitative expert judgements or, through data-mining processes, directly from data sets. The three processes are not mutually exclusive and can be integrated into the network development process. The process of learning from data consists of three steps:
- (1)
Domain discretization;
- (2)
Structural learning;
- (3)
Learning of the conditional probability tables (EM Learning).
The discretization of the domains of the variables is an extremely delicate step, since it introduces an error that tends to render the inference of a qualitative nature. The level of discretization of the domains must therefore be carefully controlled, using where possible thresholds that have a precise semantic or operational value in the domain of interest. Structural learning serves to define the topology of the network and is usually a process that is carried out by successive approximations under the supervision of the modeler. Finally, the learning of the conditional probability tables takes place automatically through the expectation maximization algorithm (EM-Learning).
5. The Analysis of a Test Case
This section will exemplify the functionalities of the proposed system through the analysis of a test case, describing the corporate’s database, the structure of the index frame, and the main types of inference.
5.1. The Case Base and the Thermal Model View
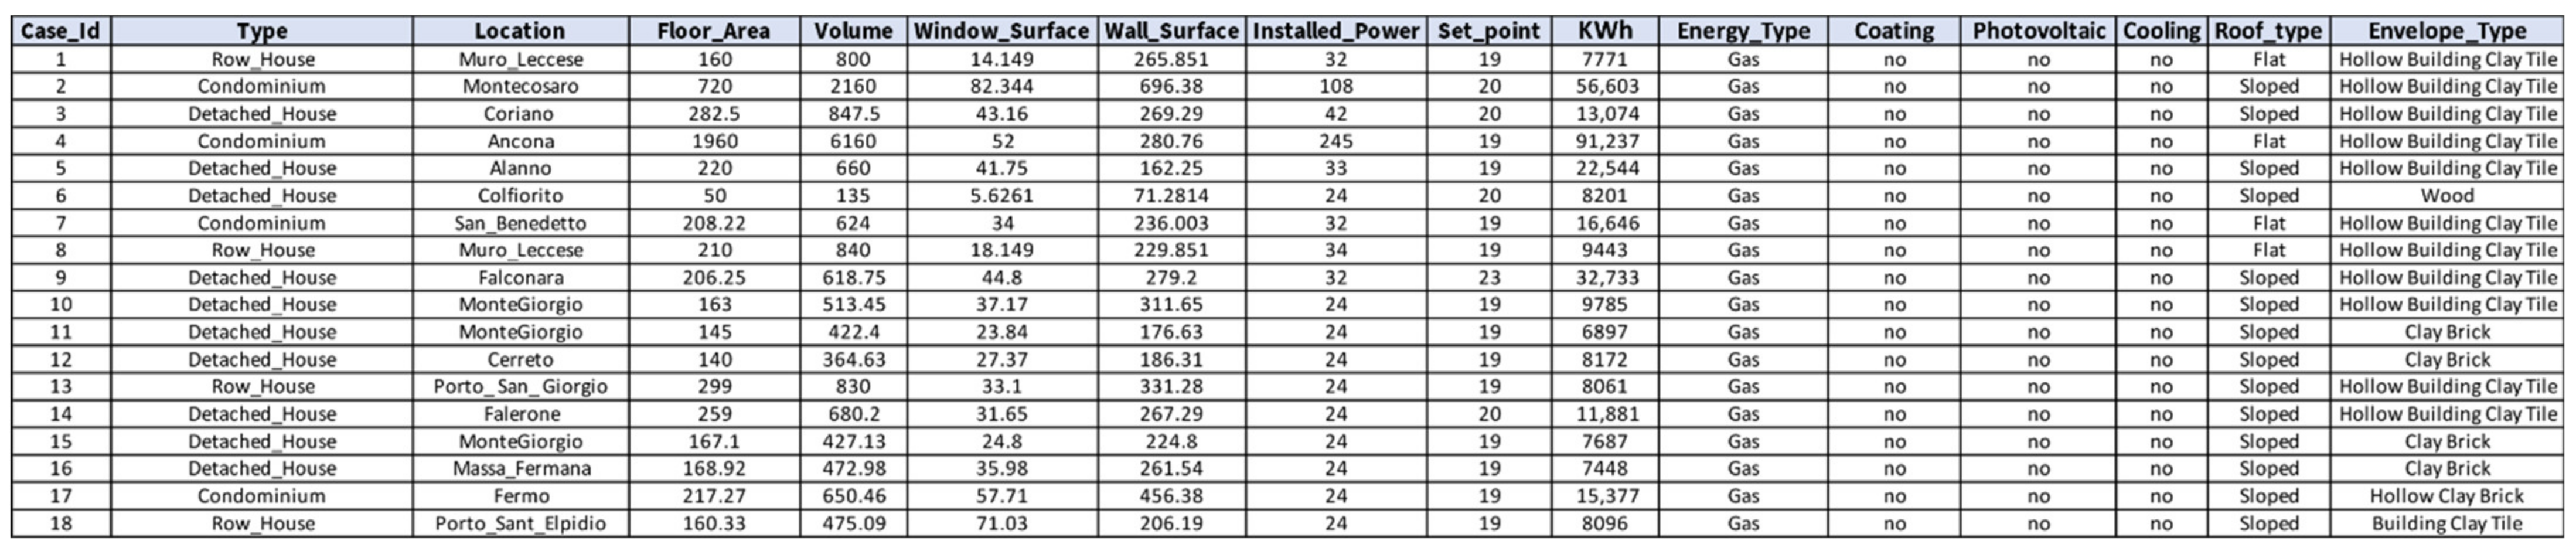
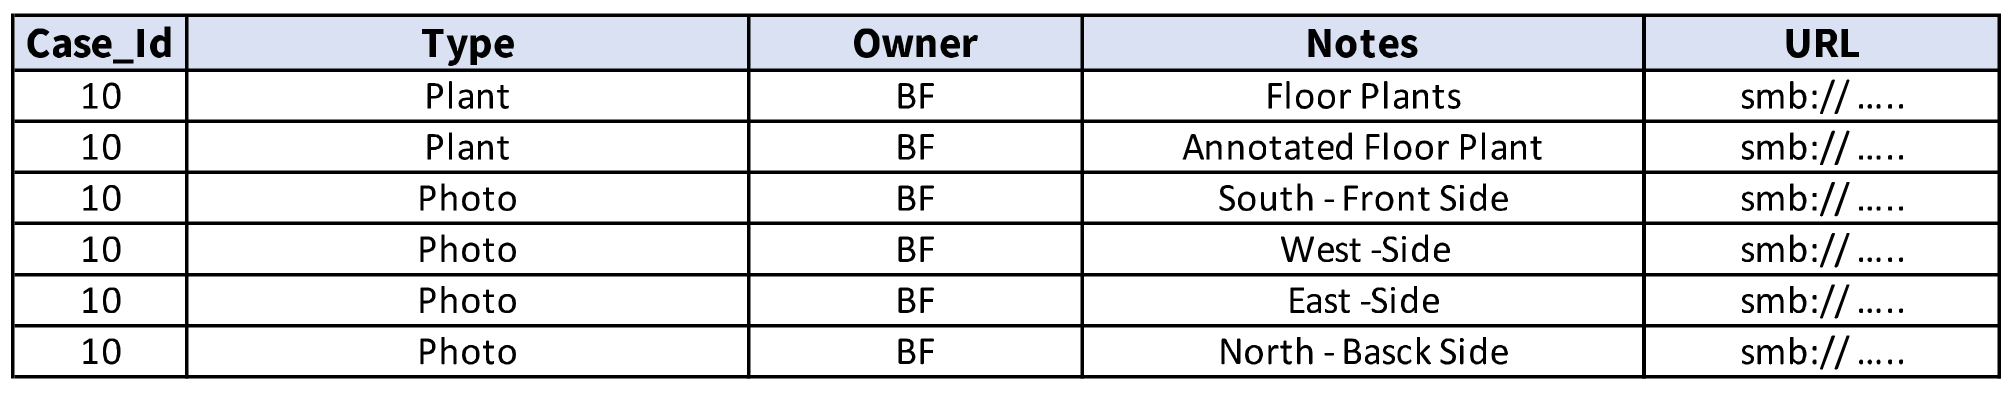
The Case Base comprises 40 buildings in the Marche region of central Italy, mostly located in the countryside. The Case Base is made of a table that contains the basic information of each building (
Figure 9), and of a table that contains the metadata of photos and technical document files (
Figure 10). The construction of the Thermal Model View required 250 simulations. For each building a baseline was calculated using the annual consumption of the year 2020. Performance forecasting were then made by simulating the consumption for different combinations of thermal insulation and photovoltaic. The parameters of the thermal system, the usage profile and the envelope have been determined with a good degree of certainty during on-site surveys. The site inspections involved the collection of technical drawings, when present, the survey of the main dimensions of the building and the visual inspection of the walls and thermal systems. Model calibration has been used to estimate the thermal resistances of the fan coil diffusers (or radiators), and the air exchanges due to the opening of windows and doors.
5.2. The Thermal Index Frame
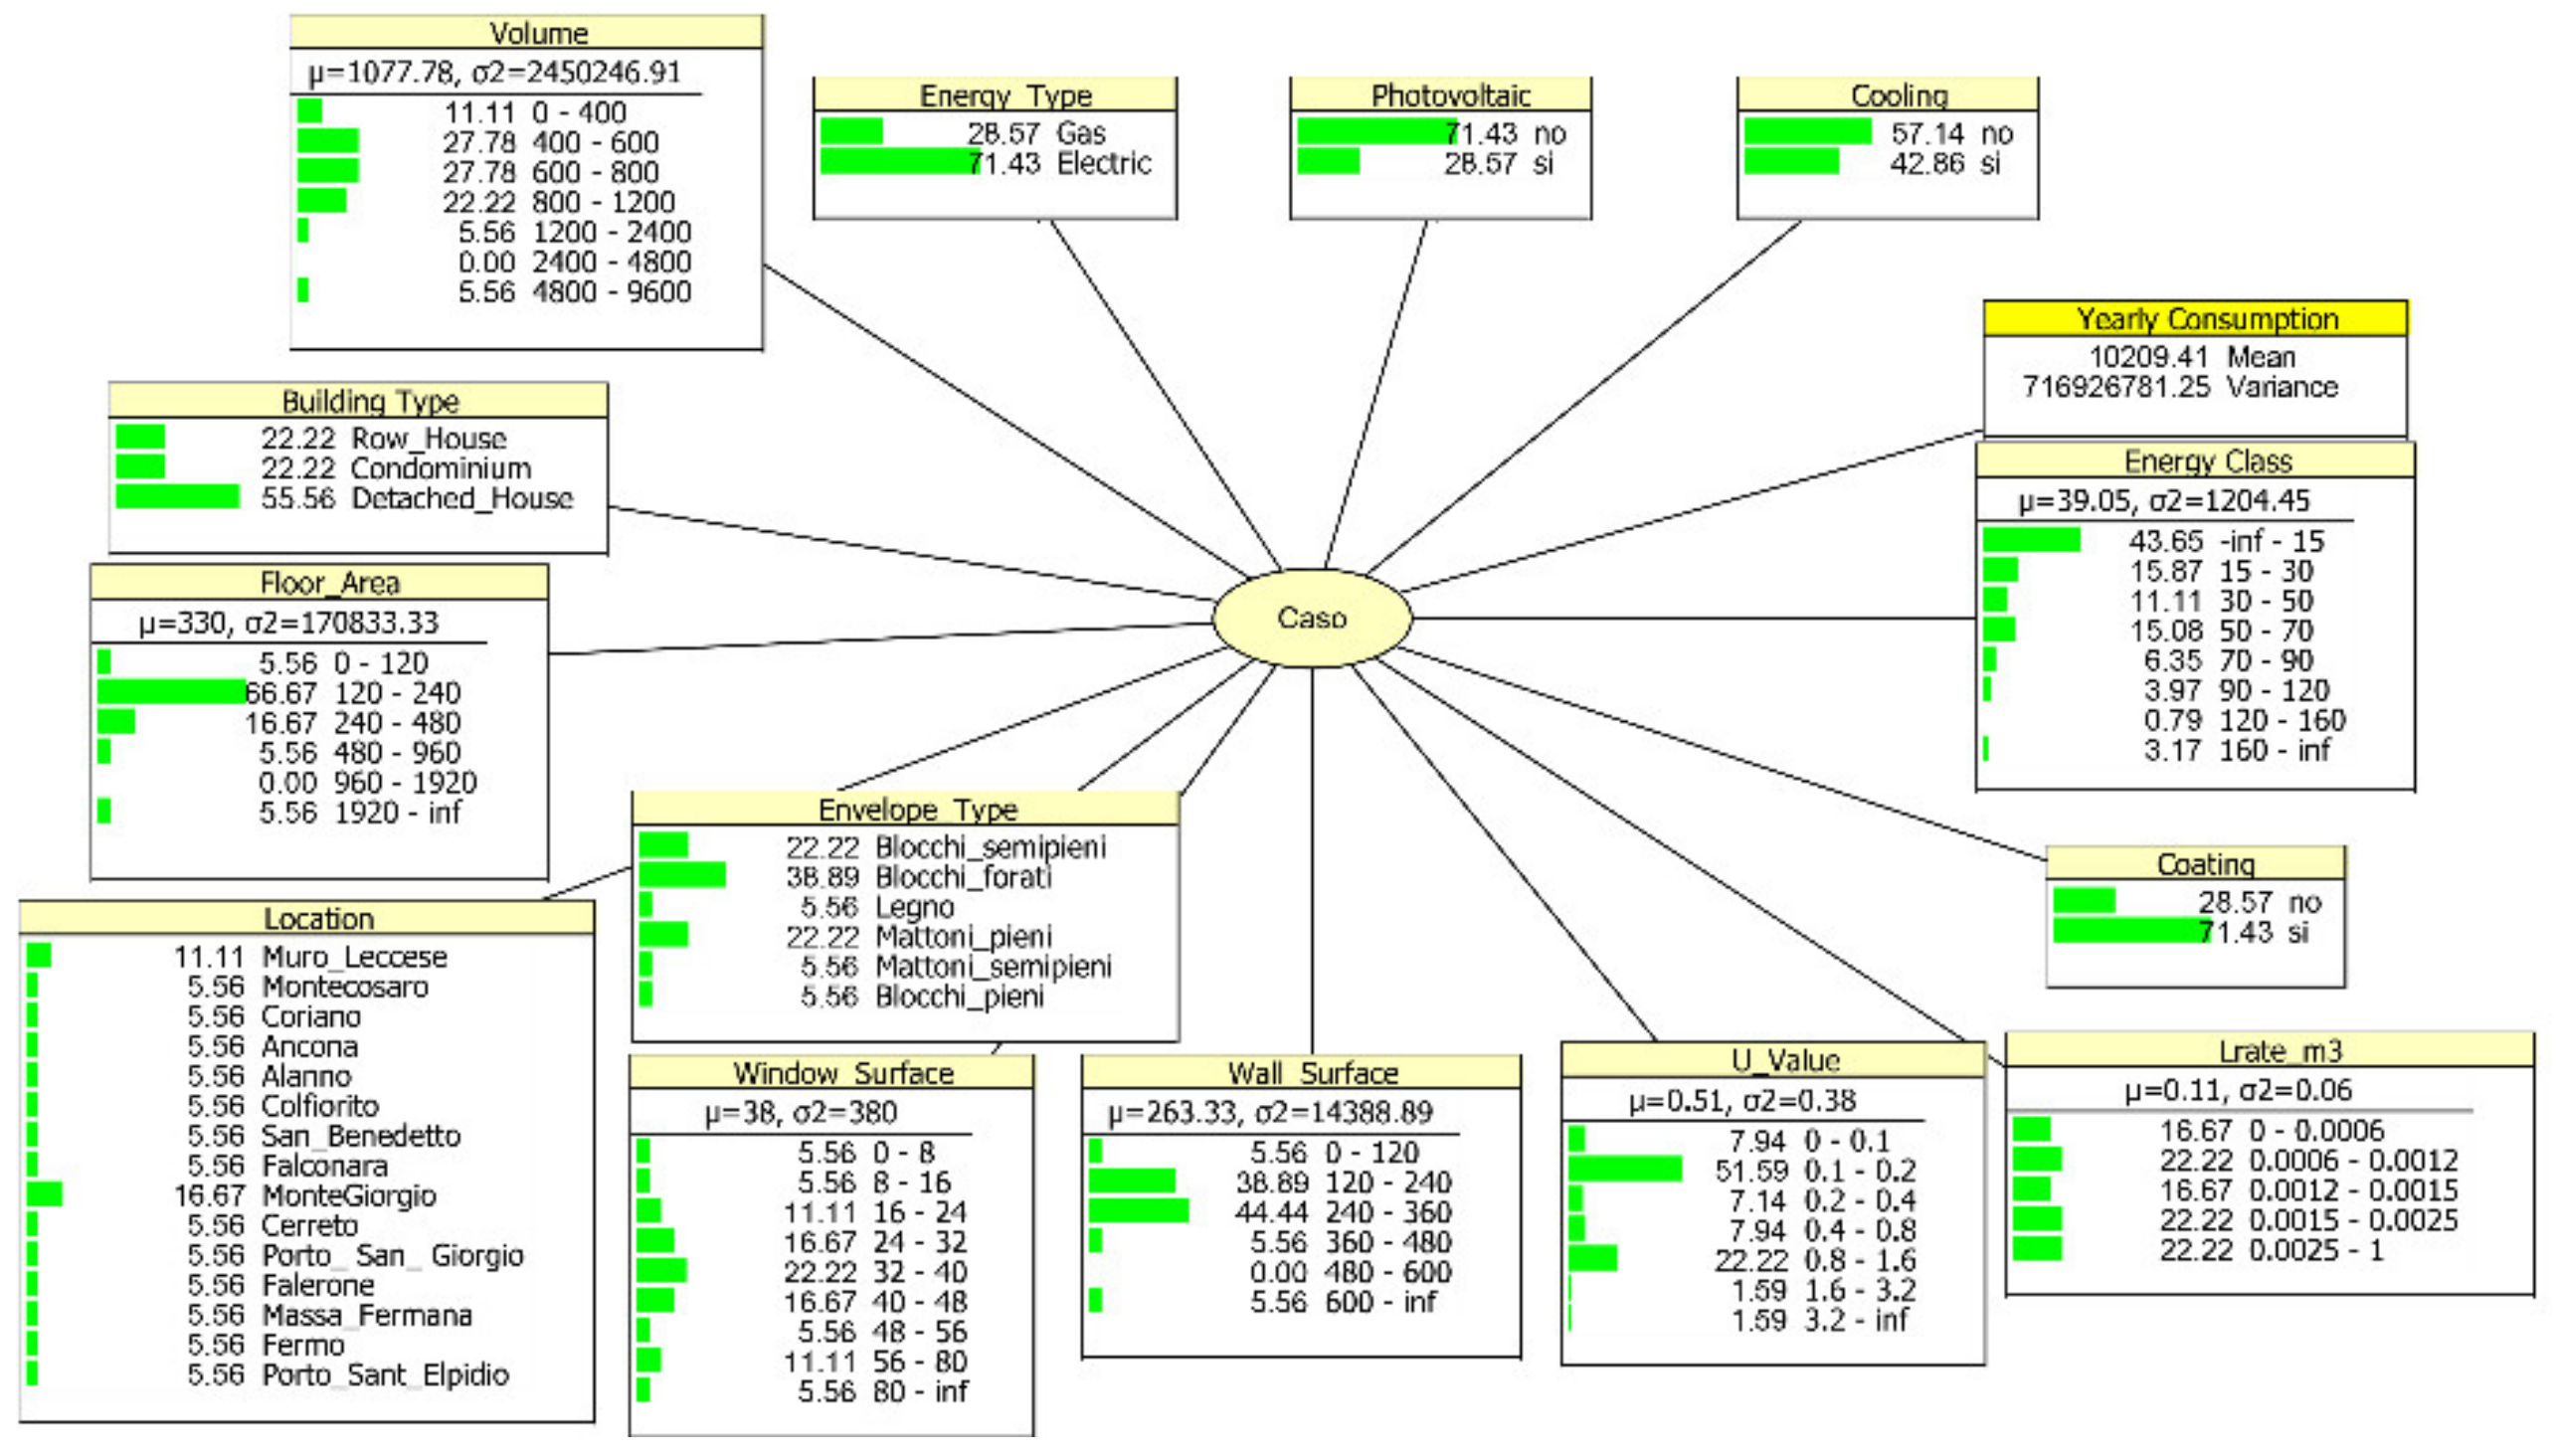
The Bayesian model used for the thermal index frame consists of a mixed Bayesian network that uses both discrete and continuous nodes. The network was derived from the Thermal Model View data set using the learning procedure. The discretization of the variables was carried out as far as possible using a good level of resolution, determined as a trade-off between network complexity and detail, and a uniform interval width. This avoids tailoring too much the model on the data set, hindering future expansions. In some cases, however, specific regulations involving some parameters (e.g., building consumption per square meter), imposed the use of standardized thresholds. The structure of the network was defined a priori, using a simple Naive Bayes Classifier model. Finally, the EM Learning algorithm was used for learning the conditional probability tables. The resulting Bayesian network is shown in
Figure 11. Nodes’ specifications are reported in
Table 3. The Bayesian Network has been implemented by means of the Hugin 8.8 library.
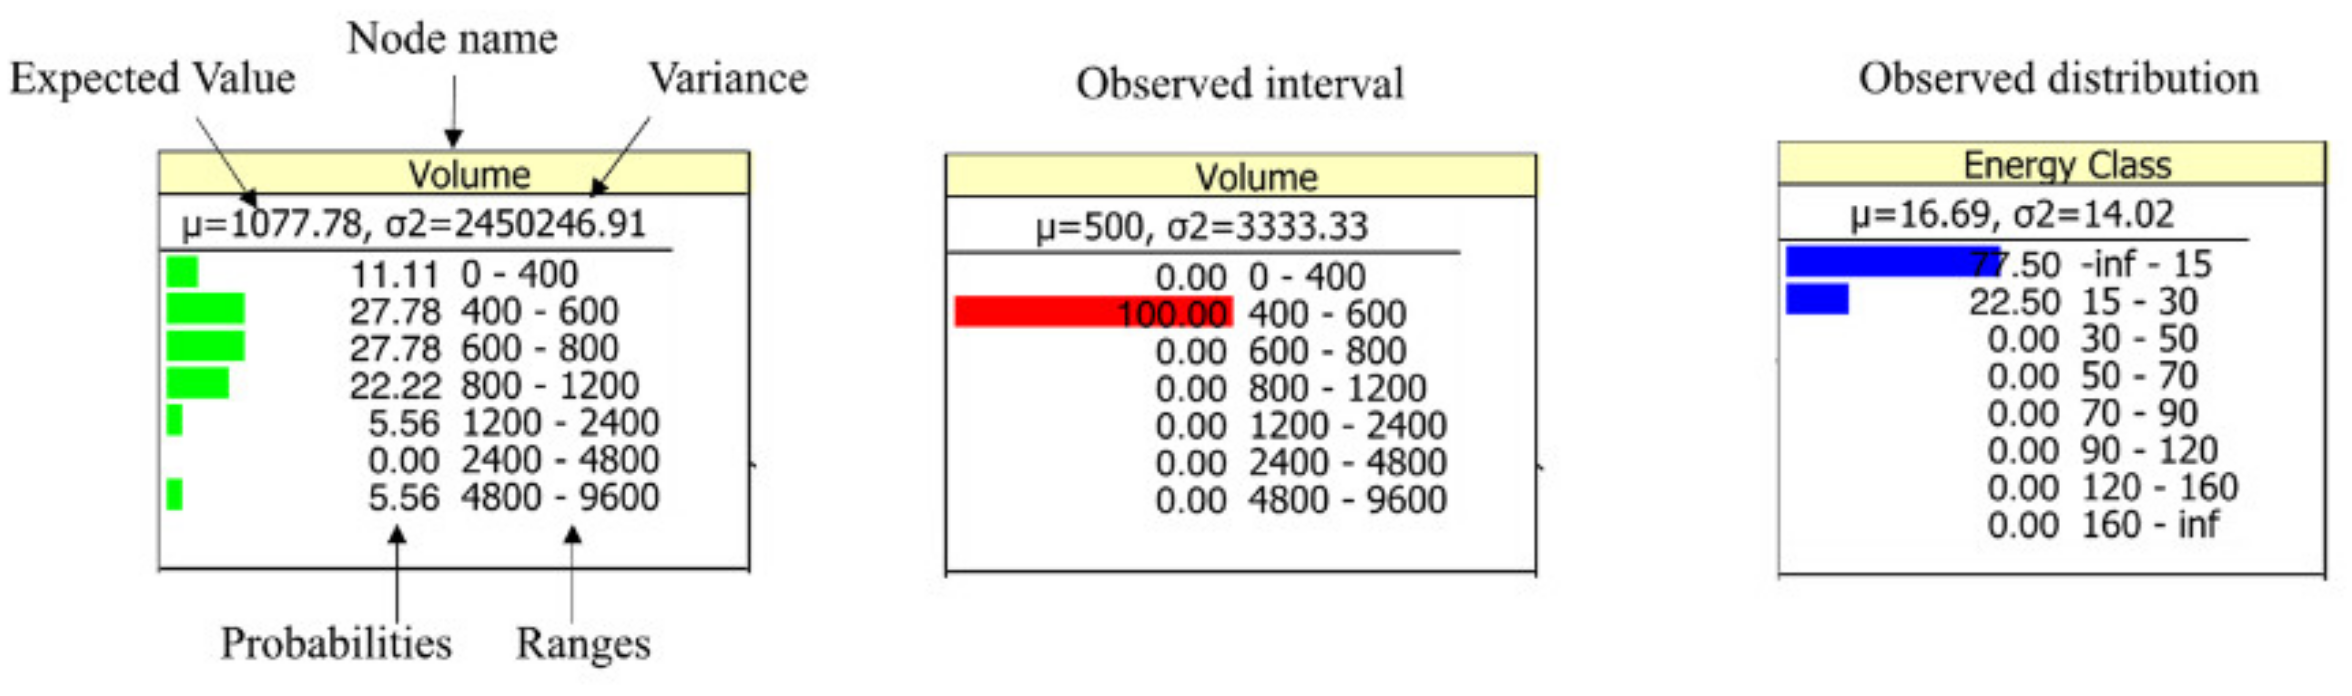
Figure 12 shows a legend of the node monitor windows.
Not all the parameters of the Thermal Model View have been used in the Index Frame, as they were not strictly necessary for making inferences. Instead, more synthetic, and directly observable parameters have been adopted. For example, a single parameter the envelope type is used to synthetically represent the thermal capacities and resistances that characterize the envelope, since it both is directly observable and strongly correlated to the thermal resistances and capacities.
The Bayesian index frame introduces several noteworthy features. The Bayesian probabilistic representation lets us use probability distributions of the various parameters to represent uncertain evaluations. A second relevant aspect concerns the lack of values. The correlated index system lets us compensate the missing data by providing the best explanation according to the probability distributions of the missing parameters, derived from the model view. Finally, the system seamlessly operates both in a forward way, estimating the expected performances starting from the observed indices, and in a backward way, estimating the framework of the technical characteristics that are most likely to achieve the expected performances.
The following sections will detail these aspects, where we will discuss three inference examples: forward reasoning as performance estimation, backward reasoning as estimation of technical parameters, and the full CBR.
5.3. Performance Estimation
The first example of performance estimation concerns the assessment of the actual condition. It is articulated by defining the dwelling type and some of the most easily identifiable parameters, such as the volume (Volume approx 440 [m
3]), the technology of the envelope walls (Wall_Type = brick, Coating = no) and the characteristics of the systems (Cooling = no, PV = no). The model provides a consumption estimate of about 67 [KWh/m
2] (see
Figure 13).
As a further inferential step, it is possible to evaluate alternative scenarios as a function of different possible energy efficiency measures. For example,
Figure 14 shows the result that can be obtained after a coat of insulation (Coating = yes).
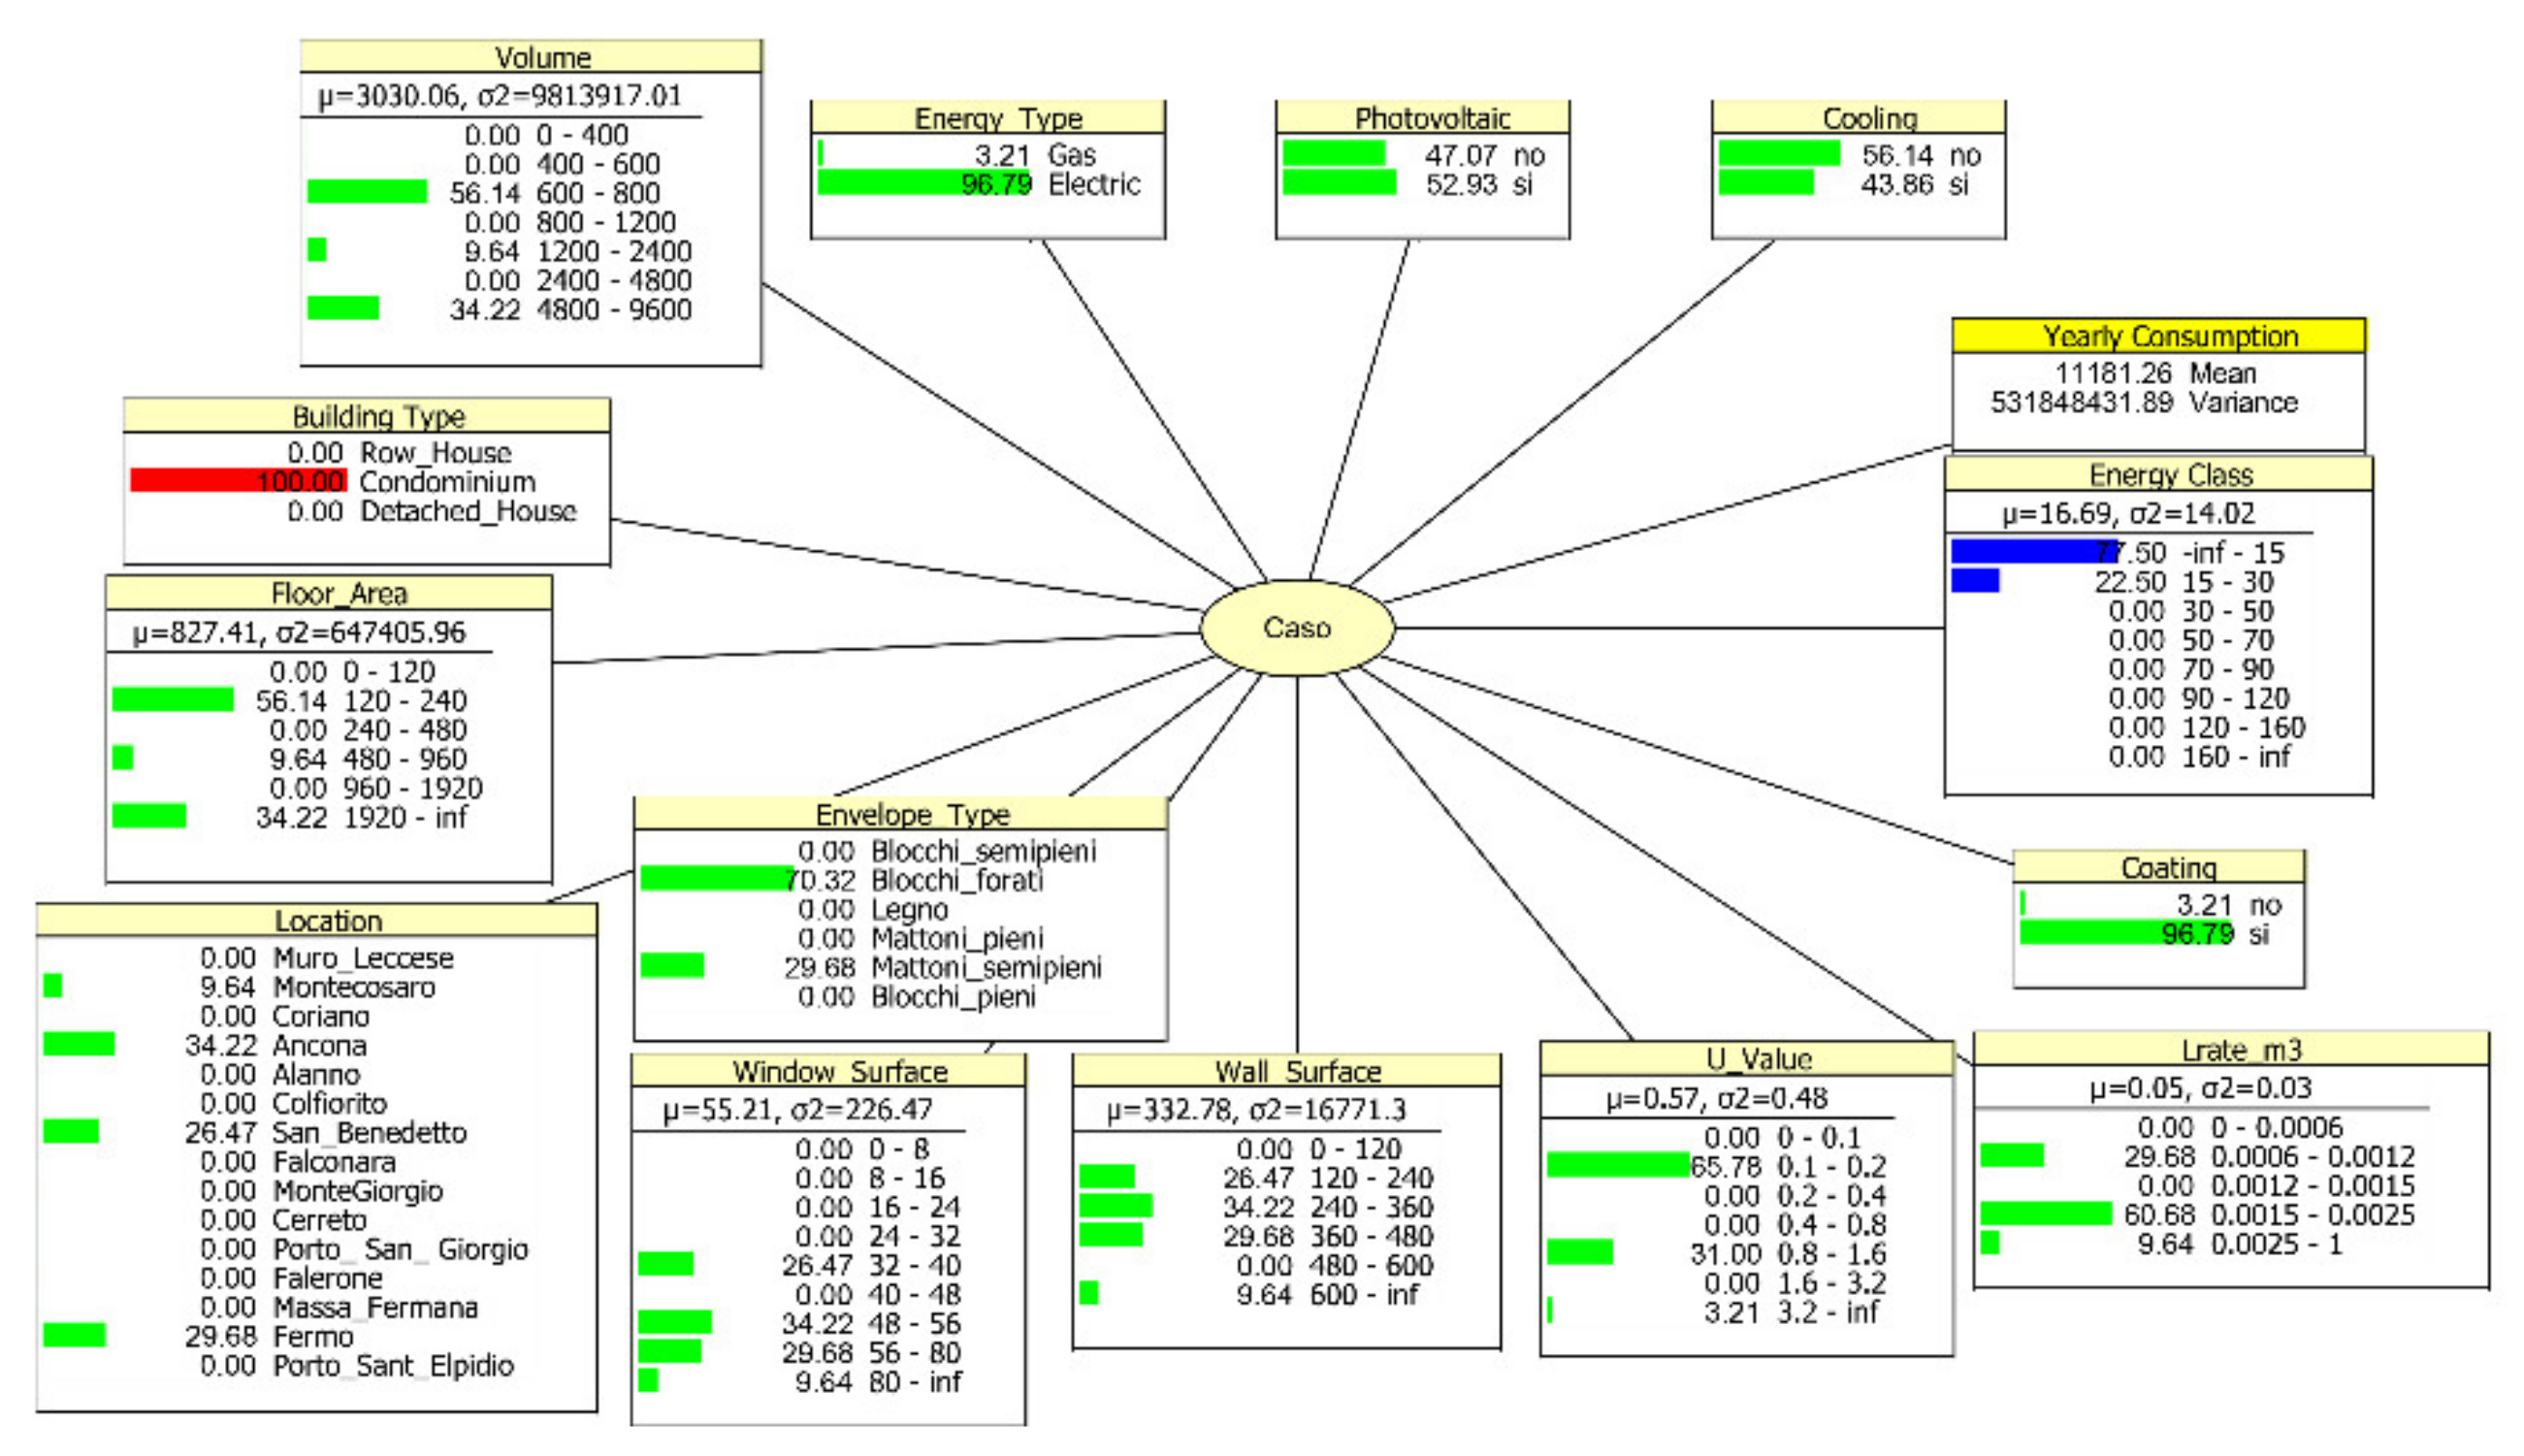
Finally, it is possible to represent the uncertainty in the estimation of more fuzzy parameters, such as the infiltration rate.
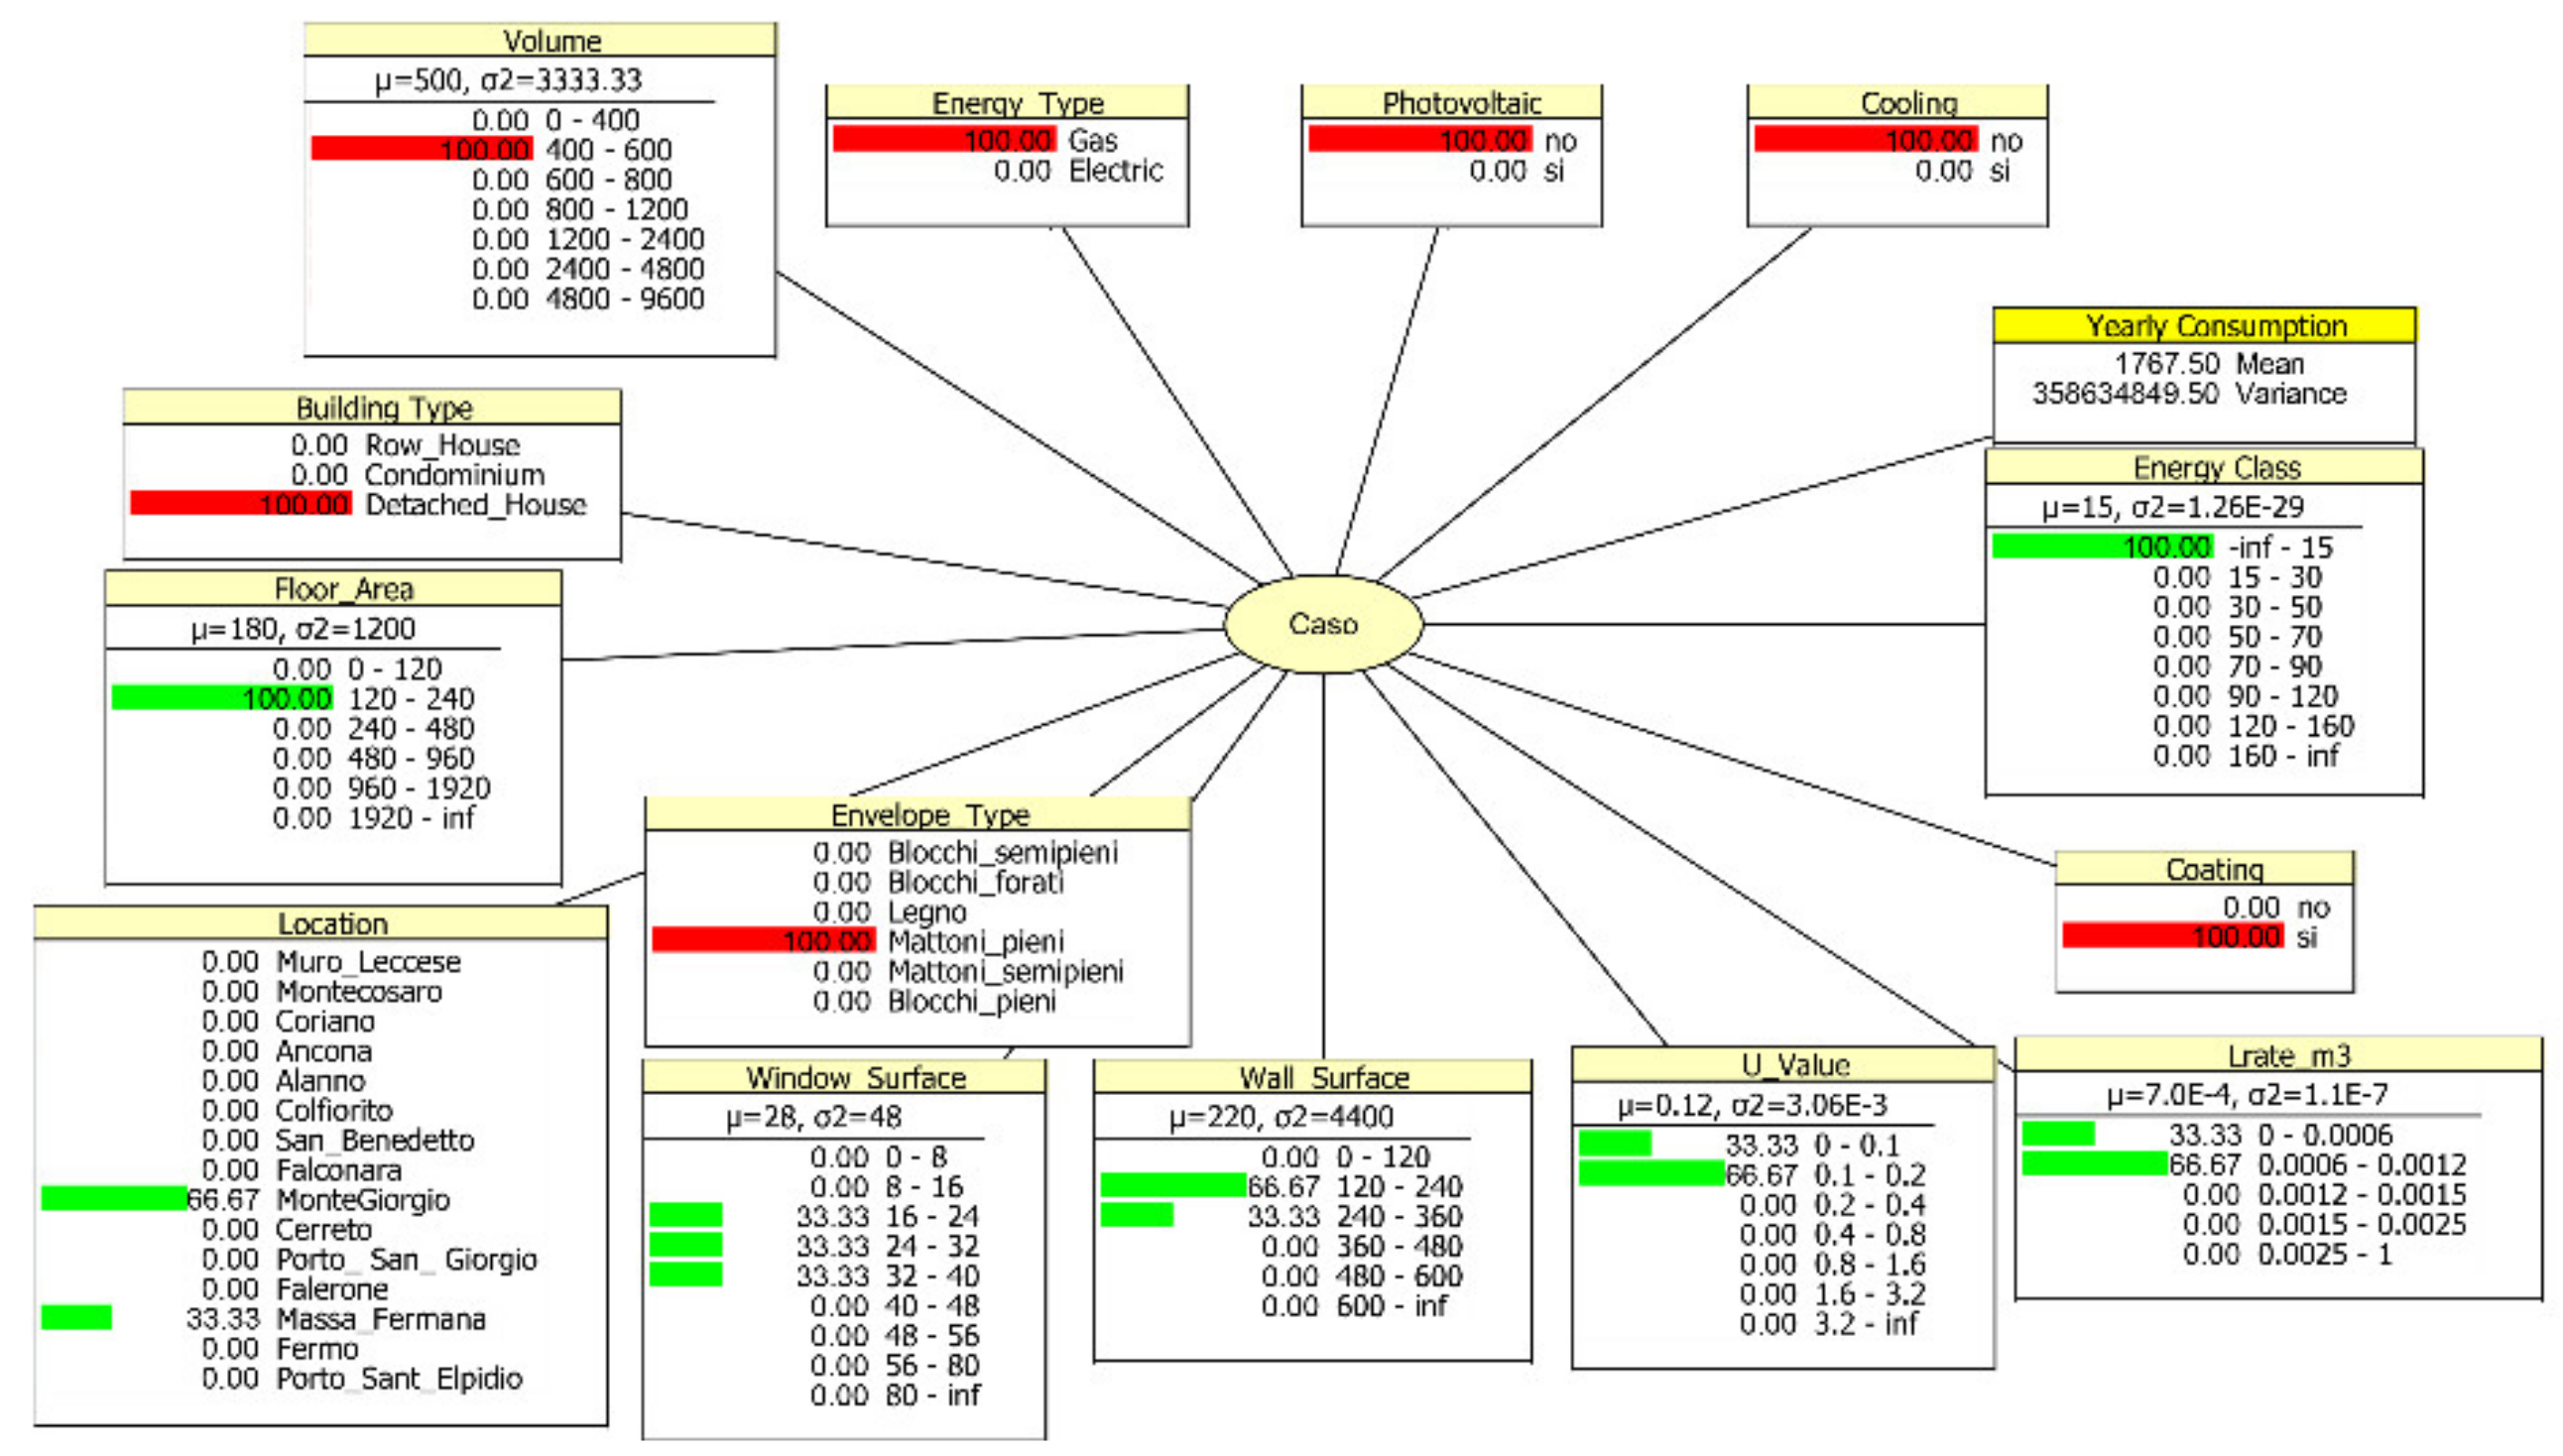
Figure 15 shows the performance estimation of a detached house with a heated volume of about 640 m
3. In this case the case base contains examples with a wide range of performance values. It is therefore necessary to include further parameter estimates to narrow the range.
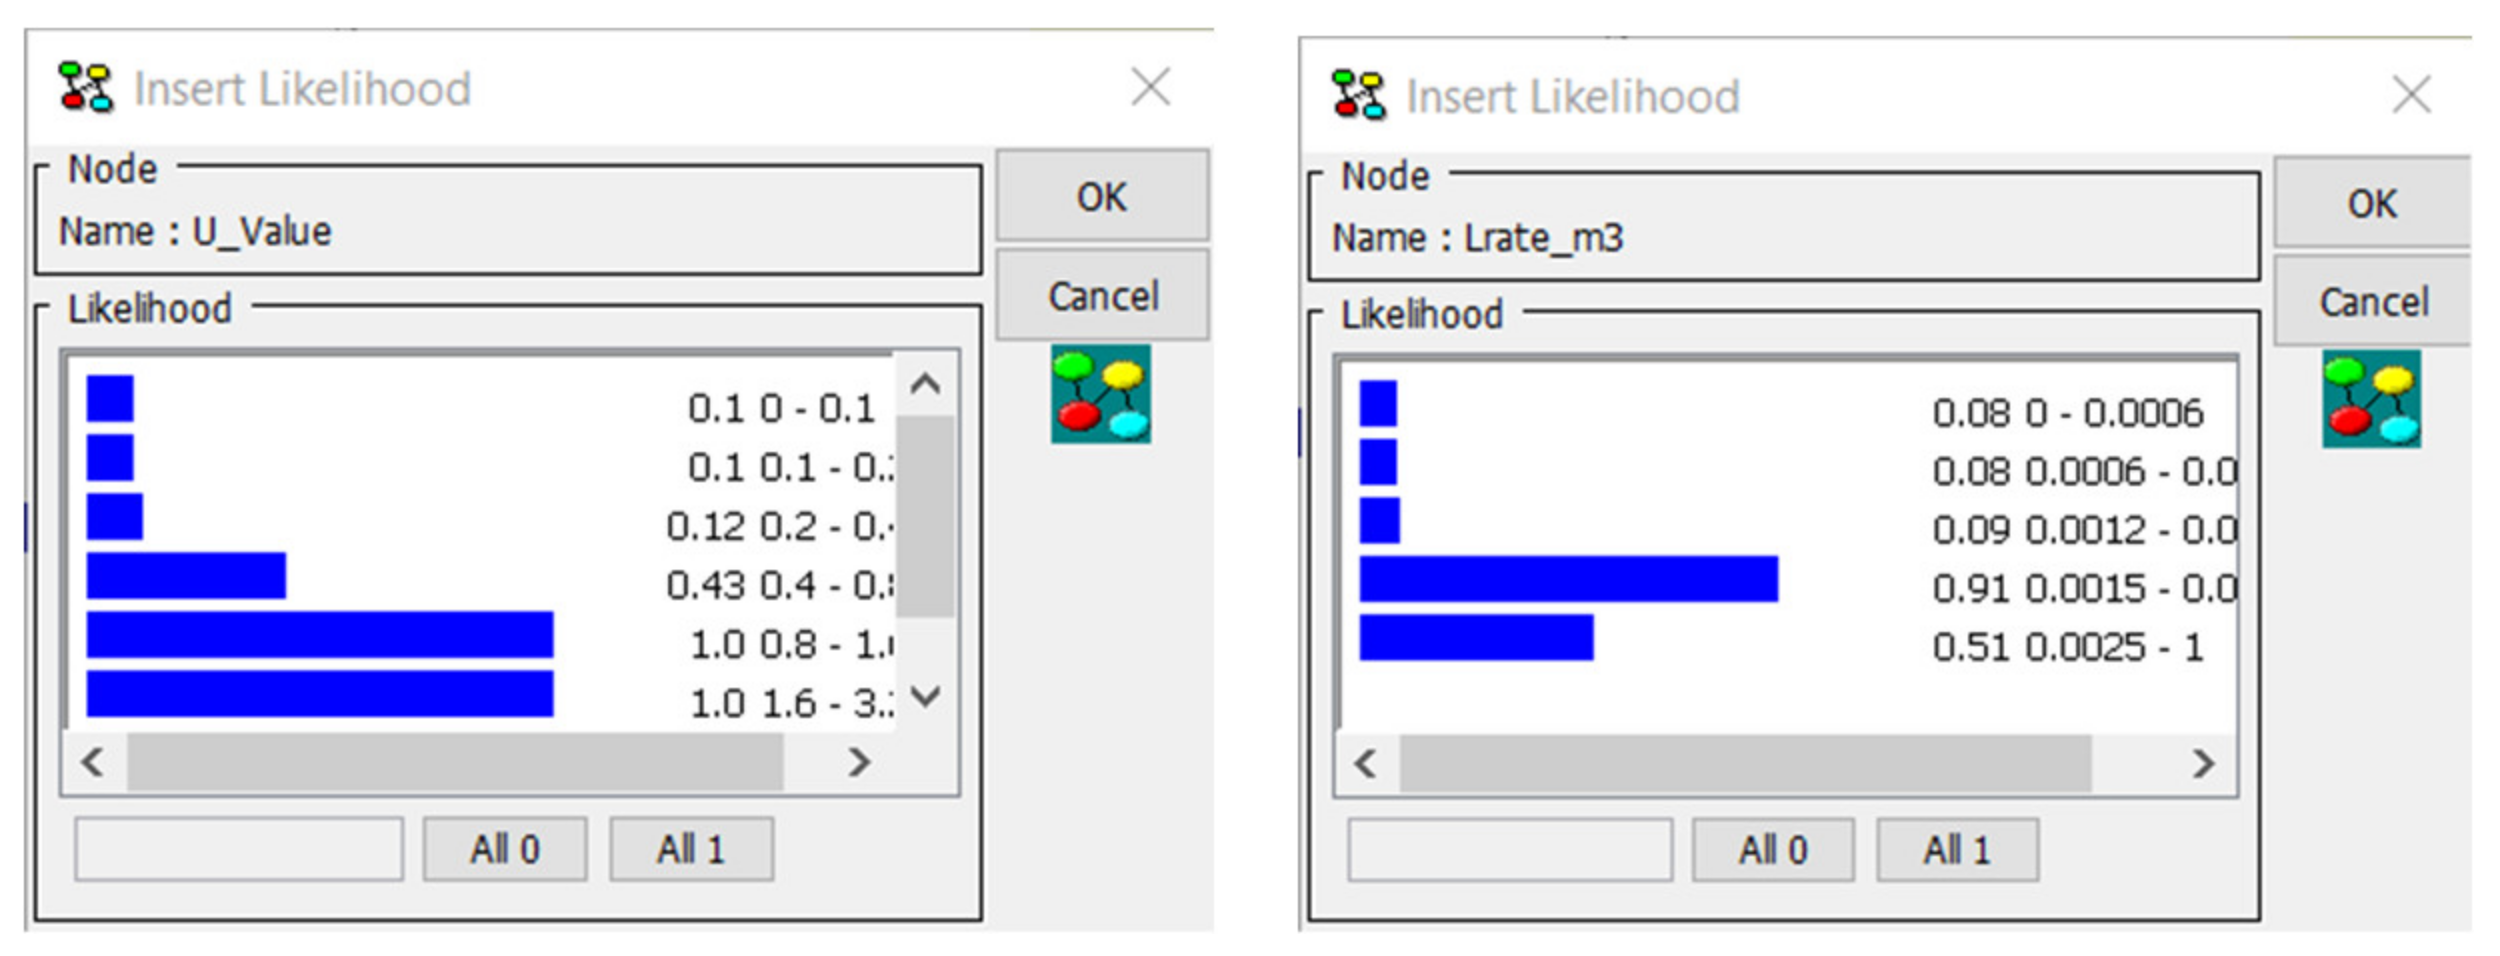
Figure 16 shows the performance values obtained downstream of an infiltration (
Lrate_m3 Node) and transmittance (
U_Value Node) estimates. In this case, the
U_Value parameters and
Lrate_m3 parameters are observed as likelihood distributions over their domain (
Figure 17). The
Energy Class converges towards the range 120–180 [KWh/m
2].
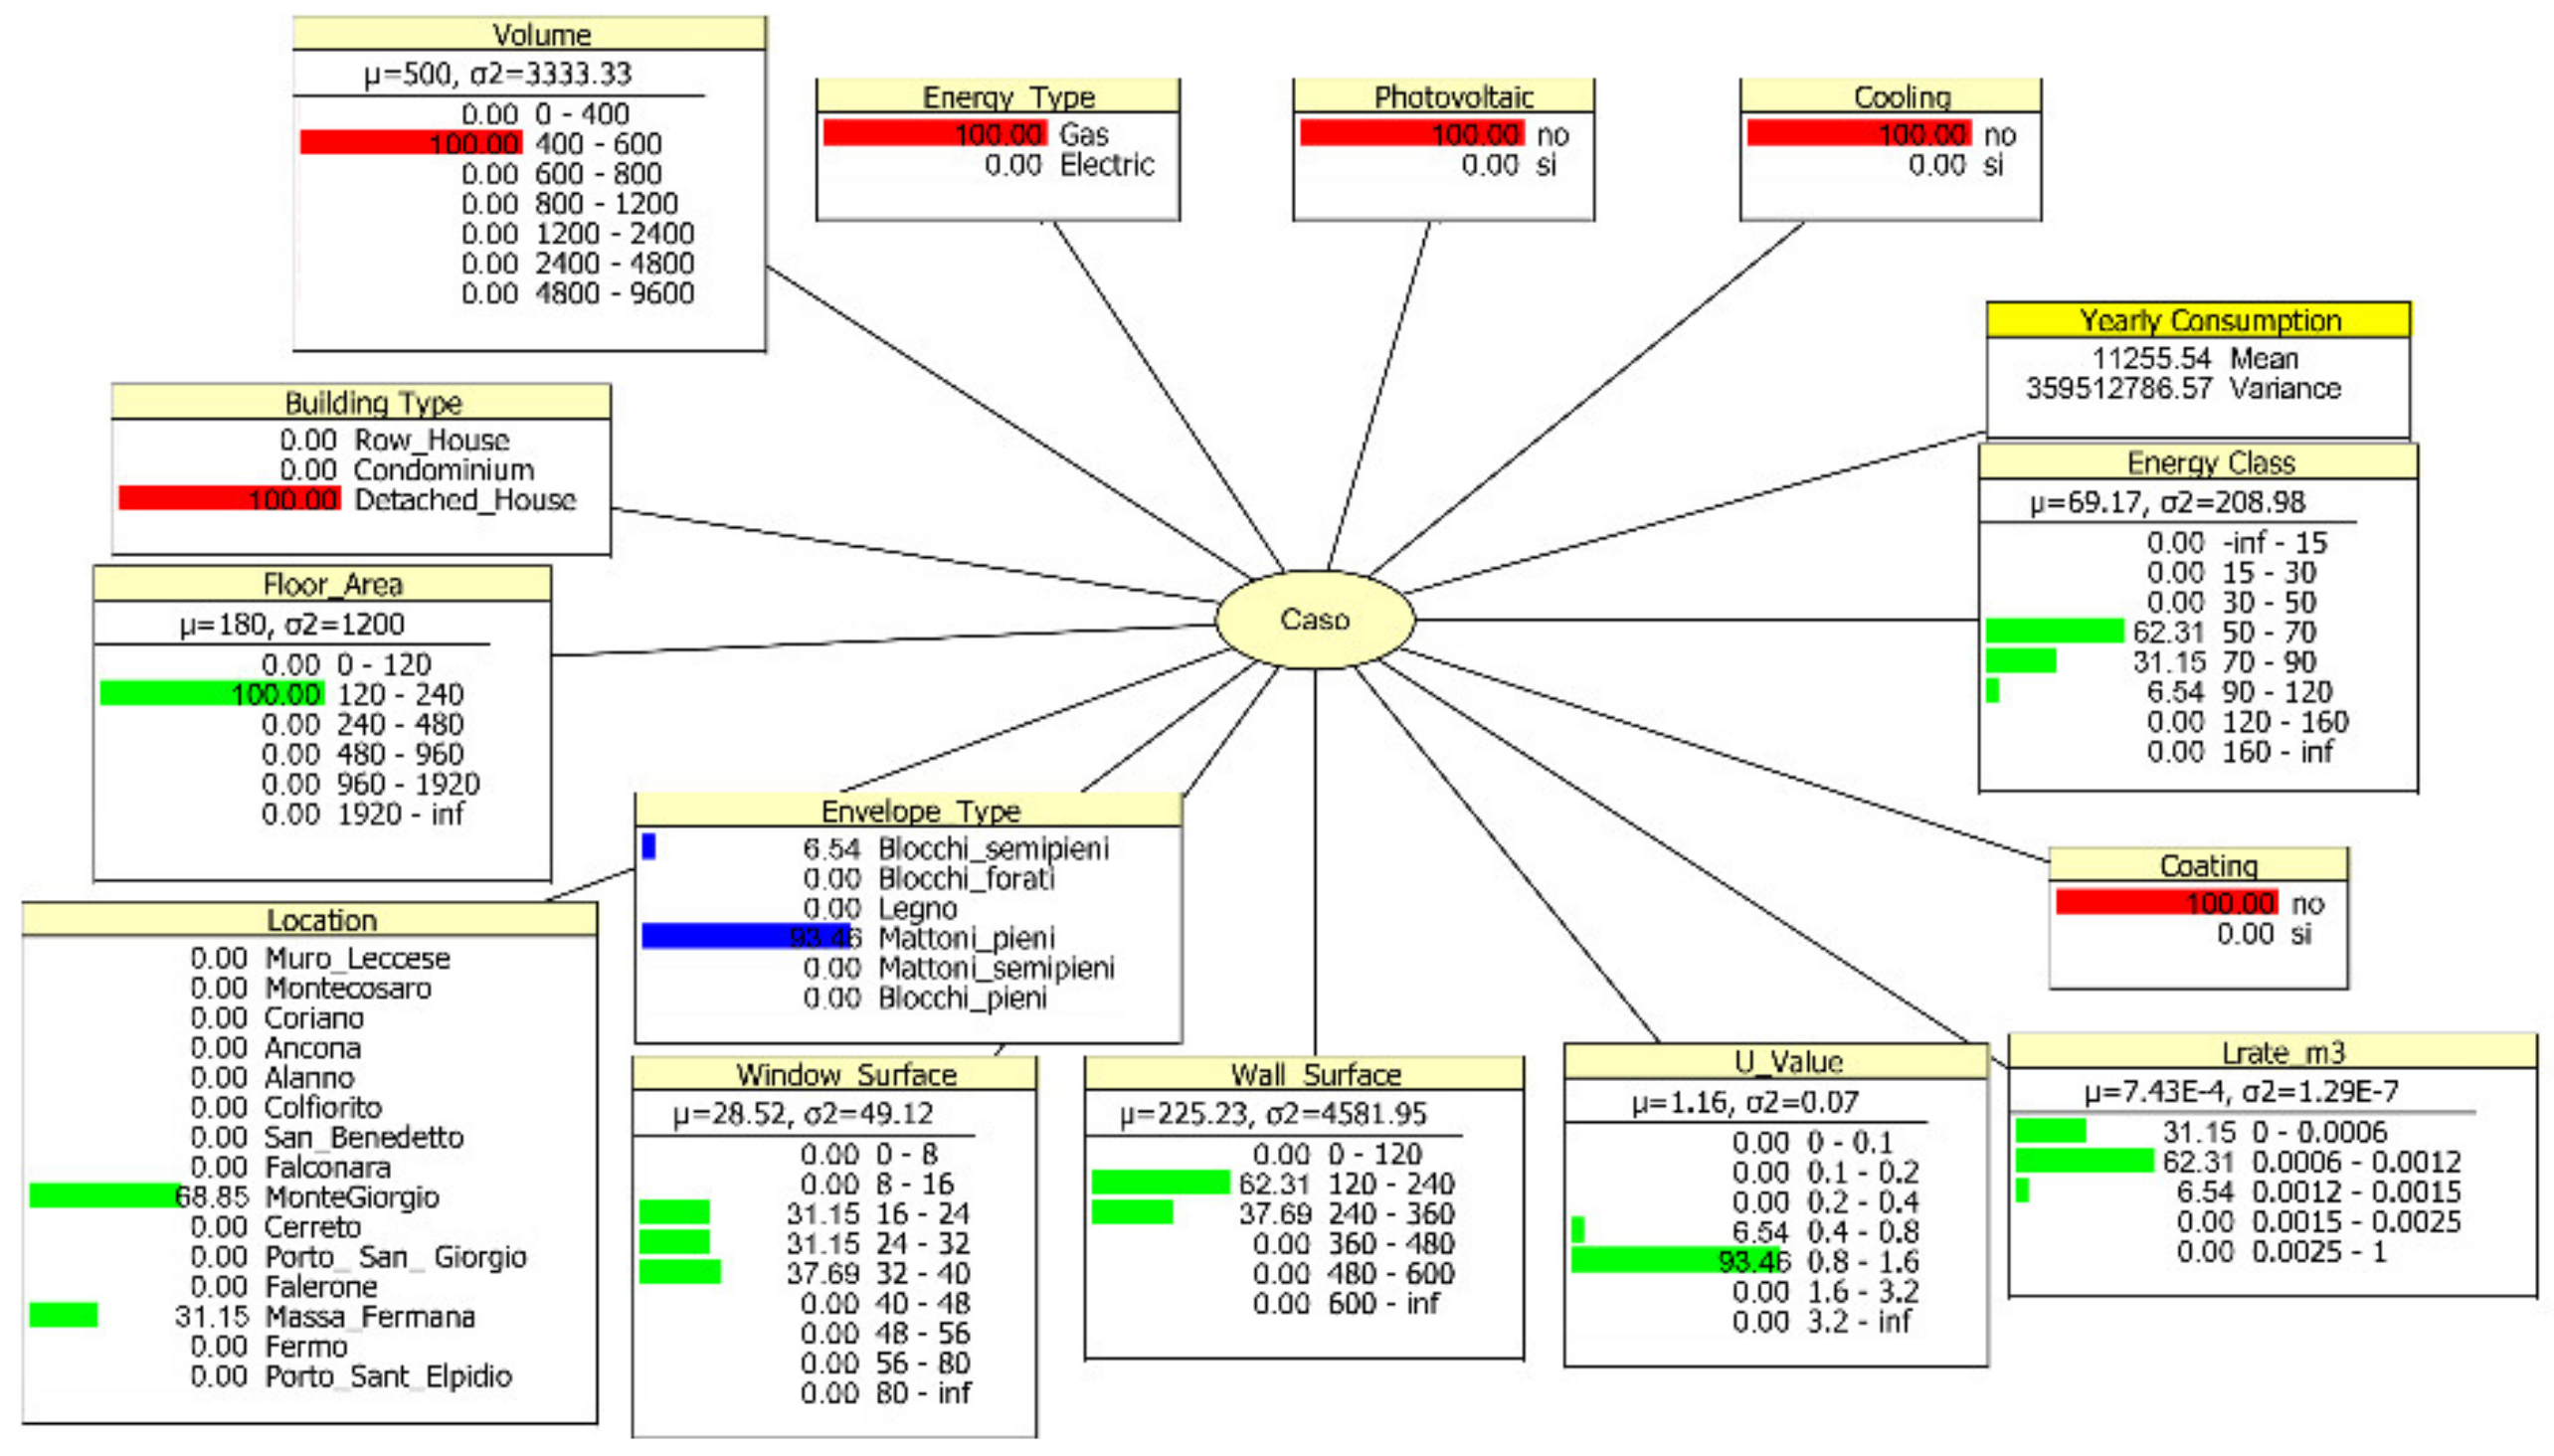
5.4. Estimation of Technical Parameters
The analysis of technical parameters is obtained by constraining the probability distribution of a performance parameter (e.g.,
Energy Class) and, possibly, other parameters such as the building type of interest (
Figure 18).
The Index-Frame assumes a configuration that indicates the compatible cases that can support the investigation of this scenario. A first relevant aspect emerges: these performance classes can only be achieved after a building envelope insulation intervention.
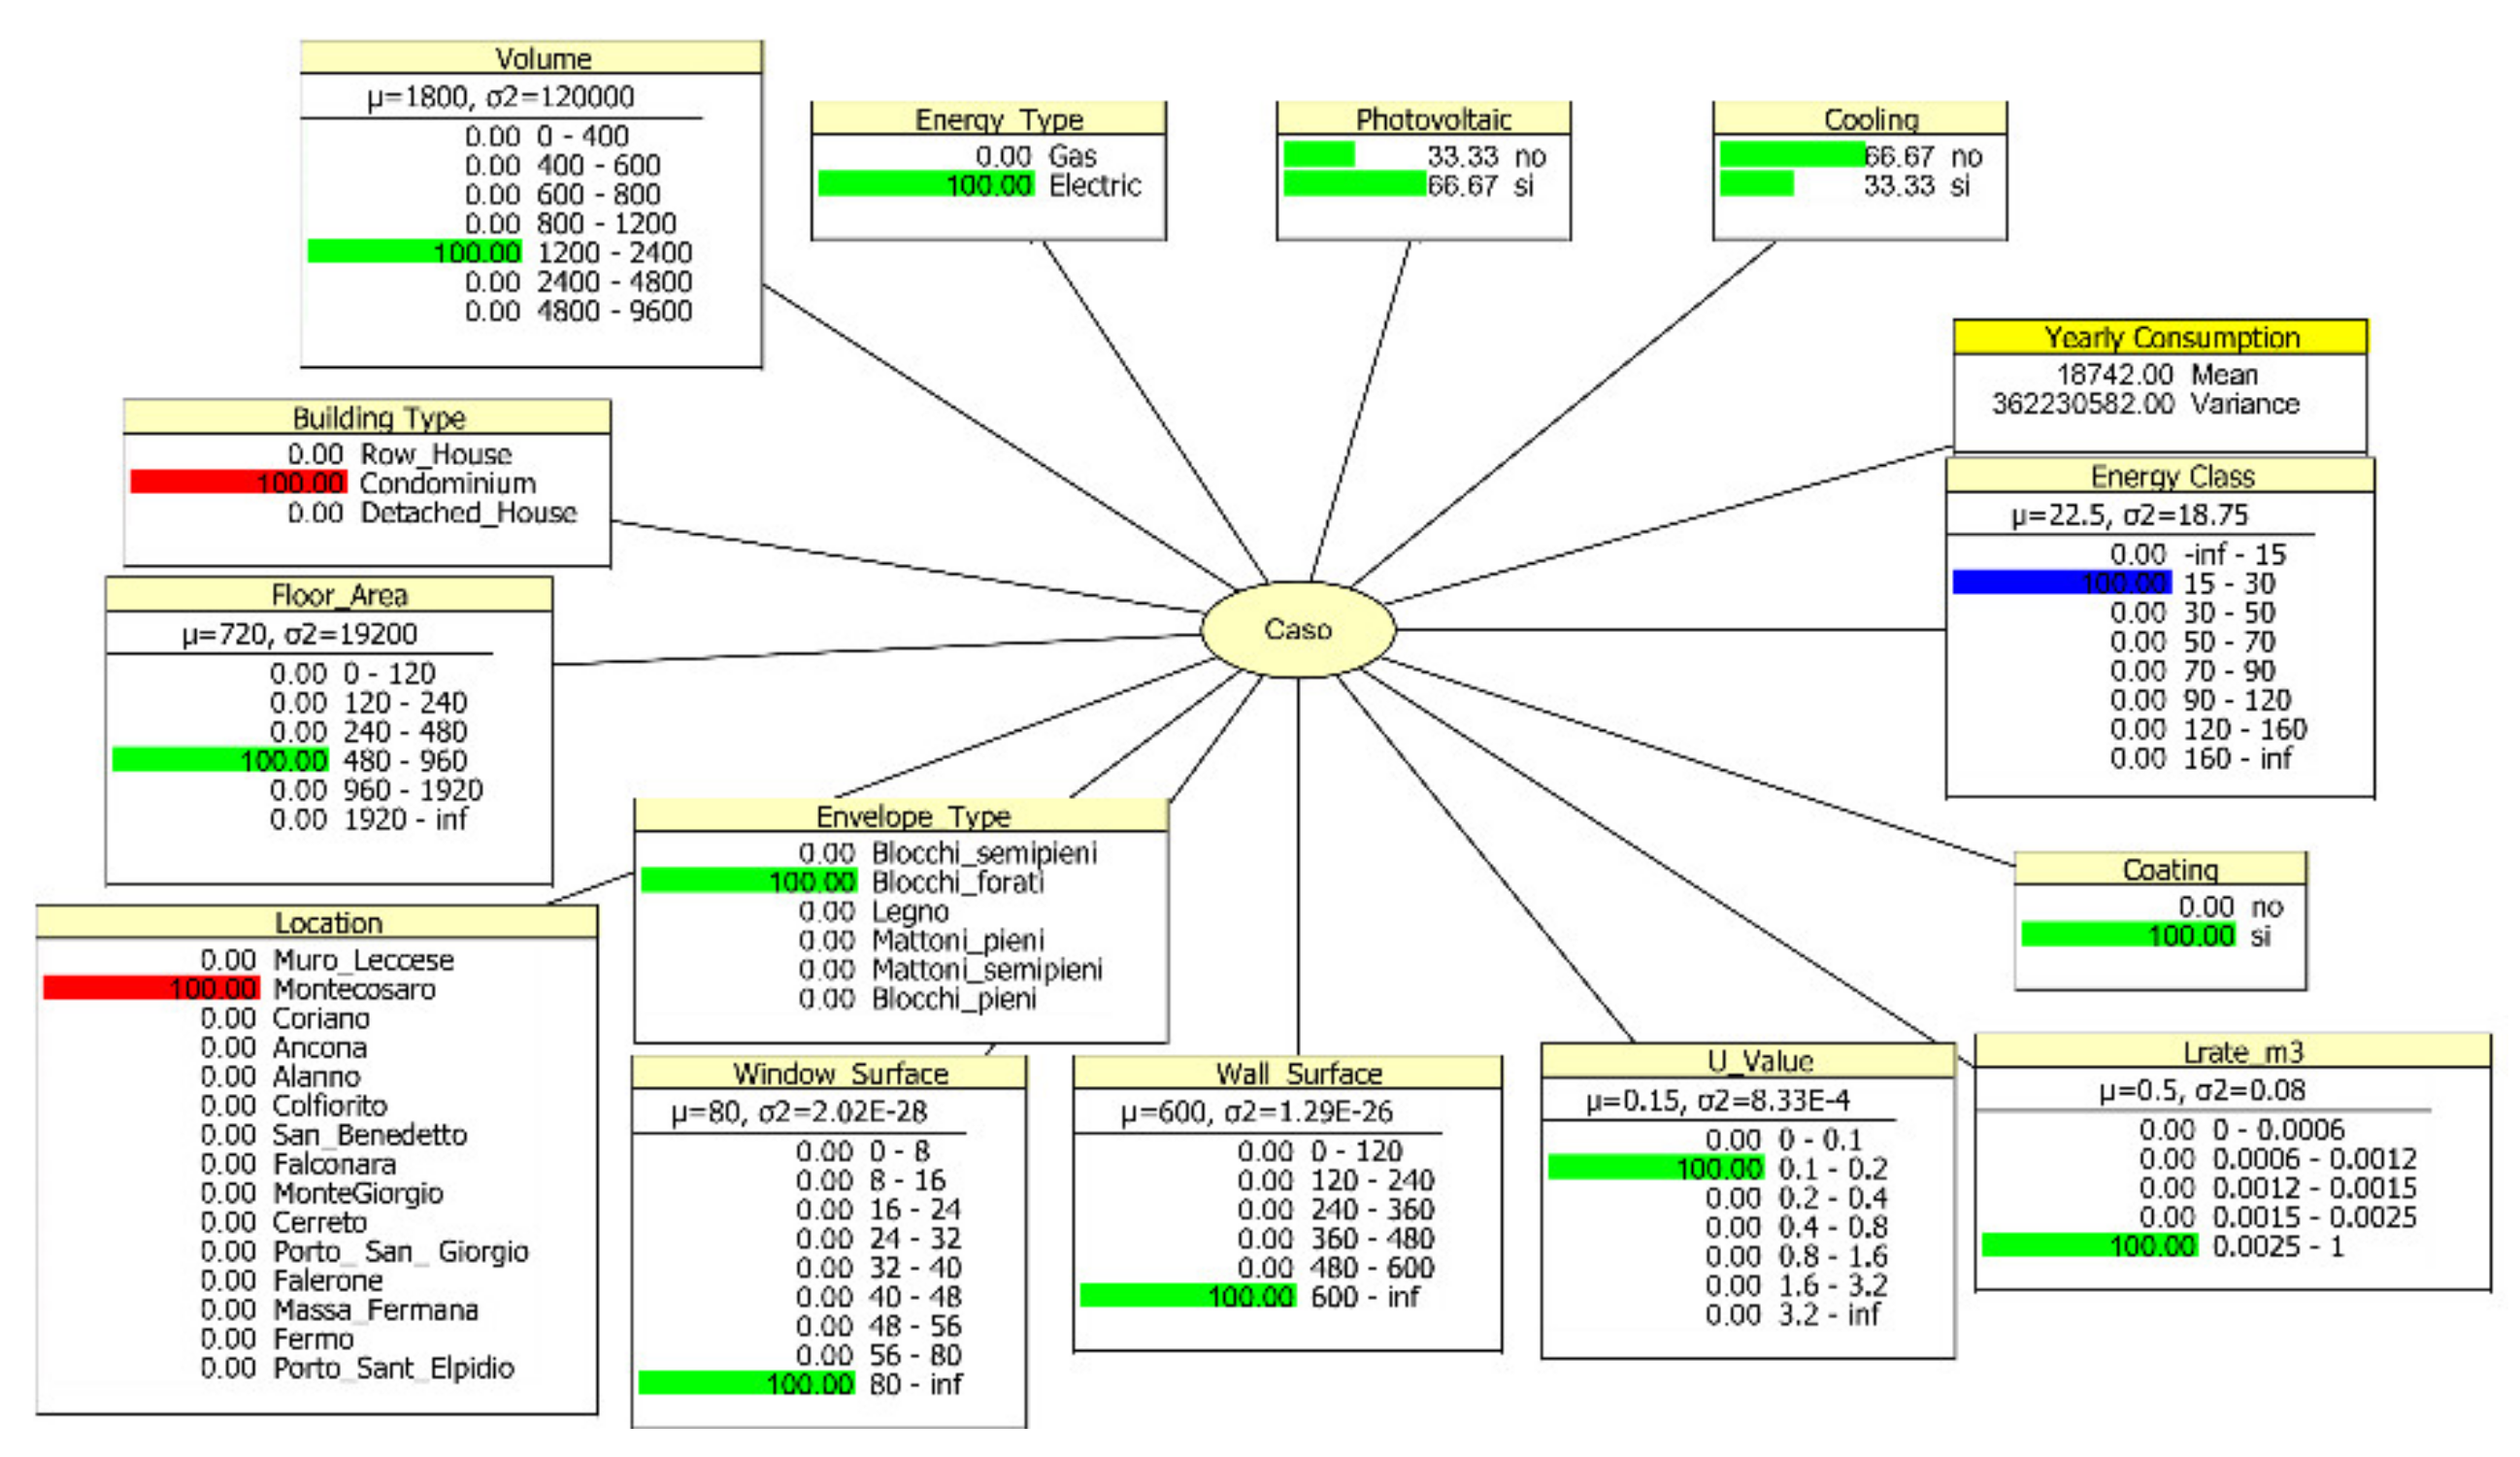
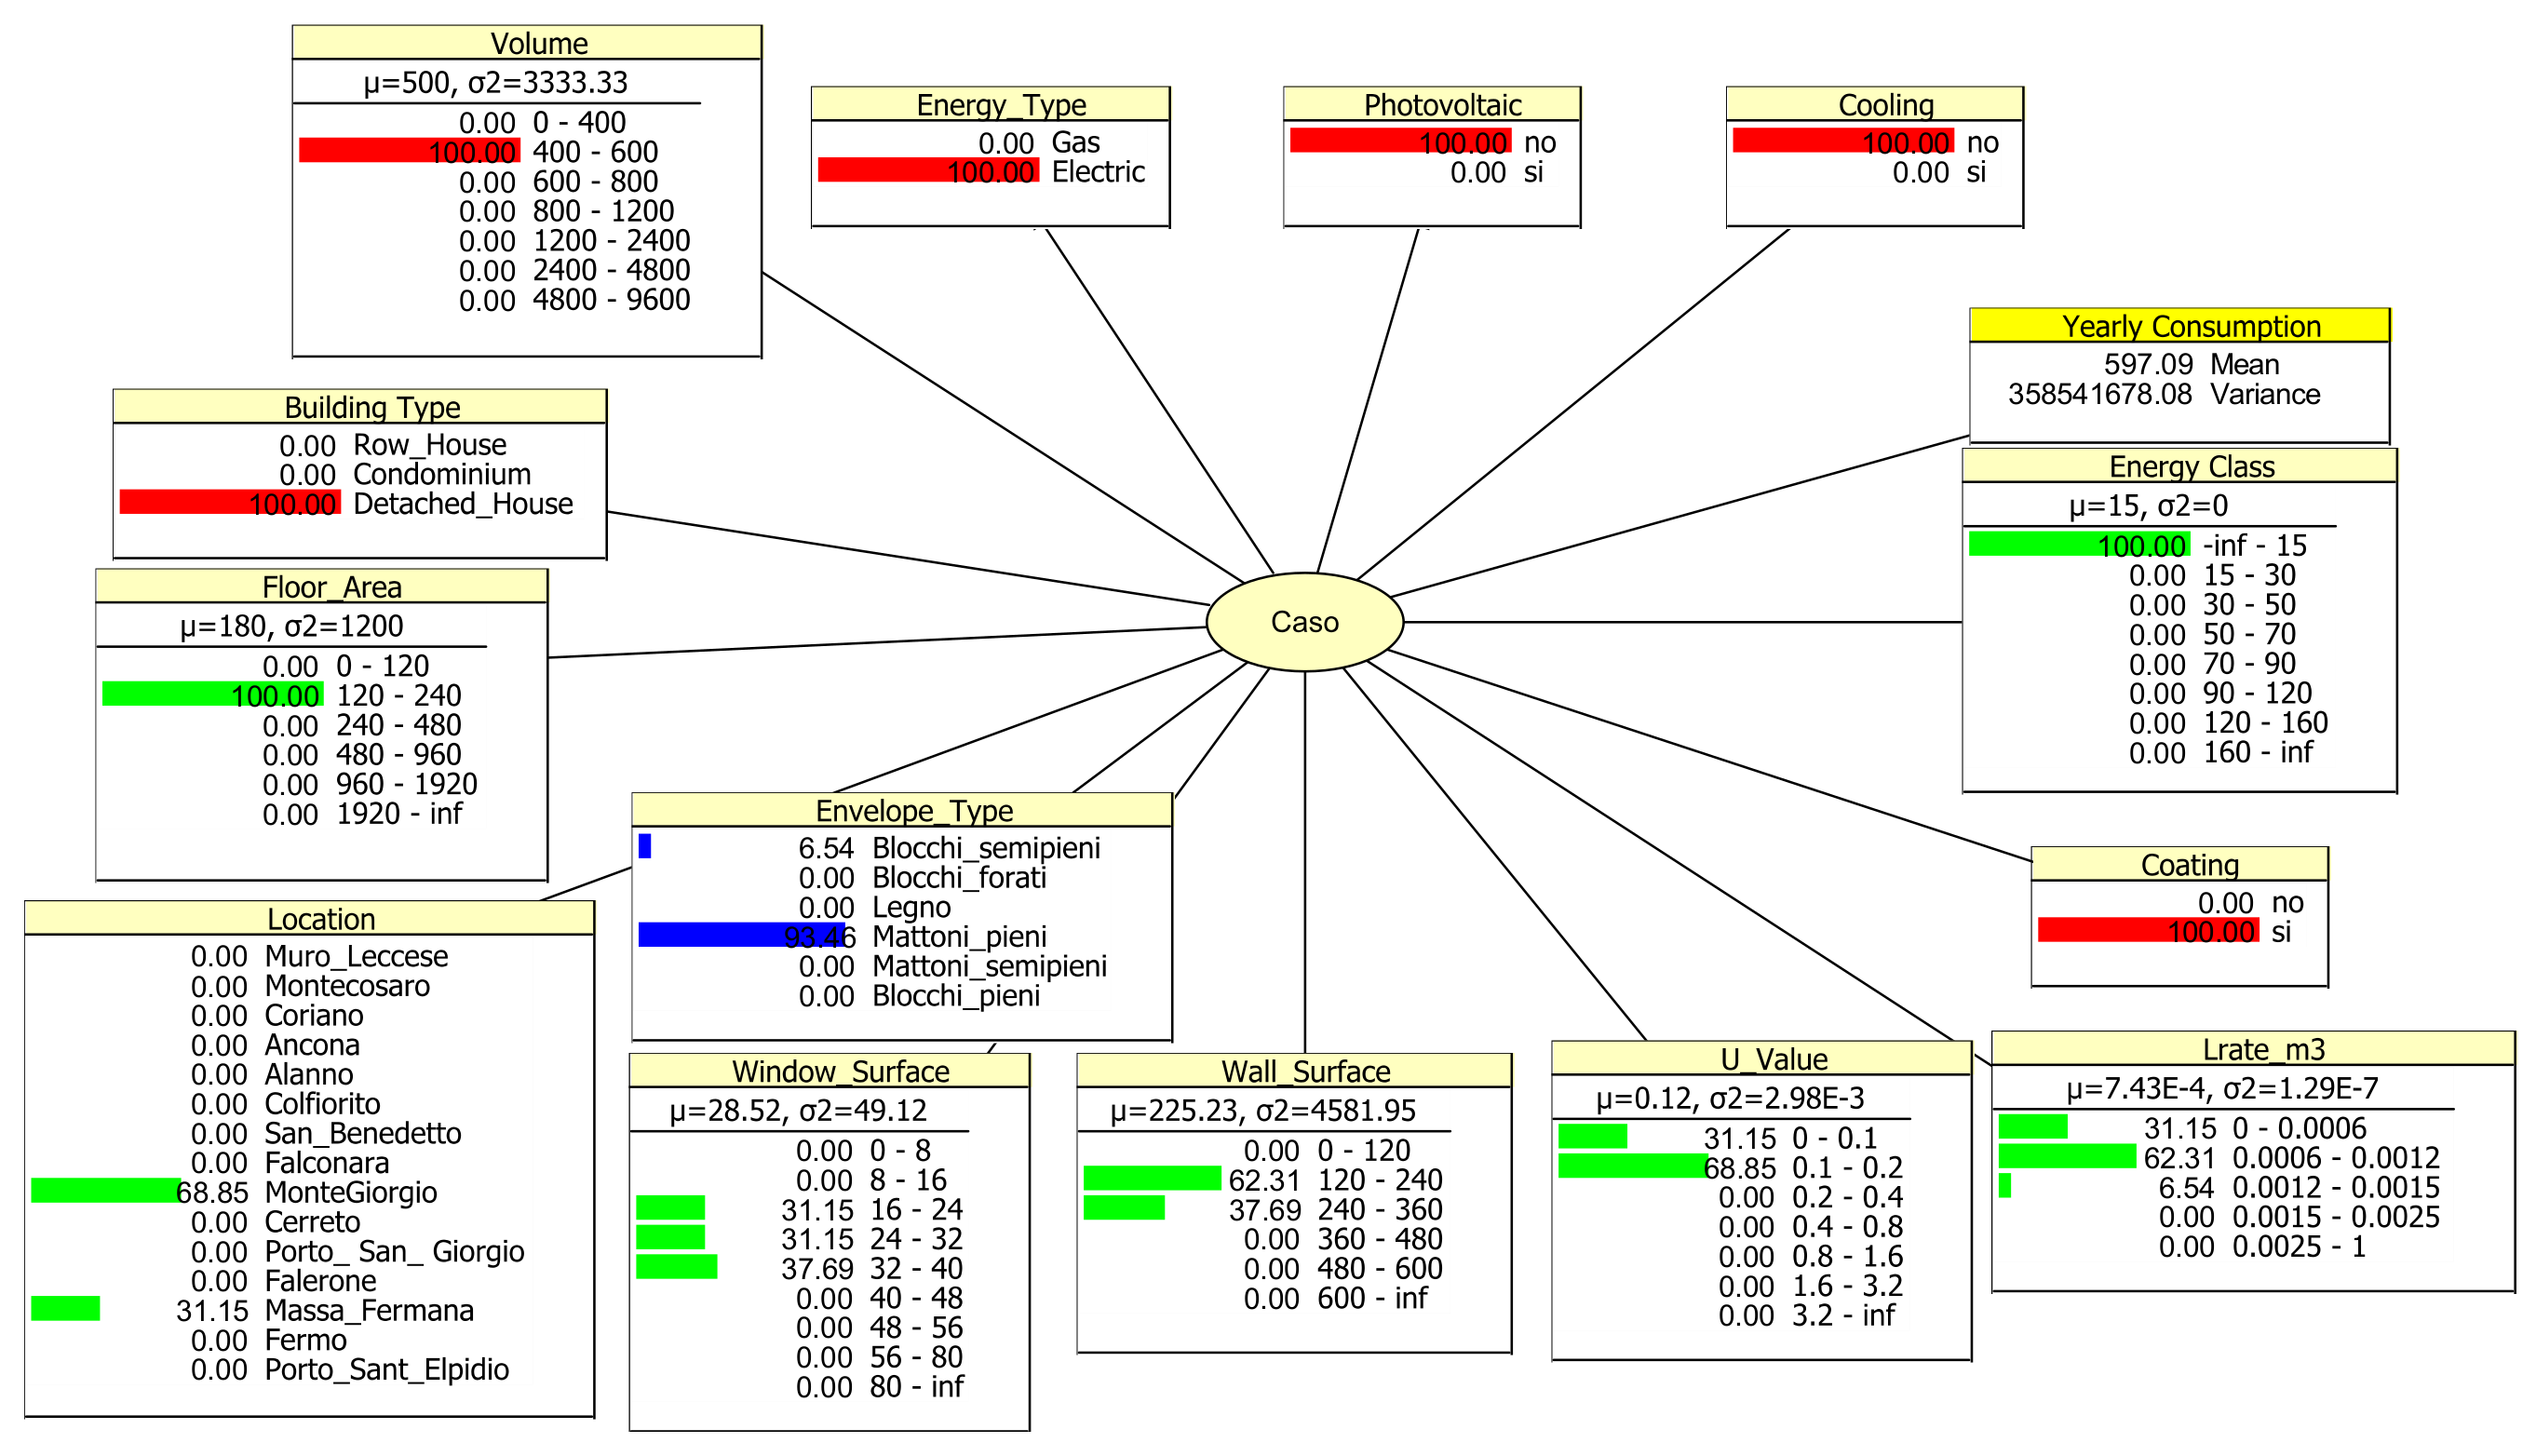
Considering the effect of a heating/cooling system that includes photovoltaic panels it is possible to achieve Near Zero Energy Building (-inf-15) [KWh/m
2] performance in the case of a condominium located in the city of Ancona (
Figure 19) while class A (15–30) [KWh/m
2] performance is achieved in a case located in the municipality of Montecosaro (
Figure 20).
5.5. Case Based Reasoning
This section will exemplify a form of reasoning that combines Bayesian network inference with CBR. We will show how this combination let the inference range to include unstructured information.
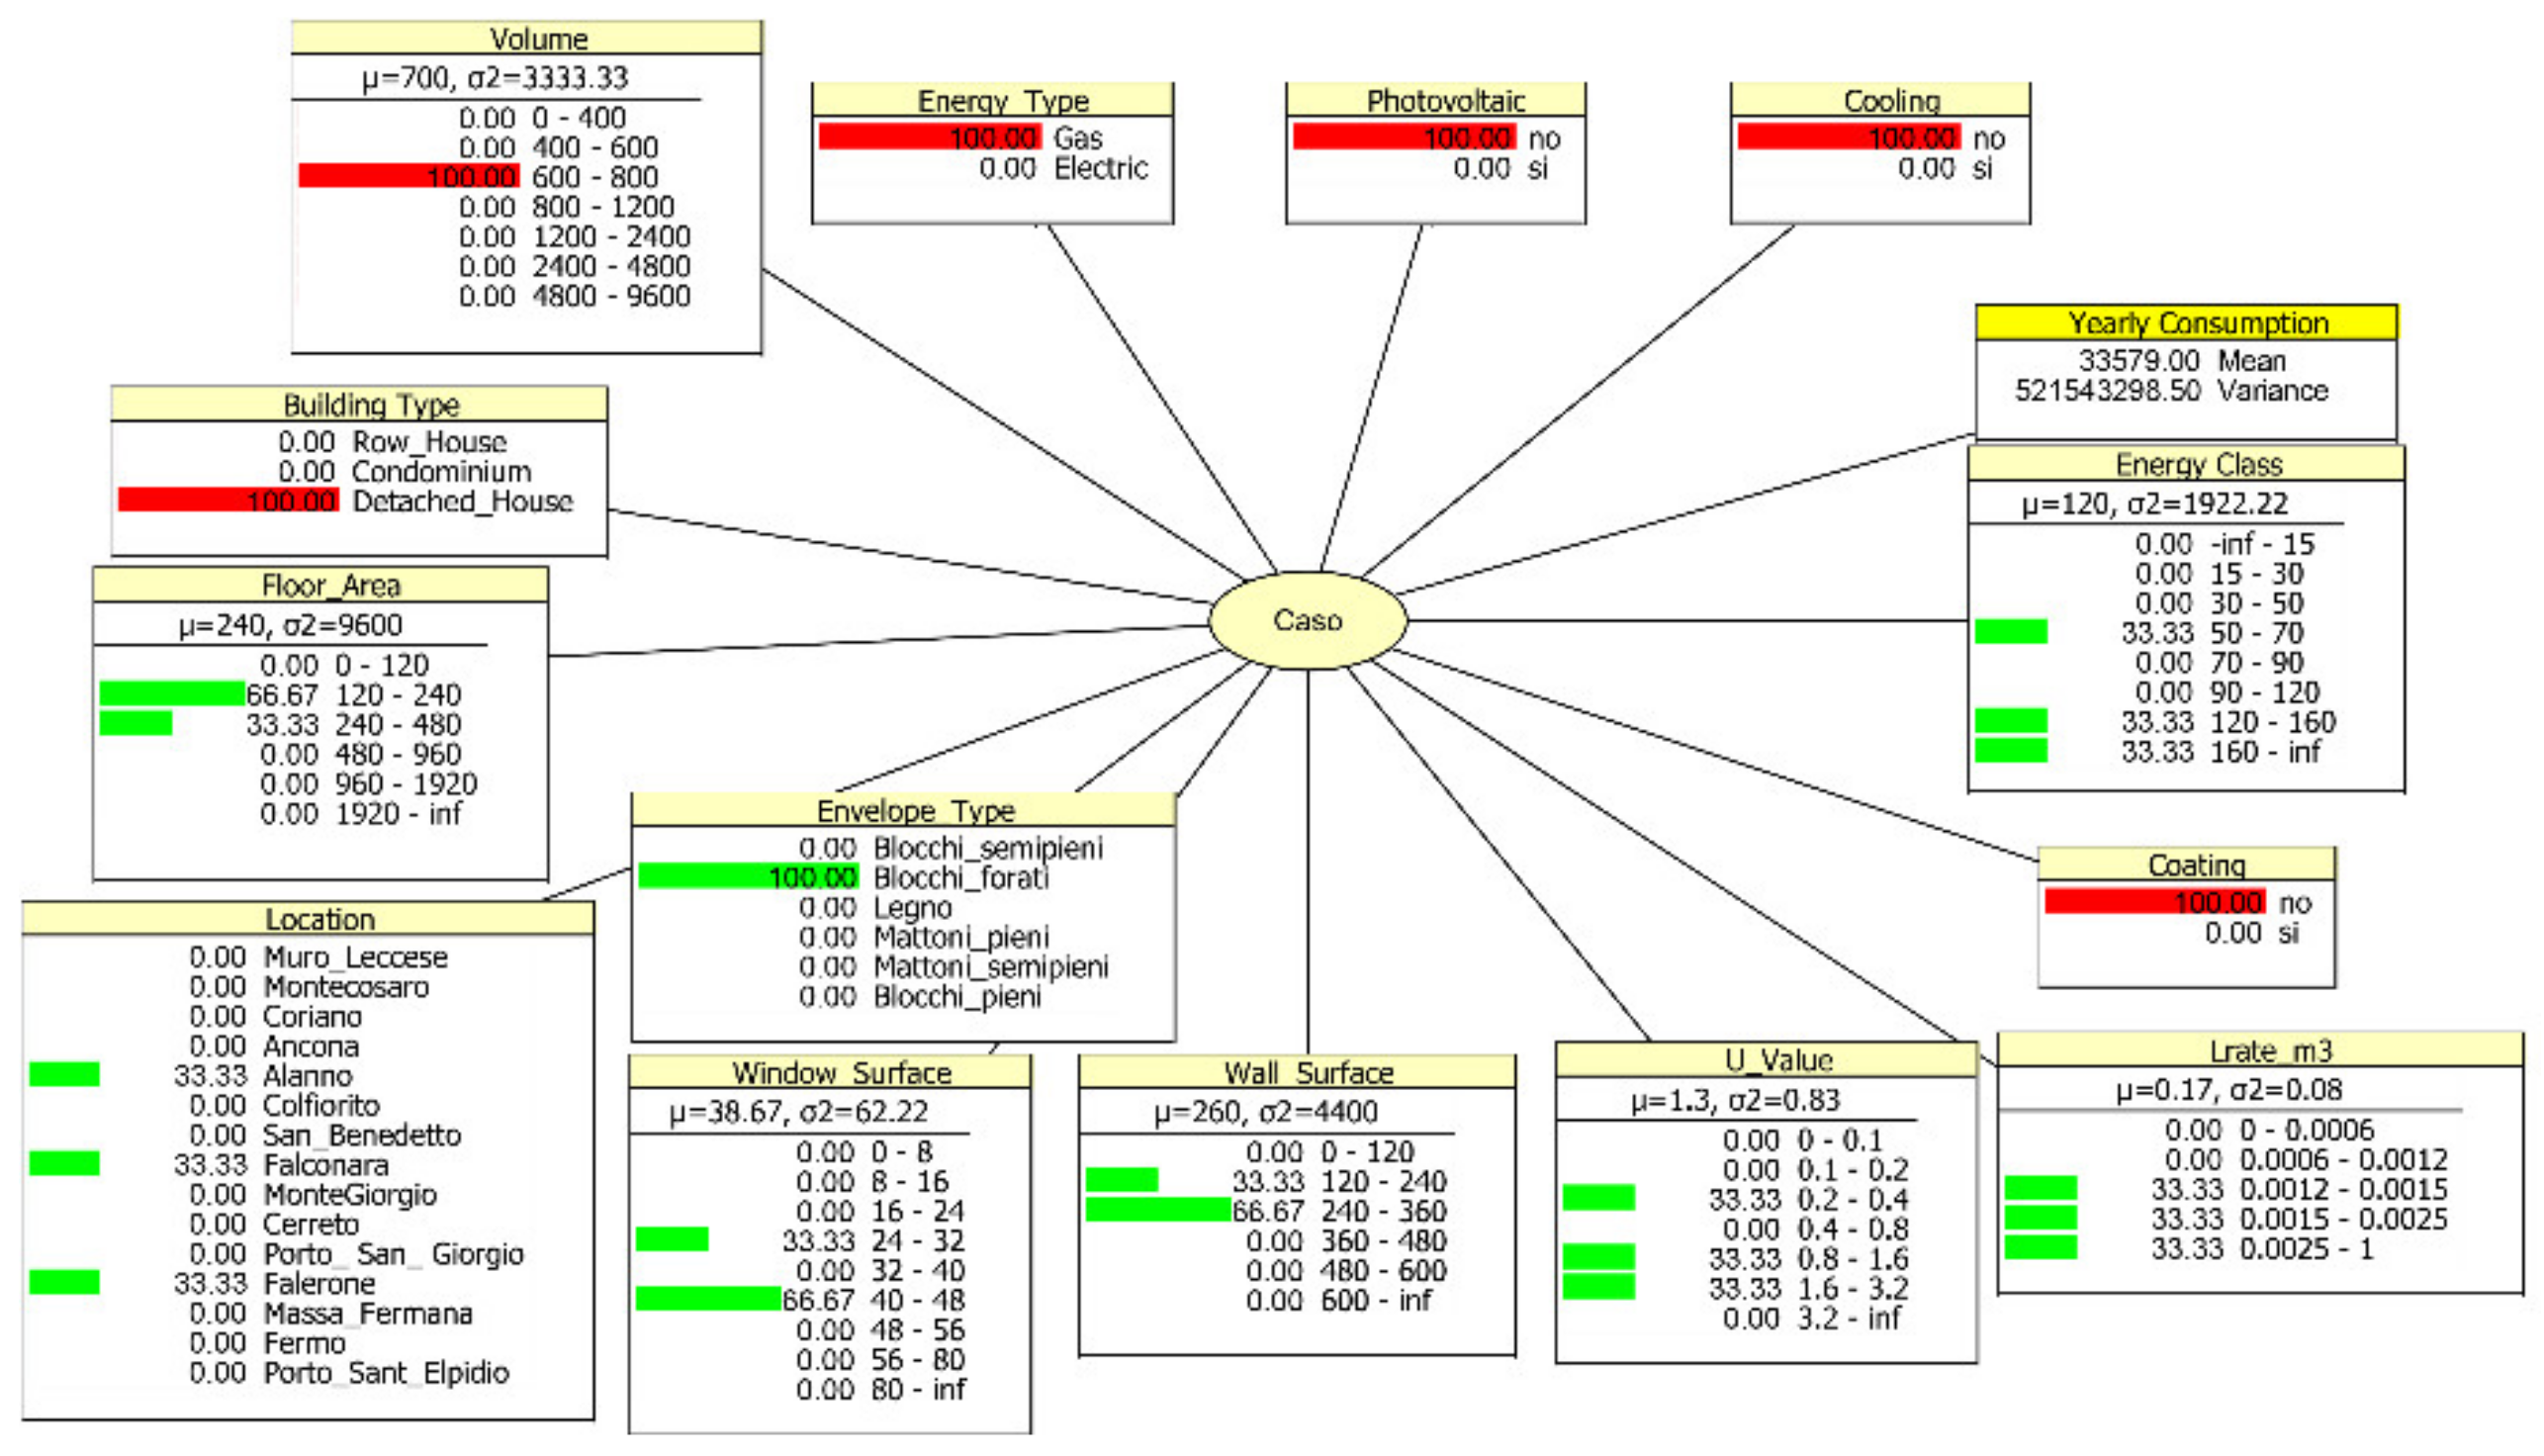
Let us consider the case in which an operator needs to quickly evaluate the energy saving potential of the house in
Figure 21, a country house of 472 m
3 of heated volume, built with traditional technology most likely in
mattoni pieni or
semipieni (i.e., typical bricks used in Italy), less likely in
blocchi (i.e., blocks).
This situation is very frequent, it can occur both in business contacts with owners and during screening of potential investments in specific regions by real estate managers. Under these conditions, both information and technical time are limited.
The reasoning will be Case Based. Estimates made in the closest cases will be used to build a first picture of the energy saving potential of the building. The assessment of similarity between different buildings, however, requires more information than is available in the index frame, such as the location in the urban or rural context, the form factor, the presence of appurtenances, and shading. In the reduce order modelling, these factors are absorbed by the calibration process and are therefore not explicitly expressed in the index frame. The CBR system lets us compensate for this limitation by offering the possibility of visual comparison and/or the access to technical documents.
Using, for example, the available information, it is possible to circumscribe through the index frame the set of cases which have some similarity with the case under examination (i.e., likelihood distribution on the technology) (
Figure 22).
At this point an explicit search in the case base can be used to mitigate the information gap using the unstructured information collected in the Case Base.
Table 4 shows the result of the query to the Case Base by selecting the most likely cases.
A visual comparison points out that the selected cases are quite compatible: isolated buildings, same region, no shading, not very different volumes and surfaces. It is therefore possible to use the results of this set of cases to build a first estimate. The estimation of the building condition is obtained by selecting a very typical scenario for the area, {
Coating = no,
E_Type = Gas,
PV = no} (
Figure 23).
Similarly, it is possible to estimate consumption downstream of an efficiency intervention by selecting the appropriate configuration {
Coating = yes,
Energy_Type = Electric, PV = no} (
Figure 24).
The performance values thus obtained reflect the statistics of the case base and are very much like the judgements that would be made by an expert in the field with legacy knowledge of the company’s energy refurbishment projects. The values obtained through the index frame are approximate and qualitative.
The approximation is due to the already discussed epistemic uncertainty, while the qualitative nature of the inference derives from the fuzziness introduced by the discretization of the variable’s domains. The integration with the Case Base, however, mitigates the problem of qualitative inference because it allows access to the point data of each analytical simulation that was used in the inference process. For example, it is possible to obtain from the thermal model view table the precise values of the envelope resistances and capacities, as well as the calculated consumption. Following the analysis phase, the workflow foresees the intervention design (
Figure 3). Once completed, the design data will be fed into the case base together with the simulated and, over time, measured performances. This completes the corporate knowledge cycle. The relevance of the knowledge cycle implementation for the competitive development of facility management companies is well discussed in [
32].
6. Conclusions
This paper discussed the architecture of a decision support system for energy refurbishment of buildings. A case study limited to a Case Base of residential buildings, developed in collaboration with the GUMPUB s.r.l. corporate, was described. The contribution showed how ROEM provides a level of abstraction that is at the same time able to maintain an acceptable accuracy in predicting performance under different intervention conditions, and to support the logic of decision-making processes in the management of energy efficiency projects. The integration of Bayesian networks as a further refinement of the index frame of the Case Base provided a good operational flexibility. Finally, the CBR system allowed to extend the scope of inference by integrating, as far as possible, also unstructured information.
The system shown in this paper represents a proof of concept of a methodology that will integrate, with the same paradigm, other areas of analysis, such as the evaluation of seismic vulnerability and the flexibility in the lay-out of spaces and a cost model. The NBC structure of the Bayesian network represents only an initial hypothesis. It will be necessary to investigate the development of networks with different structures and to evaluate their degree of generality, especially in the integration of new cases.
The methodological approach is complementary to the procedures already developed in the literature, as it has been discussed in the introduction, since it is specialized on a well-defined usage profile. The main innovative aspect of the research lies in the integration of a particular form of energy modelling into corporate business processes. By emphasizing the operational costs of energy audit processes, it highlights new requirements for modelling techniques and propose new solutions that are not typical of the Building Physics domain.


