1. Introduction
In recent years, significant efforts have been made to reduce greenhouse gases in the atmosphere. Based on the Paris Agreement signed at the 2015 United Nations Conference on Climate Change (COP 21), which obligates all countries to reduce greenhouse gas emissions, the Korean government set a goal of achieving a 37% reduction by 2030 [
1,
2]. To meet this goal, the current government established the Renewable Energy 3020 Implementation Plan, which aimed to generate 20% of the total power supply from new and renewable energy sources by 2030, with 5% of this power generated from biomass, such as wood pellets. Biomass is a carbon-neutral fuel due to its carbon cycle, so it does not contribute to carbon emissions by itself [
3]. It is advantageous because it can be utilised in existing coal-based power generation facilities, replacing solid fossil fuels, and has gained increasing attention in the field of energy utilisation [
4]. Furthermore, unlike fossil fuels that cannot be recycled once imported and consumed, wood-based biomass is an existing domestic resource which has natural cyclical characteristics that allow its reproduction through the agricultural and forestry industries [
5]. Various studies are being conducted to use the biomass. Menardo et al. (2012) conducted a study to produce methane through anaerobic digestion by mixing agricultural by-products and organic waste [
6]. Ramírez-López et al. (2003) conducted a study on the treatment of polluted air by using five agricultural by-products, such as peanut shells, rice husks, and coconut shells, thrown away in South America as biofilters [
7]. Fediuk (2016) reported that the Russian Far East improved the physical and mechanical properties by adding fibers to concrete as binders [
8]. However, from the perspective of biosolid fuel, interest in wood pellets has increased because they facilitate the use of biomass. In 2019, the local production of wood pellets in the Republic of Korea (ROK) was approximately 243,000 tons, while the imported quantity was 2,566,000 tons [
9]. This difference in quantities results from difficulties in procuring the raw materials for pellet production and the high cost of pelletising. To supply stable raw materials for producing wood pellets, various domestic agricultural by-products can be utilised [
10].
Currently, the domestic biomass potential of the ROK is estimated to be 5141.39 PJ/year, while the supply potential of the current technology is 971.34 PJ/year [
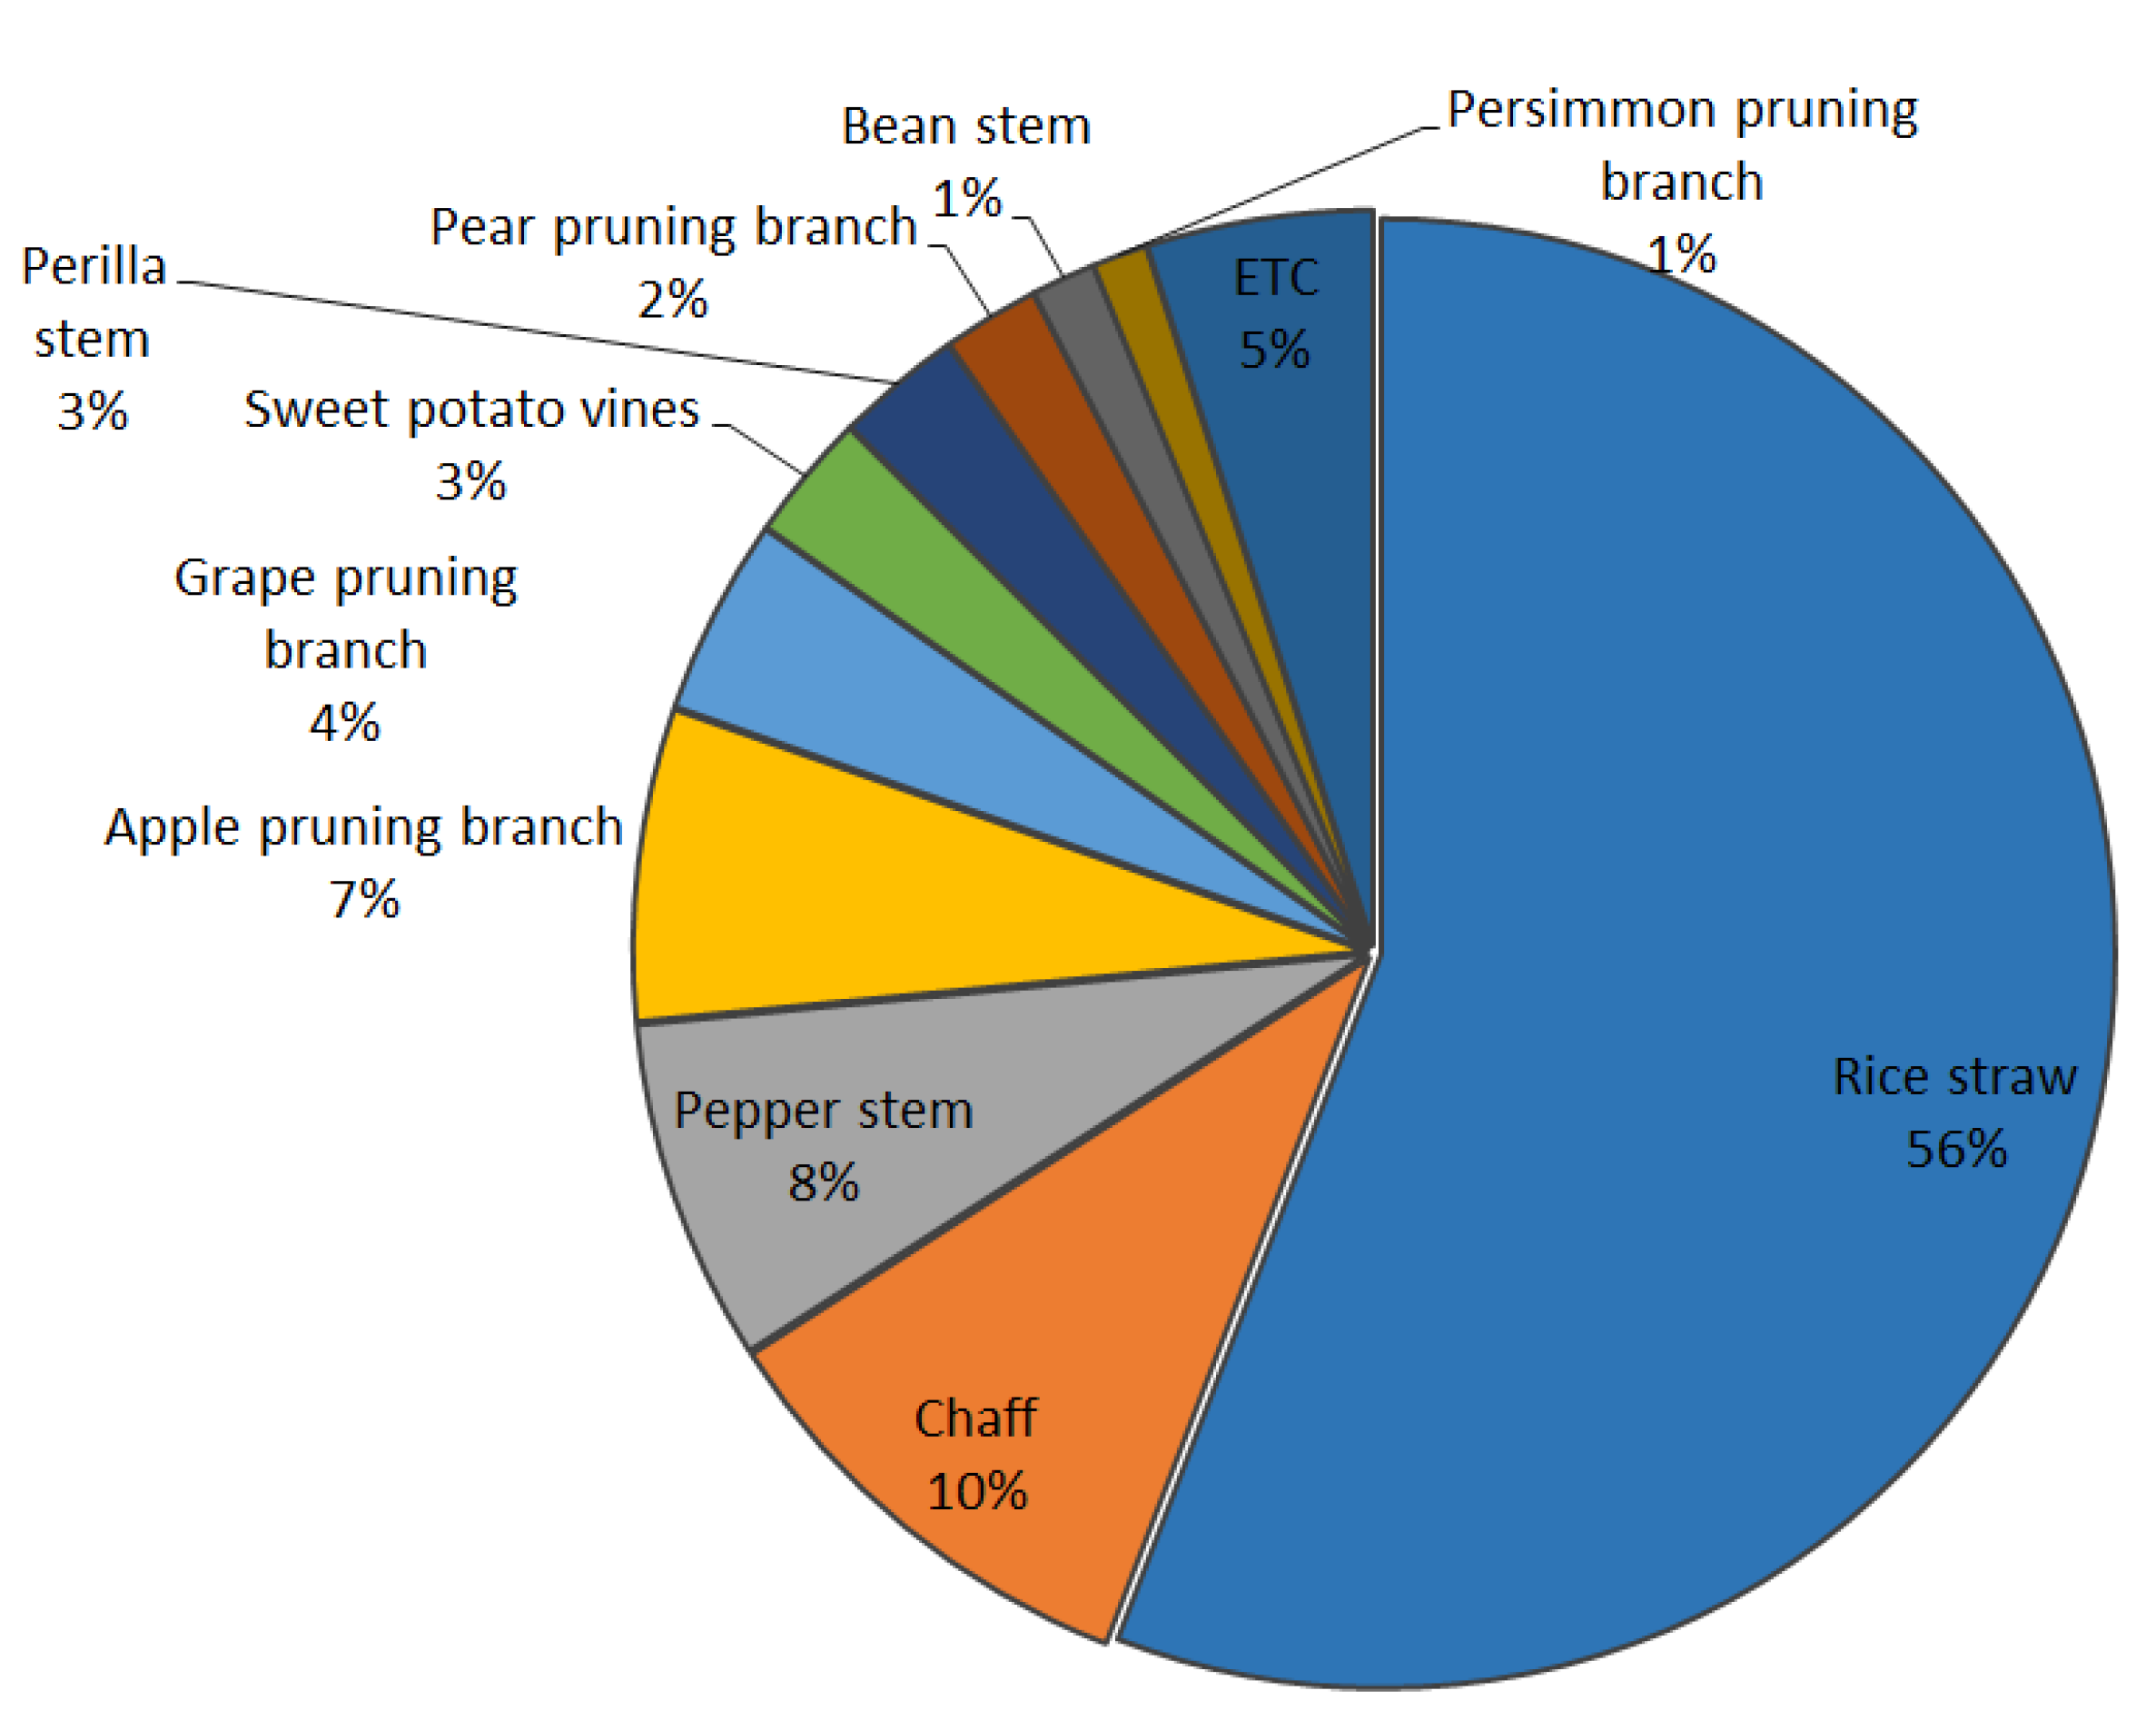
11]. Rice straw (approximately 93.97 PJ/year) and rice husk (approximately 16.97 PJ TOE/year) comprise the largest portion of agricultural biomass (
Figure 1) and have their own applications including compost, animal feed, and livestock rugs [
12]. After rice straw and chaff, pepper stem is the next most prominent biomass. Most other agricultural by-products are either burned or discarded. This is because the transportation and collection of agricultural by-products incur additional costs and storage is difficult, owing to their low calorific value and hygroscopicity.
Coffee consumption is increasing worldwide. In 2019/20, it was estimated that approximately 8303 million kg was consumed, up 0.3% from the previous year [
13]. ROK’s consumption of coffee in 2016 averaged 377 cups per person; accordingly, large amounts of coffee waste (270,000 tons/year) are discharged as garbage every year. According to a previous study, the coffee grounds remaining after extraction contain 15 wt % of residual oil; therefore, the calorific value (24.5 MJ/kg) of waste coffee grounds exceeds that of wood pellets (18.36 MJ/kg) [
14]. In addition, a previous study reported that waste coffee grounds have excellent adsorption abilities [
15] and can be used as wood adhesives. However, this study found that if pelletising was performed using only waste coffee grounds, the lignin content was significantly lower than that of wood, and successful moulding required the use of an adhesive [
16]. Park et al. (2020) showed the possibility of fuel applications by mixing spent coffee grounds and agricultural by-products in a 5:5 ratio, but they did not suggest an exact mixing ratio [
17]. Ungureanu et al. (2018) reported that the optimal moisture content of pellets was 5–15%, and that pellets with >20% moisture may become unstable [
18]. Samuelsson et al. (2012) reported that the moisture content of sawdust was the dominant factor determining the bulk density of the mixture and consequently the required pelletiser motor current; the optimal moisture content was reportedly 11–13% [
19]. Liu et al. reported that a ratio of 3:2 is the most optimal when pellets are made by mixing bamboo and rice husks [
20].
Against this backdrop, in this study, we were consider mixing and a torrefaction process for the effective utilisation of unused agricultural by-products and spent coffee ground as a possible fuel. In this study, unused agricultural by-product and spent coffee grounds, pepper stems, and waste coffee grounds were combined with different mixing ratios to produce six types of pellets. Pure pepper stem pellets and spent coffee ground pellets were also evaluated as controls. These pellets were evaluated based on the ‘Non-woody biomass’ standards of the Korea Energy Appliances Industry Association (KEAA) [
21]. After evaluation, an optimal mixing ratio was determined. Then, the pellets were subjected to torrefaction to improve their fuel characteristics, and their mass reduction was measured. Subsequently, elemental analysis and calorific value measurements were performed, and the properties of the torrefied agro-pellets were evaluated.
2. Materials and Methods
In this study, red pepper stems and coffee waste were pelletised. The pepper stems were collected from Yangju-si in Gyeonggi Province, Yesan-gun in Chungcheongnam Province, and Gumi-si in Gyeongsangbuk Province. The spent coffee grounds were collected from a café in Kangwon National University, Korea. The pepper stem and spent coffee grounds were naturally dried to a moisture content of <15%. The moisture content of pepper stem and spent coffee waste was approximately 8% and 14%, respectively. Then, the elemental compositions of the pepper stems from each source were analysed (
Table 1).
2.1. Production of Pellets
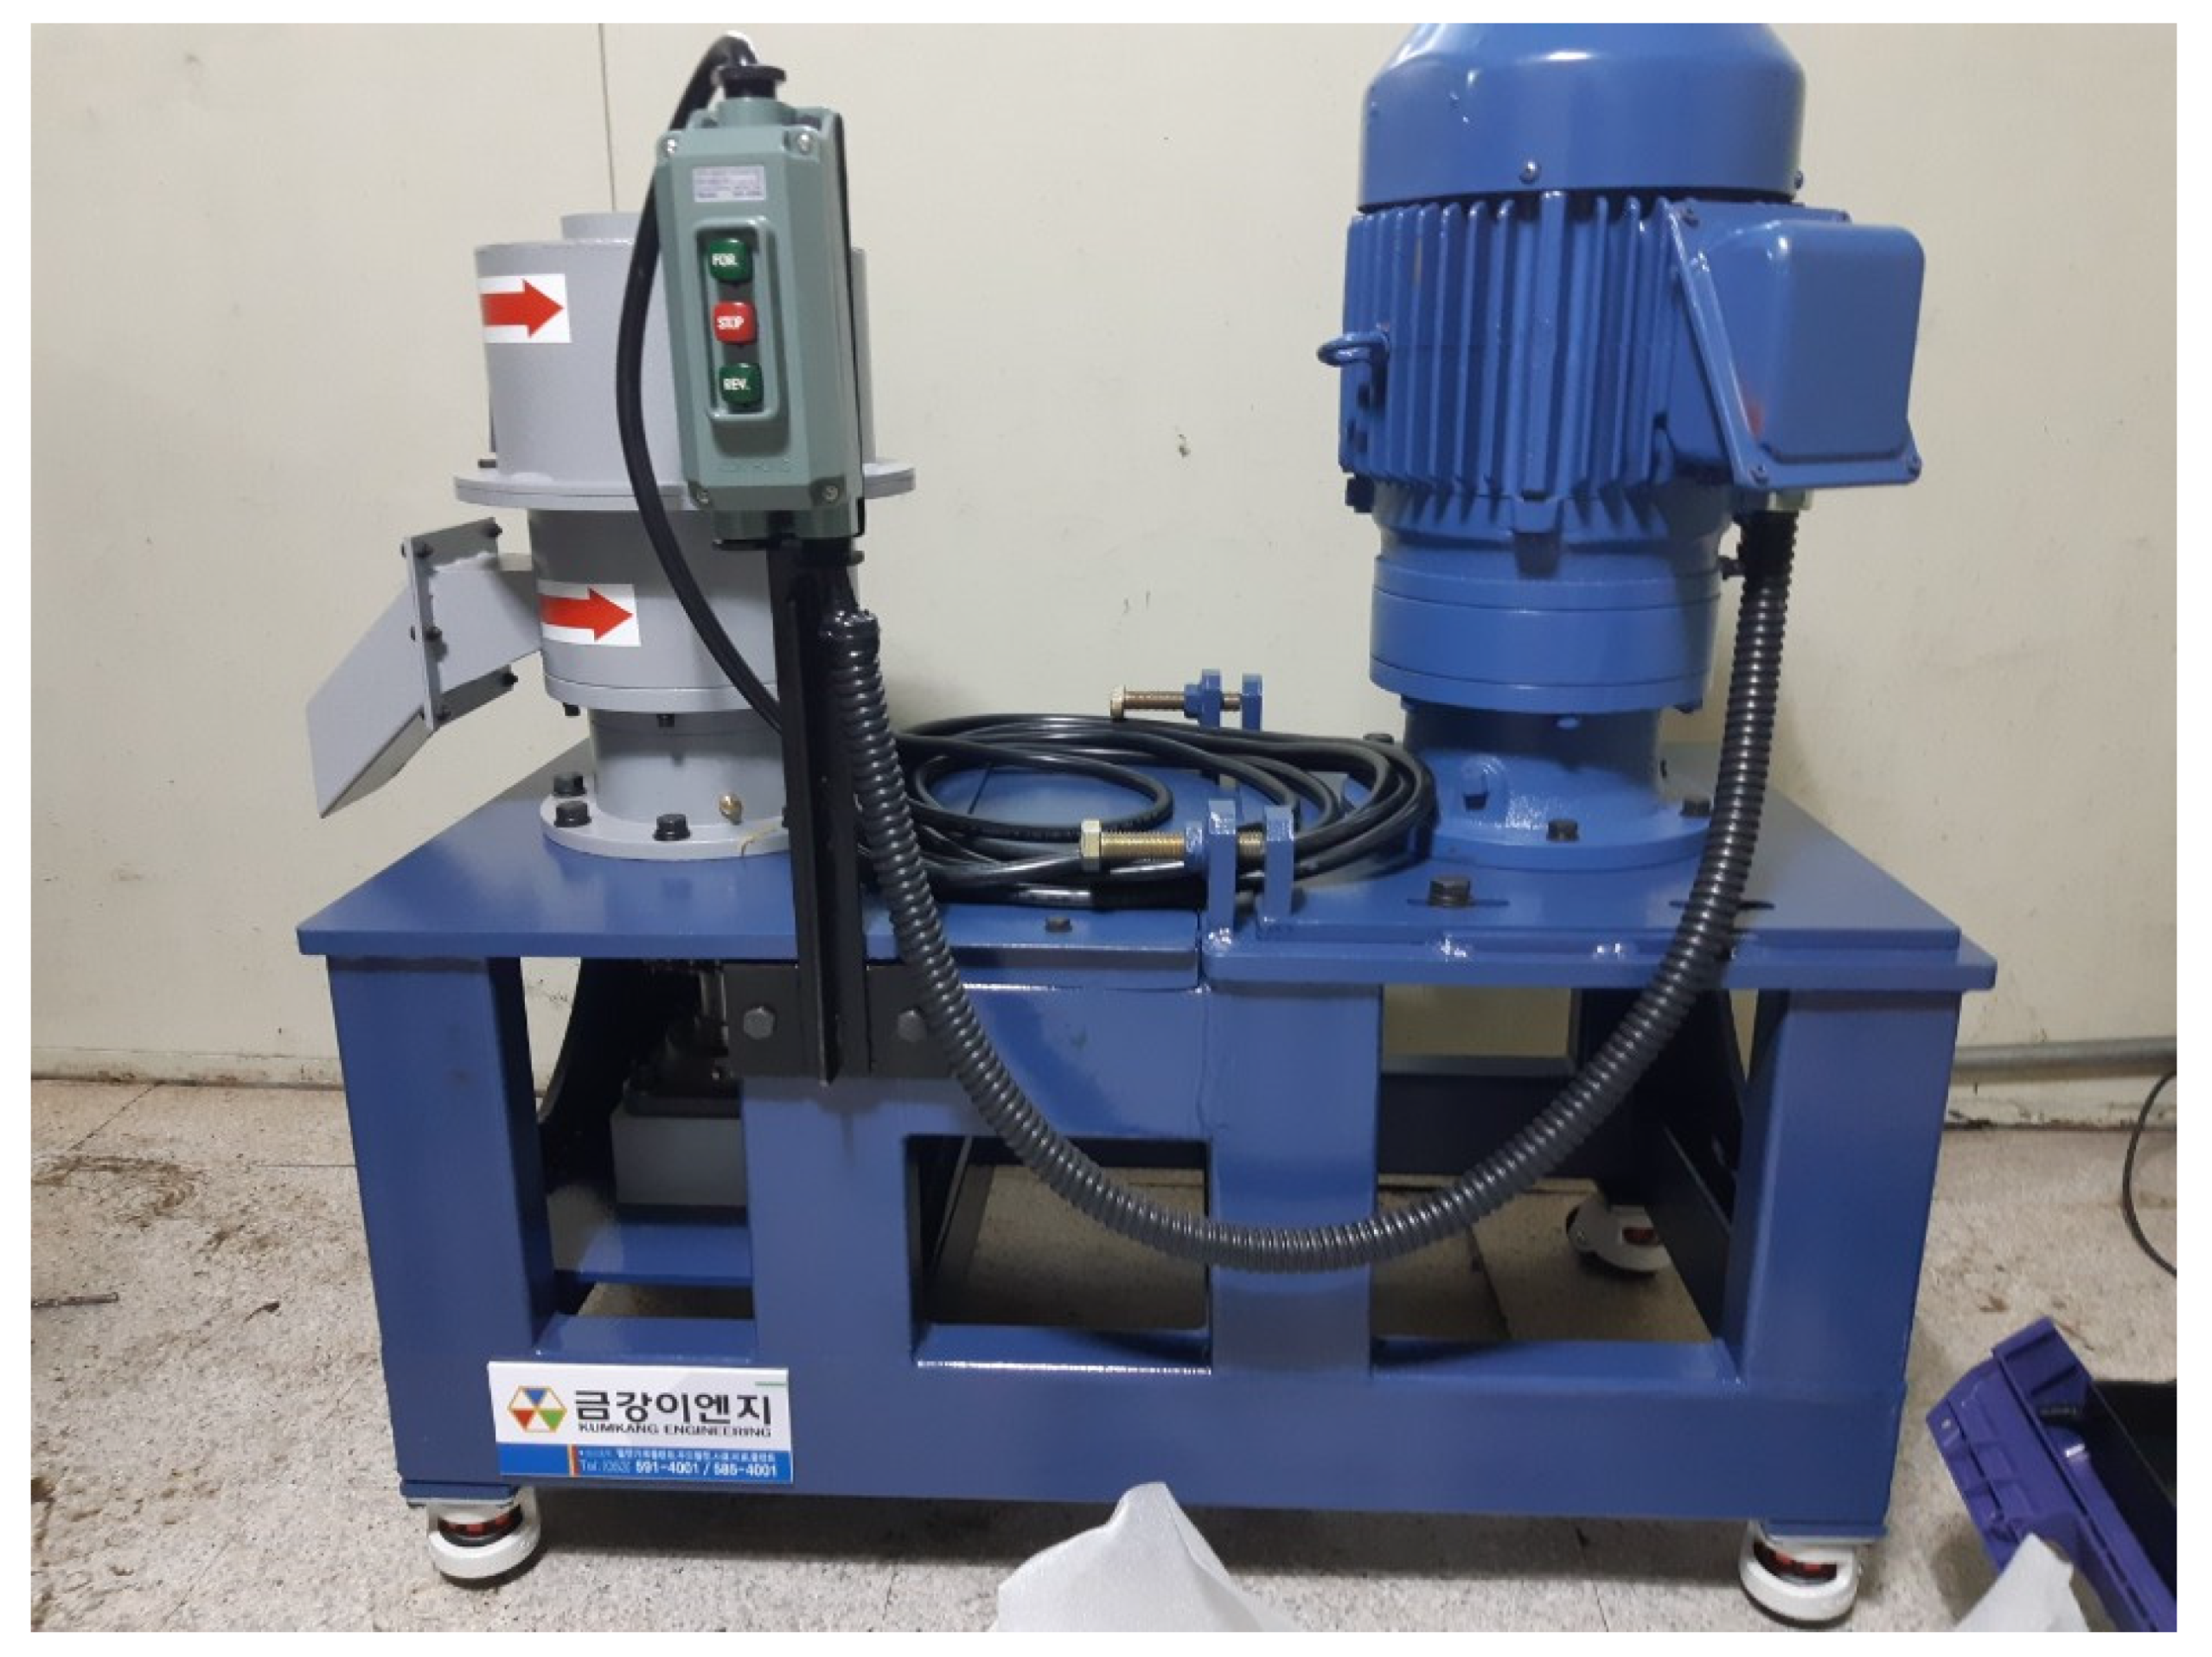
The pepper stems were pulverised to less than 2.36 mm in size using a shredder (SH01-2540, Woojin Techtool, Seoul, Korea), while the spent coffee grounds were already less than 0.4 mm. A pelletiser (SP-75, Geumgang ENG, Gwangju, Korea) was used to pelletise the collected by-products (
Figure 2). The specifications of the pelletiser are listed in
Table 2. The mixing ratios of pepper stems and coffee waste were varied from 9:1 to 6:4 in mass fraction. For evaluation, approximately 7–10 kg of each variety of pellet were produced. The single-material pepper stem and coffee waste pellets were designated as PP and CP, respectively. The mixed pellets were named PACB, where A and B represent the relative proportions of pepper stems and coffee waste, respectively. For example, the pellets with a pepper stem and coffee waste mix ratio of 9:1 were named P9C1.
The pepper stems were pulverised to less than 2.36 mm in size, while the spent coffee grounds were already less than 0.6 mm (
Table 3). A pelletiser (SP-75, Geumgang ENG, Korea) was used to pelletise the collected by-products (
Figure 2). The specifications of the pelletiser are listed as
Table 2. The mixing ratios of pepper stems and coffee waste were varied from 9:1 to 6:4 in mass fraction. For evaluation, approximately 7–10 kg of each variety of pellet were produced. The single-material pepper stem and coffee waste pellets were designated as PP and CP, respectively. The mixed pellets were named PACB, where A and B represent the relative proportions of pepper stems and coffee waste, respectively. For example, the pellets with a pepper stem and coffee waste mix ratio of 9:1 were named P9C1.
2.2. Evaluation of Pellets
The pellets were evaluated according to the KEAA standards. The evaluation indicators were size; bulk density; moisture content; ash content; fine particles; durability; gross calorific value; and the contents of chlorine, sulphur, nitrogen, and eight kinds of heavy metals (As, Cd, Cr, Cu, Pb, Hg, Ni, and Zn).
2.3. Size
The length and diameter of the pellets were measured using Vernier callipers.
2.4. Bulk Density
A 1 L container was filled with pellets to approximately 20 cm above the top edge. Then, the container was dropped thrice onto a rigid flat wooden floor, and any pellets remaining above the top of the container were removed with a flat object and weighed. This process was repeated twice. The bulk density, expressed in kg/m
3, was calculated using Equation (1), and the resulting value was rounded off to the first digit.
where
BDar: Pellet bulk density on wet basis (kg/m
3).
mpc: Weight of container with pellet (kg).
mc: Weight of empty container (kg).
V: Volume of empty container (m
3).
2.5. Moisture Content
In accordance with ISO 18134-2:2017 [
22], the pellets were dried at 105 °C for 3 days and weighed before and after drying. Then, the moisture content was calculated from the difference in weight using Equation (2):
where
MC: moisture content of pellet (%),
mo: weight of pellet before drying (kg),
mf: weight of pellet after drying (kg).
2.6. Ash Content
Ash content measurements were conducted in accordance with the ISO 18122:2015 [
23] using a proximate analyser (PrepASH229, Precisa, Switzerland).
2.7. Fine Particles
A fine particle is defined as a particle with a diameter of <3.15 mm. In accordance with ISO 18846:2016 [
24], pellets weighing 50 g or more were selected and weighed to two decimal digits. The pellets were placed in a metal sieve with a mesh size of 3.15 mm, which was mounted on a shaker and filtered. The mass of the pellets remaining in the sieve was measured twice. The mean of the values, calculated using Equation (3), was rounded up to 0.1%.
where
F: Fine particle content (%),
ma: pellet weight before sieving (g),
mo: pellet weight after sieving (g).
2.8. Durability
In accordance with ISO 17831-1 [
25], 500 ± 50 g of pellets were poured into a durability tester, and 500 rotation tests were conducted at the rate of 50 ± 2 rev/min. After the test, the pellets were filtered using a sieve with a mesh size of 3.15 mm, and the weight of the pellets remaining in the sieve was measured twice. The mean of the values, calculated using Equation (4), was rounded up to 0.1%:
where
DU: durability (%),
ma: pellet weight post-sieving after durability test (g),
mb: pellet weight prior to sieving before durability test (g).
2.9. Calorific Value
The calorific value was measured through combustion using an automated calorimeter (6400, Parr, Moline, IL, USA). The calorimeter was calibrated using benzoic acid as a standard substance. The pellets were dried in a dryer, and their calorific value was measured thrice. The average calorific value of the samples was rounded off to the first digit.
2.10. Elemental Analysis
In accordance with the quality test method for solid fuel products stipulated by the Ministry of Environment [
26], elemental analysis was conducted to determine the contents of the elements C, H, N, and O by an elemental analyser (FlashEA 1112, Thermo Fisher Scientific, Waltham, MA, USA).
2.11. Sulphur and Chlorine
The sulphur and chlorine contents were measured in accordance with ASTM D7359 through combustion ion chromatography (AQF-2100H, Mitsubishi Chemical Analytech Co., LTD, Tokyo, Japan).
2.12. Heavy Metals
The Hg content was measured using an Hg analyser (Hydra II C, Teledyne Leeman Labs, Hudson, NH, USA). The contents of the other metals were measured using inductively coupled plasma optical emission spectroscopy (ICP-OES; OPTIMA 7300 DV, PerkinElmer, Waltham, MA, USA) after pre-treatment by microwave heating.
2.13. Torrefaction Experiments
Torrefaction experiments were conducted by placing 12 ± 2 g of the pellets into a prototype capsule with a height of 100 mm and a diameter of 24 mm. The capsule was sealed with heat-resistant tape to reduce external effects during the experiments. The experiments were performed using an electric furnace (N7/H/B410, Nabertherm GmbH, Lower Saxony, Germany). To isolate the effect of temperature, the duration of each experiment was set to 30 min and the process temperature was varied from 210 to 290 °C in increments of 20 °C. After the experiments, all samples were cooled for 30 min to prevent rapid reactions with oxygen. After cooling, the mass reduction was measured. Based on the mass reduction, the mass yield was calculated using Equation (5):
where
MY: mass yield (%),
mtorrefied: mass after torrefaction (g),
mraw: mass before torrefaction (g).
To determine the microstructures of the samples, scanning electron microscopy (SEM) was conducted using a field-emission scanning electron microscope (S-4800, Hitachi, Tokyo, Japan).
2.14. Fuel Characteristic Analysis
2.14.1. Elemental Analysis and Van Krevelen Diagram
The elemental composition of a pellet can vary based on the torrefaction conditions, such as time, temperature, and atmospheric conditions. The H, C, and O contents of a pellet significantly affect its combustion characteristics. Van Krevelen diagrams show the ratios of these three elements. To investigate the changes in element composition, elemental analysis (EA3000, Eurovector, Pavia, Italy) was performed, and Van Krevelen diagrams were plotted from the results of the analysis.
2.14.2. Calorific Value and Energy Yield
To account for changes in both calorific value and mass loss, the energy yield was calculated using Equation (6):
where
EY: energy yield (%),
HHVtorrefied: higher heating value after torrefaction (MJ/kg),
HHVraw: higher heating value before torrefaction (MJ/kg).
3. Results
3.1. Mixed Pellets
Agricultural by-product pellets were produced. With increases in the quantity of coffee waste, the observed colours of the mixed pellets became darker. In length, the CP pellets were shorter than the other pellets.
3.2. Evaluation of Pellets
The pellets were classified as A-grade or B-grade ‘Non-wood pellets’, based on the standards stipulated by KEAA, and as Bio-SRF grade based on the ‘Act on the Promotion of Saving and Recycling of Resources’ of the Ministry of Environment (
Table 4) [
27]. The criteria for A-grade and B-grade non-wood pellets are more extensive than those for the Bio-SRF standards. Therefore, in this study, the grades of the pellets were categorised according to their quality in the order of A, B, and Bio-SRF.
3.3. Size
All pellets had a 6 mm diameter, as required by the A-grade standard in diameter. Expect for the CP pellets, the length of pellets was 21.3 ± 0.9 mm, and there were no significant variations with the different mixing ratios. However, the average lengths of the CP pellets were approximately 10 mm, while in some cases, the length was <10 mm.
3.4. Bulk Density
The bulk density varied with the mixing ratio. The bulk densities increased from PP to P8C2 but decreased from P7C3 to CP. All pellets had bulk densities above 600 kg/m3 except CP, which had a bulk density of 563 kg/m3 and therefore did not satisfy the A- or B-grade criterion.
3.5. Moisture Content
Excluding P6C4 and CP, the moisture content in the pellets was observed to be within 10–12%, satisfying the A-grade criterion. The moisture contents of P6C4 and CP were approximately 13.3% and 20.4%, respectively. Therefore, we conclude that an increased proportion of coffee grounds resulted in a higher moisture content, owing to the hygroscopic properties of coffee waste.
3.6. Ash Content
All pellets met the A-grade criterion for ash content. This analysis showed that a higher proportion of pepper stem corresponded to increased observed ash contents.
3.7. Fine Particles
The proportion of fine particles was determined to be less than 0.2% in all pellets, excluding CP (2%). Therefore, all pellets were determined to be of A-grade, except for CP, which was categorised as B-grade.
3.8. Durability
The durability varied only slightly with changes in the coffee waste mixing ratio and was observed to be over 98% for all pellets except CP. In particular, P9C1 showed an increase in durability compared with PP. A previous study (Park et al., 2020b), reported a durability of 98.6% for PP, similar to the results obtained in this study, although it was slightly lower. The same study reported a durability of 85.9% for CP, which was approximately 3.3 percentage points lower than the value obtained in this study. Neither of the pellets could be graded as A or B.
3.9. Gross Calorific Value
All pellets had higher gross calorific values than those specified by the grading criteria. In particular, the observed value for CP was 23.14 MJ/kg, which is similar to that of sub-bituminous coal. The gross calorific value increased as the proportion of coffee waste increased.
3.10. Nitrogen, Sulphur, and Chlorine Content
The N and S contents of pellets have important implications for the generation of oxides of these elements (NOx and SOx). P6C4 and CP were identified as Bio-SRF in grade, while the others met the B-grade criterion. All pellets except PP had less than 0.1% S and 0.3% Cl. PP showed the highest S content, but no significant differences were observed between the pellets. The Cl content in PP was observed to be higher than that suggested by the B-grade criterion. Thus, PP was determined to be of Bio-SRF. Mixed pellets (P9C1, P8C2, P7C3, and P6C4) had 0.1–0.3% Cl and were therefore identified as B-grade. Only CP could be classified as A-grade.
3.11. Heavy Metals
All pellets met the criterion for heavy metal content. CP exhibited the highest Cu content; therefore, the mixed pellets also showed higher Cu than PP. The Zn content of the pellets ranged from 20% to 30% but was less than 10% for CP.
3.12. Evaluation Summary
All evaluation results presented above are summarised in
Table 5. PP conformed to neither grade A nor grade B because of its high Cl content. P6C4 did not meet the requirements for grades A or B because of its N content, while CP had excessively high moisture and N contents and therefore could not be graded as A or B. Furthermore, because of its lower durability, CP was graded as Bio-SRF, which lacks a specific durability criterion. With increasing coffee waste content, the Cl content of the pellets decreased while the calorific value increased. P6C4 was found to be easily contaminated with fungi and was therefore unsuitable for storage. The durability of PP was similar to that of pellets evaluated in a previous study [
13]. CP exhibited a durability of 89.2%, which is higher than the durability of 85.9% obtained in a previous study. The Cu content of the pellets varied with the different sources of pepper stems, which was likely due to the particular soil conditions and rainfall patterns of the different areas. Based on these evaluations, both PP and P6C4 were categorised as Bio-SRF grade, while P9C1, P8C2, and P7C3 were categorised as B-grade. Only CP could not meet any of these standards. The pellets with the optimum mixing ratios of pepper stems to spent coffee grounds were P8C2 and P7C3. Both pellet types were categorised as B-grade. P8C2 showed a higher bulk density and durability and a lower moisture content than P7C3, while P7C3 showed a higher gross calorific value and lower Cl and N contents. Based on all evaluations, P9C1, P8C2, and P7C3 showed similar characteristics. Among them, P7C3 had the highest calorific value. However, considering transportation and storage in warehouses, P8C2 was considered to have the optimal characteristics owing to its maximal durability.
3.13. Torrefaction
Torrefaction was conducted to improve the fuel properties, such as the calorific value. Higher processing temperatures corresponded to darker pellet colours and higher mass losses. At low (210 °C and 230 °C) and intermediate temperatures (250 °C), mixed pellets showed lower mass losses than the single-material pellets (PP and CP), regardless of the mixing ratio. The difference in mass losses between the different pellets was less than 3%. However, in the high-temperature range (270 °C and 290 °C), it was observed that a higher proportion of spent coffee grounds corresponded to a lower mass loss. The mass yields of PP were found to be 69.16% and 50.87% at 270 °C and 290 °C, but those of CP were 75.34% and 60.81%, respectively (
Table 6).
SEM imaging was conducted on P8C2 (identified as the optimal composition), on the two single-material pellets (PP and CP), and on torrefied pellets of these three compositions. However, the CP pellet was easily broken up, so SEM could not be performed. The SEM images are shown in
Figure 3. The images are magnified by factors of 300, 1.5 K, and 3 K to demonstrate the microstructures of the pellet cross-sections. Many linear fibre structures were observed in PP. The PP treated at 290 °C exhibited a more broken down linear fibre structure compared to the non-torrefied PP. In P8C2, unlike PP, it seems that the spent coffee grounds were attached to linear fibre structures. In P8C2 treated at 290 °C, no linear fibres were visible, and some parts had collapsed. It was determined that these changes were due to the thermal decomposition of the attached spent coffee grounds during torrefaction.
3.14. Fuel Characteristics and Van Krevelen Diagram
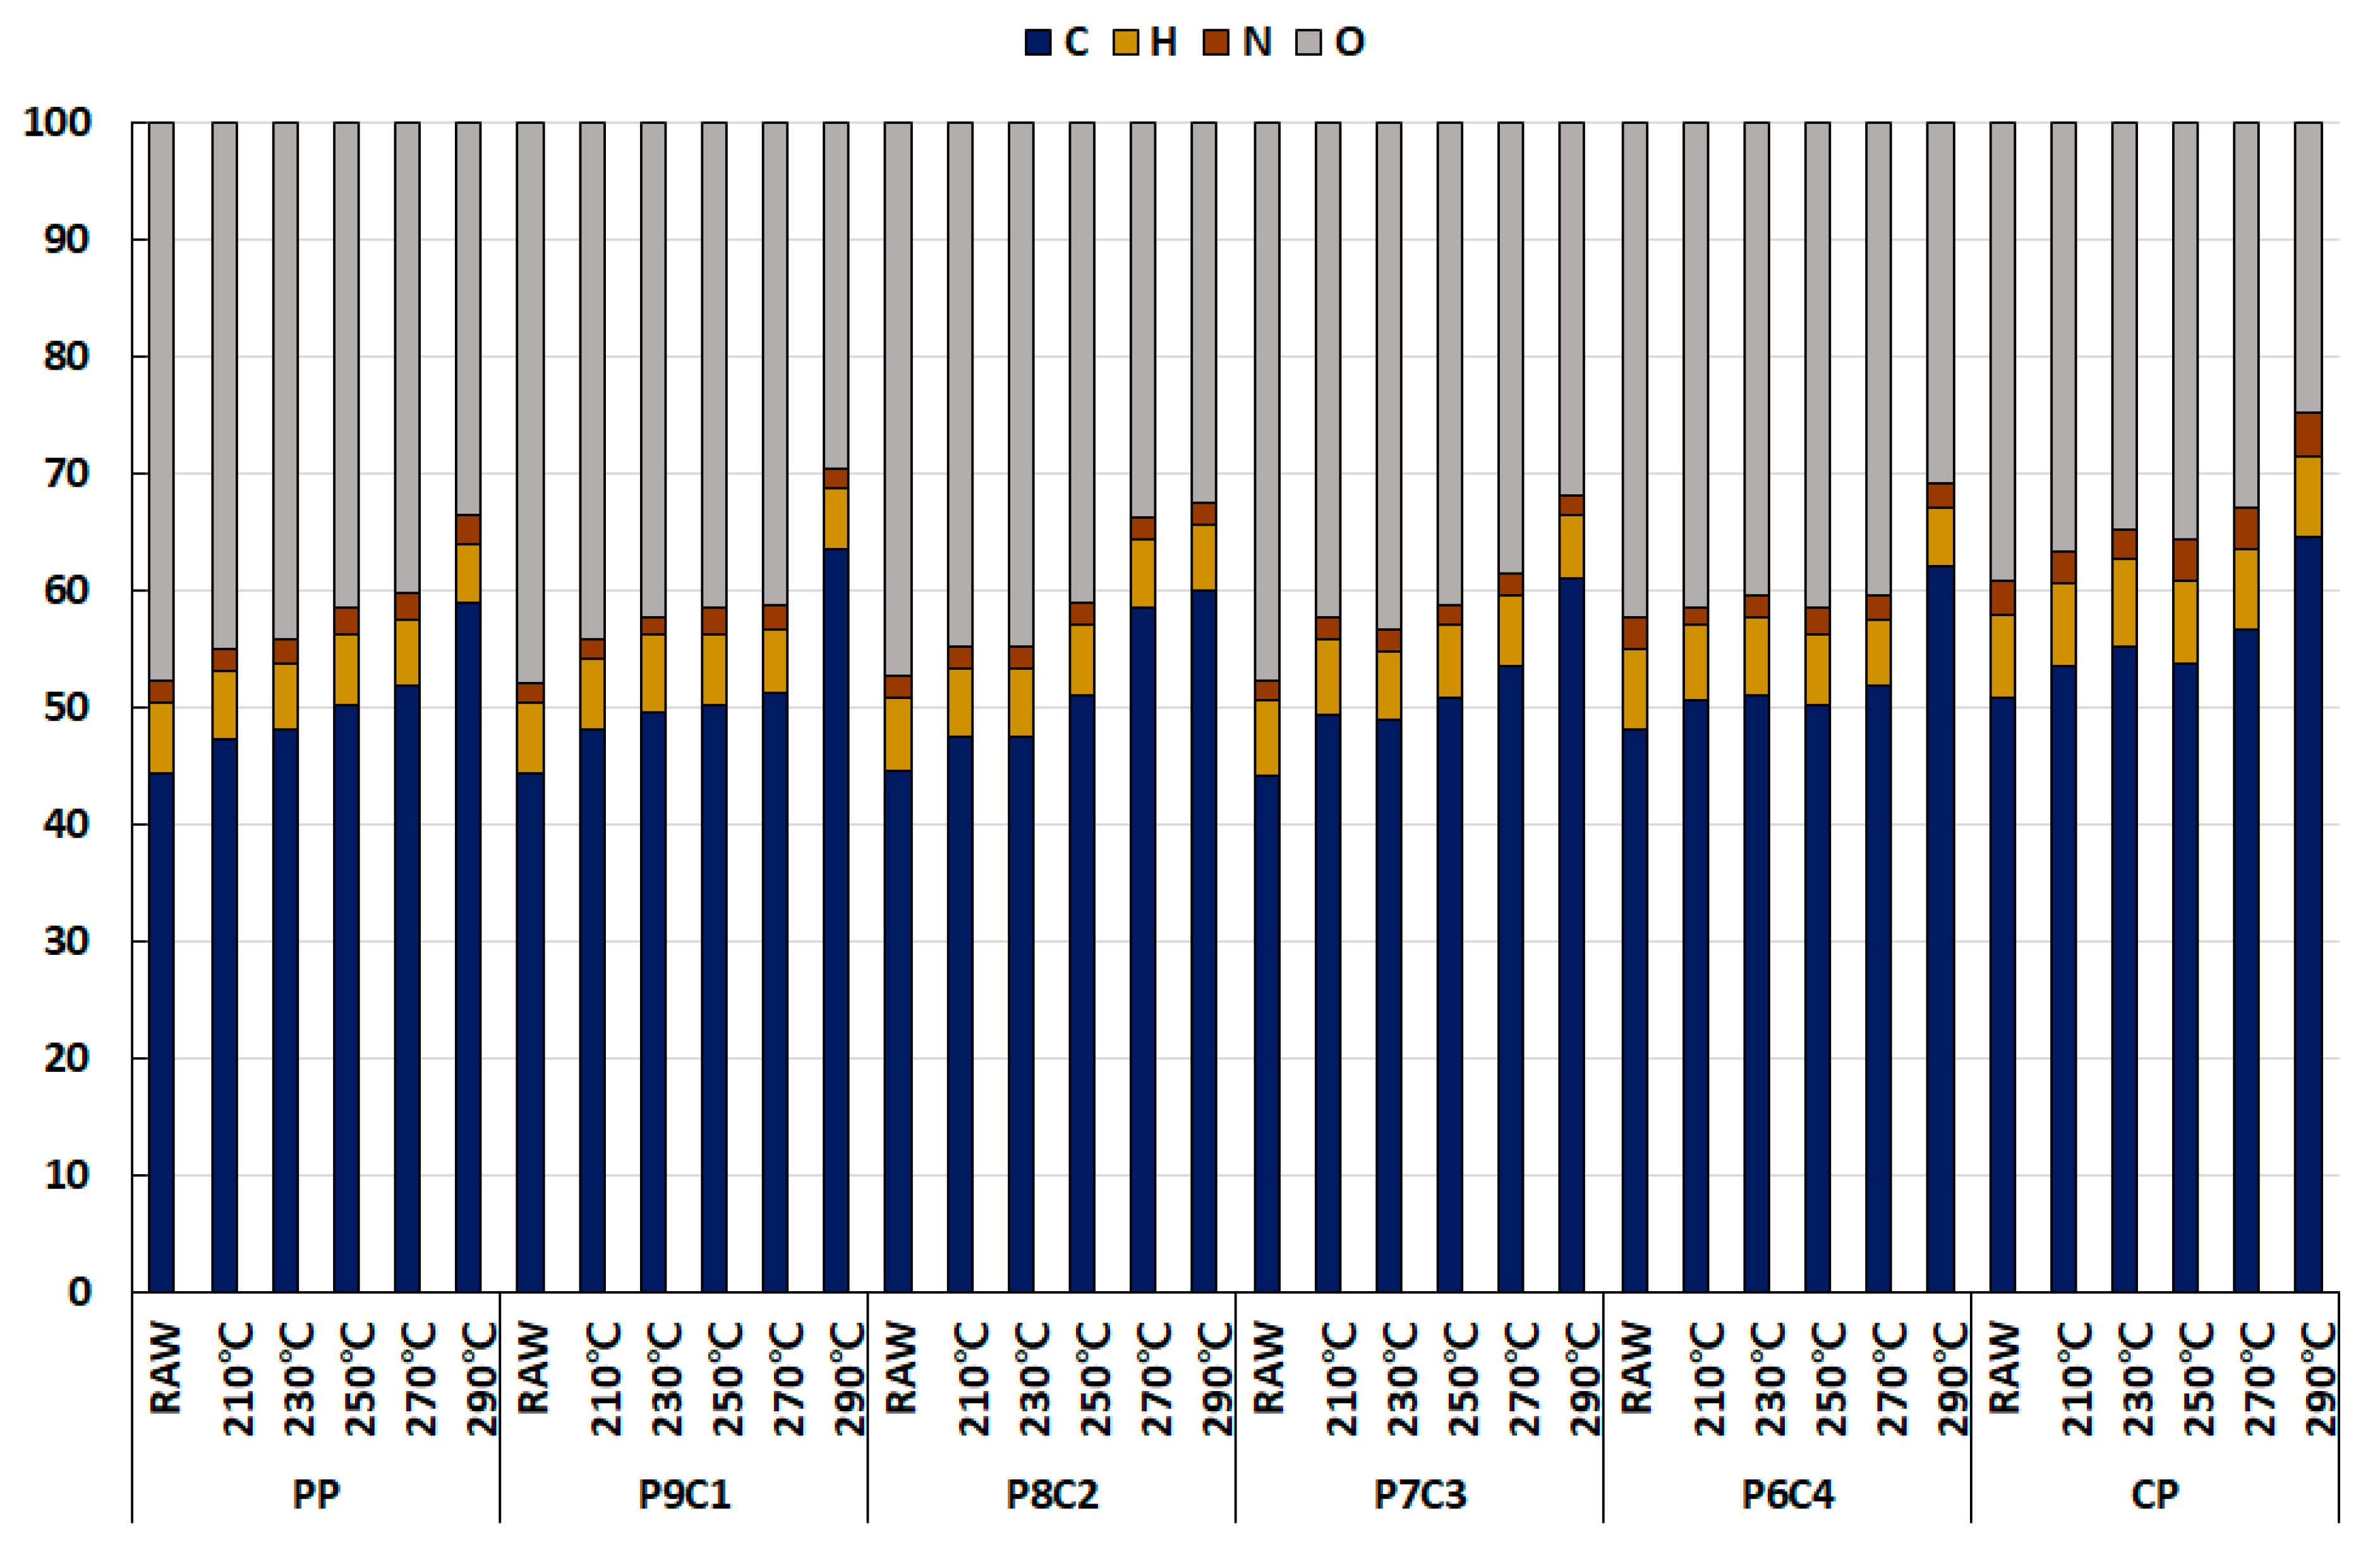
The torrefaction-induced changes in the elemental composition of each of the pellets were significant, as shown in
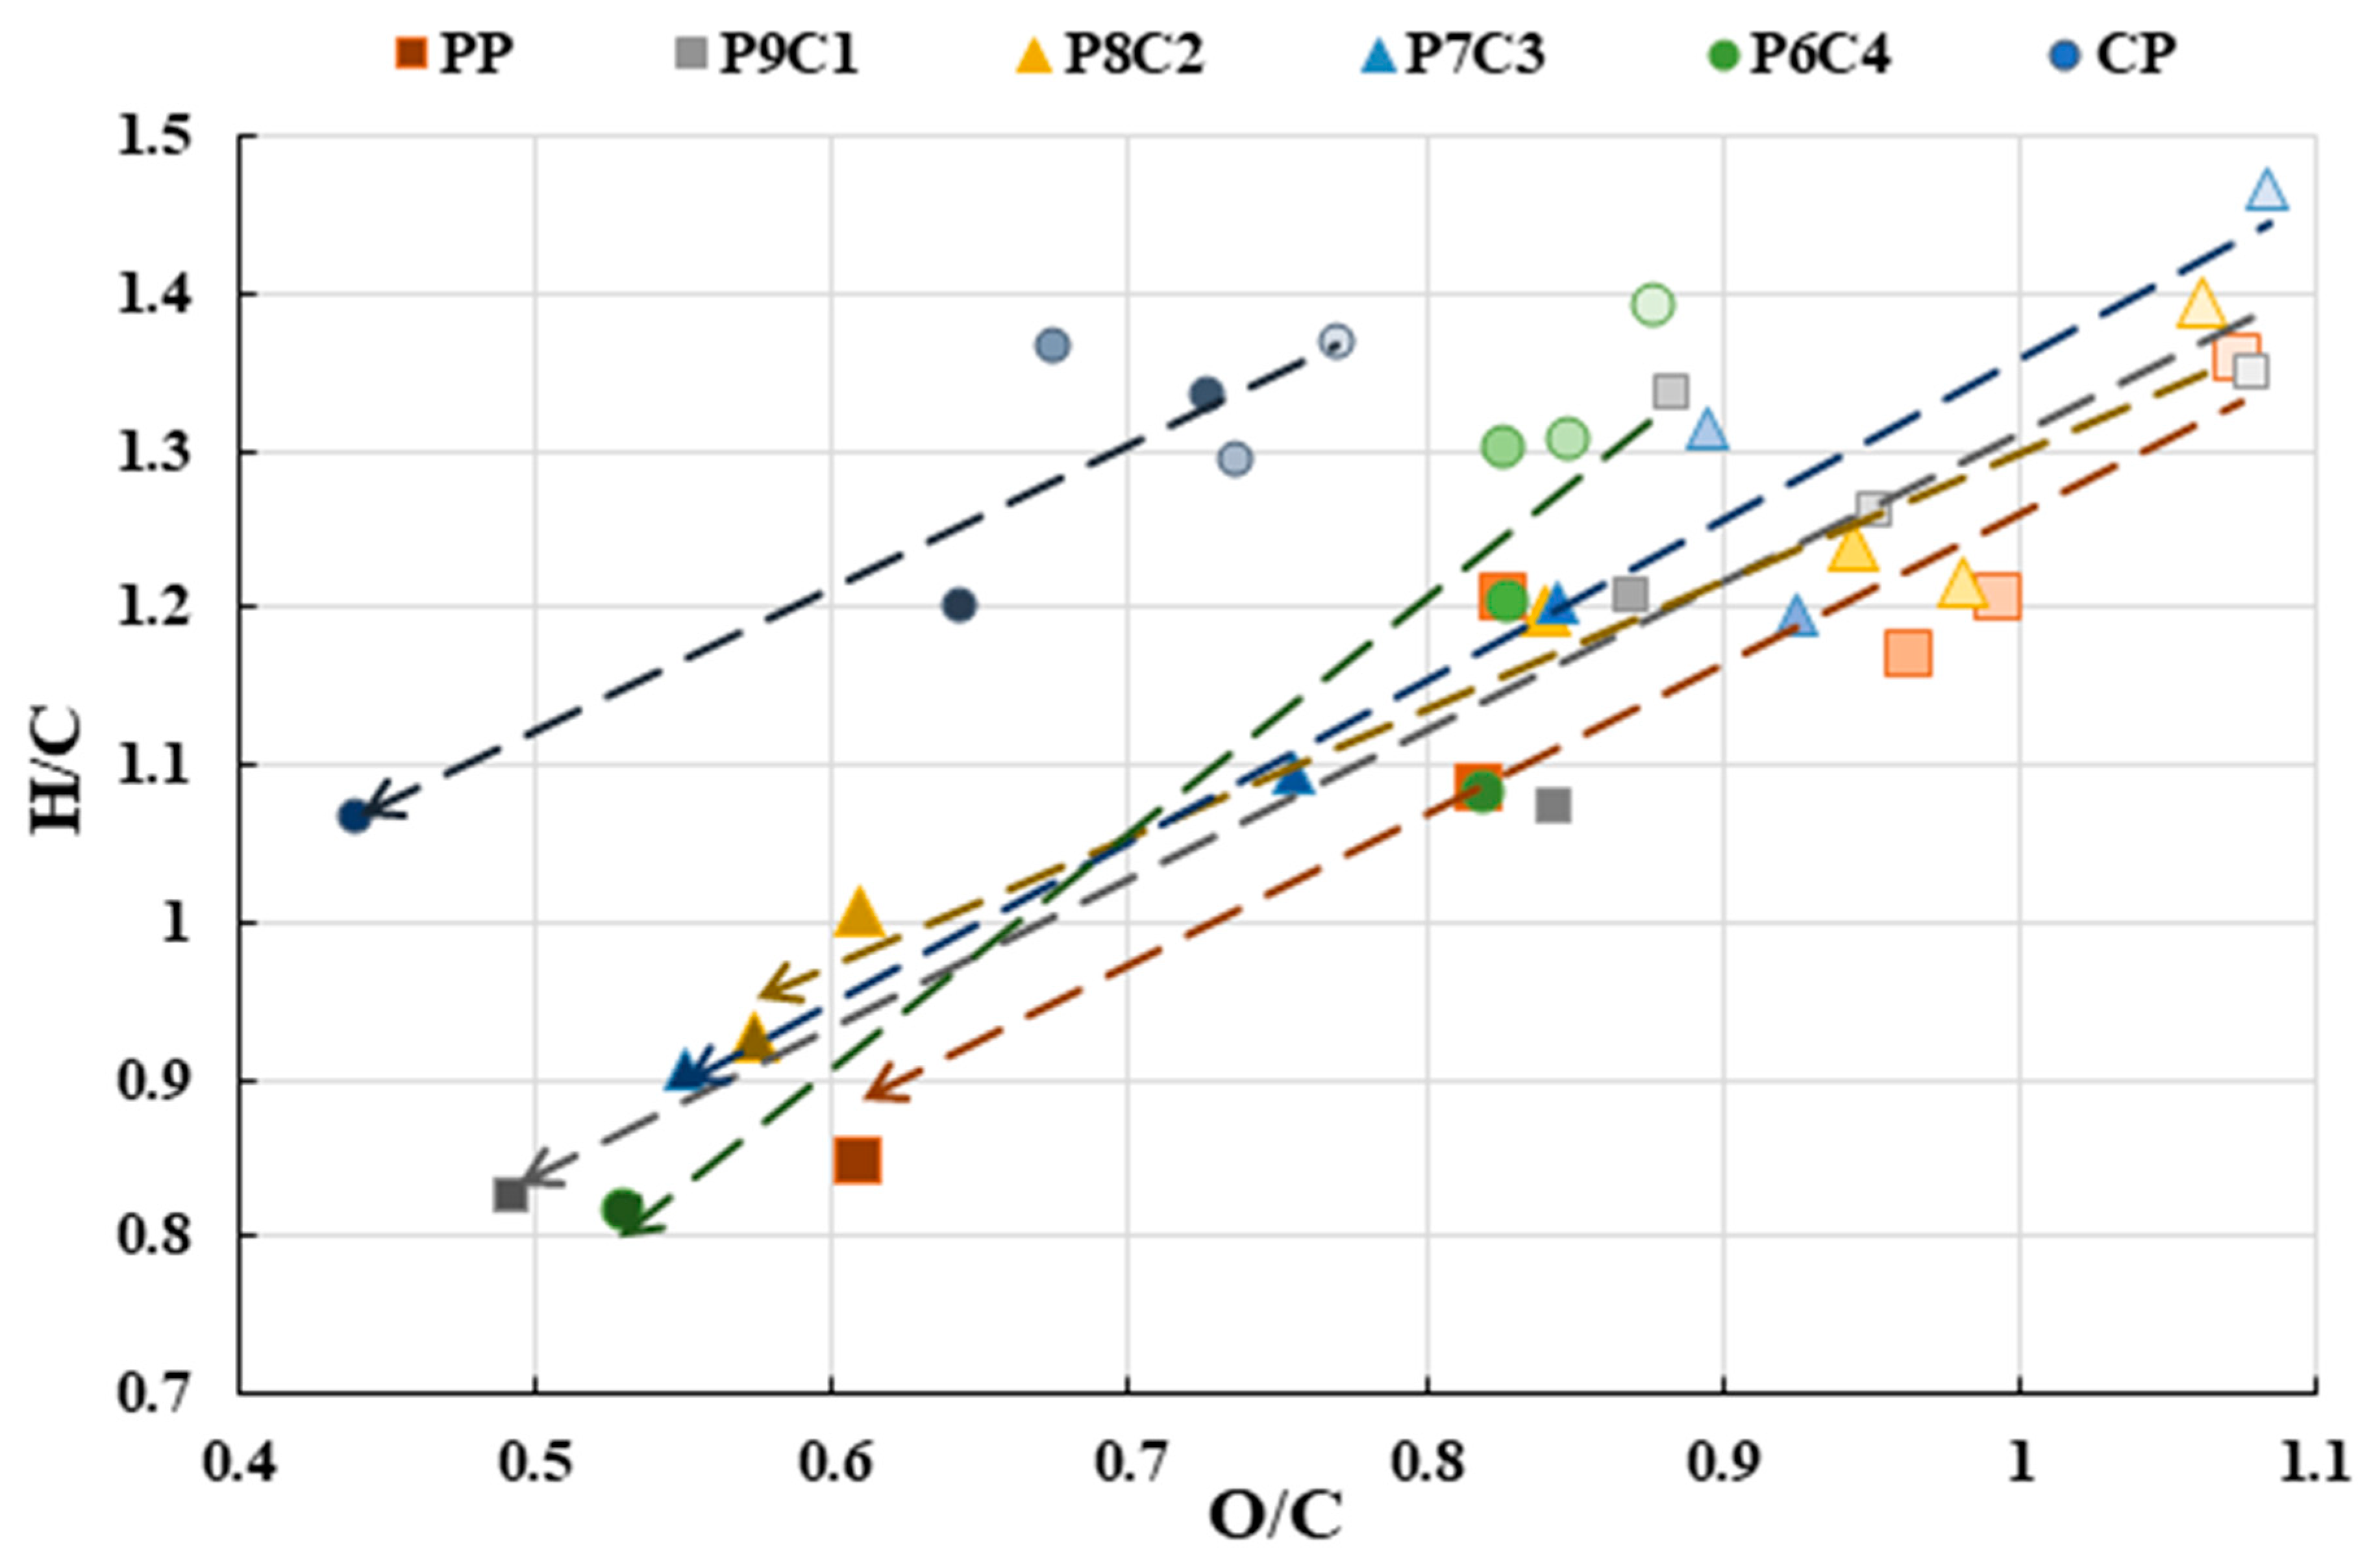
Figure 4. C, O, and H exhibited the largest variations, as these elements are commonly associated with combustion characteristics. With higher torrefaction temperatures, the proportion of C in the biomass was increased, but the proportions of O and H were decreased. The N concentration did not exhibit significant differences with changes in the processing temperature. As a result of the changes in the elemental composition, all pellets showed decreases in the O/C and H/C ratios, as shown in
Figure 5. The H/C and O/C ratios of all pellets were improved by torrefaction. Higher C contents and lower O contents were observed for pellets with a higher proportion of waste coffee grounds.
3.15. Calorific Value and Energy Yield
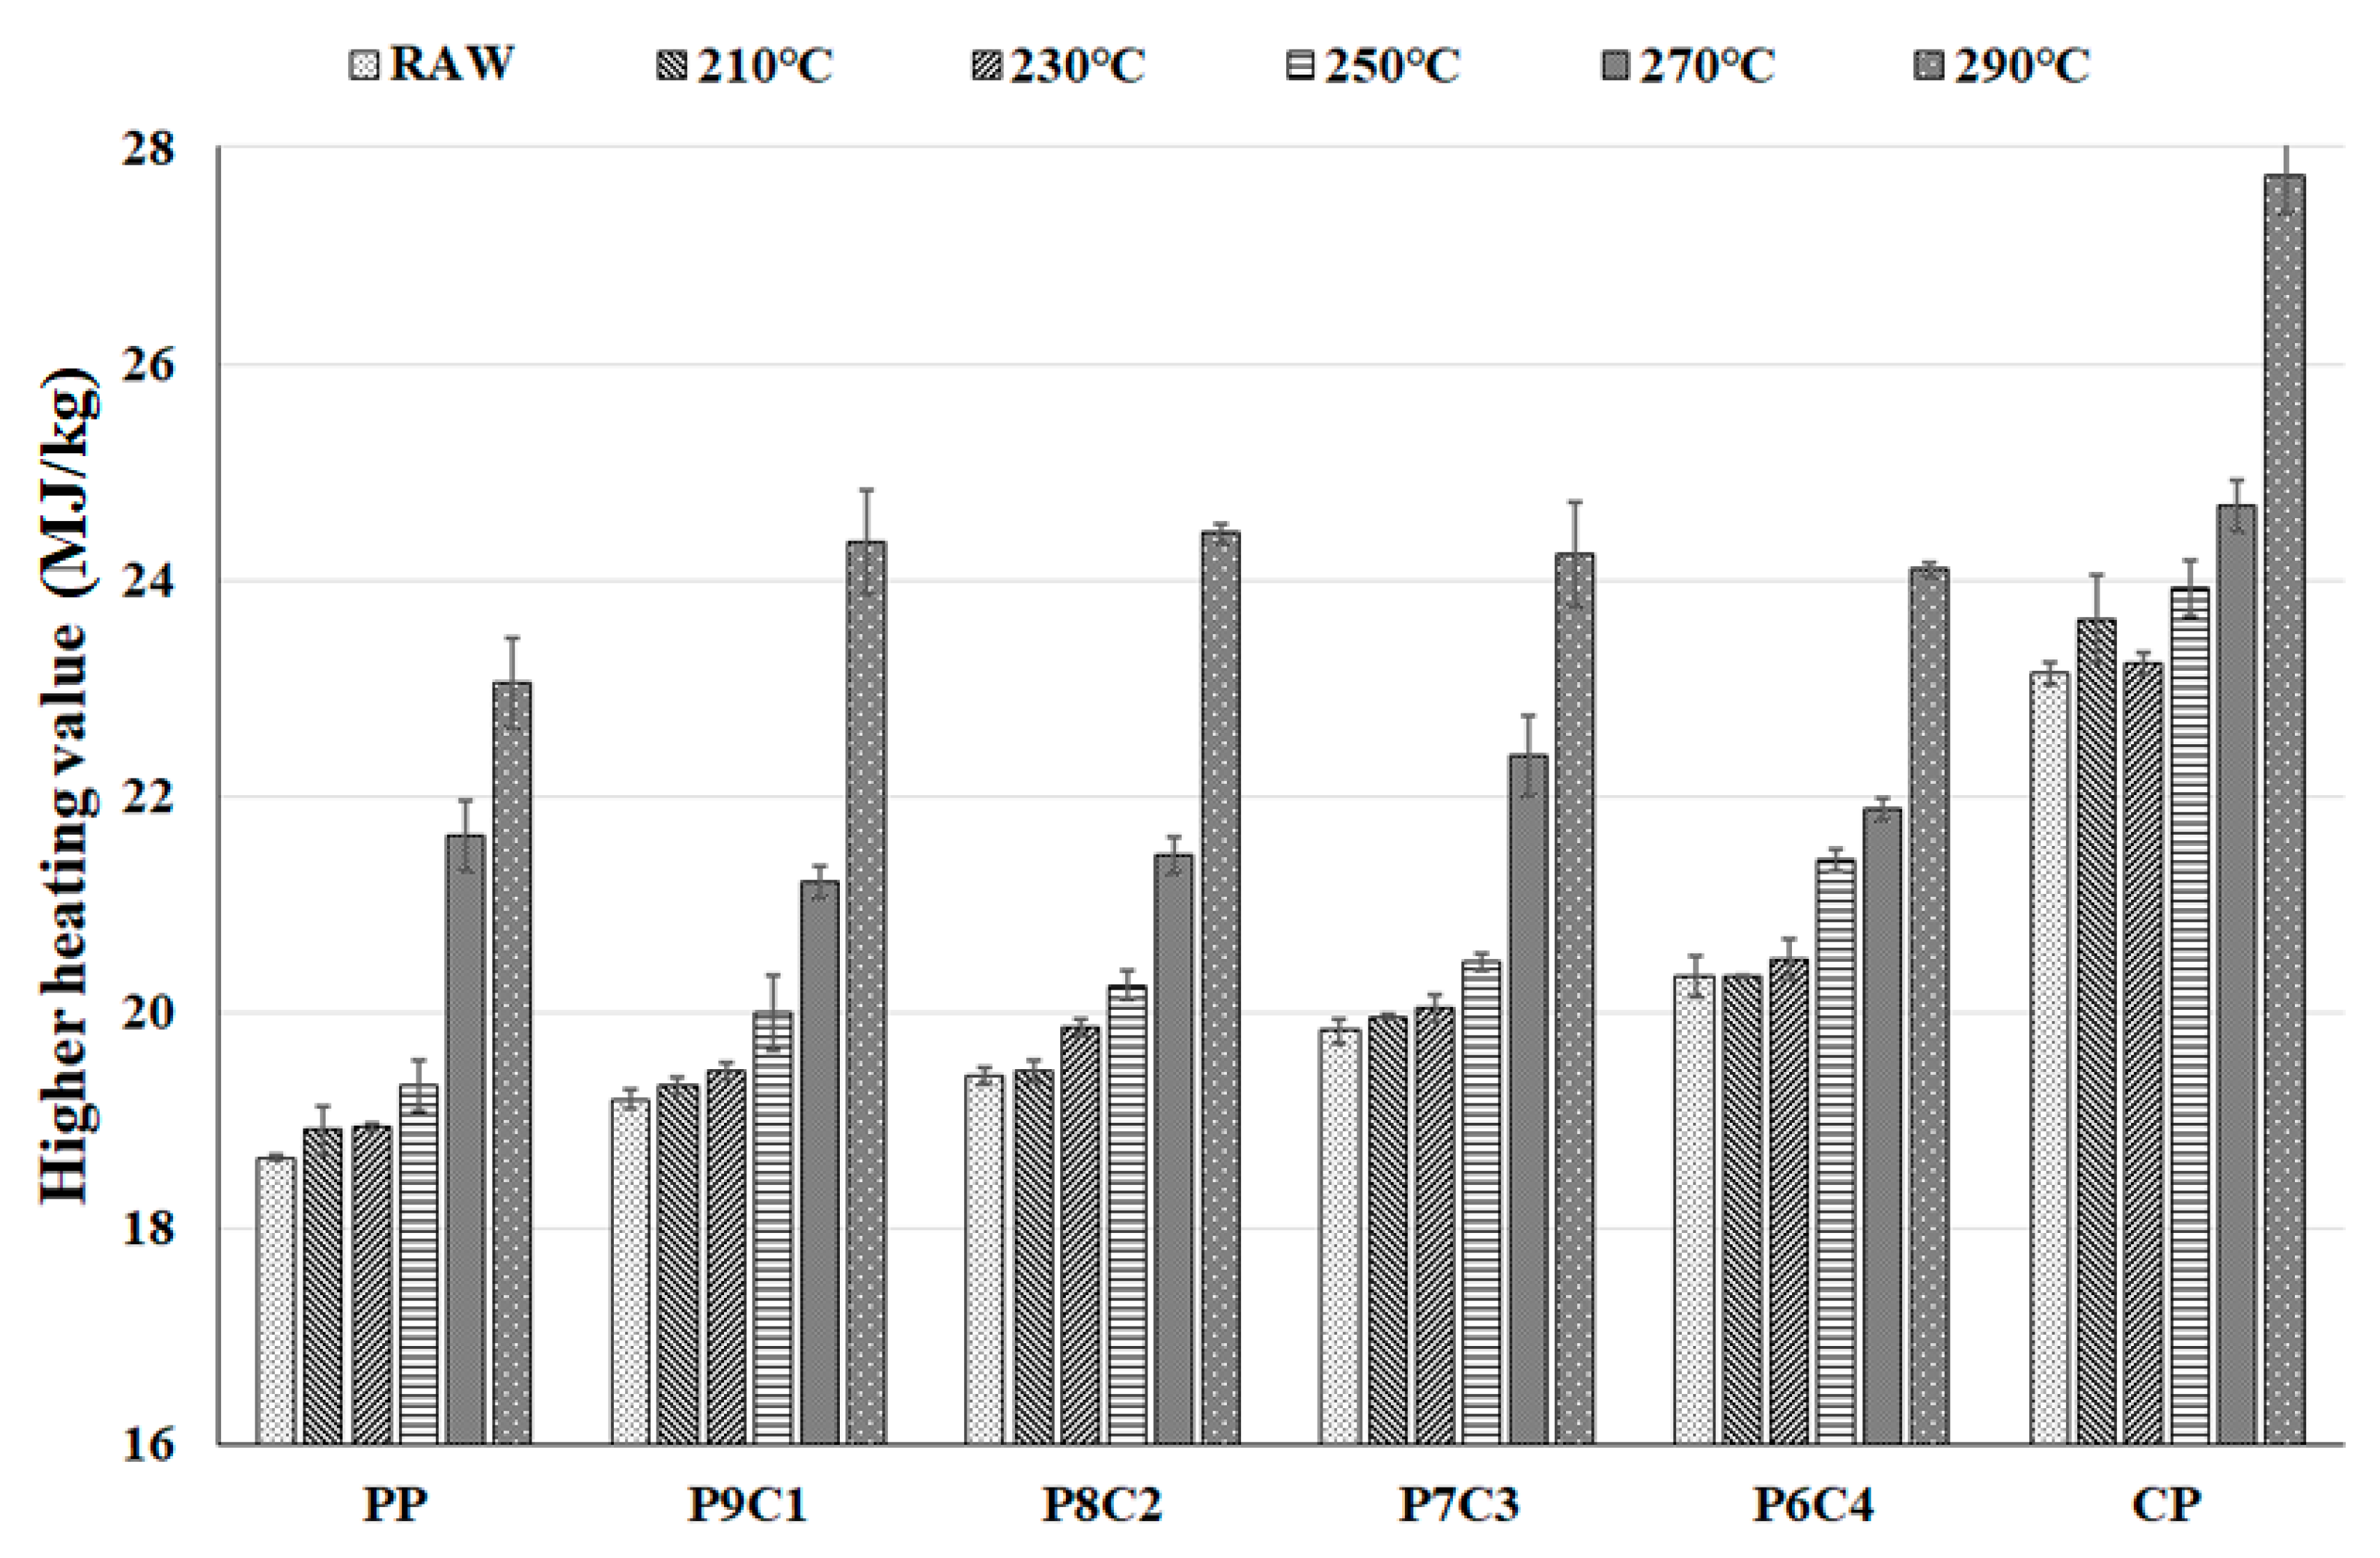
The calorific values increased with increasing torrefaction temperature, as shown in
Figure 6. Relative to the raw (non-torrefied) pellets, pellets torrefied at a relatively low temperature (210–230 °C) showed a slight increase in calorific value, while CP showed a slight decrease at 230 °C. According to a previous study, this is possibly because the removal of the oil component of CP during torrefaction reduces its calorific value [
28]. P9C1 showed the highest increase in calorific value (26.8%), while CP showed the lowest increase (19.9%) compared to that of the raw pellet. At temperatures below 250 °C, pellets with a higher proportion of waste coffee grounds showed higher calorific values, similar to the trend observed for the raw pellets. However, in the high-temperature range (270–290 °C), a different tendency was observed. For the mixed pellets, the variation in calorific value exhibited a U-shaped trend. The calorific value increased as the proportion of spent coffee grounds increased. Furthermore, P7C3 showed the highest calorific value of the pellets torrefied at 270 °C, but P6C4 showed a lower calorific value than P7C3. Moreover, P8C2 showed the highest calorific value after torrefaction at 290 °C. The calorific value of pellets torrefied at this temperature decreased with increases in the proportion of spent coffee grounds.
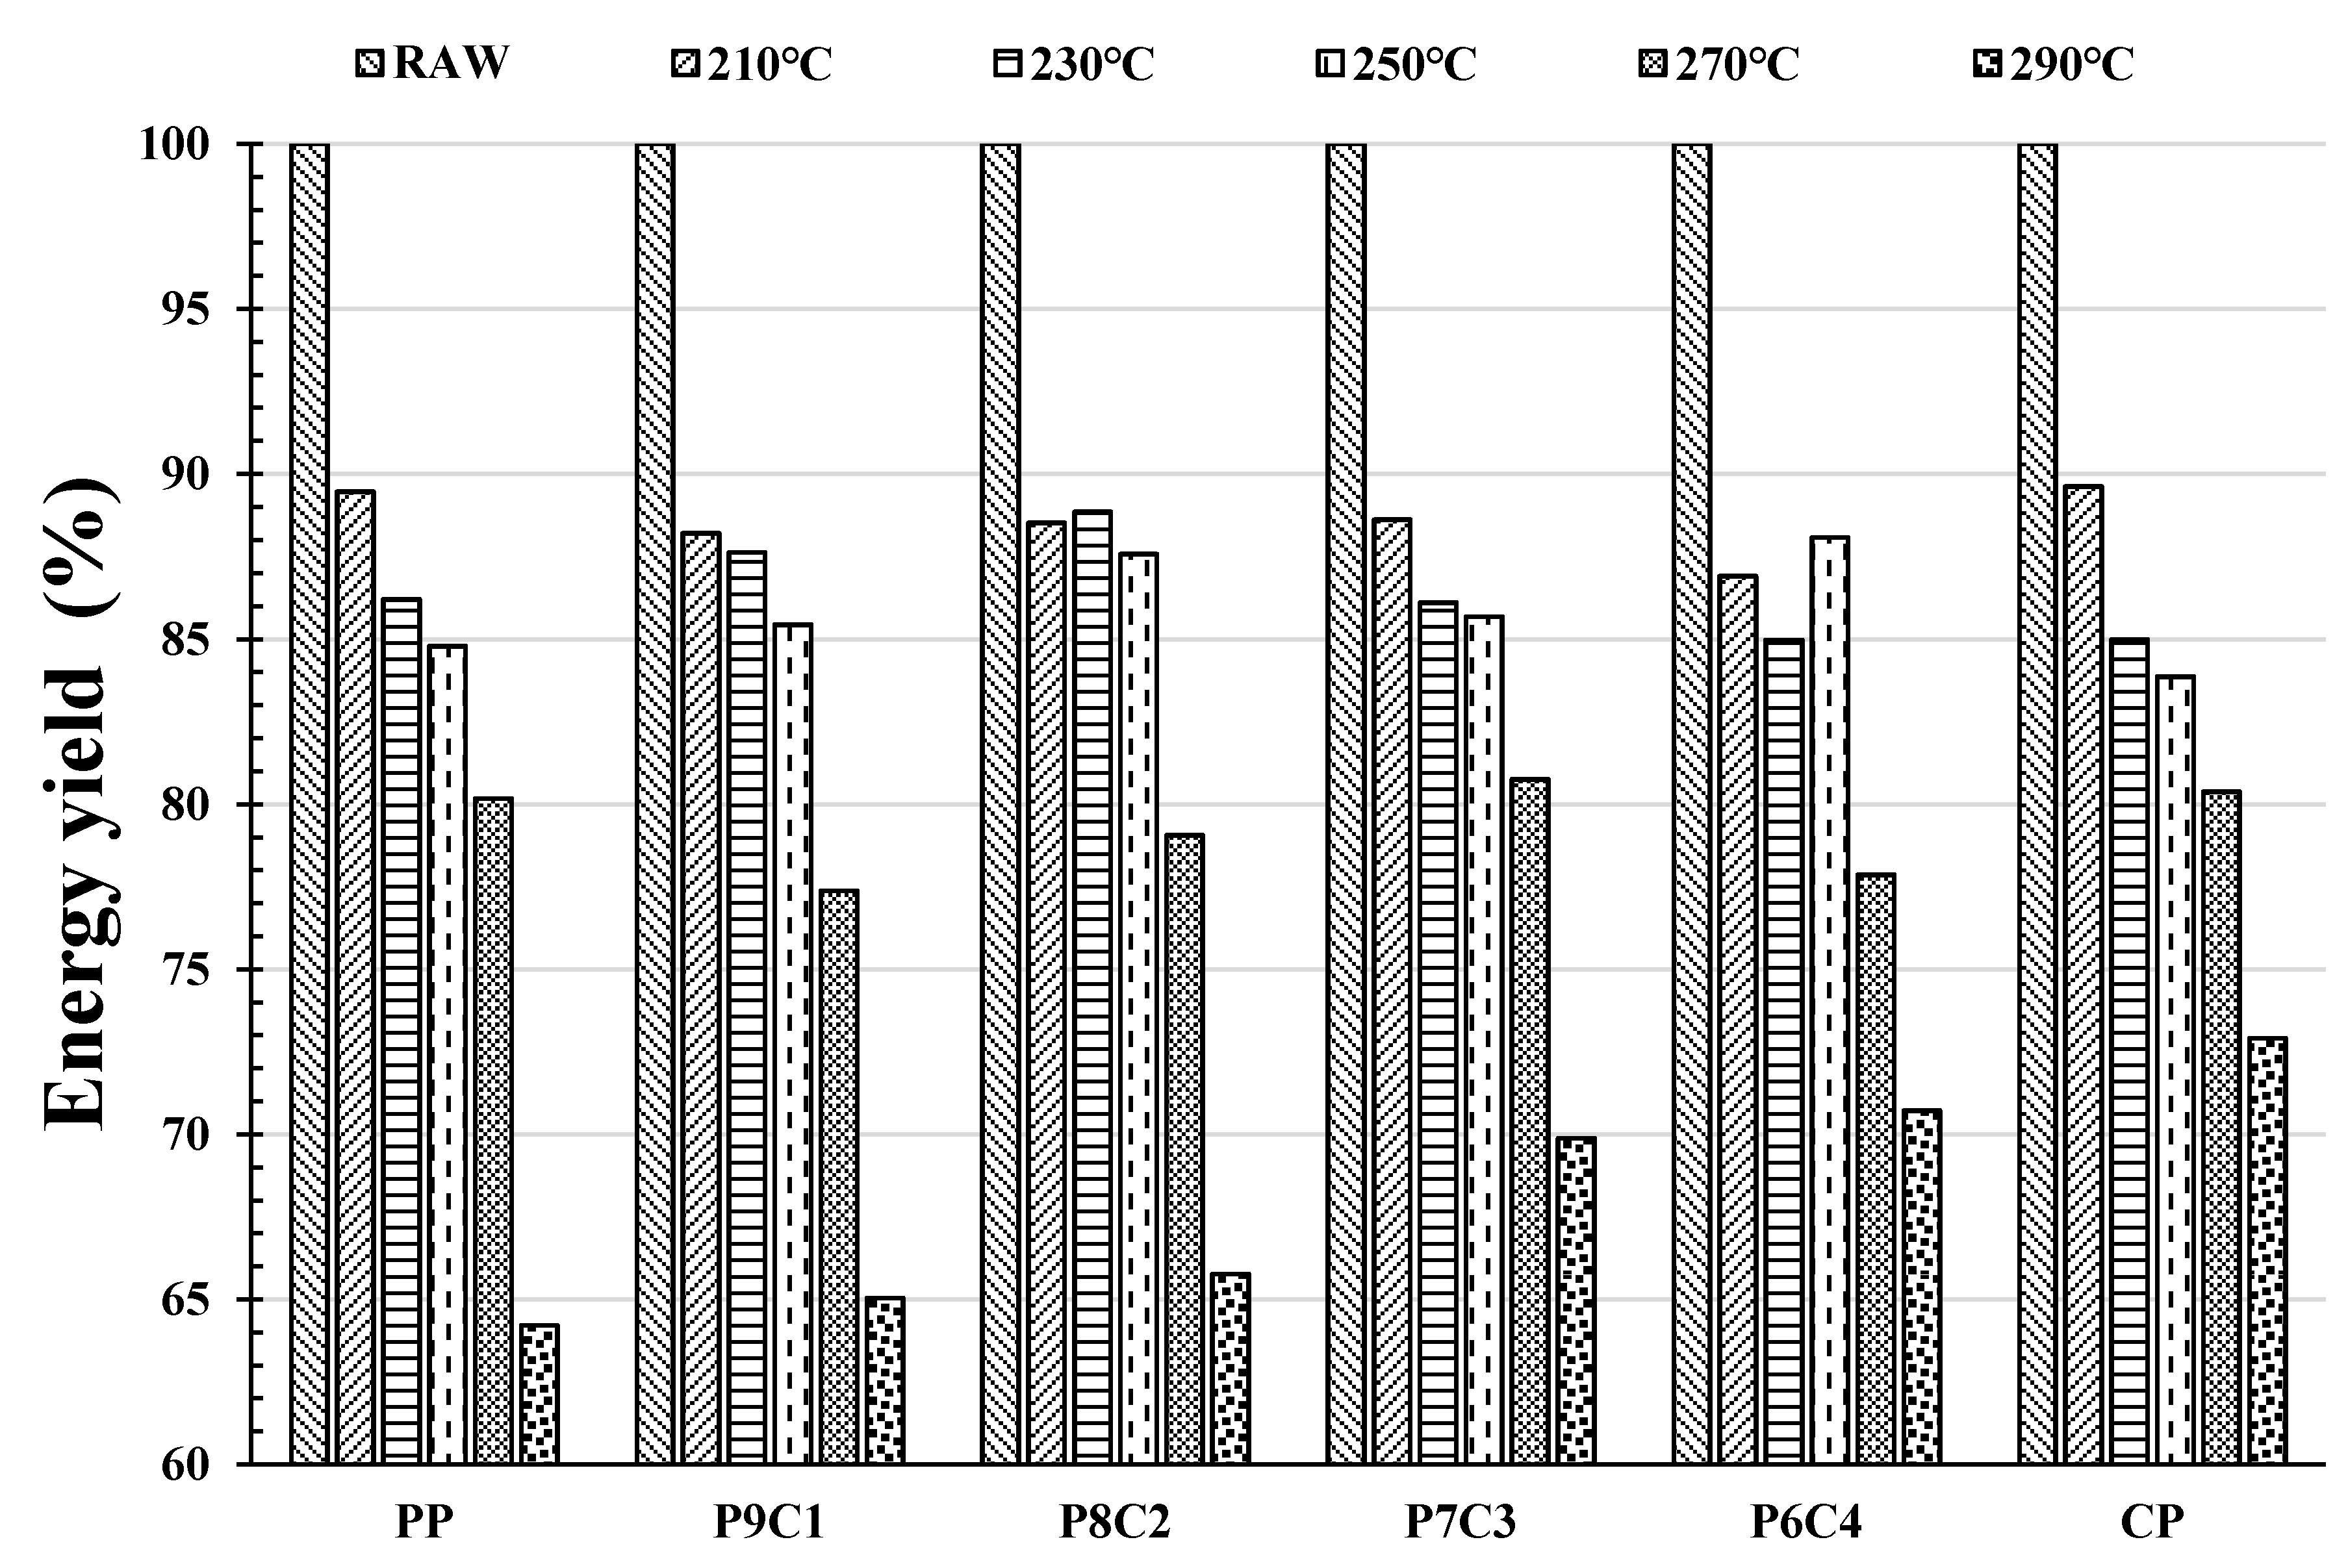
In terms of energy yield (
Figure 7), all pellets showed an approximate 10% decrease in yield when torrefied at 210 °C, relative to the raw (non-torrefied) pellets. This caused a significant decrease in mass compared to the increase in the calorific value due to moisture evaporation. All pellets torrefied at 250 °C showed energy yields of more than 80%. In particular, pellets torrefied at 290 °C exhibited a significant decrease in mass compared to those torrefied at other temperatures. However, except for temperatures of 290 °C, no clear tendency was observed between the mass loss and the proportion of coffee grounds. As the energy yield is the product of the mass yield and the calorific value, considerably high energy yields were observed in some cases, even though the mass yield was low (e.g., P6C4 torrefied at 230 °C and 250 °C).
To determine the optimal conditions, the energy yield was used to reflect the increases in both mass yield and calorific value. An energy yield of approximately 85% was selected as the optimal condition because it indicated a mass yield of over 80%, as well as a significant increase in the calorific value.
4. Discussion and Conclusions
To determine the optimal mixture ratio of fuel pellets comprising agricultural by-product pepper stems and spent coffee grounds, and to improve the fuel quality through torrefaction, this study evaluated mixed pellets using established fuel quality standards and improved the fuel quality of the pellets through torrefaction. Regardless of the mixing ratio, the Cl and N contents of the pellets were determined to be the main factors hindering fuel performance. Through various evaluation criteria, P8C2 was determined to be the optimal mixing ratio. In torrefaction tests, higher mass yields were correlated with higher concentrations of pepper stems at relatively low torrefaction temperatures of 210–230 °C. However, this trend was reversed at temperatures above 250 °C. For the evaluation of fuel characteristics, the calorific value and element component ratio of each mixing pellet was determined. Based on energy yield, 230 °C was selected as the optimal torrefaction temperature for CP, while 250 °C was optimal for the others. It was determined that the calorific value of CP decreased at higher torrefaction temperatures as a result of the decomposition of volatile matter.
This study showed that the properties of single-material pellets (PP and CP) can be improved upon by mixing the two materials at a ratio of 8:2. The high calorific value of coffee grounds can be complemented by the relatively low hygroscopicity of agricultural by-products. Compared with previous study [
17], the moisture content of CP can be improved. In addition, it was confirmed that the mixing of agricultural by-products and spent coffee grounds can be the way of improving the disadvantages of existing agricultural by-products in various standards. With another previous study [
29], mixing with spent coffee ground showed more longer length. In durability, a higher mixing ratio of spent coffee ground showed less durability in previous study, but, in this study, there were significant difference in mixing. It was observed that their fuel characteristics could be optimised through torrefaction at 250 °C. This study provides baseline data for research on using agricultural by-products as solid fuels. Based on this study, further studies on the mixing of various agricultural by-products and spent coffee grounds, pilot-scale torrefaction experiments, and methods to decrease Cl and N contents should be conducted.
