Article

Life Cycle Assessment for Integration of Solid Oxide Fuel Cells into Gas Processing Operations

Division of Sustainable Development, College of Science and Engineering, Hamad Bin Khalifa University, Qatar Foundation, Doha 34110, Qatar
*
Author to whom correspondence should be addressed.
Energies 2021, 14(15), 4668; https://doi.org/10.3390/en14154668
Submission received: 12 June 2021 / Revised: 15 July 2021 / Accepted: 16 July 2021 / Published: 1 August 2021

Abstract

:
The oil and gas industry generates a significant amount of harmful greenhouse gases that cause irreversible environmental impact; this fact is exacerbated by the world’s utter dependence on fossil fuels as a primary energy source and low-efficiency oil and gas operation plants. Integration of solid oxide fuel cells (SOFCs) into natural gas plants can enhance their operational efficiencies and reduce emissions. However, a systematic analysis of the life cycle impacts of SOFC integration in natural gas operations is necessary to quantitatively and comparatively understand the potential benefits. This study presents a systematic cradle-to-grave life cycle assessment (LCA) based on the ISO 14040 and 14044 standards using a planar anode-supported SOFC with a lifespan of ten years and a functional unit of one MW electricity output. The analysis primarily focused on global warming, acidification, eutrophication, and ozone potentials in addition to human health particulate matter and human toxicity potentials. The total global warming potential (GWP) of a 1 MW SOFC for 10 years in Qatar conditions is found to be 2,415,755 kg CO2 eq., and the greenhouse gas (GHG) impact is found to be higher during the operation phase than the manufacturing phase, rating 71% and 29%, respectively.

1. Introduction

Energy must provide a broad range of essential societal services even though it comes with significant adverse environmental impacts depending on the energy source and technology used. The continuing development of more sustainable energy resources and deployment of new technologies aims to reduce such negative energy impacts while maximizing its benefits to a better balance between opportunities and energy cost—and ultimately to overcome difficulties related to efficiency.
Fossil fuels are currently the world’s primary energy source, generating more than 75% of the total energy demand; this is estimated to remain as such for many years to come [1]. However, fossil fuel combustion is the primary source of GHG emissions that cause global warming [2]. Current economic development depends heavily on exploiting fossil fuels, which will be difficult to sustain indefinitely [3]. Therefore, the energy sector must seek to reduce CO2 emissions significantly. There is a logical and moral obligation to consider the negative environmental impact of GHG emissions and broaden the industry’s focus beyond economic wealth creation. Therefore, to achieve sustainable development in the energy sector, industries should look for alternative processes that reduce CO2 emissions.
Solid Oxide Fuel Cells (SOFCs) are a new, cleaner technology based on hydrogen and electrochemical reaction to generate electricity. SOFCs are highly efficient at producing minimal emissions [4] and can be used to improve the efficiency of oil and gas plants while reducing CO2 emissions. Integrating SOFC into the oil and gas industry could be an effective method of efficient energy production and application. More details on SOFC types, usages, and challenges can be found in “Integration of Solid Oxide Fuel Cells into Oil and Gas Operations: Needs, Opportunities, and Challenges” [5].
However, long-term, broader, and multi-dimensional impacts of SOFC integration into natural gas operations must be studied to demonstrate their benefits quantitatively. A Life Cycle Assessment (LCA) can be used to evaluate the environmental impact of SOFC manufacturing and operations, compare different integration scenarios in oil and gas plants, and clarify how different kinds of integration of SOFC in oil and gas can reduce emissions. An LCA consists of several multipurpose steps used to gather and explore all inputs and outputs of a product in addition to its possible environmental impacts. This is done for the entire life cycle, from the raw material collection and manufacturing, usage, maintenance, and disposal or repurposing [6]. The environmental management standards ISO 14040 and ISO 14044 (both issued in 2006) form the basis for the systematic LCA.
This study presents a systematic cradle-to-grave life cycle assessment (LCA) based on the ISO 14040 and 14044 standards using a planar, anode-supported SOFC with a lifespan of 10 years and a functional unit of 1 MW electricity output designed to be integrated into a proper natural gas operation.
This study will have the following features:
  • The SOFC in this LCA study is fueled by natural gas and operates in a natural gas plant, while many other similar studies on SOFC LCA are based on a fuel other than pure natural gas or used in a domestic and residential area.
  • Utilizing the SOFC in a natural gas plant will eliminate unnecessary flaring of natural gas.
  • Take advantage of the presence of natural gas in Qatar at a reasonable cost as fuel to SOFC.
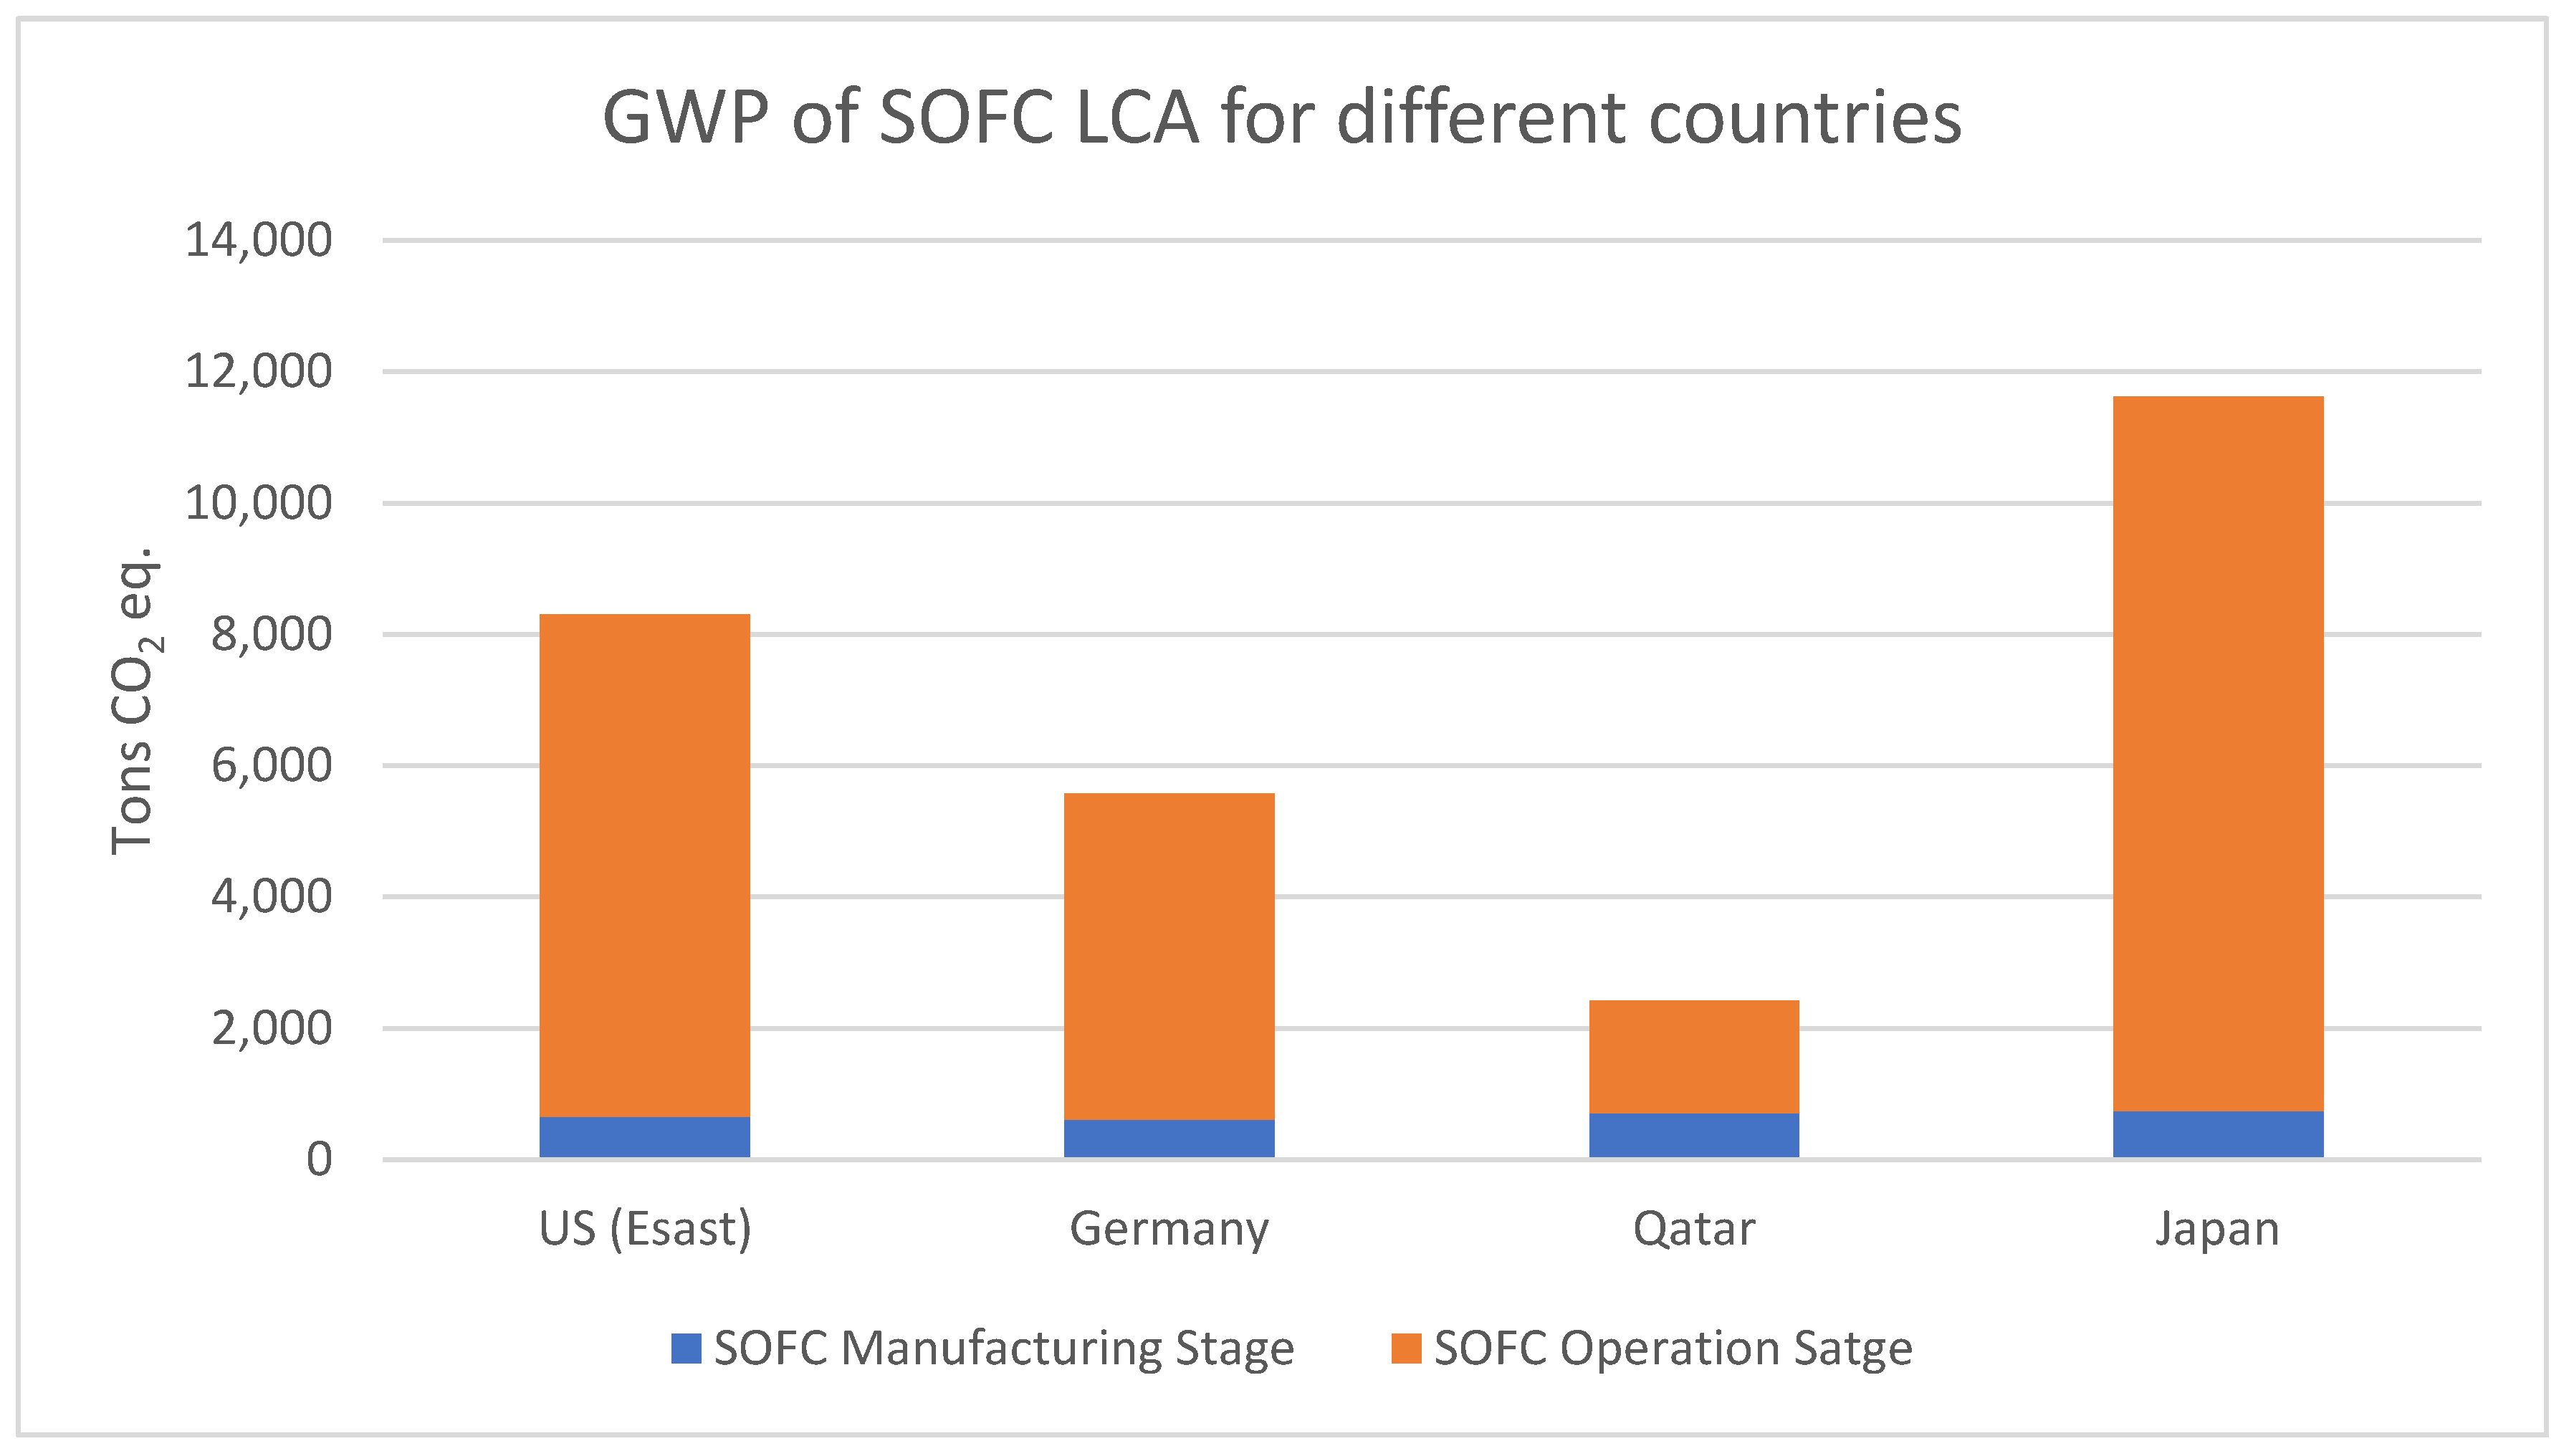
  • GWP from the operational phase of SOFC in Qatar is much less than operating SOFC in other countries.
  • Availability of data from this LCA study will allow for comparison with LCA results of traditional power generation used in the gas processing plant.
  • The ratio of GWP between the manufacturing and operation phases is aligned with the results from other SOFC LCA studies.
  • The gas plant can generate its own electricity using SOFC which will result in less environmental impact compared to other traditional power generation.
The following section comparatively summarizes and analyzes the relevant literature on the LCA and its application to energy, oil and gas operations, and SOFC; the next section presents the methodology followed in this study and describes the conditions, data collection, and justifications; the third section presents the results, findings, and discussions in detail, and the conclusions are comparatively presented in the fourth section.

1.1. Background

The LCA has become an appropriate and effective tool for evaluating matters related to resource depletion and environmental degradation [6]. From 1994 to 2014, LCA studies in the energy sector increased by 60% [6]. An LCA involves four stages: goal and scope, life cycle inventory analysis (LCI), life cycle impact assessment (LCIA), and interpretation. The first stage identifies the functional unit and system boundaries and then defines the assumptions, limitations, and allocations (if any) in addition to selecting the LCIA method. The second phase involves conducting an inventory of flows, including all inputs of water, energy, and raw materials and emissions to the air, land, and water. The third phase selects the impact categories, category indicators, and characterization models. The last step evaluates the results’ completeness, sensitivity, and consistency while providing conclusions and recommendations.
Most LCA studies of SOFCs follow the cradle-to-grave approach for system boundaries. However, many exclude the manufacturing and disposal stages due to the assumption that most environmental impacts are caused by operation and fuel production [7,8,9,10]. The decision to add or remove a specific step is based on the goals set in a particular study. It is possible to leave out activities that do not affect the overall understanding of the analysis and continue to consider the relevant issues with the LCA [7]. Environmental, health, economic, and political problems have influenced studies analyzing SOFC environmental performance and compared them with traditional power generation in many different fields [7].
Using different methodologies in SOFC LCA studies led to differences in FU and system boundary choices, among others. This, along with the unavailability of up-to-date inventory data, made comparisons and evaluations of these studies’ outcomes complex [7]. One common problem is data availability [11], as detailed data for materials used in SOFC production are not released by manufacturers due to concerns regarding confidentiality and market competitiveness [7].
The CML method is commonly used in LCAs; it includes ten impact categories, is flexible, gives accurate results, and is transparent [7]. Buchgeister used three different LCIA methods (Eco-indicator 99, CML 2001, and Impact 2002) for SOFCs fueled by gasified biomass fuel, noting that overall environmental impacts are differed [12]. The study recommended using more than one method to reach a uniform outcome, as a single approach could provide weak signals due to discrepancies in LCIA methods. For example, a midpoint (or problem-oriented) approach usually focuses on actions like emissions relief and resource usage along impact pathways like GWP, AP, and EP. An endpoint (or damage-oriented) approach focuses on the final impacts linked to outcomes (like human health) along impact pathways like AoP [7]. The IPCC methodology mainly focuses on GHGs such as CO2, CH4, and N2O.
CO2 emissions from SOFC production are negligible compared to those generated during operation. In contrast, the harmful emissions produced by other gases (e.g., SO2, CO, NOx, and SOx) are negligible during the process but are generated during production—though it only affects the area around the factory [8]. The latter contributes to acidification in local land and water systems and the development of volatile compounds that influence ozone levels and human health [11]. A SOFC operation contributes most life cycle emissions due to the fuels used should not be an excuse to eliminate the manufacturing phase from its LCA, as the supply chain may vary by location, energy mix, and other factors [7].
Nigel and Brunel demonstrated a 75–93% reduction of CH4, NMHCs, PM, and CO through SOFCs rather than traditional systems [13]. Jakob and Hirshberg [14] showed that SOFC use reduced GWP by 50% and required up to 20% less energy than traditional systems like gas boilers. Herron proved that SOFCs in three American cities produced almost no harmful gases like NOx, PM2.5, PM 10, and SOx, unlike three types of traditional systems (natural gas combined with cycle plants, coal-fired plants, and nuclear plants) and achieved superior performance [9].
The SOFC disposal phase has been ignored by many studies, especially those before 2011, mainly due to unknown strategies for SOFC end-of-life practices and a lack of relevant data. Mehmeti et al. considered the inclusion of SOFC disposal in LCA studies to be optional, recommending conducting a sensitivity analysis to account for the LCA’s numerous uncertainties and so that this process could detect significant factors affecting the overall performance [7].

1.2. Literature Review

The electrical mix plays a significant role in determining emissions results for CO2 and GWP, as the operational phase of SOFCs accounts for approximately 75–97% of life cycle environmental influences [15]. As fuel production and supply contribute to around 97% of the impact on ODP, ADP, and PED, the selection of fuel types has a significant effect on the results of the SOFC LCA. During SOFC production using the UK mix grid, 60% of CO2 release occurs during sintering of the SOFC cell, and the remainder is related to fuel processor and DC/AC power converter production as part of the BoP [16]. A recycling rate of 75% will reduce GWP by 8–11% [16].
Lee et al. argued that the manufacturing and end-of-life phases have little impact on the environmental burden of a SOFC system (2.1–9.5% and <0.6%, respectively; [10]. Within the manufacturing stage, stack production contributes approximately 72% of the total environmental impact for planar SOFC and 28% for BoP, mainly due to the utilization of stainless steel and chromium alloys that require more energy during production. Strazza et al. noted that the level of environmental impact during manufacturing is based on the quantity of steel and the type of energy mix used; the worst case is coal-based energy, demonstrating that the ecological implications of SOFC manufacturing depend on the production location [17]. That study also observed that, when using the midpoint LCA approach, natural gas is recommended for lower AP and POCP, but that for ADP, EP, GWP, ODP, and PED, biogas shows better results. Although H2 has better results than GWP and ODP, it is higher in POCP, EP, and AP. However, leaks from gas plants or pipelines can contribute significantly to overall emissions since CH4 contributes to GWP by a mass ratio of 25 CH4 to 1 CO2 [18].
Sadhukhan emphasized that GWP, AP, and POCP are the most essential categories for evaluating different technologies (based on the Monte Carlo analysis). The SOFC LCA for these categories produces lower results than internal combustion engines micro gas turbines for distributed power generation [19]. Lin et al. stated that GWP is the only category impacted by a SOFC operation, during which CO2 emissions represent 80% of total life cycle emissions [20]. Sadhukhan also argued that using SOFCs could eliminate PM2.5 and N2O emissions, which contribute more to GWP than CO2 given the mass ratio of 298:1 between N2O and CO2; N2O also impacts EP and POCP [19]. Strazza et al. provided further details on environmental impact per category, stating that ADP, ODP, GWP, and PED accounted for as little as 2% of the total life cycle environmental impact during the manufacturing and end-of-life stages. However, this rose to approximately 10–32% for AP, EP, and POCP [17].
Nease and Adams used the ReCiPe 2008 method to evaluate the life cycle impact, showing that the effects of the manufacturing phase affected climate change mainly for the fossil fuel and metal depletion categories, equaling approximately 9% for one year [21,22]. Nease and Adams claimed that, even with the uncertainties, SOFCs were better than NGCCs and were better than supercritical pulverized coal by 45.8% in life cycle influence [22]. Baratto and Diwekar also showed that using SOFCs instead of diesel engines in trucks decreased PM by 82.08%, HC by 92.65%, NOx by 99.1%, CO by 97.77%, and CO2 by 64.32% [8]. Reenaas et al. analyzed several fuel types for combined SOFC-GTs in Norway. They confirmed that, mainly due to less transportation, domestic LNG had 60% less GWP, 85% less POCP, and 90% less AP when compared with imported LNG and sulfur-free diesel [23]. Besides, the use of SOFC-GT in marine applications instead of diesel engines contributed to reductions of 35–93% in GWP, POCP, and AP [23]. Lin et al. conducted a fuel-type comparison for SOFCs between APUs and diesel engines in trucks, finding that a SOFC fueled by biodiesel was the most environmentally friendly system [20]. This required 14.5 times less fuel than diesel engines and emitted five times fewer GHGs, while no re-design of the fuel system was necessary since the fuels had similar physical and chemical compositions [20].
Concerning disposal, Cánovas et al. argued that a 70% recycling rate would result in a 7.5% reduction in life cycle impact, primarily due to lower carcinogen emissions [15]. Strazza et al. stated that nickel was the most recyclable portion of SOFCs while ceramics will end up in landfills [17]. However, Nease and Adams showed that decommissioning large SOFCs can require large amounts of fossil fuel and produce more emissions [22].
Reenaas also confirmed that overall the LCA was not sensitive to changes in the durability of SOFC-GTs. Increasing SOFC life to 10 years from 5 years would only increase the GWP, AP, and POCP by 3% at most but would reduce SOFC efficiency by 20% and lead to 6% increases in GWP and AP and 33% in POCP [23].

1.3. Objectives

The general purpose of this LCA study is to understand the impact of SOFCs on environmental values and provide a basis for comparisons of different types of integration approaches in gas processing plants. The results are intended to serve as a reference for future researchers interested in integrating SOFCs in a gas plant and providing manufacturers and decision-makers with valuable data. As shown in Figure 1, the overall SOFC system includes the different phases of SOFC, including the raw material up to the manufacturing and operational phase. However, the disposal phase is not part of the LCA study since its life cycle environmental impact is less than 3% of the total impact, as based on the literature review.
The aim of conducting an LCA for SOFCs is to identify the materials and processes involved in SOFC manufacturing and their environmental impact and evaluate the ecological effect of SOFC operation. The resulting information can improve decision-making about resource depletion and environmental degradation [7].

2. Method

SETAC developed an LCA code of practice, and it encouraged the ISO to create a standardized set of steps for the LCA process. The methodological framework defined in the ISO 14040 standard includes four main phases:
  • Goal and scope definition: the study’s aim, breadth, and depth are outlined, setting the functional unit and system boundaries.
  • LCI: data collection is performed, including calculation and allocation.
  • LCIA: potential environmental effects related to the inventory analysis results are evaluated.
  • Interpretation: the LCIA results are analyzed and summarized concerning the goal and scope.
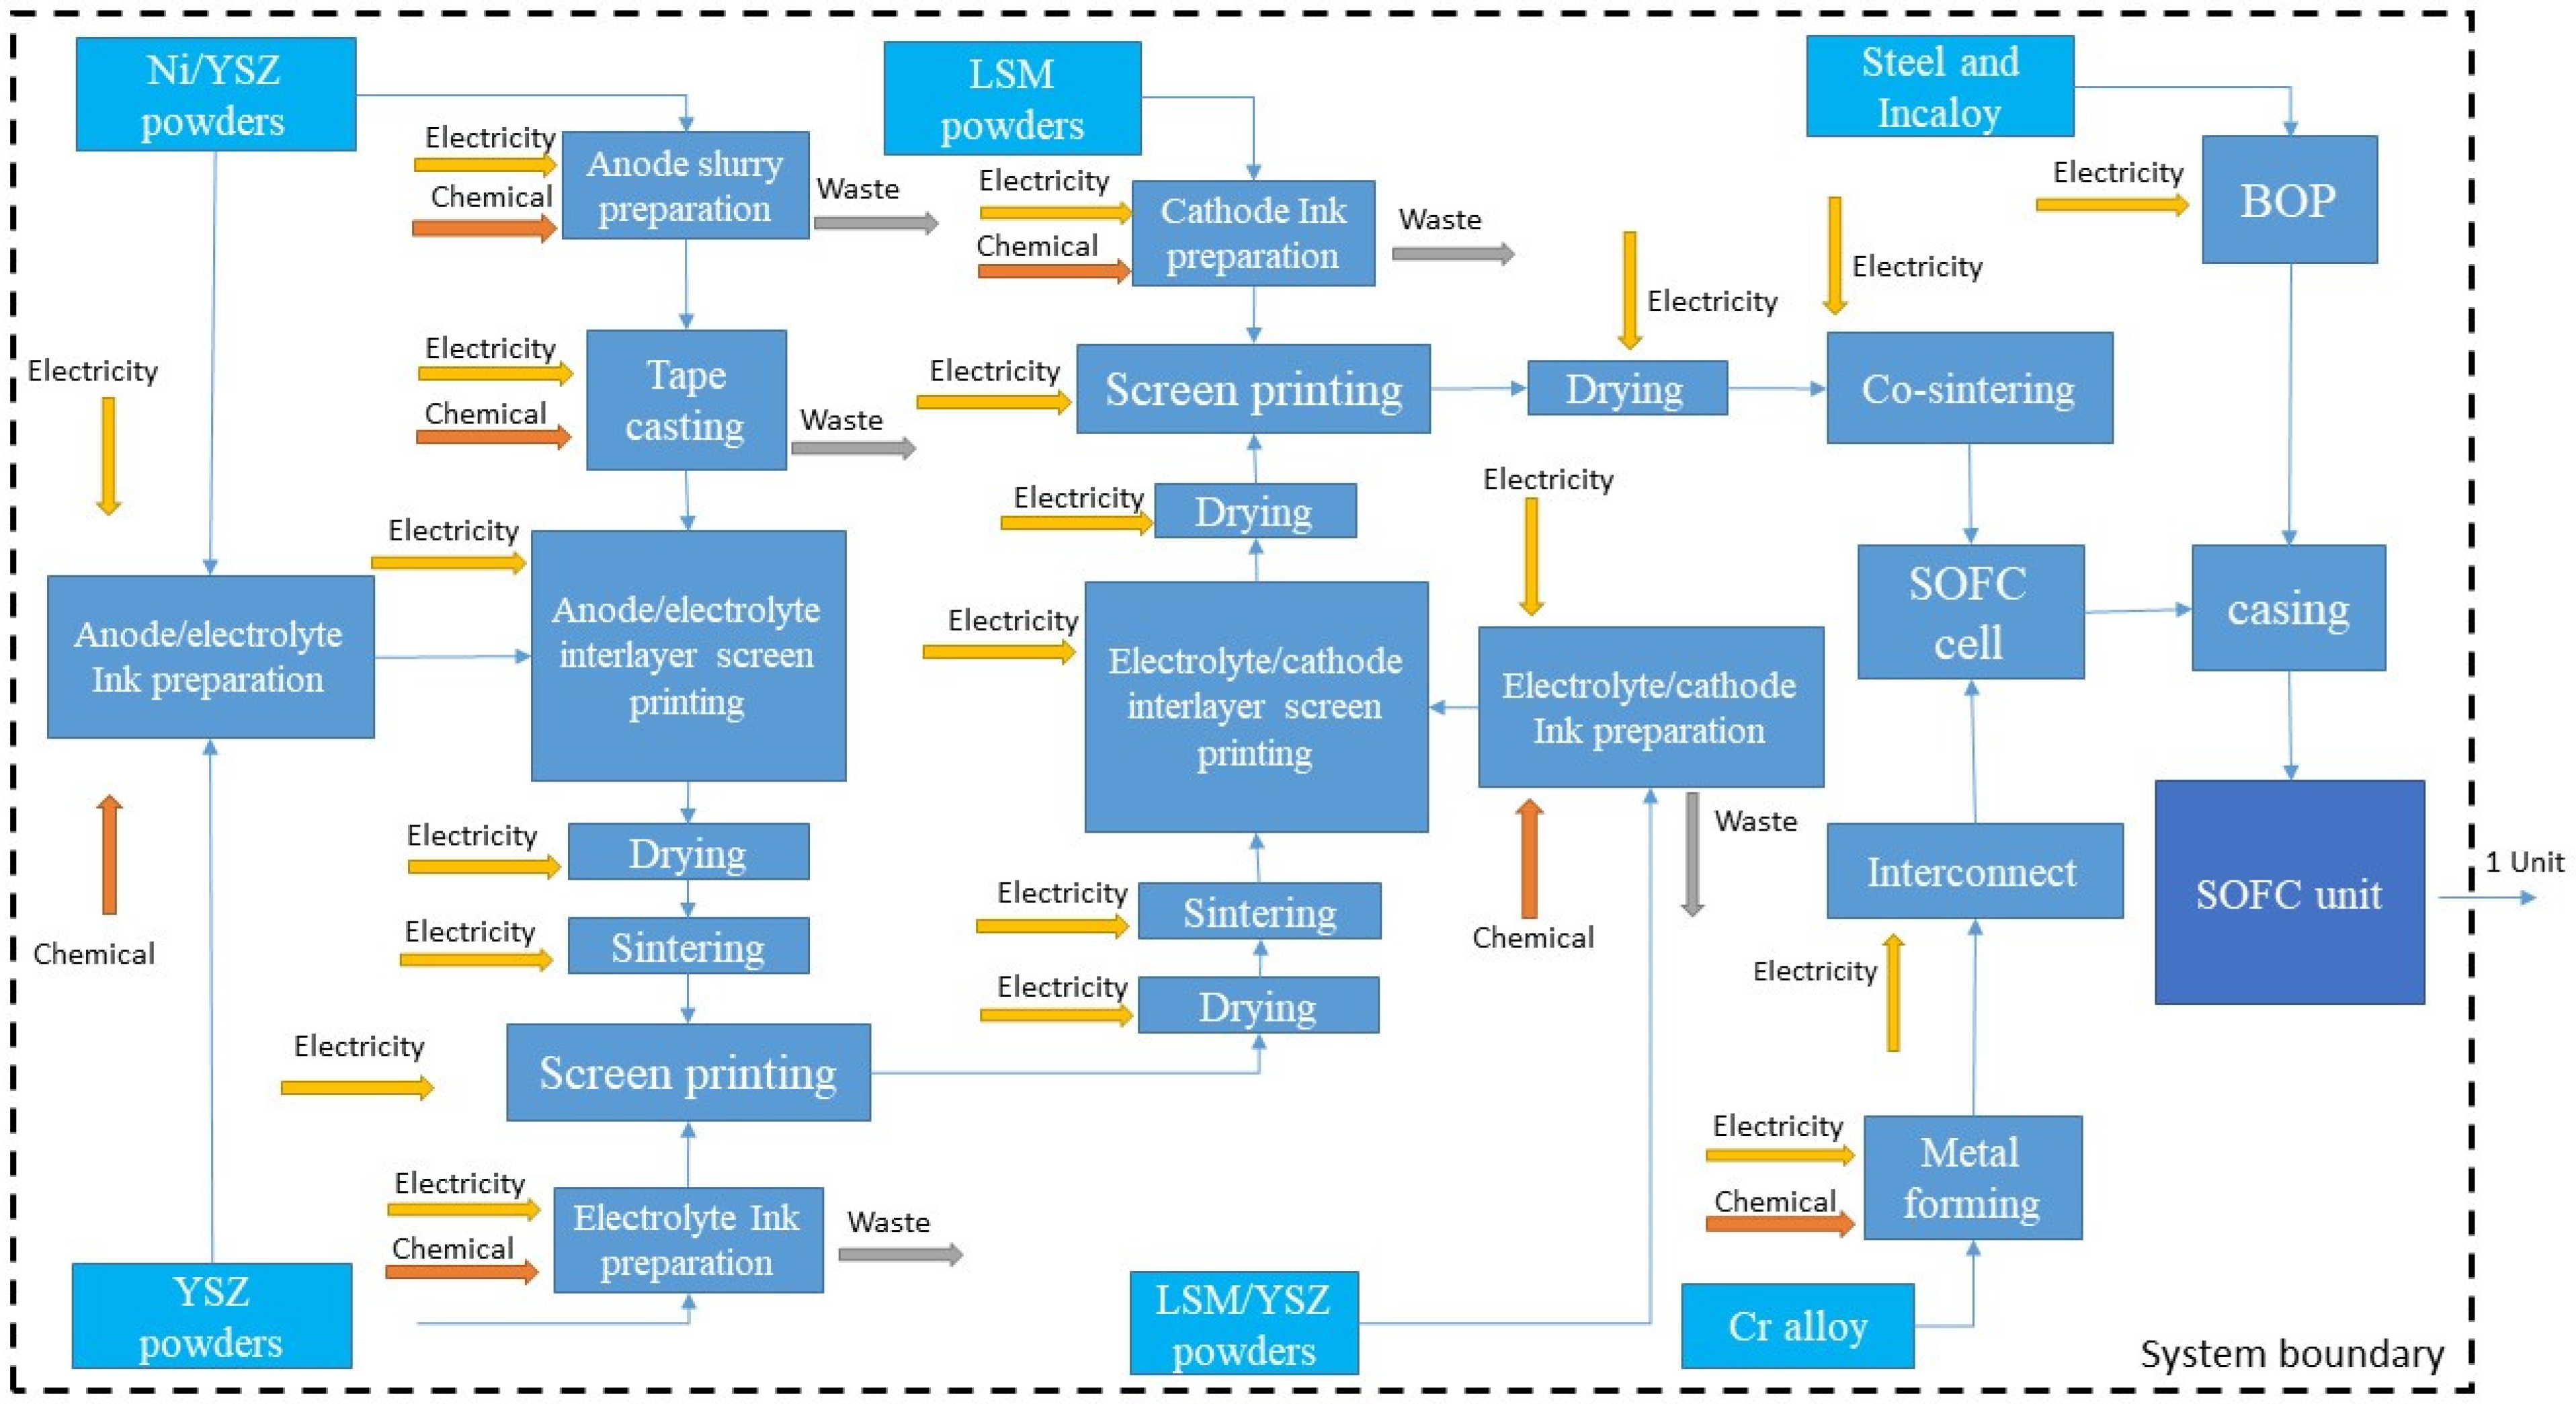
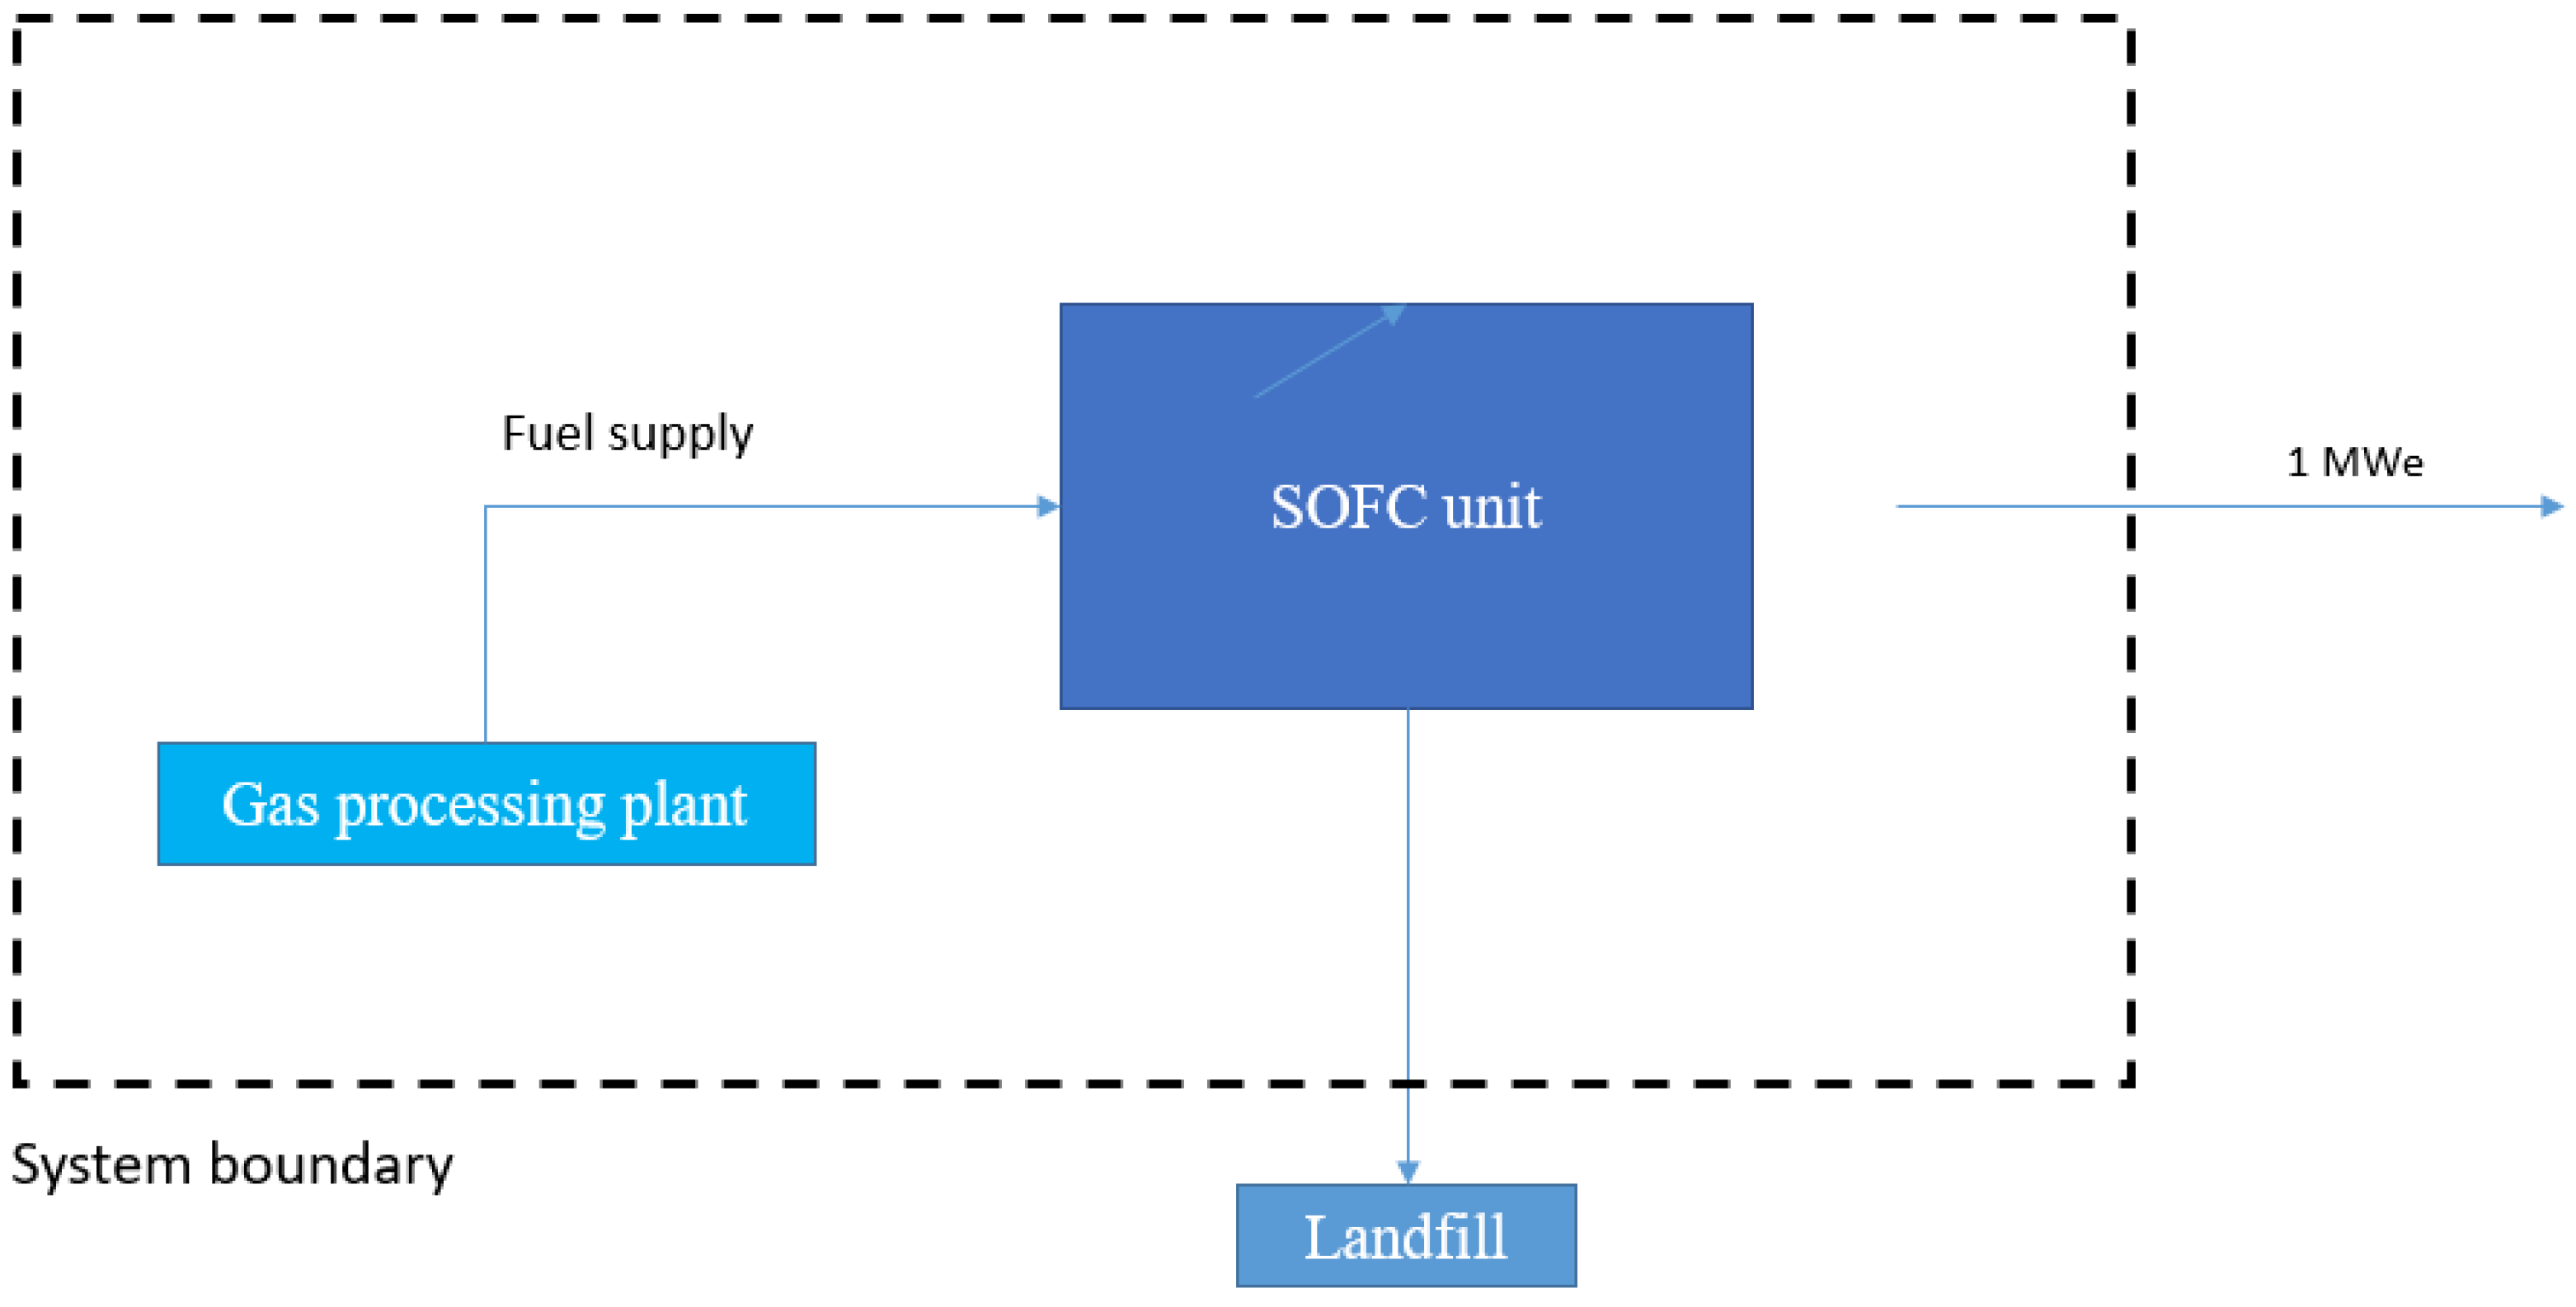
Interpretation is the last stage of the systemic LCA procedure in which the results of the inventory exploration and impact assessments are evaluated for completeness, sensitivity, and consistency. This process also clarifies uncertainties and assumptions regarding improvements to environmental performance while defining further limitations and informing recommendations.

2.1. Goal and Scope

This first phase describes the study’s purpose, scope, allocation procedures, and assumptions or limitations (if any). The system boundaries are defined in this stage, along with the functional unit and the LCIA method.
Defining the FU is not always straightforward, mainly when the product produces several useful outputs, but its selection should reflect the actual condition related to the product and market needs [7]. This helps normalize all inputs (e.g., materials, energy resources, and outputs like heat) and allows for comparative analyses. The FU for SOFCs can be presented in terms of stack power capacity (kW) or total energy output (power plus heat, kWh) if heat is considered a beneficial energy outcome. The unit scale (kWh vs. MWh) will not impact the final results since all emissions outcomes are linear to the chosen FU [24]. Proper unit selection ensures that the LCA results are accurate and improves the outcome and interpretation stages [7].
In this study, the FU was defined as 1 MW of net electricity generated by the SOFC system (and after that utilized by the gas plant) during its service lifespan of 10 years. The study’s scope was to evaluate the potential environmental impacts of integrating and operating a 10 MW SOFC system fueled by natural gas in a gas plant. It was assumed that the rest of the plant (offshore, pipeline, and onshore infrastructure) were not part of the LCA, though the natural gas input as fuel was considered.
The system boundary for the LCA included SOFC manufacturing and operation. End-of-life was not quantitatively defined because insufficient data were available to quantify the disposal or recycling of SOFC materials properly; it can, however, be qualitatively assessed for completeness [6]. Details of the system boundary and the inputs and outputs of each process are given for the manufacturing phase in Figure 2 and the operational phase in Figure 3. Transportation of raw material and natural gas was not considered in this LCA. One crucial assumption is related to the material; since the Gabi software did not have the Yttria-stabilized-zirconia in its database, another type of ceramic, Alumina, was chosen to replace the YSZ in the LCA study.
The detail drawing of the SOFC manufacturing steps as developed in GaBi software is provided in Figure S1.

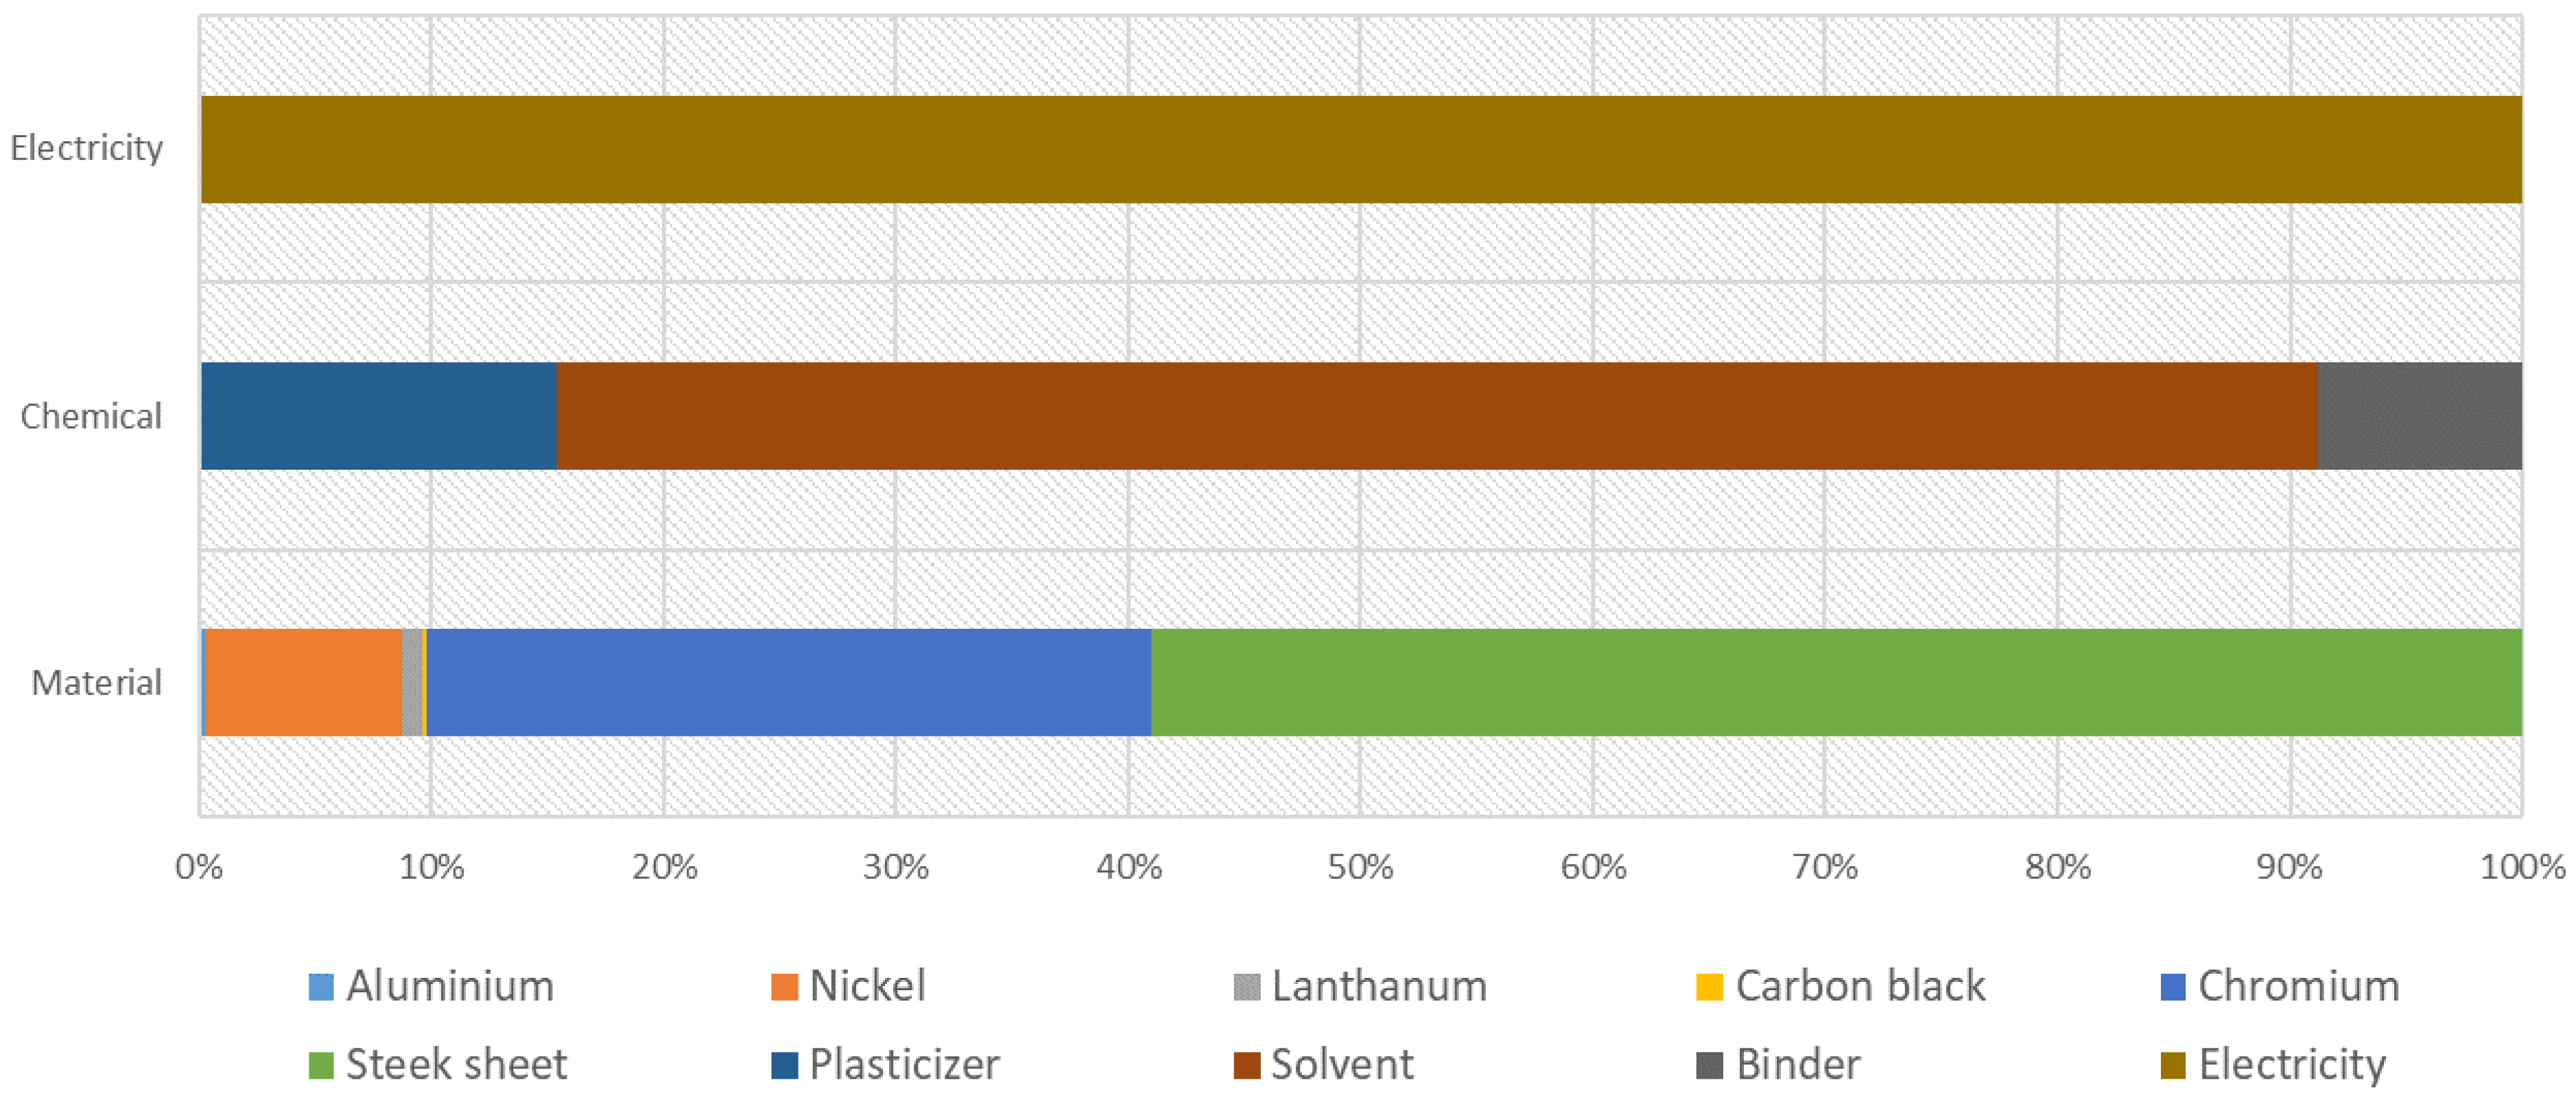
2.2. Life-Cycle Inventory

The LCI collects data from the studied system or product to produce the functional unit. This stage delineates materials, water, and used energy along with waste discharges to air, land, or water (e.g., emissions, wastewater, and solid waste) for all life cycle phases from raw material to operation. Two data types should be considered for SOFC LCIs [8]: foreground and background data. Foreground data are the outcome parameters from SOFC manufacturing and operation, while background data are related to materials and energy used for SOFC production and operation and delivering the FU. Assumptions may be necessary when data are not available or obsolete [1], resulting in uncertainties in the LCI. This is commonly the case for SOFCs, for which material details, energy inputs, and waste data are unavailable due to manufacturer confidentiality.
This study identified three input types (materials, chemicals, and energy) and collected data from previous research [13,24,25,26,27,28,29,30,31]; these were re-calculated to suit the current FU. Table 1 lists the material inventory and quantity required to generate one FU (1 MW).
Table 2 lists the chemicals required for different processes during SOFC cell manufacturing. Most binders and solvents are the same for several functions but use different quantities for each method. Table 3 lists the energy requirements for various processes during SOFC manufacturing. Materials related to the BoP are also part of the manufacturing phase; these are listed in Table 4 with their material type, weight, and power consumption. In addition to inputs, these processes produced primarily waste consisting of CO2 and evaporated solvent. Table 5 shows the amount and quantity of these outputs for all functions during the manufacturing phase.
The detail results of the SOFC LCI data analysis as generated by Gabi software are provided in Table S1.

2.3. Life Cycle Impact Assessment

The LCIA considers the possible footprint concerning LCI flows using either the problem-oriented or damage-oriented approach within a cause-effect structure. Here, impact categories and impact indicators are selected, and characterization models are specified. LCIAs are mainly used to recognize and assess the degree and importance of the potential environmental effects of the product [1].
In this study, the LCIA indicators related to the Global Warming Potential (GWP), Acidification Potential (AP), Eutrophication Potential (EP), Ozone Depletion Potential (ODP), Human Health Particulate Matter Potential (HHPM), and Human-Toxicity Potential (HTP). Table 6 lists all indicators evaluated and their scale boundary.
Impact indicators are typically characterized using the following equation:
Inventory Data × Characterization Factor = Impact Indicators
For GWP, all greenhouse gases are expressed in CO2 equivalents by multiplying the relevant LCI results by a CO2 characterization factor and then combining the resulting impact indicators to determine an overall indicator of GWP. The characterization will put these different quantities of chemicals on an equal scale to provide the impact each one has on global warming.

3. Results

The total LCA results for all impact categories for SOFC manufacturing and operation are detailed in Table 7. The ratios of total emissions between the manufacturing phase and operation phase are shown in Figure 4. The emissions related to GWP, AP, and HHPM occur more readily during the operation phase, while they are more prevalent for EP, ODP, and HTP during the manufacturing phase.
Figure 5 shows the detailed results of the six selected impact categories during the manufacturing phase of the SOFC. Total GWP for all production stages during the manufacturing phase is equal to 703,755 kg CO2 eq. The production of the BoP accounts for 81.41% of the total GWP and the fuel blower process for 74.55%. Therefore, the fuel blower is responsible for 60.7% of total GHG emissions produced during the 1 MW SOFC. For AP, the total emissions are equal to 2000 kg SO2 eq. Out of 24 stages of SOFC manufacturing, two phases of the process account for 70.68%: the fuel blower and slurry preparation, each comprising 40.94% and 29.74%, respectively. The total result for EP is equal to 77 kg N eq. The fuel blower appears to be the stage that most impacts this category at 62.29%. The ODP, the total is 4.38 × 10⁻⁸ kg CFC 11 eq. with 92.15% accounted for the slurry preparation stage. In HHPM, the total result is equal to 103 kg PM2.5 eq. The slurry preparation and fuel blower account for 66.21%, where 39.58% is for slurry preparation and 26.63% for the fuel blower production stage. And finally, the HTP results are equal to 3.51 × 10⁻⁴, where fuel blower and slurry preparations account for 35.60% and 18.39%, respectively.

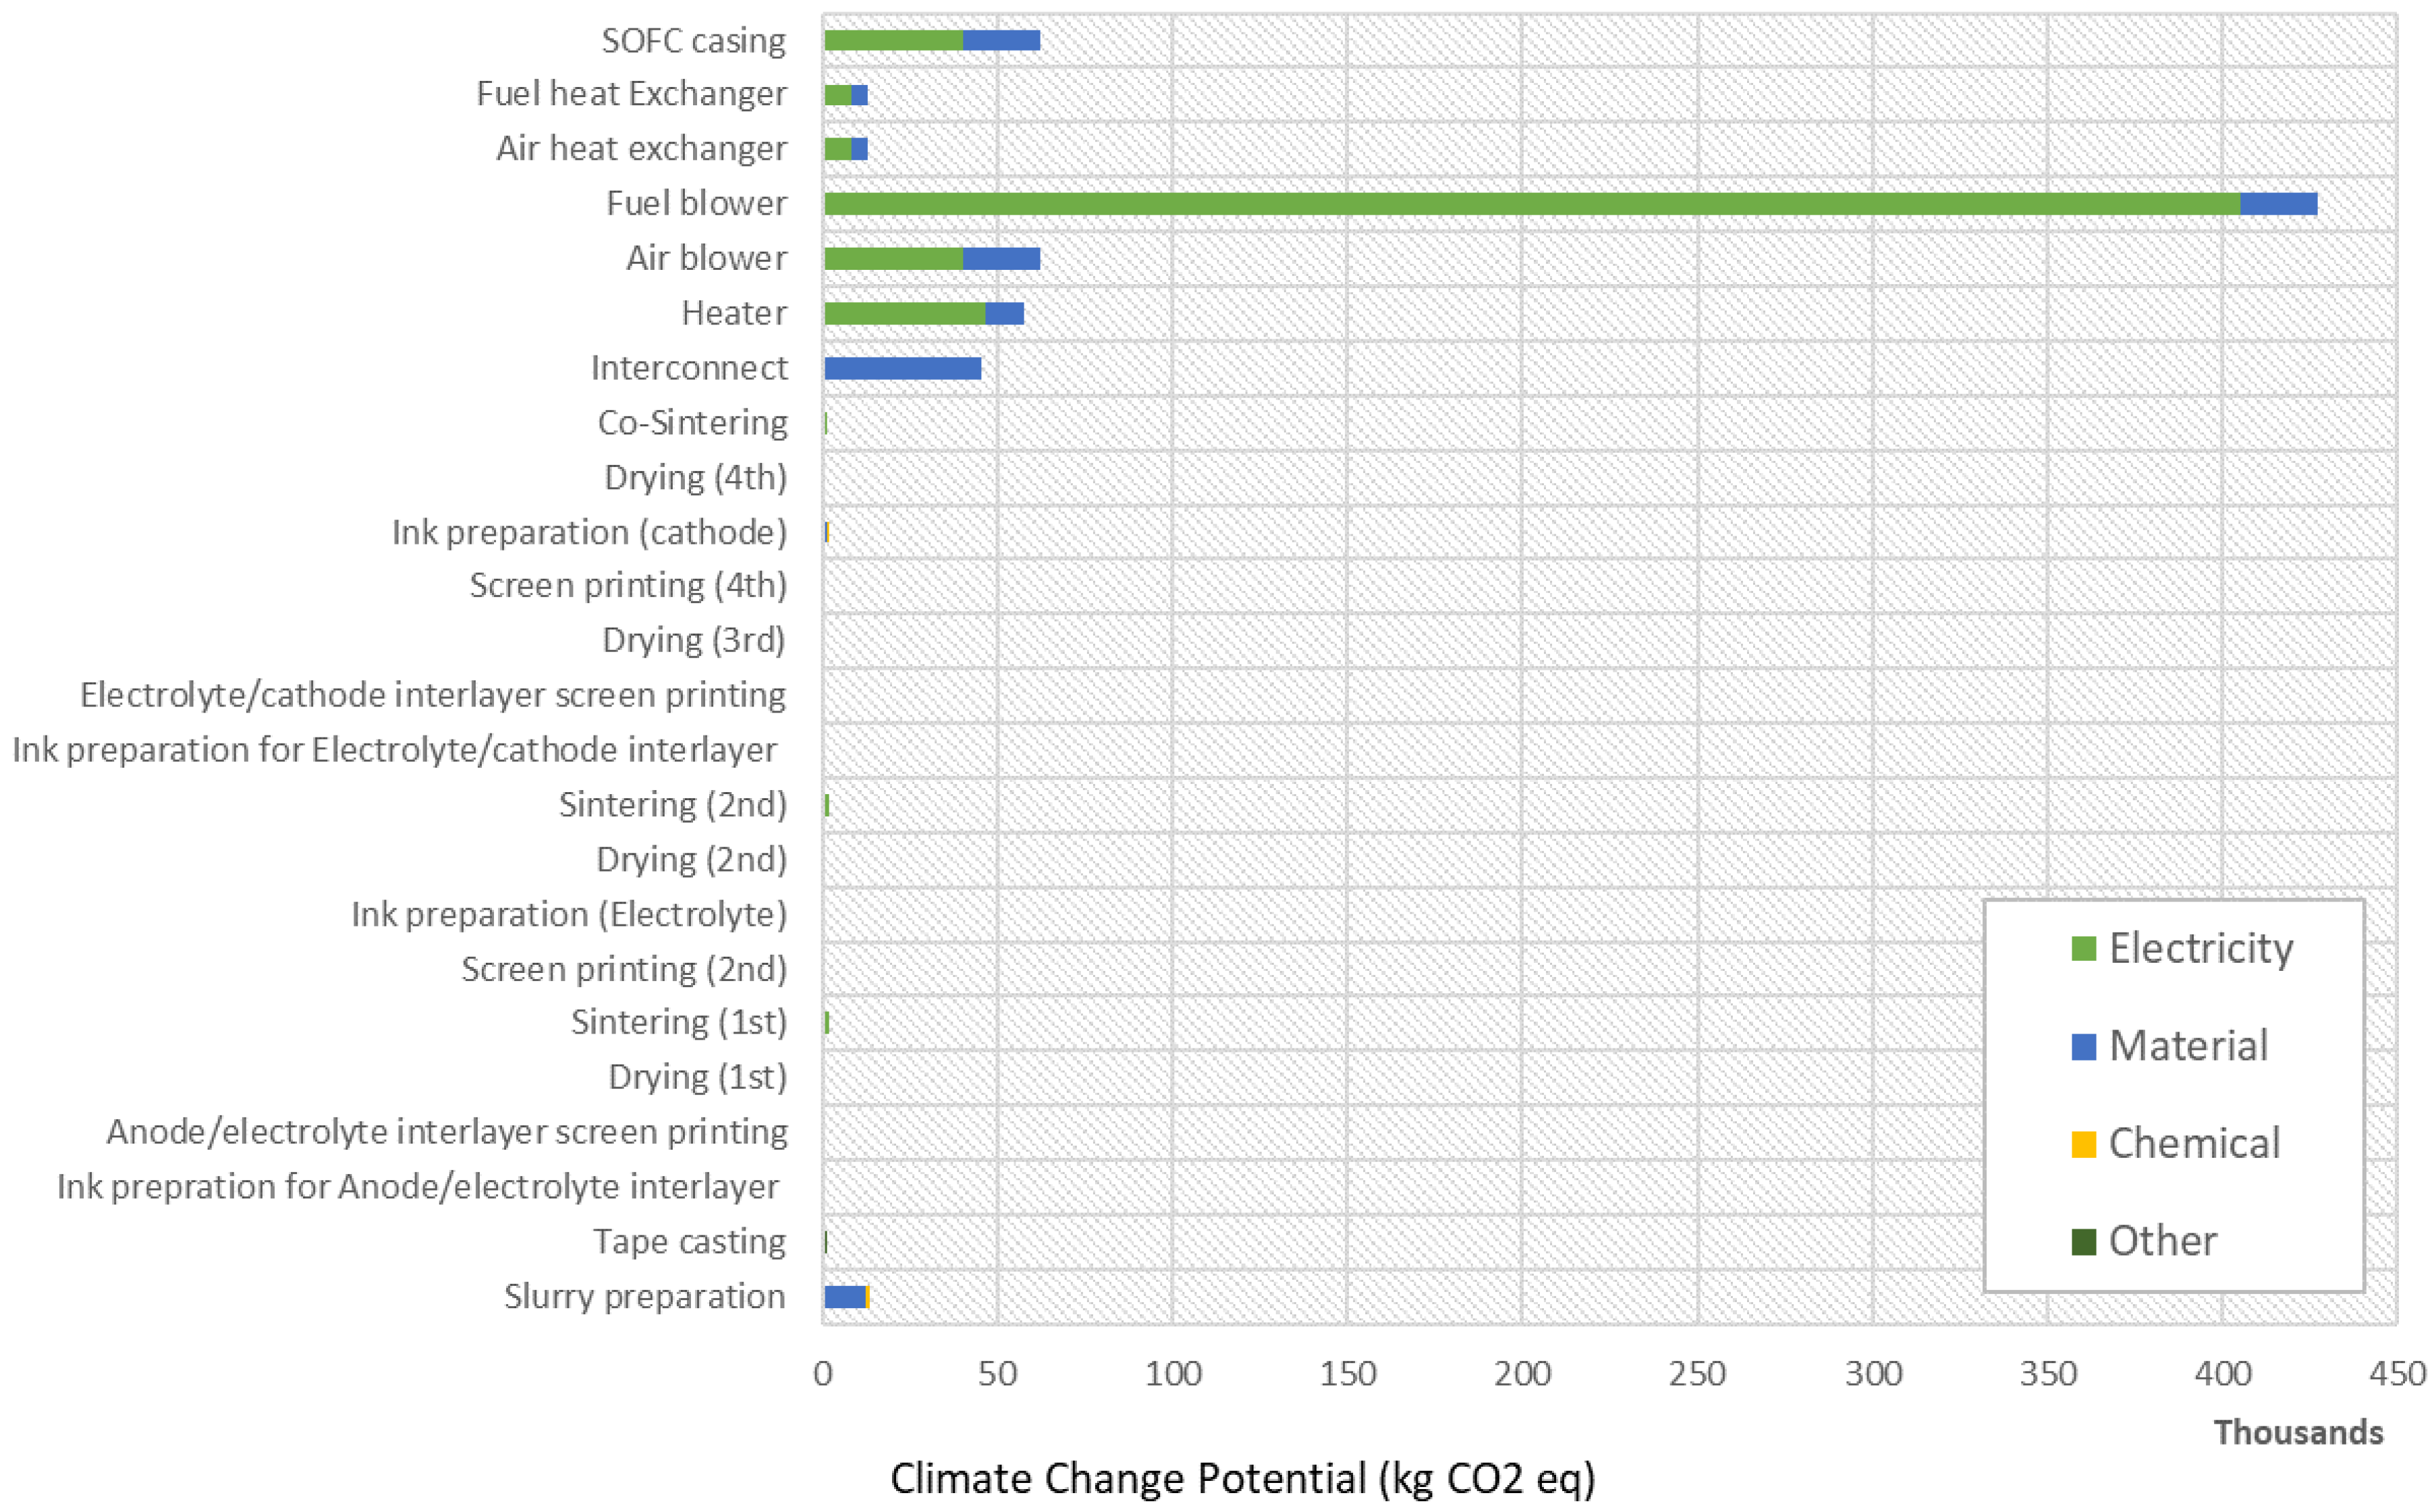
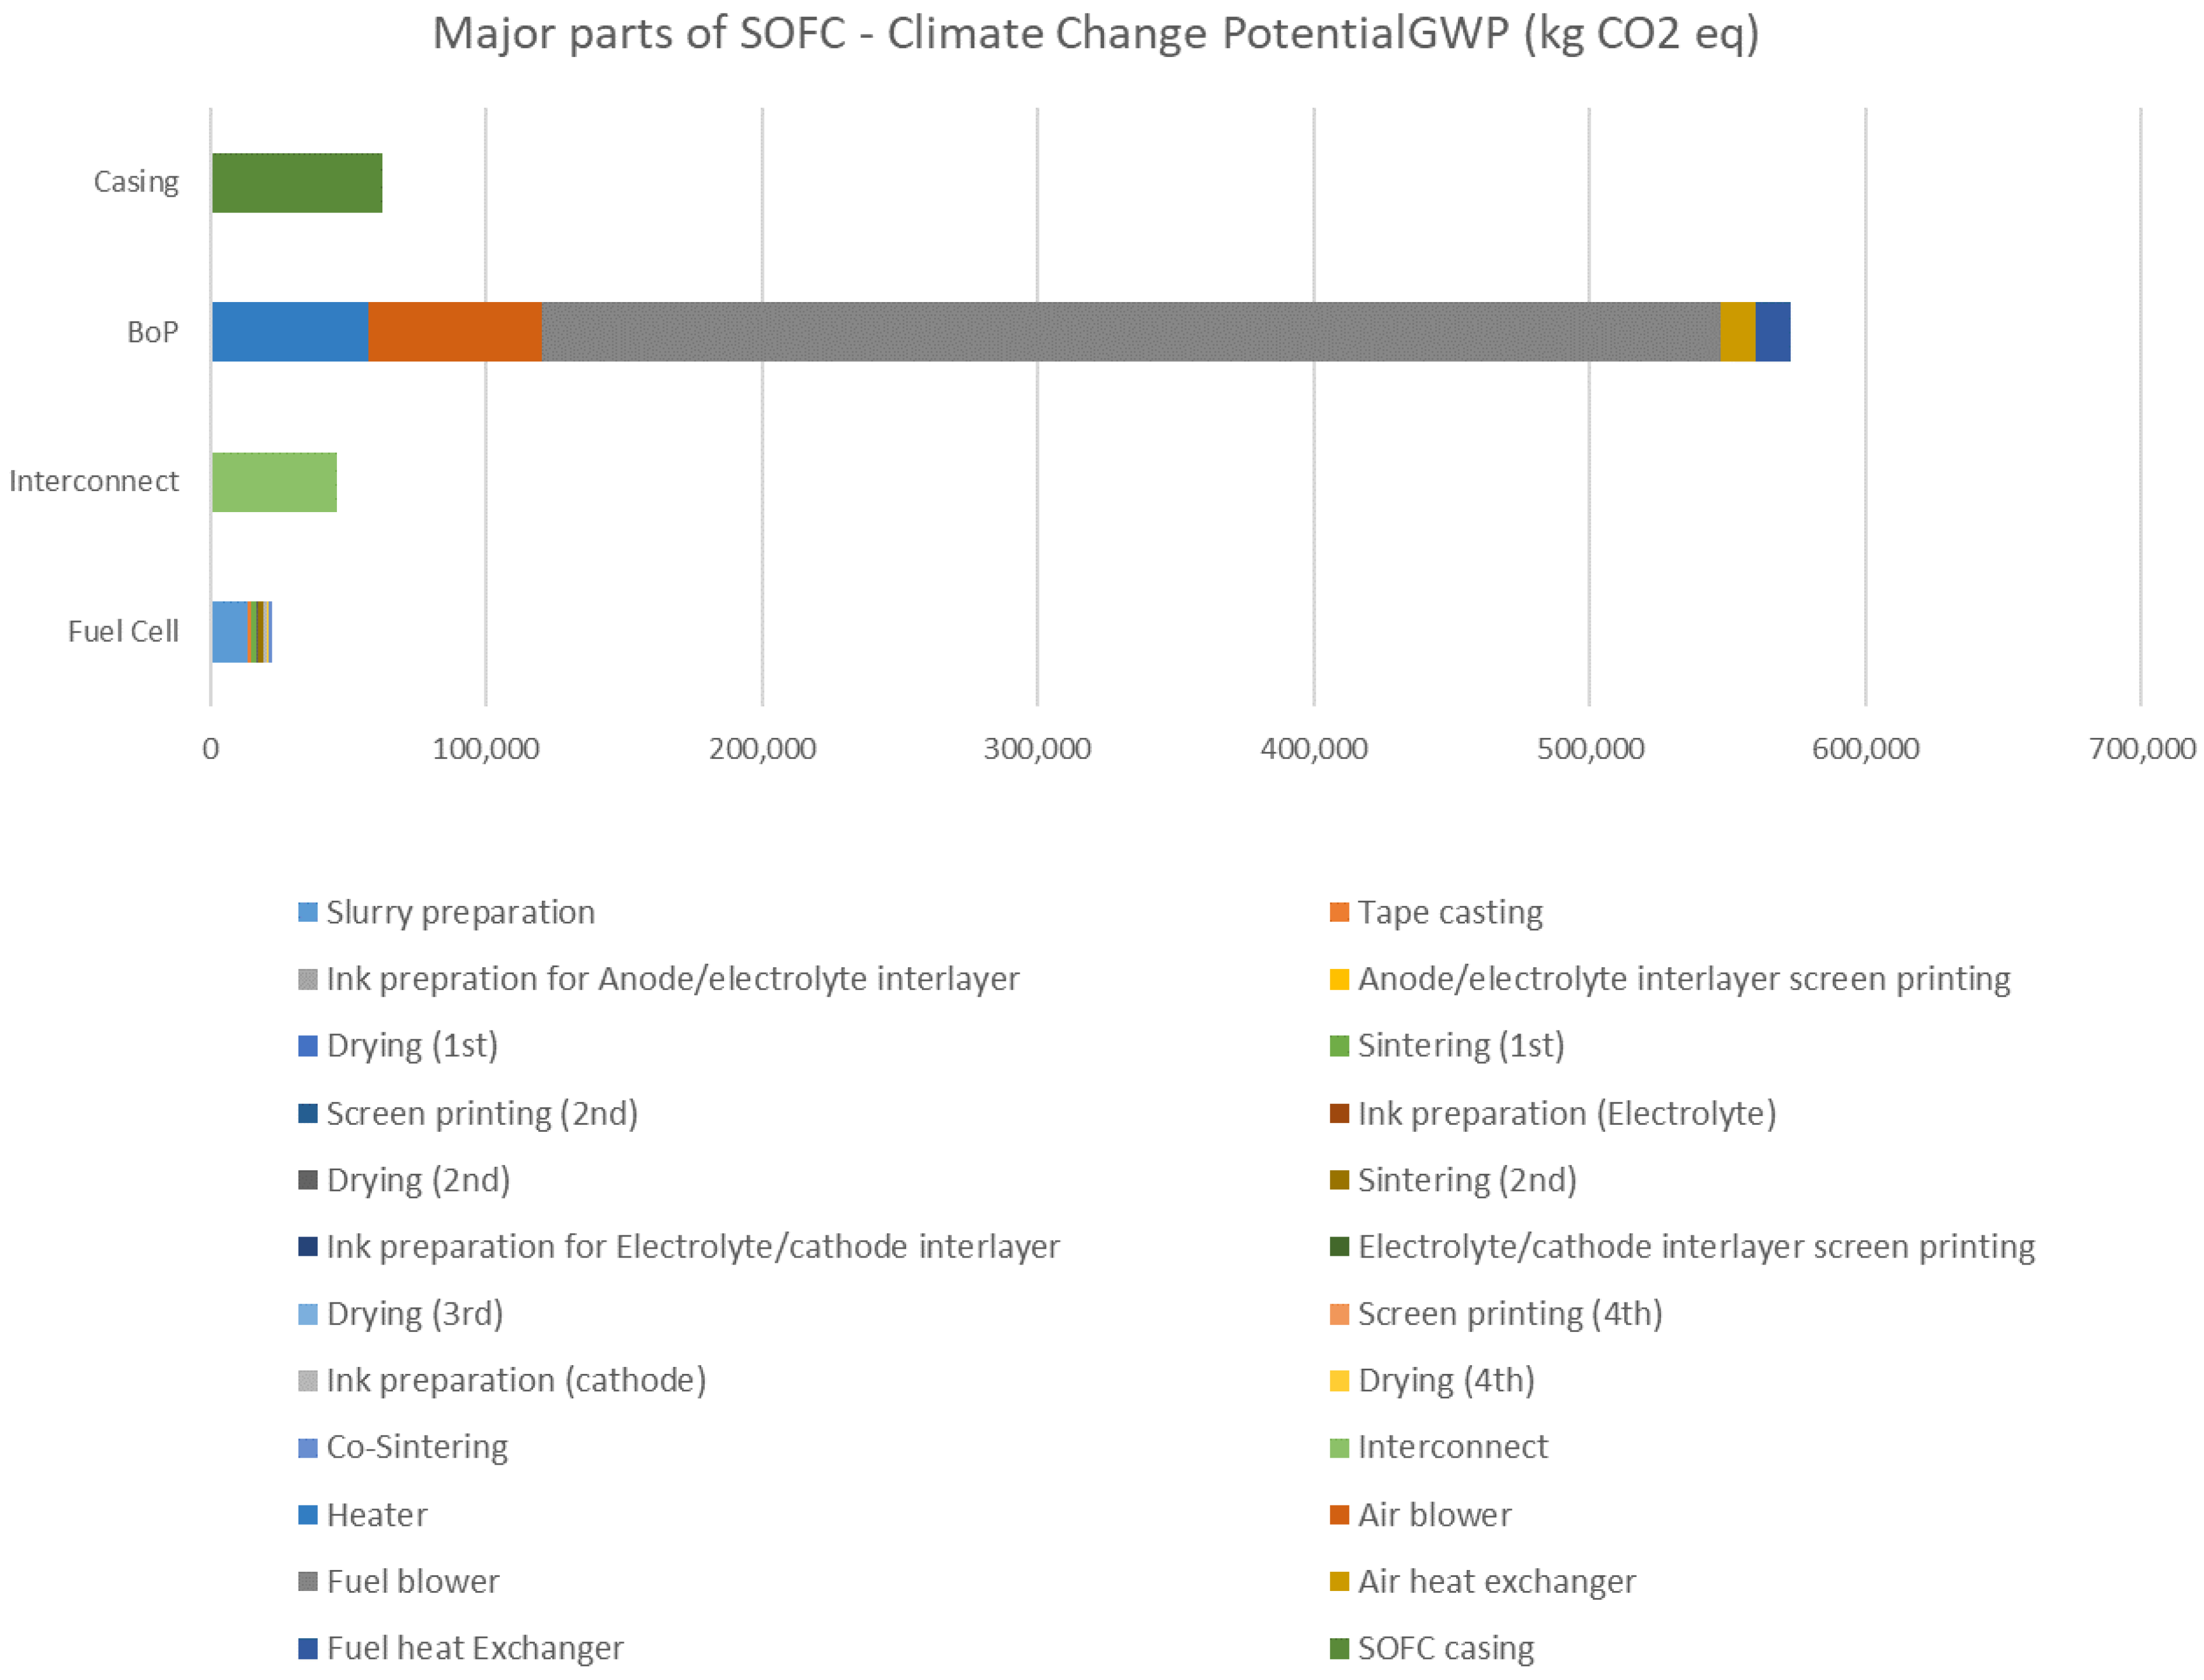
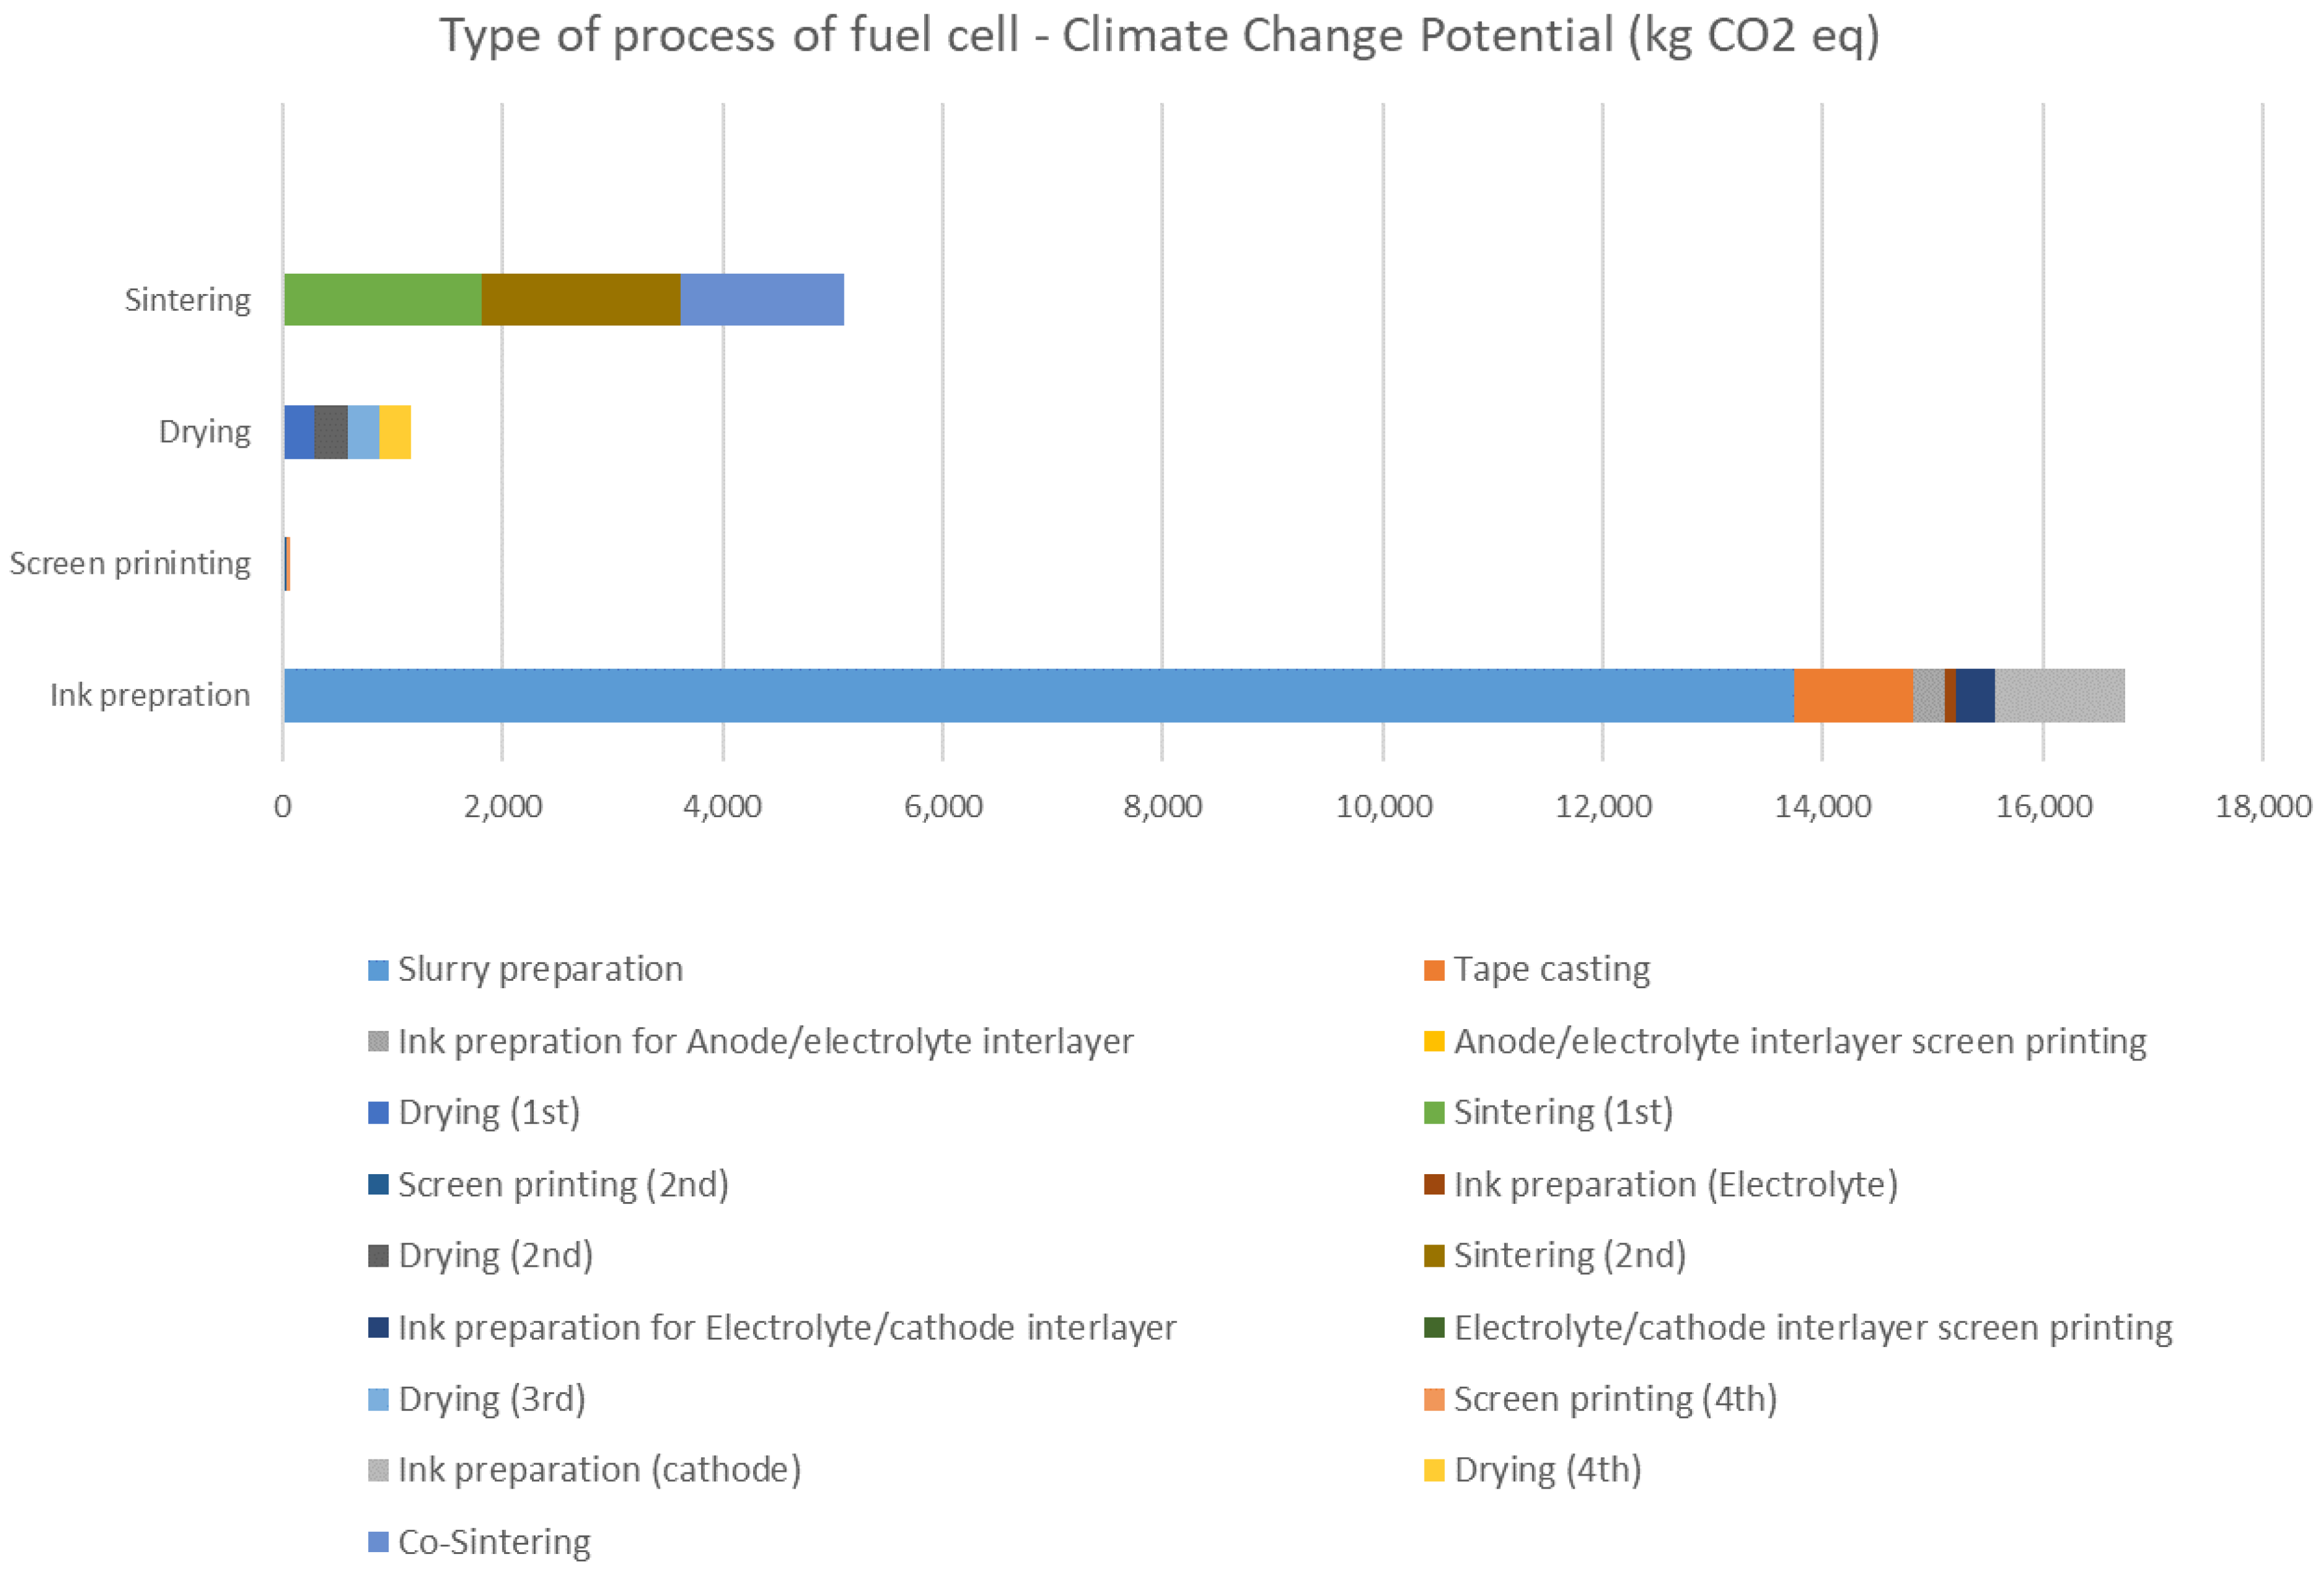
3.1. Global Warming Potential (GWP)

The total climate change emissions for the life span of 10 years or 80,000 h of 1 MW SOFC is 2,415,755 Kg CO2 eq., where 71% is emitted during the operation phase due to the usage of natural gas as fuel for the SOFC. Generating 1 MW of electricity will require 7 MM Btu of natural gas per hour and an operation spanning 80,000 h—this will emit 1.712 MM kg CO2 eq.
The manufacturing phase accounts for the remaining emissions, 703,755 kg CO2 eq., a quantity generated mainly from services and goods used to produce a 1 MW SOFC system. Figure 6, which shows the 24 different processes in the manufacturing phase, proves that most GWP is generated from only eight processes—mainly because of electricity use.
Most processes consuming electricity, and thus the most influential factor in GWP, is the fuel blower process. The material is the most significant source of GWP during the interconnect process. Additionally, Figure 7 shows the primary three services or goods used during the manufacturing phase, and they are scaled for easy comparison.
The chemical most impactful on GWP is the solvent, with more than 70% of GWP generated due to using chemicals in the manufacturing phase, and the least is the binder, with 15%. The material that most contributes to GWP is the steel sheet, with almost 60%, followed by the Chromium, with 30%. The remaining 10% of material usage is mainly nickel.
The SOFC consists of four main parts, where each one is manufactured as a standalone piece before being assembled. Figure 8 shows these four main parts and their contributions to the GWP.
The BoP is the component of SOFC that generates the highest GWP at 572,920 kg CO2 eq, which is 81% of the total GWP of the manufacturing phase, and the fuel blower is the aspect of the BoP that most contributes to the GWP at 427,100 kg CO2 eq. This represents 60% of the emissions from the manufacturing phase. Following BoP is the casing, then interconnect, and the last is the fuel cell itself with 22,498 kg CO2 eq., which represents less than 1% of the total GWP of the SOFC.
Another potential analysis is the primary type of process for the fuel cell. Figure 9 shows these processes and contributions of each one of them concerning the GWP. The ink preparation is the type of process that contributes the most to the GWP with 16,649 kg CO2 eq. It accounts for 75% of GWP’s fuel cell manufacturing. Slurry preparation for the anode is 82% of all GWP generated from the ink preparation process of fuel cell manufacturing. The type of process in fuel cell manufacturing that provides the second-largest contribution of GWP is the sintering process, followed by drying—each accounting for 22% and 5%, respectively.
The average hourly GHG of the 1 MW SOFC is approximately 30 kg CO2 eq. /MWh. By contrast, traditional power generation, like Natural Gas Combined Cycle (NGCC), is between 417 kg CO2 eq. /MWh and 557 kg CO2 eq./MWh [32,33]. There is a difference in the LCA life span of each technology. The SOFC life span lasts ten years, while the NGCC life span lasts approximately 30 years. By replacing the SOFC each year, the total GHG emissions will be around 90 kg CO2 eq. /MWh, which remains below the GHG emissions of the NGCC. Thus, SOFC technology produces 80% fewer GHGs than traditional power generations.

3.2. Sensitivity Analysis

The process contributing most substantially to the GWP in the manufacturing phase is the fuel blower, which accounts for 60% of emissions generated during the manufacturing phase. The fuel blower is mainly used to increase the fuel pressure, in this case, methane, to meet the SOFC operating pressure of approximately 7 bar. However, suppose the SOFC is being used in a gas processing plant. In that case, the fuel gas compressor is already available, and the 7-bar pressure exists in the plant, leaving no need for a separate or dedicated compressor for the SOFC fuel. Eliminating the need for the fuel blower from BoP assembly of the SOFC unit will reduce the overall GWP of SOFC by 17%, and the total emissions will be below 2 MM kg CO2 eq. The percentage GWP during the manufacturing phase dropped from 29% to 14%, while the operation GWP remains the same at 1.712 MM kg CO2 eq.
Geography and location play a role in the SOFC manufacturing process—indeed, the LCA of the SOFC found that the impact on total climate change is based on the electricity mix used in each location. In general, the effect is minimal and not particularly significant in the manufacturing phase. However, there is a substantial difference in GWP from one country to another during the operation phase. This is mainly caused by natural gas, used as a fuel for SOFC during the operation phase to generate the 1 MW power. Figure 10 shows the total GWP of 1 MW SOFC in four different countries.
Because of natural gas resources, Qatar has the least GWP compared to other countries like Germany, the US, and Japan. The natural gas in Germany is mainly imported via pipelines from Russia, so the transportation of such resources is added to its total GWP. Similarly, in the US, the pipeline network of natural gas spread across the country. Japan, which has an enormous GWP impact, gets its natural gas requirement from ships and overseas tankers.

4. Conclusions

This study’s primary objectives were to understand better the impact of SOFC integration on the natural gas processing plant in terms of environmental values and provide a basis for comparing different types of integration approaches in gas processing plants.
The operational phase of the SOFC has the most significant impact on global warming potential (GWP), acidification potential (AP), and human health particulate matter (HHPM). In contrast, the effect is higher during the manufacturing phase for eutrophication potential (EP), ozone depletion (ODP), and human-toxicity potential (HTP).
In summary, 1 MW SOFC used in gas processing plants for 80,000 total running hours (10 years) will have the following impact category:
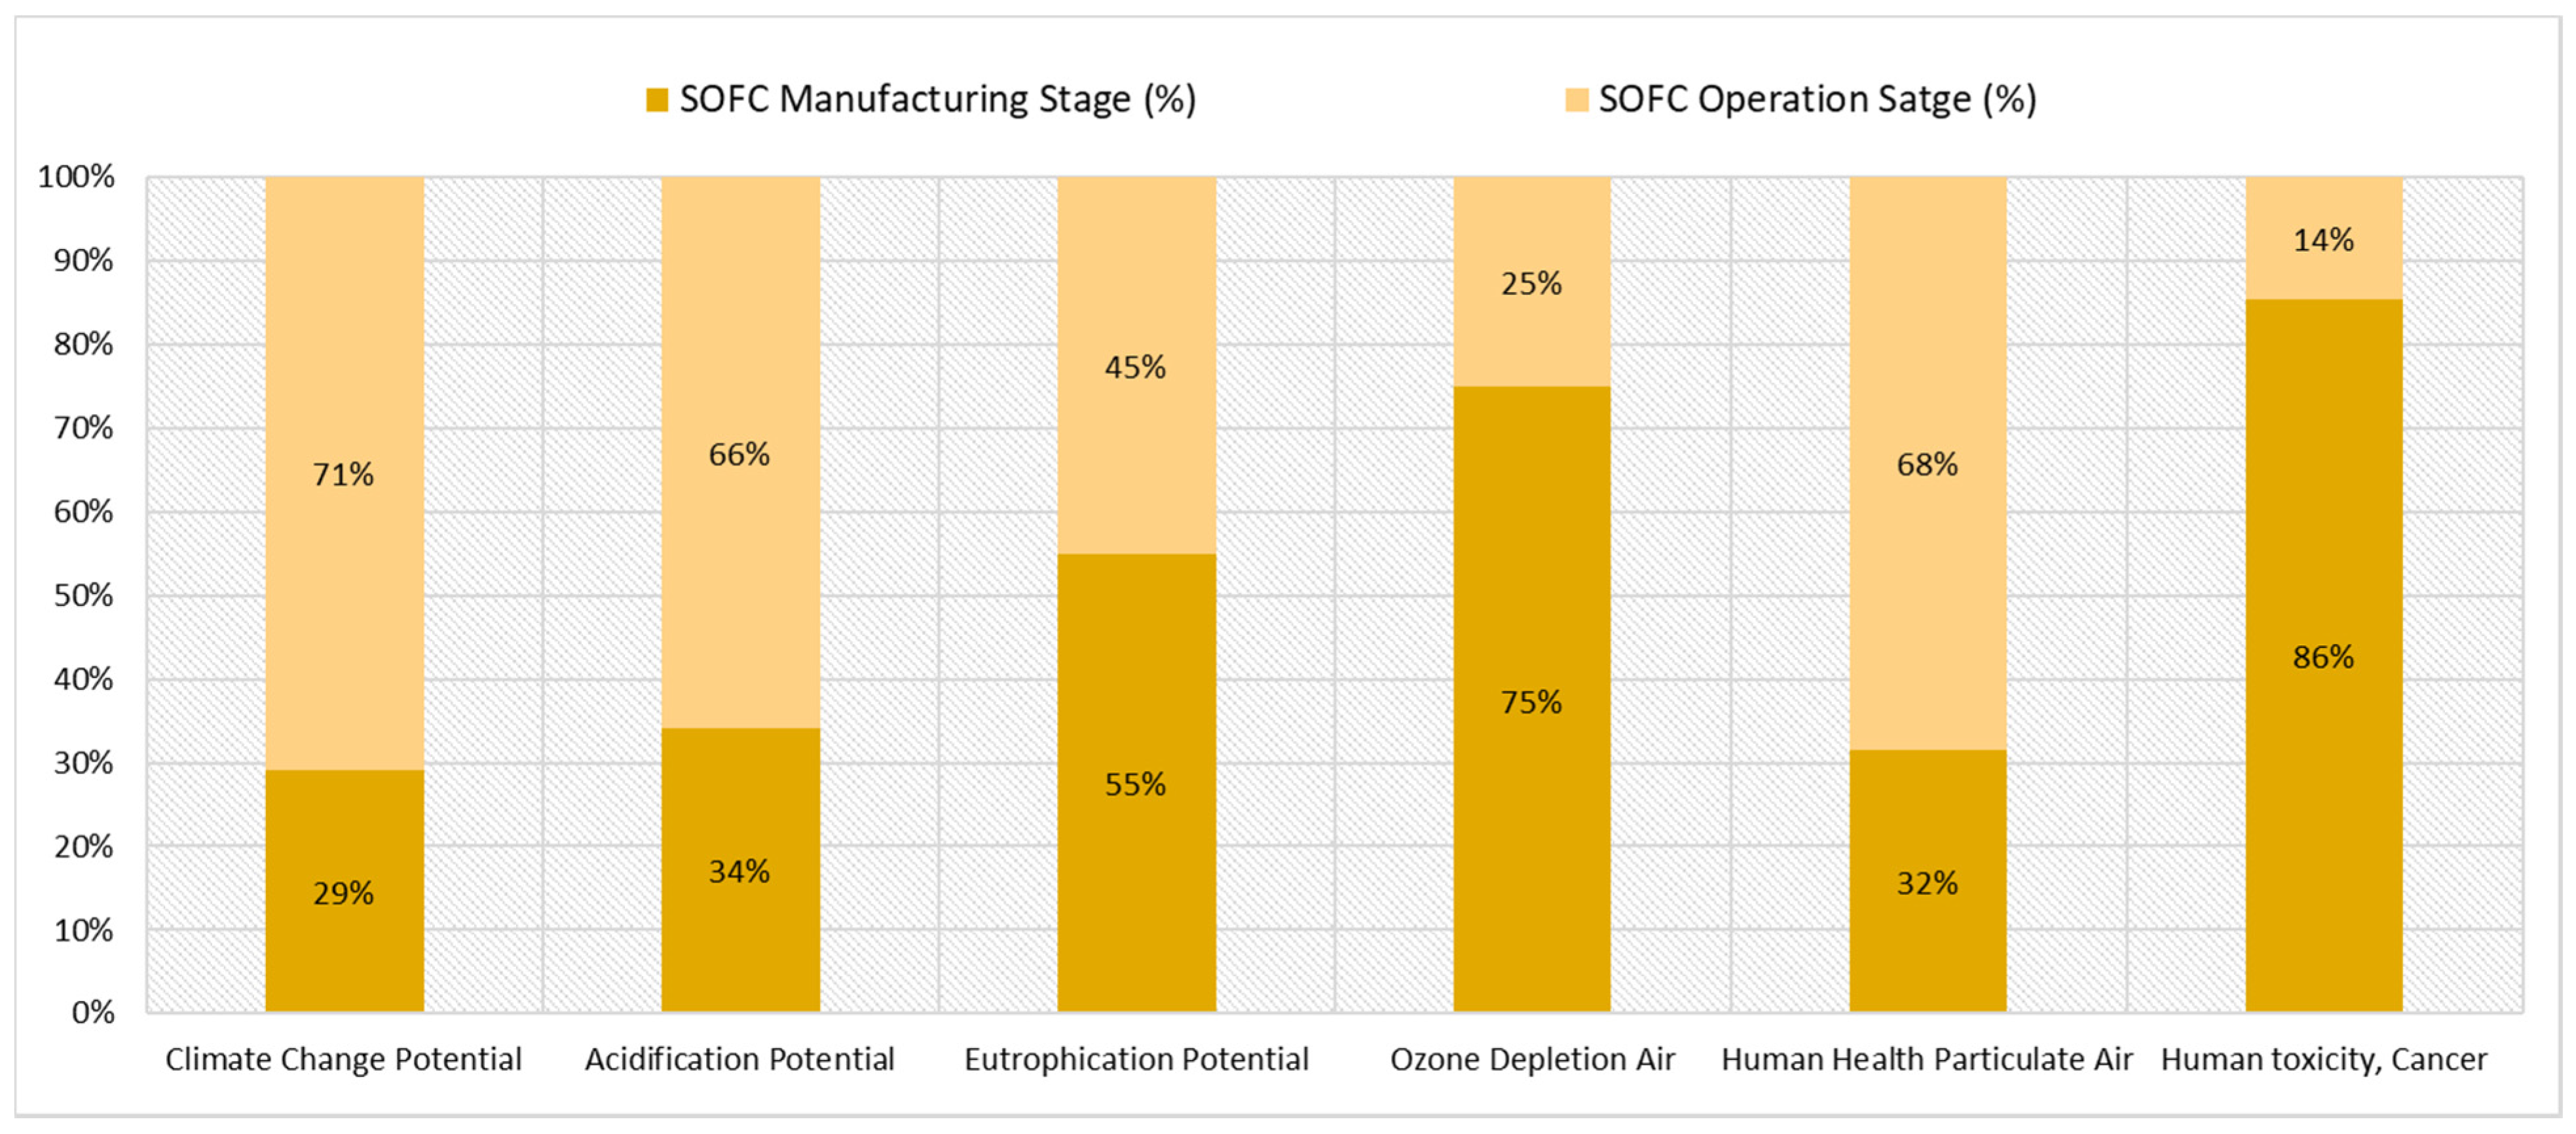
  • The total GWP is 2,415,755 kg CO2 eq. with 29% during the manufacturing phase.
  • Total AP is 5848 kg SO2 eq. with 34% during manufacturing.
  • Total EP is 141 kg N eq. with 55% during manufacturing.
  • Total Ozone Depletion Air is 5.84 × 10⁻⁸ kg CFC 11 eq. with 75% during manufacturing.
  • Total Human Health Particulate Air is 326 kg PM2.5 eq. with 32% during manufacturing.
  • Total Human Toxicity, Cancer is 4.10 × 10⁻⁴ CTUh with 86% during manufacturing.
The study results are supported by similar studies where the ratio between the manufacturing phases is almost 30 to 70 in the operation phase for GWP. The GWP during the manufacturing stage for the Qatar case is almost like manufacturing cases in other countries like the US, Germany, and Japan. It is a little higher than the US and Germany but less than Japan, which could be due to the availability and transportation of raw materials. However, for the operation phase, the difference is huge between Qatar and the other three countries. This is mainly due to fuel transportation which in the case of Qatar it is the lowest environmental impact. In addition, there is potential to reduce the total emissions produced by the SOFC if specific processes with the highest impact on climate change potential can be eliminated. For example, pressurized methane is already available in typical natural gas processing plants. Thus, an advantage of using SOFC in gas plants and particularly in Qatar by eliminating the requirement of having an additional fuel blower as part of SOFC assembly will save approximately 17% of the total GHG of SOFC LCA.
The hourly GHG released into the atmosphere for each 1 MW of electricity generated using SOFC is approximately 30 kg of CO2 eq. Comparing CO2 eq. to the emissions emitted from traditional power generation like Natural Gas Combined Cycle (NGCC), the difference is more than 80%. And this proves that fossil-fuel power generation’s impact on the environment depends on the technology used. As fossil fuel remains the primary energy source for at least a few decades to come, such a study of LCA can determine the best technology that has less impact on the environment and has lower GWP.
Qatar is a small country with the largest natural gas resources and exports, which gives it a high dependence on natural gas for its revenues and a high GHG emissions per capita. Therefore, SOFC integration can lead to significant country-wide reductions in emissions improvements to efficiency.
The findings of this study are expected to serve as a reference for future researchers interested in the integration of SOFCs into natural gas processing plants and provide decision-makers with reliable quantitative analysis and data.

Supplementary Materials

The following are available online at https://www.mdpi.com/article/10.3390/en14154668/s1, Figure S1: SOFC manufacturing steps with quantities, Table S1: SOFC LCI data analysis.

Author Contributions

Conceptualization, K.A.-K.; Data curation, K.A.-K.; Formal analysis, K.A.-K.; Methodology, S.G.A.-G.; Supervision, M.K.; Validation, S.B.; Visualization, K.A.-K.; Writing—original draft, K.A.-K.; Writing—review & editing, S.G.A.-G. All authors have read and agreed to the published version of the manuscript.

Funding

This research received no external funding.

Informed Consent Statement

Not applicable.

Acknowledgments

The authors would like to acknowledge the support of Hamad Bin Khalifa University, Qatar.

Conflicts of Interest

The authors declare no conflict of interest.

Nomenclature

ADPAbiotic depletion potential
AOPArea of production
APAcidification potential
APUAuxiliary power unit
BoPBalance of plants
CH4Methane
COCarbon monoxide
CO2Carbone dioxide
CTUhComparative Toxic Unit for human
EPEutrophication potential
FUFunctional unit
GHGGreenhouse gases
GTGas turbine
GTLGas-to-liquid
GWPGlobal warming potential
H2Hydrogen
H2OWater
H2SHydrogen sulfide
HHPMHuman Health Particulate Matter Potential
HTPHuman-Toxicity Potential
IPCCIntergovernmental Panel on Climate Change
ISOInternational Standard Organization
KwKilowatt
kWhKilowatt-hour
LC50Lethal concentration required to kill 50% of the population
LCALife cycle assessment
LCILife cycle impact
LCIALife cycle impact assessment
LSMLanthanum strontium manganite
MGTMicro gas turbine
MWMegawatt
N2Nitrogen
N2ONitrous oxide
NGCCNatural gas combined cycle
NiNickel
NiONickel oxide
NMHCsNonmethane hydrocarbons
NOxNitrogen oxides
ODPOzone depletion potential
PEPProduct environmental profile
PMParticulate matter
POCPPhotochemical ozone creation potential
PtPlatinum
PVPhotovoltaic
SETACSociety for Environmental Toxicology and Chemistry
SO2Sulfur dioxide
SOFCSolid oxide fuel cell
SOxSulfur oxides
VOCVolatile organic compounds
YSZYttria-stabilized-zirconia

References

  1. Yu, K.M.K.; Curcic, I.; Gabriel, J.; Tsang, S.C.E. Recent Advances in CO2 Capture and Utilization. ChemSusChem 2008, 1, 893–899. [Google Scholar] [CrossRef]
  2. Weldu, Y.W.; Assefa, G. Evaluating the environmental sustainability of biomass-based energy strategy: Using an impact matrix framework. Environ. Impact Assess. Rev. 2016, 60, 75–82. [Google Scholar] [CrossRef]
  3. Langlois, E.V.; Campbell, K.; Prieur-Richard, A.H.; Karesh, W.B.; Daszak, P. Towards a better integration of global health and biodiversity in the new sustainable development goals beyond Rio+20. Ecohealth 2012, 9, 381–385. [Google Scholar] [CrossRef]
  4. Jewell, J. Ready for nuclear energy?: An assessment of capacities and motivations for launching new national nuclear power programs. Energy Policy 2011, 39, 1041–1055. [Google Scholar] [CrossRef]
  5. Al-Khori, K.; Bicer, Y.; Koc, M. Integration of Solid Oxide Fuel Cells into Oil and Gas Operations: Needs, Opportunities, and Challenges. J. Clean. Prod. 2020, 245, 118924. [Google Scholar] [CrossRef]
  6. Grubert, E. Implicit prioritization in life cycle assessment: Text mining and detecting metapatterns in the literature. Int. J. Life Cycle Assess. 2016, 22, 148–158. [Google Scholar] [CrossRef]
  7. Mehmeti, A.; Mcphail, S.J.; Pumiglia, D.; Carlini, M. Life cycle sustainability of solid oxide fuel cells: From methodological aspects to system implications. J. Power Sources 2016, 325, 772–785. [Google Scholar] [CrossRef]
  8. Baratto, F.; Diwekar, U.M. Life cycle assessment of fuel cell-based APUs. J. Power Source 2010, 139, 188–196. [Google Scholar] [CrossRef]
  9. Herron, S. Life Cycle Assessment of Residential Solid Oxide Fuel Cells Life; Arizona State University: Tempe, AZ, USA, 2012; Available online: https://repository.asu.edu/attachments/82943/content/ASU_SSEBE_CESEM_2012_CPR_001.pdf (accessed on 7 July 2021).
  10. Lee, Y.D.; Ahn, K.Y.; Morosuk, T.; Tsatsaronis, G. Environmental impact assessment of a solid-oxide fuel-cell-based combined-heat-and-power-generation system. Energy 2015, 79, 455–466. [Google Scholar] [CrossRef]
  11. Guine, J.B. Selection of impact categories and classification of LCI results to impact categories. In Life Cycle Impact Assessment; Springer: Berlin/Heidelberg, Germany, 2015. [Google Scholar] [CrossRef] [Green Version]
  12. Buchgeister, J. Comparison of Sophisticated Life Cycle Impact Assessment Methods for Assessing Environmental Impacts in a LCA Study of Electricity Production; Firenze University Press: Firenze, Italy, 2015. [Google Scholar]
  13. Hart, H.; Brandon, N.; Shemilt, J. The environmental impact of solid oxide fuel cell manufacturing. Fuel Cells Bull. 1999, 2, 4–7. [Google Scholar] [CrossRef]
  14. Jakob, M.; Hirschberg, S. Total Greenhouse Gas Emissions and Costs of Alternative Swiss Energy Supply Strategies. 2001. Available online: https://www.researchgate.net/profile/Martin-Jakob-2/publication/253789416_Total_greenhouse_gas_emissions_and_costs_of_alternative_Swiss_energy_supply_strategies/links/00b7d529e481e28e68000000/Total-greenhouse-gas-emissions-and-costs-of-alternative-Swiss-energy-supply-strategies.pdf (accessed on 17 July 2021).
  15. Cánovas, A.; Zah, R.; Gassó, S. Comparative Life-Cycle Assessment of Residential Heating Systems, Focused on Solid Oxide Fuel Cells. Sustain. Energy Build. 2013, 659–668. [Google Scholar] [CrossRef]
  16. Staffell, I.; Ingram, A.; Kendall, K. Energy and carbon payback times for solid oxide fuel cell based domestic CHP. Int. J. Hydrogen Energy 2012, 37, 2509–2523. [Google Scholar] [CrossRef]
  17. Strazza, C.; Del Borghi, A.; Costamagna, P.; Traverso, A.; Santin, M. Comparative LCA of methanol-fuelled SOFCs as auxiliary power systems on-board ships. Appl. Energy 2010, 87, 1670–1678. [Google Scholar] [CrossRef]
  18. National Renewable Energy Laboratory; Mann, M.K.; Whitaker, M.; Driver, T.; Mueller, M.; Franco, G.; Spiegel, L.; Hope, L.; Oglesby, R. Life Cycle Assessment of Existing and Emerging Distributed Generation Technologies in California; California Energy Commission: Sacramento, CA, USA, 2011. Available online: https://citeseerx.ist.psu.edu/viewdoc/download?doi=10.1.1.414.9181&rep=rep1&type=pdf (accessed on 17 July 2021).
  19. Sadhukhan, J. Distributed and micro-generation from biogas and agricultural application of sewage sludge: Comparative environmental performance analysis using life cycle approaches. Appl. Energy 2014, 122, 196–206. [Google Scholar] [CrossRef] [Green Version]
  20. Lin, J.; Babbitt, C.W.; Trabold, T.A. Life cycle assessment integrated with thermodynamic analysis of bio-fuel options for solid oxide fuel cells. Bioresour. Technol. 2013, 128, 495–504. [Google Scholar] [CrossRef]
  21. Nease, J.; Adams, T.A. Comparative life cycle analyses of bulk-scale coal-fueled solid oxide fuel cell power plants. Appl. Energy 2015, 150, 161–175. [Google Scholar] [CrossRef]
  22. Nease, J.; Ii, T.A.A. Life Cycle Analyses of Bulk-Scale Solid Oxide Fuel Cell Power Plants and Comparisons to the Natural Gas Combined Cycle. Can. J. Chem. Eng. 2015, 93, 1349–1363. [Google Scholar] [CrossRef]
  23. Reenaas, M. Solide Oxide Fuel Cell Combined with Gas Turbine Versus Diesel Engine as Auxiliary Power Producing Unit. Master’s Thesis, Faculty of Information Technology Mathematics and Electrical Engineering, Norwegian University of Science and Technology, Oslo, Norway, 2005. [Google Scholar]
  24. Rebitzer, G.; Ekvall, T.; Frischknecht, R.; Hunkeler, D.; Norris, G.; Rydberg, T. Life cycle assessment Part 1: Framework, goal and scope definition, inventory analysis, and applications. Environ. Int. 2004, 30, 701–720. [Google Scholar] [CrossRef] [PubMed]
  25. Wincewicz, K.C.; Cooper, J.S. Taxonomies of SOFC material and manufacturing alternatives. J. Power Sources 2005, 140, 280–296. [Google Scholar] [CrossRef]
  26. Smith, L.; Ibn-mohammed, T.; Yang, F.; Reaney, I.M.; Sinclair, D.C.; Koh, S.C.L. Comparative environmental profile assessments of commercial and novel material structures for solid oxide fuel cells. Appl. Energy 2019, 235, 1300–1313. [Google Scholar] [CrossRef]
  27. Richards, M. Solid Oxide Fuel Cell Manufacturing Overview; 2011. Available online: https://www.energy.gov/sites/prod/files/2014/03/f12/mfg2011_iia_richards.pdf (accessed on 17 July 2021).
  28. Gandiglio, M.; Sario, F.D.; Lanzini, A.; Bobba, S.; Santarelli, M.; Blengini, G.A. Life Cycle Assessment of a Biogas-Fed Solid Oxide Fuel Cell (SOFC) Integrated in a Wastewater Treatment Plant. Energies 2019, 12, 1611. [Google Scholar] [CrossRef] [Green Version]
  29. Scataglini, R.; Mayyas, A.; Wei, M.; Chan, S.H.; Lipman, T.; Gosselin, D.; D’Alessio, A.; Breunig, H.; Colella, W.G.; James, B.D. A Total Cost of Ownership Model for Solid Oxide Fuel Cells in Combined Heat and Power and Power-Only Applications. In Solid Oxide Fuel CellManufacturing Overview, Proceedings of the Hydrogen and Fuel Cell Technologies Manufacturing R&D Workshop, Washington, DC, USA, 11–12 August 2011; Springer: Washington, DC, USA, 2015. [Google Scholar]
  30. Birnbaum, K.U.; Zapp, P. Solid Oxide Fuel Cells, Sustainability Aspects; Springer: New York, NY, USA, 2013. [Google Scholar] [CrossRef]
  31. Carlson, E.J. Solid Oxide Fuel Cell Manufacturing Cost Model: Simulating Relationships between Performance, Manufacturing, and Cost of Production. 2004, pp. 1–73. Available online: https://www.researchgate.net/publication/236512323_SOLID_OXIDE_FUEL_CELL_MANUFACTURING_COST_MODEL_SIMULATING_RELATIONSHIPS_BETWEEN_PERFORMANCE_MANUFACTURING_AND_COST_OF_PRODUCTION (accessed on 17 July 2021).
  32. Yin, L.; Liao, Y.; Zheng, K.; Liu, J. Comparative analysis of gas and coal-fired power generation in ultra-low emission condition using life cycle assessment (LCA). IOP Conf. Ser. Mater. Sci. Eng. 2017, 199, 012054. [Google Scholar] [CrossRef] [Green Version]
  33. Meng, F.; Dillingham, G. Life Cycle Analysis of Natural Gas-Fired Distributed Combined Heat and Power versus Centralized Power Plant. Energy Fuels 2018, 32, 11731–11741. [Google Scholar] [CrossRef]
Figure 1. The lifespan of SOFC from raw materials to disposal.
Energies 14 04668 g001
Figure 2. System boundary for SOFC LCA manufacturing phase.
Energies 14 04668 g002
Figure 3. System boundary for SOFC LCA operational phase and the functional unit.
Energies 14 04668 g003
Figure 4. The ratio of emissions between the manufacturing and operation phases of the SOFC.
Energies 14 04668 g004
Figure 5. LCA results for six impact categories for the process during the SOFC manufacturing phase.
Energies 14 04668 g005
Figure 6. Climate Change Potential (kg CO2 eq.) for all manufacturing stages.
Energies 14 04668 g006
Figure 7. GWP output for a different type of service or goods.
Energies 14 04668 g007
Figure 8. GWP for significant parts of SOFC manufacturing.
Energies 14 04668 g008
Figure 9. Type of process of the fuel cell manufacturing.
Energies 14 04668 g009
Figure 10. Total GWP of 1 MW SOFC in four different countries.
Energies 14 04668 g010
Table 1. SOFC cell material inventory list.
Material DescriptionMaterial Weight (Kg/MW)
Anode (Ni 70% wt)1116.00
Anode (Alumina 30% wt)332.00
Electrolyte (Alumina)39.00
Cathode (LSM)78.00
Anode/electrolyte interlayer (NiO 50% vol)20.00
Anode/electrolyte interlayer (Alumina 50% vol)20.00
Electrolyte/cathode interlayer (LSM 50% vol)20.00
Electrolyte/cathode interlayer (Alumina 50% vol)20.00
Table 2. Chemical inventory list for SOFC manufacturing.
Process TypeChemical DescriptionMaterial Weight
(Kg/MW)
Anode Slurry preparationPlasticizer (Sanitizer)132.00
Butvar-76 (binder)131.70
n-Butyl acetate (solvent)394.80
Tape castingCarbone black (pore former)87.60
Electrolyte ink preparationButvar-76 (binder)3.40
n-Butyl acetate (solvent)10.15
Anode/electrolyte interlayer inkMethocel A4M (binder)22.32
2-Butoxyethanol (solvent)12.60
Electrolyte/cathode interlayer inkMethocel A4M (binder)22.32
2-Butoxyethanol (solvent)12.60
Cathode ink preparationMethocel A4M (binder)44.40
2-Butoxyethanol (solvent)25.32
Table 3. Energy consumption by the process.
Process Description Energy Input
(MJ/MW)
Anode slurry preparation40
Anode tape casting30
Anode/electrolyte interlayer ink70
Anode/electrolyte interlayer screen printing60
Drying1710
Sintering 10,530
Electrolyte ink preparation140
Screen printing130
Drying1710
Electrolyte/cathode interlayer ink70
Electrolyte/cathode interlayer screen printing60
Drying1710
Cathode ink preparation150
Screen printing130
Drying1710
Co-Sintering8600
Metal forming (for interconnect)430
Table 4. List of BoP inventory.
Description Material TypeMaterial Weight
(Kg/MW)
Energy Input
(MJ/MW)
Air blower Steel10,000.00235,200
Fuel blowerSteel10,000.002,355,200
Air heat exchangerIncoloy/Steel2000.0049,400
Fuel heat exchangerIncoloy/Steel2000.0049,400
Heater for startupSteel5000.00270,600
CasingSteel10,000.00235,200
Table 5. Waste output during the SOFC manufacture phase.
Waste Output (Type)Quantity (kg/MW)
CO2 (air emissions)432
n-Butyl acetate (evaporated solvent)444
2-Butoxyethanol (evaporated solvent)55
Table 6. LCIA indicators and related impact categories.
IndicatorImpact CategoryScaleCharacterization Factor
CO2GWPGlobalCO2 equivalent
CH4
N2O
SOxAPRegionalSO2 equivalent
NOxLocal
NOEPLocalN equivalent
NO2
CFCsODPGlobalCFC 11 equivalent
HCFCs
PM10HHPMRegionalPM2.5 equivalent
PM2.5Local
LC50HTPRegionalCTUh
Local
Table 7. Total LCA results of impact category and per phase.
SOFC PhaseGWPAPEPODPHHPMHTP
Manufacturing703,7552000774.38 × 10−81033.51 × 10−4
Operation1,712,0003848631.46 × 10−82235.94 × 10−5
Total2,415,75558481415.84 × 10−8326.334.10 × 10−4
Publisher’s Note: MDPI stays neutral with regard to jurisdictional claims in published maps and institutional affiliations.

