
Low-Cost Thermal Camera-Based Counting Occupancy Meter Facilitating Energy Saving in Smart Buildings


Abstract
:1. Introduction
- We present a method for fine-grained occupancy assessment using an inexpensive thermal camera. The method can be deployed on low-power, low-cost embedded hardware. Moreover, it is more flexible and accurate than prior art when tested using a more challenging dataset containing realistic monitoring scenarios involving distractors, collected in multiple locations. In addition, unlike other state of the art solutions built around the same sensor, the presented approach provides useful additional information—the location of the persons in the field of view of the camera.
- We investigate the influence of encoder pretraining using low-resolution grayscale images on the training speed and performance of the complete neural network and demonstrate the gains achieved.
- We introduce a public dataset of sequences for neural network testing and training for the fine-grained space occupancy estimation. The sequences are fully annotated, collected in a few different spaces, and reflect the challenges encountered in realistic conditions. Moreover, we also distribute the code enabling the replication of the experiments shown in the paper. We hope that the availability of an open, public dataset and the source code would encourage research in this domain and allow for systematic evaluation of a variety of approaches using a common benchmark.
2. Materials and Methods
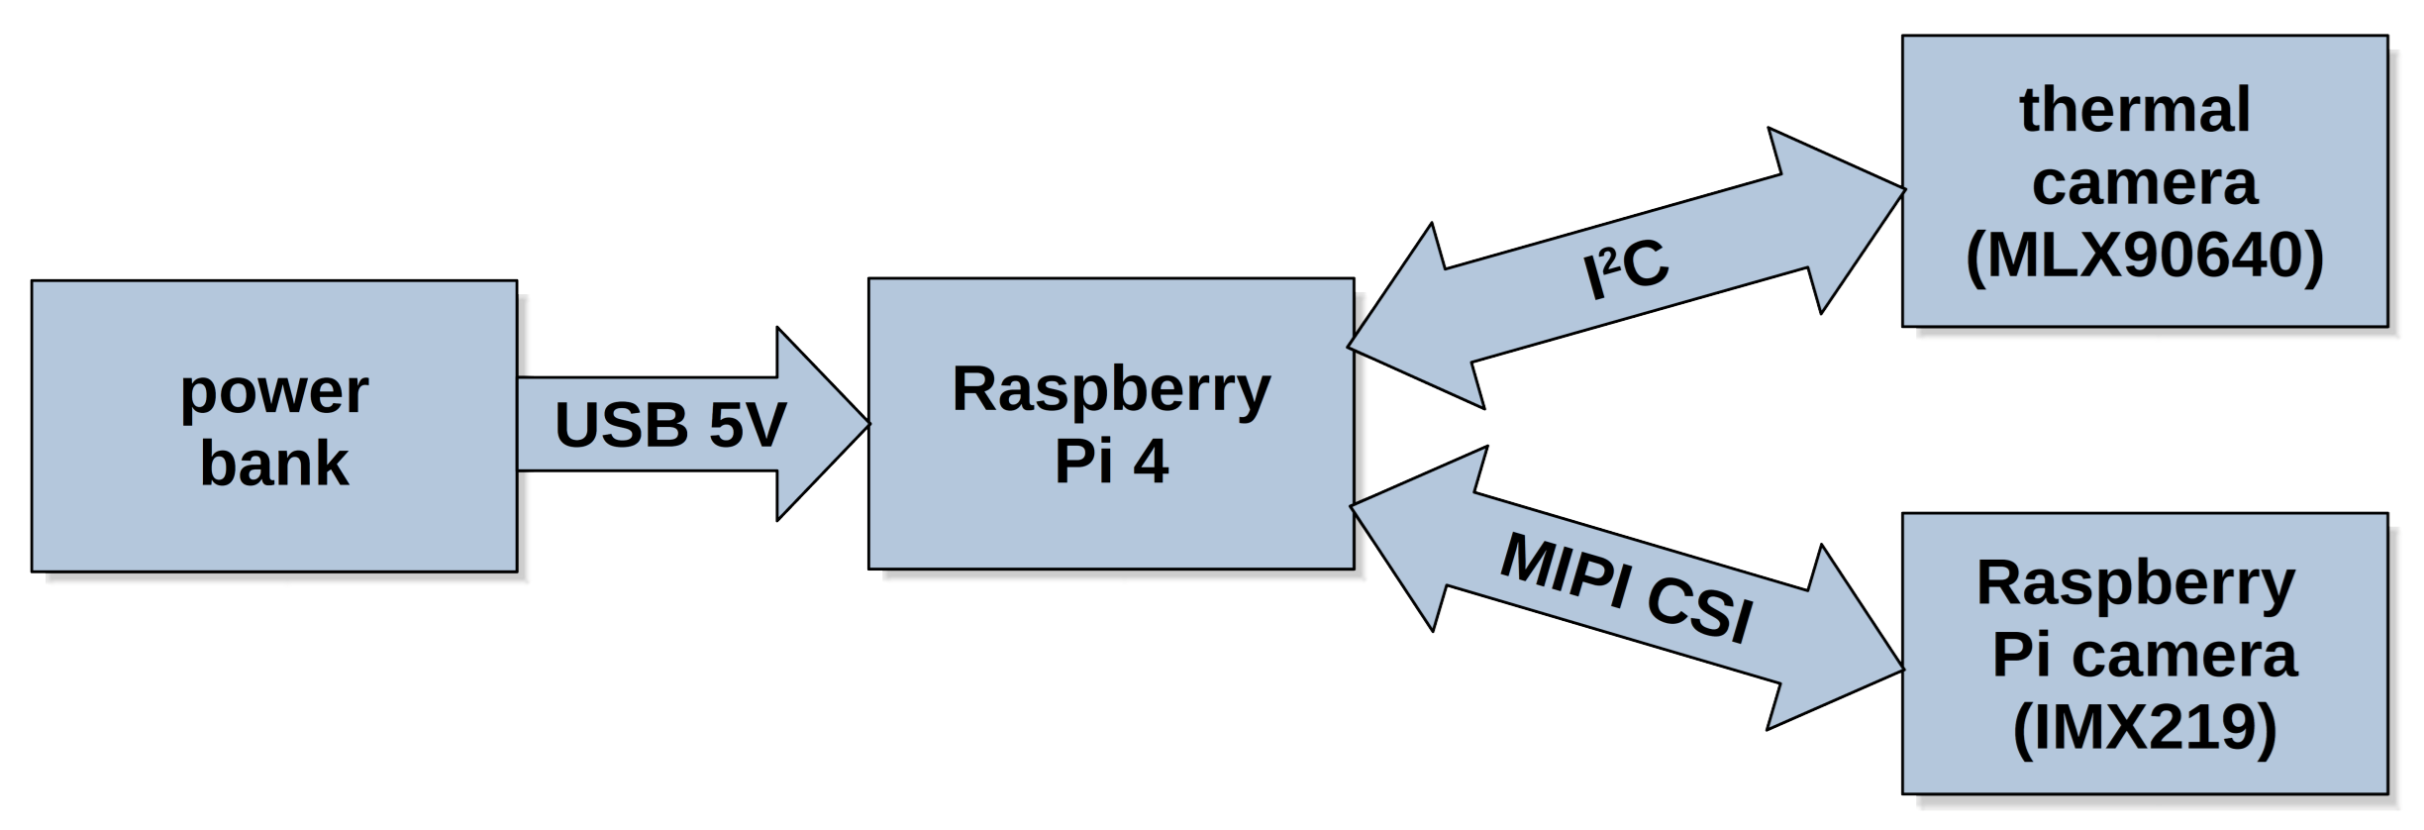
2.1. Dataset and Data Collection
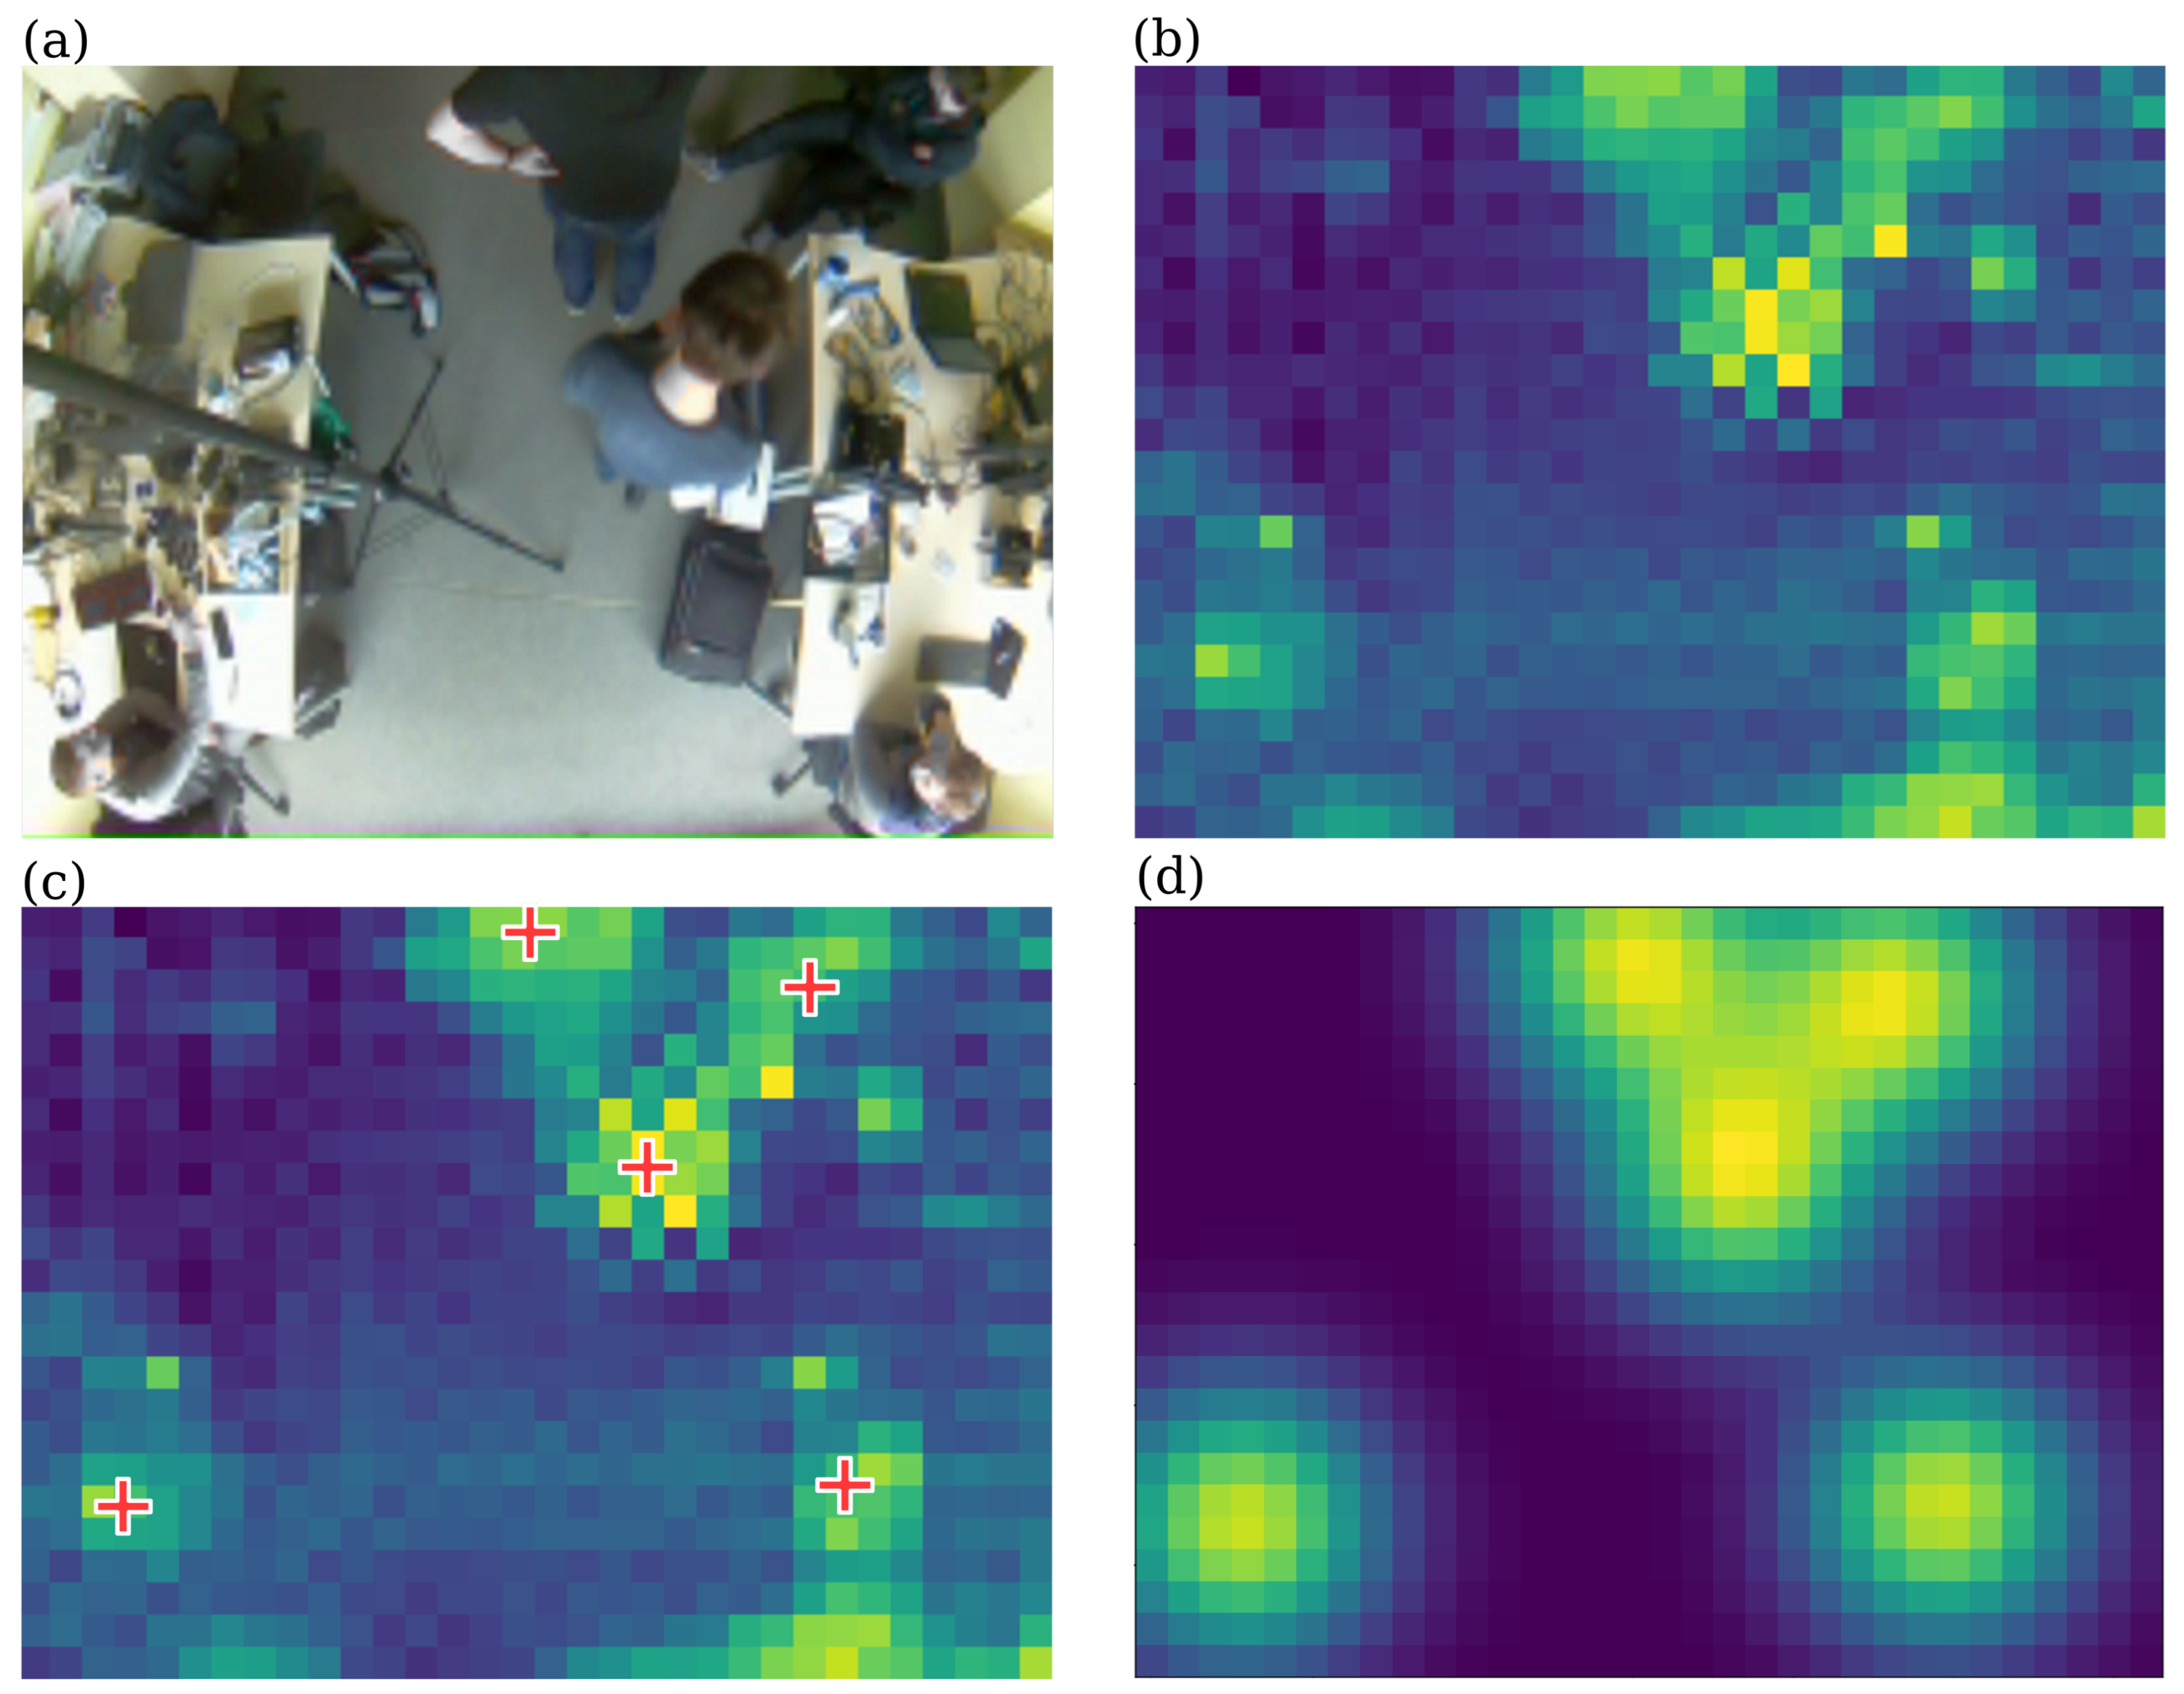
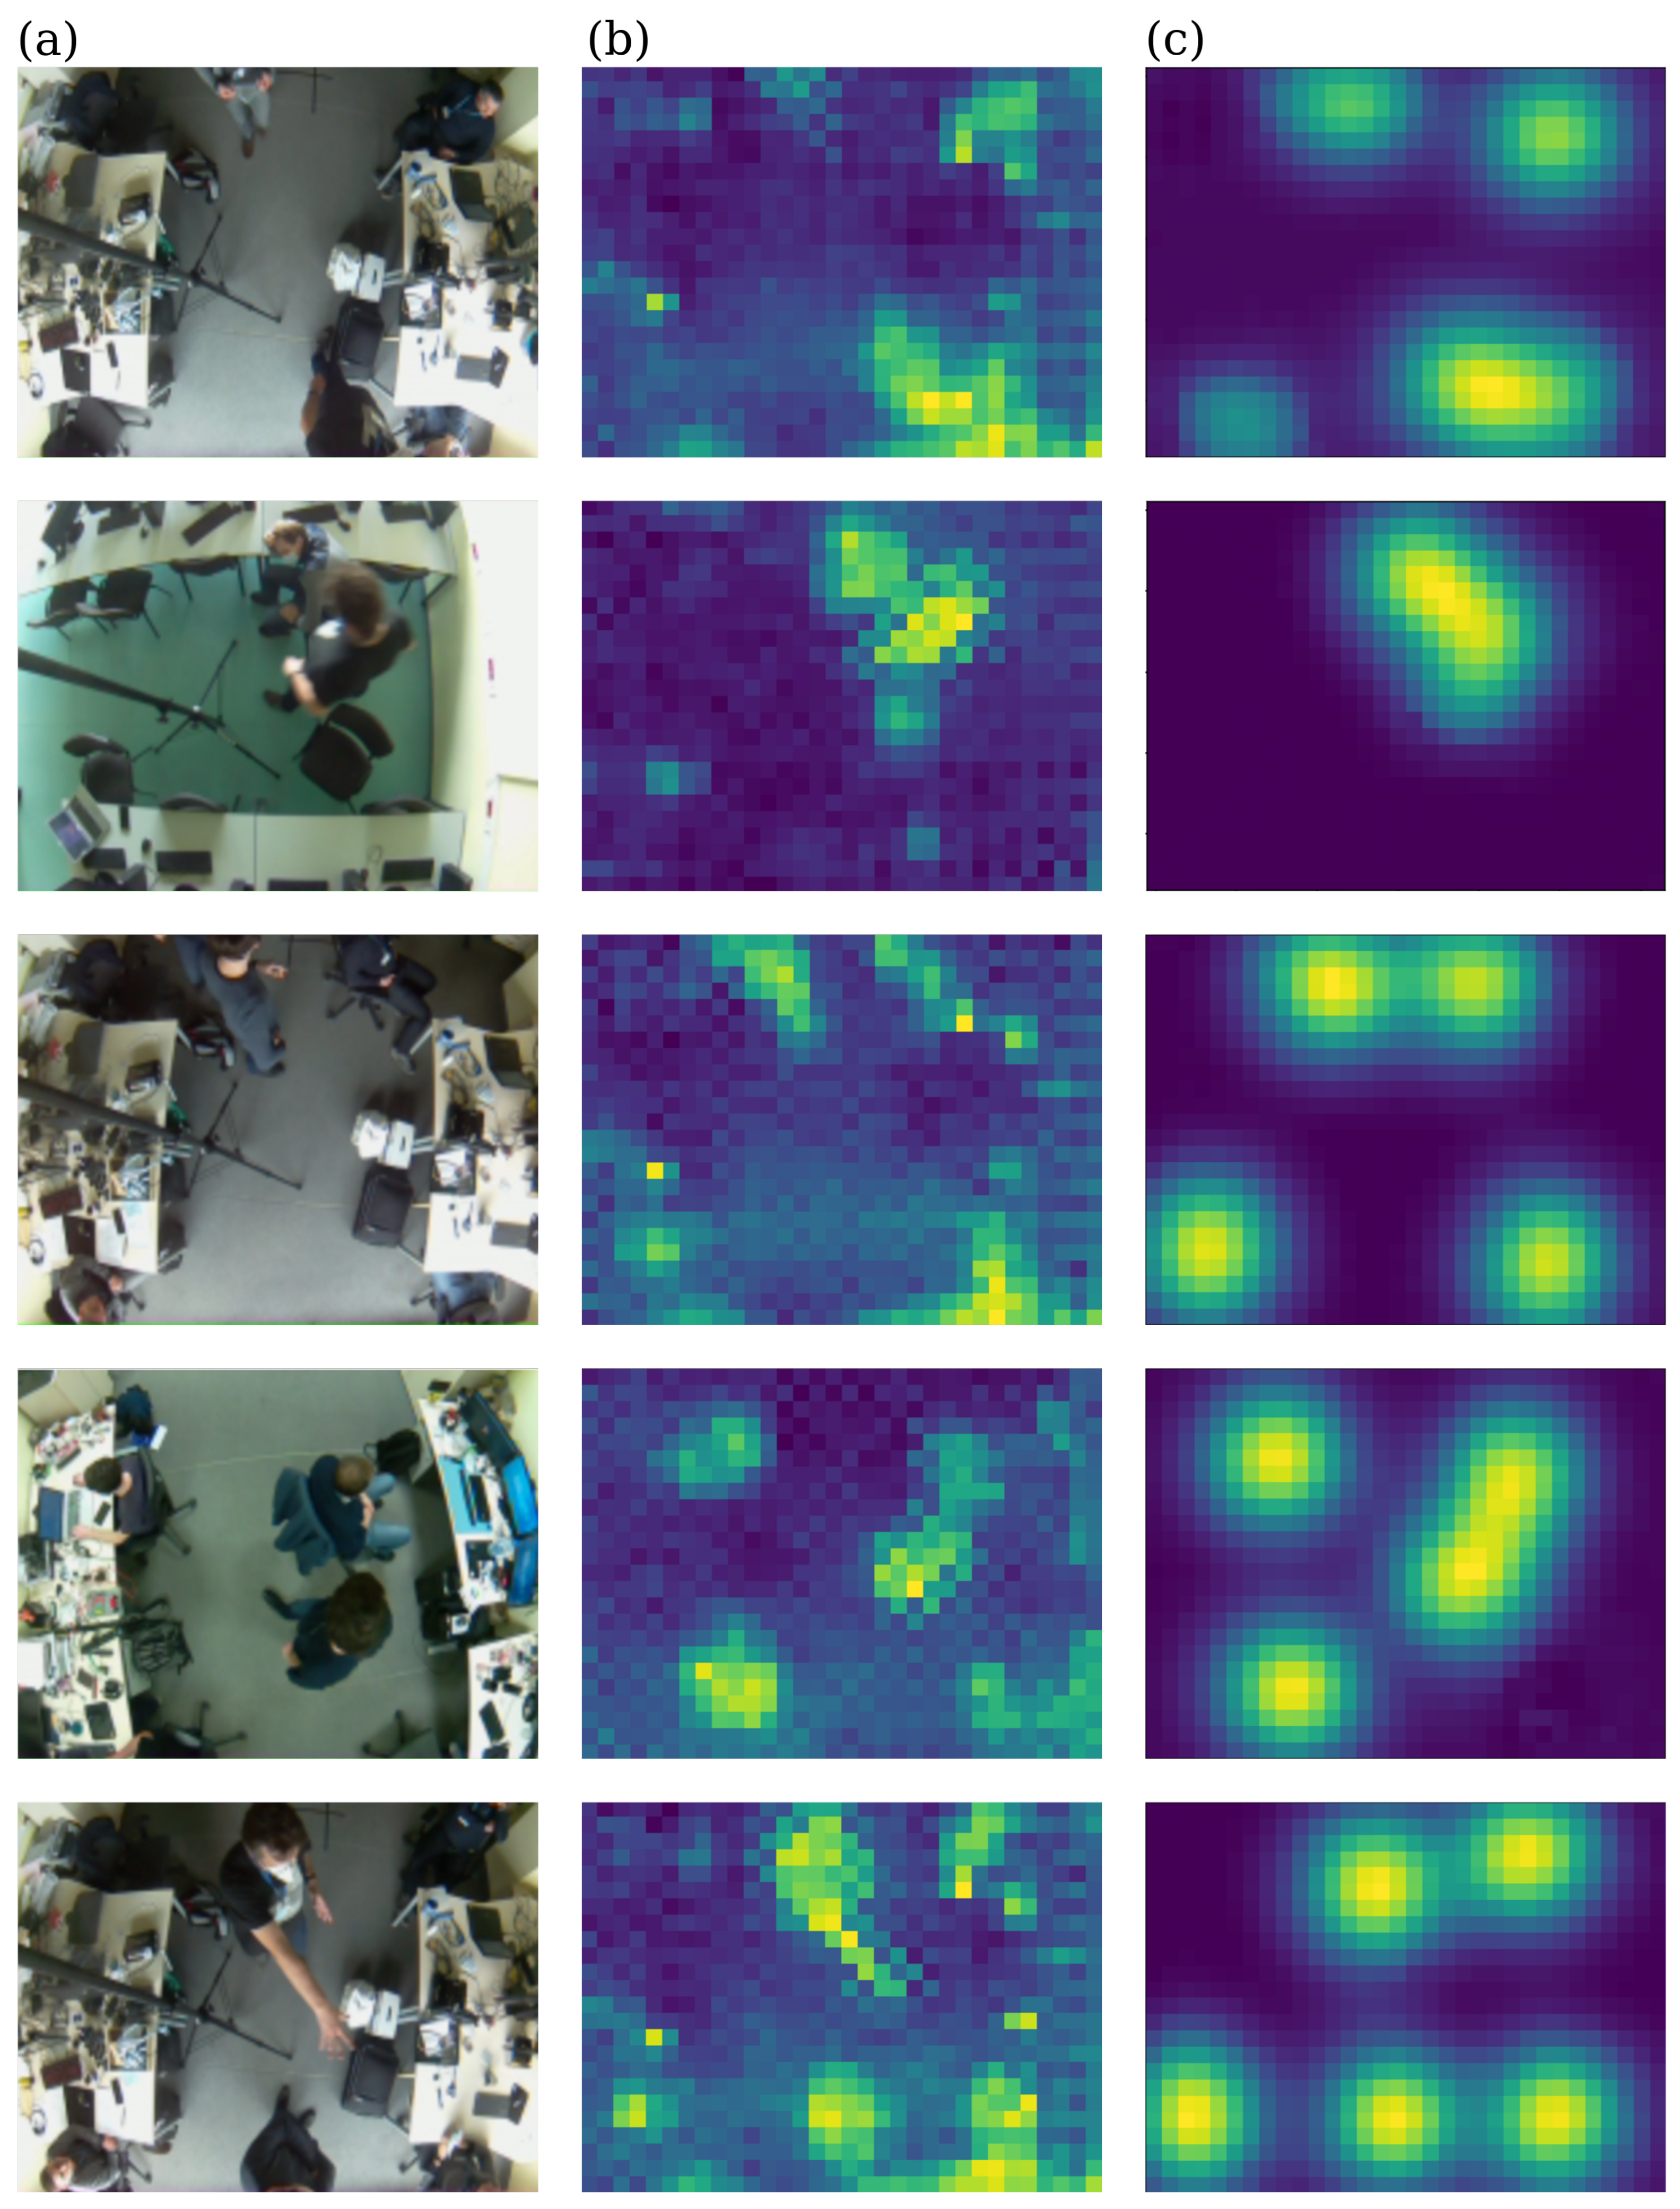
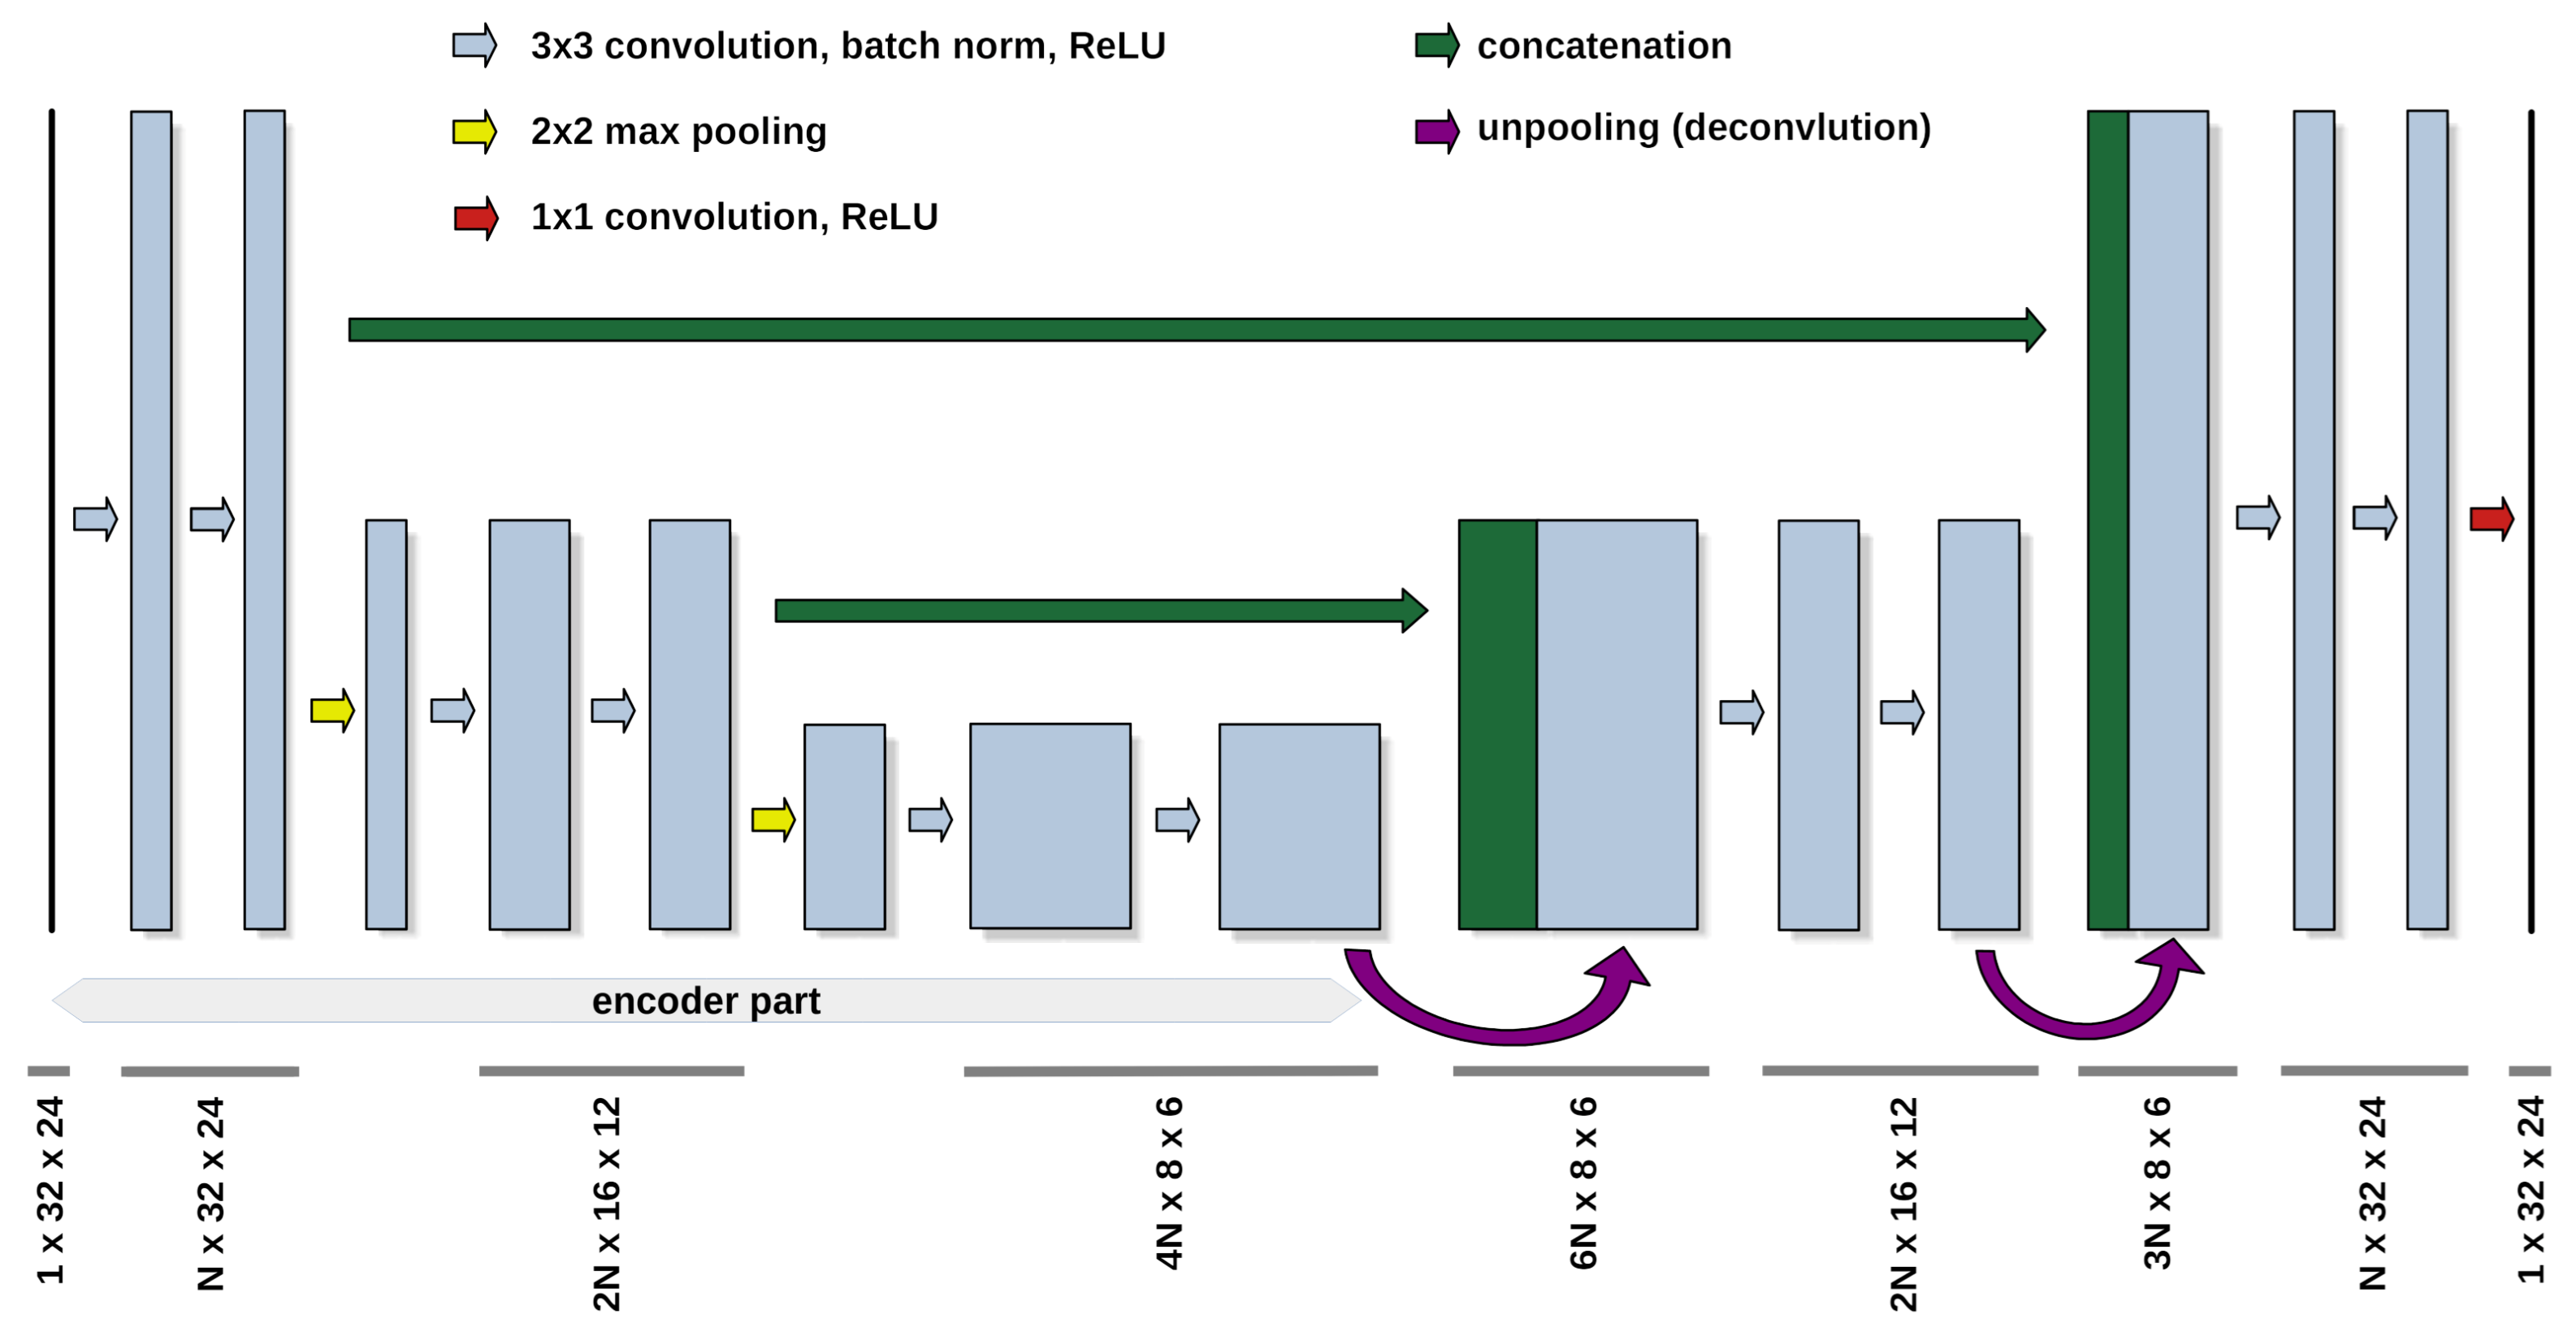
2.2. Neural Network Architecture
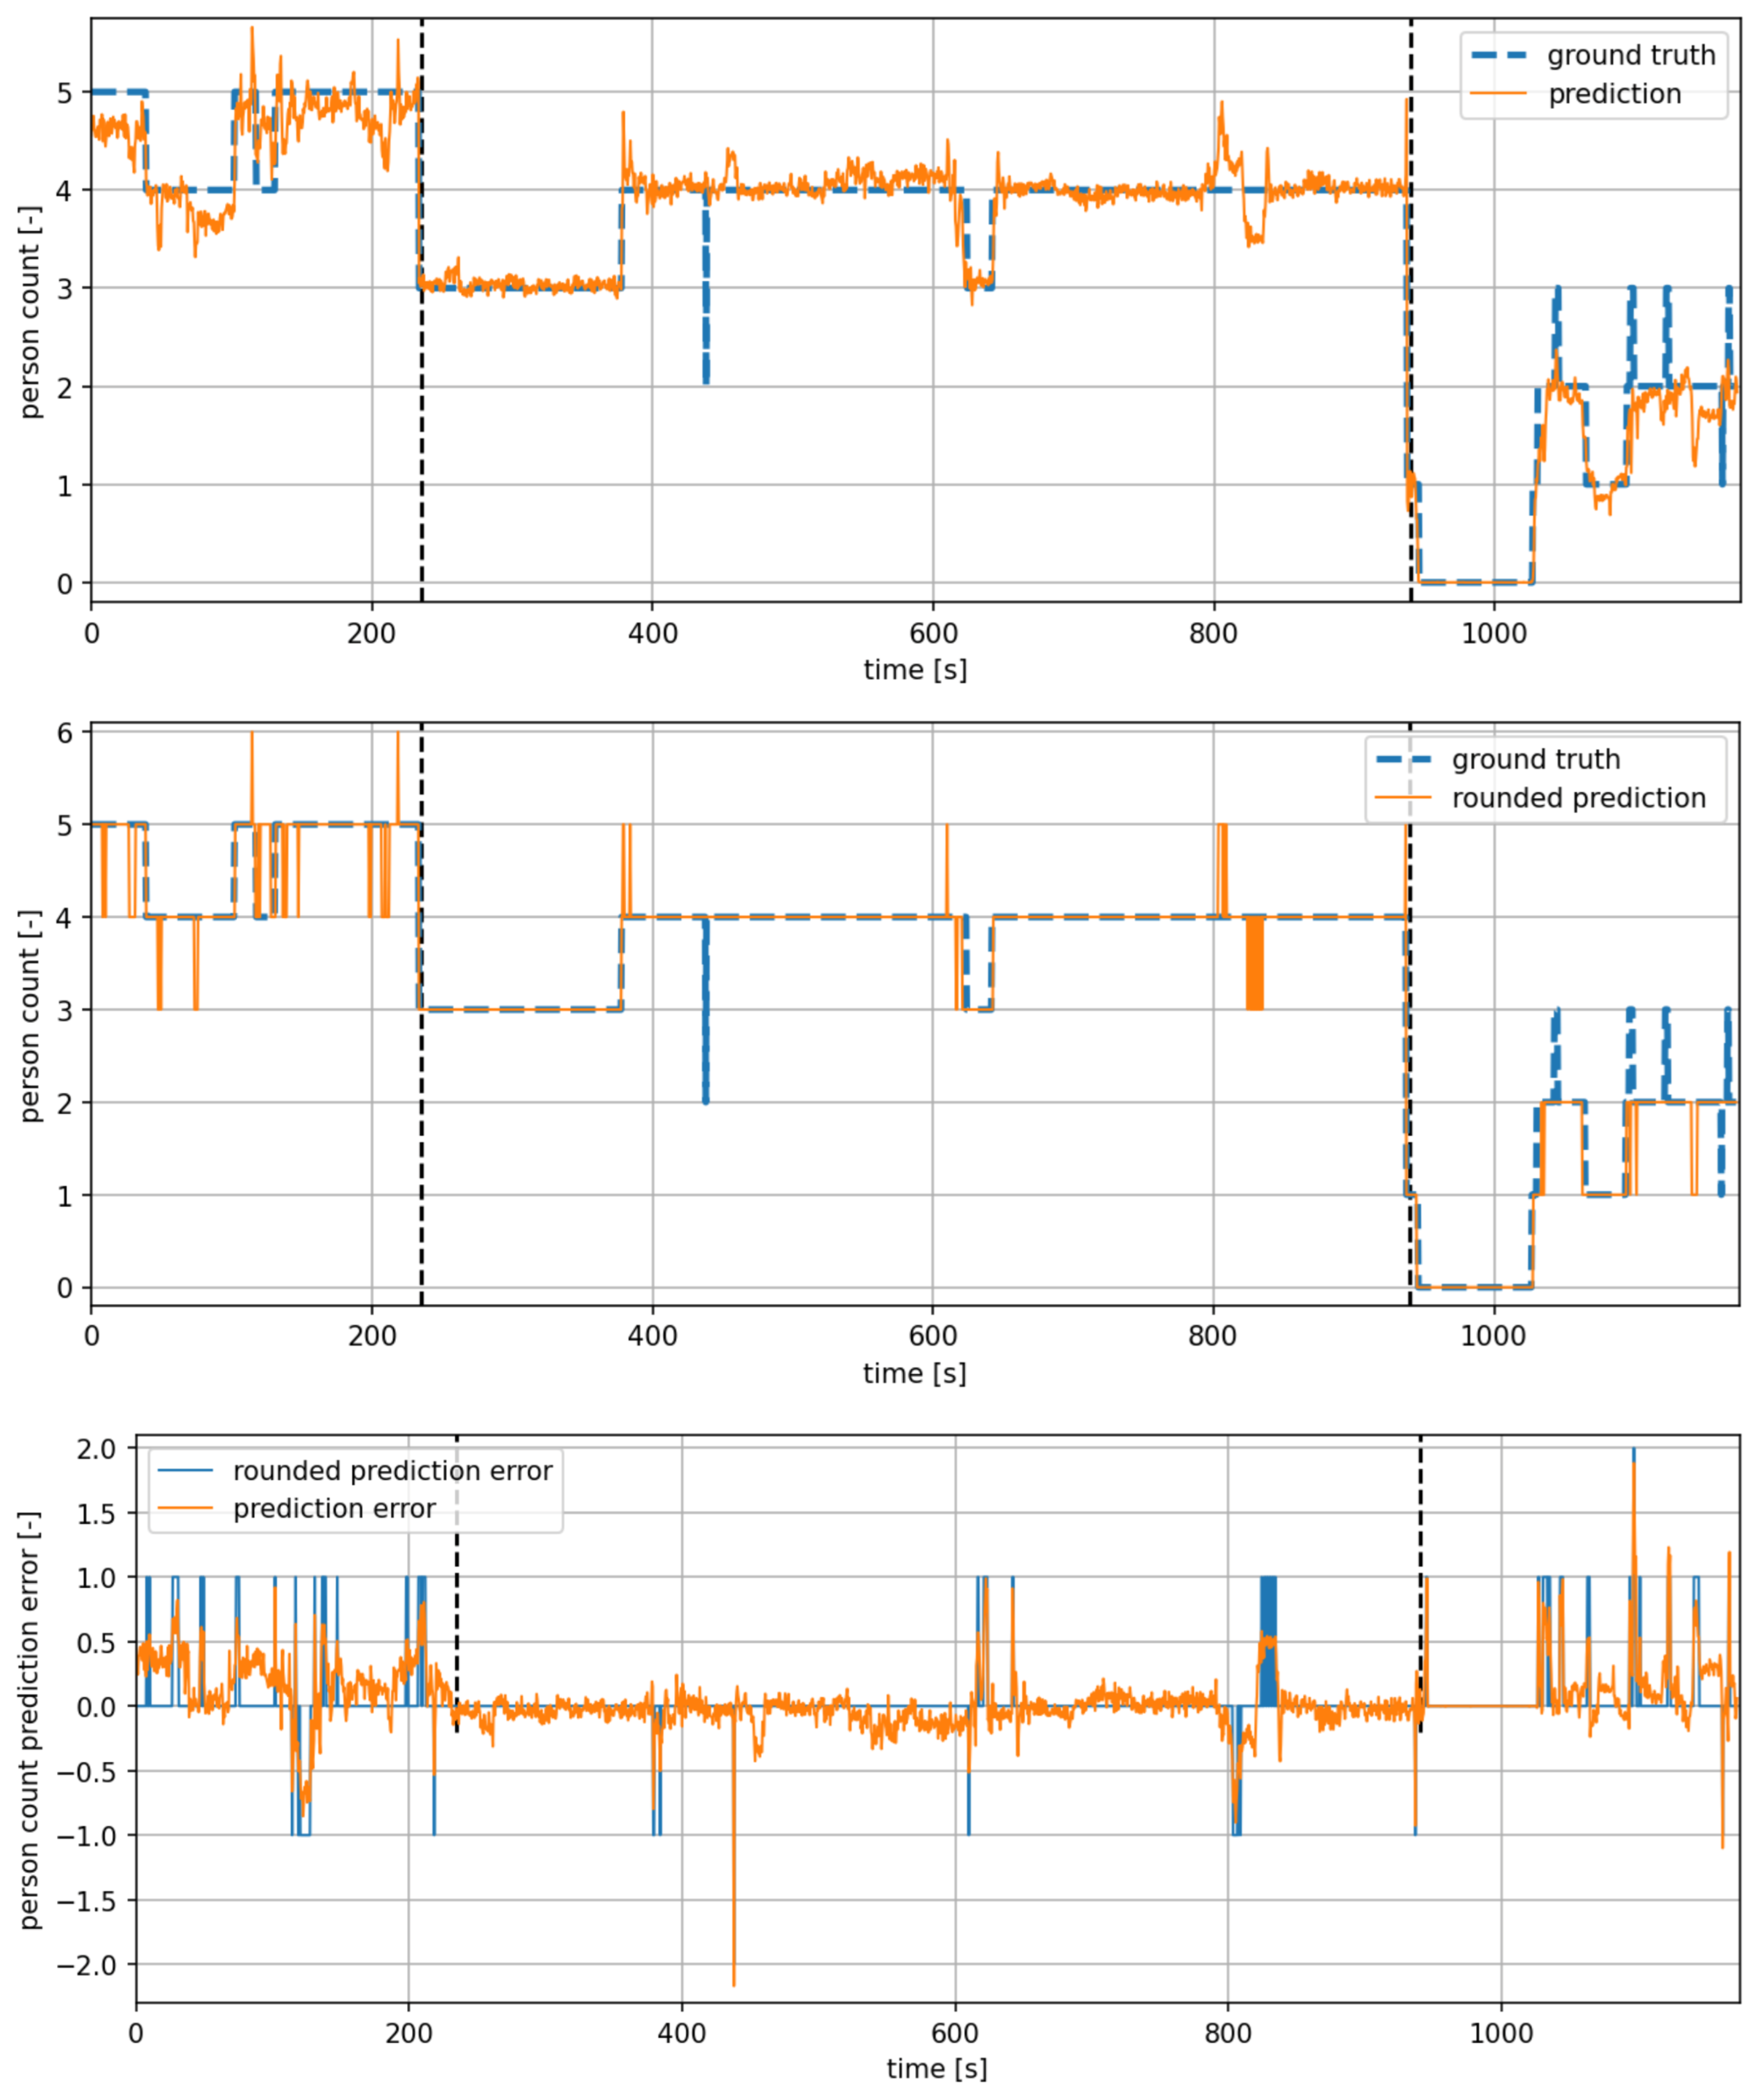
3. Results
4. Discussion
5. Conclusions
Author Contributions
Funding
Institutional Review Board Statement
Informed Consent Statement
Data Availability Statement
Conflicts of Interest
References
- Spandagos, C.; Ng, T.L. Equivalent full-load hours for assessing climate change impact on building cooling and heating energy consumption in large Asian cities. Appl. Energy 2017, 189, 352–368. [Google Scholar] [CrossRef]
- Tsemekidi Tzeiranaki, S.; Bertoldi, P.; Diluiso, F.; Castellazzi, L.; Economidou, M.; Labanca, N.; Ribeiro Serrenho, T.; Zangheri, P. Analysis of the EU residential energy consumption: Trends and determinants. Energies 2019, 12, 1065. [Google Scholar] [CrossRef] [Green Version]
- U.S. Energy Information Administration. How Much Energy Is Consumed in US Residential and Commercial Buildings? Washington, DC, USA. 2018. Available online: https://www.eia.gov/tools/faqs/faq.php?id=86&t=1 (accessed on 26 July 2021).
- Lin, T.P.; Lin, F.Y.; Wu, P.R.; Hämmerle, M.; Höfle, B.; Bechtold, S.; Hwang, R.L.; Chen, Y.C. Multiscale analysis and reduction measures of urban carbon dioxide budget based on building energy consumption. Energy Build. 2017, 153, 356–367. [Google Scholar] [CrossRef]
- Weber, R.H.; Weber, R. Internet of Things as Tool of Global Welfare. In Internet of Things; Springer: Berlin/Heidelberg, Germany, 2010; pp. 101–125. [Google Scholar]
- Asghari, P.; Rahmani, A.M.; Javadi, H.H.S. Internet of Things applications: A systematic review. Comput. Netw. 2019, 148, 241–261. [Google Scholar] [CrossRef]
- Yu, J.; Kim, M.; Bang, H.C.; Bae, S.H.; Kim, S.J. IoT as a applications: Cloud-based building management systems for the internet of things. Multimed. Tools Appl. 2016, 75, 14583–14596. [Google Scholar] [CrossRef]
- Minoli, D.; Sohraby, K.; Occhiogrosso, B. IoT considerations, requirements, and architectures for smart buildings—Energy optimization and next-generation building management systems. IEEE Internet Things J. 2017, 4, 269–283. [Google Scholar] [CrossRef]
- Pasini, D.; Ventura, S.M.; Rinaldi, S.; Bellagente, P.; Flammini, A.; Ciribini, A.L.C. Exploiting Internet of Things and building information modeling framework for management of cognitive buildings. In Proceedings of the 2016 IEEE International Smart Cities Conference (ISC2), Trento, Italy, 12–15 September 2016; pp. 1–6. [Google Scholar]
- Tushar, W.; Wijerathne, N.; Li, W.T.; Yuen, C.; Poor, H.V.; Saha, T.K.; Wood, K.L. Internet of things for green building management: Disruptive innovations through low-cost sensor technology and artificial intelligence. IEEE Signal Process. Mag. 2018, 35, 100–110. [Google Scholar] [CrossRef]
- Beltran, A.; Erickson, V.L.; Cerpa, A.E. Thermosense: Occupancy thermal based sensing for hvac control. In Proceedings of the 5th ACM Workshop on Embedded Systems for Energy-Efficient Buildings, Roma, Italy, 11–15 November 2013; pp. 1–8. [Google Scholar]
- Kaushik, A.R.; Celler, B.G. Characterization of passive infrared sensors for monitoring occupancy pattern. In Proceedings of the 2006 International Conference of the IEEE Engineering in Medicine and Biology Society, New York, NY, USA, 30 August–3 September 2006; pp. 5257–5260. [Google Scholar]
- Zhang, Z.; Gao, X.; Biswas, J.; Wu, J.K. Moving targets detection and localization in passive infrared sensor networks. In Proceedings of the 2007 10th International Conference on Information Fusion, Quebec, QC, Canada, 9–12 July 2007; pp. 1–6. [Google Scholar]
- Kemper, J.; Linde, H. Challenges of passive infrared indoor localization. In Proceedings of the 2008 5th Workshop on Positioning, Navigation and Communication, Hannover, Germany, 27–27 March 2008; pp. 63–70. [Google Scholar]
- Wahl, F.; Milenkovic, M.; Amft, O. A distributed PIR-based approach for estimating people count in office environments. In Proceedings of the 2012 IEEE 15th International Conference on Computational Science and Engineering, Paphos, Cyprus, 5–7 December 2012; pp. 640–647. [Google Scholar]
- Yang, J.; Santamouris, M.; Lee, S.E. Review of occupancy sensing systems and occupancy modeling methodologies for the application in institutional buildings. Energy Build. 2016, 121, 344–349. [Google Scholar] [CrossRef]
- Jazizadeh, F.; Jung, W. Personalized thermal comfort inference using RGB video images for distributed HVAC control. Appl. Energy 2018, 220, 829–841. [Google Scholar] [CrossRef]
- Tien, P.W.; Wei, S.; Calautit, J.K.; Darkwa, J.; Wood, C. A vision-based deep learning approach for the detection and prediction of occupancy heat emissions for demand-driven control solutions. Energy Build. 2020, 226, 110386. [Google Scholar] [CrossRef]
- Tien, P.W.; Wei, S.; Calautit, J. A Computer Vision-Based Occupancy and Equipment Usage Detection Approach for Reducing Building Energy Demand. Energies 2021, 14, 156. [Google Scholar] [CrossRef]
- Balaji, B.; Xu, J.; Nwokafor, A.; Gupta, R.; Agarwal, Y. Sentinel: Occupancy based HVAC actuation using existing WiFi infrastructure within commercial buildings. In Proceedings of the 11th ACM Conference on Embedded Networked Sensor Systems, Roma, Italy, 11–15 November 2013; pp. 1–14. [Google Scholar]
- Tekler, Z.D.; Low, R.; Gunay, B.; Andersen, R.K.; Blessing, L. A scalable Bluetooth Low Energy approach to identify occupancy patterns and profiles in office spaces. Build. Environ. 2020, 171, 106681. [Google Scholar] [CrossRef]
- Deng, Z.; Chen, Q. Development and validation of a smart HVAC control system for multi-occupant offices by using occupants’ physiological signals from wristband. Energy Build. 2020, 214, 109872. [Google Scholar] [CrossRef]
- Abedi, M.; Jazizadeh, F. Deep-learning for Occupancy Detection Using Doppler Radar and Infrared Thermal Array Sensors. In Proceedings of the International Symposium on Automation and Robotics in Construction (IAARC), Banff, AB, Canada, 21–24 May 2019. [Google Scholar]
- Metwaly, A.; Queralta, J.P.; Sarker, V.K.; Gia, T.N.; Nasir, O.; Westerlund, T. Edge computing with embedded ai: Thermal image analysis for occupancy estimation in intelligent buildings. In Proceedings of the INTelligent Embedded Systems Architectures and Applications Workshop 2019, New York, NY, USA, 13–18 October 2019; pp. 1–6. [Google Scholar]
- Ronneberger, O.; Fischer, P.; Brox, T. U-net: Convolutional networks for biomedical image segmentation. In Proceedings of the International Conference on Medical Image Computing and Computer-Assisted Intervention, Munich, Germany, 5–9 October 2015; pp. 234–241. [Google Scholar]
- Li, B.; Huang, H.; Zhang, A.; Liu, P.; Liu, C. Approaches on crowd counting and density estimation: A review. Pattern Anal. Appl. 2021. [Google Scholar] [CrossRef]
- Perko, R.; Klopschitz, M.; Almer, A.; Roth, P.M. Critical Aspects of Person Counting and Density Estimation. J. Imaging 2021, 7, 21. [Google Scholar] [CrossRef]
- Saari, M.; bin Baharudin, A.M.; Hyrynsalmi, S. Survey of prototyping solutions utilizing Raspberry Pi. In Proceedings of the 2017 40th International Convention on Information and Communication Technology, Electronics and Microelectronics (MIPRO), Opatija, Croatia, 22–26 May 2017; pp. 991–994. [Google Scholar]
- Melexis MLX90640 32x24 IR array—Datasheet. Available online: https://mel-prd-cdn.azureedge.net/-/media/files/documents/datasheets/mlx90640-datasheet-melexis.pdf (accessed on 26 July 2021).
- Ioffe, S.; Szegedy, C. Batch normalization: Accelerating deep network training by reducing internal covariate shift. In Proceedings of the International conference on Machine Learning, PMLR, Lille, France, 7–9 July 2015; pp. 448–456. [Google Scholar]
- Zhuang, F.; Qi, Z.; Duan, K.; Xi, D.; Zhu, Y.; Zhu, H.; Xiong, H.; He, Q. A comprehensive survey on transfer learning. Proc. IEEE 2020, 109, 43–76. [Google Scholar] [CrossRef]
- Deng, J.; Dong, W.; Socher, R.; Li, L.J.; Li, K.; Fei-Fei, L. Imagenet: A large-scale hierarchical image database. In Proceedings of the 2009 IEEE Conference on Computer Vision and Pattern Recognition, Miami, FL, USA, 20–25 June 2009; pp. 248–255. [Google Scholar]
- Orsic, M.; Kreso, I.; Bevandic, P.; Segvic, S. In defense of pre-trained imagenet architectures for real-time semantic segmentation of road-driving images. In Proceedings of the IEEE/CVF Conference on Computer Vision and Pattern Recognition, Long Beach, CA, USA, 15–20 June 2019; pp. 12607–12616. [Google Scholar]
- Krizhevsky, A. Learning Multiple Layers of Features from Tiny Images; Technical Report; University of Toronto: Toronto, ON, Canada, 2009. [Google Scholar]
- Xiao, H.; Rasul, K.; Vollgraf, R. Fashion-mnist: A novel image dataset for benchmarking machine learning algorithms. arXiv 2017, arXiv:1708.07747. [Google Scholar]
- Kingma, D.P.; Ba, J. Adam: A method for stochastic optimization. arXiv 2014, arXiv:1412.6980. [Google Scholar]
- Hertel, L.; Barth, E.; Käster, T.; Martinetz, T. Deep convolutional neural networks as generic feature extractors. In Proceedings of the 2015 International Joint Conference on Neural Networks (IJCNN), Killarney, Ireland, 12–16 July 2015; pp. 1–4. [Google Scholar]
- Goyal, S.; Ingley, H.A.; Barooah, P. Occupancy-based zone-climate control for energy-efficient buildings: Complexity vs. performance. Appl. Energy 2013, 106, 209–221. [Google Scholar] [CrossRef]
- Budiman, F.; Rivai, M.; Raditya, I.G.B.P.; Krisrenanto, D.; Amiroh, I.Z. Smart Control of Air Conditioning System Based on Number and Activity Level of Persons. In Proceedings of the 2018 International Seminar on Intelligent Technology and Its Applications (ISITIA), Bali, Indonesia, 30–31 August 2018; pp. 431–436. [Google Scholar]


| Number of Persons in a Frame vs. Number of Frames | |||||||
|---|---|---|---|---|---|---|---|
| 0 | 1 | 2 | 3 | 4 | 5 | Total | |
| training dataset | 99 | 105 | 2984 | 3217 | 1953 | 114 | 8427 |
| validation dataset | 0 | 139 | 631 | 1691 | 225 | 139 | 2825 |
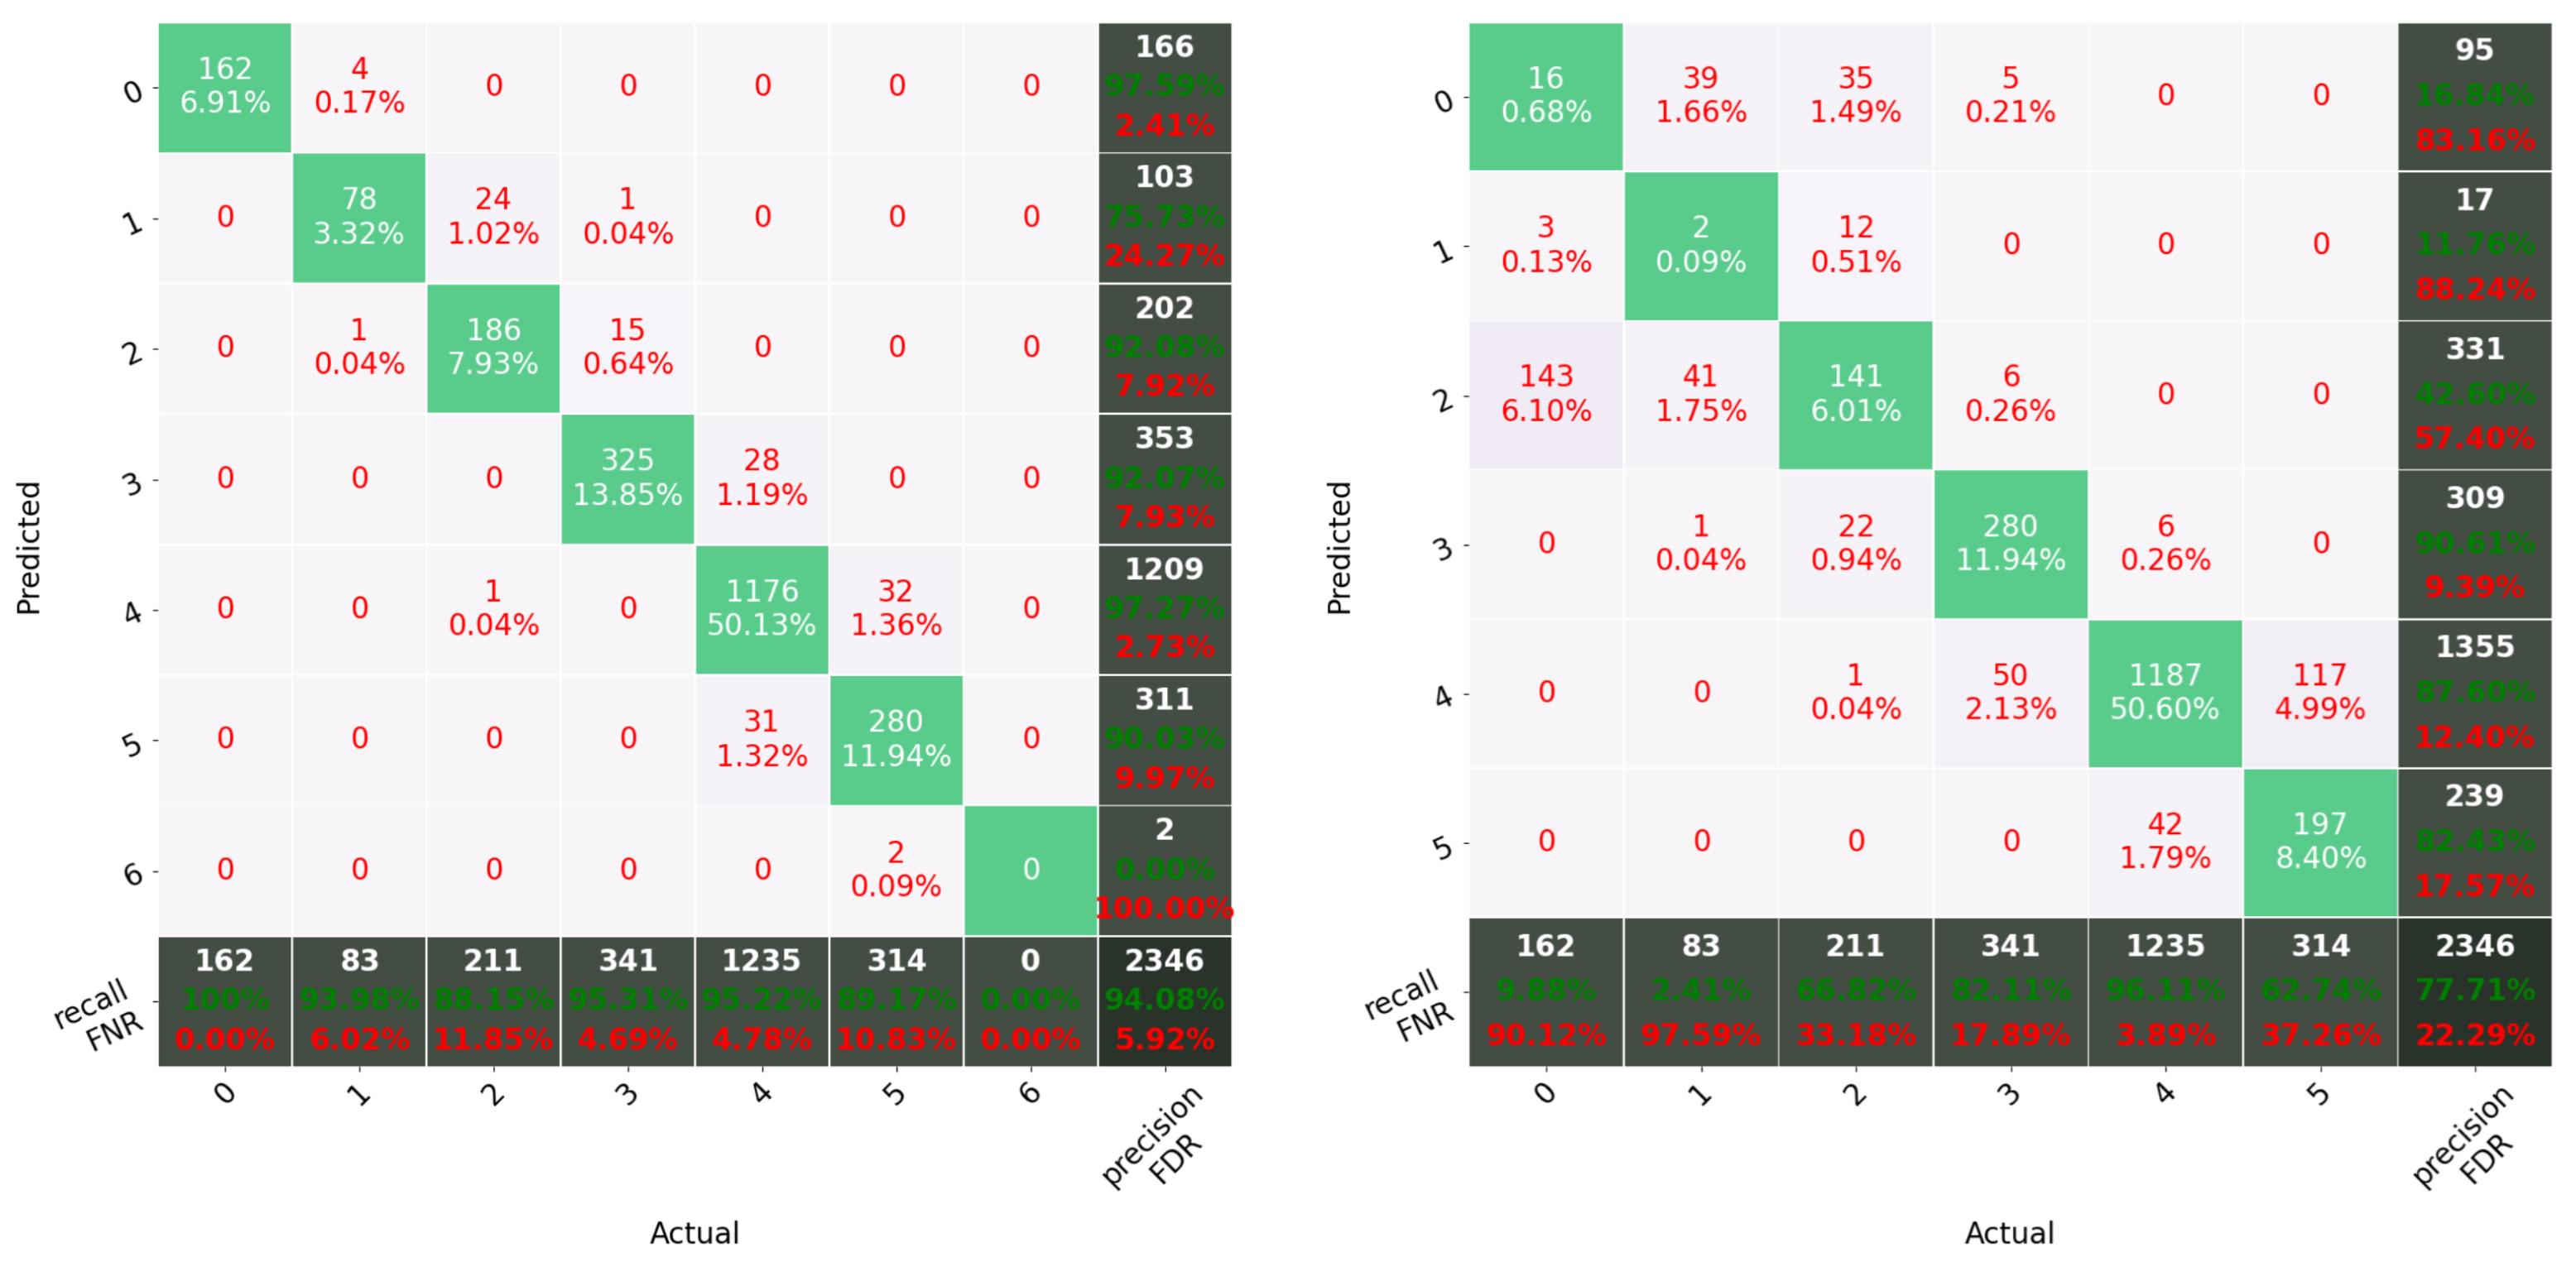
| test dataset | 162 | 83 | 211 | 341 | 1235 | 314 | 2346 |
| Metric Name | Our Result | Metwaly et al. Result [24] |
|---|---|---|
| MAE | 0.145 | - |
| MAE rounded | 0.060 | 0.304 |
| MSE | 0.057 | - |
| MSE rounded | 0.062 | 0.470 |
| Accuracy | 0.941 | 0.777 |
| No. of parameters | 130,193 | 396,806 |
Publisher’s Note: MDPI stays neutral with regard to jurisdictional claims in published maps and institutional affiliations. |
© 2021 by the authors. Licensee MDPI, Basel, Switzerland. This article is an open access article distributed under the terms and conditions of the Creative Commons Attribution (CC BY) license (https://creativecommons.org/licenses/by/4.0/).
Share and Cite
Kraft, M.; Aszkowski, P.; Pieczyński, D.; Fularz, M. Low-Cost Thermal Camera-Based Counting Occupancy Meter Facilitating Energy Saving in Smart Buildings. Energies 2021, 14, 4542. https://doi.org/10.3390/en14154542
Kraft M, Aszkowski P, Pieczyński D, Fularz M. Low-Cost Thermal Camera-Based Counting Occupancy Meter Facilitating Energy Saving in Smart Buildings. Energies. 2021; 14(15):4542. https://doi.org/10.3390/en14154542
Chicago/Turabian StyleKraft, Marek, Przemysław Aszkowski, Dominik Pieczyński, and Michał Fularz. 2021. "Low-Cost Thermal Camera-Based Counting Occupancy Meter Facilitating Energy Saving in Smart Buildings" Energies 14, no. 15: 4542. https://doi.org/10.3390/en14154542
APA StyleKraft, M., Aszkowski, P., Pieczyński, D., & Fularz, M. (2021). Low-Cost Thermal Camera-Based Counting Occupancy Meter Facilitating Energy Saving in Smart Buildings. Energies, 14(15), 4542. https://doi.org/10.3390/en14154542