1. Introduction
It has become apparent that sustainable urban development can only be achieved through a significant change in the way we build and manage our urban spaces. Transforming urban energy system is a key driver of the aspired development to make cities and human settlements inclusive, sustainable, and resilient, as elaborated in Goal 11 of the UN Sustainable Development Goals (SDGs) [
1]. Within this effort, Positive Energy Districts (PEDs) represents an innovative concept for the development of urban districts and neighbourhoods.
PEDs refer to urban neighbourhoods with the ability to achieve a positive energy balance on an annual base within its given boundary. This means that the cumulative annual energy provided within the district boundary must exceed its annual own demand and compensate for any external energy supply. Hereafter, defining the system boundary of a PED is crucial for achieving an annual positive energy balance because of internal energy consumption and local renewable energy production. Such boundaries might refer to geographical, functional, or/and virtual domains [
2].
The Joint Programming Initiative Urban Europe (JPI-UE) proposes the following definition in its publication, “Framework Definition for Positive Energy Districts and Neighbourhoods” [
3]:
“Positive Energy Districts are energy-efficient and energy-flexible urban areas which produce net zero greenhouse gas emissions and actively manage an annual local or regional surplus production of renewable energy. They require integration of different systems and infrastructures and interaction between buildings, the users and the regional energy, mobility and ICT systems, while optimising the liveability of the urban environment in line with social, economic and environmental sustainability”.
This definition builds also on previous contributions and ongoing discussions around the realisation and deployment of PEDs as originally highlighted by Temporary Working Group (TWG) 3.2 of SET-Plan Action 3.2 on implementation plan of PEDs [
2].
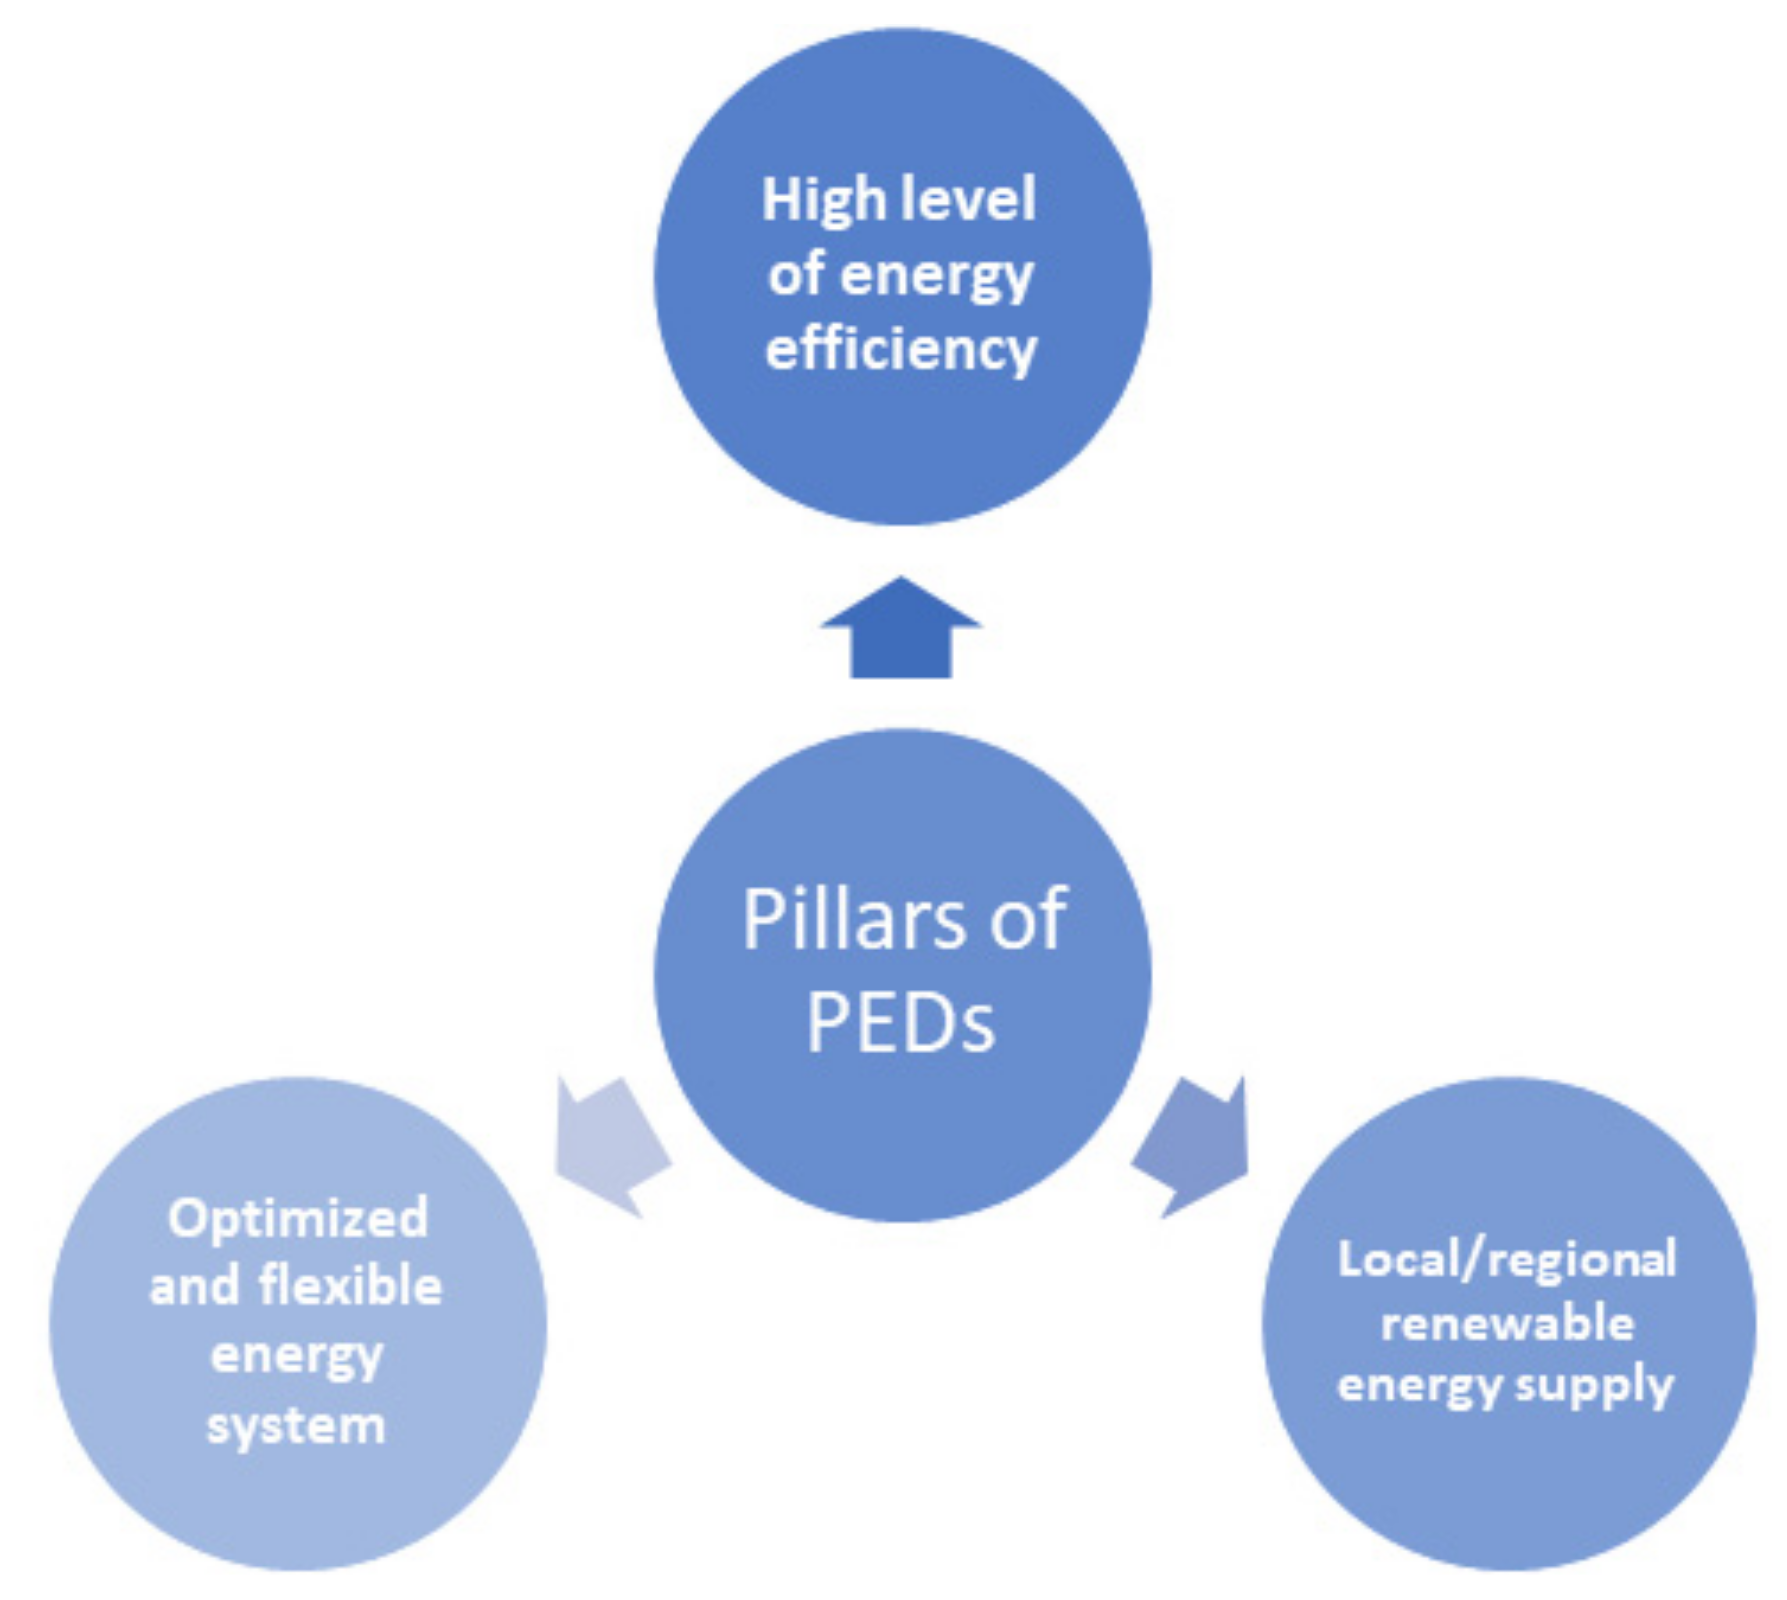
The resulting definition highlights three pillars for realising PEDs from the viewpoint of sustainable energy system (
Figure 1):
High level of energy efficiency: to keep district annual energy consumption as low as achievable.
Local/regional renewable energy supply:
Optimised and flexible energy system: to optimised interaction with the neighbourhood energy system and manage consumption and storage capacities on demand.
Figure 1.
Functions and pillars of Positive Energy Districts (PEDs) within the urban energy system (Source: AIT).
Figure 1.
Functions and pillars of Positive Energy Districts (PEDs) within the urban energy system (Source: AIT).
Following the above definition PEDs seeks to optimise the three functions towards climate neutrality and energy surplus considering the guiding principles of quality of life, inclusiveness and sustainability. It has been recognised that the contribution of various key stakeholders and enablers is essential to enable the realisation and deployment of PEDs covering:
urban governance and regulatory framework,
Engagement of citizen and need-owners,
Integration of urban and energy planning for a sustainable and resilient PEDs
Employment
ICT and integrated energy solutions, e.g., sector coupling and EV.
2. The Positive Energy Districts (PEDs) Policy Context
The main driver for PEDs is currently the climate and energy policy of the European Union (EU) and its member states. The EU is speeding up innovation in clean energy and calls for decarbonization of the EU building stock by 2050 [
4]. Such a transformation requires innovative technological solutions (with a focus on the integration of energy systems), in addition to regulation, financing, governance, new business models, and other associated socio-economic issues. Several European initiatives have been taken in this direction, aimed at achieving the EU long-term energy and climate goals; among them are the SET-Plan Action 3.2 “Smart Cities and Communities” [
5] and the recently adopted European Green Deal to reach climate-neutrality by 2050 [
6].
The prominent EU initiative under SET-Plan Action 3.2 SCC considers PEDs as a driver of sustainable urbanisation. In its declaration of intent published in 2016, it seeks to “make Europe a global role model in integrated, innovative solutions for the planning, deployment and replication of Positive Energy Districts with the aim by 2025 to have at least 100 Positive Energy Districts synergistically connected to the energy system in Europe and a strong export of related technologies” [
5]. This initiative is the result of extensive consultations with several stakeholders, including European Innovation Partnership on Smart Cities and Communities, Covenant of Mayors, EERA Joint Programme on Smart Cities, Joint Program Initiative Urban Europe, EU SCIS, ERA-NET on Smart cities and Communities, beside public consultation. The initiative stresses that PEDs raise the quality of life in European cities, contribute to reach the COP21 targets, and enhance European capacities and knowledge to become a global role model. Following this initiative, the temporary technical working group 3.2 (TWG 3.2) was established. Chaired by national representatives from Austria, TWG 3.2 developed in a joint effort a pathway towards PED in Europe, including a technology roadmap. In addition, it specified commitment for planning and implementation actions [
2]. The outcomes of this effort resulted in proposing an integrated approach to tackle the interdisciplinary challenges of PEDs covering technological, economic, financial, legal, and regulatory aspects within an urban perspective. Moreover, it recognised the crucial role of cities on the way to realise PEDs together with the vital contribution of key stakeholders from research, industry, real state, and funding and financing, beside other fields.
Based on this initiative, the transnational Joint Programming Initiative Urban Europe (JPI-UE) has been working to provide a programme management structure for PEDs research activities. It aligns research efforts with cities’ needs and their apprehended future sustainable development goals, including the deployment of PEDs. The JPI programme seeks, for its implementation, the contribution of stakeholders of city authorities, research organisation, industry, energy suppliers, and citizens’ organisations. [
3].
Considering the attractiveness of the PEDs concept for sustainable urban development, numerous initiatives have been taken to develop solutions, roadmaps, and business models for planning and implementing PEDs [
7,
8]. Such initiatives benefit from the wealth of experiences gained in the construction of positive energy buildings (PEBs) that form the building blocks of future PEDs, leveraging innovative technologies for building, integrating, and managing buildings within an integrated neighbourhood energy system.
The IEA Annex 83 “Positive Energy Districts” [
9], a research network under the auspices of the International Energy Agency (IEA), is currently documenting the international state of the art. Besides several European Universities and research organizations, it involves participants from Canada, Australia, Japan, and China (Hong Kong). In the United States of America, for example, researchers from the National Renewable Energy Laboratory (ENREL) have developed a definition for a “Zero Net Energy Community” [
10]. NREL is also involved in the Smart City project and Zero Energy District “Peña Station” in Denver [
11]. These initiatives show that the interest in PED is growing rapidly, not only in Europe, but also globally.
However, PEDs are still in the early stage of their introduction with a significant need to overcome a multitude of challenges spanning across technological, financial, environmental, societal, and regulatory domains. This stems from the fact that a PED is not just an energy standard, but rather an innovative concept to promote the sustainable development of urban energy systems on a district scale with significant impact on the development of our future cities, which are committed to a sustainable and low-carbon pathway to ensure high viability and affordability of urban services for all residents.
3. From Zero Energy Buildings to Positive Energy Districts
The concept of PEDs is related to the concept of Near Zero Energy Buildings (NZEB) and Zero Energy Buildings, for which several concepts have been developed and demonstrated worldwide. Not only do Net Zero Energy Buildings (NZEBs) and Zero Energy Buildings (ZEB) not consume energy, but they also generate renewable energy onsite. This allows for a high share of self-consumption and thus a reduced carbon footprint [
12].
Many studies have analysed how buildings can be designed, built, maintained, and refurbished to become NZEBs or even ZEBs [
13]. The findings of these studies provide valuable insights into the development of PEDs. However, there are significant differences in the challenges that need to be taken when an NZEB is planned and a PED is developed. However, framework conditions for the planning and implementation of a Zero Energy Building and Positive Energy Districts differ significantly:
Zero Energy Buildings are usually new buildings, planned and built by one developer. The architects, engineers, and other technical experts are involved in the project work on behalf of this developer. This means that plans and other data are exchanged freely within the planning team. After the realization, the building is usually operated and maintained by a single building operator on behalf of the owner. Positive Energy Districts, however, usually consist of already existing buildings, with new buildings as infills. Typically, the buildings have several owners and operators. Information on energy consumption and building technology tends to be incomplete. The transformation of a neighbourhood into PED takes longer than the planning and construction of a ZEB, as not all necessary measures can be implemented at the same time. During the planning and implementation of PEDs, a multitude of actors need to be involved, including not only the building owners, but also tenants, energy utilities, and several branches of the city administration. For the operation phase, a multi-party energy management system and contractual arrangements for the exchange of energy (e.g., in the form of a Renewable Energy Community) must be set up. Due to these structural differences, PEDs require different planning approaches and tools than ZEBs. This applies to the pre-assessment, planning, and monitoring and evaluation phases. In this article, we will present a planning method that allows to pre-assess which urban neighbourhoods have the potential to become a PED, based on urban space types.
Urban space types have been used in several studies in urban energy planning. Everding and Kloos [
14] developed prototypes for solar urban neighbourhoods, relating to 14 urban spaces found in many cities. Genske, Jödecke, and Ruff [
15] developed a tool to identify the potential of renewable energy supply within different types of typologies of urban neighbourhoods and open spaces. The tool assesses the potential of not only roofs in generating renewable energy, but also façades as well as the immediate surroundings of buildings, urban open spaces, and the urban subsoil. An updated version of this tool is described in Everding, Genske, and Ruff [
16], where their energy model is discussed in detail. Another example of the use of space types to model urban energy demand and potential for renewable energy was developed by Hegger and Dettmar [
17]. Their typology of urban spaces provides information on the energy and structural characteristics of typical settlement forms. In addition, they characterize green open spaces, water areas, and street spaces by energy requirements and potential. Although several typologies and related urban energy models have been developed in recent years, they have so far not been tailored for the pre-feasibility assessment of PEDs.
4. Approach and Methodology for Evaluating Positive Energy Districts (PEDs)
Bringing PED concepts into implementation requires conducting pre-feasibility studies that rely on mapping promising urban typologies and examine their conversion potential towards PEDs. This article presents a new approach to assess the potential of different urban typologies to reach a PED standard, based on typology, for urban neighbourhoods. The aim is to provide an easy-to-use and applicable approach to test and inspect the potential for implementing PEDs in cities and municipalities that aim towards a carbon-neutral future.
Our work is embedded within this realm and provides its scientific contribution in two-folds. First, offering a systematic approach for mapping urban typology and examining their conversion potential towards PEDs, considering the social, technological, climate and urban planning criteria of the nominated sites. Second, conducting a simplified quantitative energy assessment of the selected site to define and specify the needed measures to attain a PED with annual positive energy balance.
Building on the elaborated approach of defining and specifying PEDs, a simplified concept was developed to evaluate the suitability of different urban typologies to generate more energy than it consumes and reach the status of one of the defined PED types. For this purpose, the bottom-up modelling tool MAPED (Model for Energy Analysis of Positive Energy District) was developed. MAPED enables the user to analyse and evaluate the energy demand-supply of urban districts and additionally offers the possibility to test different scenarios and implementation measures to explore the transformation pathways towards a PED.
To retrieve a typical district’s potential to become a PED, the following steps need to be followed:
- -
Identification of relevant urban typologies (detached housing area/single-family homes (SFH), terraced housing (TH) area, multi-family housing (MFH) area, apartment blocks (AB)) for different construction classes,
- -
Data collection as input for the MAPED tool using the GIS-based approach to extract area boundaries, population, built-up area, building footprints, etc.,
- -
Mapping and modelling the district energy system within MAPED,
- -
Analyses of different supply options and related conditions for implementation.
4.1. Selection of Different Urban Typologies
To ensure applicability in European cities, it was important to select different urban typologies that can be refurbished and built elsewhere as well. Based on Vienna´s urban neighbourhood typology that was developed by the Municipal Department for Urban Development and Planning [
18], four typologies were selected (
Figure 2):
Detached housing built 1961–1980: 91% single-family homes (SFH), 9% terraced houses (TH)/multi-family homes (MFH),
Dense inner-city area (Gründerzeit), built before 1919: ~100% MFH,
Medium dense area built between 1961 and 1980 (economic boom): 63% SFH, 5% TH, 32% MFH, non-residential use with about 7% of the gross floor area,
Detached housing constructed from 2006: 100% SFH.
Figure 2.
Selected urban typologies (according to [
19]).
Figure 2.
Selected urban typologies (according to [
19]).
4.2. Mapping of District Data
Based on the typologies, the selected areas were assigned data in a further step. The data was derived from the official buildings and dwellings register [
20], mapped to statistical grid cells of 250 m× 250 m from the statistical office (Table 1). The dataset contains important data for the analyses with MAPED, such as population, buildings by type of use (e.g., residential building with number of dwellings, hotel, office building, retail, agricultural use, etc), and buildings by construction period. By means of geographic information systems (GIS) and various geodata layers, relevant parameters were extracted and calculated within the 250 m grid typology, such as the districts´ total, gross, and built areas; type, size, and height of residential and non-residential buildings (dwelling and service), and population and number of dwellings. Based on the selected typologies and the related official buildings and dwellings register, the key data needed to conduct the simplified energy demand-supply analysis for the considered districts were prepared (Table 2).
4.3. Short Description of the MAPED (Model for Energy Analysis of Positive Energy District) Model
MAPED is a bottom-up rapid energy assessment tool for analysing the energy demand and supply of urban districts and assessing their qualification to reach an annual positive energy balance by exploiting local RES to cover a district’s electricity and heat demand. MAPED was developed by AIT, based on the proven end-use concept of the IAEA model MAED [
21]. MAPED focuses on the evaluation of useful and final energy demands at the district scale, covering energy demands for residential and non-residential building, urban farming, industry, and mobility. Moreover, it offers a simplified approach to evaluate and estimate local renewable energy production to cover heat and electricity demands using photovoltaic, solar thermal energy, and heat pumps. Other local supply options like biomass, waste heat, and micro wind can be also considered, given the prevailing boundaries, topology, social acceptance, and the applied regulations (
Figure 3). The MAPED approach evaluates final and useful energy demands based on the demographic, social, and technological data of the considered district and services to the social, economic, and technological factors that affect the demand for a particular fuel (this could also include urban farming and local industrial activities in case of their existence). This implies population number and growth, number of inhabitants per dwelling, number of electrical appliances used in households and services, peoples’ mobility and preferences for transport modes, evolution of the efficiency of certain types of equipment, and market penetration of new technologies or energy forms. The expected future trends for these determining factors, which constitute ‘scenarios’, are exogenously introduced. This enables evaluation of the needed measures to convert the considered district to a PED within the given demographic, social, technical, and building types’ specifications.
For the analysis of energy usage in households, five types of dwellings are included, each type described by the size of the apartment/house, number of people living in each type, and energy efficiency of each type for heating and cooling. The service sector (non-residential building) is modelled based on the type of economic activities that affect the type of buildings, and their energy uses. Thus, five groups of service activities are considered, covering offices, educational institutions, shopping and commercial activities, hospitals, hotel, and restaurants. This feature allows for a realistic analysis of energy demands and enables to explore the possibility of a “Positive Energy District”, given the type of building operational energy and the potential of local renewables and their technical exploitation. Based on the conducted district energy demand-supply analysis, key indicators are generated to evaluate the district self-sufficiency to cover its energy demand and achieve a positive annual energy balance.
4.4. District Input Data for MAPED (Model for Energy Analysis of Positive Energy District) Analysis
Following the above-described end-use approach of MAPED, several input parameters are needed to conduct a final energy demand analysis describing the current state and the conceived future development towards the set target of a PED, assuming to be reached by 2040. Beside the specified urban typology (
Table 1), the input data cover the following categories:
Demographic, social data: total population, dwelling size, person per dwelling, share of each dwelling type,
Climate data: heat degree days (HDD) and cooling degree days (CDD),
Technological data: average heat loss coefficient of building envelope, efficiency, and penetration rates of final fuel consumption by end-use category (e.g., share and efficiency of gas and biomass for covering space heating), share of dwelling area cooled,
Specific energy consumption data: current final energy consumption by fuel type and end-use form for space heating and cooling, water heating and cooking, lighting, appliances,
Potential of local renewables: estimated potential for PV on rooftop area, facades, open land area, and transport infrastructure area in the district.
Table 1.
Base data of the selected urban typologies.
Table 1.
Base data of the selected urban typologies.
| Data Description | Detached Housing
1961–1980 | Dense Inner City before 1919 | Medium Dense
1961–1980 | Detached Housing 2006 |
|---|
| | ![Energies 14 04449 i001]() | ![Energies 14 04449 i002]() | ![Energies 14 04449 i003]() | ![Energies 14 04449 i004]() |
| Total area [m2] | 62,500 m2 | 62,500 m2 | 125,000 m2 | 62,500 m2 |
| Gross floor area [m2] | 23,760 m2 | 100,250 m2 | 66,510 m2 | 19,400 m2 |
| Share of residential area | 100% | 100% | 93% | 100% |
| Share of service area | - | - | 7% | - |
| Service sector floor area | - | - | 1970 (22% nonresidential: 11% commercial and 11% hotels/restaurants) | - |
| Built-up area [%/m2] | 27%/17,170 m2 | 50%/31,520 m2 | 19%/23,200 m2 | 17%/10,420 m2 |
| Traffic area [%/m2] | 17%/10,330 m2 | 30%/18,760 m2 | 20%/24,440 m2 | 16%/10,210 m2 |
| Green area [%/m2] | 56%/35,000 m2
(private green) | - | 2%/2000 m2
(public green) | 9%/5450 m2
(public green) |
| Population | 312 | 2512 | 1071 | 376 |
| Number of dwellings | 154 | 1429 | 521 | 143 |
Single-family homes
[share/area in m2] | 91%/150 m2 | - | 63%/150 m2 | 99%/150 m2 |
| Building with 2 dwellings [share/area in m2] | 2%/75 m2 | 1%/75 m2 | 5%/75 m2 | 1%/75 m2 |
| Building with 3 or more dwellings [share/area in m2] | 7%/65 m2 | 99%/65 m2 | 32%/65 m2 | - |
The specific energy consumption data per dwelling (and dwelling size) and by end-use activities of water heating, cooking electricity consumption of appliances were collected from the energy survey on household energy consumption of statistics in Austria [
22]. The current technical state of building insulation for the considered typologies and building types refers to the standard energy performance certificate of the defined “generic building types” for Austria provided by the TABULA Typology structure of the EPISCOPE project [
23,
24]. To reach the status of a PED, measures specifically targeting the framework conditions and challenges for each typology must be applied. While it is difficult for dense inner areas to harvest locally available energy sources due to the limited availability of space for renewable infrastructure plants like large-scale PV on open land, it is easier for detached housing districts due to more land availability. Another limiting factor in multi-family-houses is the dependency on many tenants if some plants are to be refurbished or newly built.
Table 2 presents exemplarily the data used for the first type, “Detached housing”.
For future developments towards the PED 2040 target, the following assumptions have been applied:
Adopting effective building refurbishments to reach an advanced level of space heat energy performance, according to the Austrian building standard OIB RL 6 for low energy buildings [
25],
Significant efficiency improvements in space and water heating, lighting, and appliances over the period of 2020–2040,
Fuel switch from fossil to renewable supply with focus on electrification of end-use activities of cooking, space heating, and water heating via a heat pump (HP) beside solar thermal energy (ST),
No biomass (BM) is considered,
Increasing the penetration rate of HP and ST to fully cover the heat demands for space and water heating by 2040, as follows:
- -
Space heating: 75% HP, 15% ST, and 10% direct electricity as a backup system for ST
- -
Water heating: 63% HP, 30% ST, and 7% direct electricity as a backup system for ST
Improvement in the Coefficient of Performance (COP) of HP by around 37% to reach 3.8 by 2040,
Utilisation of the top local renewable energy potential with focus on PV and ST, aiming at meeting the annual electricity and heat demands from local renewables,
Interaction with the electricity grid of the city, beside local power storage, has been assumed but not explicitly modelled,
Increasing the share of dwellings requiring cooling from 5% to 20% over the period of 2020–2040
No change in population number, person per dwelling, Heating Degree Days (HDD), and Cooling Degree Days (CDD).
Table 2.
Annual key parameter for modelling the energy demand of the detached housing district.
Table 2.
Annual key parameter for modelling the energy demand of the detached housing district.
| Data Description | Current State 2020 | PED-Target 2040 |
|---|
| Population | 312 | 312 |
| HDD/CDD | 2919/857 | 2919/857 |
| Heat loss coefficient (W/m2K)/ EPC 1 (kWh/m2a) | 2.06/144.3 | 1.0/70 |
| Water heating (kWh/cap) | 1054 | 843 |
| Cooking (kWh/dw) | 500 | 500 |
| Lighting (kWh/dw) | 365 | 292 |
| Appliances, non-shiftable (kWh/dw) | 838 | 670 |
| Appliances, shiftable (kWh/dw) | 1146 | 917 |
| Penetration of energy forms into SH: elec./district heating/fossil/BM/ST | 12.8%/32%/50.2%/2.5%/2.5% | 85%/-/-/-/15% |
| Penetration of energy forms into WH: elec./district heating/fossil/BM/ST | 18.9%/35.6%/36.8%/0.4%/8.3% | 35%/-/-/65% |
| COP of HP | 2.5 | 3.8 |
5. Results and Discussion
Following the above-presented concept and the compiled input data, a detailed energy demand-supply analysis has been conducted for each of the four considered districts. The following sections demonstrate the results for the typology of the first district type (Detached Housing District). The remaining three typologies are addressed in a similar way.
5.1. Energy Demand
The adopted transformation measures on the demand side in terms of efficiency improvement and electrification of end-uses will boost the overall district energy efficiency by 66.2%, resulting in annual district final energy demand reduction from 3.94 GWh to 1.33 GWh. The applied fuel switching and electrification for end-use will lift the share of electricity from the current 20% to 72% of the total final demand of the projected PED. The resulting average annual final energy demand per dwelling will decrease from the current 25,552 kWh/Dw (dwelling) to 8640 kWh/Dw of the targeted PED, corresponding to 179 kWh/m
2 and 61 kWh/m
2, respectively (
Figure 4). The decrease of space heating from the current 80% to 50% for PED state is remarkable, beside the increased share of appliances from 7% to 18%. The achieved reduction in space heat final energy demand, which dominates and drives the desired transition to PED, is the direct result of two combined measures, namely effective building refurbishments and the shift to highly efficient HP—its share is assumed to rise from the current 3.4% to 70%.
The specific final energy for space heat demand is estimated to drop from 144 kWh/m2 to 30.6 kWh/m2 and the useful space heat demand (corresponding to the EPC) from 128.8 to 70 kWh/m2, following the adopted effective building refurbishment. The results indicate a transition from externally provided supply in terms of fossil fuel and district heating to local supply of HP and ST.
5.2. Energy Supply
The observed transformation will be enabled mainly through the electrification of final energy, enabled by the local renewables supply of PV, besides the contribution of ST to cover part of the hot water and space heating. On an annual basis, around 72% of the district final energy demand will be provided by PV and 28% by ST (
Figure 5). Around 76% of ST will be devoted to HW and the remaining 24% to SH. Local PV-generation covers the remaining HW demand, main part of SH (76% via HP), and all electricity demands for appliances, lighting, space cooling (SC), and cooking. Moreover, it is assumed that the district will interact with regional electric and heat networks in the neighbourhood to account for the needed flexibility to compensate for energy deficit and surplus over various periods of the year. The technical potential of PV depends on available areas of rooftops, south facades, open land, and transport infrastructure. For a realistic harnessing of the local renewable energy of the detached housing district, the following combination was adopted after intensive consultation with building developers:
40% of the roof top area is used for PV panels: intense consultations with real estate developers reveals that no more than 60% of the roof area can be utilised for the installation of PV or solar thermal. The adopted figures in this analysis is based on experts’ recommendations.
5% of the roof top area is used for ST collectors,
10% of the south façade is used for PV panels.
The resulting electricity generation density (yield per square meter) for PV amounts to 144.7 kWh/m
2, comparable to the documented average value of 153.8 kWh/m
2 for Vienna (MA20, 2018). For solar thermal, the resulting thermal generation density is around 447.5 kWh/m
2, which is close to the highest confidence value specified for Vienna in the range of 450–600 kWh/m
2 for the low temperature heat [
26]. The resulting annual output is 1.054 GWh for PV and 0.384 GWh for ST.
Figure 5.
Key development indicators of transforming the detached housing district to PED (source: AIT). EL—electricity; SH—space heating; ST—solar thermal.
Figure 5.
Key development indicators of transforming the detached housing district to PED (source: AIT). EL—electricity; SH—space heating; ST—solar thermal.
The exploitation of local renewables will evolve during the process of building refurbishment, which will proceed within a participatory process following a common agreement among the tenants/owners of the buildings in the considered district. With regards to the regulatory challenges for deploying PEDs, such a process can be triggered and accelerated by the applied incentives and promotion measures, beside the introduced regulations by the considered municipality, a governance challenge that needs to be tackled hand in hand with other challenges to enable the desired transition towards PED.
5.3. Flexibilization Need
The energy consumption of electricity and heat follows certain load profiles that change over days, weeks, and seasons showing periods of high demand (in the evening and during the cold winter days). In the current energy system infrastructure, the needed flexibility is offered completely by the supply system provided by the national/regional electricity grid (and gas and district heat grid), besides the big storage facility for fossil fuel. However, with the increased share of intermittent renewable energy sources (RES), additional flexibilisation options are neded, like local electric and heat storage. Since these measures have limited availability at the district scale (due to cost and operational management issues), the interaction with the regional energy supply infrastructure, e.g., regional electric grid and district heat grid, are indispensable in offering feasible solutions to help overcome the supply deficits, particularly in the winter time, and manage the energy surpluses produced in summer.
Figure 6 presents the approach applied to handle flexibility needs to ensure adequate heat supply around the clock. Using typical normalised monthly load curves for space heating and hot water demands, beside the production curve of solar thermal in the considered district site, the figure demonstrates the periods of deficit and excess of heat supply through solar thermal energy. Based on the specified potential of ST, 76% of hot water and 24% of annual space heat demands can be covered by the installed solar thermal systems. However, cumulative heat excess and heat deficits that are compensated on an annual basis need further flexibility measures to manage the timely mismatch between demand and supply curves. The flexibility need is assumed to be achieved by interaction with the regional electric grid and district heating network, which are assumed to absorb heat excess in summer and provide compensation in winter. Other alternatives might be the availability of local heat storages. Similar behaviour is observed by comparing the PV supply curve with the electricity demand curve cumulating all electricity end-use (for HP, lighting, and appliances). In this case, flexibility will be ensured by interaction with the regional electric grid, beside locally available electricity storages.
Table 3 summarizes comparatively the main results of evaluating the PED suitability of the four evaluated typologies in Vienna, elaborated in terms of select KPIs.
The results show that with the applied energy demand-supply measures, “Detached Housing” has the potential to become a PED with an annual positive energy balance of 110% of electricity supply with PV and 103% of heat supply with ST. The New Detached Housing fails to reach the PED-status by 10% due to the lower density of buildings, which means that fewer façades and roof surfaces are available for PV or solar thermal energy; the Medium Dense Housing fails by around 38%; and the Dense Inner-City by 55%. Hence, with further improvement in energy performance (there is still good potential for further energy performance improvement by enhancing the building shale insulation and using energy efficient window (e.g., adaptive thermochromic glazing with double glass). It is a matter of cost as such measures will go beyond the current standard of building refurbishment) and slightly increased use of open area for PV-panels, New Detached Housing can attain the status of PED. The results also reveal that the higher the buildings and the fewer open spaces in the district, the more difficult it becomes to achieve a PED status within the defined geographical boundary of the district.
Figure 7 depicts the evolution of key indicators used to demonstrate the transition from the current state to a PED for the various considered typologies depicted for the specific final and useful energies.
Finally, it is noteworthy that the realisation of a PED depends further on the cost of the proposed energy demand-supply measure of eco-refurbishment, electrification of the end-uses, and harnessing the locally available areas of rooftops, facades, and open places for PV and ST.
6. Conclusions and Outlook
The concept of PED represents a promising innovative solution with great leverage for the realization of urban energy and climate goals. It promotes urban change towards energy-optimized, integrative, and resilient cities. Given the fact that cities are responsible for about 75% of energy consumption and 80% of GHG emission—with the building sector alone responsible for around 28% [
27,
28]—the expected impact of implementing and deploying PEDs within Europe will have a significant role in enabling the targeted urban energy system transformation, given its high potential for energy-saving and local renewable energy integration.
Our study analysed the potential of four selected urban typologies to achieve a positive annual energy balance and thus become PEDs. Among the analysed typologies, the detached housing neighbourhood built between 1961 and 1980 shows the potential to become a PED under the given assumptions, and the more-energy efficient, but also significantly denser detached housing neighbourhood built after 2006 comes very close to the PED standard. The medium-dense neighbourhood built between 1960 and 1980 comes close to renewable self-sufficiency for heat supply, but is far off for electricity supply, while the inner-city neighbourhood built before 1919 does not show potential to become a PED. The results clearly show that PEDs require not only a very high level of energy efficiency, but also sufficient open spaces (including roofs and facades) for the local generation of renewable energy. If these two criteria are met, and the density of the neighbourhood does not become too high, the PED standard can be reached. An integrated planning process aligning urban and architectural design and energy planning is therefore key for the successful development of PEDs.
Considering that PEDs are expected further to generate an annual surplus of energy that can be used outside the district, PEDs will have a significant impact on the efficient and low-carbon urban energy system transformation once deployed among EU cities. In this regard, the substitution rate of buildings is low, compared to other energy-intensive sectors; thus, PEDs as a new innovative idea will help accelerate the transformation of building stock, given their high promising potential and the expected adaptation by building regulation and certification. This will directly result in accelerating the urban energy system, beside the expected indirect impact of the triggered technological innovation for improving the use of local renewables and flexibilization options, and their impact on the overall energy system.
The demonstrated screening and modelling approach is replicable in other areas and typologies due to its flexible bottom-up approach, which allows integrated energy demand-supply analysis at the district scale. However, there is the need to expand MAPED for improved modelling of flexibilization options, which need an integrated spatio-temporal assessment of the district energy system to capture existing synergies among the different use types (different dwelling types and building usages). It is therefore planned to include improved modelling of flexibilization, which will further enhance the applicability and replication potential of the established methodology. Future activities will deal with the question of designing and building local heat and power storages at the district scale. This effort requires additional considerations analysis based on techno-economic optimisation, considering the limits and constraints related to the interaction between the public heat and power grids and the applied regulatory framework. Further analysis effort is also needed to address the electricity demand for electric vehicle (EV) and the potential of the interaction of building and mobility as an additional flexibilization option.
Author Contributions
Conceptualization by H.-M.N., A.H., V.S; methodology, software, validation, and investigation—A.H., R.S., G.E., H.-M.N.; data curation—R.S., G.E., H.-M.N., A.H. writing—original draft preparation, A.H., H.-M.N., R.S., G.E.; writing—review and editing, H.-M.N., V.S., A.H.; visualization—R.S., G.E., A.H.; supervision—H.-M.N.; project administration—H.-M.N.; funding acquisition, H.-M.N. and G.E. All authors have read and agreed to the published version of the manuscript.
Funding
This journal article presents the results of the study “Aufbereitung städtischer Energiedaten für zukünftige Plus-Energiequartiere” (Preparation of urban energy data for future plus-energy districts), financed by the Republic of Austria via contract FN 252263a.
Institutional Review Board Statement
Not applicable.
Informed Consent Statement
Not applicable.
Data Availability Statement
Not applicable.
Acknowledgments
The authors would like to thank the Federal Ministry for Climate Action, Environment, Energy, Mobility, Innovation and Technology of Austria (BMK) and the Austrian Research Promotion Agency (FFG) for the excellent collaboration.
Conflicts of Interest
The authors declare no conflict of interest.
Abbreviations
| BESS | Battery energy storage system |
| BEVs | Battery-powered electric vehicles |
| BM | Biomass |
| BMK | Bundesministerium für Klimaschutz, Umwelt, Energie, Mobilität, Innovation und Technologie |
| DHCS | District heating/cooling system |
| DSM | Demand site management |
| CHP | Combined heat power |
| Dw | dwelling |
| EV | Electric Vehicle |
| FE | Final Energy |
| GHP | Geothermal heat pump |
| HDD | Heat Degree Days |
| HP | Heat pump |
| HW | Hot water |
| LHCs | Lighthouse cities |
| MAPED | Model for Analysis of Plus Energy District |
| NZEB | net-zero energy building |
| NZED | net zero energy district |
| NPC | Net present costs |
| PEDs | Positive Energy Districts |
| PE | Primary energy |
| PV | Photovoltaic |
| SC | Space cooling |
| SH | Space heating |
| SG | Smart grid |
| ST | Solar thermal |
| TRM | Technology Roadmap |
| UE | Useful energy |
| WH | Water heating |
References
- UN-SDGs. Sustainable Development Goals, 17 Goals to Transfer Our World. 2016. Available online: http://www.un.org/sustainabledevelopment/sustainable-development-goals/ (accessed on 23 April 2021).
- European Commission. SET Plan Action No. 3.2 Implementation Plan; European Commission: Brussels, Belgium, 2018. [Google Scholar]
- JPI Urban Europe. PED Reference Framework; JPI Urban Europe: Vienna, Austria, 2019. [Google Scholar]
- European Parliament, Council of the European Union. Directive 2010/31/EU of the European Parliament and of the Council of 19 May 2010 on the Energy Performance of Buildings; Publications Office of the European Union: Luxembourg, 2010; Chapter 12; Volume 3, pp. 124–146. Available online: https://eur-lex.europa.eu/legal-content/EN/TXT/?uri=celex%3A32010L0031 (accessed on 23 April 2021).
- European Commission. SET Plan—Declaration of Intent on Strategic Targets in the Context of an Initiative for Smart Cities and Communities; European Commission: Brussels, Belgium, 2016. [Google Scholar]
- European Commission. The European Green Deal; European Commission: Brussels, Belgium, 2019. [Google Scholar]
- Polly, B.; Kutscher, C.; Macumber, D.; Schott, M.; Pless, S.; Livingood, B.; Van Geet, O. From Zero Energy Buildings to Zero Energy Districts; National Renewable Energy Laboratory: Golden, CO, USA, 2016. [Google Scholar]
- The Rocky Mountain Institute (RMI). An Integrated Business Model for a Zero-Energy District; RMI: Peshawar, Pakistan, 2017. [Google Scholar]
- IEA EBC—Annex 83—Positive Energy Districts. 2021. Available online: https://annex83.iea-ebc.org (accessed on 23 April 2021).
- Carlisle, N.; Van Geet, O.; Pless, S. Definition of a Zero Net Energy Community. Technical Report NREL/TP-7A2-46065. 2009. Available online: https://www.nrel.gov/docs/fy10osti/46065.pdf (accessed on 23 April 2021).
- Polly, B. Zero Energy Districts. 2009. Available online: https://www.nrel.gov/docs/fy18osti/71424.pdf (accessed on 23 April 2021).
- Hedman, Å.; Ur Rehman, H.; Gabaldón, A.; Bisello, A.; Albert-Seifried, V.; Zhang, X.; Guarino, F.; Grynning, S.; Eicker, U.; Neumann, H.-M.; et al. IEA EBC Annex83 Positive Energy Districts. Buildings 2021, 11, 130. [Google Scholar] [CrossRef]
- Belussi, L.; Barozzi, B.; Bellazzi, A.; Danza, L.; Devitofrancesco, A.; Fanciulli, C.; Ghellere, M.; Guazzi, G.; Meroni, I.; Salamone, F.; et al. A review of performance of zero energy buildings and energy efficiency solutions. J. Build. Eng. 2019, 25. [Google Scholar] [CrossRef]
- Everding, D.; Kloos, M. Solarer Städtebau: Vom Pilotprojekt Zum Planerischen Leitbild; Kohlhammer: Stuttgart, Germany, 2007. [Google Scholar]
- Genske, D.; Jödecke, T.; Ruff, A. Nutzung Städtischer Freiflächen für Erneuerbare Energien; Erschienen: Bonn, Germany, 2009. [Google Scholar]
- Everding, D.; Genske, D.; Ruff, A. Bausteine des energetisch-ökologischen Stadtumbaus. In Energiestädte; Springer Spektrum: Berlin/Heidelberg, Germany, 2020. [Google Scholar] [CrossRef]
- Hegger, M.; Dettmar, J. Energetische Stadtraumtypen: Strukturelle und Energetische Kennwerte von Stadträumen; Fraunhofer IRB Verlag: Stuttgart, Germany, 2014. [Google Scholar]
- Nitsch, D. Wohngebietstypen; Beiträge zur Stadtentwicklung: Vienna, Austria, 2016. [Google Scholar]
- Stadt Wien. Katalog Wohngebietstypen 2016 Wien. Available online: https://www.data.gv.at/katalog/dataset/eab5ce18-827f-44a8-a206-e56f772dfa8b (accessed on 23 April 2021).
- Statistics Austria. Gebäude- und Wohnungsregister; Statistics Austria: Vienna, Austria, 2016.
- International Atomic Energy Agency (IAEA). MAED, Model for Analysis of Energy Demand—User’s Manual; Computer Manual Series No. 18; IAEA: Vienna, Austria, 2006. [Google Scholar]
- Statistics Austria, Overall Energy Consumption of Households, Vienna. 2019. Available online: https://www.statistik.at/web_en/statistics/EnergyEnvironmentInnovationMobility/energy_environment/energy/energy_consumption_of_households/index.html (accessed on 23 April 2021).
- TABULA. WebTool. 2017. Available online: http://webtool.building-typology.eu/?c=all#bm (accessed on 23 April 2021).
- Amtmann, M. Reference Buildings, The Austrian Building Typology, Classification of the Austrian Residential Building Stock; Scientific Report D 6.9; Austrian Energy Agency: Vienna, Austria, 2019. [Google Scholar]
- Österreichisches Institut für Bautechnik (OIB). Requirement for New Buildings and Major Renovations; OIB RL 6 Energie-einsparung und Wärmeschutz; Österreichisches Institut für Bautechnik (OIB): Vienna, Austria, 2019. [Google Scholar]
- Wiener Umweltanwaltschaft (WUA). Zukünftige Chancen der Solarthermie in Wien; WUA: Vienna, Austria, 2008. [Google Scholar]
- International Energy Agency (IEA). Tracking Buildings; IEA: Paris, France, 2019. [Google Scholar]
- Lucon, O.; Ürge-Vorsatz, D.; Zain Ahmed, A.; Akbari, H.; Bertoldi, P.; Cabeza, L.F.; Eyre, N.; Gadgil, A.; Harvey, L.D.D.; Jiang, Y.; et al. Climate Change 2014: Mitgation of Climate Change. In Contribution of Working Group III to the Fifth Assessment Report of the Intergovern-Mental Panel on Climate Change; Edenhofer, O., Pichs-Madruga, R., Sokona, Y., Farahani, E., Kadner, S., Seyboth, K., Adler, A., Baum, I., Brunner, S., Eickemeier, P., et al., Eds.; Cambridge University Press: Cambridge, UK; New York, NY, USA, 2014. [Google Scholar]
| Publisher’s Note: MDPI stays neutral with regard to jurisdictional claims in published maps and institutional affiliations. |
© 2021 by the authors. Licensee MDPI, Basel, Switzerland. This article is an open access article distributed under the terms and conditions of the Creative Commons Attribution (CC BY) license (https://creativecommons.org/licenses/by/4.0/).


 ,
, 

