Article

Development of Empirical Correlation of Two-Phase Pressure Drop in Moisture Separator Based on Separated Flow Model

Innovative System Safety Research Division, Korea Atomic Energy Research Institute, Daejeon 34057, Korea
*
Author to whom correspondence should be addressed.
Energies 2021, 14(15), 4448; https://doi.org/10.3390/en14154448
Submission received: 24 June 2021 / Revised: 19 July 2021 / Accepted: 20 July 2021 / Published: 23 July 2021
(This article belongs to the Special Issue Two-Phase Flow with Boiling Heat Transfer)

Abstract

:
Pressure drop across the moisture separator installed in the steam generator of a nuclear power plant affects the power generation efficiency, and so accurate pressure drop prediction is important in generator design. In this study, an empirical correlation is proposed for predicting the two-phase pressure drop through a moisture separator. To ensure the applicability of the correlation, a series of two-phase air-water experiments were performed, and the results of the present test and of the benchmark test of high-pressure steam-water were used in developing the correlation. Based on the experimental results, quality, dimensionless superficial velocity, density ratio of the working fluid, and the geometrical factor were considered to be important parameters. The two-phase pressure drop multiplier was expressed in terms of these parameters. The empirical correlation was found to predict the experimental results within a reasonable range.

1. Introduction

The moisture separation system of a steam generator in the nuclear power plant is composed of primary separators, a secondary separator, and a steam dryer bank. The system plays an important role in ensuring the safety of turbines and efficiency in power generation. The performance of the system should achieve acceptable steam quality, namely 0.1%, under the various operation conditions. The major parameters related to the criteria are the moisture carry-over (MCO), the steam carry-under (SCU), and pressure drop. The steam-water two-phase mixture is generated from the tube bundle inside the steam generator, so the two-phase pressure drop should be regarded as an important parameter in the optimal design of the nuclear power plant. High pressure drop deteriorates the circulation ratio of the coolant relating power generation efficiency. In addition, the pressure drop data are used to determine the arrangement of the moisture separators. Therefore, a database of the pressure drops across single moisture separators under a wide range of operating conditions is essential to estimate the overall efficiency of the power generation. However, there is a lack of information about the two-phase pressure drop across moisture separators due to the large cost for the experiment involved in the high pressure and temperature conditions.
There have been several attempts to correlate the air-water experimental data under atmospheric conditions with the steam-water two-phase pressure drop [1,2]. For the fluid flow through the simplified flow path, the dimensionless parameters are generally used to express the similarity between the fluid flows under different working conditions, and should have same values in both cases. However, it is difficult not only to define appropriate dimensionless parameters, but also to conserve all the parameters for the flow across the moisture separator due to the complex flow structure inside the separator, such as multi-dimensional two-phase vortex flow and sudden direction change.
In the present study, an empirical correlation predicting two-phase pressure drop in a moisture separator for the OPR1000 reactor was proposed. In South Korea, two types of steam generator are generally used: a combustion engineering (CE) type and a Westinghouse (WH) type. Among them, a moisture separator in the CE-type steam generator, which is used in the ORP1000 reactor, is focused on in the present study. The basic formation of the correlation was based on the two-phase separated flow model, but the parameters constituting the correlation were appropriately selected to predict the two-phase pressure drop data, which include benchmark data in a full-scale steam-water test facility [3] and our own experimental data from an air-water test facility.

2. Strategy to Develop Two-Phase Pressure Drop Prediction Model

2.1. Conventional Two-Phase Pressure Drop Models

The pressure drop of single-phase flow can be divided into frictional pressure drop from viscous dissipation between the fluid and the wall, gravitational pressure drop from the flow direction, and irreversible pressure drop (or form loss) from a sudden change in the flow direction or the cross-sectional area of the flow. In the case of two-phase flow, pressure loss from the interface between two phases is additionally generated. There are several methods to predict the pressure drop of two-phase flow in a pipe; pressure drop depends on the two-phase flow pattern, or how the flow pattern is assumed.
Conventional methods for predicting the frictional pressure drop of two-phase flow can be classified into the following three categories: the homogeneous flow model, the separated flow model, and the drift-flux model [4].
The homogeneous flow model is a simple method that assumes that the velocities of the liquid and gas phases are the same, indicating homogeneous velocity; the pressure drop is estimated using a suitably defined homogenous friction factor for two-phase flow. In the homogeneous flow model, it is important to properly choose the two-phase viscosity correlation, which is expressed in terms of the quality and viscosities of both phases.
The separated flow model considers the phases to be artificially segregated into two streams. This model predicts the two-phase pressure drop by calculating the pressure drop for one of the two phases and then multiplying it by a two-phase friction multiplier (ϕ2). There are several correlations for the two-phase friction multiplier, which are usually deduced empirically.
The drift-flux model considers the relative velocity between the two phases as the most important parameter. In predicting the pressure drop, it is important to properly model the two-phase distribution coefficient and the gas drift velocity. Several models have been reported, and these usually depend on the two-phase flow pattern; Ishii’s models [5] are widely used.

2.2. Flow Characteristics in Moisture Separator and Two-Phase Pressure Drop Model Development Strategy

The flow path from the inlet to the outlet of the moisture separator has a very complex shape. In the case of a CE-type separator, which is the subject of the present study, the flow introduced into the inlet experiences abrupt direction change when it passes through a spinner blade, and sudden flow area change when it passes through the holes in the outer wall of the separator. When passing through such a complicated flow path, even in the case of a single-phase flow, form loss is mainly expected to occur, rather than frictional pressure drop.
The form loss of single-phase flow is usually expressed in terms of a dynamic pressure component and a loss coefficient (K), with different models depending on the type of flow path. Several widely used models exist for standardized flow paths (i.e., sudden expansion, sudden contraction, orifice, valve) [6], but the loss coefficient for the complex flow path should be obtained in a separate experiment.
In the case of irreversible pressure drop for two-phase flow, there exist analytic models for certain standardized flow paths. However, these models are not applicable to the complex flow path through the moisture separator, and so it is necessary to use an experimental approach.
Zeghloul et al. [7] conducted a series of two-phase flow pressure drop experiments using an orifice for the upward flow, and then compared the experimental data with the several two-phase flow pressure drop correlations. Their methodology for experimental data manipulation is briefly introduced, as follows:
  • Establishment of Euler number (Eu) correlation after a single-phase flow test.
  • Comparison with two-phase pressure drop multiplier models after performing a two-phase flow test.
They performed a single-phase test using water as the working fluid, so the ratio of the single-phase flow pressure drop to the two-phase pressure drop was defined as the ‘total liquid two-phase pressure drop multiplier (ϕLO2)’ and used for comparison with existing models.
In the present study, using an air-water experimental facility, single-phase and two-phase pressure drop tests were conducted for the CE-type moisture separator. In a manner similar to that used by Zeghloul et al. [7], experimental data were used to obtain single-phase Euler number and two-phase pressure drop. Then, an empirical correlation of the multiplier was suggested in terms of the influential parameters.
The detailed model development procedure can be summarized as follows:
  • First, the single-phase Euler number is evaluated based on the single-phase air pressure drop test. The Euler number implies the pressure loss coefficient, as expressed in Equation (1).
Eu 1 ϕ = Δ P A ρ A j A 2
where Eu1ϕ is the single-phase Euler number, and ΔPA is the pressure drop of the air flow. ρA and jA are the air density and superficial velocity of the air flow, respectively. The superficial velocity means the volumetric flow rate divided by the cross-sectional area. In the case of the moisture separator models used in the present study, the inner diameter of the separator can was used to estimate the cross-sectional area.
Here, it is assumed that the single-phase Euler number is mutually applicable for both air and water flows.
After obtaining two-phase pressure drop experimental data, ‘total liquid pressure drop’, ΔPLO, is calculated from Equation (2); this is the pressure drop assuming that the whole flow area is occupied by liquid with its own superficial velocity.
Δ P LO = Eu 1 ϕ ρ W j W 2
where ρW and jW are the water density and superficial velocity of water flow, respectively.
2.
From the two-phase pressure drop data and total liquid pressure drop estimated from Equation (2), the total liquid two-phase pressure drop multiplier is calculated as follows:
ϕ LO 2 = Δ P 2 ϕ Δ P LO
where ΔP2ϕ is the two-phase pressure drop, which is obtained from the experiments.
3.
Finally, the empirical correlation of the total liquid two-phase pressure drop multiplier is established considering the effect of major variables representing the physical phenomena of the flow inside the moisture separator on the multiplier.
To verify the above methodology, a series of air-water experiments were performed using full-scale and half-scale CE-type moisture separators. In developing the empirical correlation, benchmark data in a full-scale steam-water test facility were also used.

3. Experimental Setups and Methods
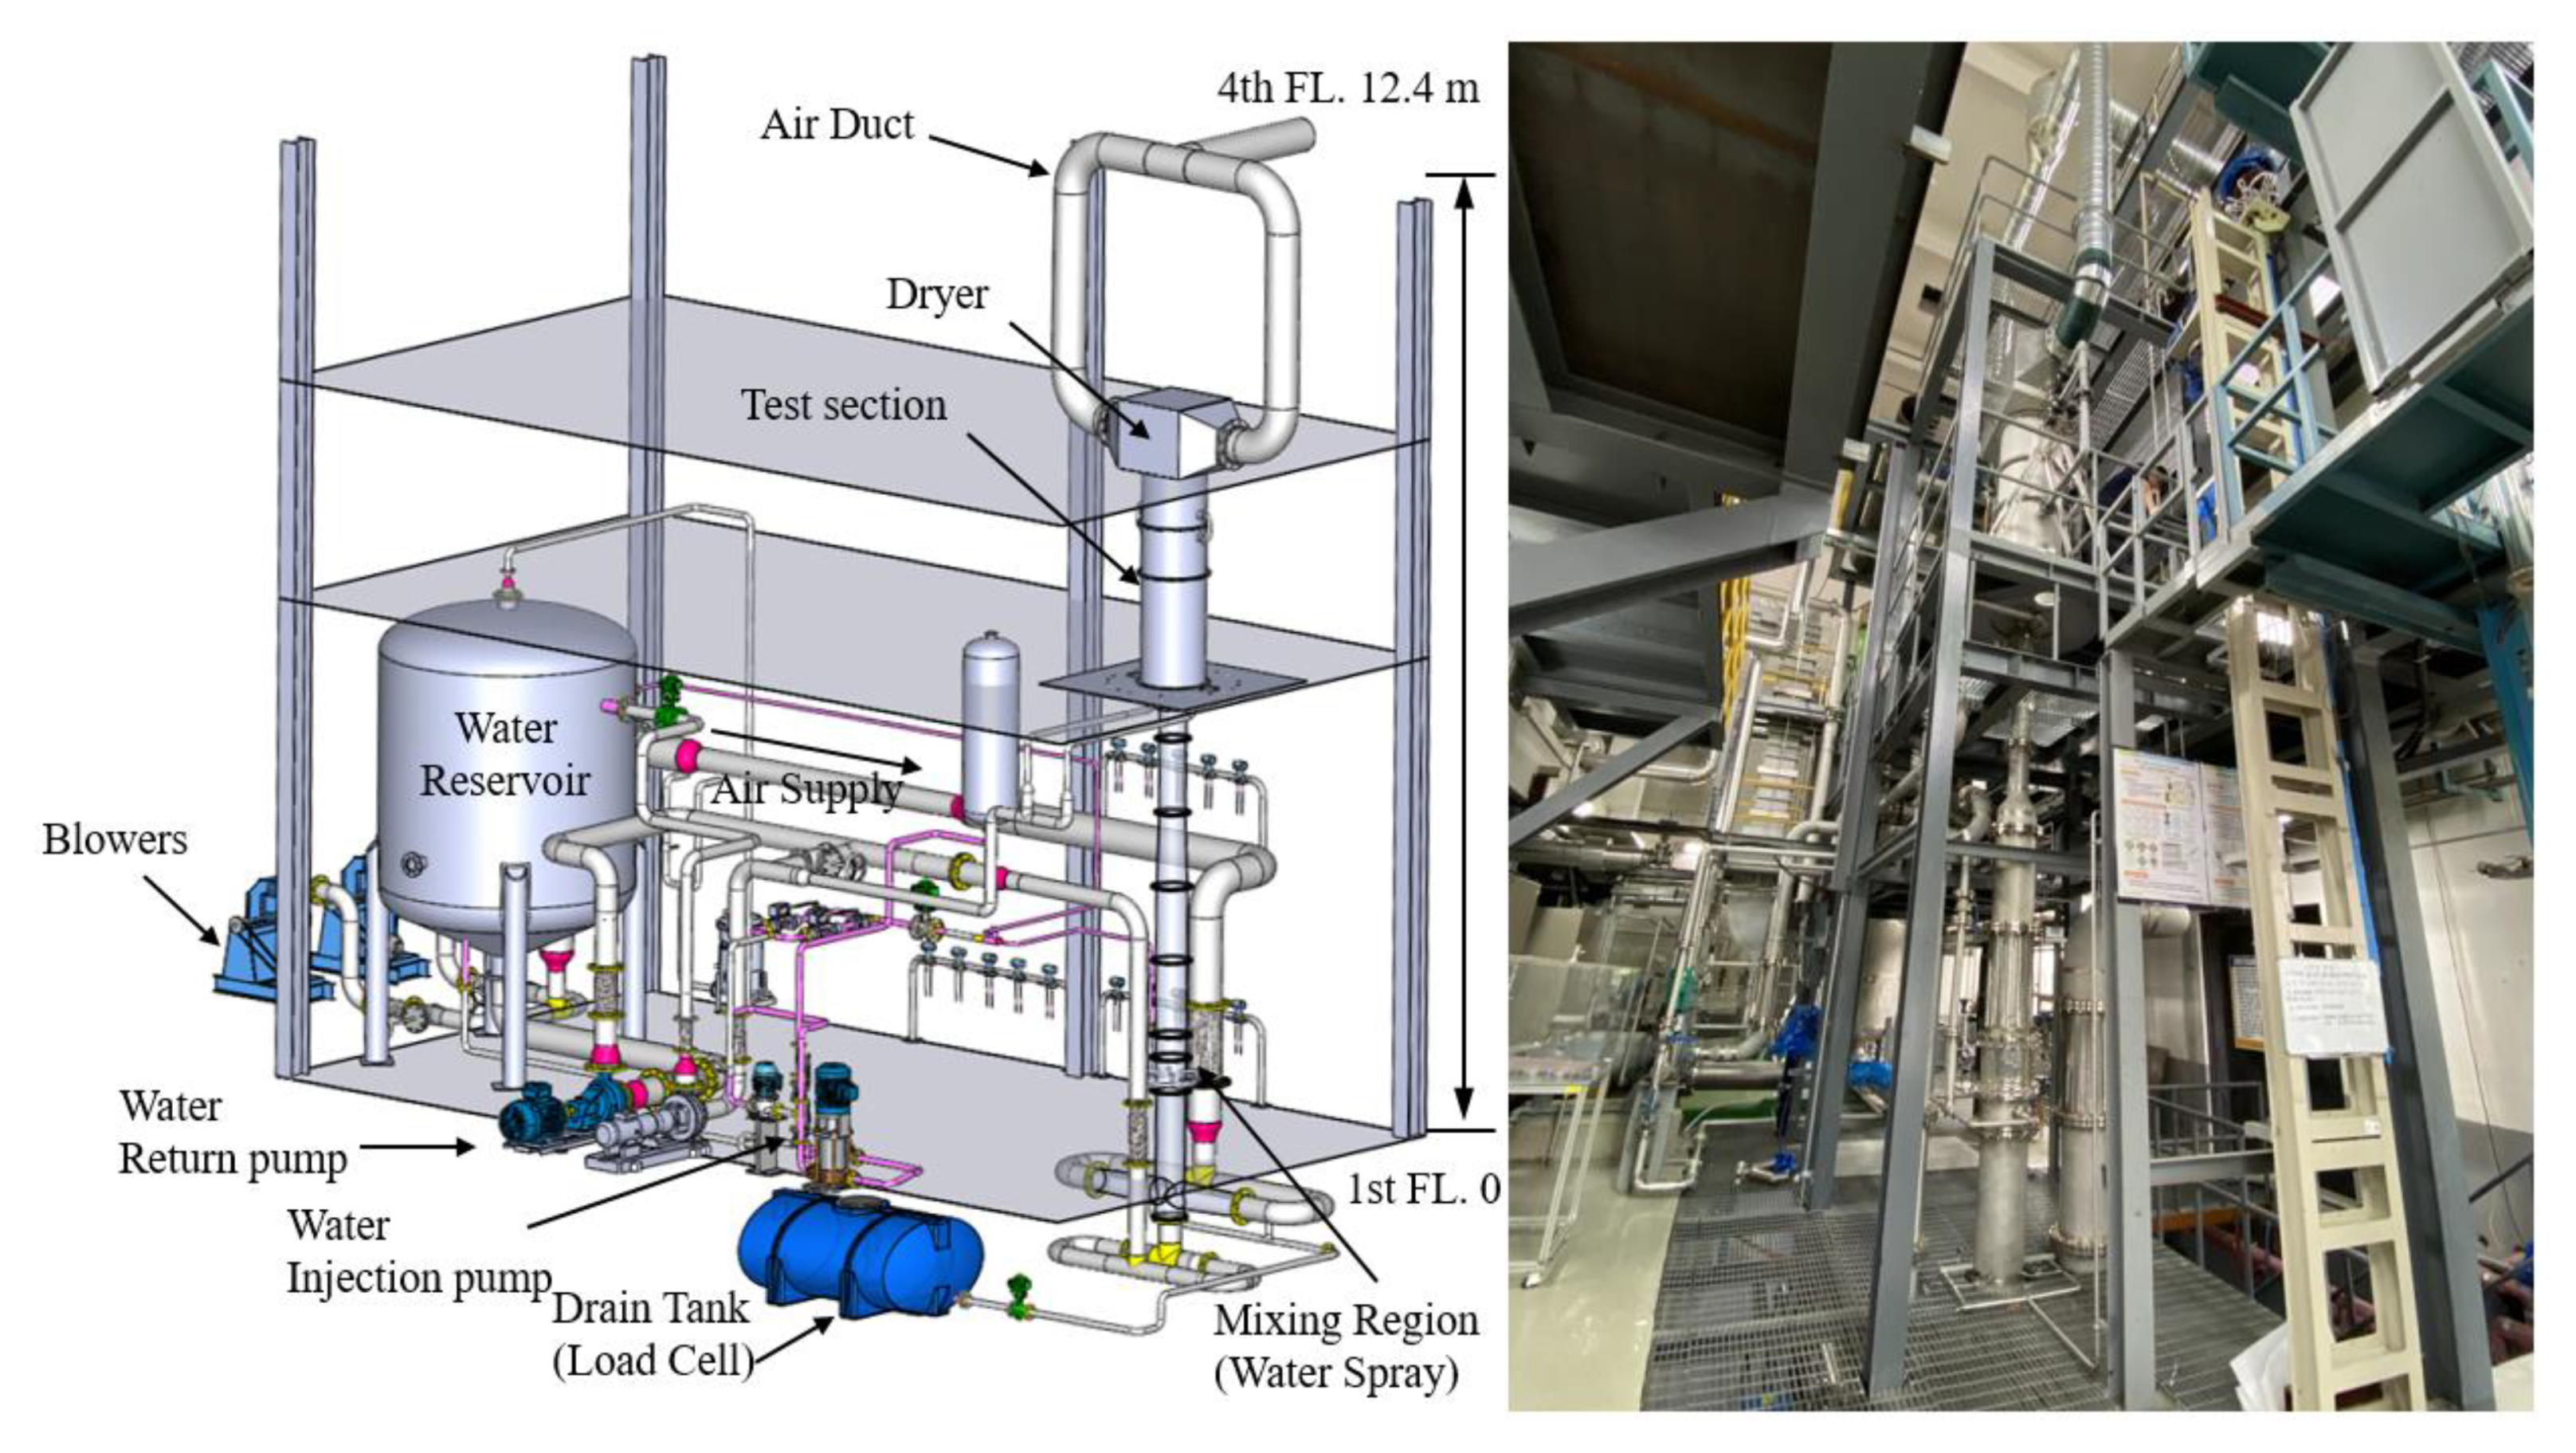
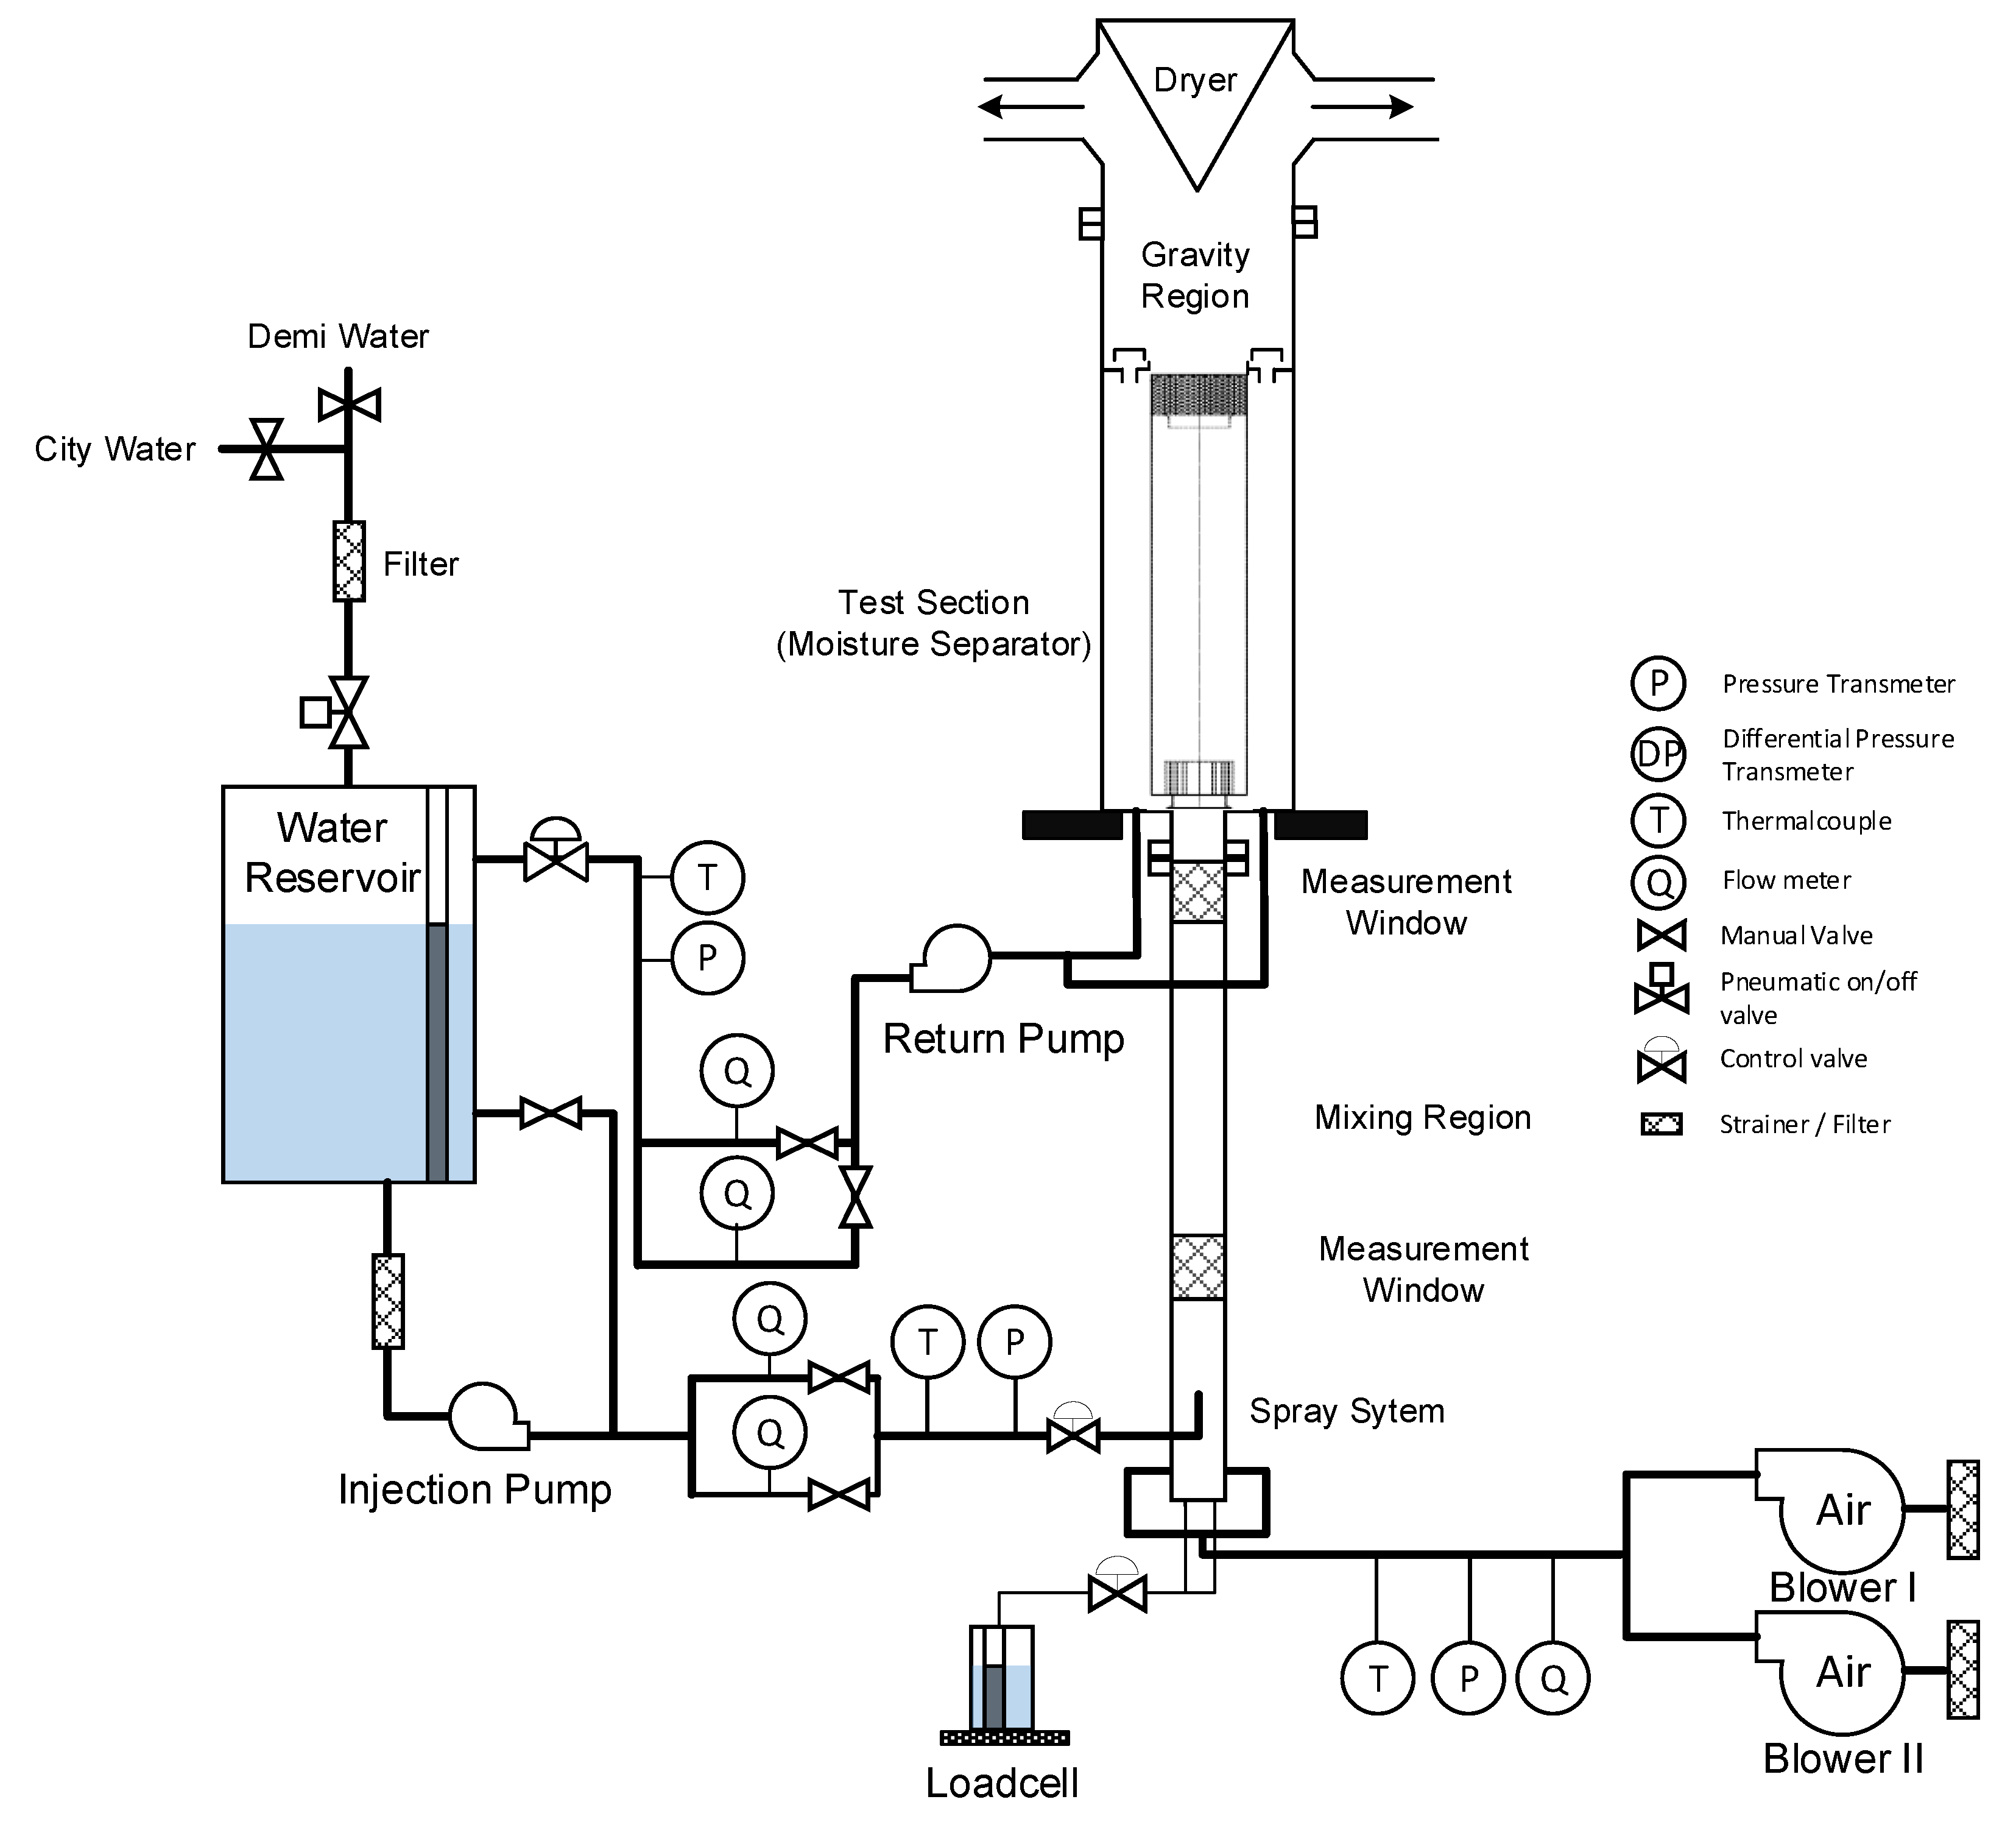
3.1. Fluid System

The Performance Evaluation of a Moisture Separator (PEMS) test facility was constructed to investigate the performance of the single moisture separator, as shown in Figure 1. The test facility is composed of a test section, an air supply loop system, a water supply loop system, and a mixing region. The various types of model separator could be installed on the test section without changing the supply loop systems. The water and air are supplied to the mixing region by using pump and blowers, respectively. In the mixing region, a spray nozzle is installed to generate the small liquid droplets, and the droplets are mixed with the air flow passing through the inlet pipe. The design specifications are summarized in Table 1, and the details of the test facility is described in the authors’ previous research [8]. The volumetric air flow rate is measured by vortex flow meter, and the corresponding mass flow rate is calculated from the air density estimated from the pressure and temperature measured near to the flow meter. The water flow rates are measured by two types of flow meters, vortex and magnetic flow meters, to cover a wide range of the flow conditions. The accuracy of the measurement instrumentations is summarized in Table 2. The configuration of the test loop, including measurement points and the instrumentation, is shown in Figure 2.

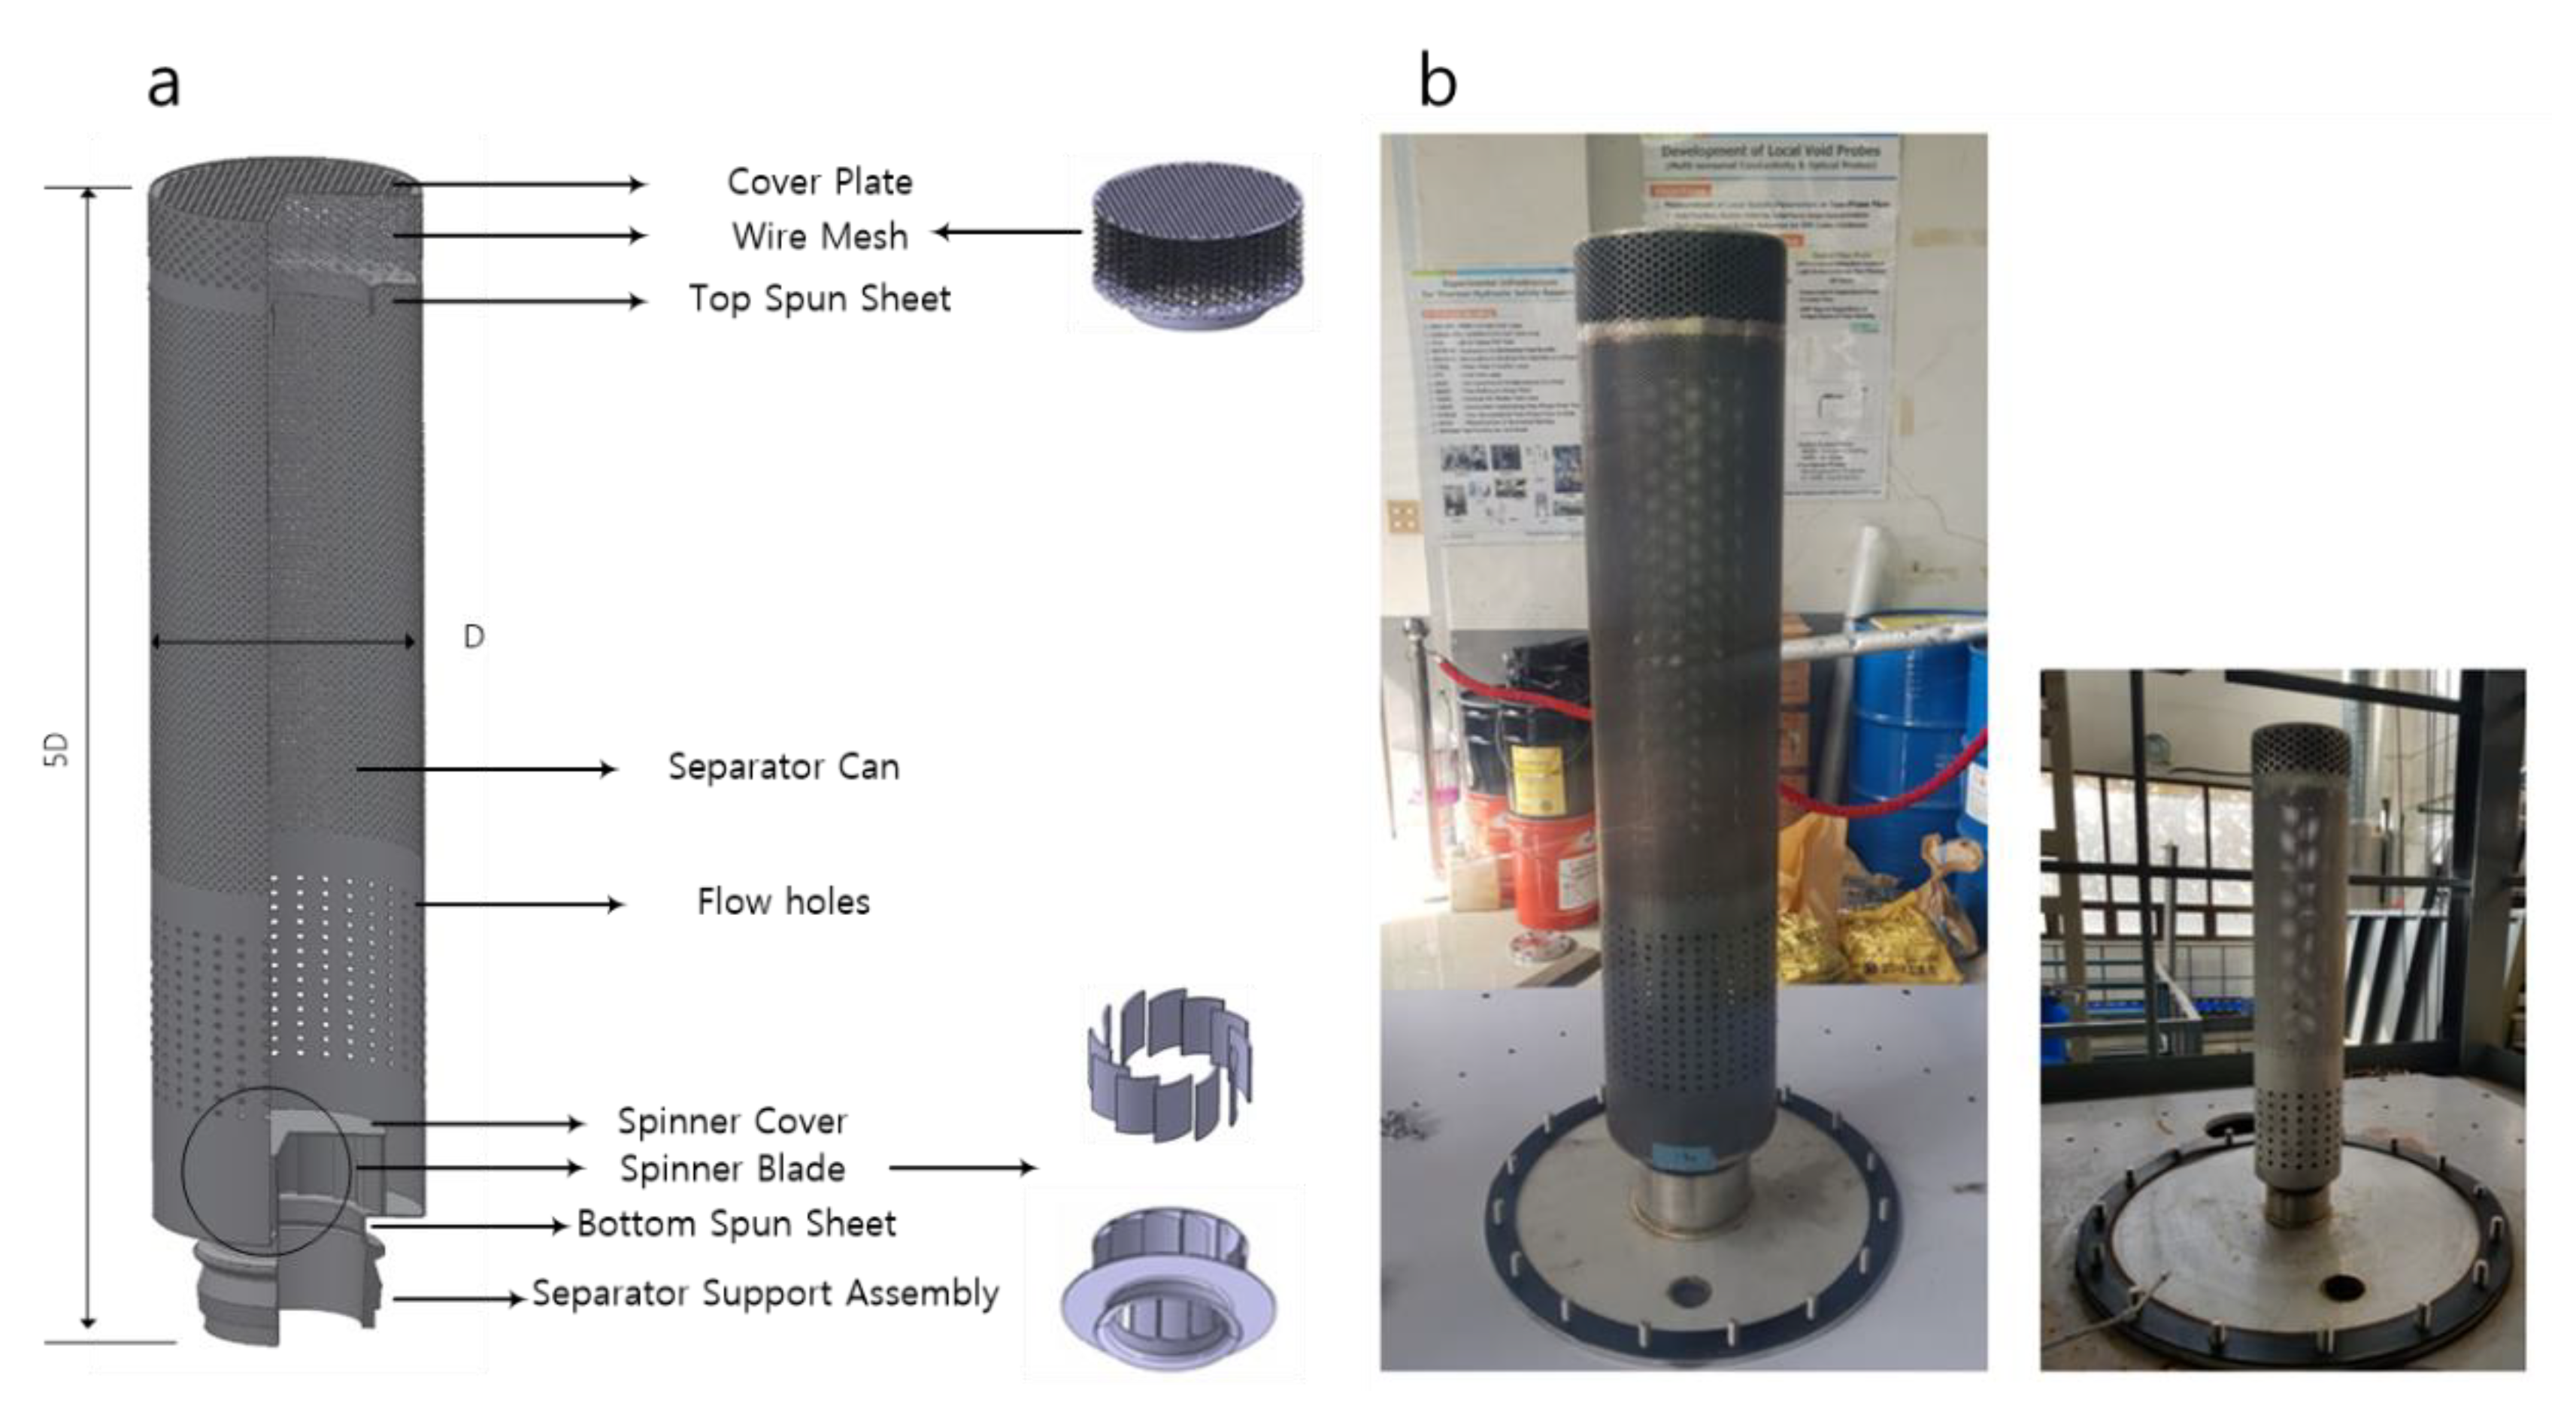
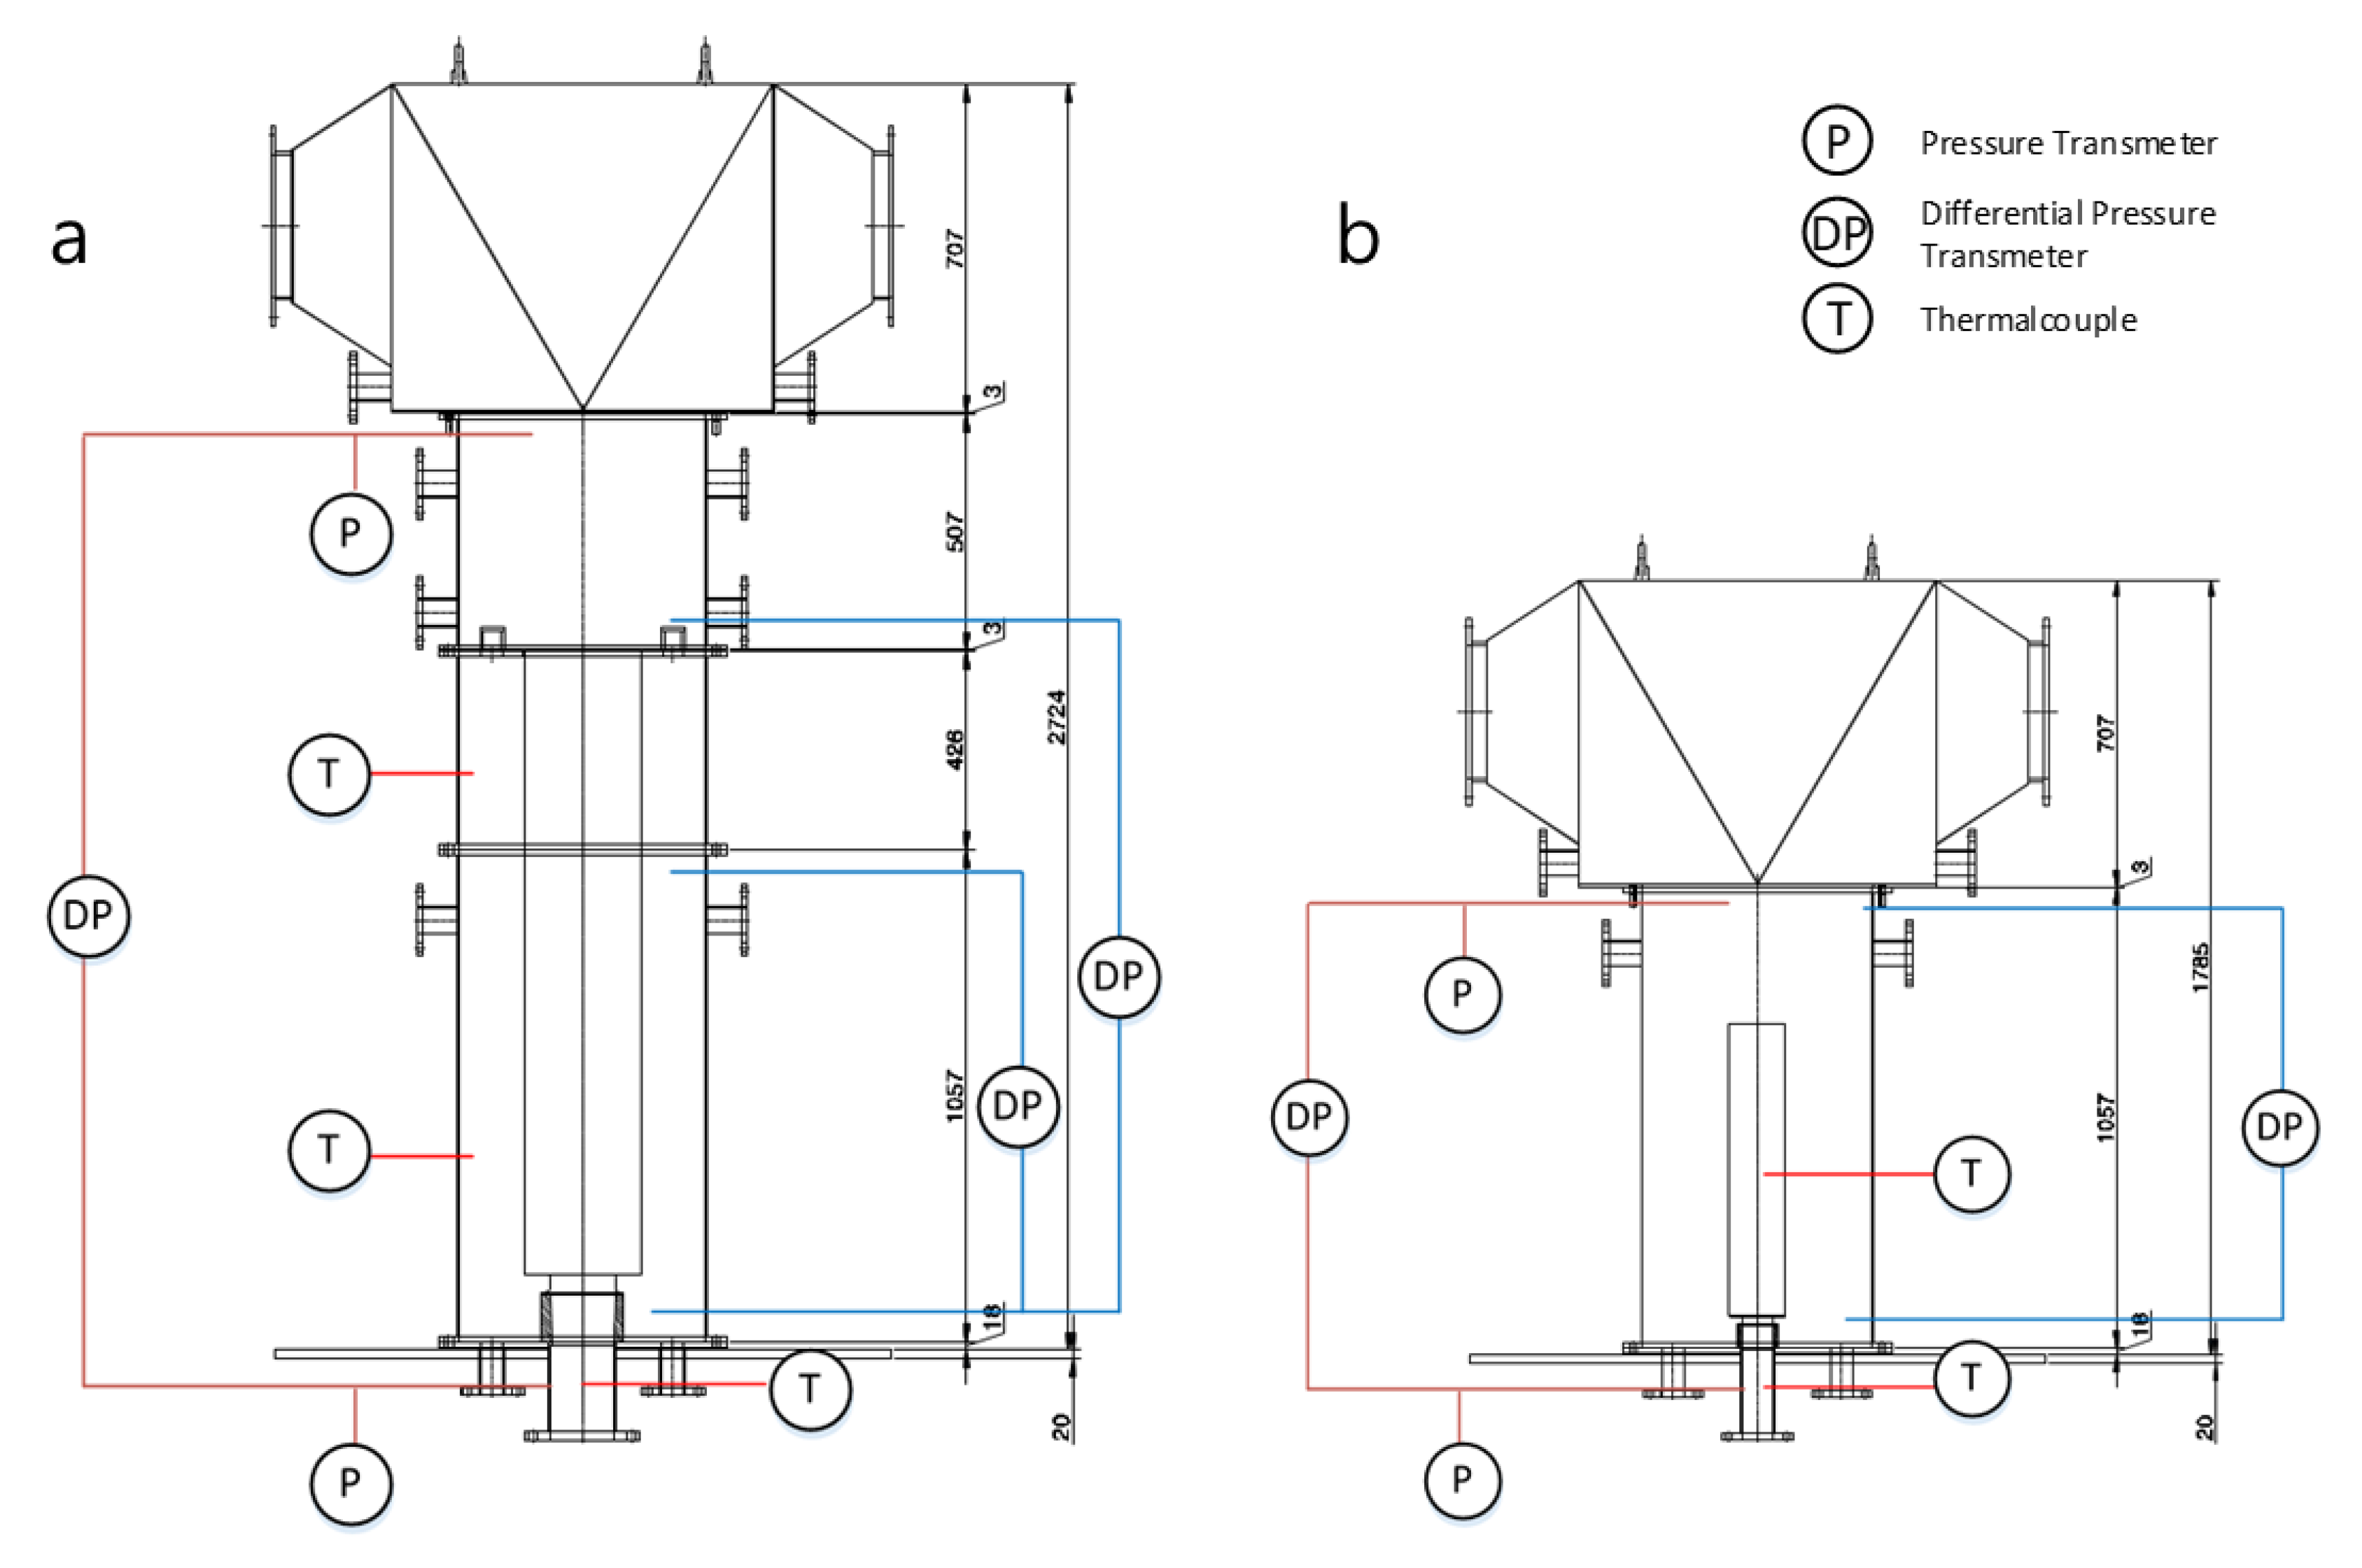
3.2. Full Scale and Half Scale Moisture Separators

In the present experiments, pressure drop data were obtained for two separator models; full and half scale of the CE-type moisture separators as shown in Figure 3. A large number of flow holes are machined on the separator can. A spinner blade is installed at the bottom region of the separator. The top of the spinner blade is covered by a spinner cover, so the fluid flow experiences sudden direction change and a strong swirl flow is induced. The top of the separator is covered by a cover plate, which also has a number of flow holes. In the upper region of the separator, a bunch of wires is installed. The measurement points on the test sections are depicted in Figure 4. The pressure drop data of the moisture separator were obtained by measuring the differential pressure between the inlet of the separator and the inlet of the dryer region.

4. Experimental Results

4.1. Single-Phase Test Results

The single-phase flow test was performed in a steady state, and the differential pressure from the inlet to the outlet of the separator was measured. Air was used as the working fluid. The test conditions were selected in consideration of the available range of the air blower in the test facility. The test conditions and the corresponding test results for the full-scale separator are summarized in Table 3. As can be seen in the results, the Euler number had similar values within the test conditions; the average value was 8.46. The test conditions and the test results for the half-scale test section are summarized in Table 4. The average value of the Euler number for the half-scale test section was 7.07.
In the present study, detailed modeling of the single-phase Euler number was not performed; instead, the average value was used to develop the two-phase pressure drop multiplier. Note that the error originating from the single-phase Euler number is included in the final two-phase pressure drop multiplier.

4.2. Two-Phase Test Results

In the two-phase test, experimental data for a wide range of flow rate conditions were obtained to investigate in detail the effect of the important parameters on two-phase flow pressure drop. The test was performed under atmospheric pressure and temperature conditions. The superficial velocities of water and air ranged from 0.017 to 0.073 m/s and from 8.1 to 25 m/s, respectively. The corresponding mass quality range of the two-phase flow was 0.176 to 0.466. The total liquid pressure drop and the two-phase pressure drop multiplier were calculated from Equations (2) and (3). The test conditions and the derived variables are summarized in Table 5 and Table 6 for full scale and half scale test sections, respectively.

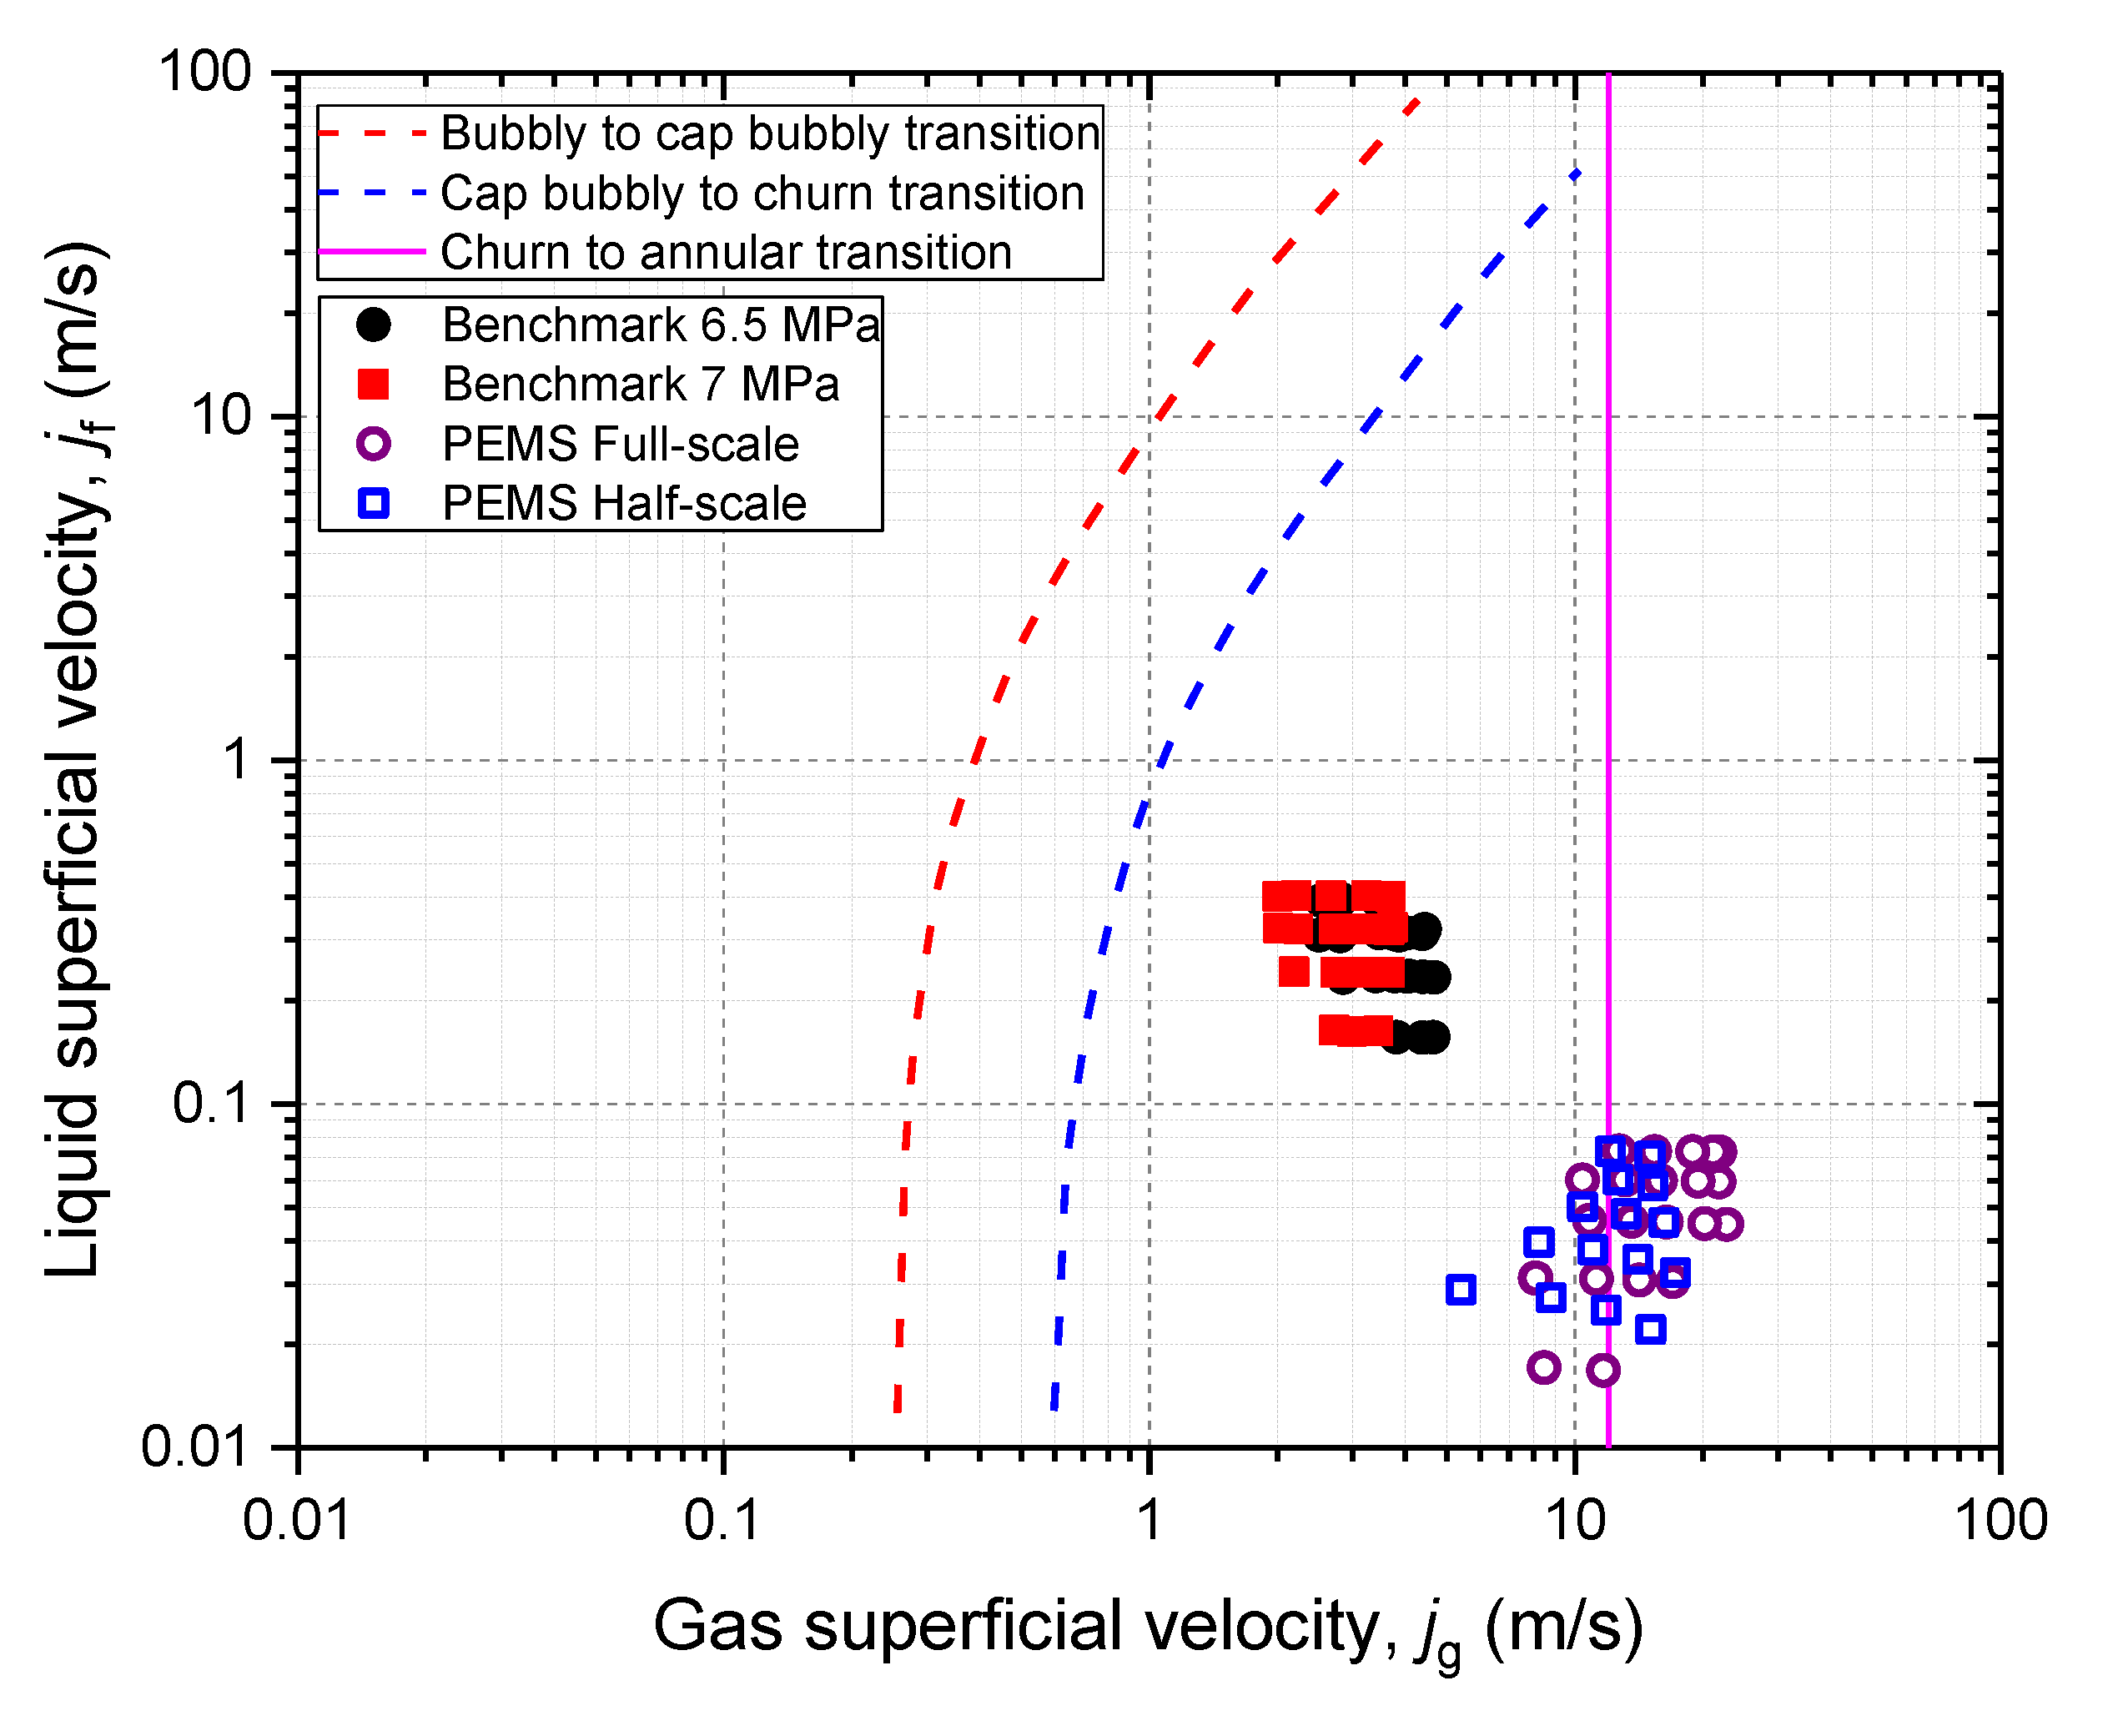
4.3. Benchmark Test Results

In developing the two-phase pressure drop multiplier, the single-phase air test data and the air-water test data described in Section 4.1 and Section 4.2 can be used. However, there is no guarantee that the empirical correlation derived from only the air-water test data will predict the pressure drop under the prototype conditions (high temperature and high pressure condition). To ensure the reliability of the correlation, benchmark data [3] in a full-scale steam-water test, performed under 6.0 and 7.5 MPa of saturated pressure, were also used.
Figure 5 shows the dependency of the quality on the two-phase pressure drop multiplier calculated from the present two-phase test results and benchmark test data. The multiplier showed a clear dependency on the quality, and had different tendencies according to the system pressure or the density ratio of the working fluid. As the density ratio decreases, the multiplier tends to decrease, which can be clearly recognized by comparing the results of air-water and steam-water experiments.

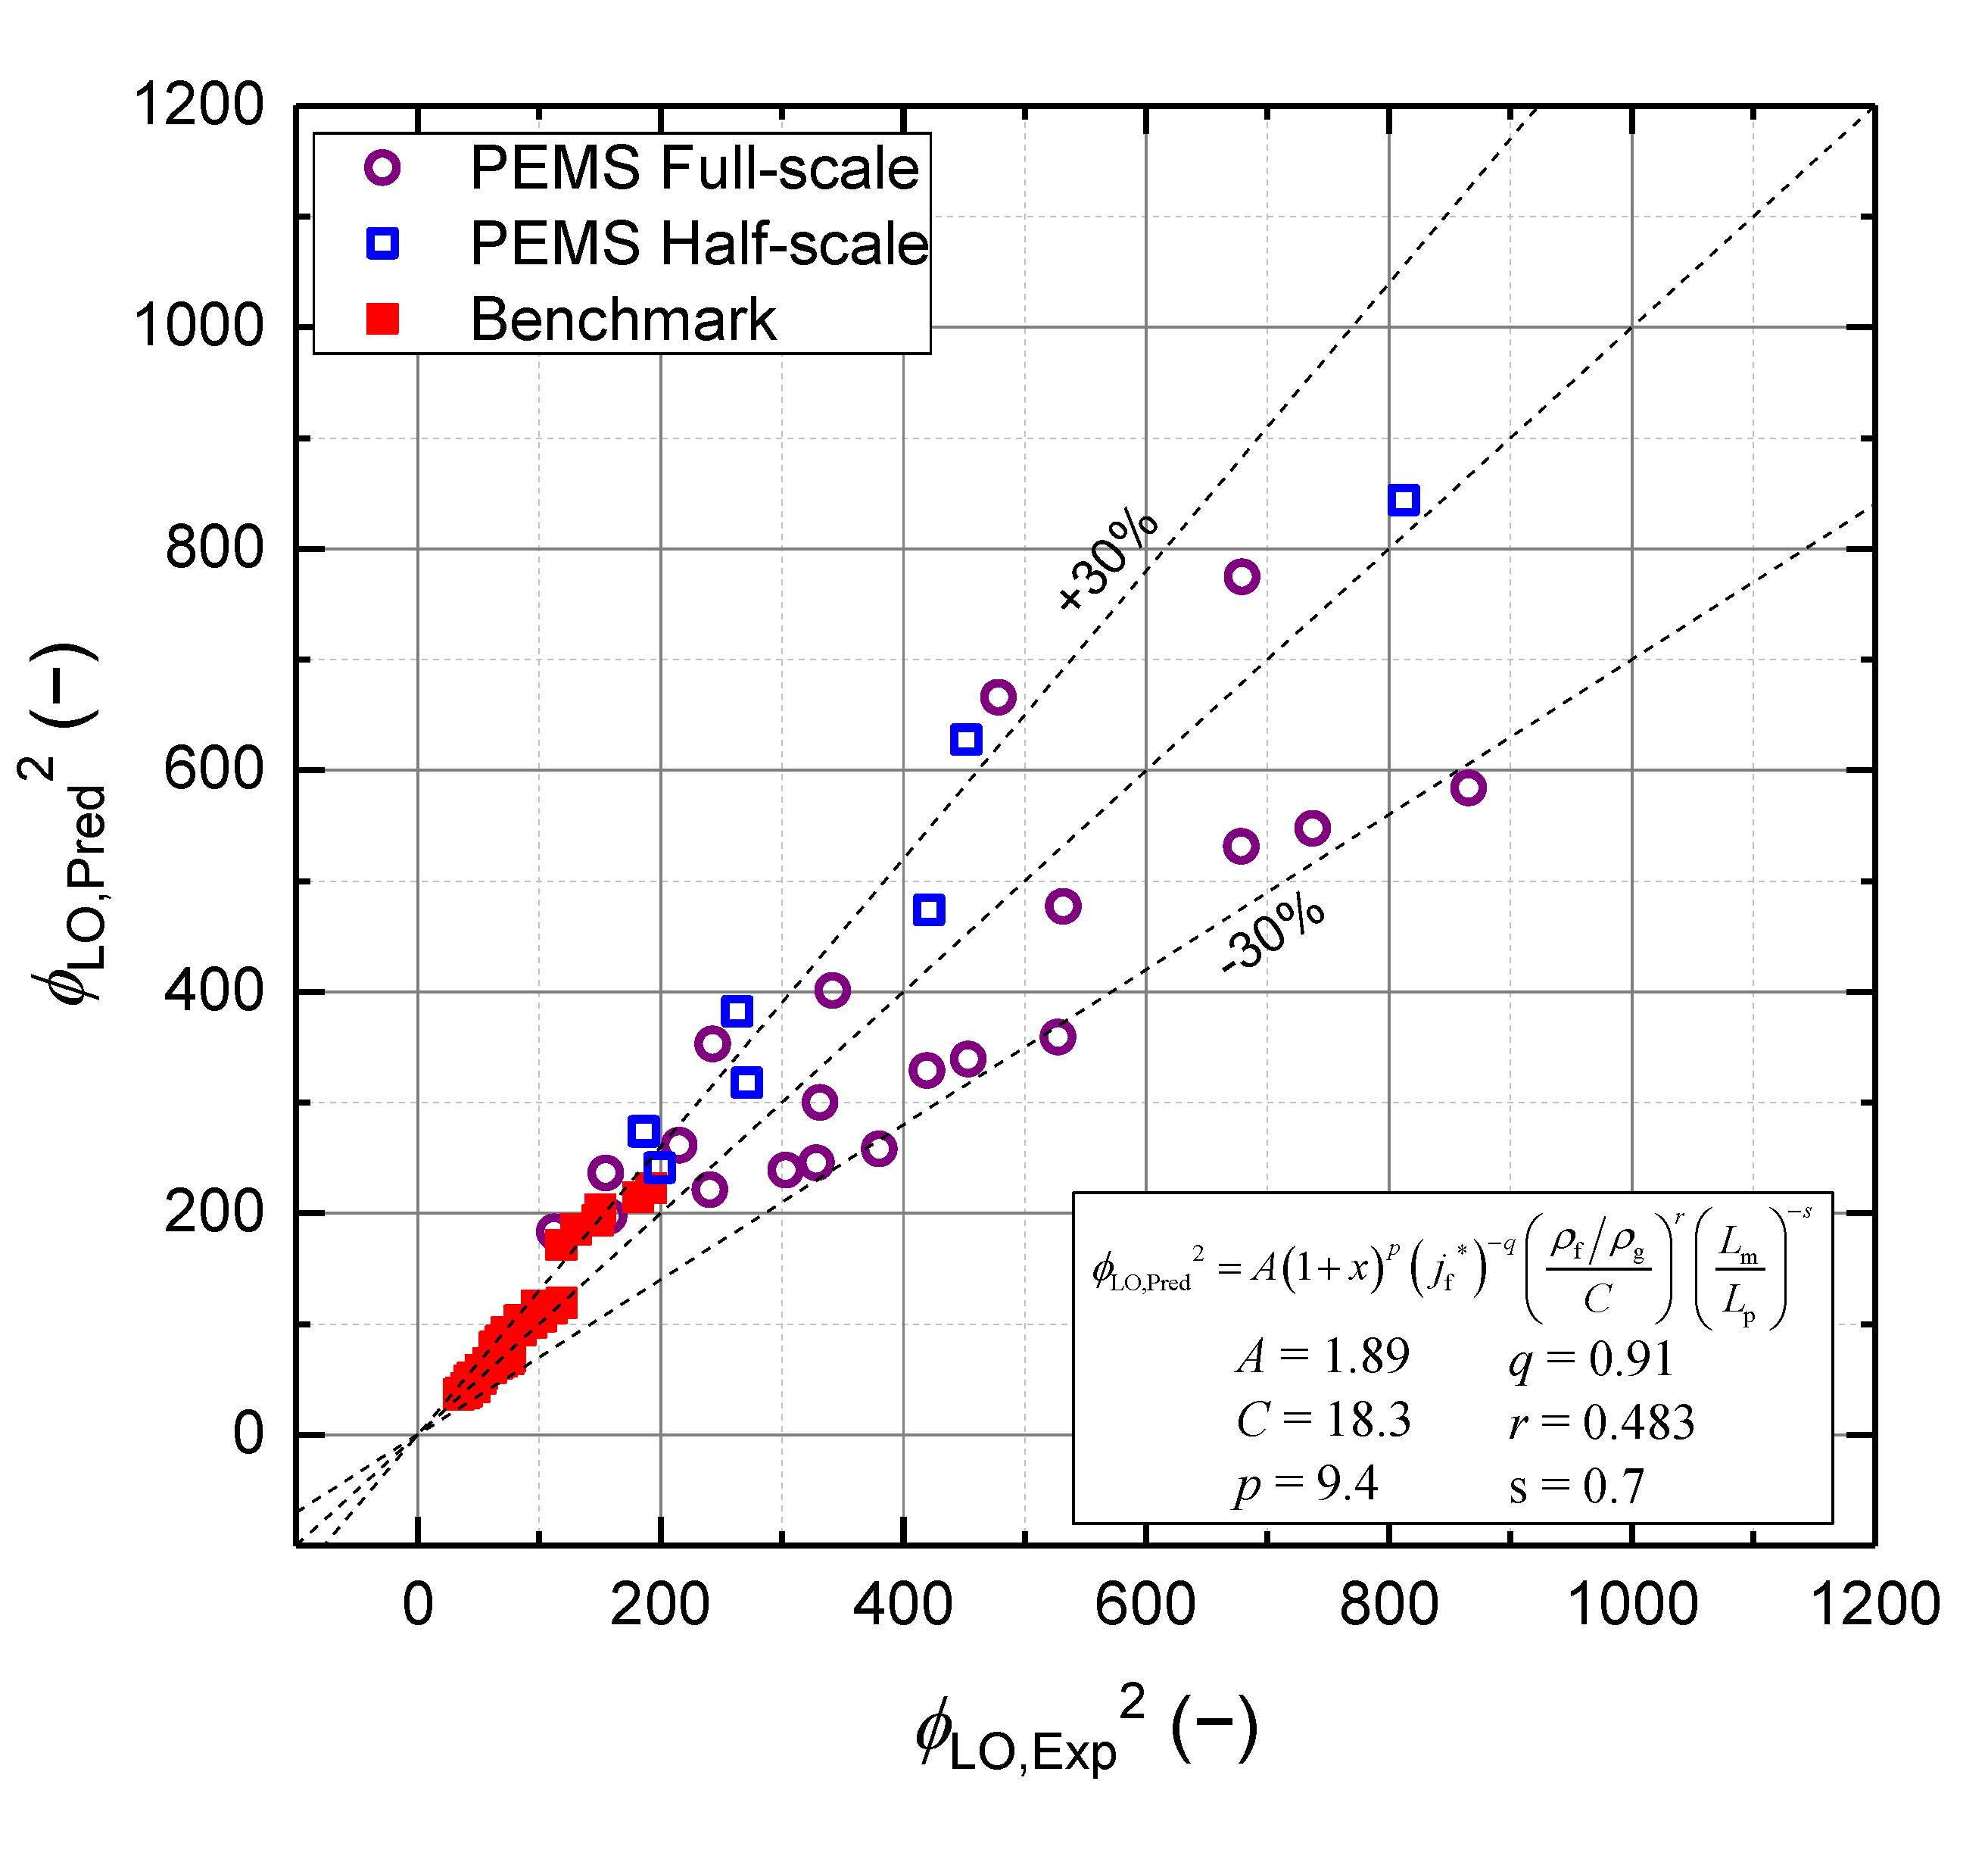
5. Development of Empirical Correlation for Two-Phase Pressure Drop Multiplier across Moisture Separator

5.1. Previous Research

In two-phase flow, the pressure drop characteristics are significantly affected by the liquid fraction (or quality). Thus, in developing the prediction model, not only the flow condition of each working fluid but also the interrelationship between the two fluids should be considered. For the model developed based on the air-water test to be usable in the prototype condition, the similarity between the air-water flow and the air-steam flow should be ensured, so that the effects of the major variables on the pressure drop can be properly expressed as non-dimensional parameters.
The similarity of the two-phase pressure drop across the moisture separator was investigated by Liu [9] and Hoffmann [10]. Liu [9] defined dimensionless parameters according to the Pi theorem of Buckingham in the case of two-phase pressure drop of the moisture separator, as in Equation (4). They reported that that Reynolds number, density ratio, and velocity ratio of each phase should be preserved.
Δ P ρ g v g 2 = f ( ρ g R v g μ g , ρ f R v f μ l , v f v g , ρ f ρ g , Geometrical parameters ,   )
where ρ and μ represent the density and viscosity, respectively. R is the characteristic length, and v is the velocity. Subscripts g and f indicate gas and liquid, respectively.
Hoffmann [10] observed that the pressure drop characteristics vary according to the size and distribution of liquid droplets, the fraction of droplets, the density, the viscosity, the characteristic velocity, the surface roughness, the gravitational acceleration, and the geometrical shapes of the droplets. If the flow is dominated by the vapor phase (low solid loading), the variables related to the droplets can be ignored, which resulted in the following simplified expression:
Δ P ρ g v ch 2 = f ( ρ v ch D μ , g D v ch 2 ) = f ( Re , Fr )
where vch, g and D represent the characteristic velocity, gravitational acceleration and characteristic length, respectively. Fr is the Froude number, which defined as the ratio of the flow inertia to gravity.
The two-phase pressure drop characteristics depend on the flow regime. The moisture separator has a wide range of operating conditions, and thus the two-phase flow regime may be different from the test conditions. Kataoka and Ishii [11] defined a dimensionless diameter whose critical value is 40 that indicates the criteria of transition from the churn to the annular flow regime, in terms of the Taylor wavelength, as:
D * = D σ / ( g ( ρ f ρ g ) ) 40
where σ is the surface tension.
They concluded that the characteristics of two-phase flow differ greatly, owing to dramatic changes in structure and dynamics when the critical diameter is larger than 40. The critical diameter of the full-scale moisture separator was 105.3, and thus it was regarded as a ‘large diameter’.
The flow regime in a large diameter was approximately confirmed by Schegel’s flow regime map [12,13]. As shown in Figure 6, the flow regime for the benchmark test condition corresponds to churn flow. The flow pattern of the present air-water test conditions belongs to a transition region between churn flow and annular flow. The flow characteristics of annular flow and churn flow are not very different: sometimes churn flow is referred to as semi-annular flow [4]; thus, the pressure drop multiplier is modelled in a single equation in the benchmark test and in the present air-water test.
In a vertical annular flow, when the gas phase flows upward, the liquid film experiences a shear force. As the pressure drop increases significantly, the liquid phase flows upward, which is called flooding. If the flow rate of the gas phase is large enough, both the liquid phase and the gas phase will move upward vertically, which is quite similar to the physical phenomenon at the inlet of the moisture separator. The most commonly used method for explaining the flooding phenomenon as a correlation was proposed by Wallis [14]; the conventional expression is as follows, with the dimensionless superficial velocity.
j g * = j g ρ g 0.5 [ g D ( ρ f ρ g ) ] 0.5
j f * = j f ρ f 0.5 [ g D ( ρ f ρ g ) ] 0.5
The non-dimensional superficial velocity is derived from the force balance between buoyancy and interfacial friction in the two-phase flow, and it is related to the average momentum fluxes. The detailed derivation process can be found from Yun et al. [15].

5.2. Empirical Correlation

As mentioned in Section 5.1, in the case of two-phase flow, the degree of the pressure drop depends on the flow pattern and flooding phenomenon, and so the dimensionless superficial velocity should be considered in the modelling pressure drop multiplier. In addition, the geometric parameter should be considered as an important factor. For the full-scale test section, the geometry is preserved; however, for the half-scale, since it is reduced at a linear scale ratio, the effect of the geometry should be included. The flow inside the separator is dominated by the strong vortex, so the ‘natural vortex length’, which is the distance between the start and the end of the vortex, should be considered. In the CE-type moisture separator, a strong vortex is formed across the spinner blade located at the inlet of the separator, but it is difficult to define analytically the point where the vortex disappears, and so the ratio of the length (or diameter) is considered for the reduced test section.
Finally, the main parameters affecting the two-phase pressure drop across the moisture separator are the quality, which indicates the fractions of the gas and liquid phase, the dimensionless superficial velocity, the density ratio of each phase considering the effect of system pressure, and the geometrical factor. The two-phase pressure drop multiplier can be expressed as the following equation.
ϕ LO , Pred 2 = A ( 1 + x ) p ( j f * ) q ( ρ f / ρ g C ) r ( L m L p ) s
where Lm and Lp are the diameters of the model separator and prototype separator, respectively.
For an optimal solution [16], the empirical constants A, C, p, q, r, and s were obtained by minimizing the root mean square values, which are the difference between the two-phase pressure drop multipliers calculated from the test results, including the benchmark test, and from the correlation; the final results are as follows.
ϕ LO , pred 2 = 1.89 ( 1 + x ) 9.4 ( j f * ) 0.91 ( ρ f / ρ g 18.3 ) 0.483 ( L m L p ) 0.7
Figure 7 shows a comparison of the pressure drop multiplier predicted from the above correlation with that from the experimental data including the air-water test and benchmark test. The two-phase pressure drop multiplier is predicted to be within a range of about ±30%. The correlation proposed in the present study is obtained empirically, so some of parameters, such as wall roughness and local turbulence phenomena, could not be represented in the correlation. However, it was found that the present empirical correlation can predict the experimental results within a sufficient engineering range when considering the errors originating from the benchmark test facility and the PEMS facility.

6. Conclusions

In this study, a new empirical correlation to predict a two-phase pressure drop multiplier across a CE-type moisture separator was proposed in terms of quality, non-dimensional superficial velocity, density ratio, and geometrical parameter. The basic form of the correlation is based on the two-phase separated flow model.
The applicability of the correlation was verified using a series of experimental data. An air-water test facility called PEMS was constructed to measure the pressure drop for the CE-type moisture separator. Experimental data were obtained from full-scale and half-scale separators to ensure geometrical similarity of the suggested correlation. Benchmark tests, conducted for a full-scale separator under the operating conditions of the prototype reactor, were also used to optimize the empirical constants in the correlation.
The empirical correlation showed reliable and versatile results and demonstrated its usefulness in predicting the two-phase pressure drop across the moisture separator.

Author Contributions

Formal analysis, K.-H.K.; Investigation, W.-S.K. and J.-B.L.; Methodology, W.-S.K.; Project administration, K.-H.K.; Supervision, K.-H.K.; Writing—original draft, W.-S.K.; Writing—review & editing, J.-B.L. and K.-H.K. All authors have read and agreed to the published version of the manuscript.

Funding

This work was supported by a Korea Institute of Energy Technology Evaluation and Planning (KETEP) grant funded by the Korean government (MOTIE) (20181510102390, Localization of Westinghouse Steam Generator Submerged Separator).

Data Availability Statement

The data presented in this study are available on request from the corresponding author. The data are not publicly available due to design information security.

Conflicts of Interest

The authors declare no conflict of interest.

References

  1. Paik, C.Y.; Mullen, G.; Knoess, C.; Griffith, P. Steam separator modeling for various nuclear reactor transients. Nucl. Eng. Des. 1988, 108, 83–97. [Google Scholar] [CrossRef]
  2. Green, S.J.; Hestroni, G. PWR steam generators. Int. J. Multiph. Flow 1995, 21, 1–97. [Google Scholar] [CrossRef]
  3. Kim, J.I.; Kim, M.Y.; Bae, H.S.; Lee, B.E. An experimental investigation for the moisture separation system of a steam generator for nuclear power generation. In Proceedings of the ICAPP, Reno, NV, USA, 4–8 June 2006. [Google Scholar]
  4. Collier, J.G.; Thome, J.R. Convective Boiling and Condensation, 3rd ed.; Oxford University Press Inc.: New York, NY, USA, 1994; pp. 34–130. [Google Scholar]
  5. Ishii, M. One Dimensional Drift-Flux Model and Constitutive Equations for Relative Motion between Phases in Various Two-Phase Flow Regimes; ANL-77-47; Argonne National Laboratory: Lemont, IL, USA, 1977. [Google Scholar]
  6. Idelchik, I.E. Handbook of Hydraulic Resistance, 3rd ed.; Begell House Inc.: New York, NY, USA, 1996. [Google Scholar]
  7. Zeghloul, A.; Azzi, A.; Saidj, F.; Messilem, A.; Azzopardi, B.J. Pressure drop through orifices for single- and two-phase vertically upward flow—Implication for metering. J. Fluids Eng. 2017, 139, 031302. [Google Scholar] [CrossRef]
  8. Kim, K.; Lee, J.B.; Kim, W.S.; Choi, H.; Kim, J.I. Development of a prediction model relating the two-phase pressure drop in a moisture separator using an air/water test facility. Nucl. Eng. Technol. 2021, in press. [Google Scholar] [CrossRef]
  9. Liu, L.; Bai, B. Scaling laws for gas–liquid flow in swirl vane separators. Nucl. Eng. Des. 2016, 298, 229–239. [Google Scholar] [CrossRef]
  10. Hoffmann, A.C.; Stein, L.E. Gas Cyclones and Swirl Tubes, 2nd ed.; Springer: New York, NY, USA, 2007. [Google Scholar]
  11. Kataoka, I.; Ishii, M. Drift-flux model for large diameter pipe and new correlation for pool void fraction. Int. J. Heat Mass Transf. 1987, 30, 1927–1939. [Google Scholar]
  12. Schlegel, J.P.; Sawant, P.; Paranjape, S.; Ozar, B.; Hibiki, T.; Ishii, M. Void fraction and flow regime in adiabatic upward two-phase flow in large diameter vertical pipe. Nucl. Eng. Des. 2009, 239, 2864–2874. [Google Scholar] [CrossRef]
  13. Schlegel, J.P.; Miwa, S.; Chen, S.; Hibiki, T.; Ishii, M. Experimental study of two-phase flow structure in large diameter pipes. Exp. Therm. Fluid Sci. 2012, 41, 12–22. [Google Scholar] [CrossRef]
  14. Wallis, G.B. One-Dimensional Two-Phase Flow; McGraw-Hill Inc.: New York, NY, USA, 1969. [Google Scholar]
  15. Yun, B.J.; Kwon, T.S.; Song, C.H.; Jeong, J.J.; Cho, H.K.; Park, G.C. Scaling of the direct ECC bypass during LBLOCA reflood phase with direct vessel injection system. In Proceedings of the International Conference on Nuclear Engineering, Nice Acropolis, France, 8–12 April 2001. [Google Scholar]
  16. Arora, J.S. Introduction to Optimum Design; Elsevier Academic Press: Cambridge, MA, USA, 2004. [Google Scholar]
Figure 1. Schematic view and picture of the PEMS facility [8].
Energies 14 04448 g001
Figure 2. System configuration of the PEMS facility.
Energies 14 04448 g002
Figure 3. Moisture separator of OPR1000 reactor: (a) conceptual configuration; (b) photograph of test section.
Energies 14 04448 g003
Figure 4. Instrumentation of test section: (a) full-scale; (b) half-scale.
Energies 14 04448 g004
Figure 5. Dependency of mass quality on two-phase pressure drop multiplier.
Energies 14 04448 g005
Figure 6. Two-phase flow regime map for benchmark test and air-water test [12].
Energies 14 04448 g006
Figure 7. Comparison of empirical correlation with experimental data.
Energies 14 04448 g007
Table 1. Design specifications of the PEMS test facility.
Design Pressure0.5 MPa
Design Temperature60 °C
Separator Diameter0.14~0.5 m
Separator Height0.79~3.4 m
Water Mass Flow Rateup to 36 m3/h (@ 1 atm, head of 57 m)
Air Mass Flow Rateup to 7000 m3/h (@ 1 atm head of 1.2 kgf/cm2)
Table 2. Accuracy of instrumentation.
InstrumentationModelAccuracy
Pressure TransmitterRosemount 3051±0.15% of span
Differential Pressure TransmitterRosemount 3051±0.15% of span
Vortex Flow MeterRosemount 8800D Series±1.00% of span (gas)
Magnetic Flow MeterPanametrics±0.51% of span
Mass Flow ControllerBROOKS, SLAMf51±0.632% of span
ThermocoupleWatlow, K-type±1.1 °C or 0.4%
Table 3. Single-phase test results for full-scale test section.
No.Inlet Pres.Inlet Temp.ρgΔPjgEu
(kPa)(°C)(kg/m3)(kPa)(m/s)(-)
1113.326.61.3179.52428.3758.980
2112.527.51.3048.72327.4038.910
3111.227.61.2897.33525.5988.687
4109.426.71.2715.58422.8918.384
5107.225.11.2523.45918.3828.175
6106.024.51.2412.39715.3688.175
7105.124.11.2321.53012.2458.283
8104.423.91.2250.8479.0538.440
9103.923.91.2190.3695.9178.639
10103.422.71.2180.0291.7477.932
Table 4. Single-phase test results for half-scale test section.
No.Inlet Pres.Inlet Temp.ρgΔPjgEu
(kPa)(°C)(kg/m3)(kPa)(m/s)(-)
1105.921.61.2514.18320.48.063
2104.422.61.2292.70117.27.439
3103.422.71.2171.67414.06.993
4102.722.51.2101.03111.07.026
5101.819.21.2130.1855.15.838
Table 5. Two-phase test results for the full-scale test section.
No.Inlet Pres.Inlet Temp.ΔPxρfρgρf/ρgjfjgϕLO,Exp2
(kPa)(°C)(kPa)(-)(kg/m3)(kg/m3)(-)(m/s)(m/s)(-)
1120.622.716.80.314997.61.420702.30.07223.3380.3
2119.422.915.60.364997.51.405709.80.05924.0527.4
3118.123.014.30.440997.51.389717.90.04425.0865.5
4116.122.812.30.419997.51.367729.80.04523.4737.1
5117.223.013.50.346997.51.379723.40.05922.7453.4
6118.323.214.50.297997.41.391717.10.07221.9328.6
7117.223.213.40.288997.41.378723.90.07221.2303.2
8116.223.212.50.335997.51.367729.80.05921.9419.7
9115.123.211.40.410997.51.354736.80.04522.8678.5
10112.822.89.10.375997.51.328751.20.04520.2531.7
11113.622.99.90.305997.51.337745.90.06019.5331.7
12114.422.910.70.260997.51.346740.90.07318.9240.8
13110.722.87.10.217997.51.304765.20.07315.4157.9
14110.222.76.50.257997.61.298768.60.06015.9215.5
15109.622.65.90.319997.61.292772.40.04516.4341.9
16108.922.35.30.419997.61.284776.80.03017.0679.2
17107.422.03.80.370997.71.268786.70.03114.2478.4
18107.922.14.30.276997.71.274783.30.04613.6243.3
19108.322.14.70.219997.71.278780.40.06013.1155.2
20108.722.15.10.183997.71.283777.80.07312.7112.8
21106.721.93.10.180997.71.260791.90.06010.4102.2
22106.421.82.80.230997.81.257793.80.04610.8158.2
23106.021.62.50.313997.81.253796.10.03111.3305.8
24105.721.12.20.466997.91.252797.30.01711.7901.6
25104.721.31.20.381997.91.239805.20.0178.5477.3
26104.921.51.30.244997.81.240804.40.0318.1160.3
27104.921.51.30.244997.81.240804.40.0318.1161.8
Table 6. Two-phase test results for the half-scale test section.
No.Inlet Pres.Inlet Temp.ΔPxρfρgρf/ρgjfjgϕLO,Exp2
(kPa)(°C)(kPa)(-)(kg/m3)(kg/m3)(-)(m/s)(m/s)(-)
1107.617.06.00.409998.81.292773.00.03217.3812.3
2107.717.16.10.317998.81.293772.60.04516.2421.1
3108.017.26.40.255998.71.296770.40.05815.3271.4
4108.617.27.00.218998.71.304766.20.07115.0199.4
5105.517.13.90.464998.81.266789.00.02215.11125.1
6105.617.14.00.336998.81.267788.00.03514.0451.9
7105.917.14.30.260998.81.271785.80.04813.2263.4
8106.417.14.80.211998.81.277782.00.06012.6186.2
9106.917.15.30.176998.81.283778.50.07312.1141.1
10104.117.12.50.371998.81.249799.50.02511.9553.6
11104.317.02.70.268998.81.253797.40.03811.0270.6
12104.817.03.10.208998.81.258794.20.05010.4176.6
13103.217.01.60.285998.81.239805.90.0278.8305.5
14103.517.01.90.206998.81.243803.60.0408.2173.2
Publisher’s Note: MDPI stays neutral with regard to jurisdictional claims in published maps and institutional affiliations.

