Abstract
There are international activities and on-going initiatives, particularly at the European level, to define what Positive Energy Districts should be, as the driving concept for the urban transition to a sustainable future. The first objective of the paper is to contribute to the on-going and lively debate about the definition of the notion of Sustainable Plus Energy Neighbourhood (SPEN), which highlights the multiple dimensions when talking about sustainability in districts moving beyond the traditional and strict building energy assessment. Based on a holistic methodology which ensures the consideration of the multidimensional nature and goals of SPEN, the paper outlines an evaluation framework. The evaluation framework defines the key performance indicators distributed in five categories that consider energy and power performance, GHG emissions, indoor environmental quality, smartness, flexibility, life cycle costs and social sustainability. This framework is designed to be implemented during integrated design processes aiming to select design options for a neighbourhood as well within during the operational phase for monitoring its performance. Further work will include the implementation and validation of the framework in four real-life positive energy neighbourhoods in different climate zones of Europe as part of syn.ikia H2020 project.
1. Introduction
Over the course of syn.ikia H2020 project [1], four real-life Sustainable Plus Energy Neighbourhoods (SPEN) tailored to four different climatic zones will be developed, analysed, optimised and monitored, demonstrating the functionality of the plus-energy neighbourhood concept in Europe. When it comes to the implementation of sustainable development in the construction sector, the focus has started shifting from individual buildings (micro-scale) to districts and cities (meso- and macro-scale) (Figure 1). The idea of shifting scales is based on believing that the sustainability challenge has to do with more than just buildings; it includes interrelationships between buildings, open spaces, users, infrastructures and transport networks [2].
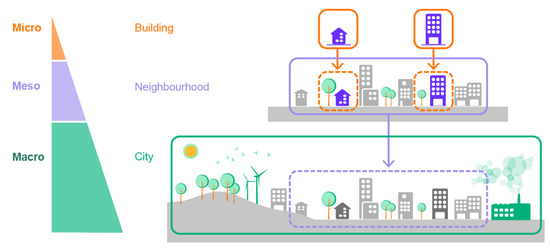
Figure 1.
Identification of the neighbourhood scale. Source: IREC (2021), adapted from [4].
The transition from single buildings to neighbourhoods brings a need to fully understand, assess and regulate the potential for energy flexibility including clusters of buildings at an aggregated level. A cluster of buildings implies that several buildings can be located physically next to each other, or digitally connected having one common instance (usually named the aggregator) controlling and managing their energy flexibility. Aggregation of the energy flexibility from several buildings is required to ensure a significant impact to the energy systems and grids, in contrast to the limited energy flexibility of a single building, e.g., in Net ZEBs [3].
The development of sustainable plus energy neighbourhoods is aligned with the broad concept of Positive Energy District (PED) stated by the implementation plan of SET Plan Action TWG 3.2, thus anticipating the concept of PEDs highlighted in the European Partnership Driving Urban Transition to a sustainable future [5]. It is inspired by discussions within the European Innovation Partnership on Smart Cities and Communities (EIP-SCC) supported by the European Commission, and especially by the initiative on Positive Energy Blocks and the “Zero Energy/Emission Districts” mentioned in the TWG 3.2 declaration of intent [6]. In this context, a PED is considered as an “energy-efficient and energy-flexible urban area or groups of connected buildings which produce net zero greenhouse gas emissions and actively manage an annual local or regional surplus production of renewable energy”. A PED requires integration of different systems, interaction between buildings and users, and other mobility, ICT and energy systems. A PED should secure the energy supply and wellbeing considering social, economic and environmental sustainability aspects. This concept is the result of several working groups and on-going initiatives at European level. JPI Urban Europe [6] conducts the programme “Positive Energy Districts and Neighbourhoods for Sustainable Urban Development” which aims to support the planning, deployment and replication of 100 Positive Energy Neighbourhoods by 2025 as one of the means to face the global urban challenges of today. The European Energy Research Alliance Joint Program on Smart Cities [7] help to define the European research landscape on smart cities based on the experience from H2020 smart city lighthouse projects and other national actions. The European Innovation Partnership on Smart Cities and Communities is merged with the “Smart Cities Information System” (SCIS) in one single platform named the “Smart Cities Marketplace” with the aim to bring cities, industries, SMEs, investors, researchers and other smart city actors together [8]. The European Regions Research and Innovation Network has specific working groups on smart cities and energy and climate change [9]. Eurocities [10] coordinates activities based on the knowledge sharing among more than 190 cities in 38 counties in Europe. The International Energy Agency EBC Annex 83 [11] started to work on developing an in-depth definition of PED and researching on technologies and planning tools for the decision-making process related to positive energy districts. Finally, the COST Action CA19126 “Positive Energy Districts European Network” [12] will establish a PED innovation eco-system to facilitate open sharing of knowledge and support the capacity building of new generation PED professionals, early Career Investigators as well as experienced practitioners. Outside Europe, NREL developed a guide to show how the implementation of district-scale high-performance scalable strategies can be suitable approaches to achieve deep energy savings, to increase affordability, reduce emissions and improve resilience [13].
Despite the above-mentioned efforts, there is still no standard definition of the PED concept, even if a shared definition developed by the EERA JPSC together with the JPI Urban Europe, integrates a wide vision of different projects and programs in Europe. It gathers the main characteristics of the PED projects and precursors of PEDs [14]. According to this work, up to four categories of PEDs have been established based on two main aspects: the boundaries and limits of the PED in order to reach a net positive yearly energy balance and the energy exchanges (import/export) in order to compensate for energy surpluses and shortages between the buildings and the external grid [15]. The four categories are:
- Auto-PED (PED autonomous): “plus-autarkic”, net positive yearly energy balance within the geographical boundaries of the PED and internal energy balance at any moment in time (no imports from the hinterland) or even helping to balance the wider grid outside;
- Dynamic-PED (PED dynamic): net positive yearly energy balance within the geographical boundaries of the PED but dynamic exchanges through the boundary compensate for momentary surpluses and shortages;
- Virtual-PED (PED virtual): net positive yearly energy balance within virtual boundaries of the PED and also dynamic exchanges with outside to compensate surpluses and shortages; and
- Candidate-PED (pre-PED): no net positive yearly energy balance within the geographical boundaries of the PED but energy difference is provided by the market with certified green energy.
All of the described categories of PEDs are based on the accomplishment of a yearly positive energy balance, measured in greenhouse gas emissions, with use of renewables within the defined boundaries. Auto-and Dynamic-PEDs are the only categories where a net positive energy balance is achieved and Candidate-PED should compensate the energy difference with imported certified energy from outside the boundary. The difference between Auto-PED and Dynamic-PED is that the first does not need to import energy at any time. The difference between Dynamic-PED and Virtual-PED is that the latter defines the boundaries of the PED as virtual and they are not limited to a geographical area.
The ISO 52000-1:2017 is the overarching EPB (Energy Performance of Buildings) standard, providing the general framework of the EPB assessment based on primary energy as the main indicator. In order to evaluate the Positive Energy Balance, the set of EPB standards play a key role to assess the energy performance as defined in the recast of the Energy Performance of Buildings Directive (EPBD) (The EPBD and the EED have been amended by Directive (EU) 2018/844, which entered into force on 9 July 2018). Each of the five EPB standards describes an important step in the assessment of the energy performance of single buildings and a building portfolio [16] From the amended (2018) text of EPBD Annex 1, point 1: “Member States shall describe their national calculation methodology following the national annexes of the overarching standards, namely ISO 52000-1, 52003-1, 52010-1, 52016-1, and 52018-1, developed under mandate M/480 given to the European Committee for Standardisation (CEN)”. When the positive energy balance assessment moves from a single building to a group of buildings (Building Portfolio) at the neighbourhood scale, new considerations are needed in terms of integrating urban and energy planning to evaluate the overall energy performance. Furthermore, neighbourhoods include other technological, spatial, regulatory, financial, legal, environmental, social and economic perspectives, but also barriers and challenges, which are not fully covered nor planned by the EPBD and EPB standards. Among them, barriers for changing household behavioural need to be understood and analysed to design measures that make households to contribute in mitigating climate change [17].
Moving from the building to the neighbourhood scale fits very well with the smartness imperative of exploiting all of the potential from collaborative approaches. The SPEN concept includes a profound integration and interoperability between buildings, urban spaces [18], the grid and infrastructures, but also with their governance. For instance, when focusing on a set of buildings, it is required to consider a common technical system whose energy performance considers the aggregated performance. Aggregation articulates synergies and discloses higher potential for smart and mutual interaction [19]. Therefore, the neighbourhood scale will foster sustainability through economies of scale, aggregation synergies (e.g., the deployment of flexibility and integration) and a considerable involvement of stakeholders and communities. The vision of future buildings described in [20] sees buildings as active components of larger districts which should be able to adapt to changing environmental conditions and occupancy, supporting well-being and using resources efficiently. The authors of [20] proposed a framework with 14 metrics to drive the transformation of the building stock with 100-year targets. The authors of [21] stresses the need for clear, comprehensible and structured definitions, including KPIs, after reviewing 144 scientific publications and analysed 35 terminologies on zero emission neighbourhoods, positive energy districts and similar concepts of climate friendly neighbourhoods.
The objective of this paper is to present and define the concept of Sustainable Plus Energy Neighbourhood (SPEN) which highlights the need of considering mutual interaction between the built environment, the inhabitants and the nature (Figure 2). The definition aims to contribute to the on-going debate for a common vision of what a PED should consider. Through a multidimensional analysis to address complexity in neighbourhoods, this paper outlines an assessment framework for the performance evaluation of SPEN. The selection of the main assessed categories and Key Performance Indicators (KPIs) have been based on a holistic and comprehensive methodology which highlights the multiple dimensions of sustainability in the built environment. The contents of the paper are based on the work developed in the syn.ikia project [22] with extended details on the methodology applied, revised definitions and concise and synthetic presentation of the metrics. Section 2 presents the definition of the SPEN and Section 3 describes the methodology applied to select the different categories and indicators ensuring multidimensionality. The core key performance indicators are presented for each dimension in the results section, followed by the conclusions of the paper.
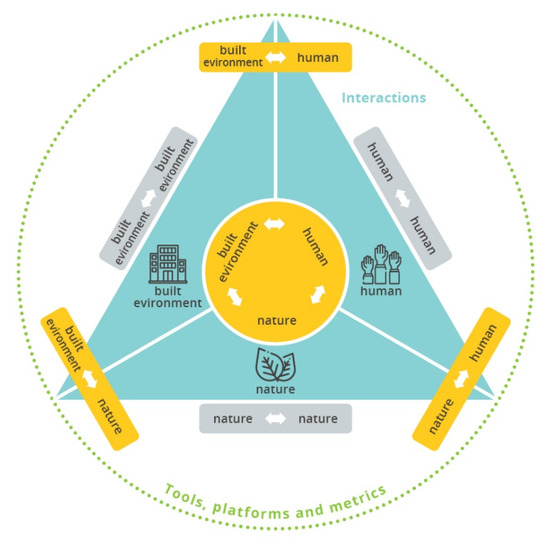
Figure 2.
Interactions between humans, nature and the built environment Source: Reith, A. [23].
2. Definition of Sustainable Plus Energy Neighbourhoods (SPEN) and System Boundaries
2.1. Definition of SPEN
The syn.ikia definition of a SPEN follows a similar basis for Positive Energy Buildings (PEB), but the geographical boundary is physically or digitally expanded to the entire site of the neighbourhood, including local storage and energy supply units (Figure 3). Users, buildings and technical systems are all connected via a Digital Cloud Hub (HUB) and/or common energy infrastructures. The SPEN framework includes a strong focus on cost efficiency, indoor environmental quality, spatial qualities, sustainable behaviour, occupant satisfaction, social factors (co-use, shared services and infrastructure and community engagement), power performance (peak shaving, flexibility and self-consumption) and greenhouse gas emissions.

Figure 3.
SPEN schematic as defined within syn.ikia project. Source: Skogen, syn.ikia project [4].
SPEN is defined as a group of interconnected buildings (The neighbourhood concept in syn.ikia project refers to, but is not limited to the Building Portfolio definition within the ISO52000 that considers a set of buildings and common technical building systems whose energy performance is determined by considering their mutual interactions [SOURCE: ISO 52000-1:2017, 3.1.6]) with associated infrastructure (infrastructure includes grids and technologies for exchange, generation and storage of electricity and heat. Infrastructure may also include grids and technologies for water, sewage, waste, mobility, ICT, and Energy Management System (EMS)), located within a limited geographical area and/or a virtual boundary. A SPEN aims to reduce its primary energy use towards zero over a year and an increased use and generation of renewable energy. A SPEN—a highly energy efficient neighbourhood with a surplus of energy from renewable sources—should focus on the following key-points:
- A SPEN is embedded in an urban or regional energy system and is driven by renewable energy to provide energy security and flexibility of supply;
- A SPEN is based on well-designed and high-efficient energy measures aiming to reduce the local energy consumption below the amount of locally produced renewable energy;
- A SPEN enables increased use of renewable energy by offering optimised flexibility and by managing consumption and storage capacities responding to demand;
- A SPEN couples the built environment with sustainable energy generation, use, and mobility (e.g., EV charging) to create added value for the citizens;
- A SPEN optimally use advanced technologies and materials, local RES, and other solutions as local storage, smart energy management systems, demand-response, user interaction ICT, etc.; and
- A SPEN offers affordable housing, high-quality indoor environment, and well-being for the human beings.
SPEN should be focused in five areas named the 5D areas:
- Decentralisation: neighbourhoods, as flexibility providers, allow higher penetration of renewable energy sources into the grid and increase flexibility;
- Democracy: empowered and conscious users having access to affordable homes and high-quality neighbourhoods;
- Decarbonisation: climate neutral, meaning efficient districts with a minimal final energy consumption and generating a surplus of energy from renewable sources;
- Digitalisation: ICT based neighbourhoods integrating smart networks that provide well-managed built environment for the citizens; and
- Design: highly attractive energy-efficient urban neighbourhoods by means of an integrated energy, architectural and outdoor spaces design that increase their market uptake.
5S strategies are identified as the ones that facilitate the achievement of SPENs:
- Save: reducing the neighbourhood net energy consumption by using solutions based on a total life cycle cost analysis;
- Shave: facilitating peak shaving through load shifting, control, and storage, thus reducing the size of energy supply installations, increasing self-consumption of renewable energy, and reducing the stress on the grid;
- Share: sharing of resources such as energy, infrastructure, and common spaces with neighbours;
- Shine: ensuring high quality architecture, creating good indoor and outdoor environments and solutions that make the occupants and the community proud of their neighbourhood;
- Scale: benefitting from large-scale effects of the neighbourhood scale to replicate the solutions.
2.2. SPEN and Different Level of System Boundaries
There is a continuous discussion of where to define the system boundaries, i.e., what energy elements to include in the balance when developing and defining PEDs. From a technical point of view, a SPEN is characterised by achieving a positive energy balance within a given system of boundaries according to an Energy Community scheme [24]. There are multiple ways to cover the RES generation in a SPEN. Moving from the single building boundary to the neighbourhood scale widens the on-site generation possibilities significantly. The scale is not restricted to on-site boundaries and, when using the SPEN smartness attributes, a SPEN may expand beyond the physical boundaries of the community. The SPEN boundary may address two different levels:
- Functional Boundary: On one hand, a functional boundary addresses the spatial-physical limits of the building portfolio and the neighbourhood. On the other hand, it addresses the limits with regards to the energy grids considering them as a functional entity of the neighbourhood that they serve. (e.g., a district heating system that can be considered as a functional part of the neighbourhood even if its service area is substantially larger than the heating sector of the building portfolio in question). Renewable share of the energy infrastructures (e.g., electricity from the grid) is included in the balance with the use of appropriate conversion factors from final energy to primary energy or CO2 emissions.
- Virtual Boundary: This addresses the limits in contractual terms, e.g., including a renewable energy generation system owned by the occupants but situated outside the geographical boundaries (e.g., an offshore wind turbine owned through shares by the community).
According to these boundaries descriptions, and aligned to the draft definition of PEDs from the EERA JPSC working group and JP Urban Europe [15], the net positive yearly energy balance of a SPEN will be assessed within the functional or virtual boundaries. Thus, a SPEN will achieve a positive yearly energy balance having dynamic exchanges within the functional/virtual boundaries, but in addition, it will provide a connection between buildings inside the boundaries of the neighbourhood. In a SPEN, buildings can be digitally connected by means of a digital cloud hub (HUB), sharing ICT infrastructure and energy management systems.
3. Methodology: Ensuring Multidimensionality in Selection of Indicators
Assessment of SPENs can be a challenging exercise, since neighbourhoods, energy systems on a neighbourhood scale and sustainability itself are complex to evaluate [25,26]. Thus, evaluation frameworks that are already present agree on the fact that neighbourhoods can only be evaluated when taking the combined effect of multiple factors into account. From a completely different point of view, it is really important for different legislative measures and interventions to consider the actual problems, and react to the existing practice. Otherwise it is possible, that their effectiveness will be limited. Consequently, a holistic approach need to be used to ensure the consideration of appropriate measures and mitigation of known obstacles [27]. Decision-making processes consists of numerous independent factors differing by stakeholders and other levels, i.e., political interests, personal beliefs, market orientation, etc. [28]. In a proper decision making process, all of these drivers need to be considered. Therefore, it is needed to design a holistic, multidimensional assessment framework considering all elements of a SPEN that can diagnose and adapt to numerous district resources, cater for different users and market conditions and initiate commercial arrangements between partners in and out of the SPEN. Creating connected and equitable targets across multiple dimensions is also described as the “ energy trilemma” by the World Energy Council (WEC). It is described as a combination of three equally important factors: environmental sustainability, energy security and energy equity. Valdes [25] mentioned that it is critical to review the robustness of the indicators. Ensuring multidimensionality on the selection level can be done with the help of four design consideration: avoidance of selection bias (Diversity analysis); avoidance of anchoring bias (Multiple valid impact chains) [26]; avoidance of overreliance on available and measurable data (Multiple valid impact chains) [28]; and avoidance of multicollinearity (D-separation) [29,30].
To make sure, that all the previously described considerations are ensured, directed acyclic graphs (DAGs) are built, and the KPIs are tagged along different aspects. Through a diversity analysis, tagged KPIs are able to ensure the heterogeneity and avoidance of selection bias, while with the help of a method called “d-separation” and by creating at least two impact chains for each goal, DAGs can ensure the rest of the design considerations. Tagging key performance indicators (KPIs) is a widely used approach and it is able to help ensuring the heterogeneity and spread of KPIs across different aspects. Usually, sustainability focused indicator development frameworks are based on the ‘three pillars of sustainability’: environmental, social and economic pillars [31]. Furthermore, there are other aspects when we consider the intersections of the previously mentioned pillars: livable, equitable and the viable dimensions as presented in Figure 4.
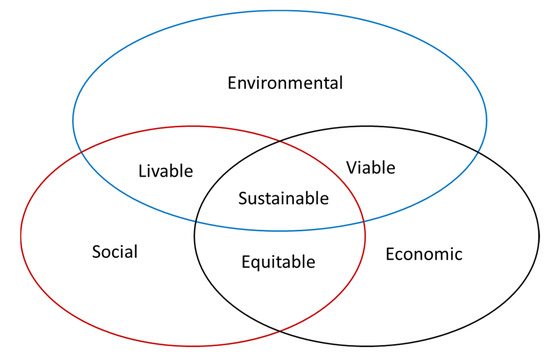
Figure 4.
Pillars of sustainability and their intersections by Tanquay et al. [31].
KPIs however do not always fit these six categories, and forcing them into these categories may cause misunderstandings. Furthermore the boundaries between these categories are not completely defined. It is therefore more appropriate to categorize the KPIs along different, more SPEN definition relevant aspects. These are defined as followings:
- Domain of sustainability (Social, Economic, Environmental);
- Life cycle stage (Design, Operation);
- Scale (Household, Building, Neighbourhood);
- Functionality (Core, Sub);
- Type (Categorical, Numerical, Boolean, Index);
- Authority (Occupant, Facility manager, Grid operator, Policy developer, Building owner);
- Relation to the five main SPEN focus areas defined as the 5D: Design, Decentralization, Democracy, Decarbonization and Digitalization;
- Relation to five main SPEN strategies or the 5S: Save, Shave, Share, Shine and Scale; and
- Relation to the goals in the SPEN framework: Energy and Environment, Economic, Indoor Environmental Quality (IEQ), Social and Smartness and Flexibility.
There are categorically inclusive aspects which means that the indicators can get multiple different tags (for example for Domain of sustainability, Life cycle stage, Scale, Authority, 5D, 5S, SPEN goals), while others are exclusive (for example Functionality, Type) meaning, that each indicator can have one tag. Functionality notation accounts for customization and prioritization, for when not all KPIs are relevant or measurable there needs to be a slight room for changes.
To calculate the KPI diversities, a well-known diversity index is used. The Shannon-diversity index is a broadly used diversity index in the field of ecology. It was first proposed by Claude Shannon [32], to quantify the entropy in strings of text. Here it is used to define the diversity of different KPI groups (grouped by indicator sets). Shannon diversity index is calculated as stated in Equation (1):
where is the proportion of indicators belonging to the i-th tag structure for the indicator set in question. DAGs are created to map the different indicators related to the drivers present for each performance to be measured in SPEN. Expert knowledge was used to define cause and effect relations between indicators of different drivers.
4. Results
As result of the application of the methodology described in Section 3, five KPI categories were identified and are defined as shown below:
- Energy and Environmental, which address overall energy and environmental performance, matching factors between load and on-site renewable generation and grid interaction;
- Economic, addressing capital costs and operational costs;
- Indoor Environmental Quality (IEQ), addressing thermal and visual comfort, as well as indoor air quality;
- Social, which addresses the aspects of equity, community and human outcomes; and
- Smartness and Flexibility, addressing the ability to be smartly managed.
Table 1 summarizes the 38 core indicators selected for the SPEN evaluation framework organised per category and sub-category. Details of each key indicators are described in the following sub-sections.

Table 1.
Key Performance Indicators defined in the SPEN key performance categories.
The individual indicator sets have the following diversity indices in Table 2. The most evenly distributed diverse KPI variation can have a Shannon index of 2.30, which is the maximum value we can get from each indicator set. Considering the fact that every tag is represented at least once, and using a threshold value of 2.00 by Shannon indices, it can be stated that each indicator set is sufficiently diverse.
Table 2.
Shannon index of each indicator set.
Causal DAG is created for all of the project goals. For the sake of simplification, these goals are presented by their DAG handles shown in Table 3. An overview of the DAG shows that for every main goal, there are at least two different impact chains, or in other words, there are at least two arrows pointing towards the goal from the outer circle in Figure 5. The five main goals are presented in the inside of the circle. The size of the nodes represents the number of arrows pointing to the node. The more inbound arrows are, the bigger the nodes. Edge colours are inherited from the target nodes at the end of each causal chain. Since for every goal there are multiple ways and multiple considerations considered, it is ensured that the risk of anchoring biases and the overreliance of available data is mitigated.
Table 3.
Different SPEN goals categorised by the relevant key performance categories.
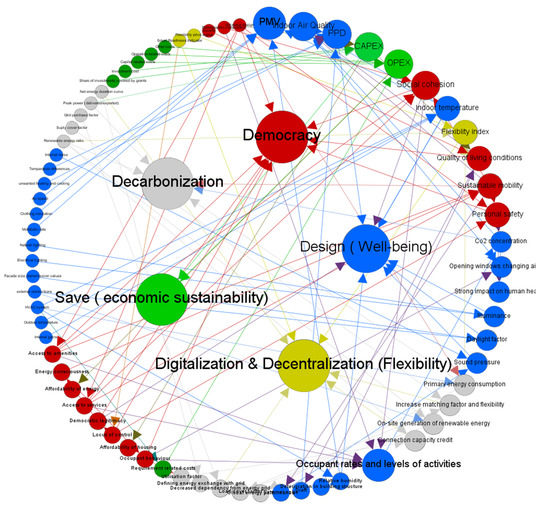
Figure 5.
Complete causal DAG of the SPEN evaluation framework.
4.1. Energy and Environmental Performance KPIs
The set of indicators selected which characterizes the energy and environmental performance of each neighbourhood and their interaction with the connected energy networks follows the methodology of the Energy Performance of new and existing Buildings (EPB) described in the ISO-52000 standards [33] based on primary energy balance. In general terms, the overall energy performance of a building, by measurement or calculation, should be based on hourly or sub-hourly values of the different energy carrier flows in the buildings and by the exchanged energy (delivered and exported energy) with the energy networks in their broad concept (electricity, thermal energy with district heating and cooling networks, natural gas, biomass, etc.). Sub-categories for the energy and environmental assessment are depicted in Figure 6.
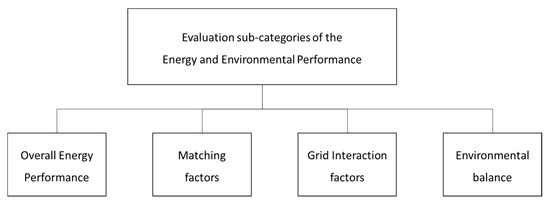
Figure 6.
Evaluation sub-categories of the energy and environmental performance.
4.1.1. Overall Energy Performance
The overall energy performance of a system is calculated as the balance at the assessment boundary of the weighted delivered energy and weighted exported energy. The delivered energy is required to cover the energy demand of the considered neighbourhood, including the on-site generated energy, which can potentially be exported if not used within the neighbourhood. To describe the overall performance, two main indicators are selected. The main one is the non-renewable primary energy balance which weights the delivered and exported energy. If this balance is lower than zero, it means that it is a positive energy system. The other main indicator is the Renewable Energy Ratio which represents the share of renewable energy in the system.
- Non-Renewable Primary Energy Balance: This indicator takes into consideration all types of energy used and generated in the neighbourhood, and the exchange with the energy grids. It is calculated by summing all delivered and exported energy for all energy carries into a single indicator with the corresponding non-renewable primary energy conversion factors. In the framework of syn.ikia, weighting or conversion factors for exported energy should be selected based on the resources avoided from the external grid, which is equivalent to “Step B” stated in ISO-52000. This means that, for example, the values of the delivered and exported weighting factors for electricity are commonly considered to be equal.
- Renewable Energy Ratio: RER is the percentage share of energy from renewable sources in the total energy use. The share of renewable energy is defined by the Renewable Energy Ratio (RER), which is calculated relative to all energy use in the building, in terms of total primary energy and accounting for all the renewable energy sources. These include solar thermal, solar electricity, wind and hydroelectricity, renewable energy captured from ambient/ground heat sources by heat pumps and free cooling and renewable fuels [34].
4.1.2. Matching Factors
Load match factors describe the degree of the utilization of on-site energy generation related to the energy use in the neighbourhood. These factors characterize the direct use of energy generated inside the assessment boundary over a period and time (e.g., a day, a month or a year). Their calculation should be done on sub-hourly or hourly basis to characterize correctly the simultaneous use of on-site produced energy and the energy exchanged with the grid [2,35]. In the literature, the same concept has received different names. Two complementary indexes have been used: the load cover factor [2] or self-generation [36] and the supply cover factor [2,34] or self-consumption [36]. This can also be complemented with a third indicator:grid delivered factor or grid purchase ratio [37]. In case the energy use represents the useful energy demand, the grid purchase factor is a more reliable indicator and allows a fairer comparison of different systems, particularly if local electric and thermal storage are charged with renewables and/or the efficiencies of the compared systems differs.
- Load Cover Factor/Self-Generation: The load cover factor is the relation between the energy produced on-site and directly used and the total electric energy use. In ISO-52000, this factor is named use matching fraction.
- Supply Cover Factor/Self-Consumption: The supply cover factor is the relation between the energy produced on-site and directly used and the total on-site produced energy. In ISO-52000, this factor is named the production matching fraction.
- Grid Delivered Factor: The grid delivered factor is the relation between the energy delivered from the grid and the total energy used by the system over a time period. It characterizes the dependency of the neighbourhood of the grid [37].
4.1.3. Grid Interaction Factors
Grid interaction indicators are based on the net energy which represents the electricity interaction between the neighbourhood and the grid, per energy carrier. For a proper analysis of grid interaction, sub hourly resolution data is required (recommended in the range of 1–5 min and 15 min as a maximum) as there is a relatively high impact due to time averaging effects [38].
- Net Energy/Net Power: Net energy allows one to assess the interaction of a system with the energy grids over a certain period: a day, a month or a year. In doing that, it is useful to represent the net energy using a duration curve, colored carpet plots and/or box plots [2]. This kind of visual representations allows for an immediate comprehension of the distribution of power and the differences between alternative solutions. Figure 7 shows schematically the net energy duration curve. It should be noted that the red area of the net load duration curve represents the net delivered energy. In the case of a yearly duration curve, the red area of the duration curve is equal to annual delivered energy, while the green area is equal to annual exported energy. In coherence with the definition of SPEN and the ISO52000 set of standards, we refer to net energy exchange as a result of an energy balance considering on-site/nearby generated energy to cover the EPD energy use. If parts of the energy uses of the building and neighbourhood are discarded in the energy assessment, actual metered grid interaction will differ from the calculated one, as represented schematically in Figure 7.
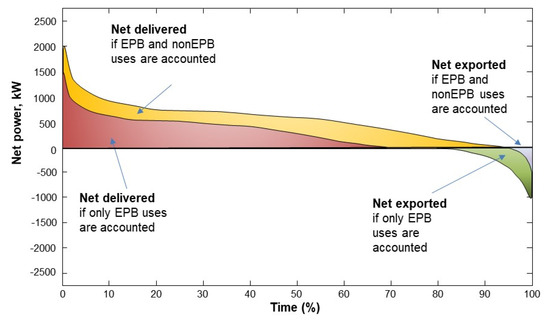 Figure 7. Net energy duration curve considering EPB energy use and non-EPB energy use in a neighbourhood: conceptual scheme. Source: IREC.
- Peak Delivered/Peak Exported Power: The peak delivered and peak exported power KPIs are the extreme values of the net duration curve. The maximum positive value is the peak delivered, while the maximum negative value is the peak exported.
- Connection Capacity Credit: The connection capacity credit, or power reduction potential [39], is defined as the percentage of grid connection capacity that could be saved compared to a reference case [40,41].
4.1.4. Overall Environmental Balance
Overall Environmental balance is assessed using the total greenhouse gas emissions as the indicator.
- Total Greenhouse Gas Emissions: It is calculated in a similar way that the primary energy balance and takes into consideration all types of energy used and generated by the system, and the exchange with the energy networks. It is calculated summing up all delivered and exported energy for all energy carries into a single indicator with the emissions of the delivered and exported energy carriers as weighting factors.
4.2. Economic Performance
The set of indicators for demonstrating economic performance is selected from the perspective of building owners and investors. SPENs are more expensive than traditional projects and the main barrier for SPEN development is the access to adequate funding and business models [42]. Yet, PEDs and SPENs also hold the potential for fostering economic sustainability due to cost efficiency and self-consumption. To the potential investor who is considering whether to invest in a SPEN, or to the building owner who wishes to track and reflect the savings from the building level to a neighbourhood scale, the following categories of indicators are recommended to be accounted for: capital costs, operational costs and overall performance, as reflected in Figure 8.
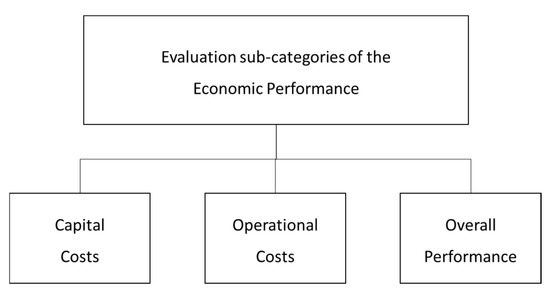
Figure 8.
Evaluation sub-categories of the economic performance.
4.2.1. Capital Costs
Capital costs in the SPEN evaluation framework refer to complete building construction cost and the cost of assets or items that are purchased or implemented with the aim of improving the energy efficient aspects of the system [41]. As stated earlier, such assets or items can include but are not limited to multi-functional façade elements with integrating photovoltaic and solar thermal, heat pumps, thermal storages and batteries.
- Investment Costs (€/m2): This indicator calculates the costs of the newly built or refurbished building, assets or items and is defined as cumulated payments until the initial operation of the system.
- Share of Investments Covered by Grants (€/m2): This indicator considers any grants or subsidies that should be accounted as capital costs in order to reflect a truly market-based approach in evaluating the cost efficiency of SPENs.
4.2.2. Operational Costs
In the operation and maintenance of SPENS, respective operational costs are incurred, from maintenance to repairs and replacements over a period of time. These costs can vary for each year [41].
- Maintenance-Related Costs (€/m2/year): This indicator encompasses depreciation, interests, repairs and replacements of those assets or items purchased or implemented to improve the energy efficiency aspects of the system.
- Requirement-Related Costs (€/m2/year): This indicator is defined as power and fuel costs, costs for operating resources and in some cases external costs.
- Operation-Related Costs (€/m2/year): This indicator relates to the costs of using the installation.
- Other Costs (€/m2/year): This indicator captures other costs such as the cost of insurance.
4.2.3. Overall Economic Performance
This sub-category of overall economic performance represents important factors in the decision-making in real estate markets (new built and renovation) from the perspective of building owners and investors. They provide an evaluation of the relative benefits of a particular choice of investment. They summarize both the capital costs and the operational costs together with possible sources of income in a single indicator. Within this sub-category of KPIs, the Net Present Value is the one that is considered the most reliable [43]. In some cases, especially when liquidity is a limiting factor, other KPIs, such as the Payback Period, might be more relevant to the building owner or investor.
- Net Present Value (€): The Net Present Value (NPV) is computed as the difference between the investment and the discounted cash flows related to an investment. In the context of SPENs, the cash flows can be represented by the yearly savings obtained by entering the project. These savings can be discounted using a risk-adjusted rate of return to provide an estimate of the value of these savings as if the investors would obtain them at the same moment when the investment occurs. The discount rate needs to be defined using available ones employed in similar projects or recovered from the stock market.
- Internal Rate of Return: The Internal Rate of Return (IRR) is defined as the discount rate that makes the current value of savings equal to the initial investment.
- Economic Value Added (€):The Economic Value Added is a quick evaluation measure that can be computed as the difference between the yearly savings and the minimum required savings.
- Payback Period (year): The Payback Period is the number of years it takes before the cumulative savings equals the initial investment.
- nZEB Cost Comparison (%): The nZEB Cost Comparison is computed as the ratio between the total cost of the respective investment and its nZEB alternative. The calculation period should cover the expected lifetime of the SPEN and the reference, e.g., 50 years.
4.3. Indoor Environmental Quality
People spend approximately 90% of their time in indoor environments [44]. Over the last decades, an abundant number of studies have shown that the indoor environmental quality (IEQ) has a significant impact on human health and wellbeing [45]. IEQ refers to the quality of a building’s environment with respect to wellbeing and health of the building occupants and is determined by many factors such as indoor thermal environment, air quality and lighting and acoustics [46]. Well designed and implemented plus energy buildings and neighbourhoods can bring multiple benefits, including improvements in air quality, health comfort and productivity. It is therefore essential to ensure that the IEQ positively contributes to realising these benefits.
This section aims at developing an approach to assess the IEQ of plus energy buildings by focusing on the main factors that determine the indoor environment (see Figure 9). A common approach to assess IEQ can help highlighting potential areas for improvement and provide useful feedback to building professionals and value chain actors, including designers, developers, facilities managers and property agents. The evaluation framework has been designed with the objectives of user friendliness, quality, reliability and economic feasibility. It is built on existing methodologies, frameworks, indexes and certification schemes such as Level(s) [47], CBE Survey [48], TAIL [49], DEQI [50], WELL [51], IEQ-Compass [52]. It also complies with the EN Standard 16798 [53,54]. The evaluation framework can be used at several stages of the life cycle of the buildings in a SPEN. The predicted IEQ characteristics of the buildings are explored at the design phase through calculations and simulations, while the actual IEQ is assessed during the operational phase through on-site measurements, checklists, and questionnaire surveys. This approach allows to determine whether the SPEN meet their design objectives but also make a link between design and operational performance.

Figure 9.
Evaluation sub-categories of the IEQ category.
4.3.1. Indoor Air Quality (IAQ)
Adequate indoor air quality is the air without harmful concentrations of contaminants [55]. Studies have linked poor indoor air quality with adverse health effects such as asthma, eczema and allergic diseases [56]. Carbon dioxide is of the most well-known contaminants and is a good proxy of the indoor air quality as it can provide an indication of the ventilation rate in a space. Therefore, CO2 (in units of ppm) has been selected as the KPI of the IAQ and its concentration ranges will be used to evaluate the indoor air quality according to the four categories specified in EN ISO 16798-1-2019.
4.3.2. Thermal Comfort
According to the EN ISO 7730, “thermal comfort is that condition of mind which expresses satisfaction with the thermal environment”. The level of occupant’s thermal comfort is often expressed in percentage of the number of people who are satisfied or dissatisfied with the thermal conditions. The most commonly used indexes are the predicted mean vote (PMV) and the predicted percentage dissatisfied (PPD)—these will be KPIs of the thermal environment. The calculation formulas for the PMV and PPD indexes are in line with the ISO 7730 and ASHRAE Standard 55. Air temperature (°C) and relative humidity (%) will be additional KPIs of the thermal environment of buildings without mechanical cooling. To evaluate the thermal environment, the percentage of time that temperatures are out of the ranges specified in the categories of EN 16798, should be estimated for buildings with and without cooling systems for the heating and cooling seasons.
4.3.3. Lighting and Visual Comfort
According to the EN12665, visual comfort is defined as “a subjective condition of visual well-being induced by the visual environment”. A good visual environment (e.g., adequate levels of natural and artificial lighting, reduced glare, etc.) can add to the well-being and productivity of the building occupants [57]. Illuminance is the total amount of light delivered on a surface by either natural daylight or electrical fitting. In this project, the illuminance (lux) and the daylight factor (%) will be measured and simulated to evaluate the visual environment and will serve as the KPIs of the lighting and visual comfort. Daylight factor is a metric expressing, as a percentage, the amount of daylight that is available in a room in comparison to the amount of daylight available outside under overcast sky conditions [57]. The daylight factor depends on the size, the transmission properties of the façade, the size and shape of the space as well as the extent to which external structures obscure the view of the sky.
4.3.4. Acoustic Comfort
Acoustic comfort includes the protection of building occupants from noise in order to provide a suitable acoustic environment for the designed human activity [58]. Depending on the levels of noise, it can cause annoyance, hearing damage or interference to speech intelligibility [59]. The acoustic environment should be designed to avoid these harmful effects and the criteria used to ask for an acceptable c environment are expressed in sound levels decibels (dB), noise rating (NR) or noise criteria (NC). To determine the quality levels of acoustic comfort in the living room, the percentage of hours that the level of acoustics exceed noise levels defined in the categories specified in EN 16798 will be estimated. The sound pressure level (dB(A)) will serve as the KPI of the acoustic comfort.
4.4. Social Performance
There are no standards on how to monitor social sustainability, which is due to inconsistencies in its definition [60]. Defining what social includes and what it does not is bound to political and contextual factors [61]. Social performance in the SPEN context is defined as the fidelity of development with human and societal values. This evolution should foster an environment that achieves reconciling cohabitation and heterogeneity, fostering cohesive community practices and improving in quality of life for. To achieve this, social performance is assessed on three pillars simultaneously (see Figure 10).

Figure 10.
Evaluation sub-categories of the social performance category.
- Equity: assessment of the fair, just and legitimate functioning of the community.
- Community: assessment of the ability of the community to maintain itself and thrive.
- People: assessment of human experiences, behaviour and outcomes.
Some methodological adjustments are necessary when evaluating social performance [62]. First, social KPIs vary most across different scales: on national levels demographic, systemic variables are prevalent, while on hyperlocal levels focus more on social interactions and quality of life. The neighbourhood scale is a mix of both, since it is place-based, but also requires some form of institutionalization in the PED context [63]. Second, it is not always apparent, whether a specific result for an indicator is good or bad, plus, in many cases this is location-dependent, meaning universal benchmarks are rarely feasible [60,64]. Third, social performance should be measured both as an objective variable and as the way people feel about it to account for varying user experiences [65]. Certain KPIs must couple objective and subjective components to avoid institutionalizing injustices of unconsidered human experiences [66]. The data collection for subjective experiences, however, must be carefully designed to avoid a collection of subjective interpretations—which can result in inconsistent responses. Finally, the distribution of social performance must also be monitored to avoid obscuring disparities and discrimination among different social groups [61].
4.4.1. Equity
Equity indicators describe the fair, just, legitimate functioning of the SPEN. It refers to various aspects of justice, including spatial and procedural, referring to the distribution of services (such as education, green spaces, adequate and affordable housing, public transportation), and participation on important issues, especially where valuable infrastructure (here, energy assets) are shared. It includes just, equitable, accountable distribution of influence, blind to all aspects of identity or personal resources. Core KPIs are:
- Access to Services measures whether services of general interest (education, groceries, healthcare, green, etc. as discussed in EC Com (2011) 900) are in walkable distance to all households. It is a GIS-based assessment through the aggregation of distances evaluated against service-specific thresholds for each service and each household. This metric indicates both walkability—for an environmental perspective [67]—and spatial justice—for a social perspective [68].
- Affordability of Energy is the adoption the standardised European “arrears” and “share of income spent on energy” indicators for energy poverty developed by the European Energy Poverty Observatory (EPOV) [69]. It is measured through a household survey and reflects the wider goal of providing just sustainable transition for all [70].
- Affordability of Housing is measuring, in a household survey the share of people with a housing cost overburden, and mapping the income required to afford housing in the SPEN. This is partially in line with the European standard of relating housing costs to income [71,72,73], but considers more items on the cost side to fully reflect real cost of housing—notably mortgage principals. Also, the second metric of the KPI indicates whether the SPEN is gated or affordable for the larger population.
- Democratic Legitimacy is measured by two sets of criteria: objective and subjective. Objective criteria are measured on the process and content of stakeholder consultation [74], while the subjective part is a survey of participants on their experiences of the process [72]. Legitimacy is critical to ensure the principle of subsidiarity [75], and a fair consideration of individual interests in collective and top-down decisions [36].
- Living Conditions are the adoption of overcrowding and common poor living condition “red flags” monitored by Eurostat, which in turn refers to SDGs 1, 6 and 11 [67,73]. These are measured in household surveys as they are determinants of social, health-related and environmental outcomes [67,69,71,73].
In addition to the core KPIs presented here, complementary KPIs that may be included in this category are access to amenities [68], sustainable mobility and accessibility to universal design [76].
4.4.2. Community
Community indicators describe the resilience, and self-reinforcing quality of local communities. On the one hand, this refers to maintenance of social networks, including absorbing newcomers and engaging with existing members. On the other hand, this refers to social capital exchange in social networks, including the use of public spaces and other channels for meaningful interactions, conflict resolution, and supporting one another.
- Social Cohesion addresses the existence and the conditions for strong social networks, formed on trust-based bonds, with a capacity to absorb and build on diversity [72,77,78]. The indicator has a subjective, normative component that evaluates personal resilience attributed to belonging in a household survey [72,78]. It also has descriptive component, in a form of a checklist of environmental features that can support social cohesion [71,79].
4.4.3. People
People indicators refer to social performance measured on individuals and describing personal, human conditions. These cover human needs, like health, employment, education, security, and quality of life metrics, such as wellbeing, happiness and comfort. Additionally, people indicators include environmental determinants for both of the above. Lastly, they describe how sustainably people inhabit their SPEN, how they behave and interact with their environment, and its resources.
- Personal Safety refers to the goal of providing safe, non-intrusive public and shared spaces eliminating deterrents of walking and staying outdoors, especially for women [68]. The indicator has a subjective, normative component that is the adoption of standard Eurostat metrics in a household survey [73]. It also has a descriptive component, in a form of a checklist of environmental features that are associated with perceived and real safety in public space.
- Energy Consciousness describes the behavioural determinants of energy use, which is crucial to eliminate occupant-centric barriers to coordinated, environmentally conscious energy management [63]. The indicator is measured through a household survey. The survey extracts personal drivers behind environmental, energy, and technology-related decisions based on common behavioral models [80,81]. These helps classify the main drivers per social group and guidelines are provided how to respond to specific driver classes.
4.5. Smartness and Flexibility
Smartness and flexibility refers to the ability of the built environment to manage its energy demand and local generation according to the climate conditions, user needs and preferences and grid requirements. For its assessment, two sub-categories are defined: flexibility and smartness (see Figure 11). The Flexibility Index and the Smart Readiness Indicator (SRI) are proposed as KPIs, respectively.
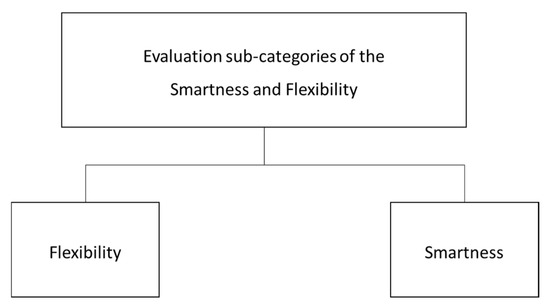
Figure 11.
Evaluation sub-categories of the smartness and flexibility.
4.5.1. Flexibility
The flexibility index is proposed to evaluate flexibility in SPENs. The flexibility index has been developed during the past years and several publications explain it in details [17,75]. The flexibility index is related to the ability of a system to react at a variable price signal and, thus, optimize the energy usage of a given system to minimize the energy cost.
- The flexibility index is defined as the monetary savings that can be achieved by adopting a flexible energy usage, for a given price-signal [82]. For example, given a price-signal, a building or a neighbourhood obtaining a Flexibility Index of 0.1 means that the building or neighbourhood is able to save 10% of its energy costs, by applying energy flexibility, for the given price signal. It shall be noted that, if the price reflects the amount of CO2 emissions of the energy mix used as energy source, the flexibility index is also representing the savings of CO2 emissions obtained through the smart controller.
4.5.2. Smartness
The SRI [83] at the building level has been adopted by the EU as the main measure to evaluate how smart-ready buildings are (https://smartreadinessindicator.eu/ (accessed on 16 July 2021)). According to the executive summary [84] on the “Smart Readiness Indicators”, the aim of the SRI is to “make the added value of building smartness more tangible for building users, owners, tenants and smart service providers”. The roll-out scheme for the SRI implementation across the EU procedure was published in October 2020 [85] The definition of Smartness in buildings can be adapted to the neighbourhood level.
- Smartness Readiness Indicator of a SPEN refers to the ability of a neighbourhood (namely, its systems and buildings) to sense, interpret, communicate and actively respond in an efficient manner to changing conditions in relation to the operation of technical building systems or the external environment and to demands from the occupants and the users of the different buildings and services. The readiness of a neighbourhood to be smart is related to three aspects: adapting in response to the needs of the occupants and users, facilitating the maintenance and efficient operation processes and adapting in response to (price) signals from the grid. From the practical point of view, it is suggested to compute the SRI for each building of a SPEN, singularly.
5. Discussion
This paper presents two main contributions to the existing literature. The first one is to put forth a consistent definition of Sustainable Plus Energy Neighbourhood (SPEN) with the objective to make an active contribution to the ongoing debate on a common understanding of what a Positive Energy District (PED) is and how it should be evaluated. Acknowledging the positive benefits to act at larger scale than at individual buildings, a SPEN is defined as a group of interconnected buildings with associated infrastructure, located within both a confined functional area and/or virtual boundary. A SPEN aims to reduce its direct and indirect energy use towards zero over an adopted complete year with an increased use and production of renewable energy. Beyond the consideration of the energy balance, several other aspects need to be considered to achieve a successfully sustainable PED. Then, additionally, the definition of a SPEN covers the following five main objectives:
- The primary energy, net-zero greenhouse gas emissions and carbon footprint reduction;
- The active management of annual site or regional surplus production of renewable energy and power performance (self-consumption, peak shaving, etc.) through smart management and energy flexibility;
- The cost efficiency and economic sustainability according to a life cycle assessment;
- An improved indoor environment for well-being of the inhabitants; and
- The social inclusiveness, interaction and empowerment related to co-use, shared services and affordable living.
The second major contribution is to present an evaluation framework for the assessment of SPENs, to be applied both during the design phase and the operational phase to monitor their performance. The evaluation framework defines five main categories and the KPIs which are essential for the evaluation of SPENs are described with the rationale of their selection. The selection of the main assessed categories and KPIs have been based on a holistic and exhaustive methodology which highlights the multiple dimensions when addressing sustainability in districts as moving beyond the traditional and strict building energy assessment. The indicators set for each category were selected with the objective to be diverse enough and to represent the SPEN goals in a balanced and integrated way. Methodology is based on a tagging structure, DAGs and expert knowledge. A total number of 38 KPIs that allow addressing the multidimensionality nature of SPENs are described and distributed in five categories which are:
- Energy and Environmental: addressing overall energy and environmental performance, matching factors between load and on-site renewable generation and grid interaction;
- Economic: addressing capital costs and operational costs;
- Indoor Environmental Quality (IEQ): addressing thermal and visual comfort, as well as indoor air quality;
- Social indicators: addressing the aspects of equity, community and people; and
- Smartness and Energy Flexibility: addressing the ability of manage energy in clusters of buildings according sustainable objectives.
Our study provides additional support and considerable insight to large scale deployment of SPENs and PEDs. The next steps and further work will include the testing and validation of the proposed assessment framework and the indicators in four real projects across Europe, both in the integrated design phase and the operational phase. The projects are real estate developments pursuing the SPEN’s objectives in four different climate zones (Subartic, Marine, Mediterranean and Continental) with different housing contexts [1]. Our research can be a useful aid for the design, construction and post-occupancy evaluation of PEDs in an holistic way.
Author Contributions
Conceptualization, J.S., I.A. and N.G.; methodology, J.S., A.R., Á.M., P.V.D., S.Z., C.C., I.A. and D.C.; investigation, M.T., P.C., D.C., V.B., R.B., P.V.D., C.M., C.C. and Z.T.; writing—original draft preparation, M.T., P.C., V.B., P.V.D., D.C. and C.C.; writing—review and editing, J.S., I.A., S.Z., J.P., A.R. and N.G.; visualization, P.C.; supervision, J.S.; funding acquisition, N.G. All authors have read and agreed to the published version of the manuscript.
Funding
The research conducted in this paper has received funding from the European Union’s Horizon 2020 research and innovation programme under grant agreement No 869918, SYN.IKIA Project. Paolo Civiero acknowledges the funding received from the European Union’s Horizon 2020 research and innovation programme under the Marie Skłodowska-Curie grant agreement No 712949 (TECNIOspring PLUS) and the Agency for Business Competitiveness of the Government of Catalonia.
Institutional Review Board Statement
Not applicable.
Informed Consent Statement
Not applicable.
Data Availability Statement
Not applicable.
Conflicts of Interest
The authors declare no conflict of interest.
Abbreviations
| CEN | European committee for standarisation |
| CHP | Combined heat and power |
| DAG | Directed acyclic graph |
| DER | Distributed energy resources |
| DG | Distributed generation |
| DR | Demand response |
| EED | Energy efficiency directive |
| EPB | Energy performance of a building |
| EPBD | Energy performance of buildings directive |
| EV | Electrical vehicle |
| GHG | Greenhouse gas |
| IAQ | Indoor air quality |
| ICT | Information and communications technology |
| IEQ | Indoor environmental quality |
| IRR | Internal rate of return |
| KPI | Key performance indicator |
| M&E | Measurement and evaluation |
| NC | Noise criteria |
| NPV | Net present value |
| NR | Noise rating |
| nZEB | Nearly zero energy building |
| PEB | Positive energy building |
| PED | Positive energy district |
| PMV | Predicted mean vote |
| PPD | Predicted percentage dissatisfied |
| RER | Renewable energy ratio |
| RES | Renewable energy resources |
| RH | Relative humidity |
| SDG | Sustainable development goal |
| SPEN | Sustainable positive energy neighbourhood |
| SRI | Smart readiness indicator |
| WEC | World energy council |
References
- NTNU. Syn.Ikia—Sustainable Plus Energy Neighbourhoods-EU H2020 G.A. No. 841850. Available online: https://www.synikia.eu/ (accessed on 10 June 2021).
- Salom, J.; Marszal, A.J.; Widén, J.; Candanedo, J.; Lindberg, K.B. Analysis of load match and grid interaction indicators in net zero energy buildings with simulated and monitored data. Appl. Energy 2014, 136, 119–131. [Google Scholar] [CrossRef]
- Marszal-Pomianowska, A.; Johra, H.; Knotzer, A.; Salom, J.; Péan, T.; Jensen, S.Ø.; Mlecnik, E.; Kazmi, H.; Pernet, R.; Klein, K.; et al. International Energy Agency—Principles of Energy Flexible Buildings: Energy in Buildings and Communities Programme Annex 67 Energy Flexible Buildings; Danish Technological Institute: Taastrup, Denmark, 2019. [Google Scholar]
- Wiik, M.K.; Fufa, S.M.; Baer, D.; Sartori, I.; Andresen, I. The Zen Definition—A Guideline for the Zen Pilot Areas; Research Report; SINTEF Akademisk Forlag: Trondheim, Norway, 2018; No. 11. [Google Scholar]
- Proposal for the European Partnership Driving Urban Transitions Draft Proposal for a European Partnership under Horizon Europe Driving Urban Transitions to a Sustainable Future (DUT). Available online: https://ec.europa.eu/info/files/european-partnership-driving-urban-transitions-sustainable-future-dut_en (accessed on 16 July 2021).
- EU SETIS SET-Plan Temporary Working Group 3.2. SET-Plan ACTION n°3.2 Implementation Plan. 2018. Available online: http://docplayer.net/99748225-Set-plan-action-n-3-2-implementation-plan.html (accessed on 17 July 2021).
- EERA Joint Programme Smart Cities. Available online: https://www.eera-sc.eu/ (accessed on 10 June 2021).
- European Innovation Partnership on Smart Cities and Communities. Available online: https://smart-cities-marketplace.ec.europa.eu/ (accessed on 10 June 2021).
- European Regions Research and Innovation Network. Available online: https://errin.eu/ (accessed on 10 June 2021).
- Eurocities. Available online: http://www.eurocities.eu/ (accessed on 10 June 2021).
- International Energy Agency EBC Annex 83 PEDs. Available online: https://annex83.iea-ebc.org/ (accessed on 10 June 2021).
- European Cooperation in Science and Technology Action. Available online: https://www.cost.eu/ (accessed on 10 June 2021).
- Polly, B.; Pless, S.; Houssainy, S.; Torcellini, P.; Livingood, W.; Zaleski, S.; Jungclaus, M.; Hootman, T.; Craig, M. A Guide to Energy Master Planning of High-Performance Districts and Communities; Technical Report; National Renewable Energy Lab. (NREL): Golden, CO, USA, 2020. [Google Scholar]
- JPI Urban Europe/SET Plan Action 3.2. Europe Towards Positive Energy Districts. PED Booklet. 2020. Available online: https://jpi-urbaneurope.eu/ped/ (accessed on 10 June 2021).
- The Smart Cities Information System (SCIS). Actions & Recommendations: Creating A Joint Vision for Peds (Positive Energy Districts). 2020. Available online: https://cityxchange.eu/eusew-2020-webinar-creating-a-joint-vision-for-positive-energy-districts/ (accessed on 16 July 2021).
- van Dijk, D.; Hogeling, J. The new EN ISO 52000 family of standards to assess the energy performance of buildings put in practice. E3S Web Conf. 2019, 111. [Google Scholar] [CrossRef]
- Stankuniene, G.; Streimikiene, D.; Kyriakopoulos, G.L. Systematic literature review on behavioral barriers of climate change mitigation in households. Sustainability 2020, 12, 7369. [Google Scholar] [CrossRef]
- Yu, X.; Ma, S.; Cheng, K.; Kyriakopoulos, G.L. An evaluation system for sustainable urban space development based in green urbanism principles—A case study based on the Qin-Ba mountain area in China. Sustainability 2020, 12, 5703. [Google Scholar] [CrossRef]
- Jensen, S.Ø.; Madsen, H.; Lopes, R.; Junker, R.G.; Aelenei, D.; Li, R.; Metzger, S.; Lindberg, K.B.; Marszal, A.J.; Kummert, M.; et al. Annex 67: Energy Flexible Buildings—Energy Flexibility as a Key Asset in a Smart Building Future—Contribution of Annex 67 to the European Smart Building Initiatives; EBC: Vienna, Austria, 2017; pp. 1–16. Available online: http://www.annex67.org/media/1470/position-paper-energy-flexibility-as-a-key-asset-i-a-smart-building-future.pdf (accessed on 16 July 2021).
- Wang, N.; Phelan, P.E.; Gonzalez, J.; Harris, C.; Henze, G.P.; Hutchinson, R.; Langevin, J.; Lazarus, M.A.; Nelson, B.; Pyke, C.; et al. Ten questions concerning future buildings beyond zero energy and carbon neutrality. Build. Environ. 2017, 119, 169–182. [Google Scholar] [CrossRef]
- Brozovsky, J.; Gustavsen, A.; Gaitani, N. Zero emission neighbourhoods and positive energy districts—A state-of-the-art review. Sustain. Cities Soc. 2021, 72, 103013. [Google Scholar] [CrossRef]
- Salom, J.; Tamm, M. Methodology Framework for Plus Energy Buildings and Neighbourhoods. 2020. Available online: https://www.synikia.eu/wp-content/uploads/2020/12/D3.1_Methodology-framework-for-Plus-Energy-Buildings-and-Neighbourhoods.pdf (accessed on 16 July 2021).
- Reith, A. Restore—WG5: Scale jumping. In Proceedings of the Presented at the Kick off Meeting, Larnaca, Cyprus, 2 March 2020. [Google Scholar]
- Institut Català d’Energia, Smart Energy Communities: Insights into Its Structure and Latent Business Models. 2019. Available online: http://icaen.gencat.cat/web/.content/10_ICAEN/17_publicacions_informes/11_altres_publicacions/arxius/SmartEnergyCommunities.pdf (accessed on 16 July 2021).
- Valdés, J. Arbitrariness in multidimensional energy security indicators. Ecol. Econ. 2018, 145, 263–273. [Google Scholar] [CrossRef]
- Tversky, A.A.; Kahneman, D.D. Judgement under uncertainty: Heuristics and biases. J. Exp. Soc. Psychol. 1974, 6, 401–419. [Google Scholar] [CrossRef]
- Adame, B.J. Training in the mitigation of anchoring bias: A test of the consider-the-opposite strategy. Learn. Motiv. 2016, 53, 36–48. [Google Scholar] [CrossRef]
- Weaver, W. Science and complexity. Am. Sci. 1948, 36, 536–544. [Google Scholar]
- Zeng, G.; Zeng, E. On the relationship between multicollinearity and separation in logistic regression. Commun. Stat. Simul. Comput. 2019, 1–9. [Google Scholar] [CrossRef]
- Pearl, J.; Dechter, R. Identifying independencies in causal models with feedback. Acta Math. Appl. Sin. 2000, 23, 299–310. [Google Scholar]
- Tanguay, G.A.; Rajaonson, J.; Lefebvre, J.F.; Lanoie, P. Measuring the sustainability of cities: An analysis of the use of local indicators. Ecol. Indic. 2010, 10, 407–418. [Google Scholar] [CrossRef]
- Shannon, C.E. A mathematical theory of communication. Bell Syst. Tech. J. 1948, 27, 379–423. [Google Scholar] [CrossRef]
- International Standard Overarching EPB Assessment; ISO: Geneva, Switzerland, 2017.
- Mazzarella, L. Rehva Report 04: nZEB Technical Definition and System Boundaries for Nearly Zero Energy Buildings; REHVA: Ixelles, Belgium, 2013; No. 4. [Google Scholar]
- Cao, S.; Hasan, A.; Sirén, K. On-site energy matching indices for buildings with energy conversion, storage and hybrid grid connections. Energy Build. 2013, 64, 423–438. [Google Scholar] [CrossRef]
- Brattebø, H.; Gustavsen, A.; Wiik, M.K.; Fufa, S.M.; Krogstie, J.; Ahlers, D.; Wyckmans, A.; Driscoll, P. Zero Emission Neighbourhoodsin Smart Cities: Definition, Key Performance Indicators and Assessment Criteria; Techincal Report; SINTEF Akademisk Forlag: Trondheim, Norway, 2018; Version 1.0, No. 7. [Google Scholar]
- Haberl, R.; Haller, M.; Bamberger, E.; Reber, A. Hardware-In-the-loop tests on complete systems with heat pumps and PV for the supply of heat and electricity. In Proceedings of the 12th International Conference on Solar Energy for Buildings and Industry, Rapperswil, Switzerland, 10–13 September 2018; pp. 1–10. [Google Scholar] [CrossRef]
- Salom, J.; Widén, J.; Candanedo, J.; Lindberg, K.B. Analysis of grid interaction indicators in net zero-energy buildings with sub-hourly collected data. Adv. Build. Energy Res. 2015, 9, 89–106. [Google Scholar] [CrossRef]
- Verbruggen, B.; de Coninck, R.; Baetens, R.; Saelens, D.; Helsen, L.; Driesen, J. Grid impact indicators for active building simulation. In Proceedings of the ISGT 2011 (the Innovative Smart Grid Technologies), Anaheim, CA, USA, 17–19 January 2011. [Google Scholar] [CrossRef]
- Tejero, A.; Ortiz, J.; Salom, J. Evaluation of occupancy impact in a residential multifamily nZEB through a high resolution stochastic model. In Proceedings of the 4th Building Simulation and Optimization Conference, Cambridge, UK, 11–12 September 2018. [Google Scholar]
- Marijuán, G.; Etminan, G.; Möller, S. Smart cities information system—Key performance indicator guide version 2.0. In Proceedings of the 3rd IEEE Conference on Smart Cities and Innovative Systems, Marrakesh, Morocco, 21–24 October 2018. [Google Scholar]
- Bossi, S.; Gollner, C.; Theierling, S. Towards 100 positive energy districts in Europe: Preliminary data analysis of 61 European cases. Energies 2020, 13, 6083. [Google Scholar] [CrossRef]
- Brealey, R.A.; Myers, S.C.; Allen, F. Principles of Corporate Finance, 10th ed.; McGraw-Hill/Irwin: New York, NY, USA, 2011. [Google Scholar]
- Klepeis, N.E.; Nelson, W.C.; Ott, W.R.; Robinson, J.P.; Switzer, P. The national human activity pattern survey (NHAPS): A resource for assessing exposure to environmental pollutants. J. Expo. Sci. Environ. Epidemiol. 2001, 11, 231–252. [Google Scholar] [CrossRef] [PubMed]
- Al horr, Y.; Arif, M.; Katafygiotou, M.; Mazroei, A.; Kaushik, A.; Elsarrag, E. Impact of indoor environmental quality on occupant well-being and comfort: A review of the literature. Int. J. Sustain. Built Environ. 2016, 5, 1–11. [Google Scholar] [CrossRef]
- NIOSH. Indoor Environmental Quality. Centers for DIsease Control and Prevention—The National Institute for Occupational Safety and Health (NIOSH). Available online: https://www.cdc.gov/niosh/topics/indoorenv/default.html (accessed on 16 July 2021).
- Dodd, N.; Cordella, M.; Travreso, M.; Donatello, S. Level(s)—A Common EU Framework of Core Sustainability Indicators for Office and Residential Buildings Part 3: How to Make Performance Assessments Using Level(s) (Beta v1.0); Publications Office of the EU: Luxembourg, 2017. [Google Scholar] [CrossRef]
- Center for the Built Environment (CBE). Occupant Indoor Environmental Quality Survey. Available online: https://cbe.berkeley.edu/research/occupant-survey-and-building-benchmarking/ (accessed on 16 July 2021).
- Wargocki, P.; Mandin, C.; Wei, W. ALDREN Methodology Note on Addressing Health and Wellbeing. 2020. Available online: https://aldren.eu/wp-content/uploads/2020/12/D2_4.pdf (accessed on 16 July 2021).
- Laskari, M.; Karatasou, S.; Santamouris, M. A methodology for the determination of indoor environmental quality in residential buildings through the monitoring of fundamental environmental parameters: A proposed Dwelling Environmental Quality Index. Indoor Built Environ. 2017, 26, 813–827. [Google Scholar] [CrossRef]
- WELL, The WELL Building Standard v1. 2019. Available online: https://www.wellcertified.com/certification/v1/standard/ (accessed on 16 July 2021).
- Larsen, T.S.; Rohde, L.; Jønsson, K.T.; Rasmussen, B.; Jensen, R.L.; Knudsen, H.N.; Witterseh, T.; Bekö, G. IEQ-Compass—A tool for holistic evaluation of potential indoor environmental quality. Build. Environ. 2020, 172. [Google Scholar] [CrossRef]
- CEN, EN 16798-1:2019 Energy Performance of Buildings—Ventilation for Buildings—Part 1: Indoor Environmental Input Parameters for Design and Assessment of Energy Performance of Buildings Addressing Indoor Air Quality, Thermal Environment, Lighting and Acous. 2019.
- CEN, EN 16798-2:2019 Energy Performance of Buildings—Ventilation for Buildings—Part 2: Interpretation of the Requirements in EN 16798-1—Indoor Environmental Input Parameters for Design and Assessment of Energy Performance of Buildings Addressing Indoor Air Quality, Thermal Environment, Lighting and Acoustics (Module M1-6). 2019.
- Ventilation for Acceptable Indoor Air Quality, (ASHRAE Standard); R. American Society of Heating and and Air-Conditioning Engineers (ASHRAE): New York, NY, USA, 2004; Volume 2004, p. 53.
- Dorizas, P.V.; de Groote, M.; Volt, J. The Inner Value of a Building: Linking Indoor Environmental Quality and Energy Performance in Building Regulation; Buildings Performance Institute Europe: Brussels, Belgium, 2018. [Google Scholar]
- VELUX, Daylight Calculations and Measurements. Available online: https://www.velux.com/what-we-do/research-and-knowledge/deic-basic-book/daylight/daylight-calculations-and-measurements (accessed on 16 July 2021).
- BPIE, How to Integrate Indoor Environmental Quality Long-Term Renovation Strategies. Available online: https://www.bpie.eu/publication/briefing-how-to-integrate-indoor-environmental-quality-within-national-long-term-renovation-strategies/ (accessed on 16 July 2021).
- CISBE. Environmental Design: Guide A; CIBSE: London, UK, 2006. [Google Scholar]
- Colantonio, A. Social sustainability: A review and critique of traditional versus emerging themes and assessment methods. In Proceedings of the 2nd International Conference on Whole Life Urban Sustainability and its Assessment, Loughborough, UK, 22–24 April 2009. [Google Scholar]
- Polese, M.; Stren, R. The Social Sustainability of Cities; University of Toronto Press: Toronto, ON, Canada, 2000. [Google Scholar]
- Bukovszki, V.; Balázs, R.; Mafé, C.; Reith, A. Six lessons learned by considering social sustainability in plus-energy neighbourhoods. In Proceedings of the 18th Vienna Congress on Sustainable Building, Vienna, Austria, 24–25 March 2021; pp. 26–28. [Google Scholar]
- Bukovszki, V.; Magyari, Á.; Braun, M.K.; Párdi, K.; Reith, A. Energy modelling as a trigger for energy communities: A joint socio-technical perspective. Energies 2020, 13, 2274. [Google Scholar] [CrossRef]
- Dempsey, N.; Bramley, G.; Power, S.; Brown, C. The social dimension of sustainable development: Defining urban social sustainability. Sustain. Dev. 2011, 19, 289–300. [Google Scholar] [CrossRef]
- Takagi, H. Interactive Evolutionary Computation: System Optimization Based on Human Subjective Evaluation; IEEE: Piscataway, NJ, USA, 1998. [Google Scholar]
- Ansell, C.K.; Torfing, J. Public Innovation through Collaboration and Design; Routledge: Abingdon, UK, 2014. [Google Scholar]
- National Affordable Homes Agency. 721 Housing Quality Indicators (HQI) Form. 2007. Available online: https://assets.publishing.service.gov.uk/government/uploads/system/uploads/attachment_data/file/366634/721_hqi_form_4_apr_08_update_20080820153028.pdf (accessed on 16 July 2021).
- Soja, E.W. The city and spatial justice. Spat. Justice 2009, 1, 1–5. [Google Scholar]
- Thema, J.; Vondung, F. EPOV Indicator Dashboard: Methodology Guidebook; Wuppertal Institut für Klima, Umwelt, Energie GmbH: Wuppertal, Germany, 2020. [Google Scholar]
- European Commission. The European Green Deal Investment Plan and Just Transition Mechanism Explained. 2020. Available online: https://ec.europa.eu/commission/presscorner/detail/en/qanda_20_24 (accessed on 16 July 2021).
- Leidelmeijer, K.; Marlet, G.; Ponds, R.; Schulenberg, R.; van Woerkens, C.; van Ham, M.V.M. Leefbaarometer 2.0: Instrumentontwikkeling; Research en Advies: Amsterdam, The Netherlands, 2015. [Google Scholar]
- City of Vancouver. Social Indicators and Trends: City of Vancouver Profile 2019. Vancouver, BC, Canada. 2019. Available online: https://vancouver.ca/files/cov/2020-01-22-social-indicators-and-trends-2019-city-demographic-profile.pdf (accessed on 16 July 2021).
- European Commission. Sustainable Cities and Communities. In Sustainable Development Indicators; Eurostat: Luxembourg, 2020. [Google Scholar]
- BREEAM. BREEAM Communities Technical Manual; BRE: Watford, UK, 2012. [Google Scholar]
- European Commission. Glossary—Regional Policy. 2020. Available online: https://ec.europa.eu/regional_policy/en/policy/what/glossary/ (accessed on 16 July 2021).
- ISO. ISO 21542:2011(en), Building Construction—Accessibility and Usability of the Built Environment; BREEAM Communities Technical Manual; BRE: Watford, UK, 2012. [Google Scholar]
- Michalos, E. Encyclopedia of Quality of Life and Well-Being Research; Springer: Dordrecht, The Netherlands, 2014. [Google Scholar]
- Scanlon Foundation. Mapping Social Cohesion. 2019. Available online: https://scanlonfoundation.org.au/wp-content/uploads/2019/11/Mapping-Social-Cohesion-2019-FINAL-3.pdf (accessed on 16 July 2021).
- Anne, T.; Bass, R.M. Assessing Your Innovation District: A How-to Guide. 2018. Available online: https://www.brookings.edu/wp-content/uploads/2018/02/audit-handbook.pdf (accessed on 16 July 2021).
- Paul, J.; Modi, A.; Patel, J. Predicting green product consumption using theory of planned behavior and reasoned action. J. Retail. Consum. Serv. 2016, 29, 123–134. [Google Scholar] [CrossRef]
- van Trijp, H.C.M. Encouraging Sustainable Behavior: Psychology and the Environment; Taylor and Francis: Abingdon, UK, 2013. [Google Scholar]
- Junker, R.G.; Azar, A.G.; Lopes, R.A.; Lindberg, K.B.; Reynders, G.; Relan, R.; Madsen, H. Characterizing the energy flexibility of buildings and districts. Appl. Energy 2018, 225. [Google Scholar] [CrossRef]
- Verbeke, S.; Aerts, D.; Reynders, G.; Ma, Y.; Waide, P. (WSEE), Final Report on the Technical Support to the Development of a Smart Readiness Indicator for Buildings. 2020. Available online: https://op.europa.eu/en/publication-detail/-/publication/f9e6d89d-fbb1-11ea-b44f-01aa75ed71a1/language-en?WT.mc_id=Searchresult&WT.ria_c=37085&WT.ria_f=3608&WT.ria_ev=search (accessed on 14 June 2021).
- Verbeke, S.; Aerts, D.; Rynders, G.; Ma, Y.; Waide, P. Summary of State of Affairs in 2nd Technical Support Study on the Smart Readiness Indicator for Buildings. 2020. Available online: https://smartreadinessindicator.eu/sites/smartreadinessindicator.eu/files/sri_summary_2nd_interim_report.pdf (accessed on 16 July 2021).
- European Commission. Smart’ Buildings—Smart Readiness Indicator (Arrangements for Rollout of Scheme). Available online: https://ec.europa.eu/info/law/better-regulation/have-your-say/initiatives/12365-Implementation-modalities-of-the-smart-readiness-indicator-for-buildings (accessed on 16 July 2021).
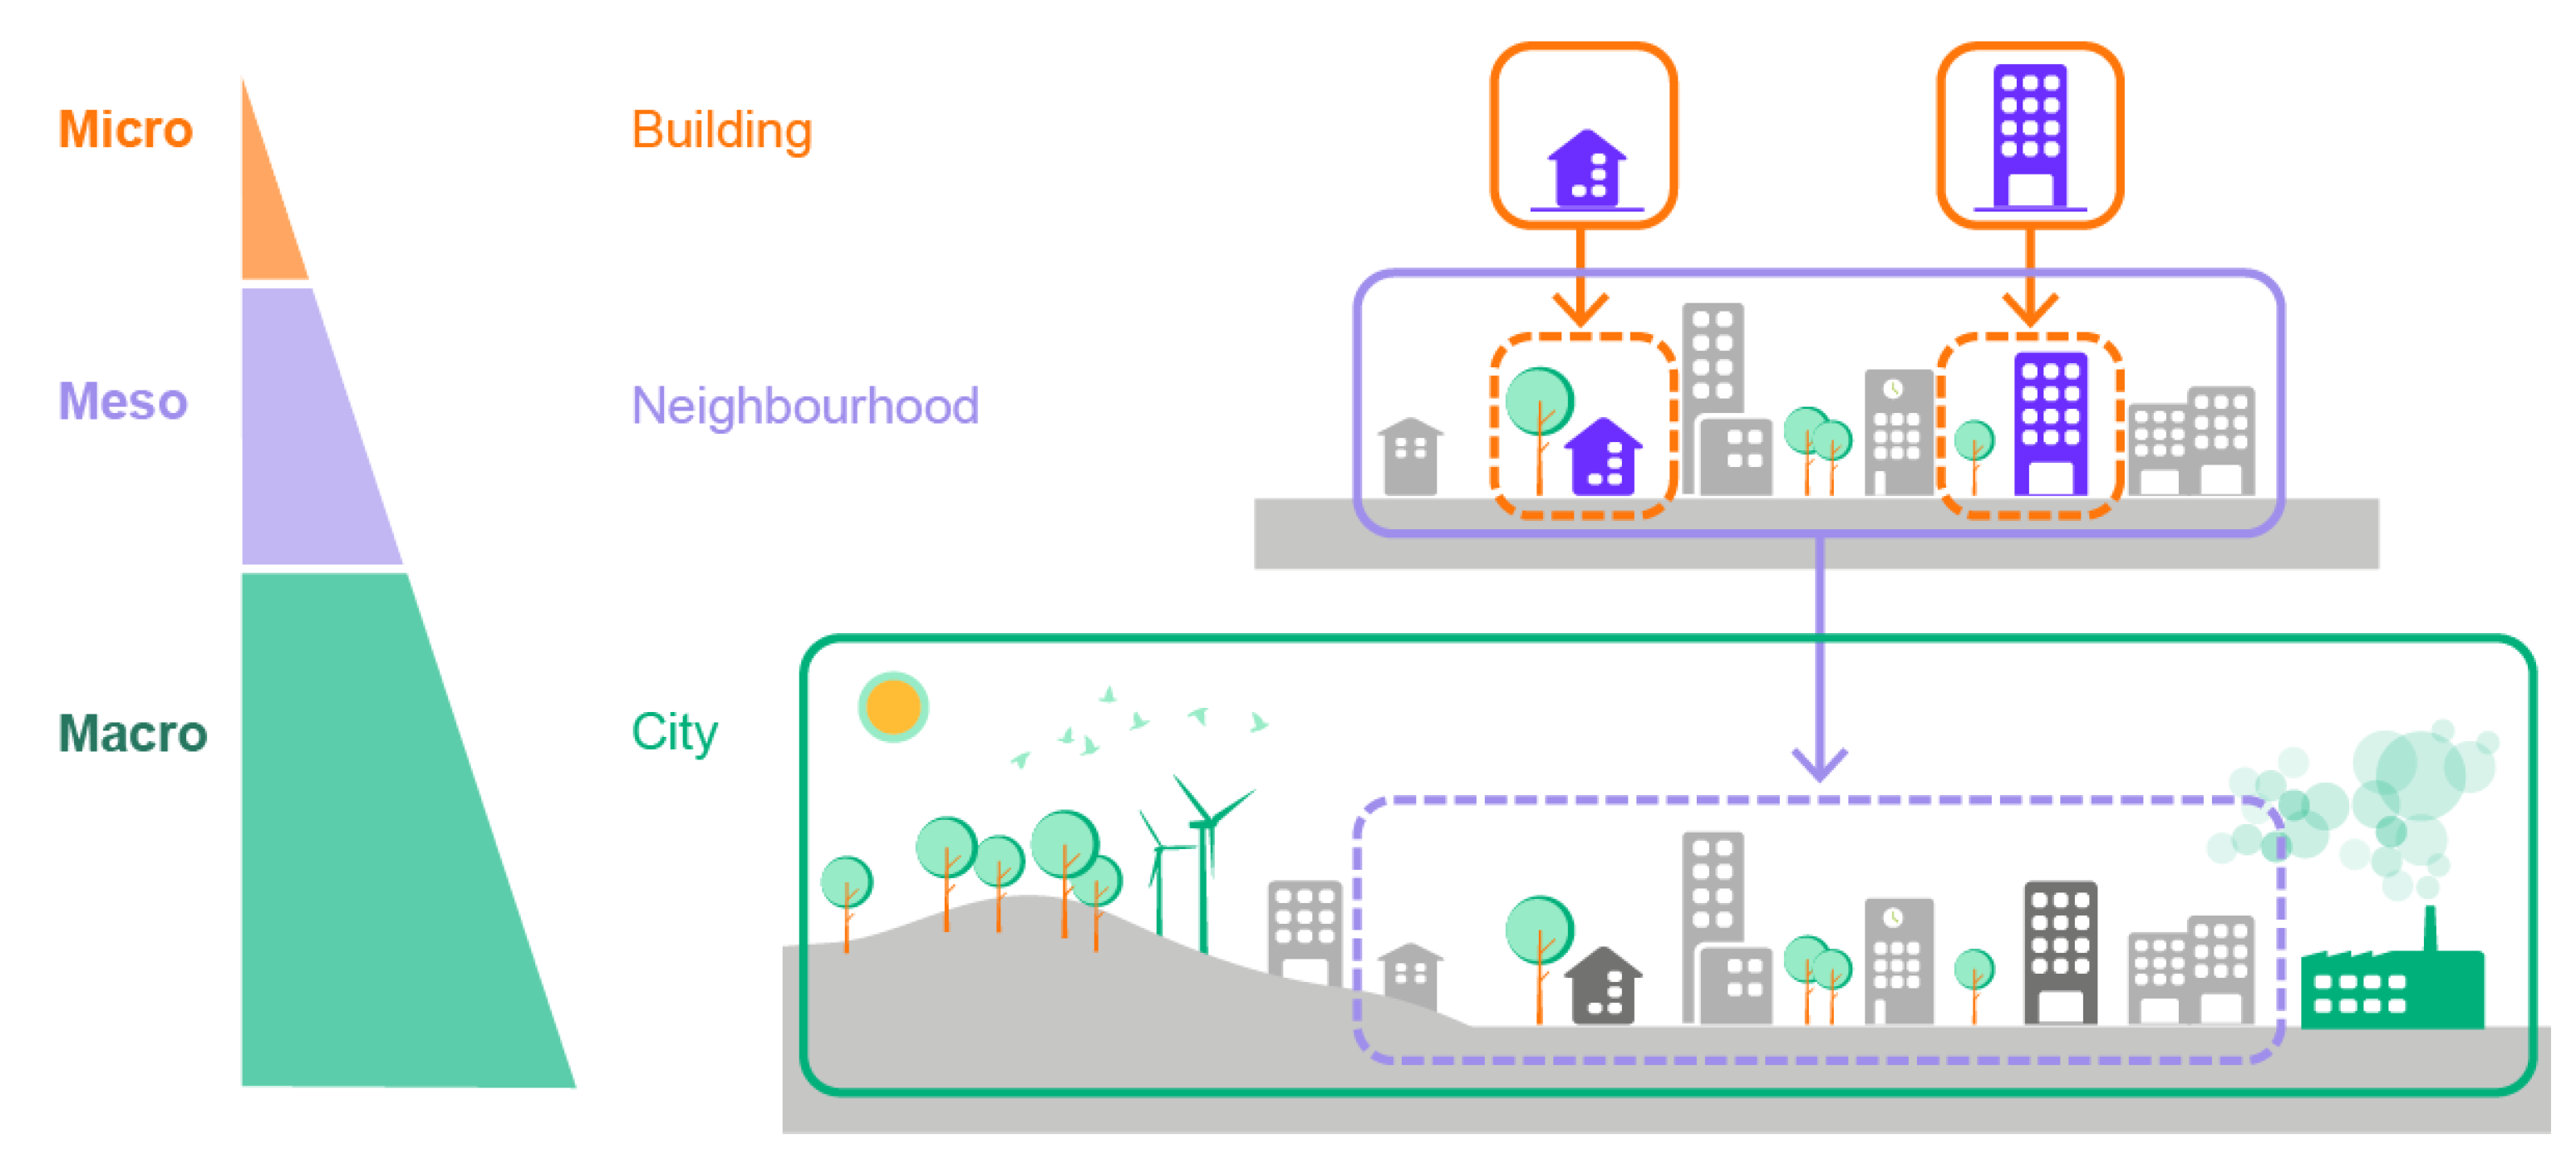
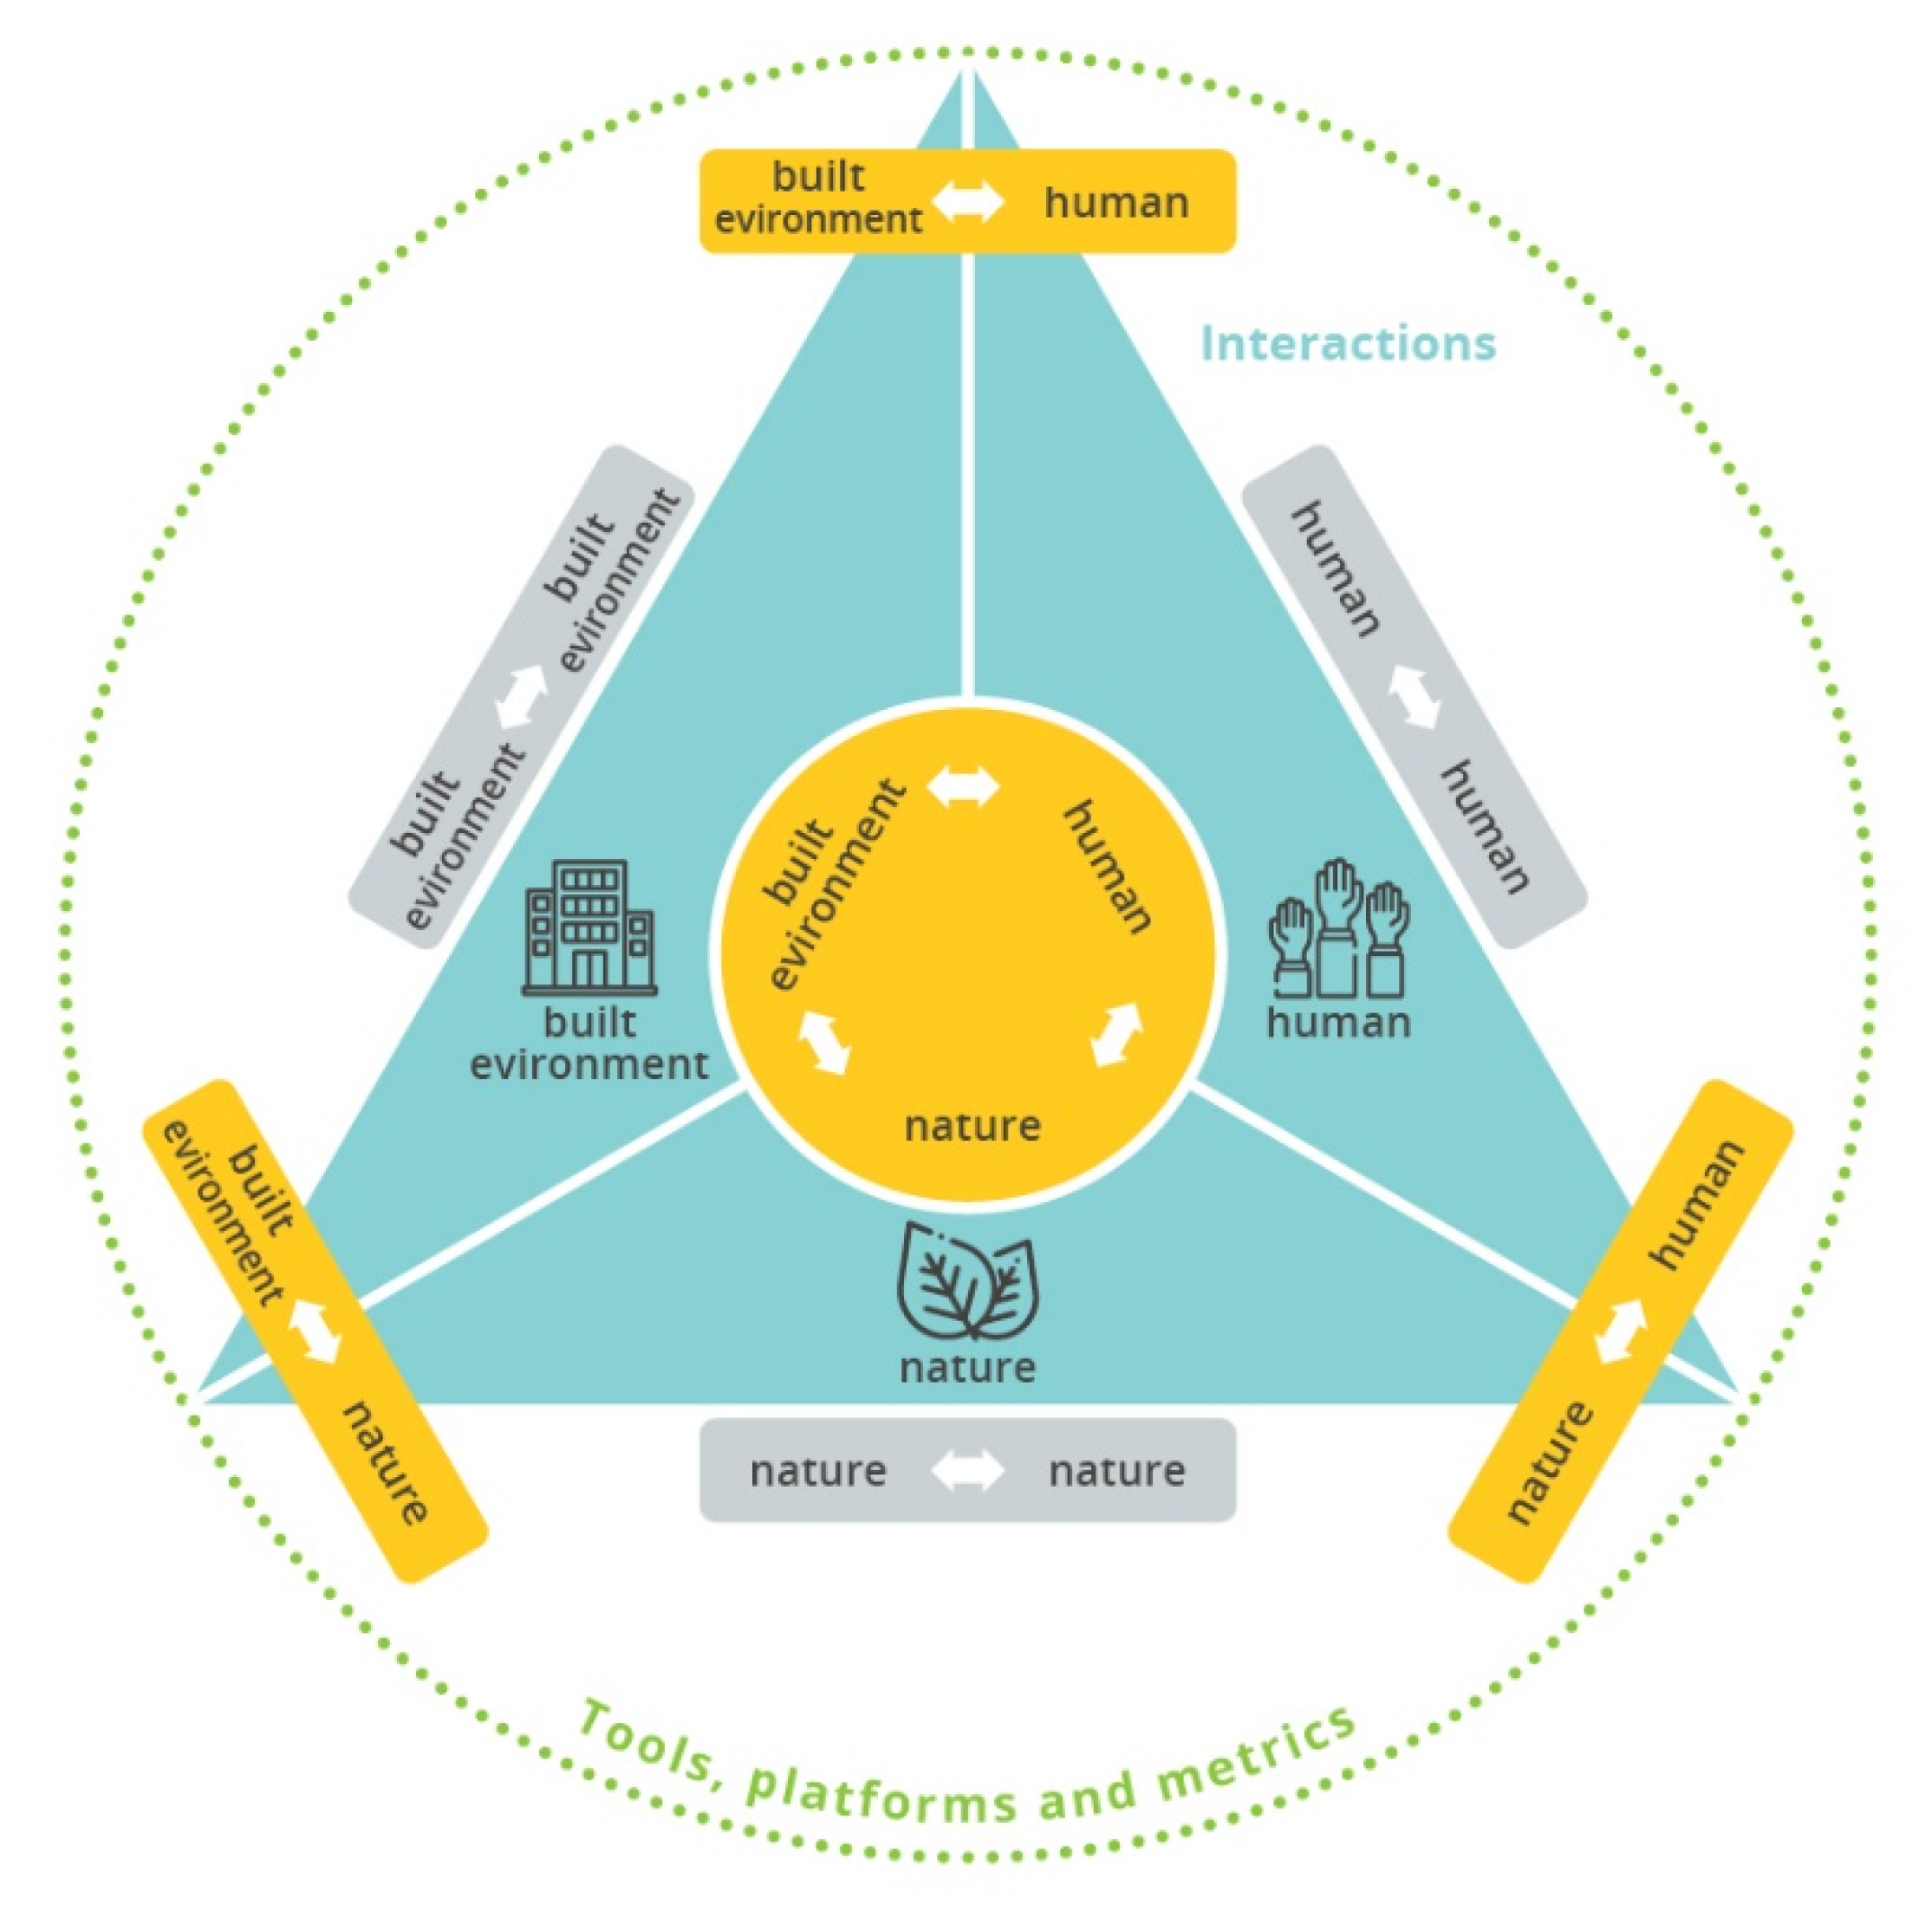
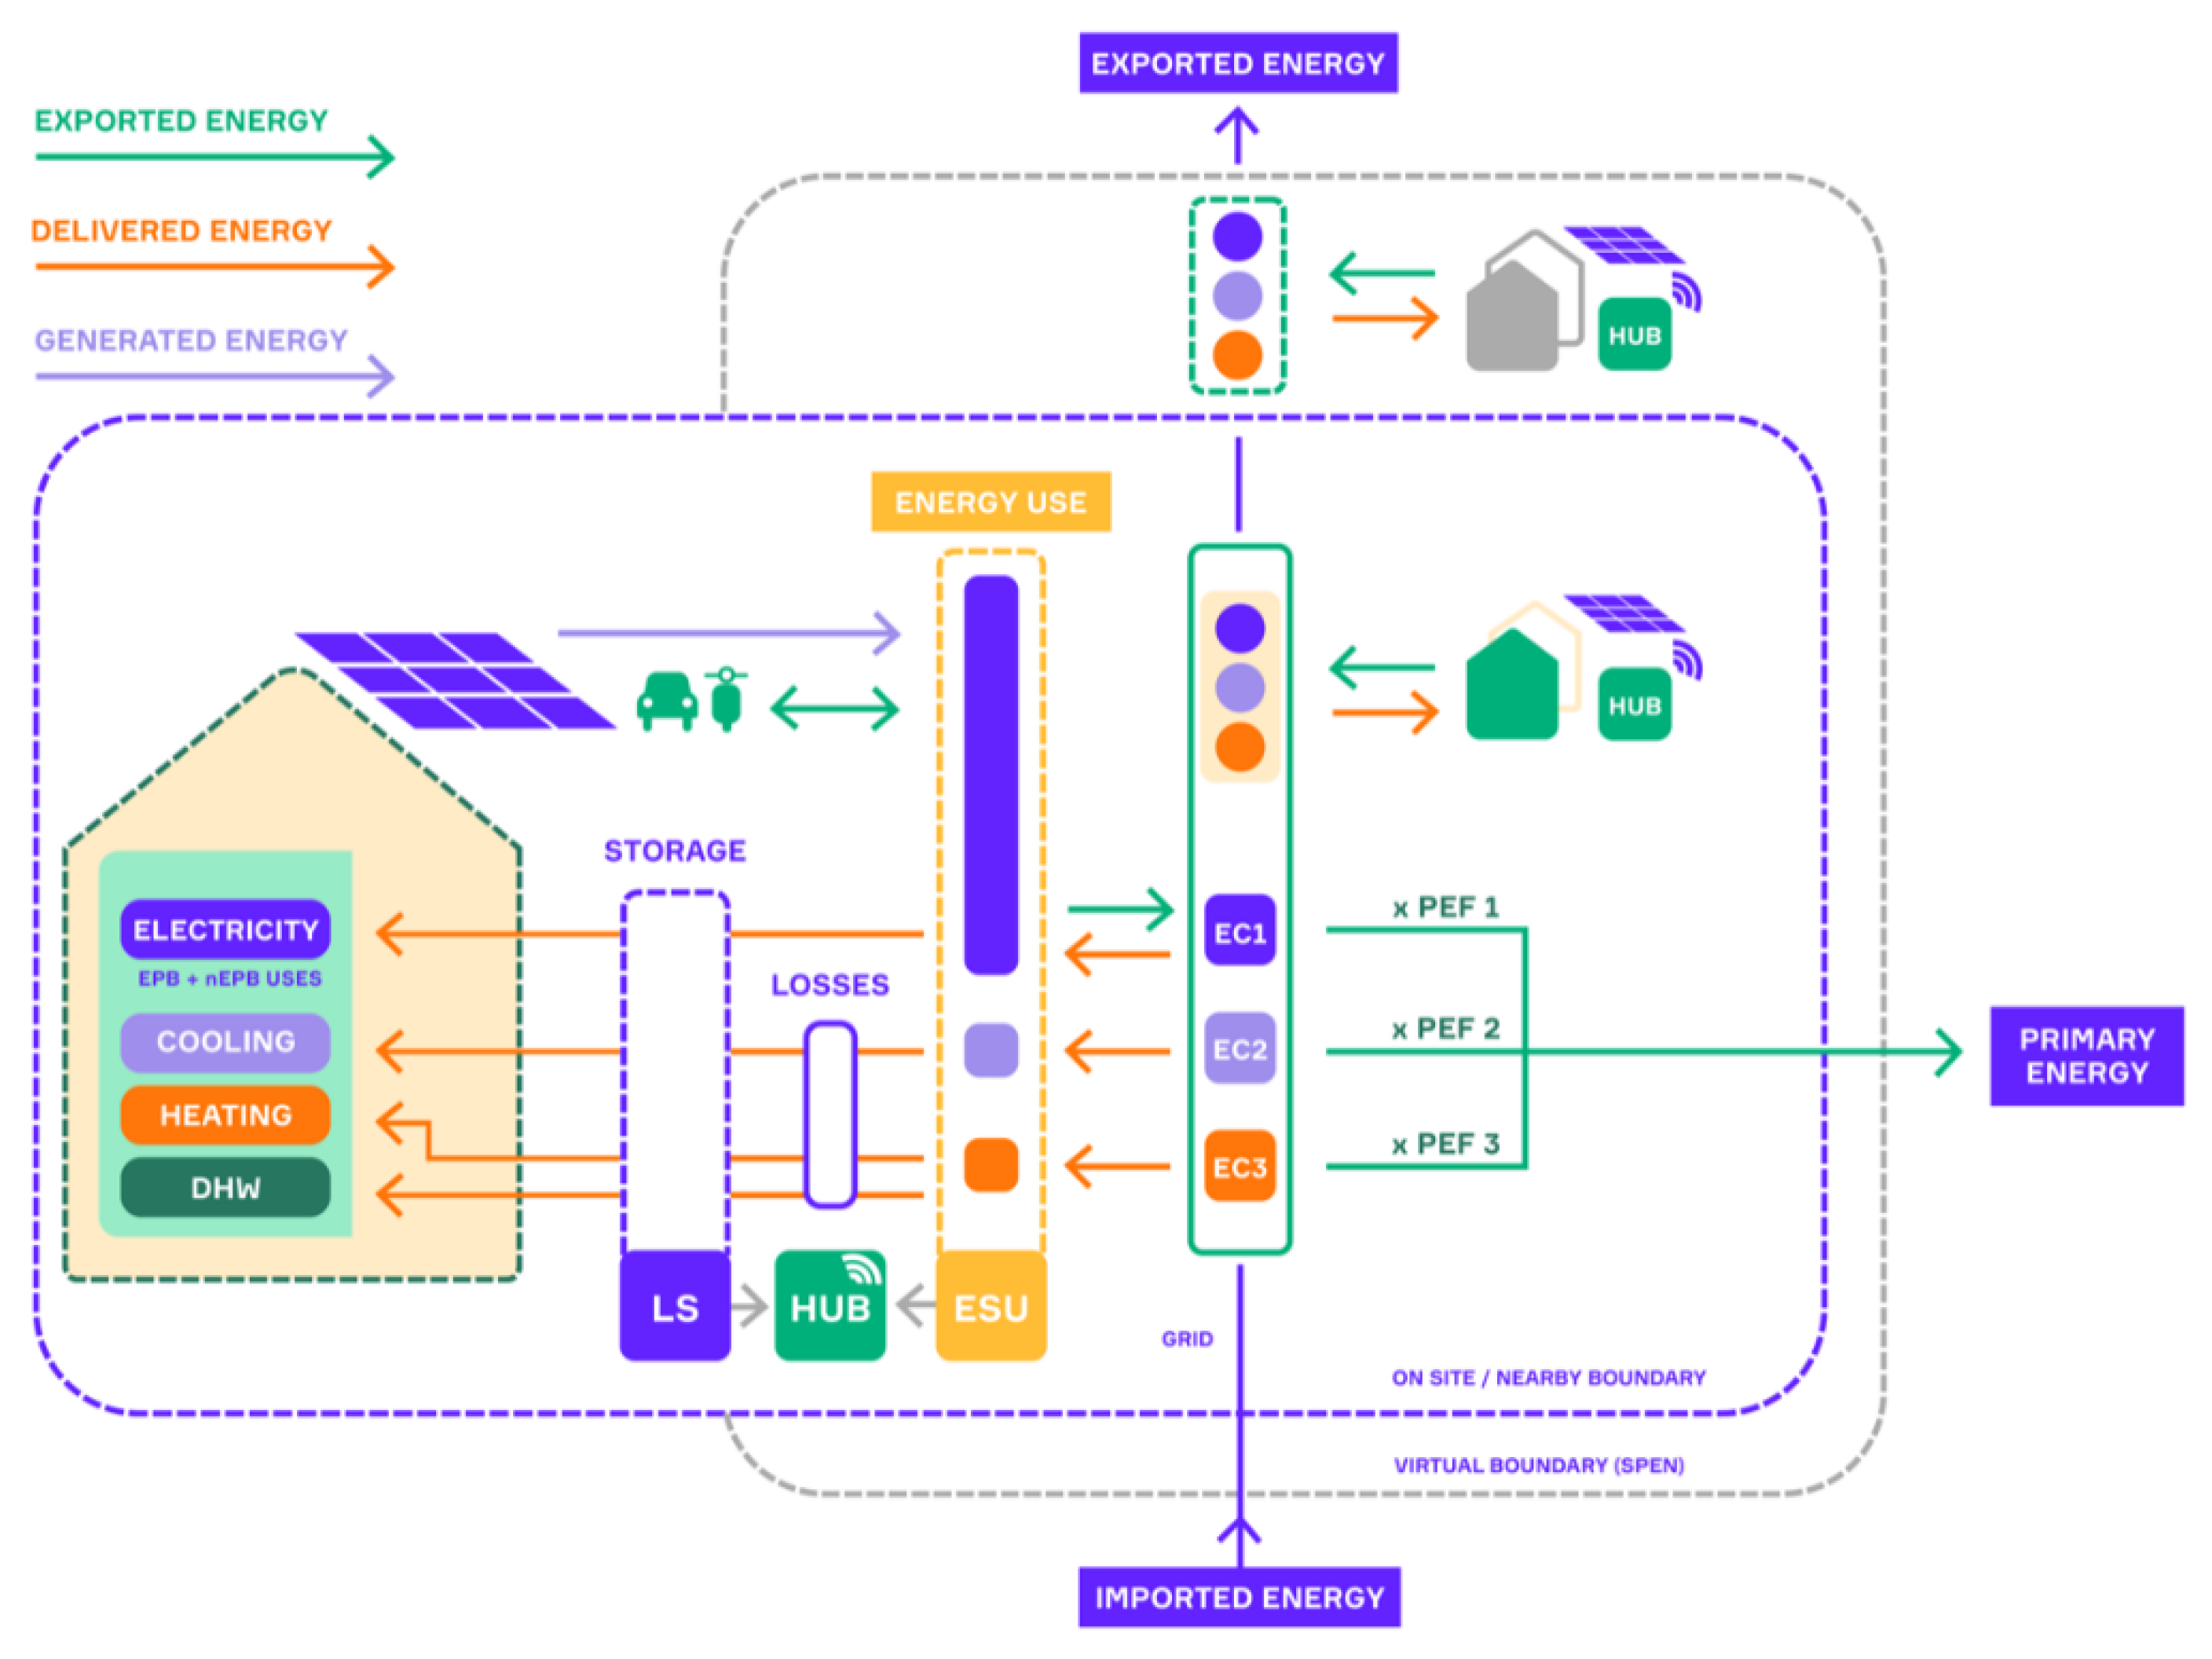
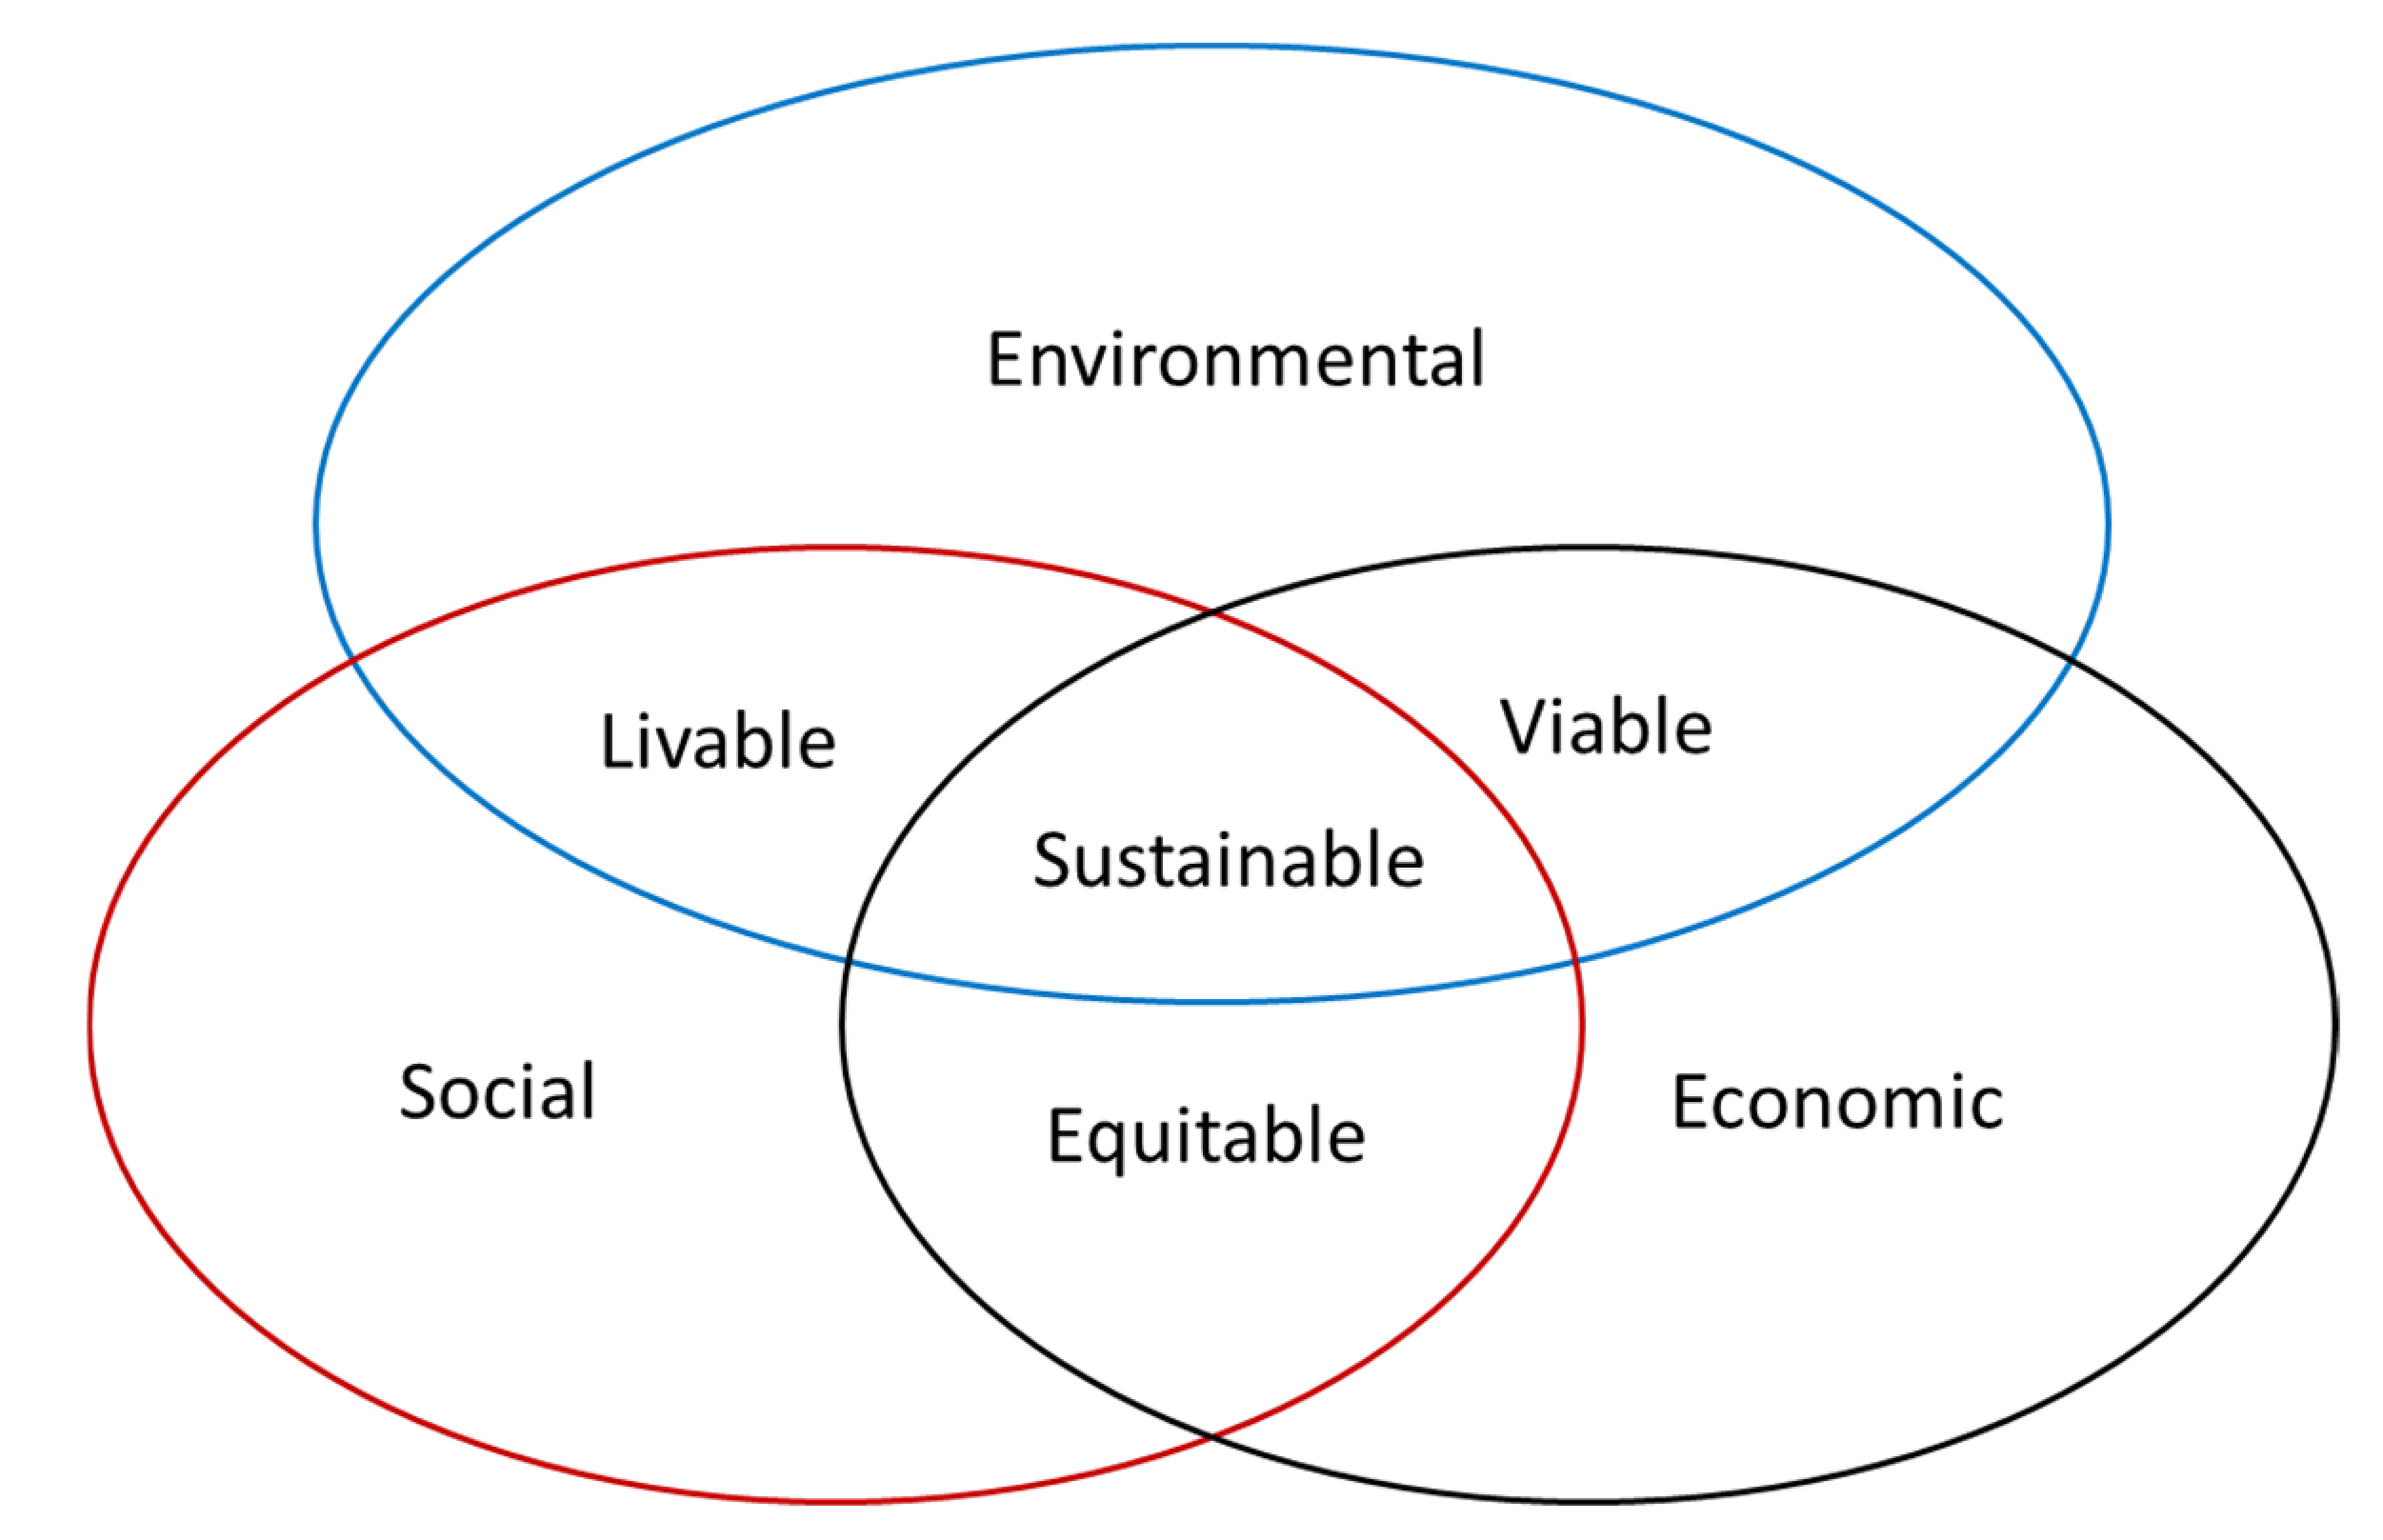
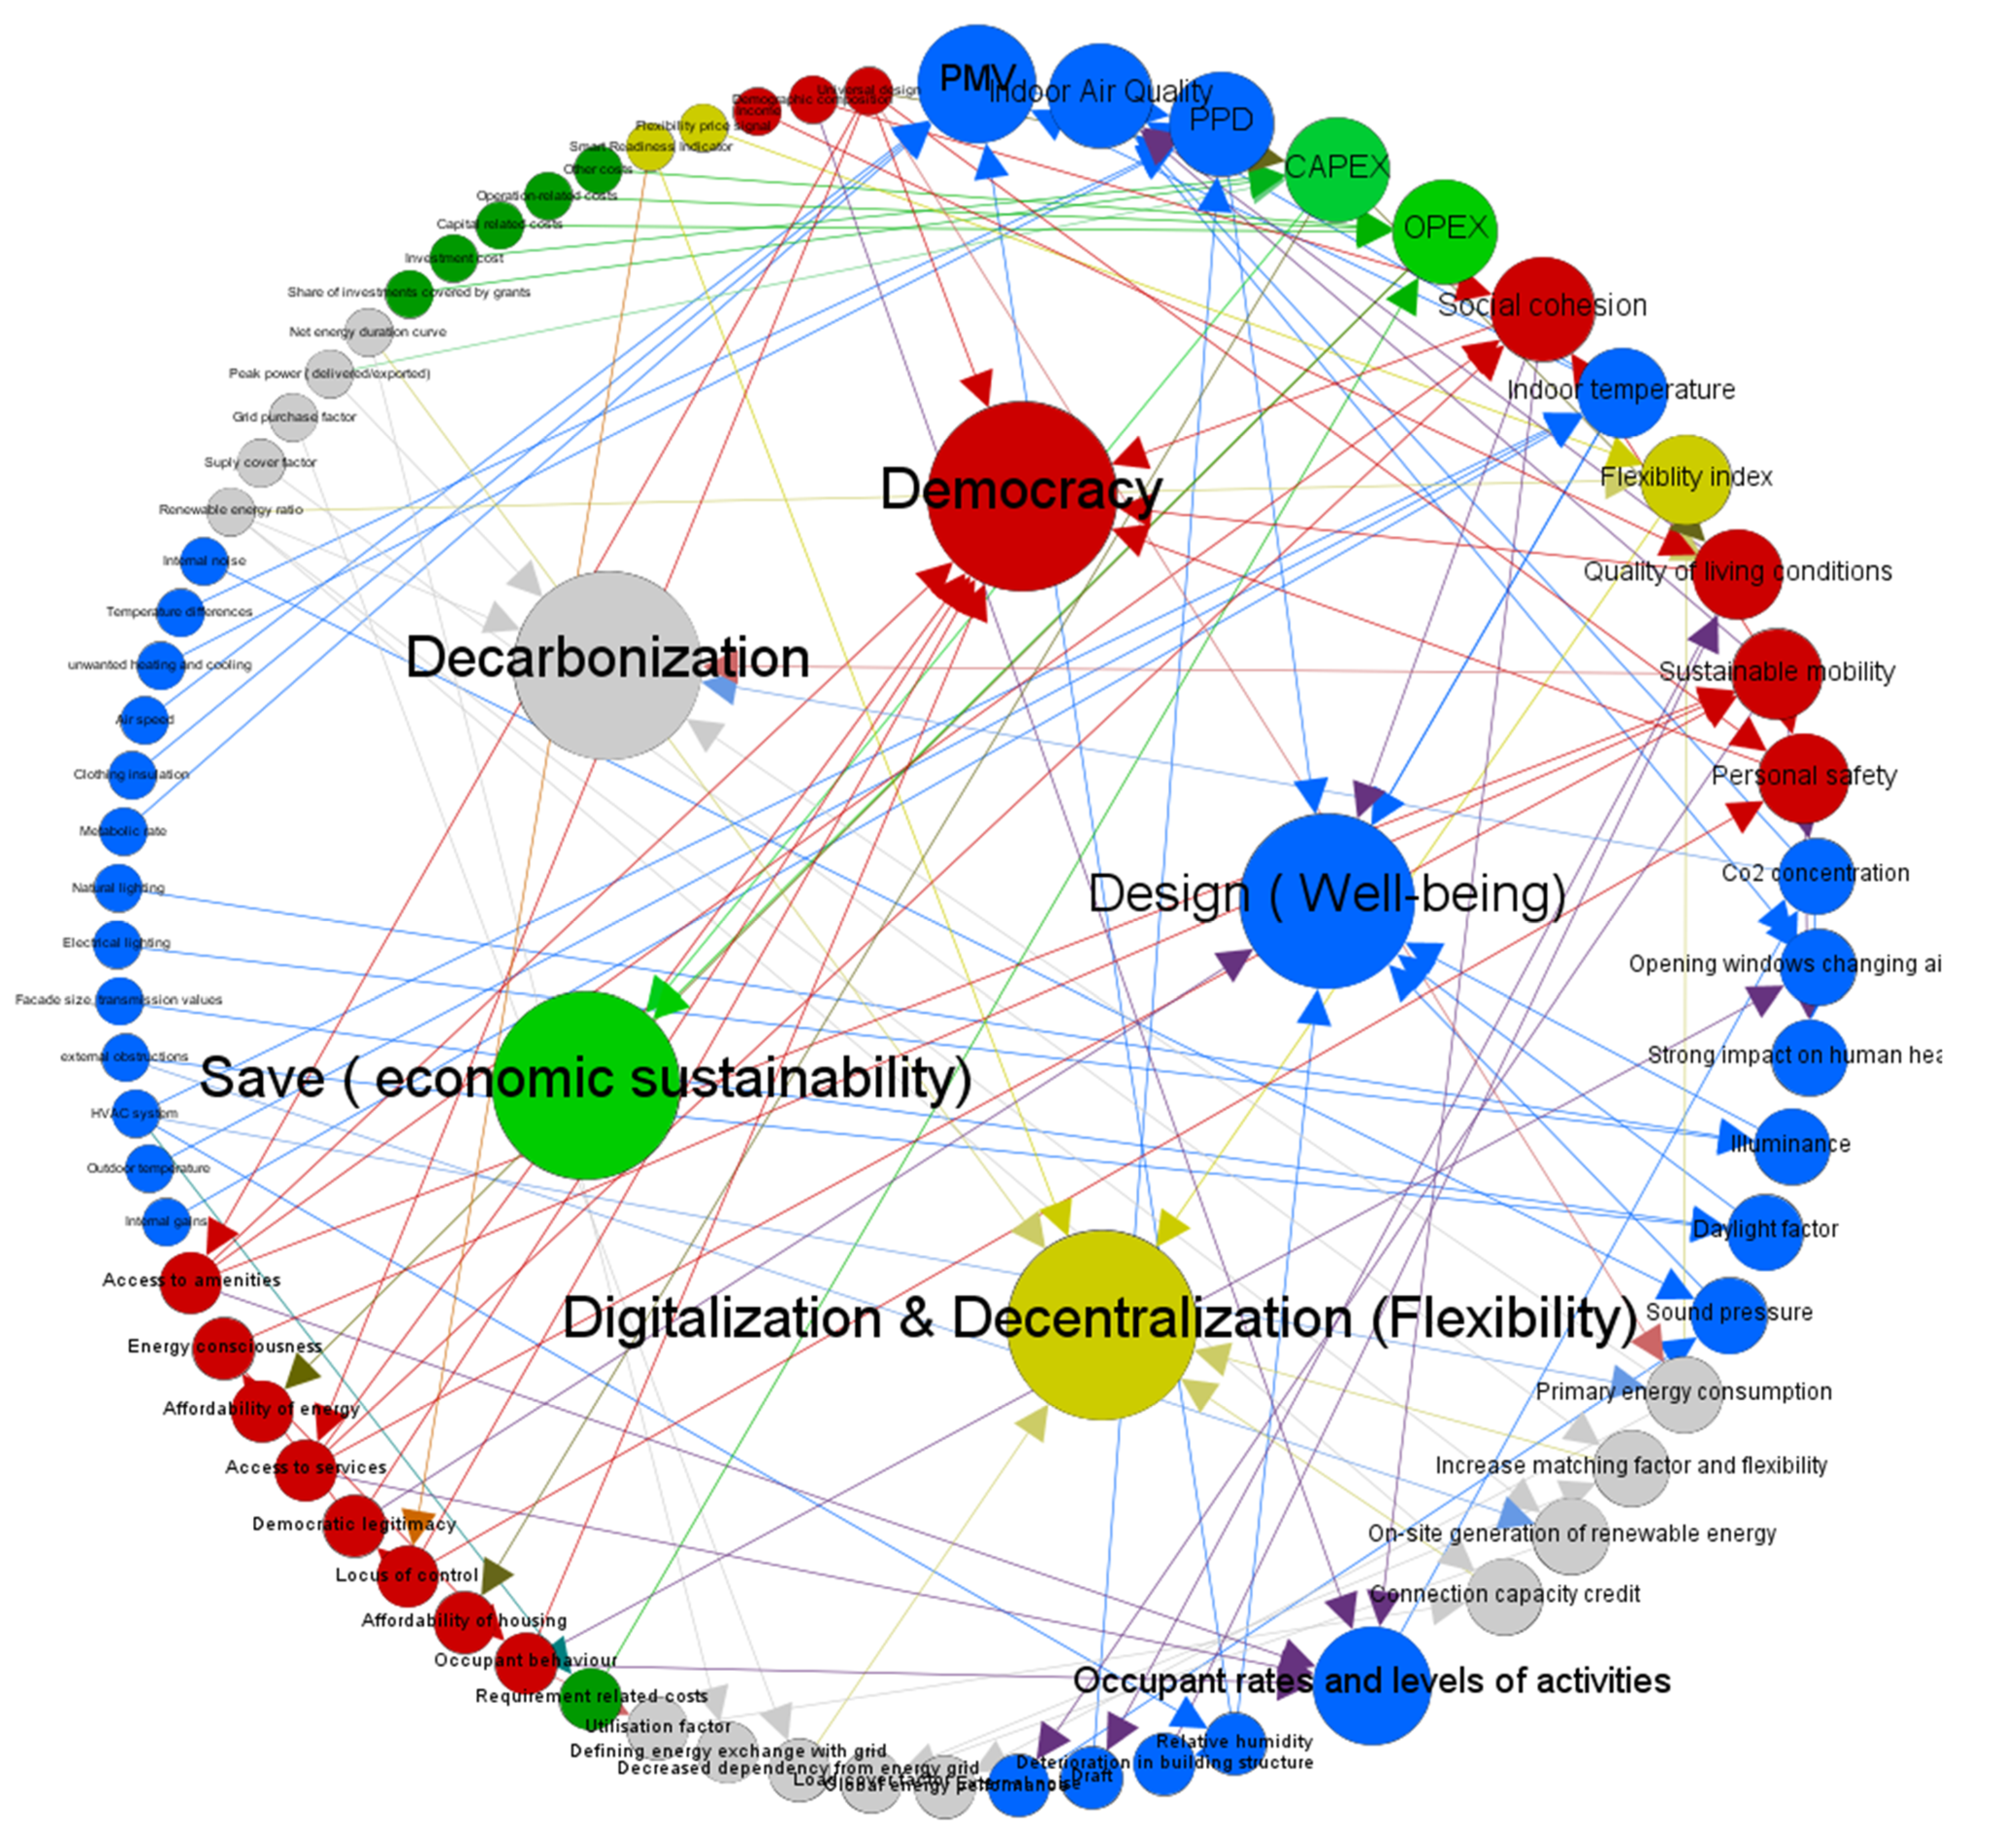
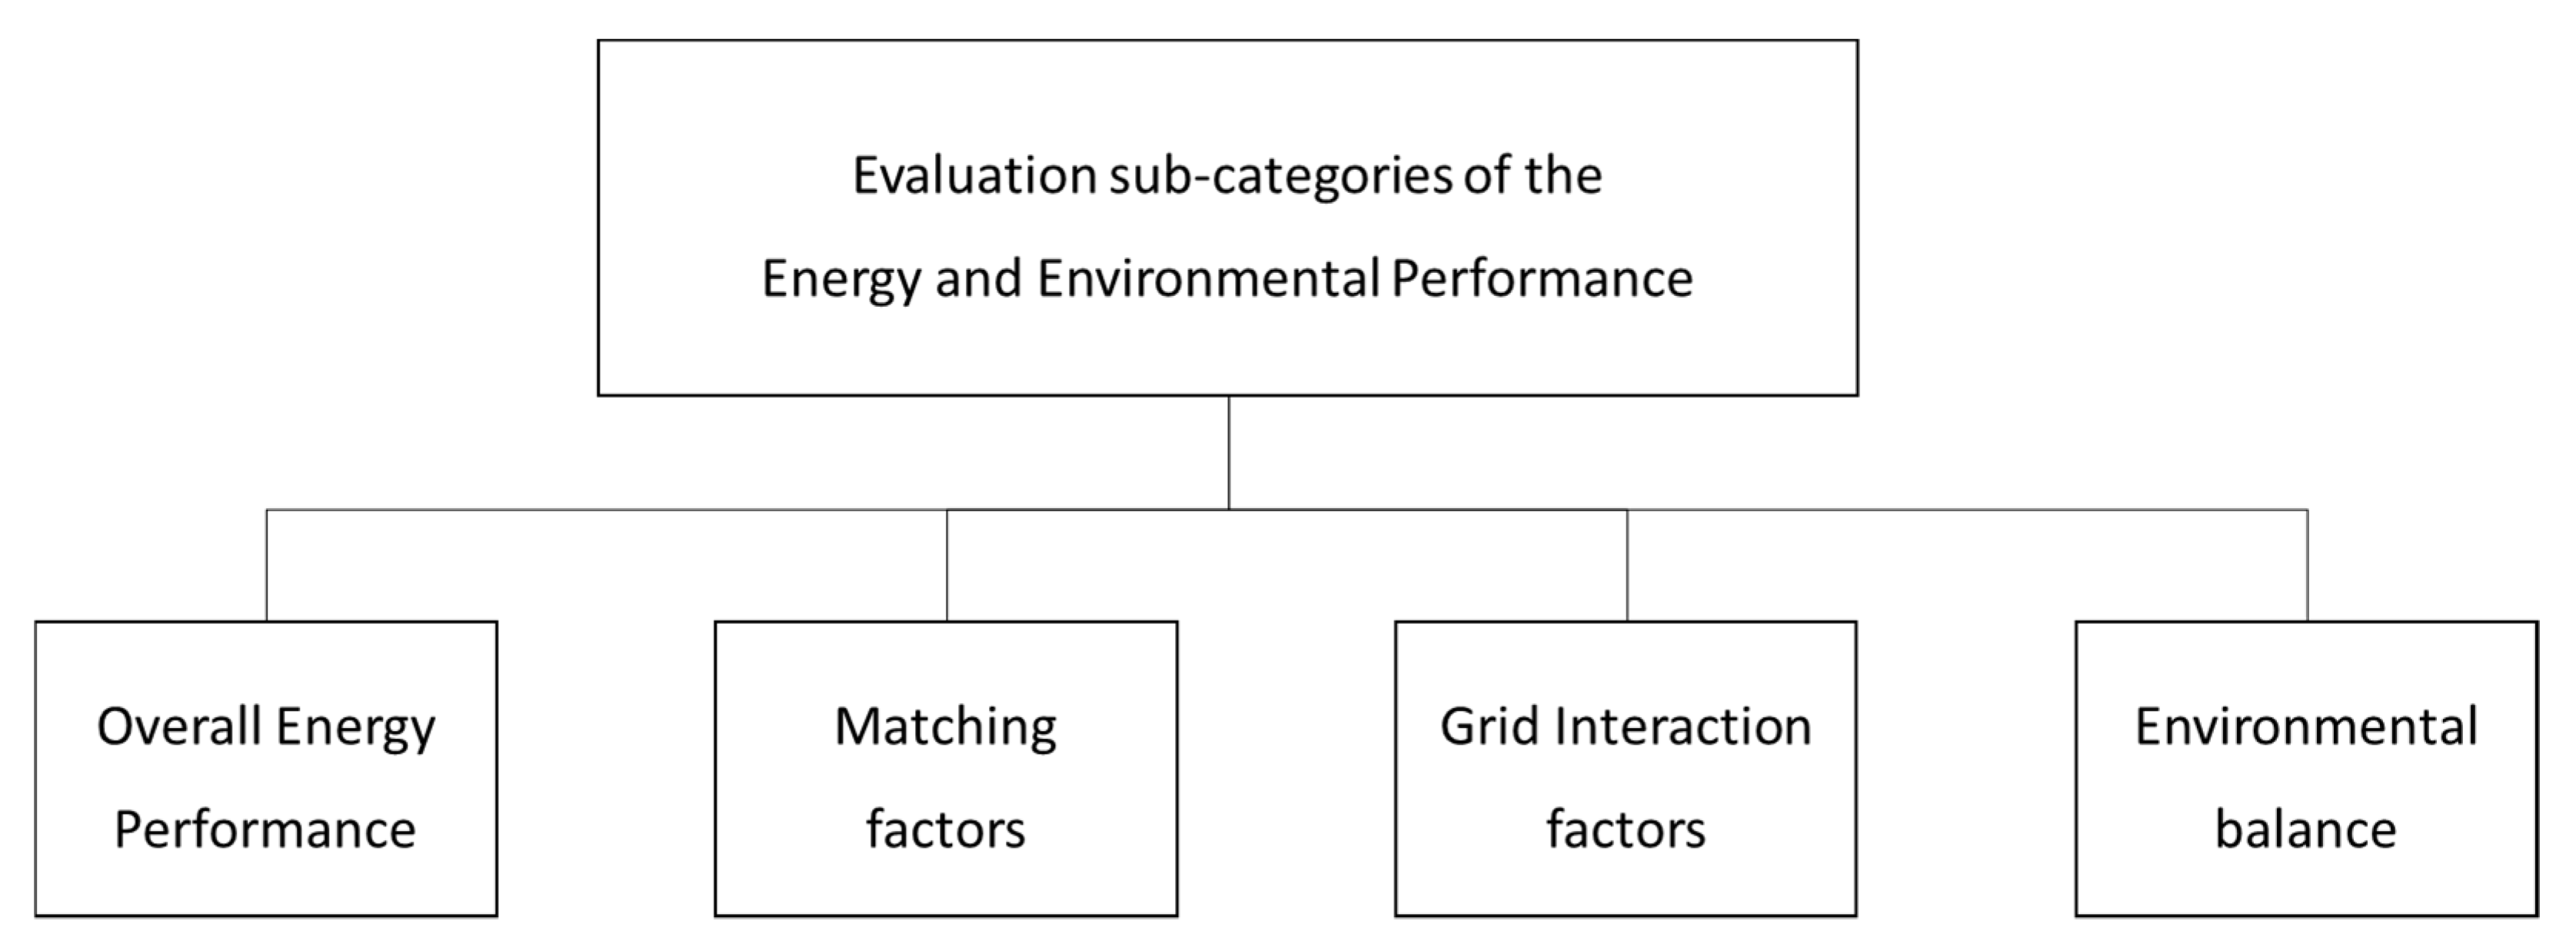

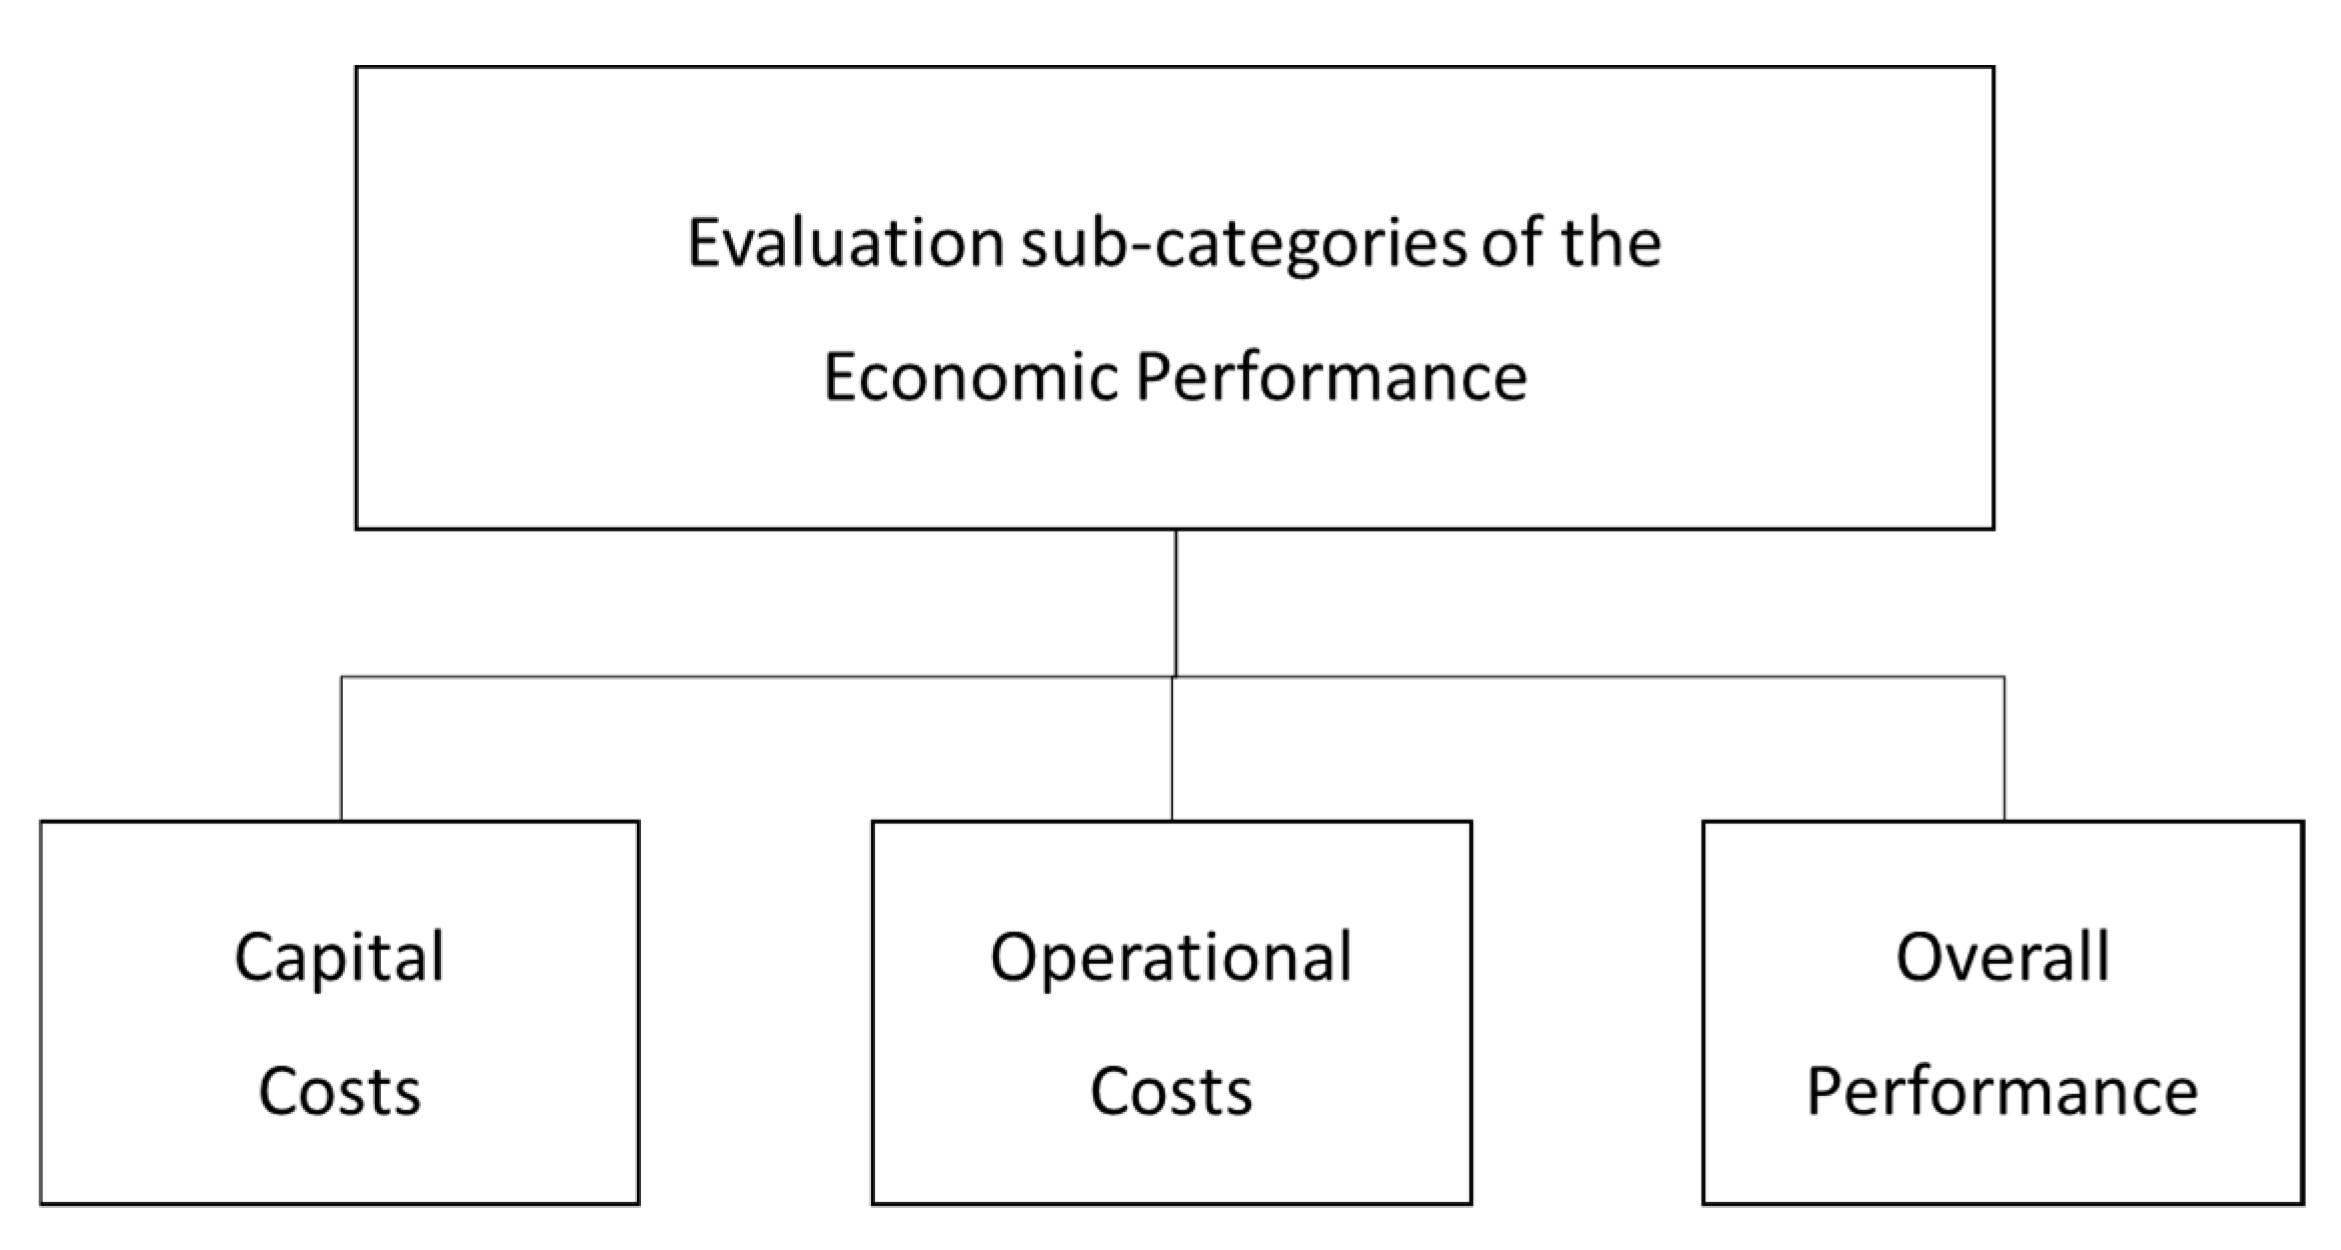
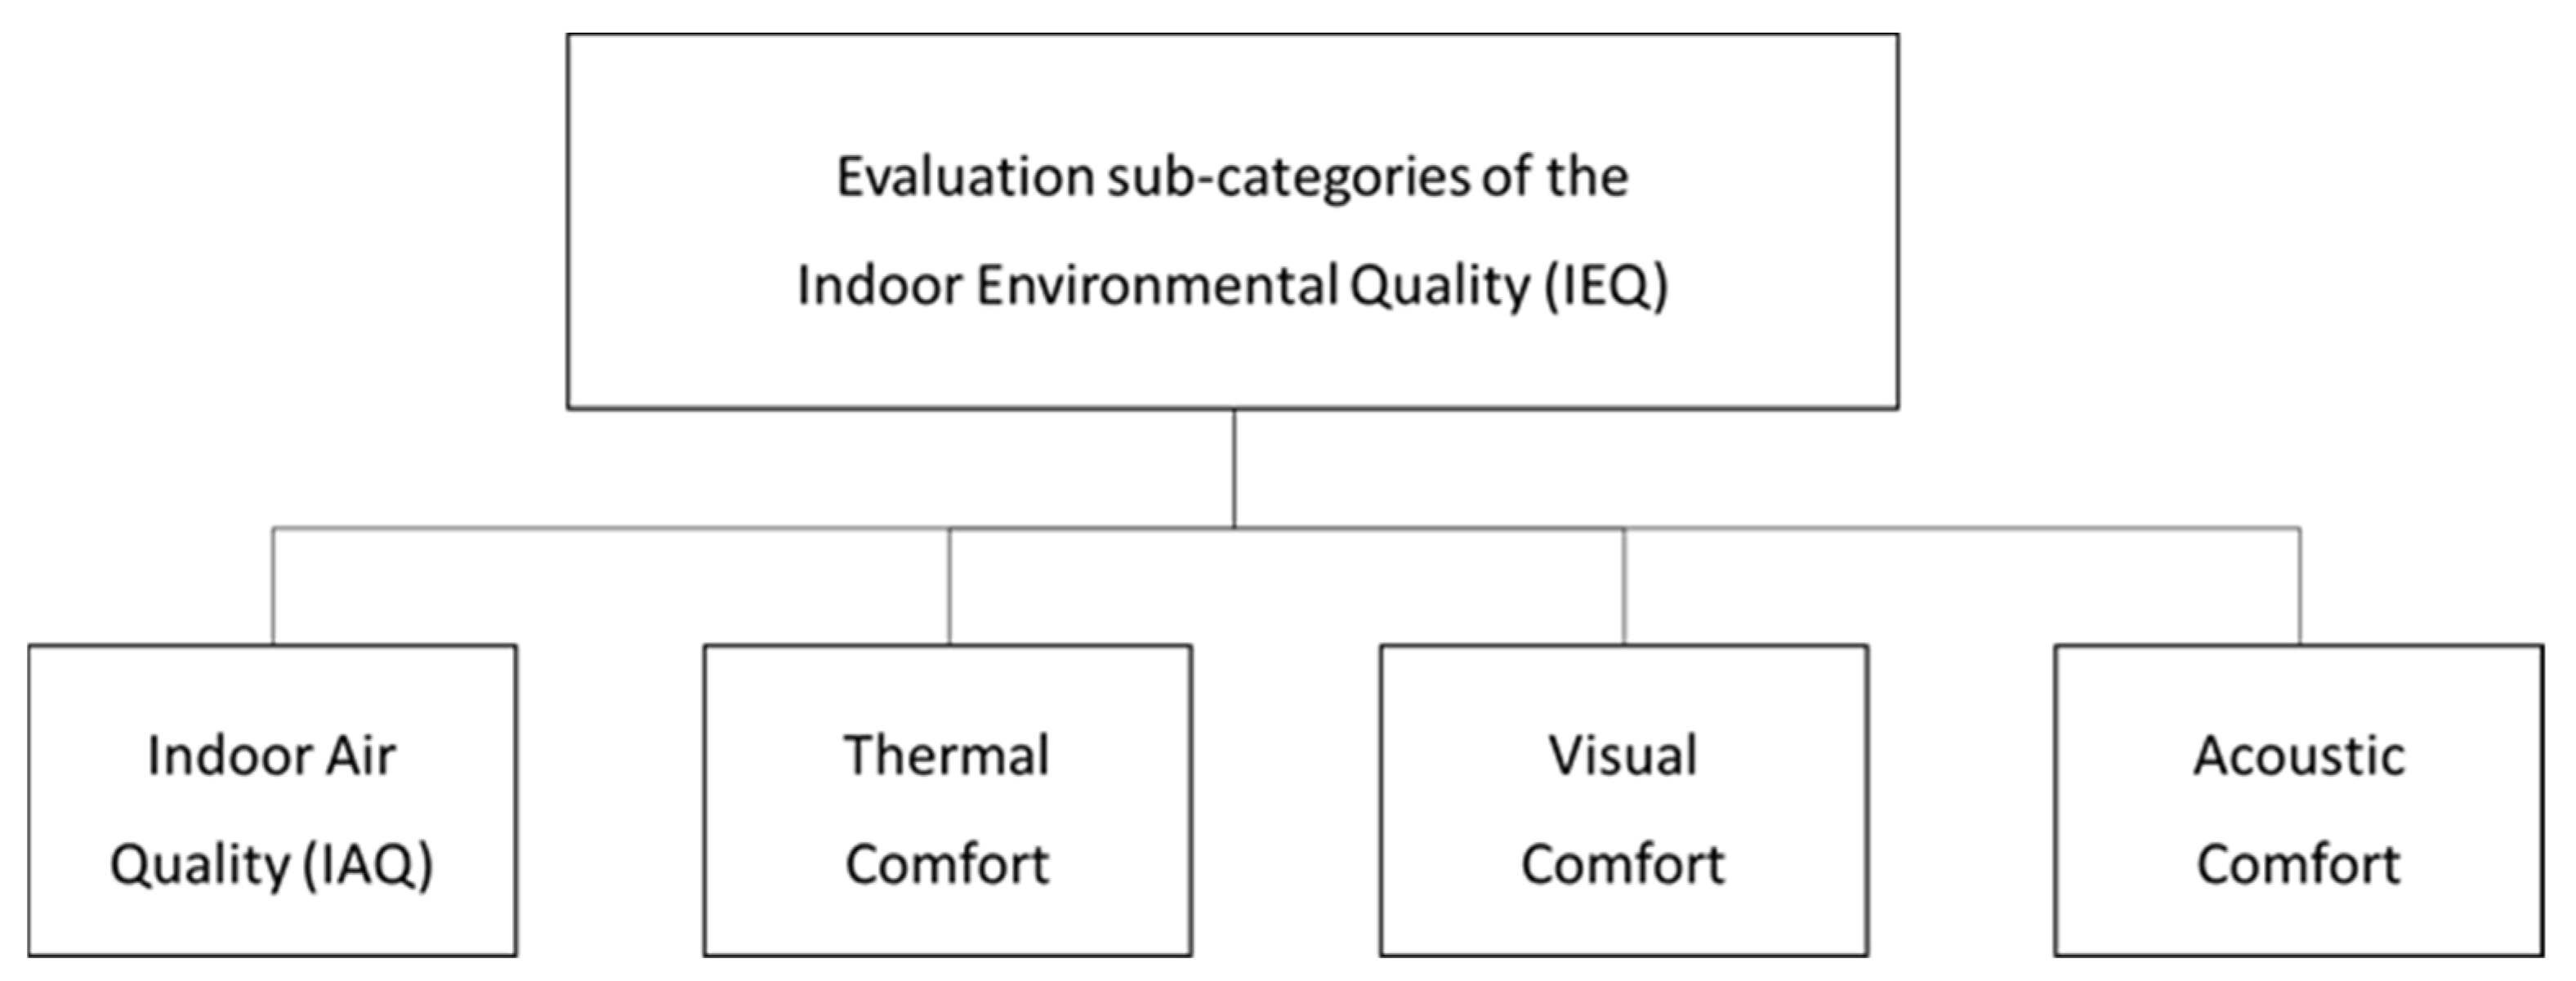
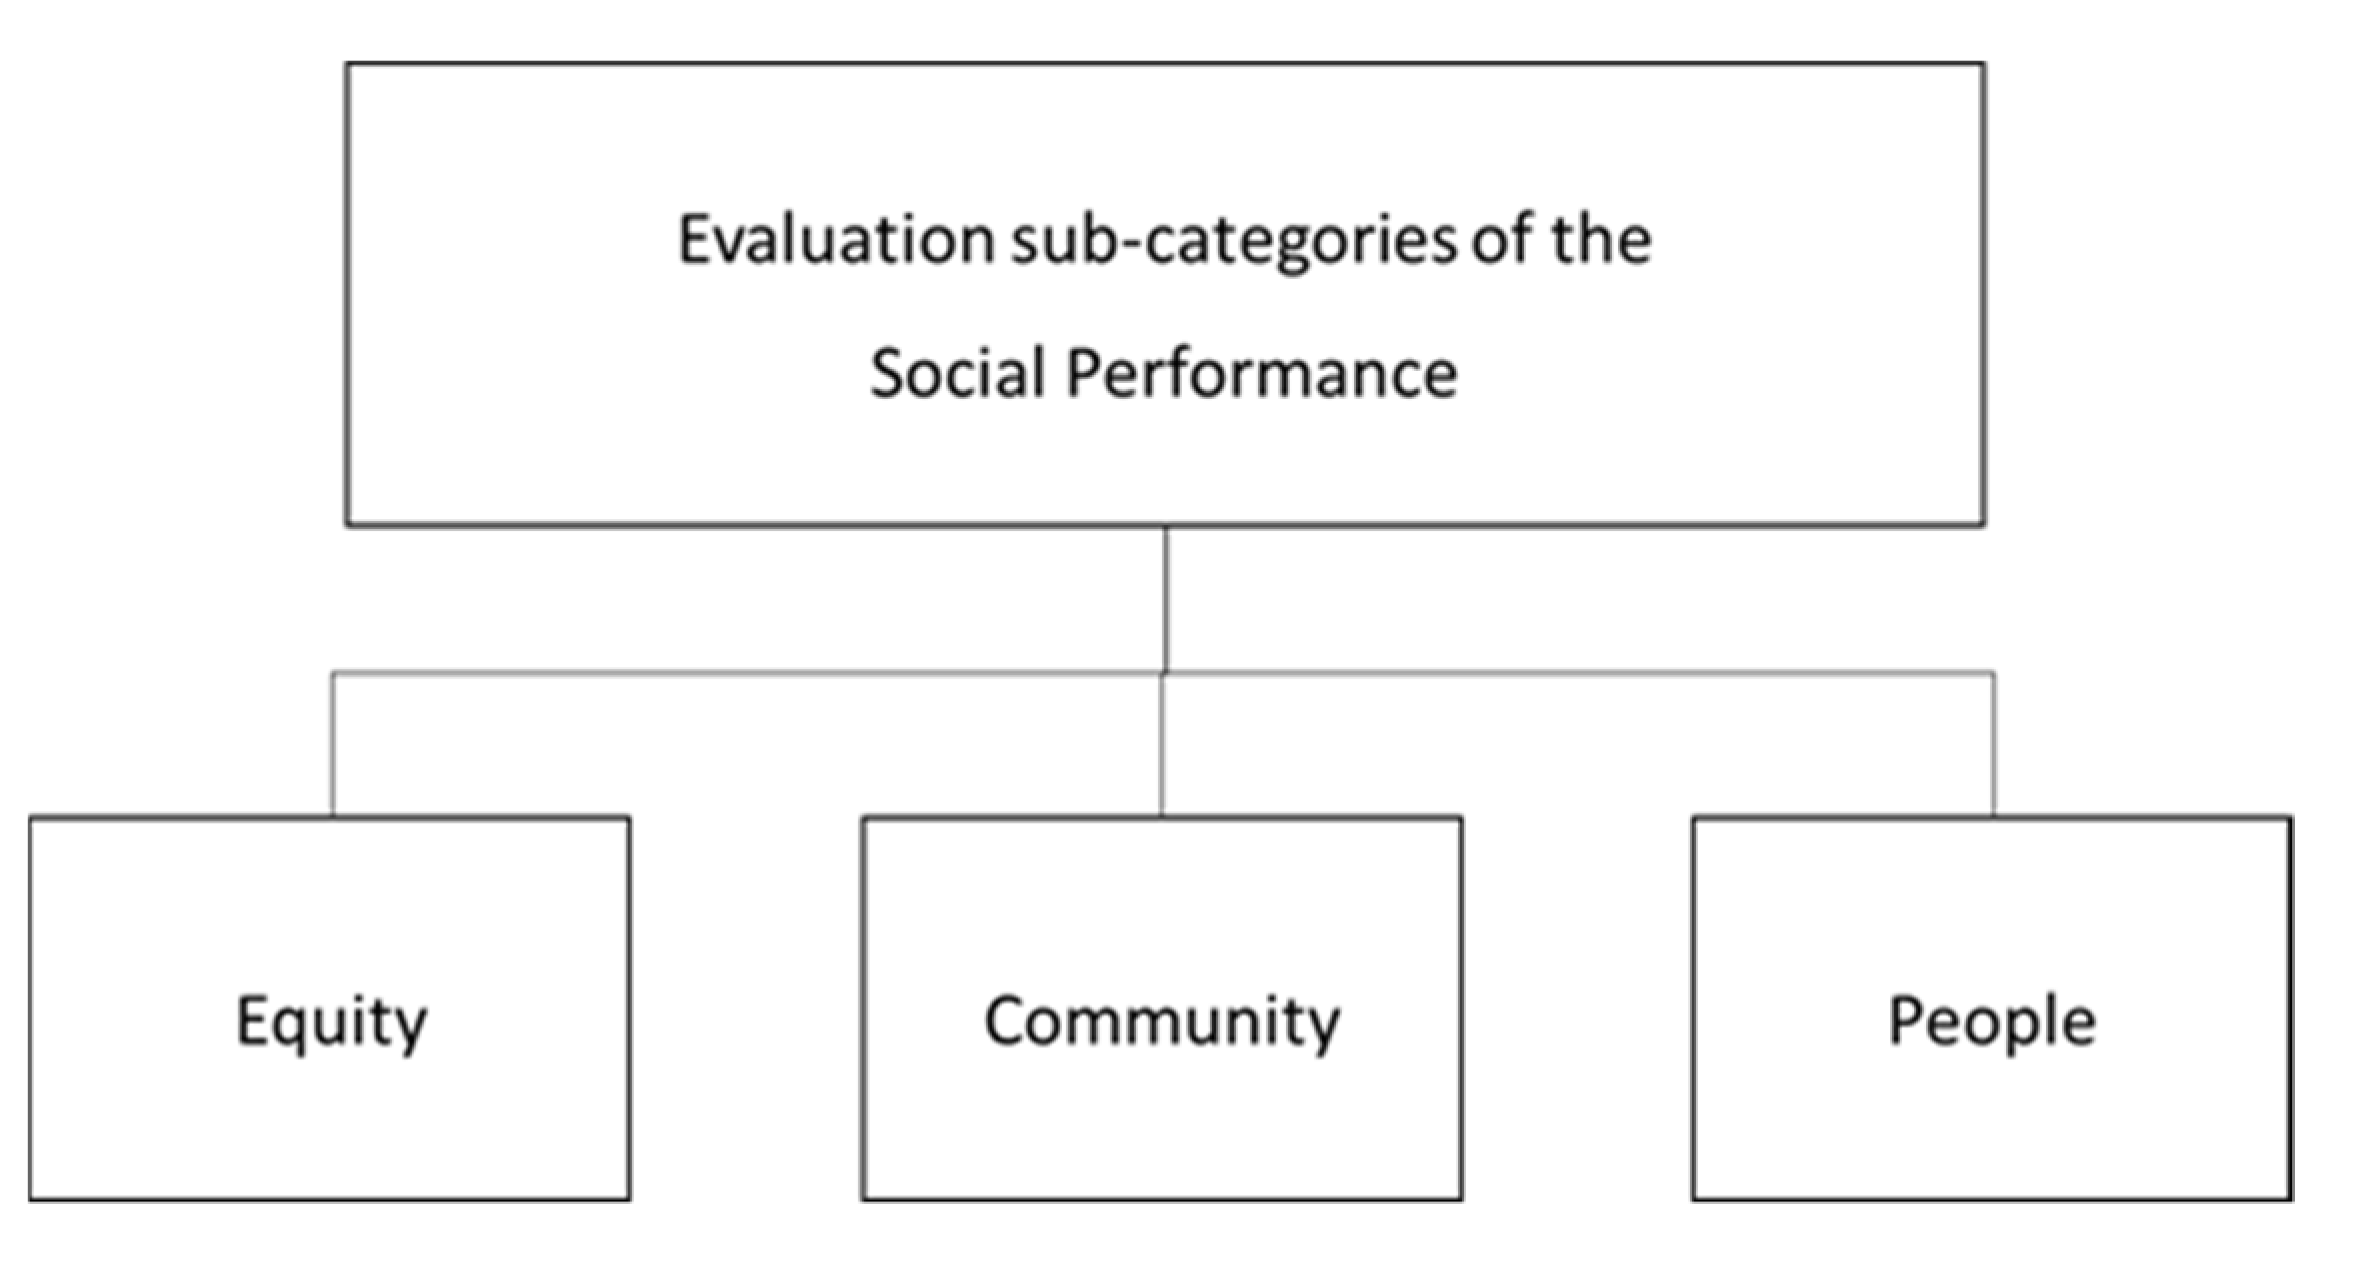
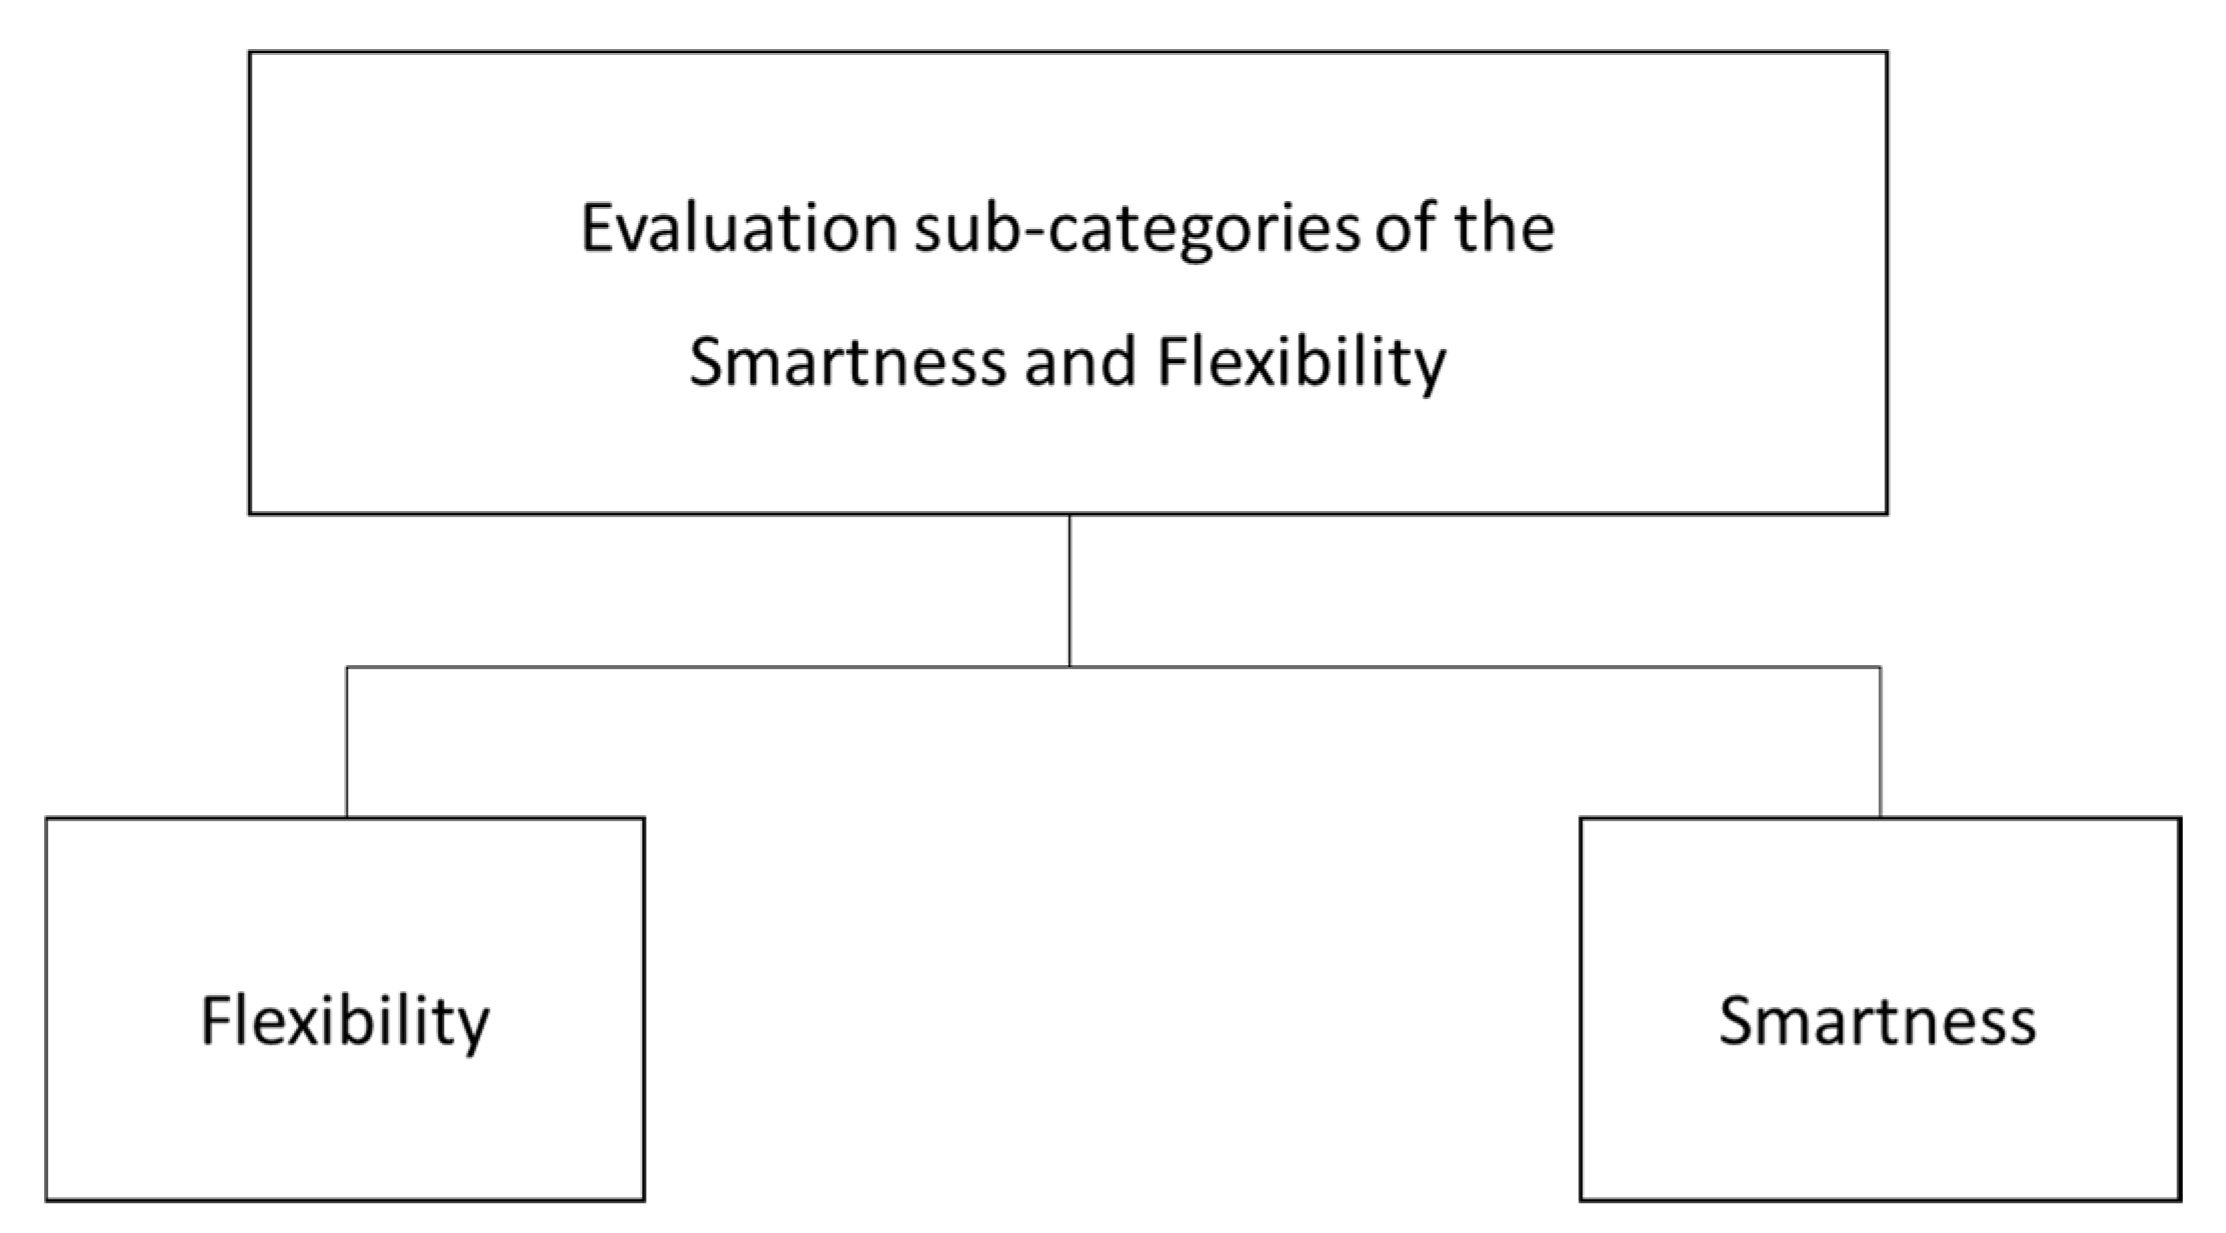
Publisher’s Note: MDPI stays neutral with regard to jurisdictional claims in published maps and institutional affiliations. |
© 2021 by the authors. Licensee MDPI, Basel, Switzerland. This article is an open access article distributed under the terms and conditions of the Creative Commons Attribution (CC BY) license (https://creativecommons.org/licenses/by/4.0/).