Article

An Original Control Strategy of Storage Systems for the Frequency Stability of Autonomous Grids with Renewable Power Generation

Engineering Department, University of Palermo, 90128 Palermo, Italy
*
Author to whom correspondence should be addressed.
Energies 2021, 14(15), 4391; https://doi.org/10.3390/en14154391
Submission received: 27 May 2021 / Revised: 6 July 2021 / Accepted: 14 July 2021 / Published: 21 July 2021
(This article belongs to the Special Issue RES-Based Generators and Electric Storage Systems)

Abstract

:
This work examines the operation of the autonomous power system of a geographical island assuming the integration of significant generation shares from renewable energy sources and the installation of the required storage systems. The frequency stability of the system is investigated considering different operating conditions, in terms of load demand and renewable power generation. The main focus of the work is an original control strategy specifically designed for power converters interfacing storage units to the grid. The proposed strategy is based on an extended frequency droop control, which selects specific droop settings depending on the operating mode—charge or discharge—of the storage unit. A simulation model of the whole electrical system is developed for dynamic analysis. The model also implements the possibility of including specific auxiliary frequency controls for synthetic inertia and primary reserve. The results of the simulation and analysis indicate that the proposed control strategy has a significant positive effect, making the storage units able to provide a fundamental and more effective support to the frequency stability of the system. The application of the proposed control strategy to storage units also reduces the need for a contribution to the frequency control from intermittent and variable sources, making the whole system more robust, stable and reliable.

1. Introduction

The increasing share of generation from renewable energy sources (RES) and the continuous integration of storage systems are rapidly changing the operation paradigm of current electrical systems. The penetration of distributed RESs in existing power grids poses several challenges for the system, the main being reversal of the power flows, an increase in the level of short-circuit currents and protection issues, balancing issues related to unpredictable production, regulatory and market aspects, inertia reduction and stability issues. In [1], the authors discuss the critical issues due to a significant annual photovoltaic (PV) penetration, including a drop of netload during the day, ramping capability and minimal load operation for thermal power plants. In [2], the hosting capacity increases potential and the associated additional grid losses due to the local control of PV plants examined. The work in [3] presents a high-level overview of the integration of RES into the electric power system in Croatia, focusing on grid connections, power balancing, inertia reduction aspects and market participation. The market impact of RES is also debated in [4], where the case of wind plants coupled with pumped hydro energy storage is examined using various optimization algorithms, and in [5], dealing with the interdependence between renewable energy and low-carbon stock prices. The study in [6] discusses the impact of RES on power system flexibility, and, similarly, the study in [7] contains a techno-economic analysis of the application of energy storage systems on wind farms to provide short-term ancillary services such as inertia response and frequency support. This continuous process of RES and storage systems integration has introduced the perspective of systems operated with a very high share of generation sources interfaced to the grid via power electronics, raising questions and challenges regarding the dynamic characteristics of the system which expand beyond the classical definitions of power system stability [8,9]. The operating conditions characterized by a high share of RES and energy storage systems (ESS) over the conventional synchronous generation can be particularly relevant in the case of small autonomous power networks such as the grids of geographical islands. In such systems, the direct availability of renewable energy sources and the simple integration of energy storage systems can push a rapid transition of the traditional nature of the electrical grid [10,11,12,13]. Systems operated with high or even total generation provided by sources interfaced through power electronics, however, require specific characteristics of design and control. In particular, the frequency stability and the response of the system to sudden power imbalances need to be specifically assessed [14]. Presently, the majority of inverter-based generation sources implement conventional vector current control, keeping the power references at the terminal and following the grid variations through a dedicated control unit typically based on a phase-locked loop (PLL). In a grid characterized by a high share of wind, solar and storage units, the power converters interfacing those sources to the grid are called to support the system in specific ways. These capabilities are particularly relevant for the case of isolated and autonomous power networks, where the amount of synchronous generation can become quickly reduced, as it is desirable for environmental reasons. For geographical and electrical islands, the impact of a high share of renewable energy sources can be a serious concern for a stable operation of the system [15,16,17,18,19].
This work examines the existing power network of Pantelleria, a small island in the Mediterranean sea. The system of the island is considered in two main energy mix conditions: the current condition, with the energy supply based on a centralized diesel power plant, and a future possible condition, characterized by the integration of RES generation and storage units, with the disconnection of unnecessary diesel generators and the corresponding environmental and economic advantages. The system condition with RES and storage units is then further detailed in four possible scenarios, which are determined by combining different operating conditions in terms of load demand and RES generation. The complete system is represented with a detailed dynamic model. The simulation model is implemented in a specific power systems analysis tool to investigate the frequency stability of the system in the different scenarios, and it includes the synchronous machines with their primary controllers, the controlled sources representing the power converters interfacing RES and storage units to the grid and the different control systems which can be applied to the power electronics. The basic representation considered in the work is commonly known as grid-following, since the control tracks the grid variations through a dedicated synchronization unit. The possibility of activating auxiliary frequency controls inside the active power loop of the converters’ control is also included in the mathematical model. These auxiliary controls are the synthetic inertia and the fast frequency response, responsible for the provision of specific frequency services to the grid as inertial response and primary reserve, respectively. These two auxiliary frequency controls are control schemes for grid-following converters widely presented in the literature.
The novelty of the work is an original control strategy for the converters of the storage units, designed by the authors and implemented in the simulation model of the system. The proposed control strategy is basically focused on the use of different frequency droops for the storage units if they operate in charging or in discharging mode. For example, if a storage system is absorbing power from the grid, the value of the droop can be much higher than the droop used when the storage is in discharge mode: in fact, at the occurrence of a loss of generation, the storage unit in discharge mode could react much more effectively, and this reaction can be ordered by a proper value of the frequency droop gain included in the control system of the converter. The same approach can be symmetrically applied for storage units in charge mode in the case of loss of load. The proposed strategy is therefore based on an extended frequency droop approach, configuring distinct droop settings for the converter control system depending on the given operating mode—charge or discharge—of the storage unit. With this novel control strategy, the storage units will be able to participate in the frequency control of the system more effectively and guarantee the stability of the system. The enhanced contribution of the storage systems achieved through the application of the proposed strategy also significantly reduces the need for relying on intermittent and variable sources such as RES generation in the transient process of maintaining the frequency stability of the system. The implementation of the proposed control strategy is illustrated in detail, observing the possible limitations related to the overall aspects of the power converters’ control. A tuning principle for the different values of the frequency droop involved in the proposed control strategy is also described and applied. The realization of the novel droop control strategy for storage units is compared to the case when only regular frequency controls are considered. The comparison is performed for different simulation scenarios, identified by an initial analysis of load and generation in the electrical grid of the island for different periods of the year.
The rest of the paper is divided as follows: Section 2 provides a description of the autonomous electrical grid of the islands under investigation, deriving four scenarios representative of the main operating conditions of the system in terms of load demand and RES generation; Section 3 describes the details of the mathematical representation of the overall electrical system under examination and the implementation of a proper simulation model, focusing in particular on the power electronics interfacing the generation sources to the grid and their control system; the novel droop control strategy for the storage units is proposed and discussed in Section 4, pointing out the opportunity of the specific extended control on storage units for a stable operation of the system; Section 5 reports results and analysis of the time-domain simulations of the different operating scenarios, indicating the fundamental role of supplementary controls on the storage units and the possibility of a coordinated management of the operating mode of the storage units to guarantee the stable operation of the system; finally, Section 7 summarizes the main observations and results of the work.

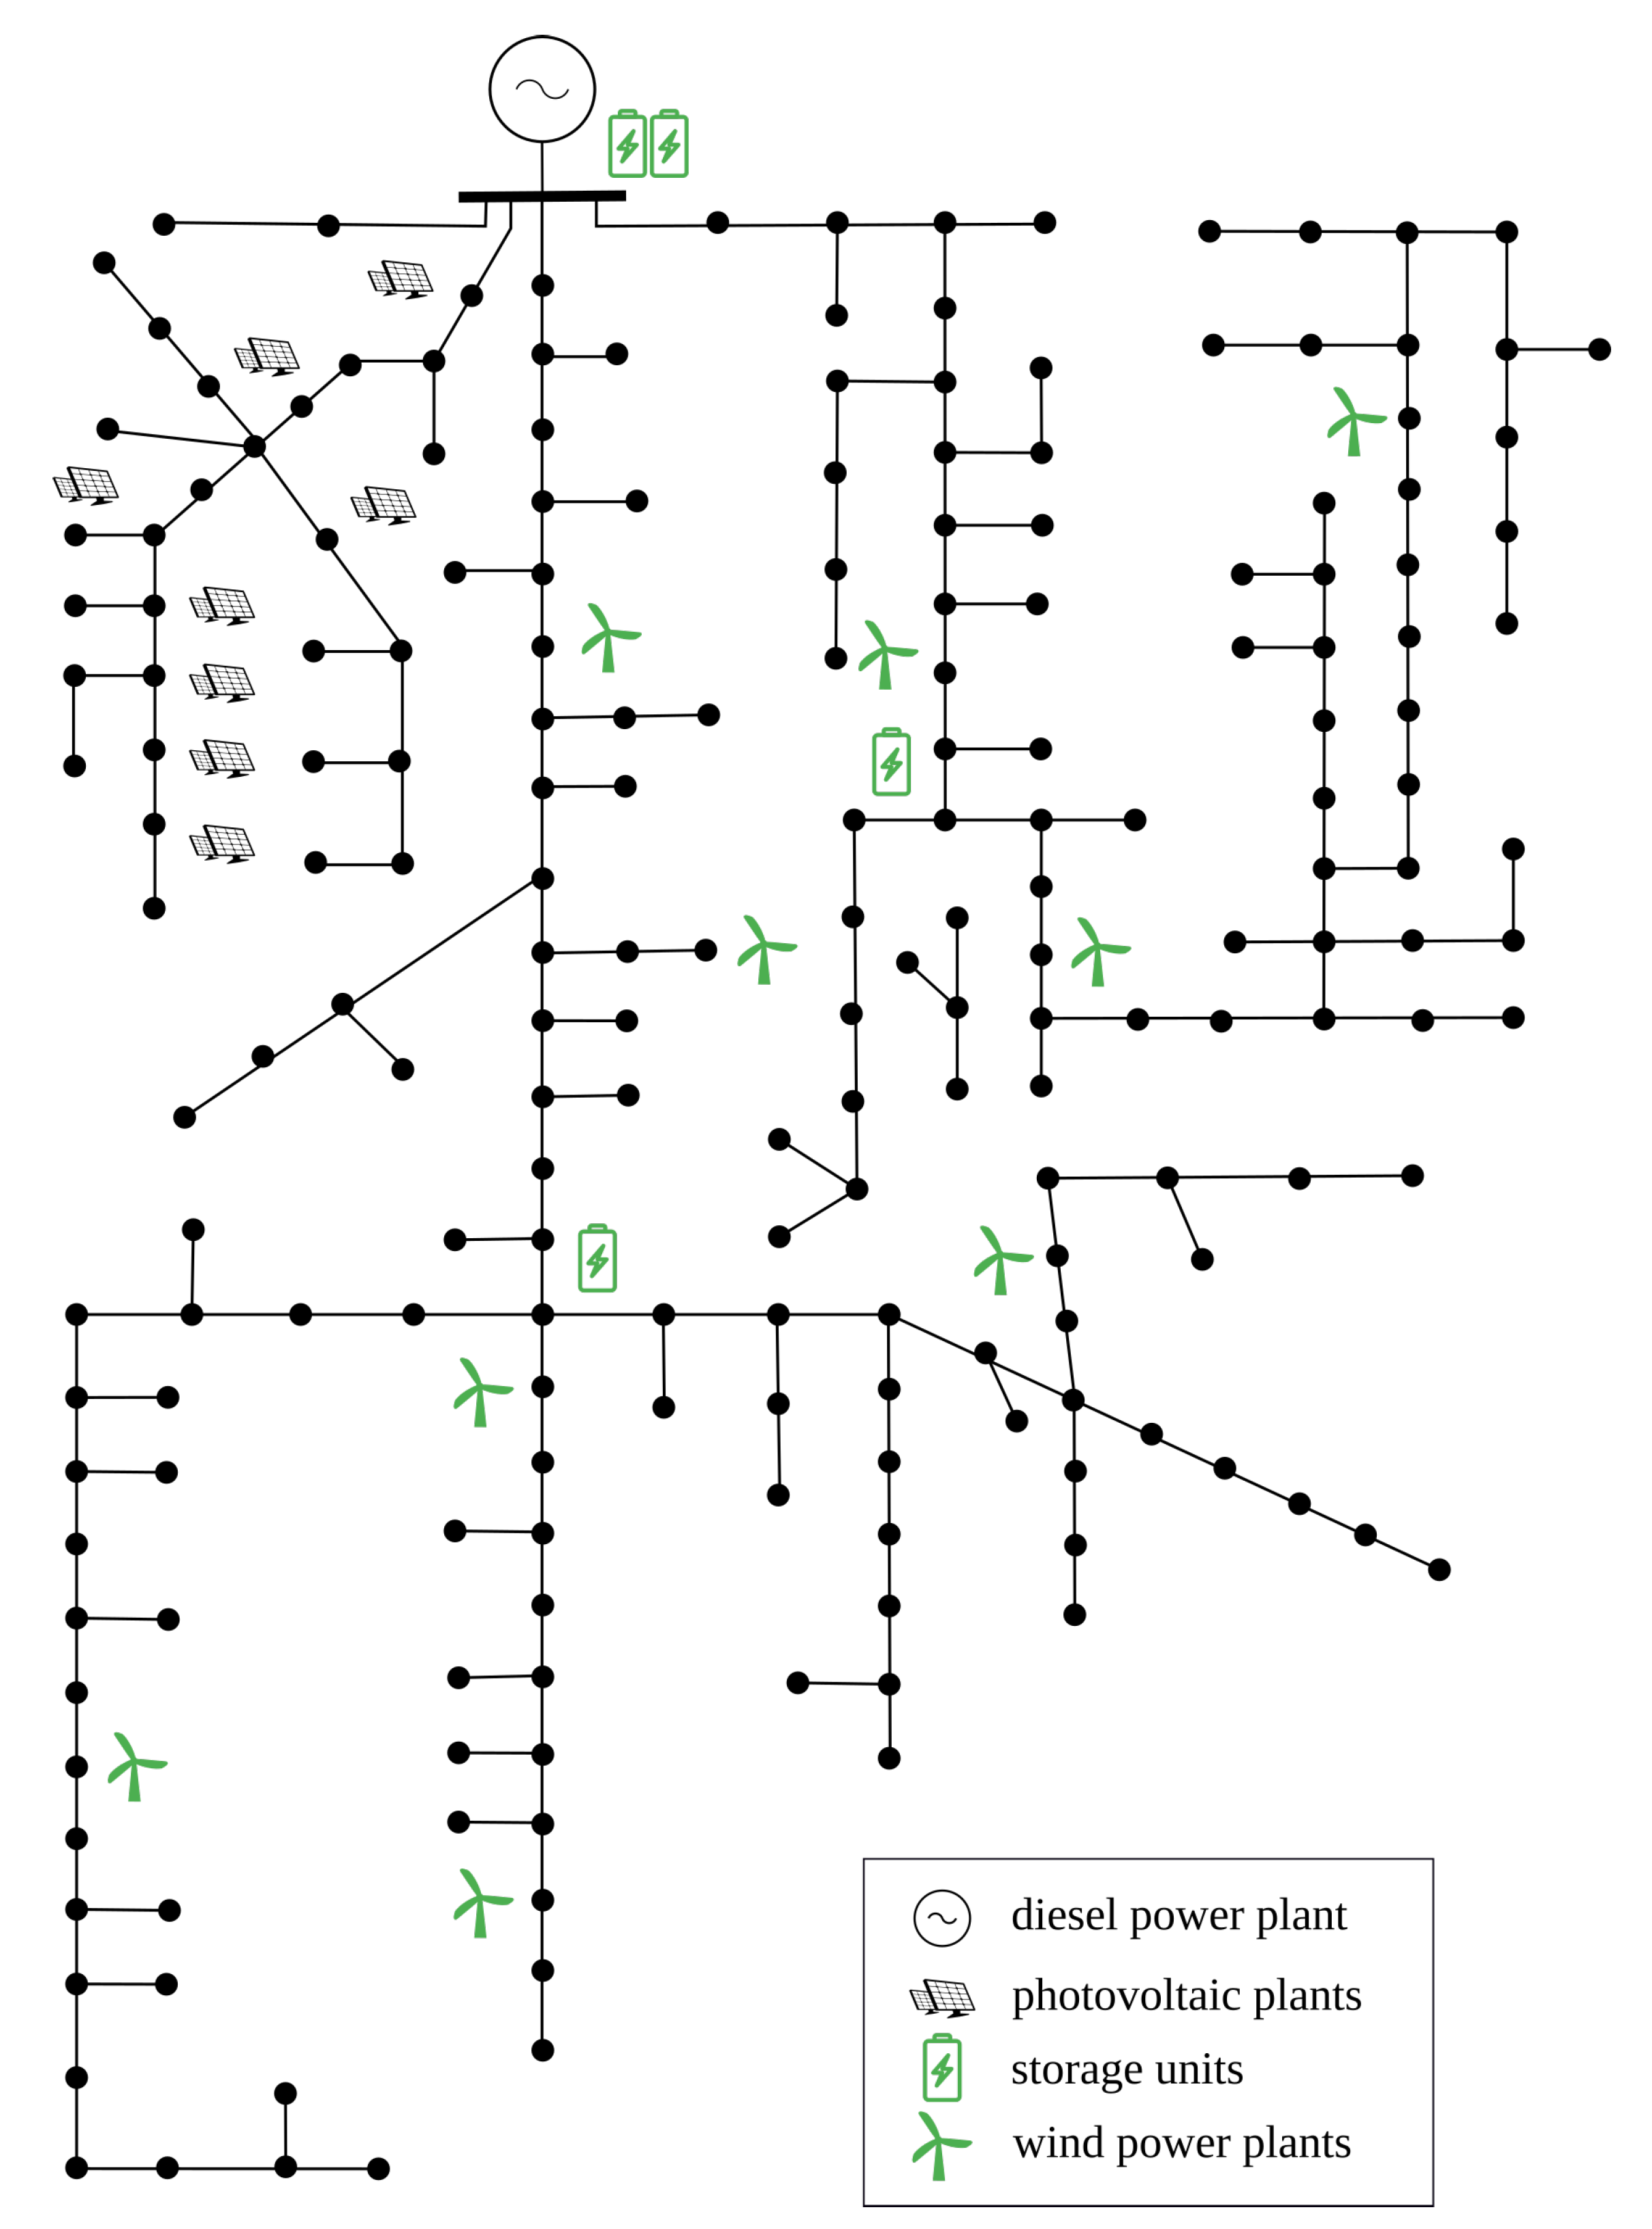
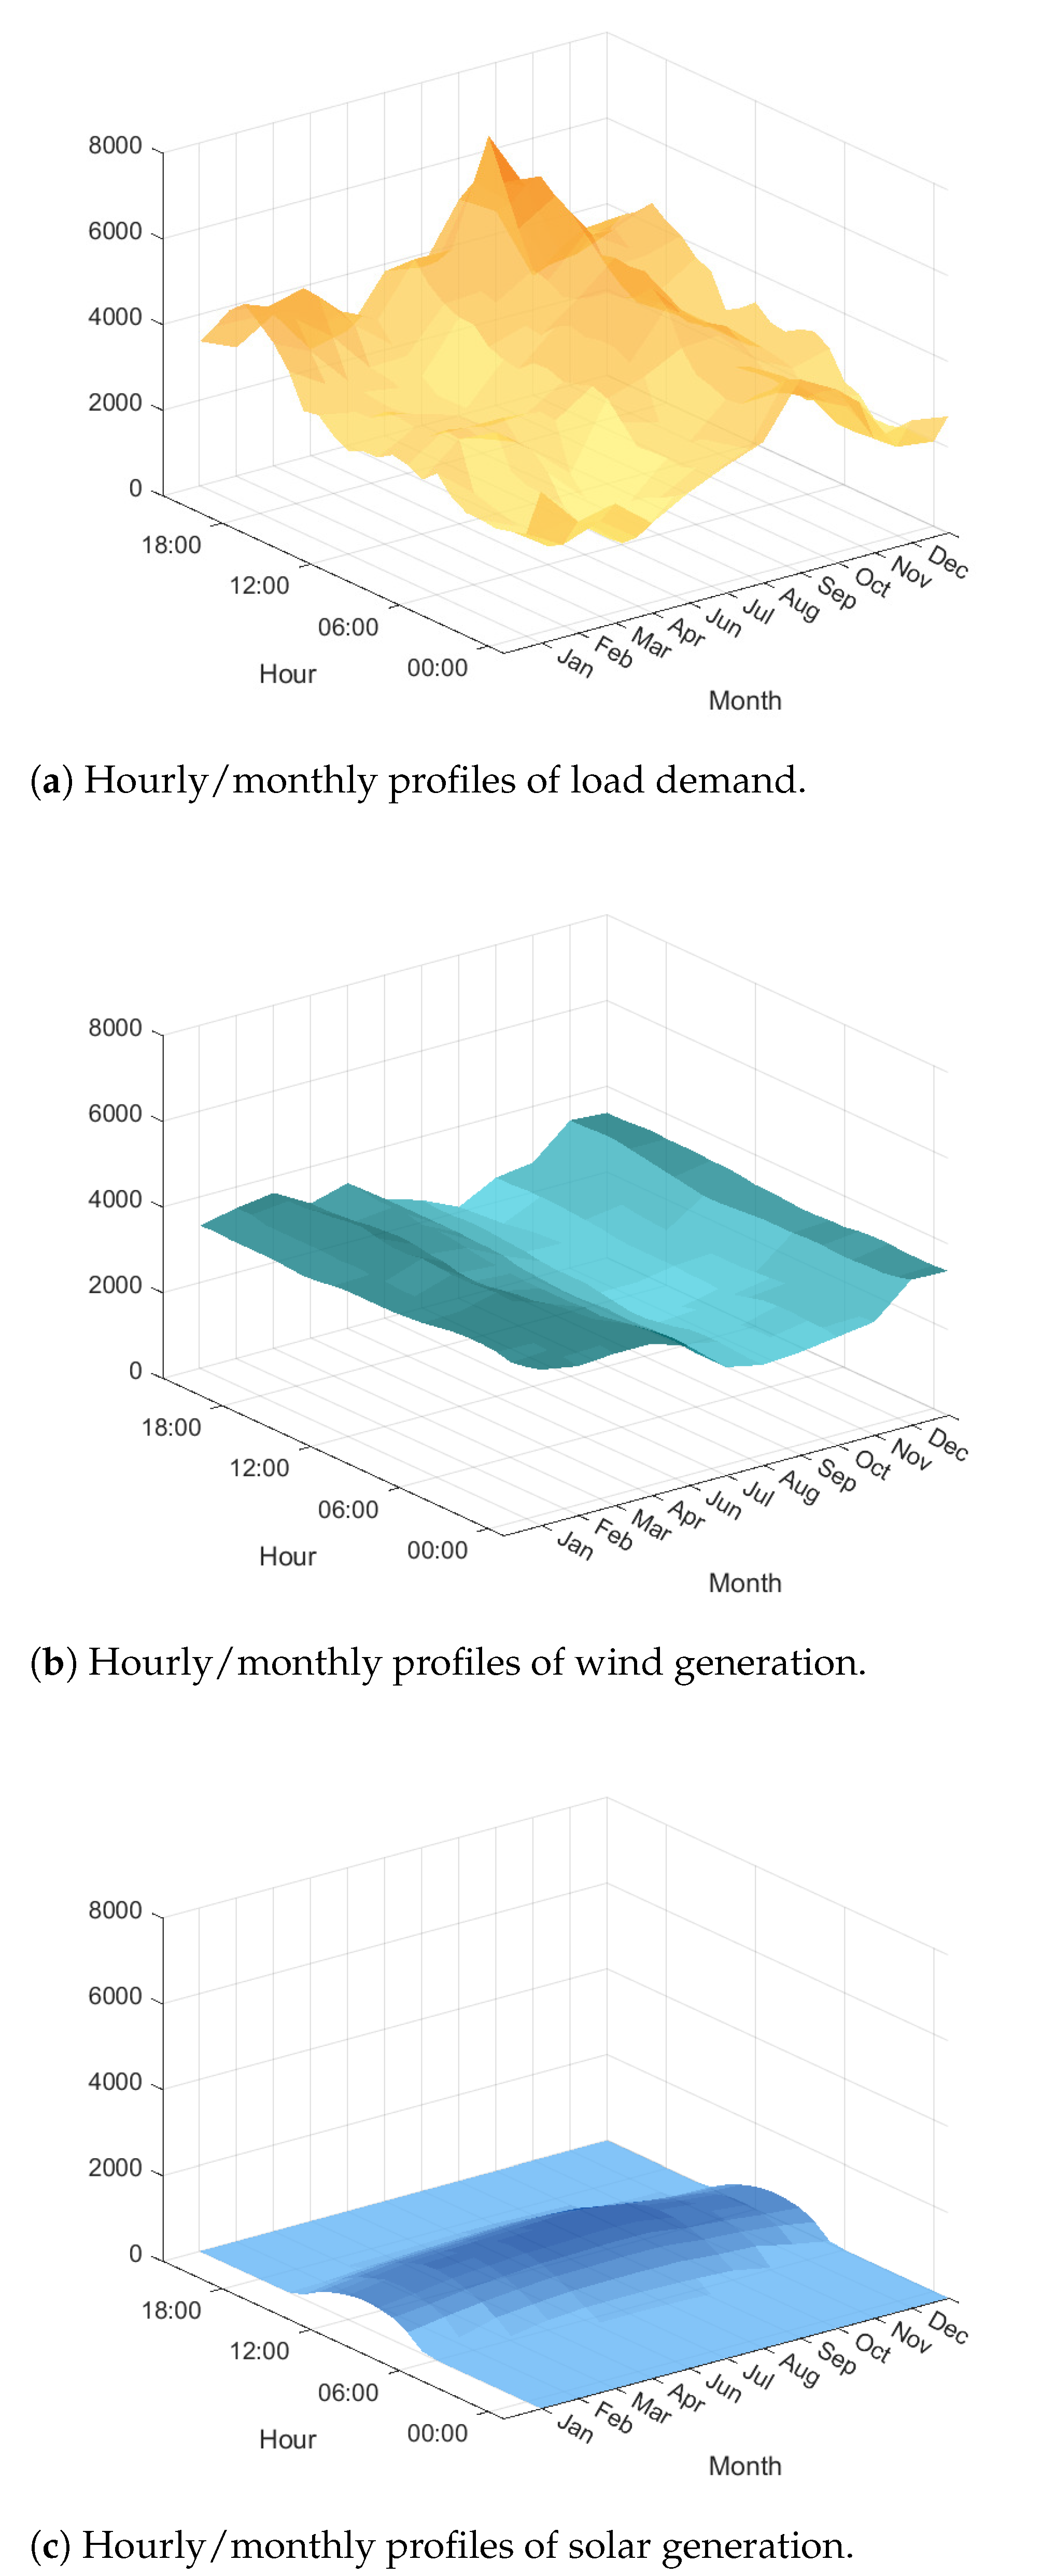
2. System Description and Scenarios

The system considered for investigation is the medium voltage network of Pantelleria, a small island located in the Mediterranean sea. The island is currently dependent on external sources of energy: the supply system is based on a centralized diesel power plant, composed of eight generators and located near the urban centre. The total demand of the island strongly depends on the period of the year, and it varies from a minimum of around 4 MW to a maximum of around 8 MW. The total generation capacity of the diesel power plant is around 20 MW. For economic reasons, in fact, generators on islands are usually large compared to the system load [16,18]. The power is delivered to the consumers and the loads through four main feeders at 10 kV, all departing from the diesel power plant. The network has a radial structure, with the possibility to counter-supply the lines in case of faults or create simple meshed configurations. The feeders are mainly cables, with lengths spanning from 14 km for the longest lines to 4 km for the shortest. Currently, there are only a few photovoltaic (PV) plants installed in the system, with a produced peak power in the range 1–20 kW, for a total active power PPV = 0.33 MW, thus representing a minor generation share over the total system load. The types of consumers can be classified as 50.6% domestic, 41.8% miscellaneous, 5.6% desalination plant and 2% street lighting. A simplified scheme of the electrical grid of Pantelleria is shown in Figure 1 directly on the geographical map of the island.
The system of the island is then considered in a future possible scenario, characterized by the integration of a given amount of RES generation and storage units, with the corresponding disconnection of unnecessary diesel generators. This scenario represents an opportunity for the island of Pantelleria to reduce polluting emissions and cut dependency on the supply of external fossil fuel, with clear environmental and economic advantages. For this small island’s network, a high share of renewable power generation is easily reached, and low-inertia operating conditions are realistic. In the future conditions assumed for the network of the island, there are four storage units (ST) and nine wind turbines (WT). The size of the storage units is 500 kVA each, for a total of SST = 2 MVA. Two storage units are installed at the same location of the main diesel power plant, while the other two storage units are located within the two main feeders. The WTs have different ratings, eight of them are 500 kVA and the last one is 1 MVA, for a total of SWT = 5 MVA. The WTs are distributed along all the four main feeders, as shown in Figure 2. All the RES generation units and the storage systems are assumed to be interfaced to the grid fully via inverters: they therefore represent non-synchronous generation which will properly be included in the model of the system as described in Section 3. For the location of RES plants and storage systems, the authors took into consideration the results of previous analyses and feasibility studies presented in [10,20]. In a planning phase, it is possible to consider different locations of plants and batteries by applying one of the methods in the literature normally used for the optimal sizing and siting of distributed resources [21,22,23,24].
The electrical system of Pantelleria island is examined under different load and generation scenarios, for the sake of a more complete analysis of the possible operating conditions of the grid. The scenarios are derived from the available hourly and monthly data of the island. The heat-maps of the power profiles given per month and per hour are reported in Figure 3. The data of load demand (Figure 3a) are provided by SMEDE, the owner and system operator of the electrical grid of Pantelleria. The highest value of the demand is observed in the summer: in that period of the year, the island attracts a high influx of tourists, which results in an excessive use of air-conditioning. The data of wind (Figure 3b) and solar (Figure 3c) generation are taken from the Global Wind Atlas [25] and the Global Solar Atlas [26] databases, respectively. The hourly and monthly values of both wind speed and solar irradiation correspond to the geographical location of the island. The values extracted from the Atlas databases are then post-processed in the following way: they are first normalized using the maximum value and then multiplied by a determined scale factor which accounts for the expected generation share resulting from the RES integration conditions described before. The normalized data per hours/months of wind and solar power profiles are reported in Appendix A.
The comparison of the hourly and monthly data for load demand and potential RES generation indicates the possibility of four main combining scenarios:
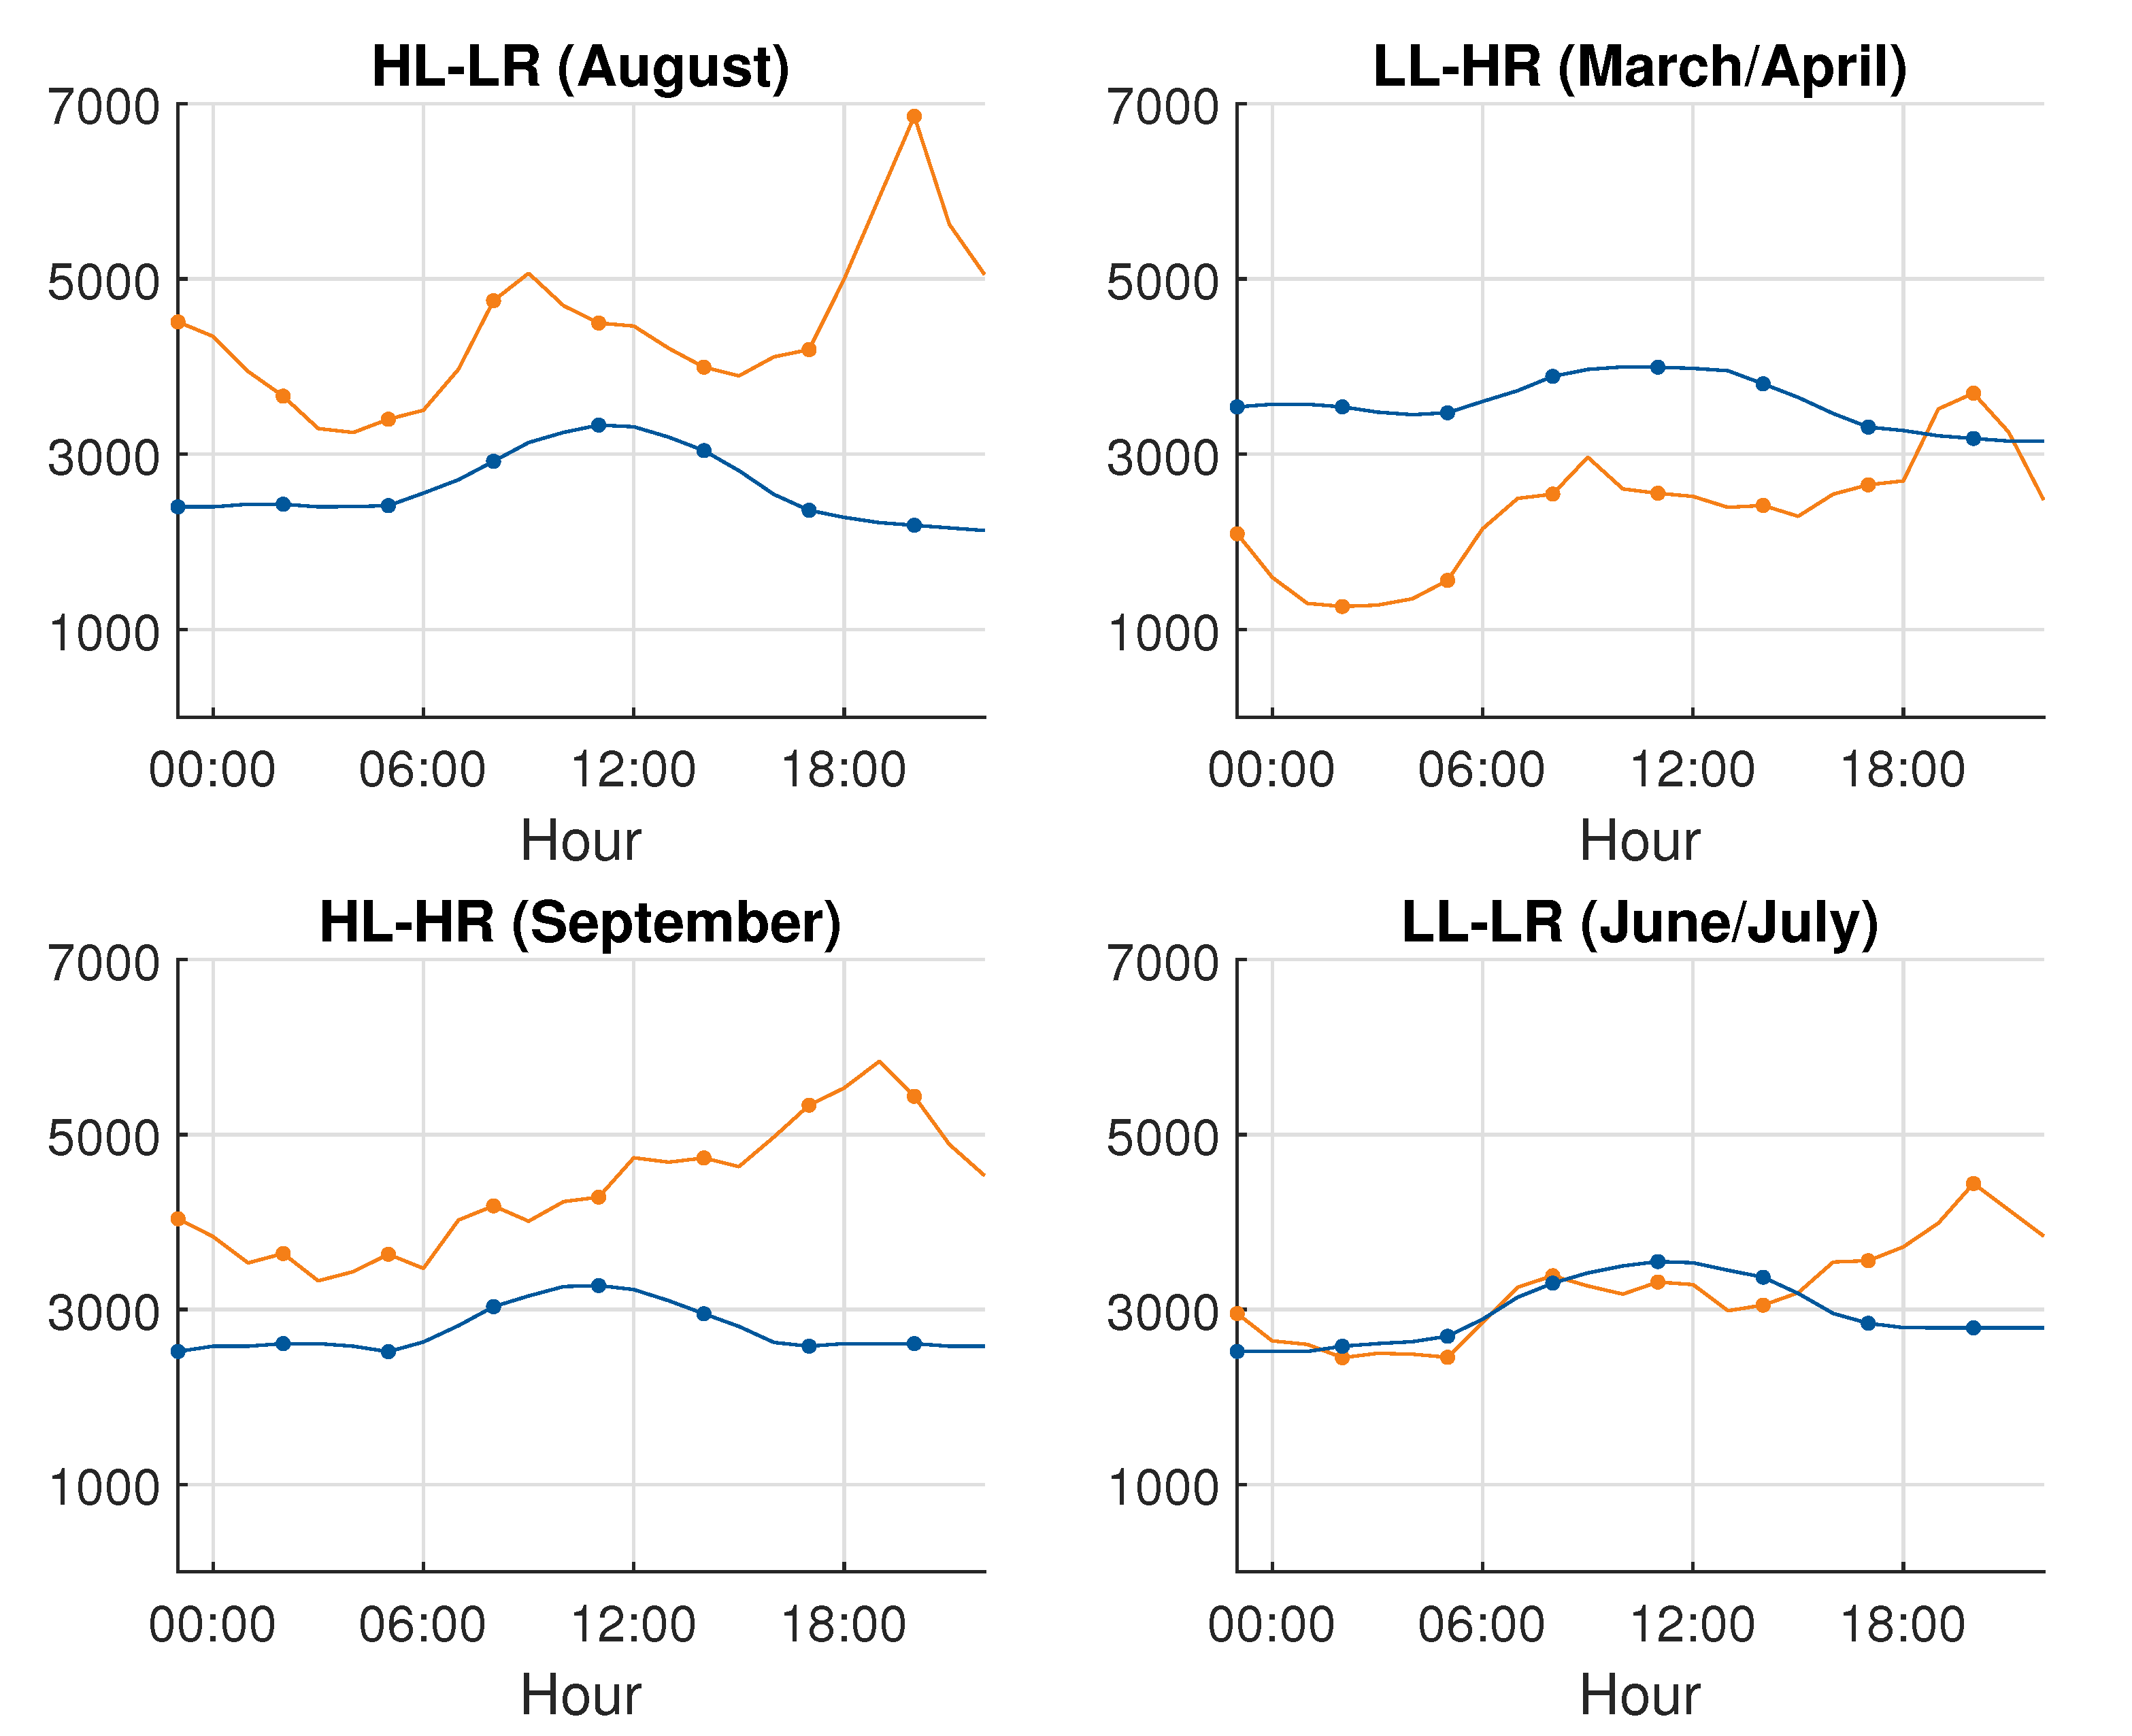
  • high load demand and low RES generation: this condition can be representative of end of July/August, especially in the evening hours (Figure 4 top-left); the peak of the demand is, in fact, detected for the summer period, where the production from wind is typically low;
  • low load demand and high RES generation: this condition can be instead associated with May/June and the beginning of July (Figure 4 bottom-right); in that period of the year, the power demand is still relatively low because the summer season is only beginning, with moderate tourist influx and mild temperatures;
  • high load demand and high RES: after some further inspections of the available data, this condition is found for the month of September (Figure 4 bottom-left); the level of the load demand is a bit lower than the peaks observed in the summer period, but at that time, there is a significant increase of the generation from RES, due to the beginning of the windy period for the island;
  • low load demand and high RES: this condition can be related to the period between March and April (Figure 4 top-right); in that season of the year, the power demand is, in fact, low, while the RES generation level is considerable due to the relatively high wind production.
It is worth noting that the identification of the case of high load demand and high generation from RES is not as distinct and straightforward as the other cases: for that scenario, the best approximation has been searched for through a detailed comparative analysis of the available data and identified in the month of September as a compromise between the two aspects of relatively high load demand and relatively high RES generation. Table 1 offers an overview of the identified scenarios, with details about the operating conditions of the storage units installed in the grid. In the naming convention, the first label specifies the load condition (High Load HL, Low Load LL), while the second label specifies the RES generation (High RES HR, Low RES LR).
Concerning the operating conditions of the storage units, the following considerations can be made:
  • scenario HL-LR: when the load demand is high and the power generation from RES is low, all four storage units might be called to generate power, especially if the production from diesel is to be reduced; in this condition, the storage units could then all be operated in discharging mode;
  • scenario LL-HR: when the load demand is high and the power generation from RES is low, the surplus of generation can be used to recharge the batteries of the storage units; in this condition, the storage units could then all be operated in charging mode;
  • scenarios HL-HR and LL-LR: when load demand and RES generation are both high or low, the approximate balance between load and generation does not pose a priori constraints on the storage units; therefore, the operating conditions of the units can be managed depending on other factors, such as level of state of charge, grid management requirements and power smoothing; in these conditions, two storage units can then be operated in charging mode and two in discharging mode.
With the definition of these four simulation scenarios, it is then possible to cover the main representative operating conditions the system could be found in. The implementation and the analysis of these scenarios will allow for a more comprehensive examination of advantages and disadvantages of the possible control strategies applied to the power electronics interfacing storage units and RES plants to the grid.
In all the considered scenarios, the diesel power plant will cover the remaining part of the total load not covered by the sum of renewable sources and storage unit power generation. In particular, in the two high load scenarios, two synchronous machines of the central power plant will be considered running in the system, while in the two low-load scenarios, only one synchronous machine will be sufficient to ensure the total supply of the demand of the island. All the identified scenarios will be implemented for analysis in the simulation model of the island electrical system, as described in Section 3.

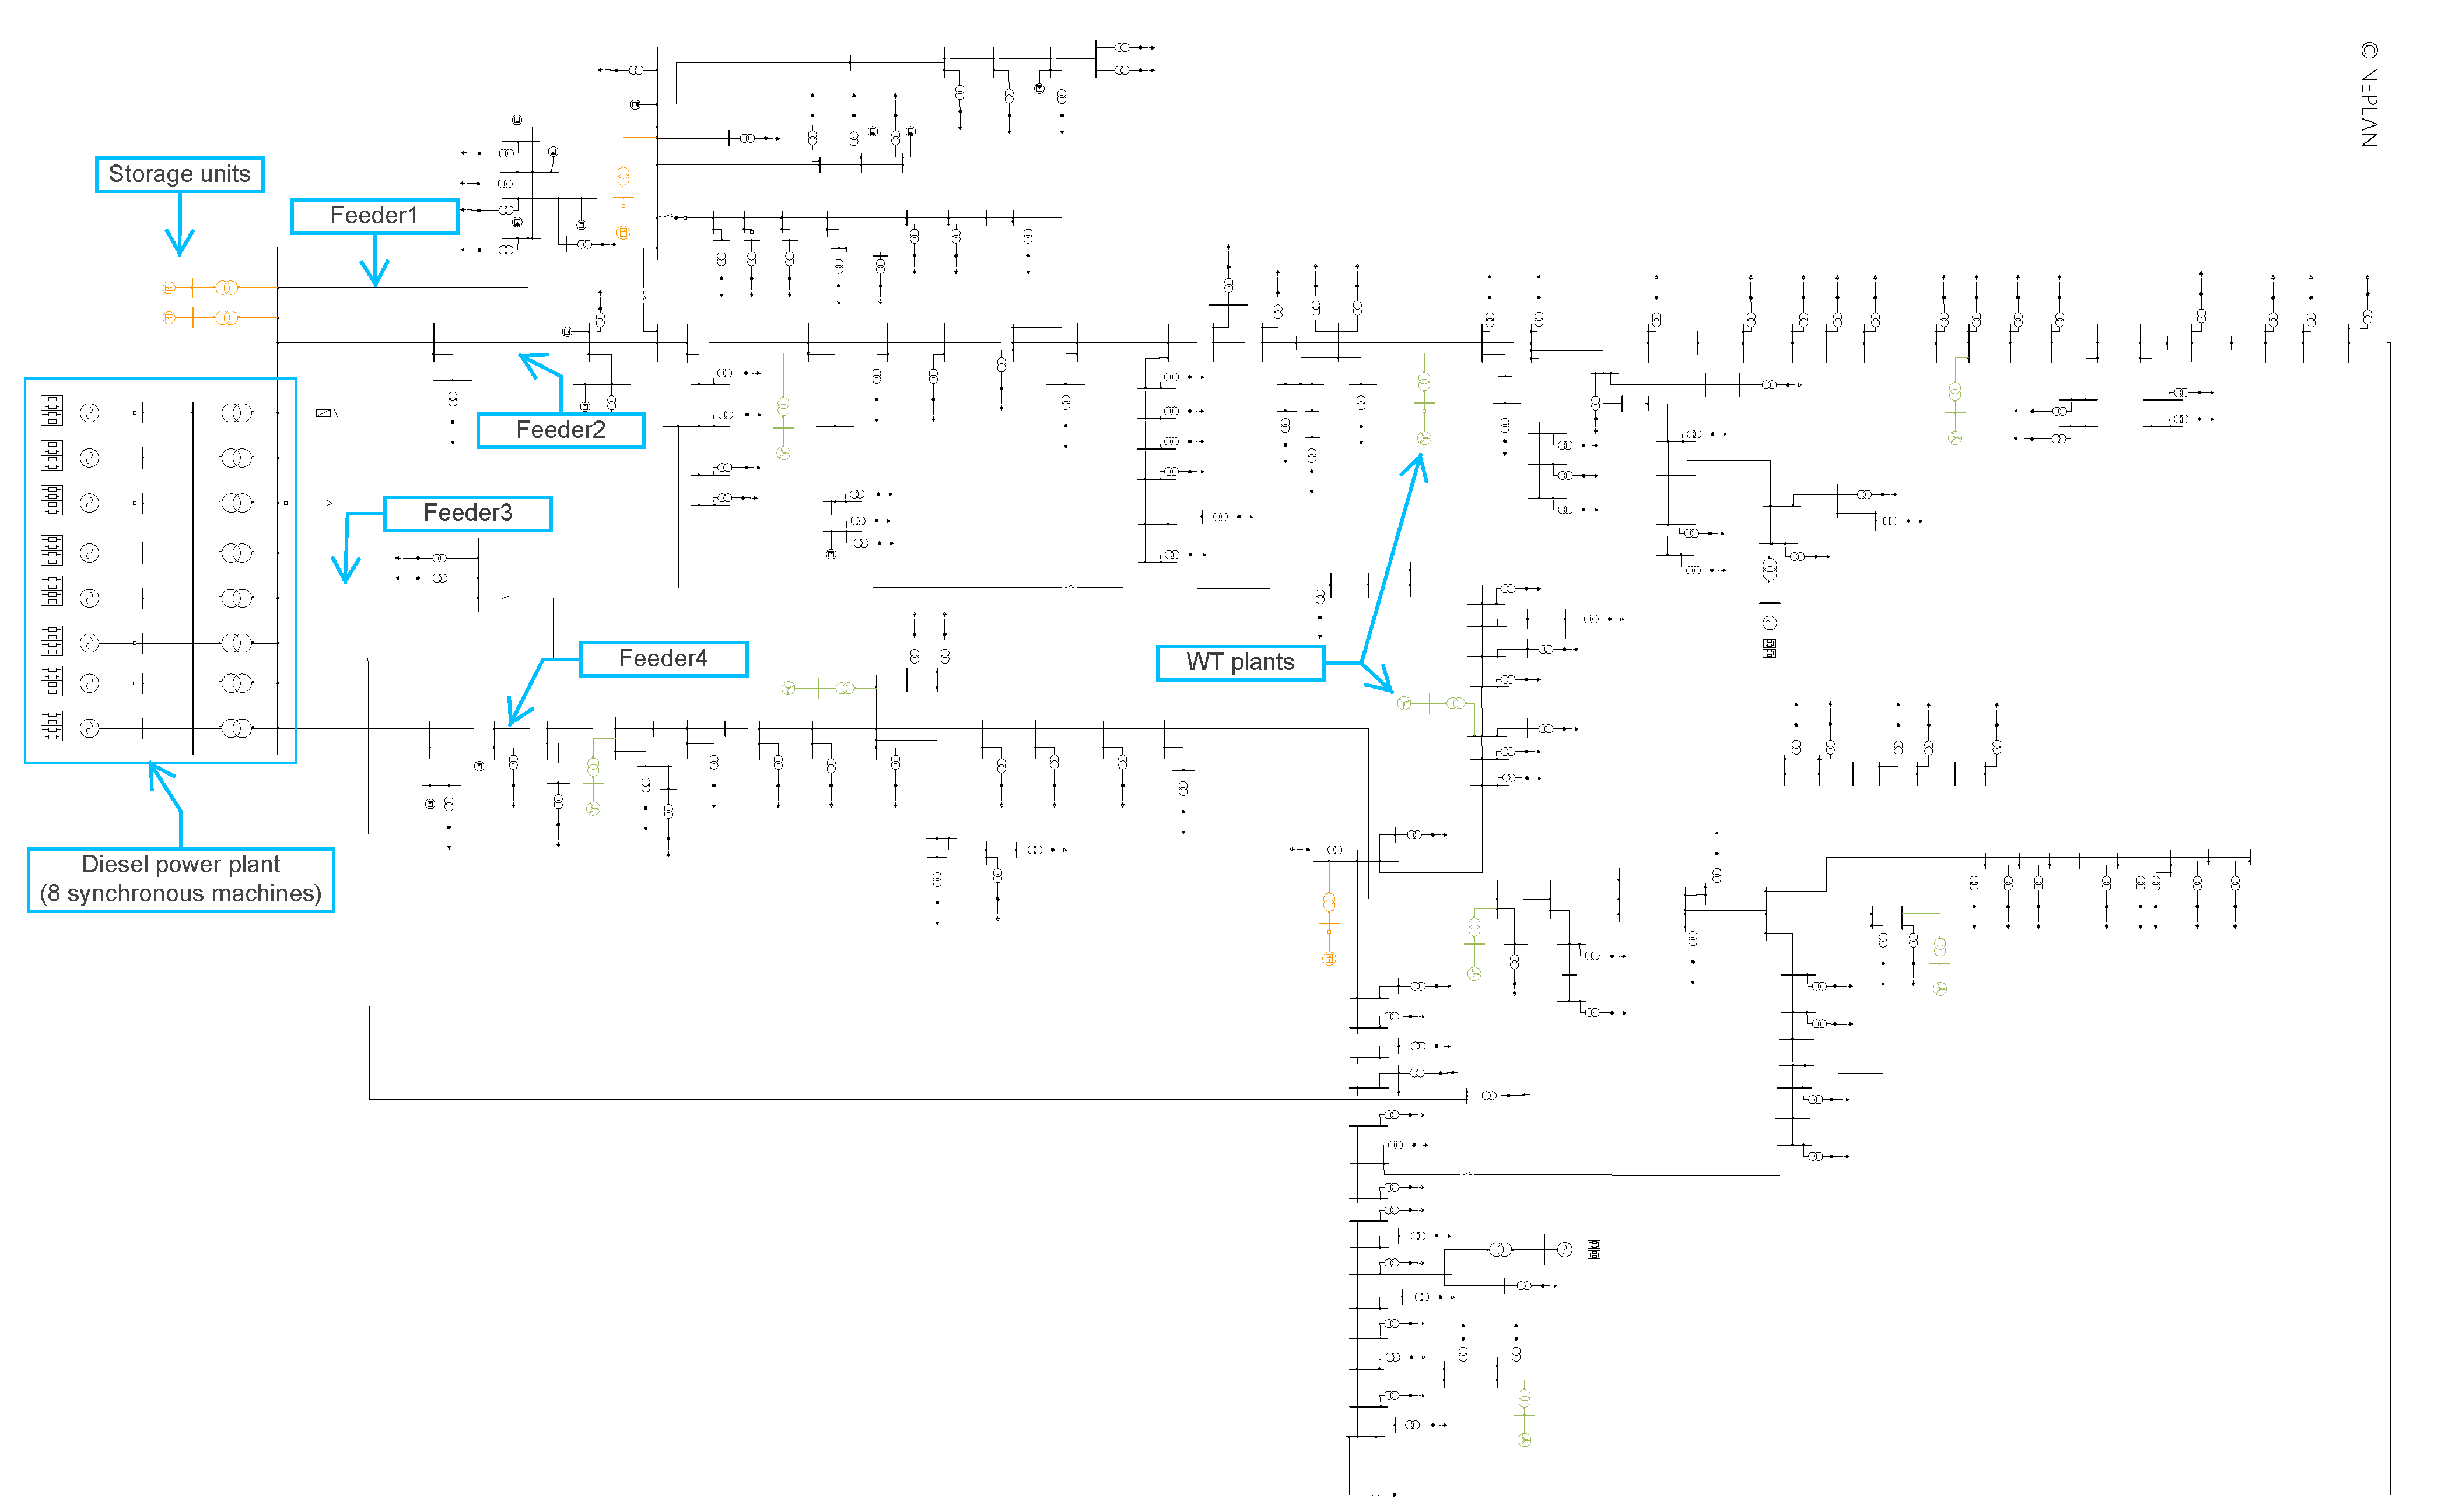
3. Implementation of Simulation Model

The basic dynamics of the island’s power system is represented using standard dynamic models for synchronous machines and for the corresponding controllers. The synchronous machines are modelled with subtransient 6th order round rotor models, using typical values of diesel generators reactances, inertia and time constants. In particular, the inertia constant is assumed as H = 2 s for all the generators. The controllers connected to the machines are automatic voltage regulators (AVR) and turbine governors. For these controllers, the standard models described in [27] are used. The block diagrams of the controllers are shown in Figure 5 and Figure 6, corresponding to the models SEXS and TGOV1, respectively.
The existing PV plants are simulated as controlled current sources, with conventional cascade vector control to keep the power references at the terminal. The same basic model is used for the representation of the 9 WTs, providing the setpoints of active and reactive power to the control system of the converter interfacing the generation source to the grid. The four storage units are assumed to be interfaced to the grid via power converters as well: for them, the same basic model will be used as the starting base, with proper modifications and extensions of the control to realize a more elaborated and effective control strategy. This point will be discussed more in detail in Section 4. The diagram of the basic model is shown in Figure 7.
The majority of power converters are usually controlled with this well-established concept [28,29]. This type of converter is commonly known as grid-following: the control relies, in fact, on the voltage angle obtained through the dedicated synchronization unit, following the grid variations through the PLL. Grid-following converters do not provide any inherent frequency support to the grid. Specific control extensions can, however, be implemented to let the unit source-inverter participate in the frequency control of the system [15,19,30,31,32,33,34,35]. These extensions concern the active power control loop, providing an additional signal to the summation point of the control loop and thus realizing a change in the actual active power reference requested to the unit source-converter. The control extensions considered in this work are shown in Figure 8. The upper part of the scheme realizes a continuous derivative-based control, producing an output signal proportional to the time derivative of the frequency. The lower part of the scheme is based on a droop control on the frequency deviation, and it provides a primary reserve to contain the frequency after a power imbalance, modifying the load sharing capabilities of the converter at steady-state. The two supplementary controls are common and widely studied versions of frequency control schemes for grid-following converters, and they are based on the two concepts of synthetic inertia and fast frequency response. The two control actions are identified with two subscripts, “IR” standing for inertial response and “PR” standing for primary reserve. The gains K I R and K P R in the two parts of the scheme of Figure 8 govern, respectively, the magnitude of the inertial response and the amount of the reserve provided during a frequency transient in the grid. The gain K I R can be related to the inertia constant H as K I R = 2 H , while the gain K P R is related to the frequency droop σ through K P R = 1 / σ .
All parameters in the previous block diagrams are defined in Section 5, with descriptions and numerical values. The dynamic model of the control system of the converters also includes rate limiters on the power reference to deal with the rapid fluctuations in the output of renewable energy sources, such as wind and photovoltaic, caused by the high variability of the source, allowing a smooth transition of the command signals and thus avoiding potential damages to electronic components.

4. Extended Frequency Droop Control for Storage Units

The participation in frequency control of generation sources interfaced to the grid via power electronics can be effectively achieved through several possibilities, such as, for instance, the synthetic inertia and the frequency droop described in Section 3. For the storage units, it is possible to imagine a modification of the basic controls reported in Figure 8, tailoring the control principles and the tuning of parameters to the intrinsic characteristics of storage systems. The main extension of the frequency controls, which can be specifically applied to storage units, concerns the droop of the primary reserve control. The opportunities of adaptive controls applied to the frequency droop for storage systems have been studied in several works [36,37,38,39,40]. In this work, a simple control principle is described and implemented. The basic idea is to have different droop settings for the storage system when operating in charging mode (load behaviour) and when operating in discharging mode (generation behaviour). If the storage unit is in charging mode, at the occurrence of under-frequency transients in the grid, the batteries of the unit could momentarily reduce or even stop the absorption of power from the grid. Whenever possible, they could even reverse the active power setpoint and switch to charging mode. Storage systems in discharging mode operating as loads can therefore provide a more intense reaction to under-frequency transients. This corresponds to lower values of the frequency droop σ and therefore higher values of the gain K P R = 1 / σ . In this case, the power absorbed by the storage system could be set at zero or even reversed in the most severe cases. If, instead, the storage unit is in discharging mode, the frequency droop settings can follow the same principles and adopt the same values which would have normally been used for the auxiliary frequency control. With the proposed control logic, the frequency droop used for the unit in discharging mode σ 1 will then be higher than the droop used in charging mode σ 2 . The tuning of the two droop values can be done according to the following considerations. The droop σ 1 for discharging mode should be fixed to guarantee the power sharing with synchronous machines and other distributed generation sources, as conventionally done. This is normally in the range 1–10%: for instance, a droop of 5% corresponds to the full activation of the reserve for Δ f = 0.4 Hz, with the gain of the primary reserve K P R 1 = 1 / σ 1 = 20 pu. The droop σ 2 for the charging mode can instead be tuned according to the requested behaviour for given frequency deviations. As an example, if the maximum power absorption of the storage system should be completely interrupted ( Δ p = 1 pu in per unit of the rated power of the storage unit) for a given steady-state frequency deviation (f.i. Δ f = 0.004 pu, corresponding to 200 mHz), the value of the droop σ 2 in per unit would be σ 2 = Δ f / Δ p = 0.004 pu, and the gain of the primary reserve K P R 2 = 1 / σ 2 = 250 pu. A complete tuning principle could also involve a check on the state of charge (SOC) of the batteries of the storage unit. The control parameters can therefore be determined by the management system of the grid operator. The proposed frequency droop characteristic for storage systems can also be qualitatively illustrated as shown in Figure 9. For under-frequency transients (right-hand side of the diagram), two different values of frequency droop are considered for storage units in charging and discharging mode. Figure 10 shows a possible extension of the proposed control logic, also with differentiated droop values for the over-frequency transients (left-hand side of the diagram). In this work, however, the over-frequency transients are not considered since they can be more easily handled with the disconnection of the surplus generation without affecting the loads, while the under-frequency transients are more critical events, especially for isolated autonomous power systems with limited resources.
A flowchart of the proposed control strategy for the frequency droop control of storage units is shown in Figure 11.
A similar approach for the inertial response could be theoretically implemented as well, with different values for the gain K I R depending on the operating conditions of the storage units. However, it would not be as effective as for the primary reserve. In this case, in fact, the limiting actions of the rate limiters included in the active power control loop would limit the steep changes of the reference p r e f , thus making the requested increase p I R useless. Due to the effects of ramp-limiters, the inertial response of the system cannot therefore be increased by single units, but it should come from the contribution of several generation sources. This aspect will be further discussed with the help of the simulation results in Section 5.

5. Simulation and Analysis

The complete RMS dynamic model of the network is developed and implemented in the power systems analysis software NEPLAN [41]. An overview of the model is shown in Figure 12, while a summary of the parameters for converters simulation is reported in Table 2. This model is used for the simulation and the analysis of the four scenarios defined in the previous sections (Section 2 and Section 3). In all the investigated cases, the system is considered in a perturbed condition where a uniform disturbance is identically applied to all the nodes with load. For this, a load increase Δ P = 5% in percentage of the total load demand is included in the time-domain simulations. A load change in the range 3–5% is considered as already a large disturbance for a power system [16,42]. The Δ P corresponds to 0.4 MW for high load scenarios and 0.2 MW for low load scenarios. For the sake of flexibility and ease in analysing scenarios and configurations, the handling of the calculations is automated with an external code written in C#. The utility offers a simple graphical interface, and it calls the APIs of the software NEPLAN to manage all the elements and models of the network, run consecutive simulations programmatically and post-process the results for analysis. The results will be analysed with particular attention to the frequency stability of the system, referring to the typical frequency metrics, such as minimum instantaneous value of the frequency (frequency nadir), maximum absolute value of the rate of change of frequency (RoCoF) and the steady-state frequency deviation, to assess the dynamic behaviour of the grid in the different scenarios.

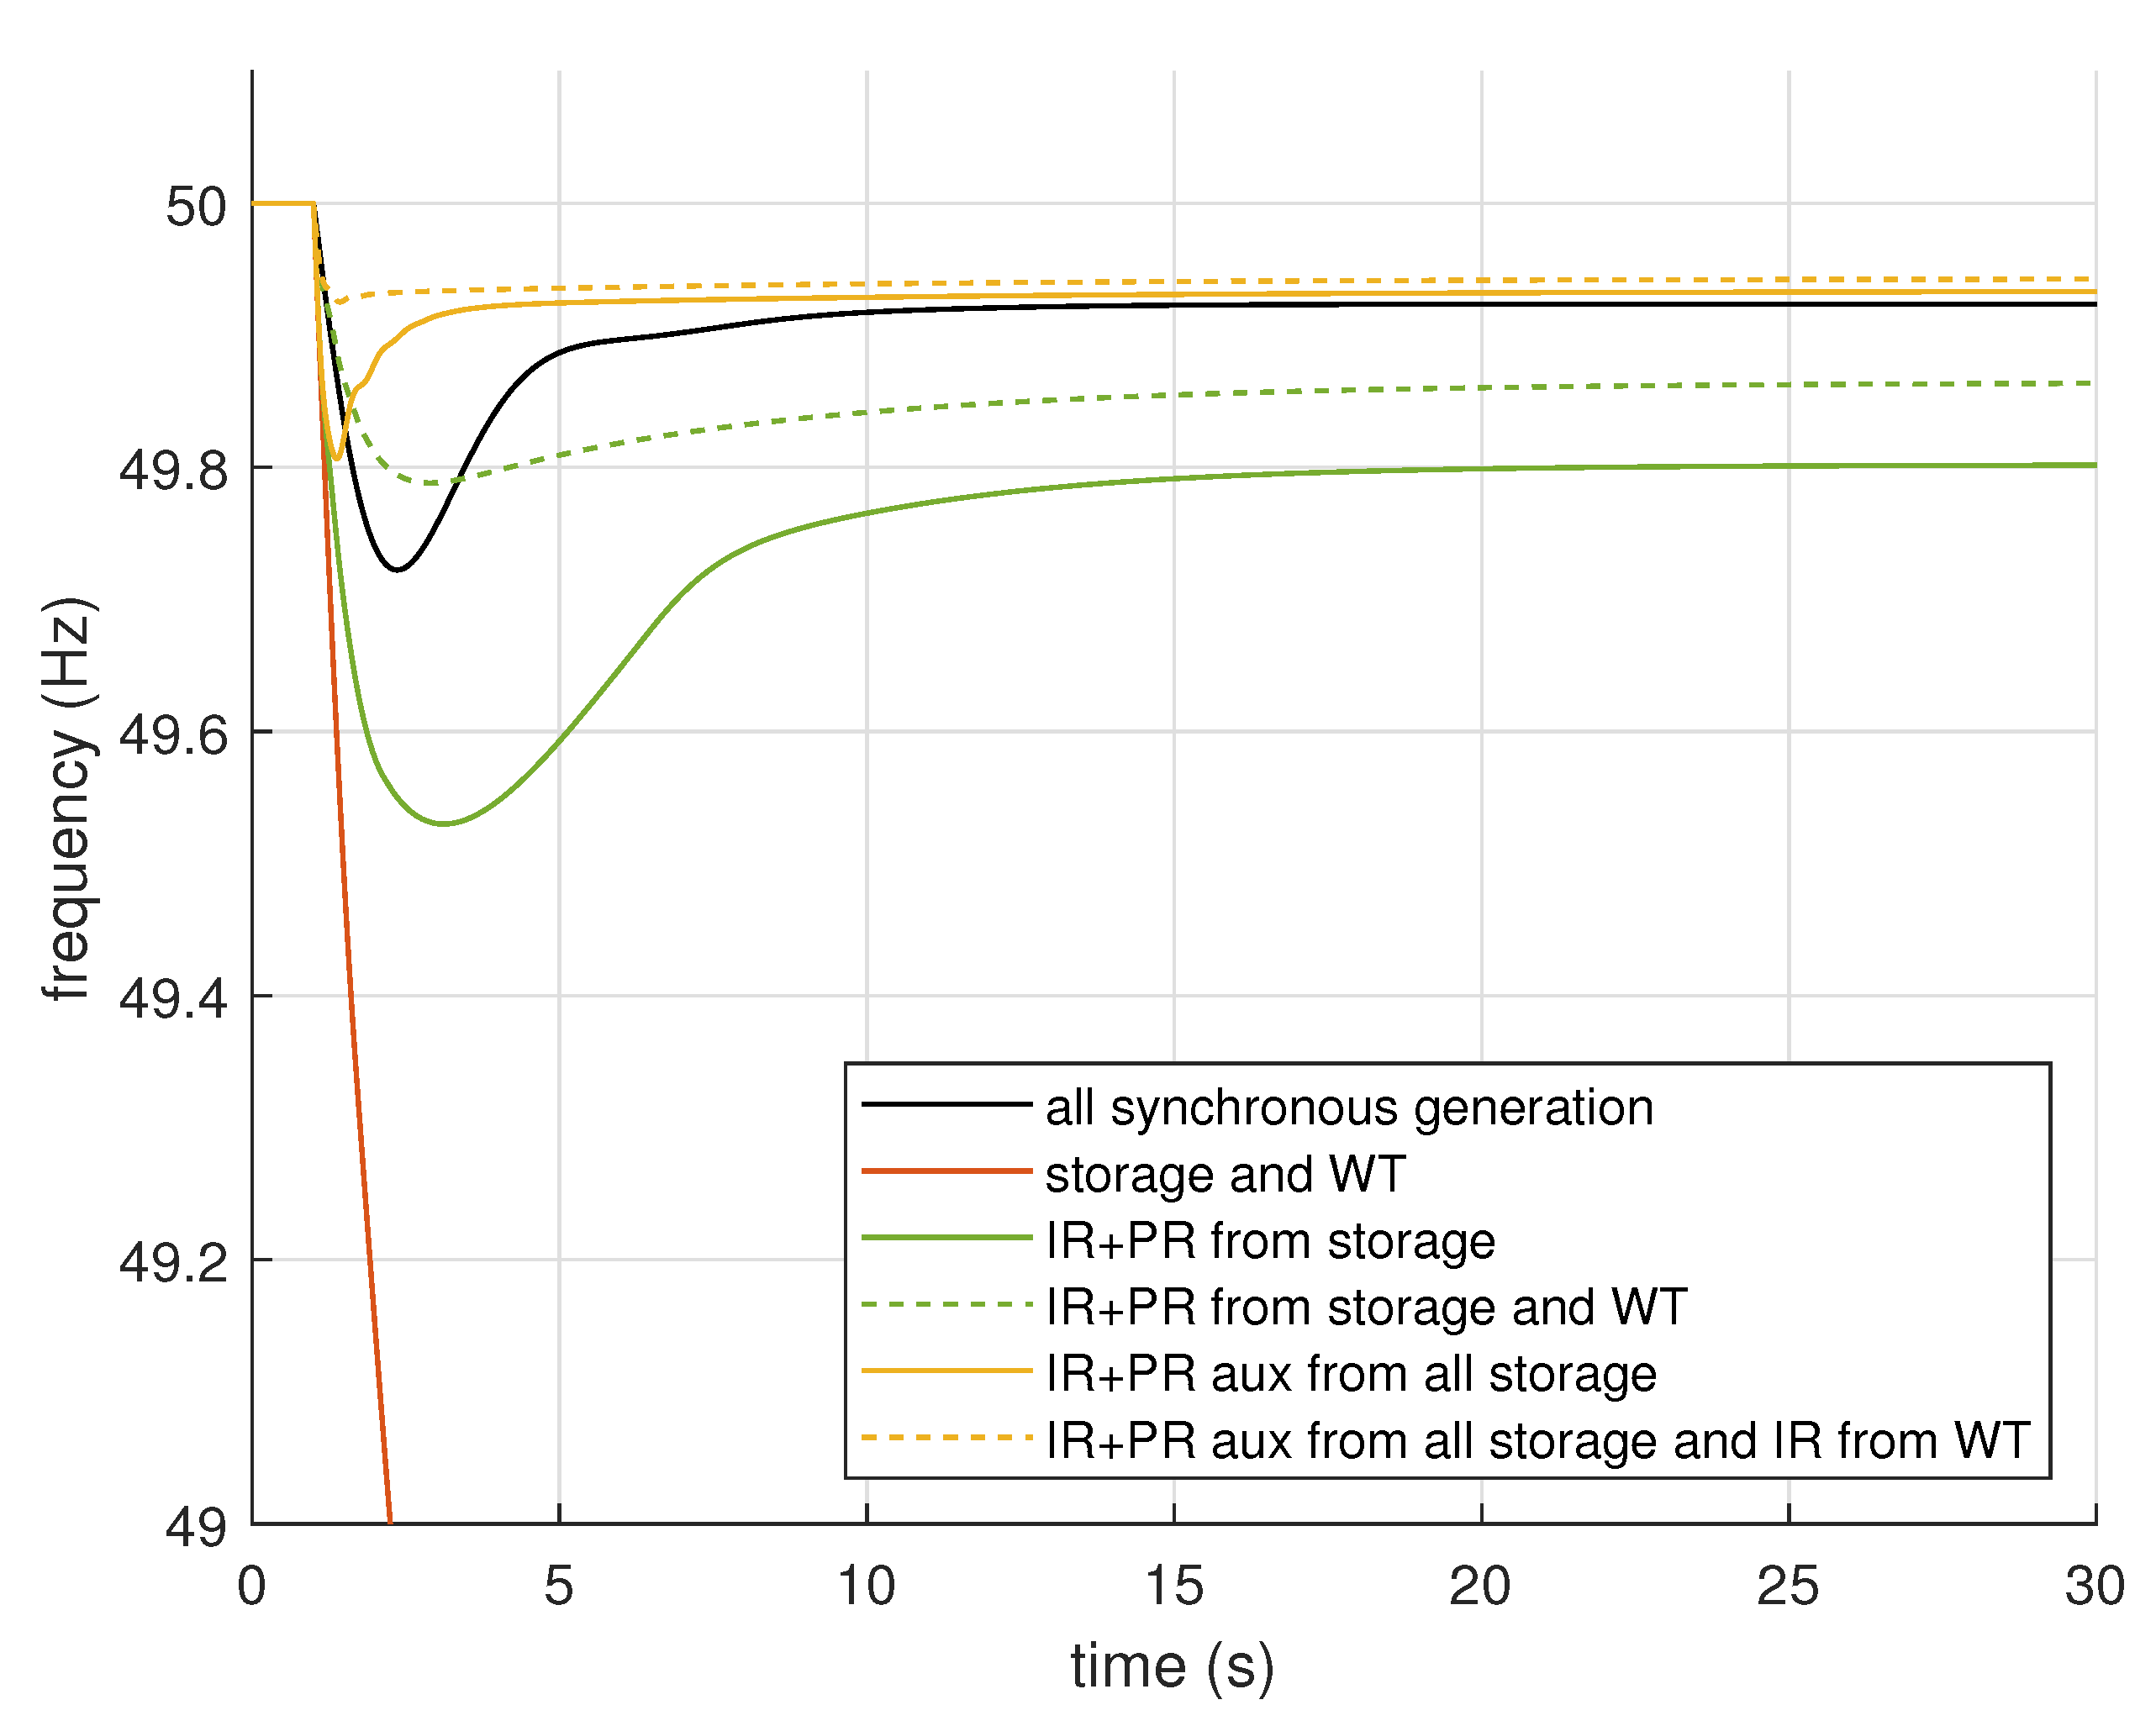
5.1. High Load and High RES

The results for the simulation scenario with a high load and high generation share from RES are shown in Figure 13. It can be immediately noticed that the system is unstable for the scenario with the integration of WTs and storage units without any auxiliary frequency controls. In this case, the system is not capable of withstanding the load disturbance and the frequency collapse (red line in Figure 13). The activation of synthetic inertia and primary reserve as auxiliary controls for the converters interfacing the storage units to the grid is already sufficient to guarantee the frequency stability of the system (green solid line in Figure 13). In this case, however, the transient performances of the system are deteriorated as expected, with higher absolute values of frequency rate, minimum instantaneous frequency and steady-state deviation. If the WTs are also participating in the frequency control with the auxiliary controls of synthetic inertia and primary reserve (green dashed line in Figure 13), the transient performance of the system clearly improves. The implementation of the control logic with different frequency droops depending on the operating mode of the storage system proves to be an effective control strategy to guarantee the frequency stability of the grid (yellow solid line in Figure 13). The frequency nadir and the steady-state deviation are largely improved, with comparable or even better values than in the case of all synchronous generation. The RoCoF, instead, still has high values for a steep frequency change right after the occurrence of the load disturbance. This observation is related to the consideration discussed in Section 4 about the inertial response provided by few generation units and the curtailment effects of the rate limiters within the active power control loop. In this case, only two storage units apply this control, as they are in charging mode (Table 1). The other two units are instead in discharging mode, and they implement the conventional droop control determined by grid management and power sharing. Additionally, if the synthetic inertia is activated for WTs as a complementary control action to this case, the transient performances of the system benefit with a significant improvement (yellow dashed line in Figure 13).

5.2. High Load and Low RES

The results for the simulation scenario with a high load and low generation share from RES are shown in Figure 14. Similar to the previous scenario, the integration of WTs and storage units with no auxiliary controls makes the system weak and unable to react stably to the load disturbance (red line in Figure 14). The activation of synthetic inertia and primary reserve only for the converters interfacing the storage units is also already sufficient in this case to guarantee the frequency stability of the system (green solid line in Figure 14). The activation of auxiliary frequency controls also for the converters interfacing the WTs positively supports the transient response of the system (green dashed line in Figure 14). In this case, the implementation of different frequency droops inside the control system of the storage unit converters does not make any difference, simply because all four storage units are in discharging mode (Table 1). In Figure 14, the yellow solid line corresponding to this case therefore overlaps the green solid line corresponding to the case of auxiliary frequency controls with a single droop value. The activation of synthetic inertia for the converters interfacing the WTs is beneficial for the stability of the grid, as expected. In this case, the transient performances of the system are clearly lower than the case where WTs provide both synthetic inertia and primary reserve (yellow dashed line and green dashed line in Figure 14, respectively).

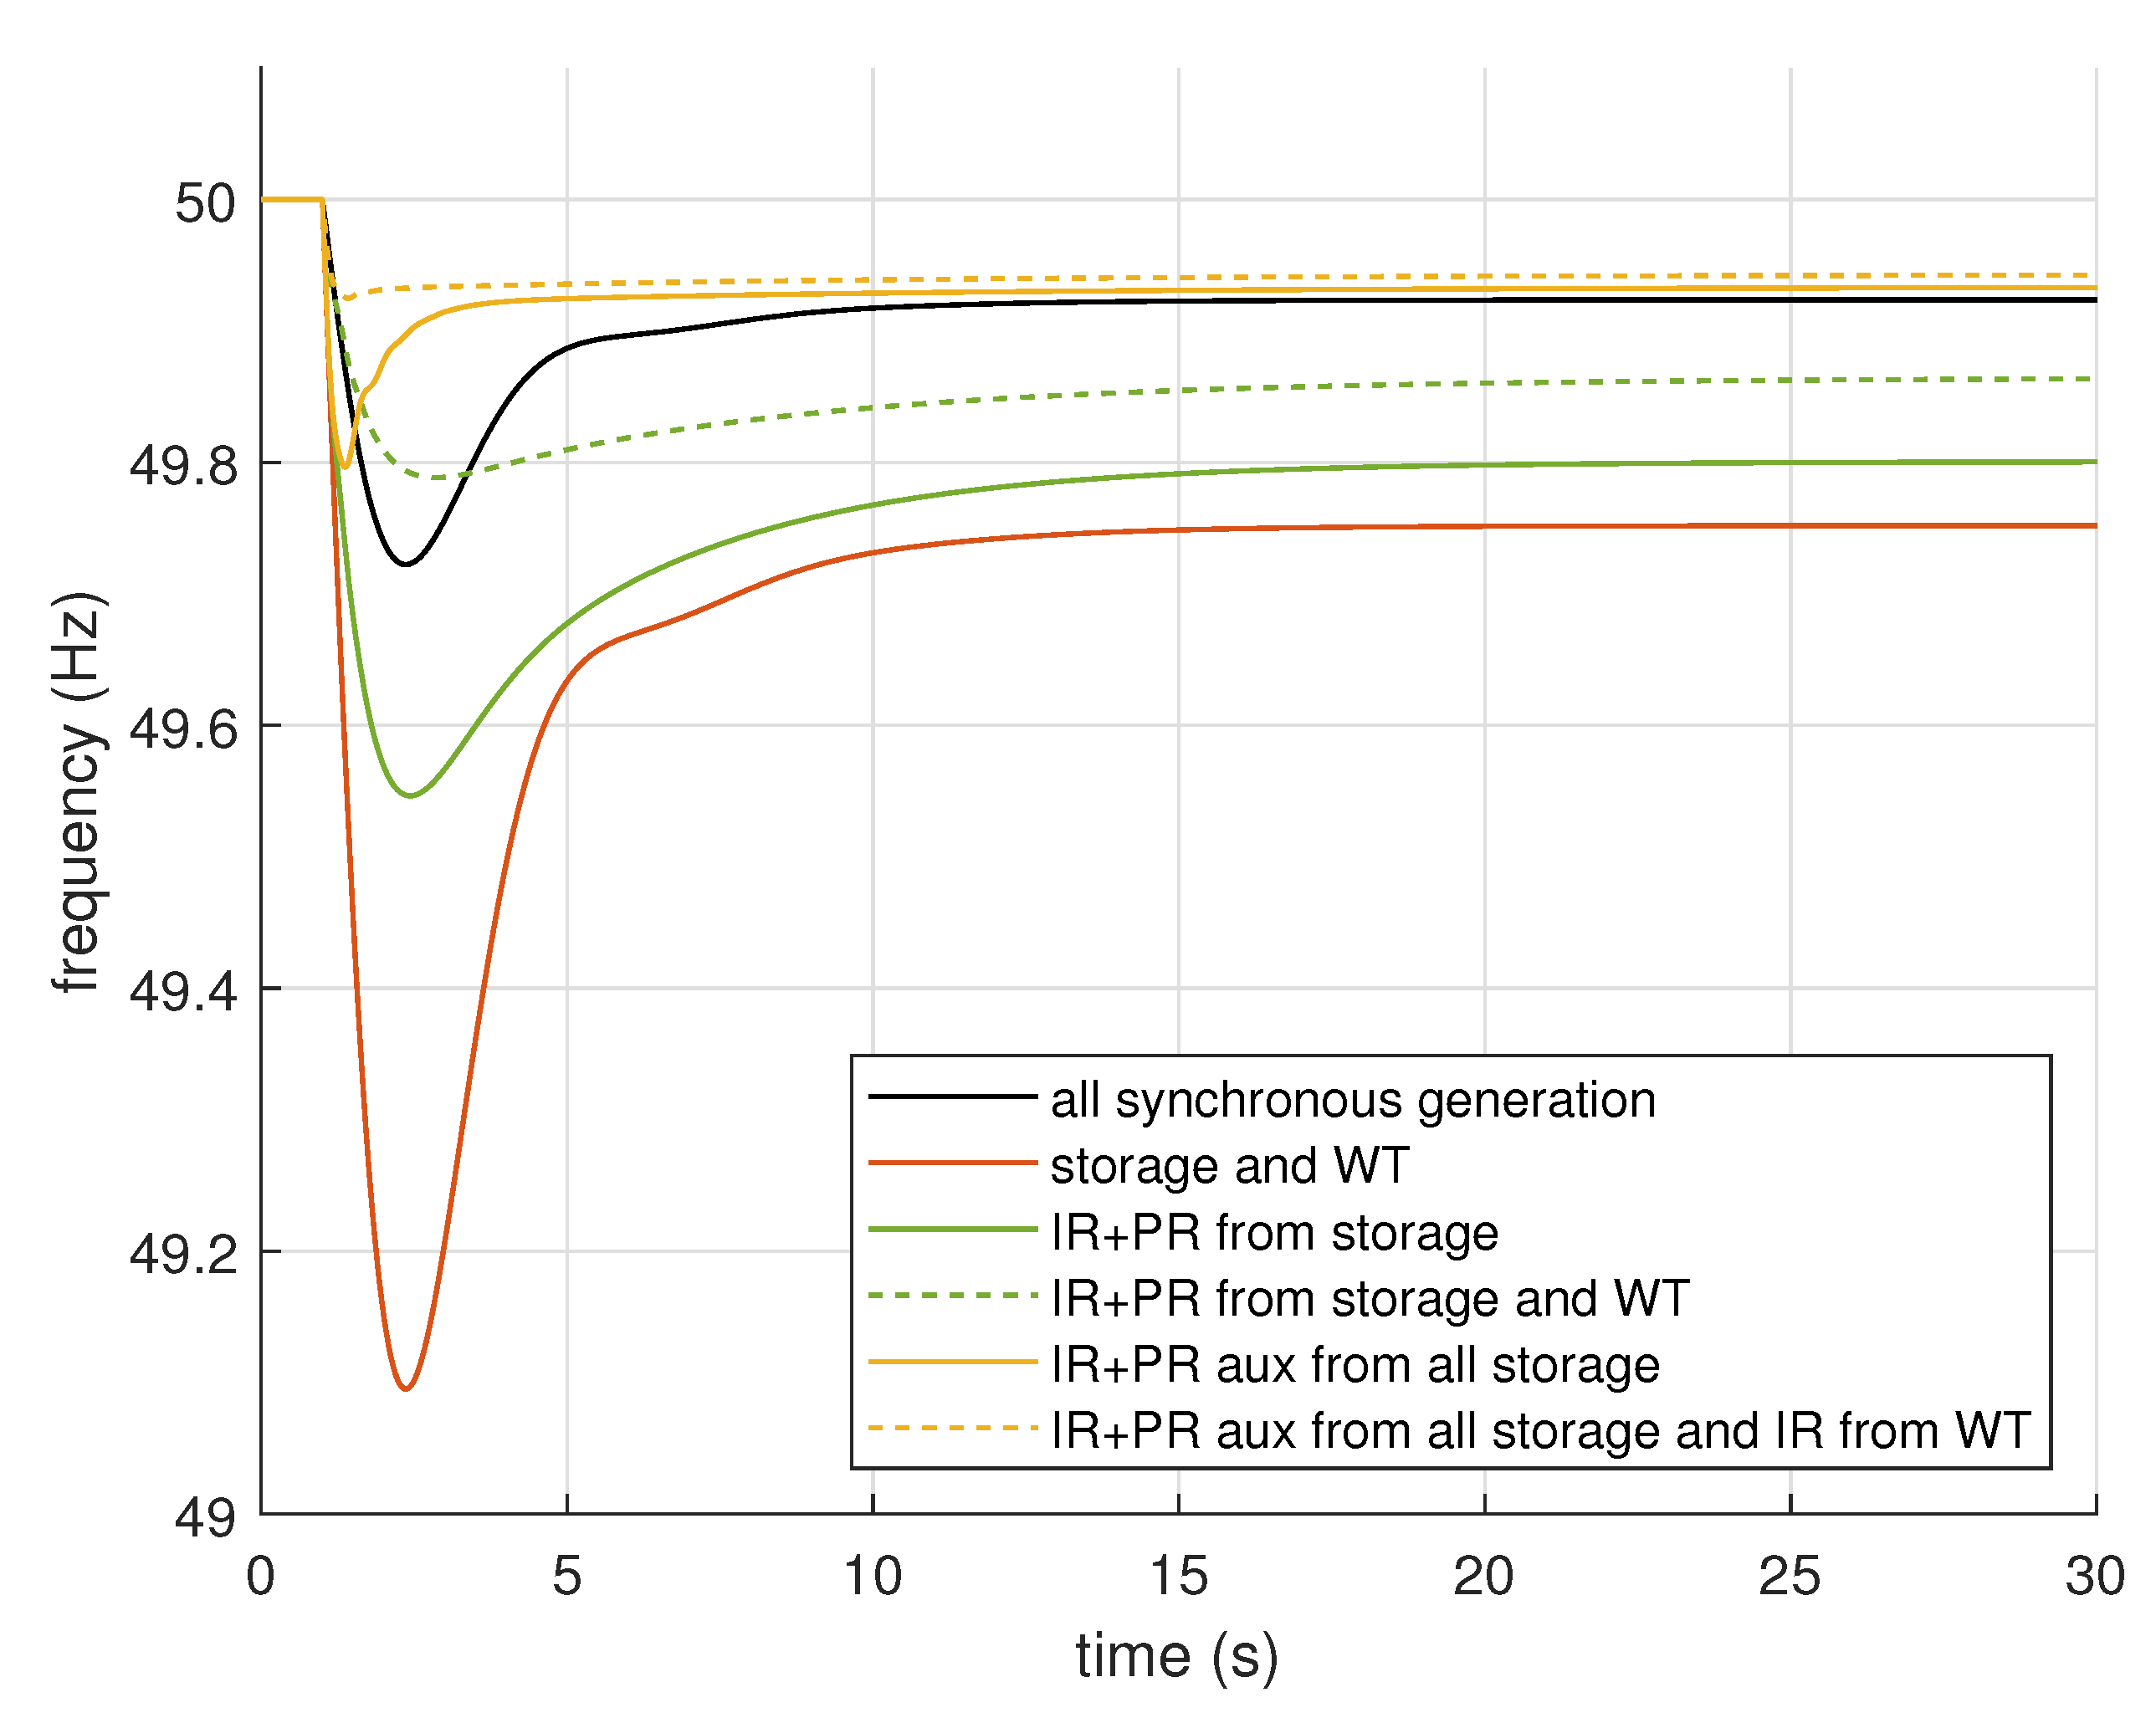
5.3. Low Load and High RES

The results for the simulation scenario with a low load and high generation share from RES are shown in Figure 15. In the low load scenario, the integration of WTs and storage units without any auxiliary controls does not critically endanger the frequency stability system. However, in this case, the transient performances are particularly poor (red line in Figure 15). The activation of auxiliary frequency controls for the converters interfacing storage units and WTs to the grid provides the expected positive contributions to the system (solid and dashed green lines in Figure 15, respectively). The implementation of different frequency droops for the primary reserve control of the storage units in charging mode determines a significant improvement, compared to the scenario where the storage units have a single value for the frequency droop (yellow and green solid lines in Figure 15, respectively). In this scenario, in fact, all four storage units are in charging mode (Table 1). The frequency nadir and the steady-state deviation are significantly enhanced, with better values than the scenario with all synchronous generation, while, also in this case, the RoCoF is basically not improved. For this, the activation of a synthetic inertia provision from WTs can contribute to compensate the lack of inertial response and reduce the maximum absolute value of the RoCoF (yellow dashed line in Figure 15). In this case, the overall transient performances increase remarkably, especially the minimum instantaneous value of the frequency.

5.4. Low Load and Low RES

The results for the simulation scenario with a low load and low generation share from RES are shown in Figure 16. Similar to the previous scenario, the integration of WTs and storage units without auxiliary controls determines a noticeable worsening of the transient performances of the system, but with no critical impact on the frequency stability. (red line in Figure 16). The activation of synthetic inertia and primary reserve for storage units and WTs also provides, in this case, a positive contribution (solid and dashed green lines in Figure 16, respectively). Again, the implementation of different frequency droops for storage units in charging mode determines a substantial enhancement of the system stability (yellow solid line in Figure 16, respectively). Compared to the previous scenario, the positive action of the proposed droop control logic is simply more contained, because in this case, only two storage units are in charging mode (Table 1). If the synthetic inertia control for WTs is additionally activated, the transient reaction of the system to the disturbance is considerably better then the base scenario with all synchronous generation (yellow dashed line in Figure 16).

6. Discussion

Analysis and results discussed in the previous sections can be summarized by some general observations and remarks. An overview of the frequency metrics computed for the different simulation scenarios is reported in Table 3.
The time-domain results indicate that the integration of generation from RES and storage units, with the corresponding reduction of diesel synchronous generation, can jeopardize the frequency stability of the grid in high load scenarios. The system might not be capable of withstanding the load disturbance, with the fatal collapse of the frequency and possible black-outs. The simulation results indicate that the activation of synthetic inertia and primary reserve as auxiliary frequency controls only for the storage units is already sufficient to guarantee a stable and safe operation of the autonomous system. However, the transient performances of the system are poor, and the stability margin of the system might be too small for critical conditions. The activation of auxiliary frequency controls for the converters interfacing the WTs to the grid can improve the situation, but this contribution depends strongly on the availability of the primary energy source (wind), and in some conditions, it might be missing. In general, the system should rely on the contribution provided by the WTs only as additional support to the frequency control, and not as essential help in maintaining the stability of the system. As a quantitative measure of the effort possibly requested from the WTs (green dashed lines in Figure 17), it can be observed that the amount of sustained active power requested by the primary reserve control is around 100 kVA as a total of all nine WTs installed in the grid. This power represents around the 3% of the installed wind power capacity assumed for the island. The inertial response requested from the WTs corresponds to a total amount of about 150 kVA, but this power is needed in a very short time frame (just a few seconds after the load disturbance). The simulation results of further scenarios indicate that the implementation of the proposed control strategy for the storage systems, with different droops depending on the operating mode of the unit (charging/discharging), is a rather effective solution to ensure the frequency stability of an autonomous power system under different conditions. It can be observed in Table 3 that the frequency nadir is generally improved when the proposed droop control strategy for storage units is applied. The values of the RoCoF are instead less affected: the reason is that the frequency gradient is primarily determined by the amount of kinetic energy available at the occurrence of the power imbalance. The proposed control for the storage units basically acts on the gain of the frequency droop control, leaving the gain of the synthetic inertia unmodified. Therefore, this control strategy only has a limited impact on the maximum value of the frequency rate following a disturbance. The RoCoF is instead improved when an additional inertial response is provided by different generation sources distributed along the grid.
With the application of the proposed droop control strategy on storage units, the system can have a sufficient stability margin without the need for relying on the transient contribution provided by WTs to guarantee the frequency stability of the grid. The additional support requested from WTs might only be limited to the inertial response, which is ultimately easier to provide than primary reserve (since the primary reserve control involves higher amounts of power and also for a more prolonged time window). In general, it could be observed that whenever possible, at least one storage unit should be operated in charging mode. For that unit, differentiated settings for the frequency droop of the primary reserve control could be then applied. With a couple of storage systems in charging mode, the additional contribution to the frequency control, which can possibly come from the RES installed in the grid, is therefore relieved by a critical role, necessarily avoiding the reliance on intermittent and variable sources and thus making the whole system more robust, stable and reliable. Whenever available, the contribution provided by RESs, such as wind power plants, can surely be beneficial for the system.

7. Conclusions

This paper presents the application of a particular control strategy for the enhancement of the frequency stability of an existing autonomous power network. The proposed control strategy is designed for the power converters interfacing the storage units to the grid, and it is based on an extended frequency droop approach, selecting different droop values for the control gains depending on the operating mode—charge or discharge—of the storage unit. The analysis of the simulation results indicates that the application of the proposed droop control strategy to storage units contributes to a considerable improvement of the frequency stability of the system. In worst-case scenarios, the system integrating storage units without a specific control strategy could experience a frequency collapse, following the occurrence of a power imbalance in the grid. The analysis and the results demonstrate that the implementation of the proposed frequency droop control for storage units is fundamental to guarantee the frequency stability of the system. The proposed droop control is also particularly effective in non-critical scenarios, resulting in a considerable improvement of the frequency nadir and thus of the transient performances of the system. Additionally, the application of the proposed droop control demonstrates a reduced need for a contribution to the frequency control from variable generation sources, such as wind power plants, ultimately making the whole system more robust, stable and reliable.
The observations and the analysis reported in the work are specifically related to the application of the proposed control strategy to storage units operating in autonomous electrical grids. The particular control strategy discussed in the work, however, might also be applicable to the case of storage units installed in large-scale interconnected power systems.

Author Contributions

Conceptualization, simulations and formal analysis, R.M.; Collection and processing of data, R.M. and G.Z.; Writing—original draft, R.M.; Writing—review and editing, F.M. and G.Z.; Supervision, M.G.I. All authors have read and agreed to the published version of the manuscript.

Funding

This research received no external funding.

Conflicts of Interest

The authors declare no conflict of interest.

Appendix A

Table A1. Normalized wind power profile (hours/months).
Hour1234567891011 12 
01:000.960.920.940.940.860.670.620.630.670.700.900.89
02:000.940.940.940.940.870.670.620.630.680.690.870.88
03:000.920.940.940.940.860.670.630.640.680.680.860.88
04:000.940.940.940.940.840.680.630.640.690.680.860.88
05:000.950.940.940.920.830.690.630.630.690.690.850.89
06:000.950.940.940.910.810.690.630.630.680.690.850.89
07:000.940.940.950.900.790.680.600.620.660.680.860.88
08:000.930.940.970.890.800.680.590.600.630.670.860.87
09:000.910.920.980.870.790.690.570.580.630.670.850.87
10:000.900.910.970.860.790.680.570.580.630.660.850.86
11:000.900.900.960.840.790.670.590.600.630.660.850.86
12:000.900.890.960.830.790.670.600.600.640.660.840.87
13:000.900.890.970.820.800.680.620.620.640.660.830.87
14:000.900.900.980.830.810.690.620.630.640.670.830.87
15:000.890.900.960.850.820.700.620.630.640.670.830.89
16:000.870.900.960.860.830.720.630.630.650.680.840.90
17:000.870.900.980.870.850.730.640.630.670.690.860.90
18:000.870.901.000.880.860.730.650.630.670.710.870.90
19:000.880.900.990.870.850.740.660.620.680.710.890.90
20:000.880.900.980.870.870.740.670.600.690.710.900.90
21:000.880.900.970.850.870.740.670.590.690.700.920.91
22:000.880.900.950.840.870.740.660.580.690.700.920.90
23:000.890.930.950.830.890.740.660.570.680.710.910.90
00:000.880.930.960.830.900.740.670.560.680.710.910.90
Table A2. Normalized solar power profile (hours/months).
Hour1234567891011 12 
01:000.000.000.000.000.000.000.000.000.000.000.000.00
02:000.000.000.000.000.000.000.000.000.000.000.000.00
03:000.000.000.000.000.000.000.000.000.000.000.000.00
04:000.000.000.000.000.000.000.000.000.000.000.000.00
05:000.000.000.000.000.000.000.000.000.000.000.000.00
06:000.000.000.000.000.020.020.010.000.000.000.000.00
07:000.000.000.010.050.110.110.100.070.030.010.000.00
08:000.000.020.100.240.300.310.300.280.230.060.030.01
09:000.050.140.370.450.520.530.540.520.450.400.210.05
10:000.330.460.570.650.710.720.740.730.630.580.480.34
11:000.520.600.720.790.850.870.890.880.750.690.590.52
12:000.590.690.810.880.930.950.980.970.830.750.660.57
13:000.620.720.860.900.940.971.000.990.840.760.660.58
14:000.570.690.820.860.900.920.960.940.800.680.580.53
15:000.470.590.700.740.770.810.850.820.670.550.460.41
16:000.320.430.530.560.590.640.680.640.490.370.280.25
17:000.100.230.320.350.380.420.450.410.290.150.060.04
18:000.000.020.090.130.160.190.210.170.070.010.000.00
19:000.000.000.000.010.030.050.050.020.000.000.000.00
20:000.000.000.000.000.000.000.000.000.000.000.000.00
21:000.000.000.000.000.000.000.000.000.000.000.000.00
22:000.000.000.000.000.000.000.000.000.000.000.000.00
23:000.000.000.000.000.000.000.000.000.000.000.000.00
00:000.000.000.000.000.000.000.000.000.000.000.000.00

References

  1. Tambunan, H.; Hakam, D.; Prahastono, I.; Pharmatrisanti, A.; Purnomoadi, A.; Aisyah, S.; Wicaksono, Y.; Sandy, I. The Challenges and Opportunities of Renewable Energy Source (RES) Penetration in Indonesia: Case Study of Java-Bali Power System. Energies 2020, 13, 5903. [Google Scholar] [CrossRef]
  2. Schultis, D.L. Comparison of Local Volt/var Control Strategies for PV Hosting Capacity Enhancement of Low Voltage Feeders. Energies 2019, 12, 1560. [Google Scholar] [CrossRef] [Green Version]
  3. Holjevac, N.; Baškarad, T.; Đaković, J.; Krpan, M.; Zidar, M.; Kuzle, I. Challenges of High Renewable Energy Sources Integration in Power Systems—The Case of Croatia. Energies 2021, 14, 1047. [Google Scholar] [CrossRef]
  4. Al-Masri, H.; Al-Quraan, A.; AbuElrub, A.; Ehsani, M. Optimal Coordination of Wind Power and Pumped Hydro Energy Storage. Energies 2019, 12, 4387. [Google Scholar] [CrossRef] [Green Version]
  5. Reboredo, J.; Ugolini, A.; Chen, Y. Interdependence between Renewable-Energy and Low-Carbon Stock Prices. Energies 2019, 12, 4461. [Google Scholar] [CrossRef] [Green Version]
  6. Mladenov, V.; Chobanov, V.; Georgiev, A. Impact of Renewable Energy Sources on Power System Flexibility Requirements. Energies 2021, 14, 2813. [Google Scholar] [CrossRef]
  7. Beltran, H.; Harrison, S.; Egea-Àlvarez, A.; Xu, L. Techno-Economic Assessment of Energy Storage Technologies for Inertia Response and Frequency Support from Wind Farms. Energies 2020, 13, 3421. [Google Scholar] [CrossRef]
  8. Ackermann, T.; Prevost, T.; Vittal, V.; Roscoe, A.J.; Matevosyan, J.; Miller, N. Paving the Way: A Future without Inertia Is Closer than You Think. IEEE Power Energy Mag. 2017, 15, 61–69. [Google Scholar] [CrossRef] [Green Version]
  9. ENTSO-E Technical Report. High Penetration of Power Electronic Interfaced Power Sources and the Potential Contribution of Grid Forming Converters. 2020. Available online: https://eepublicdownloads.entsoe.eu/clean-documents/Publications/SOC/High_Penetration_of_Power_Electronic_Interfaced_Power_Sources_and_the_Potential_Contribution_of_Grid_Forming_Converters.pdf (accessed on 1 July 2021).
  10. Curto, D.; Favuzza, S.; Franzitta, V.; Musca, R.; Navia, M.N.; Zizzo, G. Evaluation of the optimal renewable electricity mix for Lampedusa island: The adoption of a technical and economical methodology. J. Clean. Prod. 2020, 263, 121404. [Google Scholar] [CrossRef]
  11. Croce, D.; Giuliano, F.; Bonomolo, M.; Leone, G.; Musca, R.; Tinnirello, I. A decentralized load control architecture for smart energy consumption in small islands. Sustain. Cities Soc. 2020, 53, 101902. [Google Scholar] [CrossRef]
  12. Crainz, M.; Curto, D.; Franzitta, V.; Longo, S.; Montana, F.; Musca, R.; Sanseverino, E.R.; Telaretti, E. Flexibility services to minimize the electricity production from fossil fuels. A case study in a Mediterranean small island. Energies 2019, 12, 3492. [Google Scholar] [CrossRef] [Green Version]
  13. Favuzza, S.; Ippolito, M.; Massaro, F.; Mineo, L.; Musca, R.; Zizzo, G. New energy corridors in the euro-mediterranean area: The pivotal role of Sicily. Energies 2018, 11, 1415. [Google Scholar] [CrossRef] [Green Version]
  14. Tielens, P.; Hertem, D. The relevance of inertia in power systems. Renew. Sustain. Energy Rev. 2016, 55, 999–1009. [Google Scholar] [CrossRef]
  15. Bongiorno, M.; Favuzza, S.; Ippolito, M.G.; Musca, R.; Zizzo, G. Inertial Response of Isolated Power Networks with Wind Power Plants. In Proceedings of the 2019 IEEE PowerTech, Milano, Italy, 23–27 June 2019. [Google Scholar]
  16. Delille, G.; François, B.; Malarange, G. Dynamic Frequency Control Support by Energy Storage to Reduce the Impact of Wind and Solar Generation on Isolated Power System’s Inertia. IEEE Trans. Sustain. Energy 2012, 3, 931–939. [Google Scholar] [CrossRef]
  17. Bongiorno, M.; Favuzza, S.; Ippolito, M.G.; Musca, R.; Navia, M.S.N.; Sanseverino, E.R.; Zizzo, G. System Stability of a Small Island’s Network with Different Levels of Wind Power Penetration. In Proceedings of the IEEE 4th International Forum on Research and Technologies for Society and Industry, Palermo, Italy, 10–13 September 2018. [Google Scholar]
  18. Horne, J.; Flynn, D.; Littler, T. Frequency Stability Issues for Islanded Power Systems. In Proceedings of the IEEE PES Power Systems Conference and Exposition, New York, NY, USA, 10–13 October 2004. [Google Scholar]
  19. Bongiorno, M.; Favuzza, S.; Ippolito, M.G.; Musca, R.; Navia, M.S.N.; Sanseverino, E.R.; Zizzo, G. An Analysis of the Intertial Response of Small Isolated Power Systems in Presence of Generation from Renewable Energy Sources. In Proceedings of the IEEE 4th International Forum on Research and Technologies for Society and Industry, Palermo, Italy, 10–13 September 2018. [Google Scholar]
  20. Ippolito, M.G.; Silvestre, M.L.D.; Sanseverino, E.R.; Zizzo, G.; Graditi, G. Multi-objective optimized management of electrical energy storage systems in an islanded network with renewable energy sources under different design scenarios. Energy 2013, 64, 648–662. [Google Scholar] [CrossRef]
  21. Liu, W.; Luo, F.; Liu, Y.; Ding, W. Optimal Siting and Sizing of Distributed Generation Based on Improved Nondominated Sorting Genetic Algorithm II. Processes 2019, 7, 955. [Google Scholar] [CrossRef] [Green Version]
  22. Zhang, M.; Gan, M.; Li, L. Sizing and Siting of Distributed Generators and Energy Storage in a Microgrid Considering Plug-in Electric Vehicles. Energies 2019, 12, 2293. [Google Scholar] [CrossRef] [Green Version]
  23. Ghimire, S.; Alizadeh, S. Developing a Decision Tree Algorithm for Wind Power Plants Siting and Sizing in Distribution Networks. Energies 2021, 14, 2293. [Google Scholar] [CrossRef]
  24. Karunarathne, E.; Pasupuleti, J.; Ekanayake, J.; Almeida, D. The Optimal Placement and Sizing of Distributed Generation in an Active Distribution Network with Several Soft Open Points. Energies 2021, 14, 1084. [Google Scholar] [CrossRef]
  25. Global Wind Atlas. Available online: https://globalwindatlas.info/ (accessed on 1 May 2021).
  26. Global Solar Atlas. Available online: https://globalsolaratlas.info/ (accessed on 1 May 2021).
  27. ENTSO-E SPD (System Protection & Dynamics) Subgroup. Documentation on Controller Tests in Test Grid Configurations; ENTSO-E: Brussels, Belgium, 2013; Available online: https://eepublicdownloads.entsoe.eu/clean-documents/pre2015/publications/entsoe/RG_SOC_CE/131127_Controller_Test_Report.pdf (accessed on 1 July 2021).
  28. IEC 61400-27-1. Wind Energy Generation Systems—Part 27-1: Electrical Simulation Models—Generic Models, 2nd ed.; International Electrotechnical Commission (IEC): Genève, Switzerland, 2020. [Google Scholar]
  29. CIGRE Technical Brochure. Modelling of Inverter-Based Generation for Power System Dynamic Studies; Joint Working Group C4/C6.35/CIRED. 2018. Available online: https://e-cigre.org/publication/727-modelling-of-inverter-based-generation-for-power-system-dynamic-studies (accessed on 1 July 2021).
  30. Dreidy, M.; Mokhlis, H.; Mekhilef, S. Inertia response and frequency control techniques for renewable energy sources: A review. Renew. Sustain. Energy Rev. 2017, 69, 144–155. [Google Scholar] [CrossRef]
  31. Rocabert, J.; Luna, A.; Blaabjerg, F.; Rodriguez, P. Control of Power Converters in AC Microgrids. IEEE Trans. Power Electron. 2012, 27, 4734–4749. [Google Scholar] [CrossRef]
  32. Knap, V.; Chaudhary, S.K.; Stroe, D.L.; Swierczynski, M.J.; Craciun, B.I.; Teodorescu, R. Sizing of an Energy Storage System for Grid Inertial Response and Primary Frequency Reserve. IEEE Trans. Power Syst. 2016, 31, 3447–3456. [Google Scholar] [CrossRef] [Green Version]
  33. Wu, Z.; Gao, W.; Gao, T.; Yan, W.; Zhang, H.; Yan, S.; Wang, X. State-of-the-art review on frequency response of wind power plants in power systems. J. Mod. Power Syst. Clean Energy 2018, 6, 1–16. [Google Scholar] [CrossRef] [Green Version]
  34. Kerdphol, T.; Rahman, F.S.; Watanabe, M.; Mitani, Y.; Turschner, D.; Beck, H.P. Enhanced Virtual Inertia Control Based on Derivative Technique to Emulate Simultaneous Inertia and Damping Properties for Microgrid Frequency Regulation. IEEE Access 2019, 7, 14422–14433. [Google Scholar] [CrossRef]
  35. Yu, M.; Dyśko, A.; Booth, C.D.; Roscoe, A.; Zhu, J. A review of control methods for providing frequency response in VSC-HVDC transmission systems. In Proceedings of the 49th International Universities Power Engineering Conference (UPEC) , Cluj-Napoca, Romania, 2–5 September 2014. [Google Scholar]
  36. Li, J.; Xiong, R.; Yang, Q.; Liang, F.; Zhang, M.; Yuan, W. Design/test of a hybrid energy storage system for primary frequency control using a dynamic droop method in an isolated microgrid power system. Appl. Energy 2017, 201, 257–269. [Google Scholar] [CrossRef]
  37. Pinthurat, W.; Hredzak, B. Decentralized Frequency Control of Battery Energy Storage Systems Distributed in Isolated Microgrid. Energies 2020, 13, 3026. [Google Scholar] [CrossRef]
  38. Xu, H.; Pan, Z. An adaptive droop control strategy of energy storage control for microgrid with wind power and energy storage systems. In Proceedings of the 20th International Conference on Electrical Machines and Systems (ICEMS), Sydney, Australia, 11–14 August 2017. [Google Scholar]
  39. Zhang, Y. Battery energy storage operation with adaptive droop control. In Proceedings of the IEEE Conference on Control Technology and Applications (CCTA), Maui, HI, USA, 27–30 August 2017. [Google Scholar]
  40. Xing, W.; Wang, H.; Lu, L.; Wang, S.; Ouyang, M. An adaptive droop control for distributed battery energy storage systems in microgrids with DAB converters. Int. J. Electr. Power Energy Syst. 2021, 130. [Google Scholar] [CrossRef]
  41. NEPLAN Power Systems Analysis Software. Available online: https://www.neplan.ch/en-products/ (accessed on 1 July 2021).
  42. Fang, J.; Li, H.; Tang, Y.; Blaabjerg, F. Distributed Power System Virtual Inertia Implemented by Grid-Connected Power Converters. IEEE Trans. Power Electron. 2018, 33, 8488–8499. [Google Scholar] [CrossRef] [Green Version]
Figure 1. Geographic map and simplified diagram of the electric grid of Pantelleria.
Energies 14 04391 g001
Figure 2. Schematic outline of the autonomous power system under investigation, with existing system (black) and future arrangements (green).
Energies 14 04391 g002
Figure 3. Average power profiles for the island of Pantelleria, given per month and per hour: (a) load demand; (b) wind generation; (c) solar generation.
Energies 14 04391 g003
Figure 4. Selected power profiles for the considered scenarios: load demand (orange) and aggregated RES generation (light blue).
Energies 14 04391 g004
Figure 5. Block diagram of AVR controller.
Energies 14 04391 g005
Figure 6. Block diagram of turbine governor controller.
Energies 14 04391 g006
Figure 7. Dynamic model representation of inverter-based generation sources.
Energies 14 04391 g007
Figure 8. Block diagram of auxiliary controls for frequency support.
Energies 14 04391 g008
Figure 9. Proposed frequency droop characteristics for storage systems in different operating mode ( σ 1 > σ 2 ).
Energies 14 04391 g009
Figure 10. Proposed frequency droop differentiated characteristics for both under-frequency and over-frequency transients ( σ 1 > σ 2 ).
Energies 14 04391 g010
Figure 11. Flowchart of the proposed frequency droop control strategy for storage units.
Energies 14 04391 g011
Figure 12. Implementation of the island system in the analysis software NEPLAN.
Energies 14 04391 g012
Figure 13. Results of scenario HL-HR (high load and high RES generation).
Energies 14 04391 g013
Figure 14. Results of scenario HL-LR (high load and low RES generation).
Energies 14 04391 g014
Figure 15. Results of scenario LL-HR (low load and high RES generation).
Energies 14 04391 g015
Figure 16. Results of scenario LL-LR (low load and low RES generation).
Energies 14 04391 g016
Figure 17. Contributions of WT and storage units to synthetic inertia (top charts) and primary reserve (bottom charts) for scenario HL-HR under different control assumptions.
Energies 14 04391 g017
Table 1. Table summary of the analysis scenarios.
ScenarioDescription
HL-HRHigh load (8 MW) and high RES generation (4 MW)
2 storage units in discharging mode, 2 in charging mode
HL-LRHigh load (8 MW) and low RES generation (<1 MW)
All 4 storage units in discharging mode
LL-HRLow load (4 MW) and high RES generation (4 MW)
All 4 storage units in charging mode
LL-LRLow load (4 MW) and low RES generation (<1 MW)
2 storage units in discharging mode, 2 in charging mode
Table 2. Model parameters of converters interfacing storage units and RES generation.
ParameterDescriptionValue
T L P F p time constant of active power low-pass filter0.01 s
T L P F q time constant of reactive power low-pass filter0.01 s
d p m i n minimum ramp rate for active power reference−1 pu/s
d p m a x maximum ramp rate for active power reference1 pu/s
p m i n minimum value for active power reference−1.1 pu
p m a x maximum value for active power reference1.1 pu
K p P L L proportional gain of PLL60 pu
K i P L L integral gain of PLL900 pu
T s o u r c e time constant of physical generation source0.01 s
K I R gain of synthetic inertia6 pu
T I R time constant of filtered derivative for synthetic inertia0.01 s
K P R 1 gain of primary reserve (discharging mode)20 pu
K P R 2 gain of primary reserve (charging mode)250 pu
T P R time constant of low-pass filter for primary reserve0.001 s
f D B m i n minimum threshold of frequency dead-band49.9 Hz
f D B m a x maximum threshold of frequency dead-band50.1 Hz
Table 3. Table summary of the simulation results with frequency metrics.
Scenariofmin (Hz)RoCoF (Hz/s)
Synchronous generation (base)49.72−0.37
High load and high RES (HL-HR)
Storage and WTunstableunstable
IR+PR in all storage49.53−1.13
IR+PR in all storage and all WT49.79−0.63
Proposed droop control in two storage49.81−1.13
Proposed droop control in two storage, IR all WT49.93−0.69
High load and low RES (HL-LR)
Storage and WTunstableunstable
IR+PR in all storage49.46−0.91
IR+PR in all storage and all WT49.80−0.56
Proposed droop control in two storage49.46−0.91
Proposed droop control in two storage, IR all WT49.70−0.61
Low load and high RES (LL-HR)
Storage and WT49.10−1.22
IR+PR in all storage49.55−1.19
IR+PR in all storage and all WT49.79−0.63
Proposed droop control in two storage49.80−1.19
Proposed droop control in two storage, IR all WT49.92−0.69
Low load and low RES (LL-LR)
Storage and WT49.10−1.20
IR+PR in all storage49.55−1.17
IR+PR in all storage and all WT49.79−0.62
Proposed droop control in two storage49.80−1.17
Proposed droop control in two storage, IR all WT49.93−0.68
Publisher’s Note: MDPI stays neutral with regard to jurisdictional claims in published maps and institutional affiliations.

