1. Introduction
Several countries set boundaries for adequate and non-adequate voltage on a permanent basis. In 2010, the European Committee for Electrotechnical Standardization (CENELEC), European Committee for Standardization (CEN) and the European Telecommunications Standards Institute (ETSI) establish the main legislative instrument, the European Norm CEI/50160/EN, this defines the voltage characteristics of electricity supplied by public electricity networks and the permissible voltage variation with a 10% tolerance above or below the nominal voltage values [
1].
Among american guidelines established by American National Institute of Standardization, ANSI C84.1 stands out, revised in 2016 [
2]. In Canada, each electricity distribution company has autonomy to establish its procedures and standards, with CAN/CSA-C61000 and IEEE 519 being the most used [
2,
3,
4,
5,
6]. Japanese Industrial Standardization (JIS) adopts the JISC 61000 standard for the electric power sector regulation, which is an IEC standards adaptation. In South Africa, the National Electricity Regulator (NER), formed by national electricity supply industry representatives, recommends the NRS 048 standard that regulates the electricity sector and is also based on the IEC, CENELEC and IEEE standards, approved in 1996 and updated in 2003 [
7]. In Brazil, the National Electric System Electricity Distribution Procedures (PRODIST) defines indicators and penalties referring to permanent voltage [
8].
The ANSI C84.1 standard establishes nominal voltage values and operational tolerances for systems ranging from 100 V to 1200 kV, classifying the voltage level in either service and utilization voltage [
2]. Among IEC 61000 documents, the following stand out: IEC 61000-3-3 which standardizes fluctuation levels and voltage variations in distribution power grid [
9], IEC TR 61000-3-13 which defines requirements for unbalanced installations connection in transmission and distribution power grid [
10] and IEC 61000-4-30 which establishes methods for measuring power quality indicators [
3,
11]. The IEEE standards are international references, among them: IEEE 1159 which establishes a procedure referring to power system disturbances and its causes [
6], IEEE 141 on voltage parameters in distribution systems [
12] and IEEE 1564 which is used as a guide for calculating voltage indexes applied to electrical power systems [
13]. PRODIST establishes in Brazil the appropriate, precarious and critical voltage ranges that make it possible to determine precarious voltage transgression (DRP) relative duration indicator and critical voltage transgression (DRC) relative duration indicator [
8].
Currently, electricity utilities providers require distribution power grid study, monitoring, simulation and adequacy regarding voltage violations. The voltage level behavior in low voltage (LV) has been changing due to new types of loads such as electric boilers, electric vehicles and insertion of distributed generation (DG), which can cause voltage levels outside the suitable range, making it a challenge for the electricity sector [
14,
15,
16]. Brinkel et al. [
17] estates, the need to develop methodologies to predict the voltage level behavior in view of the new low voltage network profile and to avoid low quality power supply is reinforced [
18,
19].
The problem related to voltage analysis in distribution systems is target of studies that seek mechanisms to keep voltage within established limits, aiming to minimize: (i) switching in voltage regulation equipment and reactive power control [
20], (ii) integrated studies for voltage and reactive energy problems [
21], (iii) interruption or loss of loads sensitive to voltage variation [
22,
23] among other problems. Studies are increasingly necessary to mitigate impacts caused by tension variation on consumers, avoiding equipment damage, production process interruption and regulatory remedies [
24].
In most countries the electricity utilities service quality is assessed in the aspects of: (1) supply continuity, (2) customer service quality and (3) electrical power quality [
24]. These three aspects correspond to: (a) electricity availability to the consumer and, if characterized by interruptions, duration and frequency parameters, (b) quality of service that covers commercial relationship and services provision between utilities provider and consumer and (c) electricity quality distributed within limits and indicators established in each country specific resolutions, avoiding: (i) harmonic distortion, (ii) low power factor and (iii) fluctuations, imbalance and high voltage variations [
25,
26].
Works have been developed in order to analyze and indicate best methods for monitoring, simulating and adjusting the distribution power grid regarding voltage violations [
27,
28,
29,
30]. Most use optimization techniques through simulation and/or methods to predict network voltage controls [
31,
32,
33]. Therefore, a methodology development that models dynamic behavior of low voltage connected loads, identifies voltage non-conformity points by priority levels, compare electricity quality indicators established by standards, simulate and adapt best intervention solutions considering mainly minimization of disturbances and economic aspects, building a computational tool that automatically uses the concessionaires databases, is the innovation and originality of this work.
The main objective of this work is to make available a computational tool that allows identifying in an agile way the places with voltage transgression, listing all consumers connected to medium and low voltage, estimating the exposed penalties, optimizing the time and costs of adapting the distribution power grid to voltage violations. This way, preventing the distributor from carrying out high financial cost works, such as network expanding, cable replacement, or inserting voltage regulators. This tool’s applicability is to help companies, which have tens or hundreds of miles of distribution power grid, to carry out corrective, preventive, and predictive prevention through monitoring.
This tool’s relevance is the need for energy distribution companies to know the voltage level quality supplied to each consumer, including those connected to low voltage and their respective exposure to mandatory financial reimbursement, as provided by the legislation. The great extent of the electrical networks and costs to carry out field voltage level measurements make it impossible for companies to intensify proactive behavior regarding voltage level quality.
Thus, the proposed software is an option to massively assess the voltage level behavior in the distribution power grid, allowing distribution companies to optimize their resources, costs and minimize compensation impact for voltage transgressions. This entire process can be considered a clinical analysis of the adequacy of the distribution power grid regarding voltage violations and can be used by any electricity distributor that has data available in databases.
The structure of this work is:
Section 2 presents some necessary concepts for understanding the methodology and results with theoretical basis in brief description,
Section 3 presents the methodology proposed and
Section 4 shows results obtained with application of the proposed methodology.
Section 5 discuss some results and makes a general comment on the work and
Section 6 presents the conclusion.
2. Theoretical Background
This section presents the data extraction from electricity provider databases, modeling for calculating voltage level and load estimation. It also presents the main practices and demands of the electrical sector on voltage level compliance in a permanent regime and elements that allow obtaining necessary data to identify the problem and define the possible modeling and implementation of actions to adjust the voltage level.
2.1. Power Distributors Databases Data Extractor
Voltage variations have always been present in energy systems, however, in recent decades the impacts of these events are increasingly inconvenient. The scientific literature presents studies that seek diagnosis and prevention, but additional efforts are still needed. Evidence with reliable data is increasingly important, since there are limitations of this diagnosis in the documentation and availability of data [
22].
Electricity companies are expanding data access from sources such as: smart meters, frequency disturbance recorders (FDR), phase measurement units (PMU), area monitoring systems (WAMS), data acquisition systems (SCADA), power failure management systems, field devices, customer billing software in addition to consumer provided data [
34]. The need to optimize resources and better serve customers has resulted in a greater effort to take advantage of information available in databases in order to carry out simulations [
35]. There are some tools for data extraction, however, the main problem is data quality, and it is necessary to implement validation routines to avoid obtaining answers that are inconsistent with company’s reality [
28].
Even if data extraction finds all values requested in the queries, numerous errors can compromise results quality. These errors are due to inconsistencies in provider’s databases and relate to facts such as: (i) failures in notes during field data collection phase, (ii) data recording phase errors, (iii) same variable with different values in different databases, (iv) empty or null variable and (v) variable without electrical connection. The registration critical failures relate to correct identification of phases connected to low voltage segments, as of branches, consumers and distribution transformers secondary [
32].
The registration failures between the operating and commercial units of providers are normal and numerous [
31]. In commercial system a given customer is connected to
A Phase, while in the operational database the same customer is connected to
B Phase. There are normalization problems between measurement units, where are equipment with W,
,
units. In another example, high voltage equipment registered as 13.5 in one database and as 13.500 in another. Due to modernization of electricity sector regulation, it is common for some registries to have missing data until a certain date. Other records have other missing data until another date, in accordance with current legislation. With each new data requirement, the old data must be maintained, creating a new empty value chain prior to the [
34] obligation. The use of computational techniques can correct historical gaps. Specifically, there are data not registered in some providers, such as harmonics, load curves, generation curves, among others [
31].
2.2. Distribution System Modeling
Load flow analysis is one of the frequent studies carried out on power systems, serving for: (i) operation planning, (ii) system expansion, stability complementing, optimization, reliability studies and (iii) determination of the power transmission limits of the electrical system, among others. Every power flow study assumes that the system operates on a permanent basis. This means that you want to know the operating conditions of the system for some previously assumed conditions, such as constant load, constant generation and the invariant topology [
36].
When calculating power flow, in each system bus, expressions for the active and reactive powers are known, while six variables are unknown: (i) generated active and reactive powers, (ii) consumed active and reactive powers, and (iii) phase angle and voltage modulus. The powers on each bus represent the sum of all power flows on the lines connected to each bus. Once the initial variables are defined and convergence/comparison tests have been completed, the stress levels in the bus become known, allowing comparison with established regulatory limits [
37].
In power flow study for modeling the power line transmission/distribution, each node bus type is defined in the system, which can be: (i) load bus (PQ), (ii) controlled tension bus (PV) and (iii) bus swing (V
). The PQ bus feeds a connected load and has no generation available, with: (i) known active and reactive power consumed, (ii) generated active and reactive power equal to zero and (iii) phase angle and voltage modulus. For this bus type, all interest variables are implicit, and iterative calculations obtains the others [
38].
The loads estimation is another important variable for simulation, since the model must contemplate each of the classes, type of load and corresponding load curves that are divided by consumption range. In most countries, the modeled load curves are usually based on the curves acquired in the annual measurement campaigns, which provides fidelity to load estimate for voltage simulations in steady state [
39]. After calculating the power flow, we must know regulatory requirements to define the actions for monitoring and controlling the electricity quality. There are some standards and procedures that are international references for distribution voltage level quality.
2.3. Main Actions for Electric Power Distribution Adjustment
Adjusting consumers supplied voltage can use different actions. Some of most used measures to reduce voltage drop across feeders are: (i) reduce feeder length, (ii) raise power factor by installing a capacitor bank, (iii) convert single-phase sections to three-phase, (iv) redistribute the load, (v) circuits balancing and (vi) conductor resizing to a larger diameter. Employing new meter allocation techniques to allow network status estimation in a more assertive way and with less processing time and helps in power quality control dynamics [
40].
One of most used actions is installation of capacitor banks in parallel that allows the constant increase of feeder voltage, as well as a decrease in voltage variation and elevation regardless of load current. Under light load, fixed capacitors can raise the voltage above permitted limits, therefore, switched capacitor banks is required. However, fixed capacitors are easier to install and dimension when compared to switching capacitors, in addition to being cheaper [
41]. Another action is installation of voltage regulators at points along the feeder. This action is performed when voltage cannot be regulated by the substation and installation of a fixed voltage improvement device is not efficient for load intervals throughout the day [
42].
Some actions can still be performed at the substation, such as three-phase regulators installation, which control all three phases simultaneously. They can have star connections to earth, open triangle and closed triangle. In star configuration with earth and four conductors, three single-phase regulators are generally used, which connect the line to neutral. Each regulator independently controls the voltage, improving control of unbalanced system. In closed triangle configuration, three regulators are connected phase to phase. This arrangement allows the regulation range to be increased from
to
. In open triangle configuration, only two single-phase regulators are required, connecting one phase to another [
43]. Knowing that loads connected to distribution power grid vary over the hours of the day and cause variations in voltage, it is necessary to control these expected variations. To prevent this, one of the options is the transformers in primary substations that have On-Load Tap Changer (OLTC) [
36].
3. Methodology
This section presents the proposed methodology for analyzing and adjusting the distribution power grid for voltage violations. The data extraction interface is built and extracted data is used to perform computer simulations in order to identify voltage non-conformities points, indicate which interventions must be carried out to normalize them within indicators established by regulatory agency, in an attempt to achieve an improvement in supplied voltage level quality and reduce operating costs.
3.1. Data Extractor Development to Simulation Database Generation
For database (BaD) construction, an extraction interface (ITL) is developed, which fetches data from utility provider’s databases (BD) using Structured Query Language (SQL). SQL-ADO.NET is used, which is a .NET platform tool and provides access to relational and application data. The search is carried out from highest to smallest granularity, i.e., when the interface is asked for data from a specific substation to be simulated, it simultaneously searches for all data related to said substation and stores it in the form of objects that represent and abstract real world behavior, for example: (i) high voltage network (HV), (ii) medium voltage network (MV), (iii) low voltage network (LV), (iv) consumer unit (UC), (v) equipment and cable data and (vi) several others.
With consolidated data in hand, these are processed and saved in BaD using the Hibernate framework, which performs relational ⟶ object mapping. The Hibernate framework makes it easy to map attributes of objects between DB and BaD. Portability is the main feature of the proposed interface, which is a non-functional requirement. This allows data to be recorded in the BaD, regardless of BD technologies or the utility provider. Thus, the proposed software can be used with any database containing values of variables used for simulation.
The database management system (DBMS) used at BaD is from Oracle, it performs the communication between simulator and interface, being responsible for managing data access, manipulation and organization. The libraries used are from Object-relational mapping (ORM) frameworks, which facilitates programming by creating tables in BaD from classes, and records of each table are represented as instances of corresponding classes, i.e., for each new class used the corresponding values are recorded in BaD. Since it is an ORM, it is possible to execute it in any relational database.
Figure 1 illustrates the data flow of the Proposed System, where the presentation layer is the Graphical User Interface (GUI), through which data requests are made and returns the results obtained. In the deal layer are functions and rules that can be reused by different parts of the application and even by different applications. The data in the deal layer is volatile, being composed of BaD and the classes that manipulate them. This layer receives requests from the COM interface in which the simulator is inserted and from the presentation interface, its methods execute the requests in the DB and store them in the BaD. In BaD, the necessary data for the simulation (requested from the DB) and the results obtained from the simulations are stored. The COM interface receives data from the deal layer, organizes it, and delivers it to the simulator, which processes the data and returns the results to the COM interface that forwards it to the deal layer.
The system is developed in the 3-Tier Model, aiming in obtaining requests faster response and greater control in system size increase, in case new calculation modules connections are necessary [
44,
45]. In 3-Tier Model the presentation logic is separated into its own logical and physical layer. Separation into logical layers makes more flexible software, decreasing coupling and allowing parts to be changed independently, easing up maintenance, portability, and automatic access to the databases [
46,
47].
3.2. Strategy to Find Consumer Units with Voltage Transgression
The adopted strategy to find distribution power grid locations with voltage levels outside the appropriate range is to calculate the power flow sequence for each instant
t, defined according to the necessary precision, using typical load curves and compare with the limit set for the corresponding voltage level, to which the consumer unit is connected. The software chosen as voltage level simulation engine is the Open Distribution System Simulator (OpenDSS), as it is internationally validated and used by several electricity distribution regulators in the world [
48].
The OpenDSS simulator integration is performed through the Component Object Model (COM) interface and command line, which allows development of a customized solution and personalized creation of Dynamic-Link Library (DLL) to interface with the Proposed System.
When running OpenDSS, algorithms are generated in ∗.DSS format for: (i) feeder, (ii) linecode, (iii) low voltage (LV) and medium voltage (MV) segment, (iv) branch, (v) transformer, (vi) loadshape, (vii) LV and MV consumer and (viii) Universal Transverse Mercator (UTM) coordinates. The system should store simulated data in BaD at the simulation end.
In OpenDSS, studies using the Monte Carlo method previously depend on the Random variable setting: (Uniform | Gaussian | Lognormal | None). When selecting Uniform, the random variables are generated in the interval , in the case of selecting Gaussian or Lognormal, the random variables are generated considering the mean and standard deviation defined by the user. Through the loadshape object, the load curves are defined, which is a support element with multipliers in the interval , applied to active power value obtained in the measurement campaign (field data collection) and represents load variation along a desired time period. In Master.dss the load curves are defined using LoadShape.dss and loads correspond to ConsumidorMT.dss and ConsumidorBT.dss algorithms. These can be defined in three ways: (i) by nominal active power [] and by nominal reactive power [], (ii) by the nominal apparent power [] and by power factor and (iii) by nominal active power [ and by . In OpenDSS, each load model must be represented by discrete values indicated at the simulation beginning.
Through simulation operation, results are obtained for each network point and load time. The Proposed System tests and validation must be carried out in two parts of the network: (i) MV network results and (ii) LV network results. The MV network results will be validated by comparing the voltage level profile simulated by the proposed tool with the voltage level profile obtained by other software used and validated by the distribution company. In this part of the validation, it is necessary to analyze the difference in voltage values between both software (commercial software used by the power distribution company and the proposed software), per phase, and in per unit (p.u.) system. To validate the proposed methodology, the difference in voltage values between the two software cannot be significant and, consequently, the behavior of the curve should be similar. To validate the results in the LV network, the voltage level results obtained by the Proposed System will be compared with field measurements carried out by the power distribution company.
After the Proposed System test and validation, it is possible to perform results analysis and comparison in each consumption unit, observing the established regulatory limits for corresponding voltage level at each simulated point or bus and identifying whether there has been a voltage level breach. For example, for a power distribution feeder with thousands of consumers and tens of kilometers of MV and LV network, the proposed tool should allow identifying which consumers and locations in said network that have voltage level outside the established range as appropriate by local regulatory authority.
For this identification, the proposed system must generate a report with each consumer and transformer unit where the transgression occurs, containing: (i) voltage levels, (ii) voltage transgression indicator and (iii) financial compensation value, according to regulation. In addition, the tool should allow visualization on the georeferenced map, in different colors, the distribution transformers connected to consumer units with voltage transgression, simulating network optimizations and interventions in order to correct or minimize unsuitable voltages levels.
3.3. Action Implementation to Adjust Electrical Power Distribution Voltage
After analyzing the voltages with regulatory limits in mind and identifying consumer units with transgressions, it is possible to correct/minimize those. Thus, six actions are implemented to simulate interventions in concessionaire’s distribution power grid: (i) adjust the TAP of there transformers, (ii) replace/insert transformer, (iii) close the loop, (iv) replace the cable by a larger diameter one, (v) insert capacitor bank and (vi) insert voltage regulators. In the Proposed System, actions can be tested/simulated in search for the cheaper action, e.g., distribution TAP adjustment. After performing each of the six actions, it is possible to choose the one that best suits the situation of the distribution power grid at the point under study.
Other actions can be implemented, such as the transforming action that shows data modifying possibility: (i) type of regulator (single-phase or three-phase), (ii) bus, (iii) star or delta connection, (iv) phases A, B, C and (v) . The distribution power grid maps must be presented with display filters for the LV, MV and transformers segments, in which they are related to the data display. It should also present filters to export map in 4k and Full HD, generating Portable Network Graphics (PNG) extension file.
In the Proposed System it is possible to simulate more than one action at a time to adjust the network voltage level. On occasion, it is necessary to combine multiple actions to correct the voltage profile. Thus, one can evaluate the applied actions effectiveness by observing/comparing the results obtained in the distribution power grid structure before and after the actions computational implementation.
4. Results
This section presents obtained results by applying the proposed methodology for analyzing the voltage level in a steady state that allows to compare the simulation results with the local regulator standardized parameters. Quantitative and qualitative analysis of voltage violation, obtained data verification and validation were carried out, in addition to case studies on the use of optimization to voltage levels adjustment and discussions regarding the studies.
4.1. Voltage Violations Statistics: A Brazilian Power Grid Study
In Brazil, on a quarterly basis, the regulatory authority, the National Electric Energy Agency (ANEEL), asks electricity provider companies for information on voltage levels of some of the consumer units (UC) chosen at random. For this, companies carry out measurements at transformer stations that serve such UCs, a process known as “Sample Campaign”. Voltage is measured in each UC for seven days, totaling 168 h and 1008 valid readings. The data used in this work was collected at ENEL Distribution Goias electricity provider company, Goias/Brazil, which is responsible for distribution and sale of electricity in 237 municipalities in state of Goiás/Brazil, the distributor operates in a concession area with approximately 337 thousand km2, providing voltage at Volts for LV customers and voltages of 13.8 kV, 34.5 kV, 69 kV and 138 kV for the UCs that need to be serviced in MV and high voltage (HV). ENEL Distribution S.A. has more than 3 million UCs in this state of Brazil, and collects information from 330 UCs per quarter, with right to purge 10% of these records.
The Sample Campaign purpose is to identify the percentage of provider’s supplied voltage within ranges:
adequate (within desired range),
precarious (slightly outside desired range) and
critical (critically outside desired range), according to rules established in PRODIST Module 8. PRODIST Module 8 establishes that electricity distribution companies must adapt voltage levels supplied to customers and, consequently, meet the indicators of Precarious Voltage Transgression Relative Duration (DRP) and Relative Duration of Critical Stress Transgression (DRC), which violation implies in compensation payment to affected clients. In Brazil, the nominal voltage limits for a power supply lower than 1 kV are: (i) 92% to 105% is considered adequate, (ii) less than 87% to 92% or over than 105% to 106% is considered precarious and (iii) less than 87% or over than 106% is considered critical [
8].
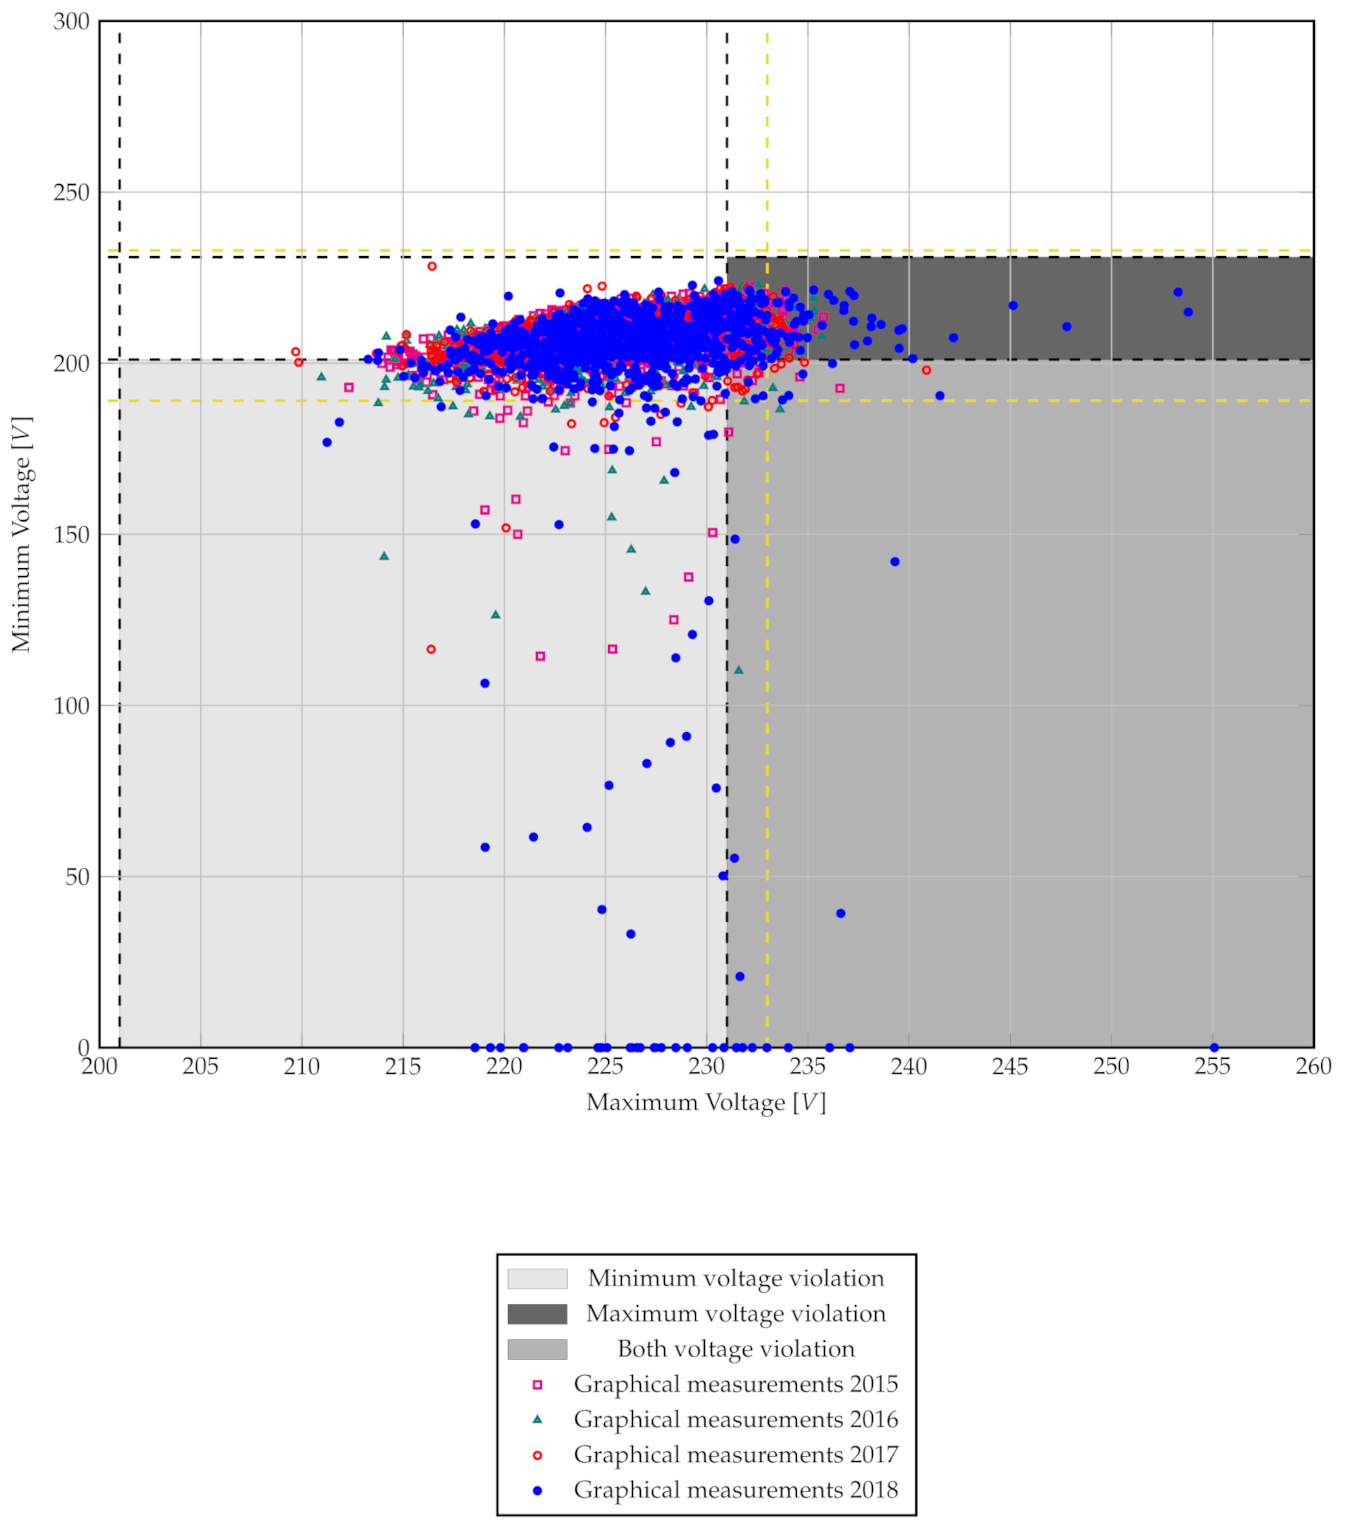
In order to present the problem verified by Brazilian electricity provider companies,
Figure 2 shows data referring to Sample Campaigns from 2015 to 2018 carried out by ENEL Distribution S.A., in which maximum and/or minimum voltage violation points are observed. The dashed lines represent adequacy limits to quality standards given by ANEEL [
8], i.e., reference values for voltage compliance in steady-state. The black dashed line refers to the limit between adequate and precarious voltage levels and the orange one limits the precarious and critical voltage levels [
49]. For the definition of voltage levels, there is, e.g., for the 220
V voltage: adequate
, precarious
or
, and critical
or
, in which
is the voltage read in the consumer. For each nominal voltage, there is a specific range.
The voltage transgression cases occupy the gray color regions (
Figure 2) and represent more than 20% of total samples obtained for the years 2015 to 2018, as shown in
Table 1. There was an increase of 68% of transgression cases in the 2015–2018 quadrennium, in which voltage violations, precarious and critical (both), are approximately 27% in 2015, 25% in 2016, 23% in 2017 and 36% in 2018. There is a gradual increase in cases of minimum and maximum voltage violations, as well as both during the period analyzed. Considering these results and the Brazil regulatory agency determinations, it is necessary to take action that allows preventive and proactive behavior by distribution companies.
4.2. Information Management and Data Collection
To meet the gradual and increasingly demanding regulatory requirements, worldwide efforts are needed. In Brazil, e.g., these efforts resulted in different management systems and with multiple databases, such as: (i) technical, (ii) commercial, (iii) registration, (iv) operation, (v) maintenance, (vi) construction, (vii) projects among others. These utilities provider’s databases must store information such as: (i) bus, poles and transformers position, (ii) distances between bus and poles, (iii) cables resistance and reactance, (iv) consumer data, (v) consumption profile among several other information. To perform simulations, it is necessary to first find out what the input variables are and in which database these variables are. Pieces of information related to databases are described in
Table 2.
This work data gathering was performed in four databases from ENEL Distribution S.A. Some input variables needed by the Proposed System have their values already available in the database, others need calculations and treatments before they can be used. Most variables that compose the feeders are in the technical database and are the variables that identify the circuit: (i) substation name, (ii) feeder name, (iii) voltage level, (iv) coupling point, (v) conductor code, (vi) conductor resistance per , (vii) conductor reactance per and (viii) maximum allowable current.
The technical database contains variables for building the electrical network and for calculating MV and LV voltage flow network, such as: (i) identification code, (ii) quantity phase, (iii) coupling code of node 1 and node 2, (iv) conductor code, (v) conductor resistance per km, (vi) conductor reactance per km and (vii) maximum allowable current. The transformers data for power flow calculation are: (i) identification code, (ii) number of phases in the primary, (iii) reactance, (iv) percentage loss at full load, (v) percentage loss at no load, (vi) primary and secondary coupling code, (vii) rated power, (viii) potential adjustment terminal (TAP) position and (ix) secondary nominal voltage.
For MV and LV segments, variables are in the technical and georeferenced databases. These data are used to identify the distance between nodes and build electrical network map, being: (i) coupling node code and (ii) Universal Transverse Mercator (UTM) geographic coordinate on the x axis and y axis. For the MV and LV consumer unit elements, other data are part of commercial database: (i) measured power in kW at the MV consumer unit, (ii) consumption measured in at the LV consumer unit and (iii) consumer unit class or type. To complete the UC element input variables, typical curves by class and consumption range are required, with the types of UC being: (i) MV consumer, (ii) residential consumer, (iii) rural consumer, (iv) industrial consumer, (v) commercial consumer and (vi) public service.
Data extraction from databases is performed after the user selects the distribution substation he wishes to simulate, through the integrated module that allows selecting and downloading the desired substation and feeder, provided that it exists in substation provider list. The extraction interface simultaneously searches for all variables necessary for simulation and that are related to the chosen substation and feeder. When extracting data, analyzing the information quality is important, as not all databases are complete, requiring treatment in multiple cases. Thus, according to each stage, as the desired data is extracted, it is necessary to treat them using criteria in order to fill or correct the flaws that may impair the simulation quality.
The most common treatments found in the studied databases were: (i) LV consumer with wrong or missing branch phase information, e.g., consumer with A and neutral () phase coupled to extension with phase C and neutral (), (ii) extension with phase information wrong or missing in the transformer’s LV segment, e.g., extension with phase connected to phase segment, (iii) different data for the same variable in different databases, e.g., UC consumption in kWh, (iv) null or empty variable, (v) variable without electrical connection, e.g., isolated pole, among others. Most inconsistent data relate to field gathered information and registered in the database later.
4.3. Simulation for Case Studies Testing
The proposed methodology after simulation denotes: maximum stress, minimum stress, stress level transgression index and financial compensation exposure value resulting from non-compliance with regulatory requirements. To identify whether the simulated voltage is meeting regulatory requirements or not, it is necessary to configure voltage values according to local legislation in parameter module. In this work, the regulatory limits for voltage in steady state established by ANEEL were used, which allows calculation of the DRP and DRC indexes [
8]. The substation-
from feeder-
data from one of ENEL Distribution S.A. substations was used for the first case study. The feeder-
have a large network extension and is predominantly urban.
Table 3 has data contained in feeder-
database,
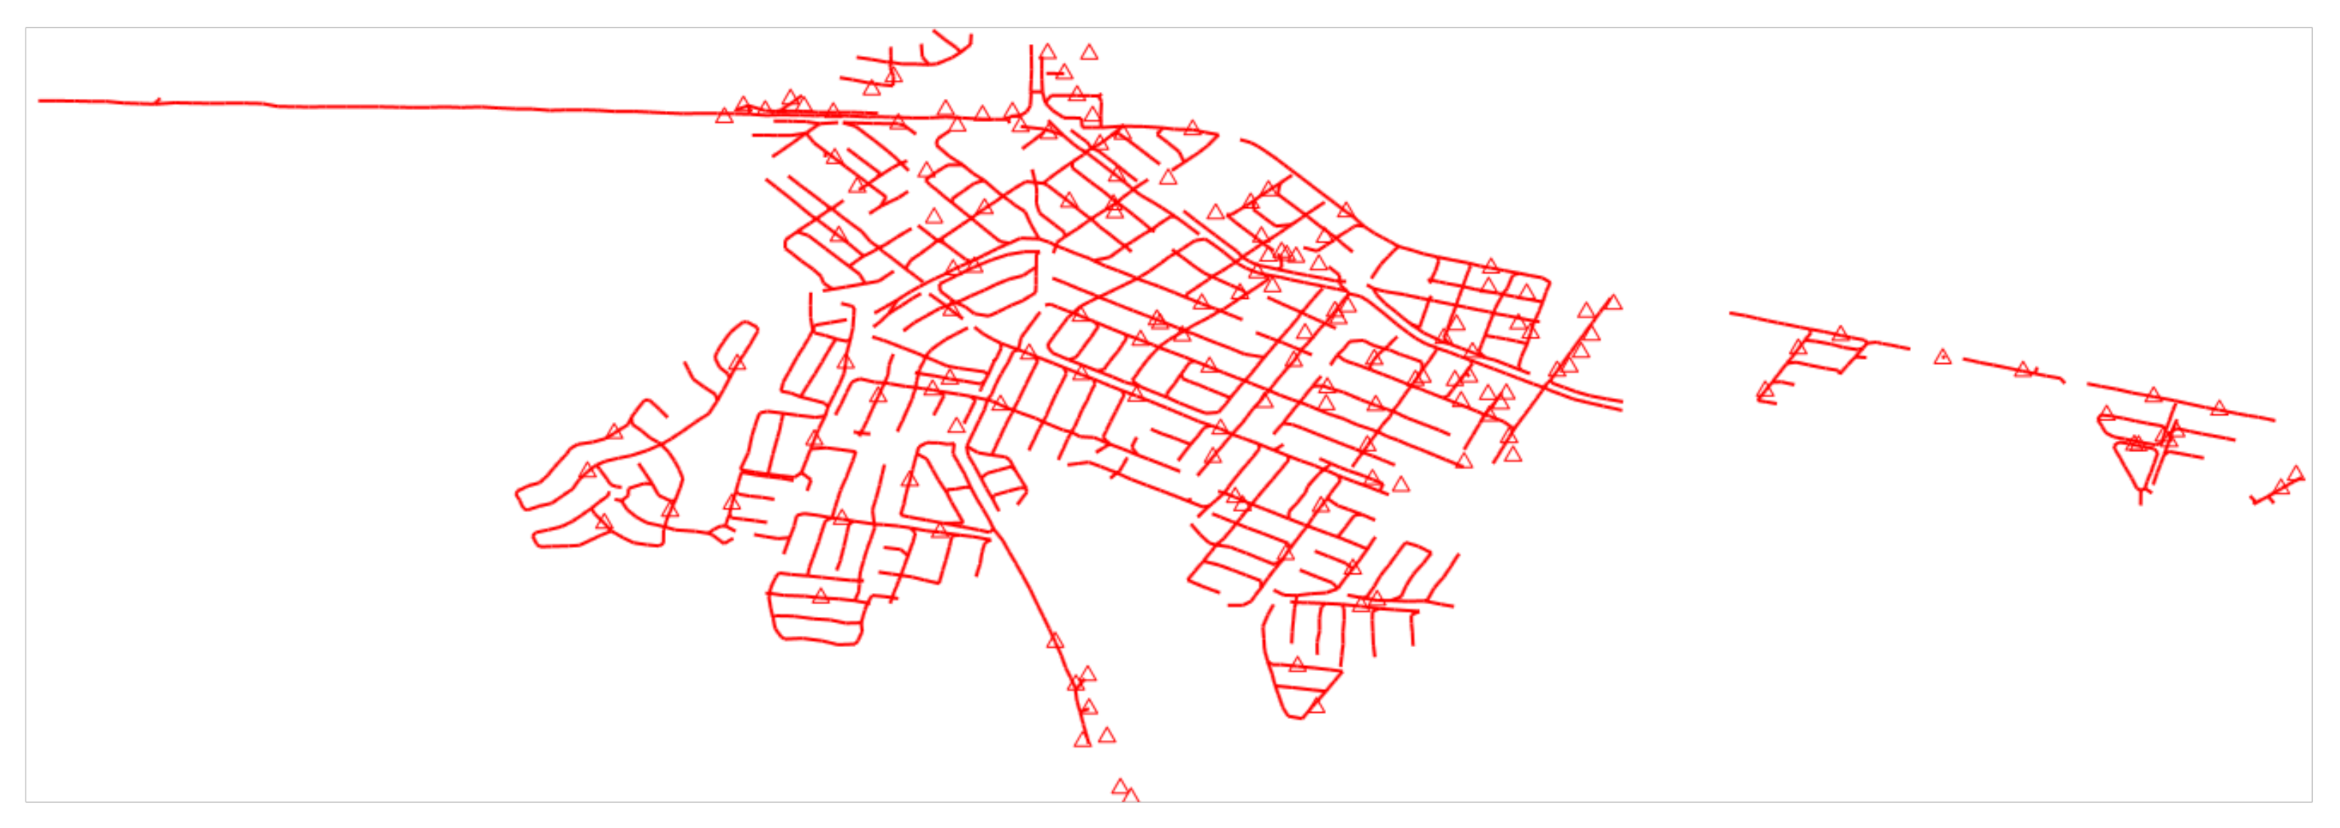
Figure 3 shows the MV circuit in blue and
Figure 4 presents the LV circuit in red.
Figure 3 and
Figure 4 shows transformers in red triangles and substation in yellow square. High voltage (HV) data are not shown, as for this voltage level there are permanent meters monitoring in all HV substations and units. With simulation results in hand, it is possible to build reports and graphs to data visualization, identifying the following for each UC and transformer: (i) voltage levels, (ii) DRP, (iii) DRC and (iv) financial compensation value that the distributor is subject if a customer files a complaint and finds voltage levels outside the adequate range.
Figure 5 shows simulation results, indicating step-down transformers as yellow triangles, and number of consumer units that showed a voltage level violation connected to that transformer.
Table 4 has results extracted from the Proposed System report, in which 27% of step-down transformers contain UC with transgression, i.e., 18% of UC of feeder-
from substation-
has an inadequate voltage level. Other information present in the report is the UC amount with transgression connected to each transformer, allowing the resources of the company to be allocated in locations with greater amounts and transgression values. Of the 336 step-down transformers and 5966 UC of feeder-
from substation-
, 90 transformers and 1075 UC shows voltage suitability problems, when compared with ANEEL regulatory requirements [
8].
As a second case study, we will use feeder-
of substation-
data, from ENEL Distribution S.A., which is a small network and urban nature.
Figure 6 shows MV and LV overlapping circuit and
Table 5 has feeder-
data.
Table 6 contains data obtained in the Proposed System report, in which of the 78 step-down transformers 14 contains UC with transgression and of the 1374 UC of the Feeder-
from Substation-
, 172 show voltage outside the range considered adequate by ANEEL. This corresponds to 18% of transformers and 13% of UCs.
4.4. Validation Methodology
The methodology for Proposed System validation occurs in two stages: (i) MV network tests and (ii) LV network tests. The MV network validation tests are done by a comparative analysis with CYMDIST, that is another system used by ENEL Distribution S.A., which is a distribution system analysis software developed by CYME International T&D.
Table 7 shows voltage values for Phase
A (
), Phase
B (
) and Phase
C (
) found by both systems (Proposed System × CYMDIST System), in the entire feeder-
MV network, considering the feeder output with 1.0 p.u., same load and simulated in 24 h with values stored hourly.
Of the 194 poles from the feeder-
MV network, we chose ten at random to compose
Table 7.
Figure 7 shows
Table 7 values, in which the voltage is in p.u. per phase for the Proposed System and the CYMDIST System. The difference between the two systems was less than 0.02 p.u. for
and
phase and 0.01 p.u. for
phase, in which the behavior of the curves was similar.
Figure 7 shows the phases visualization in a single graph for each system. The CYMDIST System presents the same values for
,
and
, since the utility provider uses the balanced option when simulating the system. The company adopts this simplification because the load model in CYMDIST is manual, thus reducing losses in the entire feeder (
Table 7 and
Figure 7). The values obtained by the Proposed System considers the system unbalanced, automatically loading the load models in each phase that is connected, making the results close to the real system. In this case, the losses are greater and the voltage sink in
,
and
along the feeder is greater when compared with the result obtained in the CYMDIST System. Since the simplification adopted by Enel Distribuição Goiás using CYMDIST is known, voltage differences between the two systems and the same curves behavior, validate the Proposed System.
The LV network validation tests were carried out by comparing DRP and DRC values simulated by the Proposed System with in field obtained values, through Sample Campaign in certain UCs indicated by ANEEL, using the electricity analyzer to obtain the values of: (i) voltage, (ii) current, (iii) DRP and (iv) DRC for seven days, according to a rule predetermined by ANEEL [
8]. Of 1374 UC from the substation-
’s feeder-
, ANEEL randomly chose ≈ 30 UC within the concession area of ENEL Distribution S.A. to participate in the Sample Campaign. Of these 30 UCs, five were chosen at random for testing and analyzing the data in this work.
Table 8 provides partial identification of the five chosen UCs, the step-down transformers connected to the UCs, the class of each UC (commercial (C), residential (R), industrial (I)), the connection phases of the UC, and the amount of compensation (when there is a breach of voltage limits, the concessionaire must regularize the service and financially compensate the consumer. The compensation is automatic and must be paid until the concessionaire regularizes the voltage supplied) calculated with a power factor of
.
All UCs and step-down transformers had their identities partially exchanged for
in
Table 8, all connected in Phase
A, Phase
B, Phase
C and Neutral (three-phase). The compensation values are in dollars and calculated according to presented methodology by ANEEL [
8].
Table 9 shows simulated DRP and DRC values using power factor
. With this value of
, all UCs had DRP in Phase-
A and none had DRC in Phase-
C.
Table 10 displays maximum (
) and minimum (
) voltage values. For the five chosen UCs, these values oscillate between
and
, a
V range. However, calculation of DRP and DRC indexes is not linked to variation limits of
and
. For this calculation, the instantaneous value measured in the UC in consecutive ten-minute intervals is used, in which 1008 valid records are considered, composing a seven days typical measurement period. Therefore, DRP and DRC values must express the time percentage in which the UC remains with precarious voltage (DRP) and with critical voltage (DRC).
Table 11 shows simulated values of DRP and DRC using power factor
. With this new value of
, only the UCs of the first and fifth lines of
Table 11 remained with DRP and/or DRC and the other UCs remained in the appropriate voltage range. The compensation values for the two UCs that remained with DRP and/or DRC, are below fifty dollars. This new value of
, modifies
and
values, as set out in
Table 12, in which for the five UCs in study, the variation between
and
is 33 V.
The value change from to produces improvements in the simulated system by ≈ 14%. It is important to estimate the appropriate to perform the simulation, as loads modeling and feeder voltage drop calculation depends on it. The lower , greater the load and voltage drop. The best way to estimate the is to use the data obtained through the power meter installed at the substation feeder outlet and adjust it before the simulation.
The simulated results for the UCs connected to the LV network of the feeder-
, displayed in
Table 8,
Table 9,
Table 10,
Table 11 and
Table 12 show alignment with the data measured by ENEL Distribution S.A. during Sample Campaign. The values of
and
using
in simulation, when compared to values obtained in Sample Campaign, differ on average
with a standard deviation of
V. The total amount of UC with voltage transgression in the simulation, with both DRP and DRC, is ≈25%, corroborating with
Table 1 data.
Table 13, has some average values obtained in simulation
average values measured in field
in five UCs that make up other substations of ENEL Distribution S.A. In all simulations, the statistical model used for load input data, allowing better results, was Monte Carlo associated with Gaussian curve.
4.5. Actions to Improve Electric Power Distribution Voltage
To demonstrate the distribution power grid improvement actions implemented in the Proposed System, with the objective of simulating correction/minimization of UC exposure to voltage level violations, fourteen lowering transformers of Substation- and Feeder- were used.
Thus, five successive simulation actions were performed (, , , e ) in some of these transformers, starting from initially simulated data. The strategy adopted for actions sequence was to simulate optimizations in distribution transformers or in circuits that presented consumers exposed to voltage transgression, starting with actions with less computational effort and field implementation financial cost. It begins with TAP adjustment or transformer replacement and finally, actions with highest financial cost because they demand execution of works such as structure adaptation for Capacitor Bank insertion or construction of a network extension to close the loop circuit. The simulated actions objective is to demonstrate tool functionalities, in practice, the company must simulate the various options available and choose the one requiring less time and financial cost to execute. The sequence replacement of 112 kVA transformer BN0006- with another 150 kVA one and the 112 kVA transformer BN0003- with another 250 kVA one, changing the TAP setting of transformer BN0003- from position 1.0 to position 0.94 and replacing transformer BN0013- from 75 kVA with a 150 kVA one, insertion of 50 kVAr three-phase capacitor bank and loop closure of the BN0005 transformer LV network circuit-.
Table 14 displays results obtained after implementation of each action through simulation using the Proposed System, in which
is the total of UC,
is the total of modified transformers and
are the values obtained in the Sample Campaign. In the configuration
there are 172 UCs with voltage transgressions connected to 14 transformers. After implementing action
there is a reduction in UC with voltage transgression to 107, of equivalent to ≈37% reduction in the level of transgression when compared to
. In the implementation of the action
there is again a reduction in the number of UCs with voltage transgression, in this action the number of UCs with transgression reduces by ≈75% with respect to configuration
.
Table 14 shows that after applying action
the UC number with transgression reduces ≈5% and with the application of action
, all UCs are within the appropriate voltage range. The actions implemented in the Proposed System include the insertion/removal of the elements: (i) transformer with adjustments, (ii) single-phase regulator with adjustments, (iii) three-phase regulator with adjustments, (iv) capacitor bank with adjustments and (v) lines with settings. With these actions it is possible to simulate adjustments, network expansion, predict the best actions for adaptation, since each action require distinct deadlines and financial costs to implement.
5. Discussion
The main difficulty in developing this work was identifying data records in energy distribution company’s databases. As different databases have the networks data, it took months identifying parameters, treating data and building the simulation database. The lack of some data in databases conditioned routines implementation to correct or minimize failures to not impair the simulation quality.
To allow other energy distribution companies to use the Proposed System, the database recorded data always must have the same format/position, regardless of which databases in used, allowing the interface between companies databases and simulation database flexibility and portability. Thus, the Proposed System can be used in any database that has variables values used for simulation. To avoid interoperability of access to the company’s database, it was necessary to implement the download option, which allows to upload data from said databases to the Proposed System.
Usually, when it comes to comparing software, runtime analysis is performed. However, in this case where the Proposed System and the CYMDIST System were compared, it was not possible to compare the time between both, as the Proposed System does not adopt simplifications or equivalences for low voltage loads. Due to the need to simulate voltage dynamic behavior along LV circuit and its reflexes in MV, which is one of the innovations proposed, to model each LV and MV UC in its respective phase for 24 h, the Proposed System works with volume superior to the CYMDIST System. Thus, the execution/simulation time is longer in the Proposed System.
To compare and validate voltage values in LV, ×, it is necessary to observe some variables that can diverge between the results and not necessarily be an error in the simulation model. For example, in addition to load variation itself, which may be more sensitive in LV in some feeders due to load profile, when operating or emergency teams adjust voltage control equipment in the field and do not properly update the network register, as: raise the voltage at the power supply output to more than 1 p.u., change the TAP of the distribution transformer or change the voltage regulator setting in MV, these must be checked during validation in LV.
Data obtained in this work indicate that voltage level quality for consumers, in some countries, is getting worse and exposing energy distribution companies to monetary compensation that can compromise their economic/financial balance. The computational tools that assist in detection of areas with voltage outside the appropriate range and able to apply actions to predict solution for the problem are increasingly needed in low voltage network. Identification of regions or stretches of medium voltage or low voltage networks exposed to voltage level transgression, allows companies to direct resources to where they really need it and serve consumers quicker.
6. Conclusions
Transforming data into useful information is the challenge for electricity companies around the world. Automaticity through smart grids is key to information and prevention of voltage variations. It is known that the growth rate of electricity consumption in a given provider can result in an increase in compensation for violating the voltage level and the higher the consumption, the greater the circulating currents, consequently, the greater the conductors voltage drop. Therefore, it is important that electricity distribution companies know the their networks voltages values, always analyzing them with local regulations. This is necessary so that they can offer better energy quality to consumers and, at the same time, have control of their exposure degree regarding penalties provided by the Law. For this, the company must act in advance, promoting the relevant improvements and reinforcements, offering the best product quality and reducing risks.
For better efficiency and less exposure to penalties, distribution companies should invest in network improvements, avoiding voltage level transgressions, which can reflect positively on the net remuneration base of the energy price. However, this requires mapping your entire network to choose priorities and optimize resources, what other tools do not do, including low voltage that other simulation tools represent in an equivalent way.
The Proposed System aims to make companies more effective, because: (i) it makes possible to communicate with the company’s database, automatically modeling the georeferenced distribution system and using the typical load curves of consumers, (ii) provides indicative reports of simulated network voltage profiles, pointing out possible points with inadequate voltage level, (iii) simulating possible network equipment interventions, aiming at correcting voltage non-conformities.
Thus, considering that feeders are normally long and that most consumers are connected to low voltage, it is essential to model each consumer individually and dynamically to identify which ones are with voltage outside the appropriate range, established by regulatory agent. The Proposed System allows to identify, through simulations, the stretches or network locations that may have a voltage level outside the appropriate range, including low voltage, in addition to implementing actions that optimize the company’s technical resources, directing efforts and equipment to where they are needed, and a priority classification system may even be developed.
Contributions examples from the Proposed System are presented in the results, through the indication of low voltage consumers, in which it is identified that approximately 20% of low voltage consumers are exposed to voltage transgression. After this identification, it is possible to simulate some optimizations in order to restore the voltage level to the appropriate range before generating work orders and sending them for execution. It can be said, then, that the prior detection of the places with transgression, through the Proposed System is effective and allows the necessary pro-activity on the electric energy distribution companies part.


 ,
, 


