Article

Active Distribution Networks Planning Considering Multi-DG Configurations and Contingency Analysis

by
Bilal Amjad
,
Mohammad Ahmad A. Al-Ja’afreh
and
Geev Mokryani
*
Faculty of Engineering and Informatics, University of Bradford, Bradford BD7 1DP, UK
*
Author to whom correspondence should be addressed.
Energies 2021, 14(14), 4361; https://doi.org/10.3390/en14144361
Submission received: 13 May 2021 / Revised: 12 July 2021 / Accepted: 14 July 2021 / Published: 19 July 2021

Abstract

:
This paper proposes a novel method for planning active distribution networks (ADNs) with the integration of an active network management (ANM) scheme using coordinated voltage control (CVC) through on-load tap changer (OLTC) transformers. The method was formulated as a security-constrained optimal power flow (SCOPF) problem to minimize total operational costs, which maximizes the utilization of renewable distributed generators (DGs) over a planning horizon. The ANM scheme was applied using OLTC to ensure safe operation and reduce voltage violations in the network. To analyse the impact of ANM, the planning problem was examined both with and without the ANM scheme. Moreover, SCOPF, considering the N-1 line contingency analysis and multi-DG configuration, was implemented to analyse the feasibility of the proposed method and the advantages of ANM under contingency situations. The method was validated on a weakly-meshed 16-bus UK generic distribution system (UKGDS). The results showed that ANM can lower operational costs and maintain network voltage for operation in feasible conditions even in the case of a contingency. Moreover, the ANM scheme mitigated the voltage rise effect caused by DGs and maximized their utilization.

Graphical Abstract

1. Introduction

1.1. Motivation and Background

The integration of distributed renewable energy resources (RERs), also called renewable distributed generators (DGs), is increasing rapidly in distribution networks. RERs contribute to the reduction of carbon emissions, network losses, and electricity generation costs. However, they also introduce many technical challenges for safe network operation due to their stochastic nature of power generation, voltage rise effect at the point of connection, and bi-directional power flow [1,2]. Active network management (ANM) schemes are being applied to deal with such challenges by monitoring and actively controlling RERs and network parameters using advanced control and communication systems. Distribution network operators (DNOs) across the UK are adopting ANM schemes as a solution to manage the high penetration of DGs into the networks by actively monitoring and controlling their output power and other network parameters. ANM is not yet implemented on a large scale due to advocate control and communication infrastructure and regulatory barriers. However, different ANM schemes are being applied in certain areas of the UK, such as in the Orkney Islands by Scottish and Southern Electricity Networks (SSEN) and in Driffield, Yorkshire by Northern Powergrid [3,4].

1.2. Literature Review and Research Gap

Generally, distribution networks are radial and have a high R/X ratio [5]. This is because radial networks are efficient, and it is simple to analyse their power flow and design protection systems. This configuration is mostly used in rural areas where loads are small, uncritical, and spread widely [6,7]. Radial networks are normally open-ended and can be modelled in a tree shape. They are highly unbalanced, inflexible and have a low level of security. In the event of any fault or maintenance, the supply of the whole network can be interrupted [7,8]. On the other hand, a ring or loop or meshed network topology is widely used in suburban and urban areas, where networks are usually heavily loaded and network security is important [6]. Meshed networks have several technical benefits over radial networks. Table 1 shows a detailed comparison of the characteristics of radial and meshed distribution networks. The proposed study considered the weakly meshed topology for distribution networks.
Using advanced and intelligent monitoring, control, and forecasting tools, ANM can actively deal with over/under voltages, reverse power flow, overloading, and congestion without any network constraint violations [9].
Active distribution networks (ADNs) with different ANM schemes are being implemented for many studies and applications including optimising penetration of DGs in the network [10,11], sizing and allocation of DGs [12,13,14], DG stability [15], minimising network losses [15], mitigating voltage violations [16], and voltage regulation [17,18,19,20,21]. In references [10,11,15,16,17,18,19,20,21], a fixed locational configuration of DGs was considered. However, in this paper, multi-DG configurations at different locations were considered.
References [22,23] presented an OPF-based ADN planning method for high penetration of wind turbines for the distribution market to optimise social welfare. ANM schemes, namely adaptive power factor control and coordinated voltage control (CVC), were studied with multi-wind turbine configuration scenarios. The results proved that ANM schemes allow wind turbines to inject more power into the grid, causing a reduction in locational marginal prices in the distribution network. The authors in [24] presented a multi-objective technique for planning and operation assessment of power injected by solar PV and line losses for a radial distribution network to minimize line losses and network operational costs while considering the combination of demand response (DR) and ANM schemes. A bi-layer planning technique for the active management of DN was proposed in [25]. The annual total cost and active management cost were considered as objective functions. Active management increased the utilisation of DG, which also reduced power losses in the network. In [26], a model to control and optimize the voltage profile in DN with high-level penetration of photovoltaic (PV) systems was presented. Most of the previous studies have investigated planning frameworks on radial distribution networks. However, the meshed network topology is essential to be applied, as it has a significant impact on reducing the technical impact of high RERs penetration (e.g., losses, voltage violations, voltage imbalances) while improving network reliability [7,27]. Moreover, the impact of DGs on distribution networks was studied at pre-defined fixed locations. However, this study implemented the planning of meshed ADNs considering multi-DG configuration scenarios under the ANM scheme.
Contingency analysis (CA) is an essential part of network planning to ensure power system security in case of any contingency such as loss of a line or a generating unit. CA helps to assess network behaviour under any failure or outage that can cause over/under voltage and overloading [28]. Security-constrained optimal power flow (SCOPF) is widely used to analyse optimal network conditions under different network contingencies. It means further constraints (line failure or generator failure) are added into the OPF problem to formulate SCOPF. SCOPF can be either preventive or corrective. The objective of preventive SCOPF is to prevent any kind of network constraint violation during a contingency and maintain the feasibility of the network in post-contingency state, whereas corrective SCOPF aims to deal with post-contingency constraint violations by performing appropriate actions [29,30]. The focus of this paper is on preventive SCOPF by means of ANM.
SCOPF is a non-linear and complex problem due to a large number of possible contingencies. Reference [30] studied preventive SCOPF to analyse generator contingencies while optimizing primary response from speed governor-operated synchronous generators depending on the droop coefficient of each generator. SCOPF was performed for transmission line contingencies while considering operating cost as an objective function in [31]. Coordinated power flow was performed for transmission system CA in [32]. A methodology was presented to select the most sensitive buses in the network and to exchange network data between system operators to deal with critical contingencies. A hybrid approach was adopted in [33] using differential evolutionary particle swarm optimization to solve SCOPF based on N-1 line contingency criteria for different IEEE bus systems. A multi-objective problem was formulated to minimize network operational cost and line losses.
The increasing share of variable energy resources (VERs) causes many uncertainties in the power system. The impact of the stochastic power generator of VERs on contingency analyses of ADNs has been covered in many recent studies [34,35,36,37]. Considering the uncertainty due to forecasting errors of VERs, a probabilistic SCOPF has been performed in [34]. Optimal sizing and placement of DGs have been performed for an ADN in [36] considering the active management scheme, DG and load curtailment, and N-1 contingency for the loss of the feeder or loss of a substation transformer. In [37], the optimal placement of energy storage was presented to prevent losses of load in ADNs as a result of N-1 contingencies. Reference [20] analysed a 3-bus radial network under normal conditions and line contingency to study the impact of contingency on voltage variation. A voltage regulation strategy was proposed to maintain voltage by injecting or observing reactive power from DG in an active distribution network. N-1 contingency analysis was carried out for radial distribution network planning by means of a generic algorithm in [38]. The problem was formulated to perform network reconfiguration in the case of N-1 contingency in the network. This study presented a planning problem with SCOPF under N-1 line contingency criteria considering operating cost as an objective function.
Many studies have implemented SCOPF for contingency analysis [30,31,32,33,34,35,36,37,38,39]. References [31,32,34] performed SCOPF for transmission networks. In addition, references [30,33,37,38,39] considered radial distribution networks. However, none of these studies analysed SCOPF for a meshed distribution network. Furthermore, a majority of reviewed studies such as references [30,31,32,33,34,37,38] have considered the operation of the network. However, limited research has been carried out to analyse SCOPF in the planning of meshed distribution networks. References [35,36,37,38,39] studied the impact of DGs on the network under contingencies for fixed configuration of DGs but in actual all the DGs are not available all of the time. Reference [37] investigated SCOPF for the operation of radial distribution networks. However, his work analysed the impact of ANM in meshed distribution networks considering an N-1 contingency criteria and multi-DG configurations. The comparison of the proposed method with existing methods is presented in Table 2.

1.3. Contributions

This paper proposes a novel approach for the planning of weakly meshed distribution networks with the integration of an ANM scheme, i.e., coordinated voltage control (CVC) using on-load tap changer (OLTC) transformers with consideration for N-1 contingency conditions and multi-DG configurations. The proposed approach has been analysed under all line contingencies (loss of a line) cases, based on SCOPF, to study the impact of the ANM scheme on network feasibility. The method was formulated as a SCOPF problem to minimize the total network operating cost over the planning horizon. The method was validated on a 16-bus UK generic distribution system (UKGDS).
The main contributions of this paper are summarised as follows:
  • Propose a novel approach for the planning of weakly meshed distribution networks with an ANM scheme that considers multi-DG configurations.
  • Analyse the impact of ANM on the planning of weakly meshed ADNs with considerations for contingency analysis and multi-DG configurations.

1.4. Paper Organisation

The paper is organized as follows. Section 2 introduces the methodology applied in this paper. Section 3 presents the formulation of the optimal power flow and security-constrained optimal power flow for ADN planning and contingency analysis, respectively. The case study and scenarios are presented in Section 4. Section 5 explains the simulation results. Finally, the conclusions are presented in Section 6.

2. Methodology

The optimal power flow problem with an OLTC-based coordinated voltage control ANM scheme was formulated for the planning of weakly meshed distribution networks over a 5-year planning horizon. The minimisation of network operating cost was considered as an objective function, subject to the network constraints. The total network demand was increased gradually with the increase in the planning year. OLTC transformer was modelled to alter the voltage on the transformer’s secondary side based on its tap magnitude range. The results were evaluated by comparing network planning results under the ANM scheme and without the ANM scheme.
SCOPF was formulated to analyse the N-1 line contingency for each line of the network to ensure the network security of supply under the ANM scheme. Under normal operating conditions, the network was considered as in a pre-contingency condition and under N-1 line contingency, the network state was considered as in a post-contingency condition. To analyse the effectiveness of ANM, both pre-contingency and post-contingency conditions were studied with and without ANM.
The whole formulation was validated on a 16-bus weakly meshed UKGDS equipped with 2 OLTC transformers and 3 DGs at different locations. All possible multi-DG configuration scenarios were considered to analyse the network with all possible conditions. The scenarios were also studied under N-1 line contingency through SCOPF to analyse the network feasibility and the impact of ANM.
The proposed problem was formulated as a non-linear problem and solved using CONOPT solver in General Algebraic Modelling System (GAMS) software [39]. CONOPT is widely used to solve nonlinear problems. It is based on a generalized reduced gradient (GRG) algorithm, introduced in 1969 by Abadie and Carpentier [40,41,42].

3. Problem Formulation

The formulations of OPF and SCOPF have been presented in several studies in the literature. In this work, the problem was formulated based on [22,27]. Necessary amendments were made in the formulation according to the proposed methodology.

3.1. Objective Function

The objective function is to minimise the network operating cost, i.e., operating cost from conventional generators and distributed generators.
O F = M i n i m i z e y = 1 N Y s = 1 N s G = 1 N G C i G P i , s , y G + y = 1 N Y s = 1 N s D G = 1 N D G C i D G P i , s , y D G
where N Y , N s , N G , and N D G are the total number of years, scenarios, conventional generators, and DGs, respectively. P i , s , y G and P i , s , y D G are respectively the active power generated by the G and DG, connected at the bus i , in scenario s of year y. C i G represents the cost function of the conventional generator G, connected at the bus i , and C i D G is a cost function of DGs that includes the investment, maintenance, and operation costs, distributed over the number of useful life years of DGs. The conventional generator is considered to be a non-renewable generator, and its cost function includes operating cost, whereas DGs are considered to be renewable generators such as wind or PV, and their cost function is based on the levelized cost of electricity (LCOE). The LCOE for each DG can be calculated by dividing the lifetime cost of DG by its lifetime electricity production [43].
L C O E D G = L i f e c y c l e _ c o s t D G L i f e t i m e _ e n e r g y _ p r o d u c t i o n

3.2. Network Constraints

3.2.1. Equality Constraints

  • Active and reactive power balance
Power balance constraint ensures that the sum of total power consumed or generated at a certain bus should be equal to the sum of power flows between that bus and the neighboured connected buses.
G = 1 N G P i , s , y G + D G = 1 N D G P i , s , y D G P i L . f y l = j = 1 N B P i , j , s , y
G = 1 N G Q i , s , y G + D G = 1 N D G Q i , s , y D G Q i L . f y l = j = 1 N B Q i , j , s , y
where Q i , s , y   G is the reactive power from conventional generators and Q i , s , y   D G is the reactive power from DGs, connected at the bus i , in scenario s of year y. P i   L and Q i L are respectively the active and reactive load connected at bus i . f y l is a factor by which the load is increasing, yearly. P i , j , s , y   and Q i , j , s , y   are respectively the active and reactive power flows between bus i and j .
  • Active and reactive power flow
The active and reactive power, flowing between bus i and j , can be expressed as follows:
P i , j , s , y = V i , s , y 2 . cos θ i j Z i j V i , s , y . V j , s , y . T i , j , s , y . cos ( δ i , s , y δ j , s , y + θ i j ) Z i j
Q i , j , s , y = V i , s , y 2 . sin θ i j Z i j V i , s , y . V j , s , y . T i , j , s , y . sin ( δ i , s , y δ j , s , y + θ i j ) Z i j
θ i j = tan 1 X i , j R i , j
Z i j = X i , j 2 + R i , j 2
where V i , s , y and V j , s ,   y are respectively the voltages at bus i and j , and δ i , s , y and δ j , s , y are the angle of the voltage at bus i and bus j , respectively. θ i j is the impedance phase angle between the voltage and the current. T i , j , s , y is tap setting magnitude for the OLTC located between bus i and j . R i , j   ,   X i , j   and Z i j represent the line resistance, line reactance, and line impedance, respectively.

3.2.2. Inequality Constraints

  • Active and reactive power generation
The active and reactive power generation constraints are based on the maximum and minimum active and reactive power capacity of the generators as formulated in Equations (9)–(12).
P i G min P i , s , y G P i G max
Q i G min Q i , s , y G Q i G max
P i D G min P i , s , y D G P i D G max
Q i D G min Q i , s , y D G Q i D G max
where P i G min and P i G max are respectively the maximum and minimum active power capacities, and Q i G min and Q i G max are respectively the minimum and maximum reactive power capacities for a conventional generator connected at bus i . P i D G min , P i D G max , Q i D G min , and Q i D G max are the same as previous but for DGs.
  • Apparent power flow limits
The power flowing through a line must be equal to or less than the maximum power capacity of the line to avoid any congestion.
S i , j , s , y S i , j max
where S i , j max is the maximum apparent power capacity of the line connecting bus i and j.
  • Voltage and angle limits
V i min V i , s , y V i max
δ i min δ i , s , y δ i max
where V i min and V i max are the minimum and maximum limits for voltage V i , s , y , and δ i min and δ i max are the minimum and maximum limits for voltage angle δ i , s , y at each bus.
  • OLTC Tap limits
T i , j min T i , j , s , y T i , j max
where T i , j min and T i , j max are the upper and lower tap magnitude T i , j , s , y for OLTC located between bus i and j .

3.3. Proposed Algorithm for N-1 Line Contingency Analysis

The SCOPF is performed by means of the above formulation. An extra variable, C, is added in the formulation which represents a particular line under contingency. If N is the total number of lines in the network, N-1 means one line, C, out of N lines is under the contingency condition (out of service). Figure 1 shows the flow chart for the N-1 line contingency analysis. The algorithm is applied to all scenarios, one by one. The flow chart includes the following steps:
(a)
Load network data: After formulating the problem and specifying scenarios, start by loading all available network parameters for generating units, buses, lines, transformers, and network constraints. N is a set of all lines in the network, from line 1, L1, to line N, Ln.
(b)
Select a scenario: As different scenarios are considered based on multi-DG configuration, each scenario will be selected one by one to perform SCOPF on all scenarios. If S is the set of all multi-DG configuration scenarios, Sn represents the nth scenario. A specific scenario will be selected at this stage to perform SCOPF.
(c)
Add line contingency: For N-1 line contingency analysis, there is only one line in contingency at an instant. Here, a line from Ln lines will be specified representing line contingency. Initially, line 1, L1, is considered in a contingency state, where C is a variable that represents the line under contingency.
(d)
Conditional statement: As C represents which line is in contingency, this stage verifies whether C represents a line from the N set lines of the network. If “yes”, move to step (e) to perform SCOPF, otherwise go to step (h) and terminate.
(e)
Perform SCOPF: After selecting a specific scenario and a line for N-1 contingency, this stage will perform SCOPF, using the formulation described in Section 3.1 and Section 3.2.
(f)
Check network feasibility: It is important to validate the feasibility of the network in a post-contingency condition against all network constraints including equality and inequality constraints. If the network meets all the constraints, it is in feasible conditions, otherwise infeasible.
(g)
Selected next line: After performing SCOPF with L1 representing a line in contingency, the next line, L2 will be selected for N-1 line contingency. The value of C will be updated and redirected to step (d). The loop will continue until SCOPF is performed for each line, from L1 to Ln, one by one.
(h)
Record results: Once SCOPF is performed for all N-1 line contingencies on a specific scenario, the results are recorded before terminating the program.

4. Case Study and Scenarios

4.1. Network Description

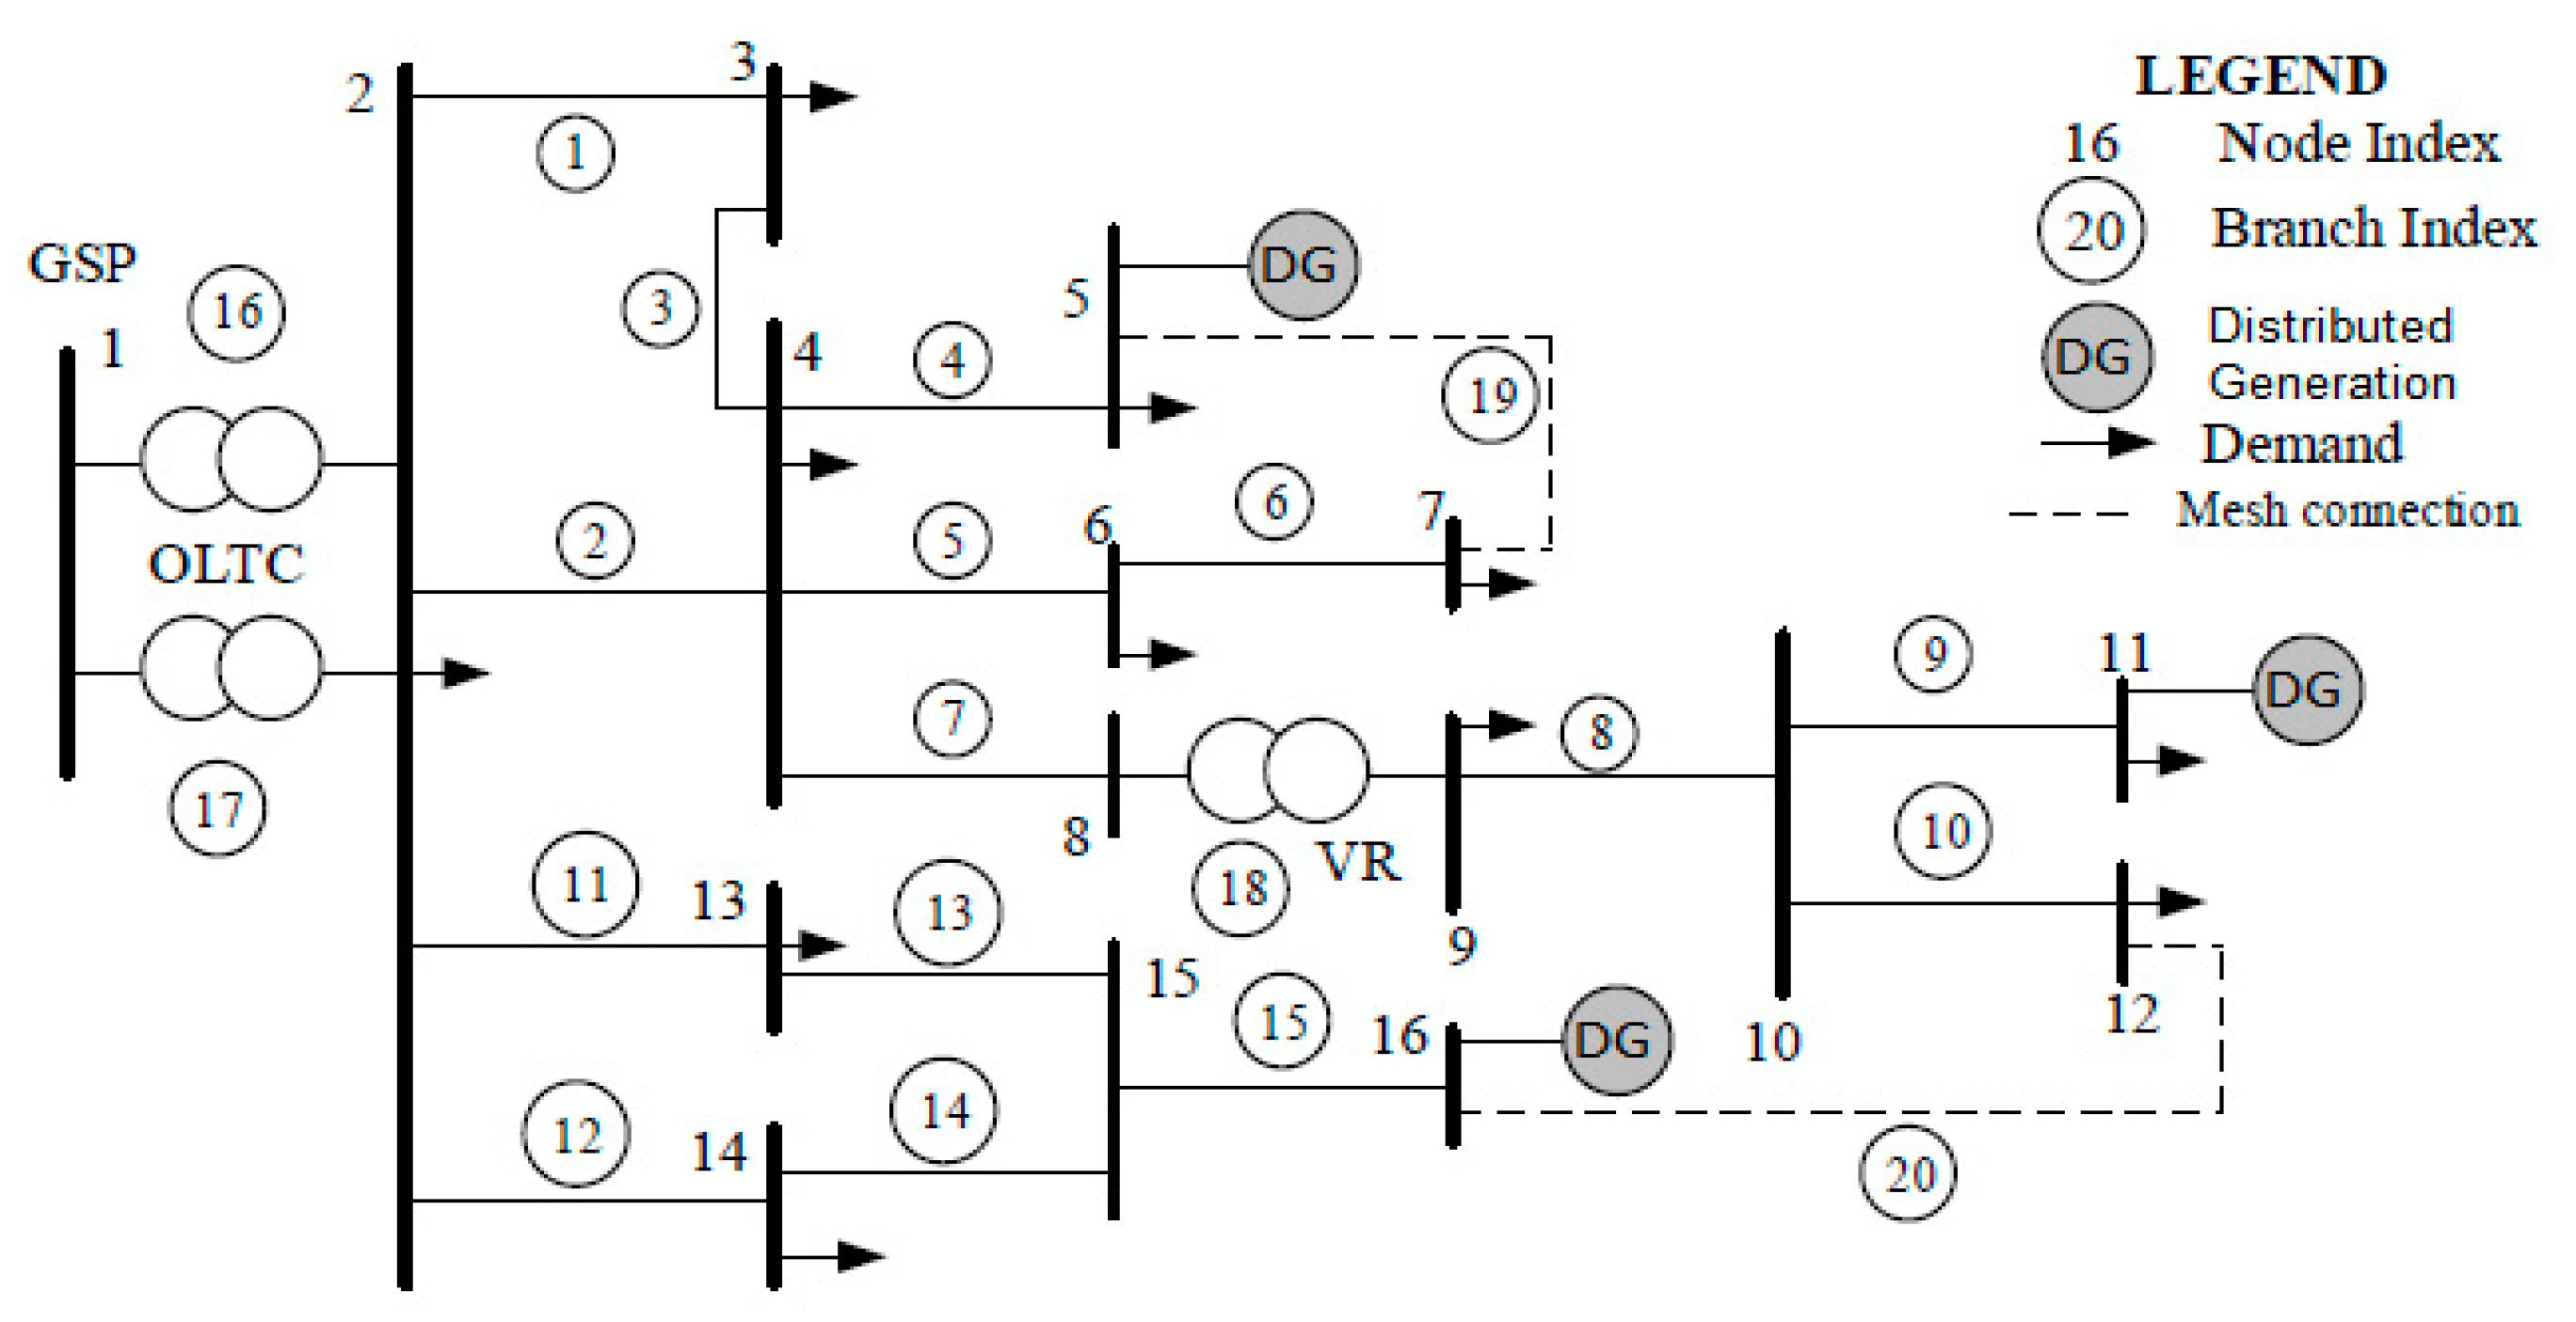
A 16-bus UKGDS was used to validate the proposed method. Originally, it was a 33 kV radial MV distribution network consisting of 16 buses and 18 lines [44]. The system topology was upgraded to a weakly meshed configuration by adding two lines (from bus 5 to 7 and bus 12 to 16). The single line diagram of weakly meshed UKDGS is shown in Figure 2. At bus 1, the network is connected to the grid supply point (GSP), which was considered as power supplied by a conventional generator. It had limits of a minimum of 10 MW and a maximum of 60 MW. Two OLTC transformers are located between bus 1 and bus 2. The voltage limits were considered to be Vmin = 0.94 and Vmax = 1.06 p.u. It was assumed that three DGs were installed in the network, at buses 5, 11, and 16. The maximum active power capacity for each DG was assumed to be 15 MW. The DGs could inject (1 Mvar) to, and absorb (−1 Mvar) reactive power from, the network. The DGs were considered to be available with maximum capacity to analyse the impact of voltage rise and maximum utilisation of DGs under ANM.

4.2. Case Study

A snapshot optimal AC power flow study was performed on peak load demand and, a 3% increase in total network demand was considered per year over the planning horizon. The DGs were considered as dispatchable resources to analyse the maximum production from DGs while satisfying all network constraints and network voltage profiles, as DGs installation caused a voltage rise at the point of connection. The case study was implemented, with and without considering ANM to analyse the impact of ANM on network operational cost, DGs power generation, voltage profile, and other parameters. The proposed ANM scheme was investigated under N-1 line contingency through SCOPF. The contingency analysis was performed in pre-contingency and post-contingency conditions for all scenarios. The pre-contingency condition represented the base case scenario when there was no contingency in the network, and the post-contingency state represented the network state after the a line contingency.

4.3. Multi-DG Configuration Scenarios

The number of scenarios was considered based on total of possible DG configurations in the network. Equation (17) expresses all possible multi-DG configuration scenarios Ns:
1     N s     2 N D G     1
where N D G is the total number of DGs. Table 3 shows the seven possible multi-configuration scenarios for three DGs. An optimal planning problem was implemented for all the scenarios over the planning horizon, with and without an ANM scheme.

4.4. Radial and Meshed Topology Comparison under N-1 Contingency

To improve the security and to minimise the risk of loss of buses/loads as a result of an N-1 line contingency, the 16-bus radial network was transformed into weakly meshed by adding two lines (lines 19 and 20) in the network, as shown in Figure 2. Table 4 shows the name and number of buses which were disconnected from the network in N-1 line contingency conditions, comparing both radial and weakly meshed topologies for 16-bus UKGDS. Three-line contingencies (L4, L5, and L7) for three scenarios (S1, S3 and S5) are shown. In scenarios S1 and S3, a contingency in line L7 can result in the loss of 5 buses in radial topology, whereas the loss of these buses is eliminated in case of meshed topology. Similarly, it can be seen that meshed topology minimised the risk of loss of buses for other scenarios and improved the security of the network for N-1 contingency.
N-1 contingency analysis was performed on all seven scenarios during the planning horizon, which was assumed to be 5 years. There were a total of 20 lines in the network, and each line was considered under contingency one by one. This means SCOPF was performed 20 times for each scenario in a year. For seven scenarios over a 5-year planning horizon, the total number would be 20 × 7 × 5 = 700. The total computational time taken to perform SCOPF for all scenarios and all planning years was 40 min with the operating system running on an AMD Ryzen 5 3500U processor and installed RAM of 8.00 GB.

5. Results and Discussion

The simulation results were generated with and without ANM for all scenarios. Then, the results for all scenarios were analysed on the basis of network operating cost, the voltage at each bus, power generation, and demand. Moreover, the simulation results from SCOPF-based contingency analysis were discussed to evaluate network feasibility and the impact of the ANM scheme.

5.1. Power Generation and Voltage

To show the significance of the ANM, the results of two scenarios, S7 and S3, are discussed here.

5.1.1. Scenario S7

In this scenario, all three DGs were connected to the grid. The total generation was equal to total demand in all years satisfying the power balance constraints, mentioned in Equation (3), as shown in Figure 3. With ANM, the power supplied from the GSP (G1) was always at a minimum level, i.e., 10 MW, while DGs were generating most of the required power to meet load demand and load growth. DG5 was generating 15 MW along the planning horizon, while DG16 was producing between 10 MW to 15 MW. Finally, DG11 was generating around 3 MW during the planning period.
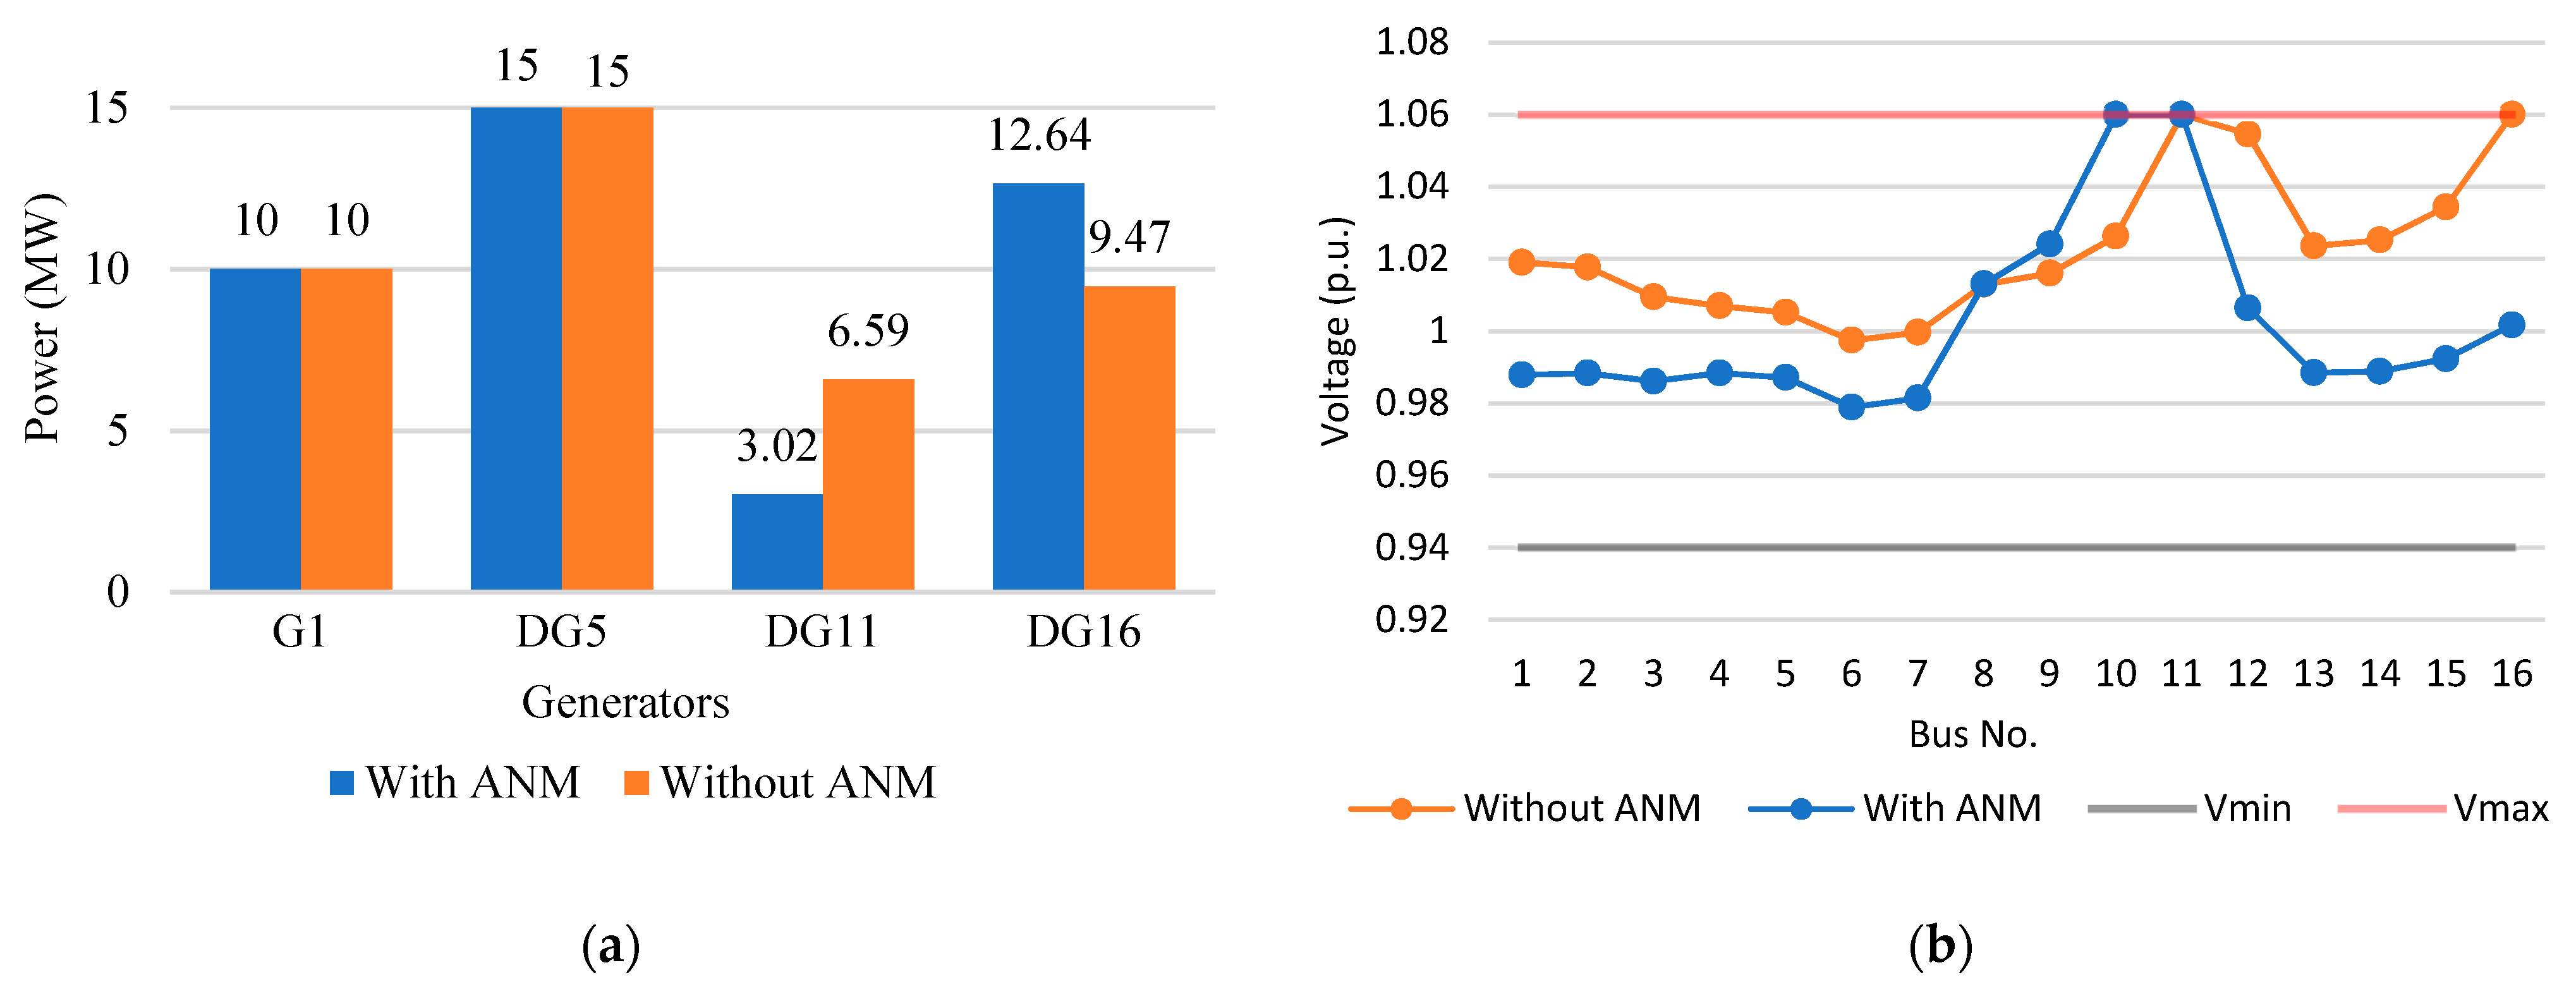
In Figure 4a,b, the power generation and voltage at each bus in scenario S7 in year Y3 are presented. Without ANM, DG16 was producing 9.47 MW due to its curtailment because of the voltage rise effect at bus 16, as shown in Figure 4b. In the case of ANM, this voltage rise effect was regulated by OLTC, and DG16 was generating 12.64 MW. Even though DG16 could produce higher power, the power from the grid was already at its minimum level.

5.1.2. Scenario S3

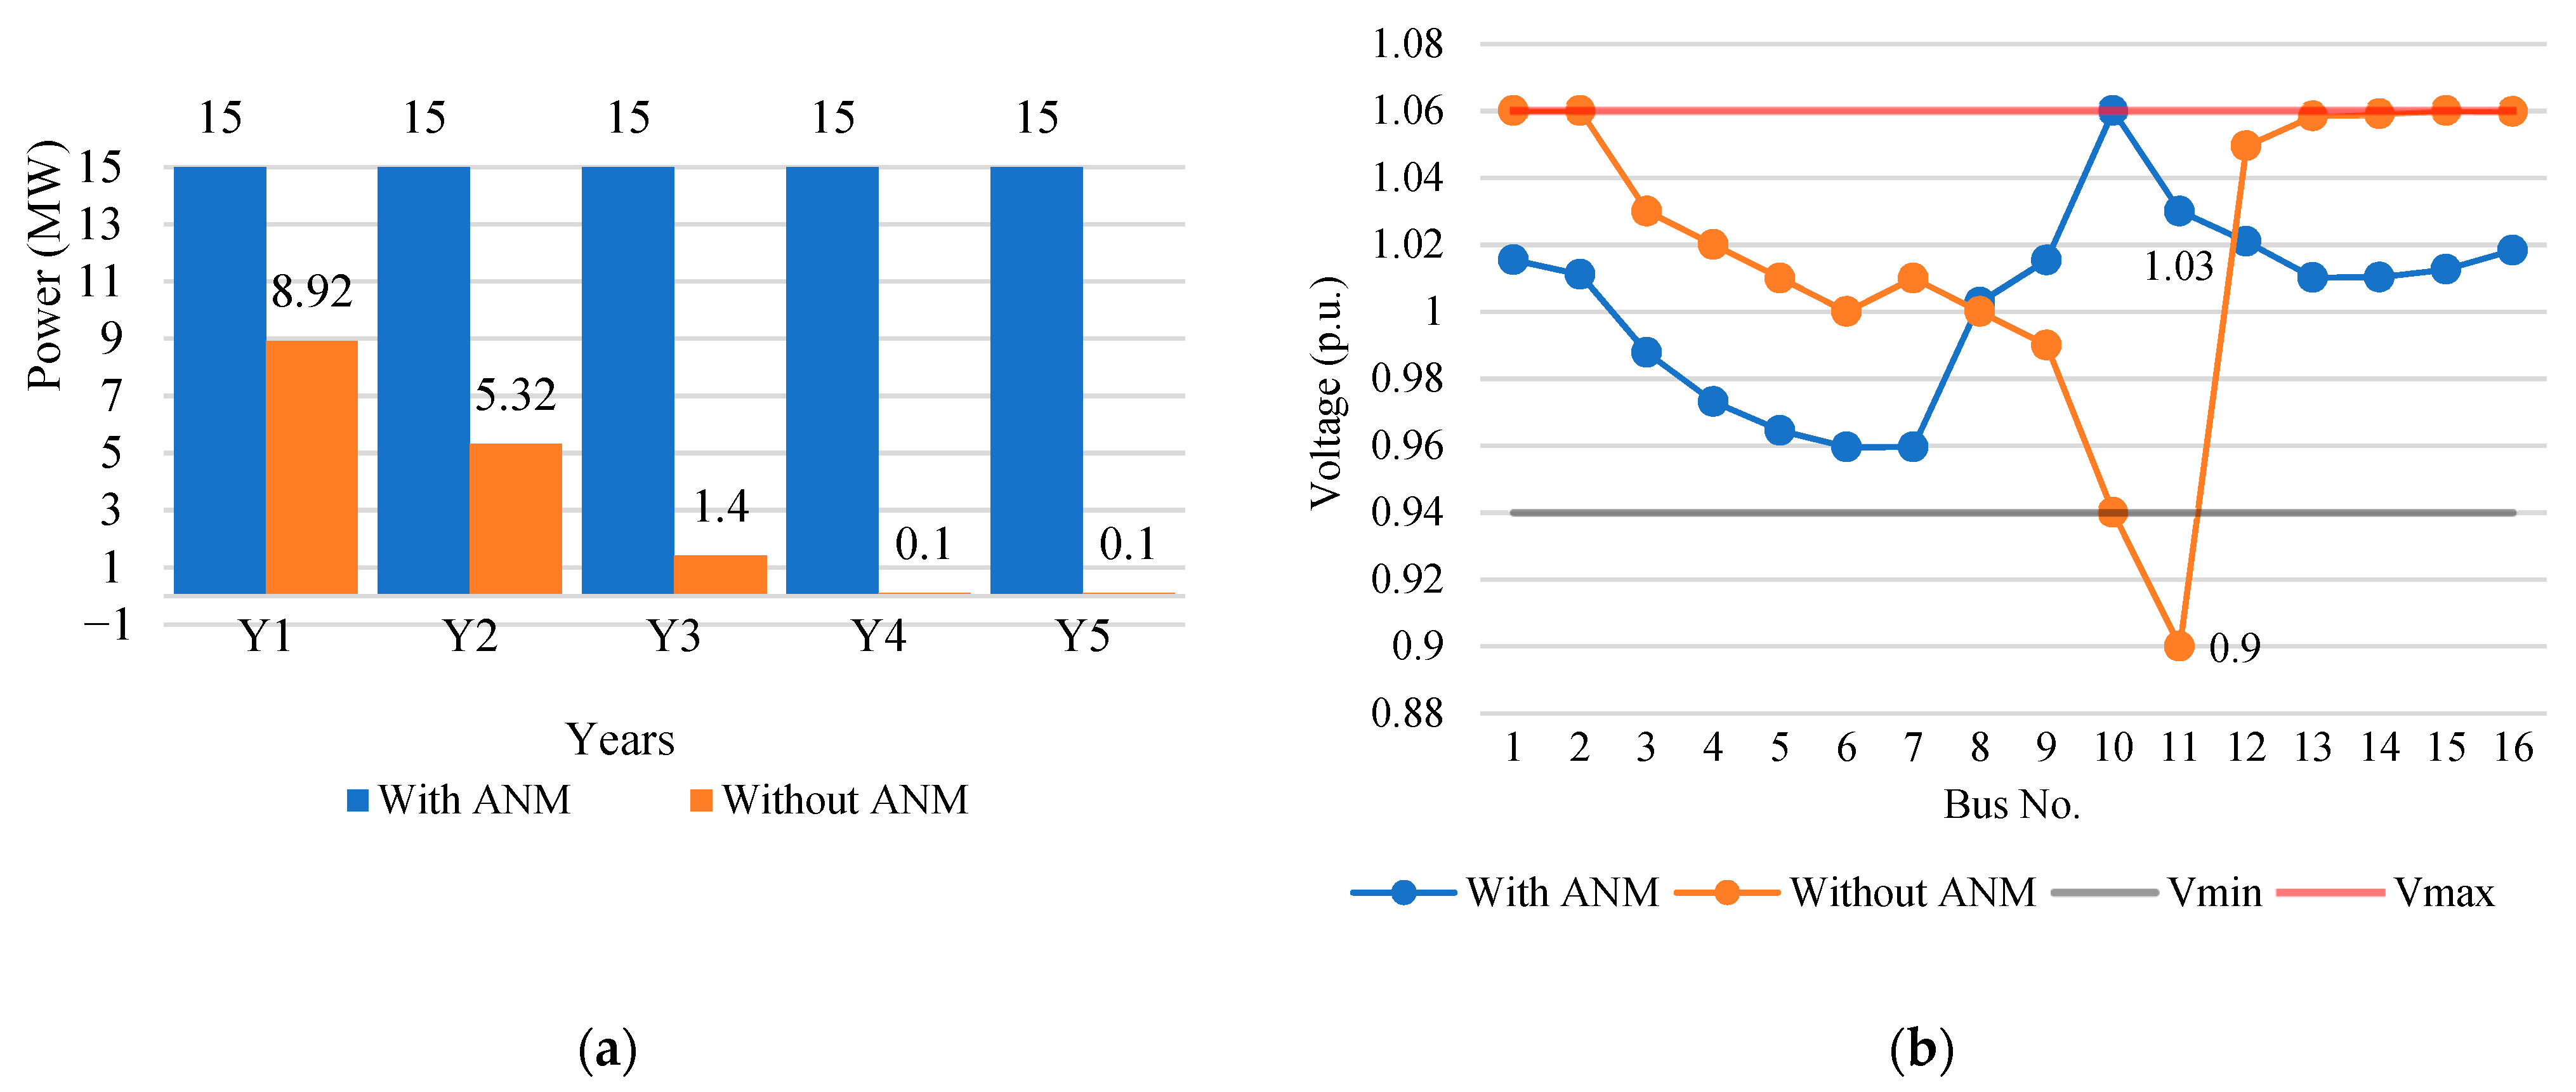
In scenario S3, only DG16 was installed at bus 16. Considering network planning without ANM, the simulation for OPF ended with an infeasible solution for years Y4 (demand increased by 9%) and Y5 (demand increased by 12%). The infeasibility was due to a high voltage drop, below 0.94 p.u., at bus 11. To analyse the impact of ANM, OPF was performed with ANM in S3. The simulation for ANM-based OPF ended with a feasible solution along the planning horizon. This means that ANM helped to maintain network voltage within the statutory limits at each bus. Figure 5b presents the voltages at all buses for scenario S3, year Y5, with and without ANM. It can be observed that the voltage at bus 11 without ANM was 0.9 p.u. whereas it was at 1.03 p.u. with ANM.
Also, from Figure 5a,b, it is evident that without ANM, the voltage rise effect at bus 16 prevented DG16 from generating more power. Most of the load demand was supplied from the GSP (G1) to maintain the voltage at bus 11 within the required limit. However, the voltage at bus 16 was at its maximum limit, which prevented DG16 from generating more power. On the other hand, with the integration of ANM, it is obvious that the voltage at bus 16 was significantly reduced, as shown in Figure 5. As a result, DG16 generated its maximum capacity for all planning years.
These results showed that ANM can maintain network voltage at each bus within statutory limits to maintain feasible network operation and allow the DGs to generate more power compared to the case without ANM.

5.2. Network Operational Cost

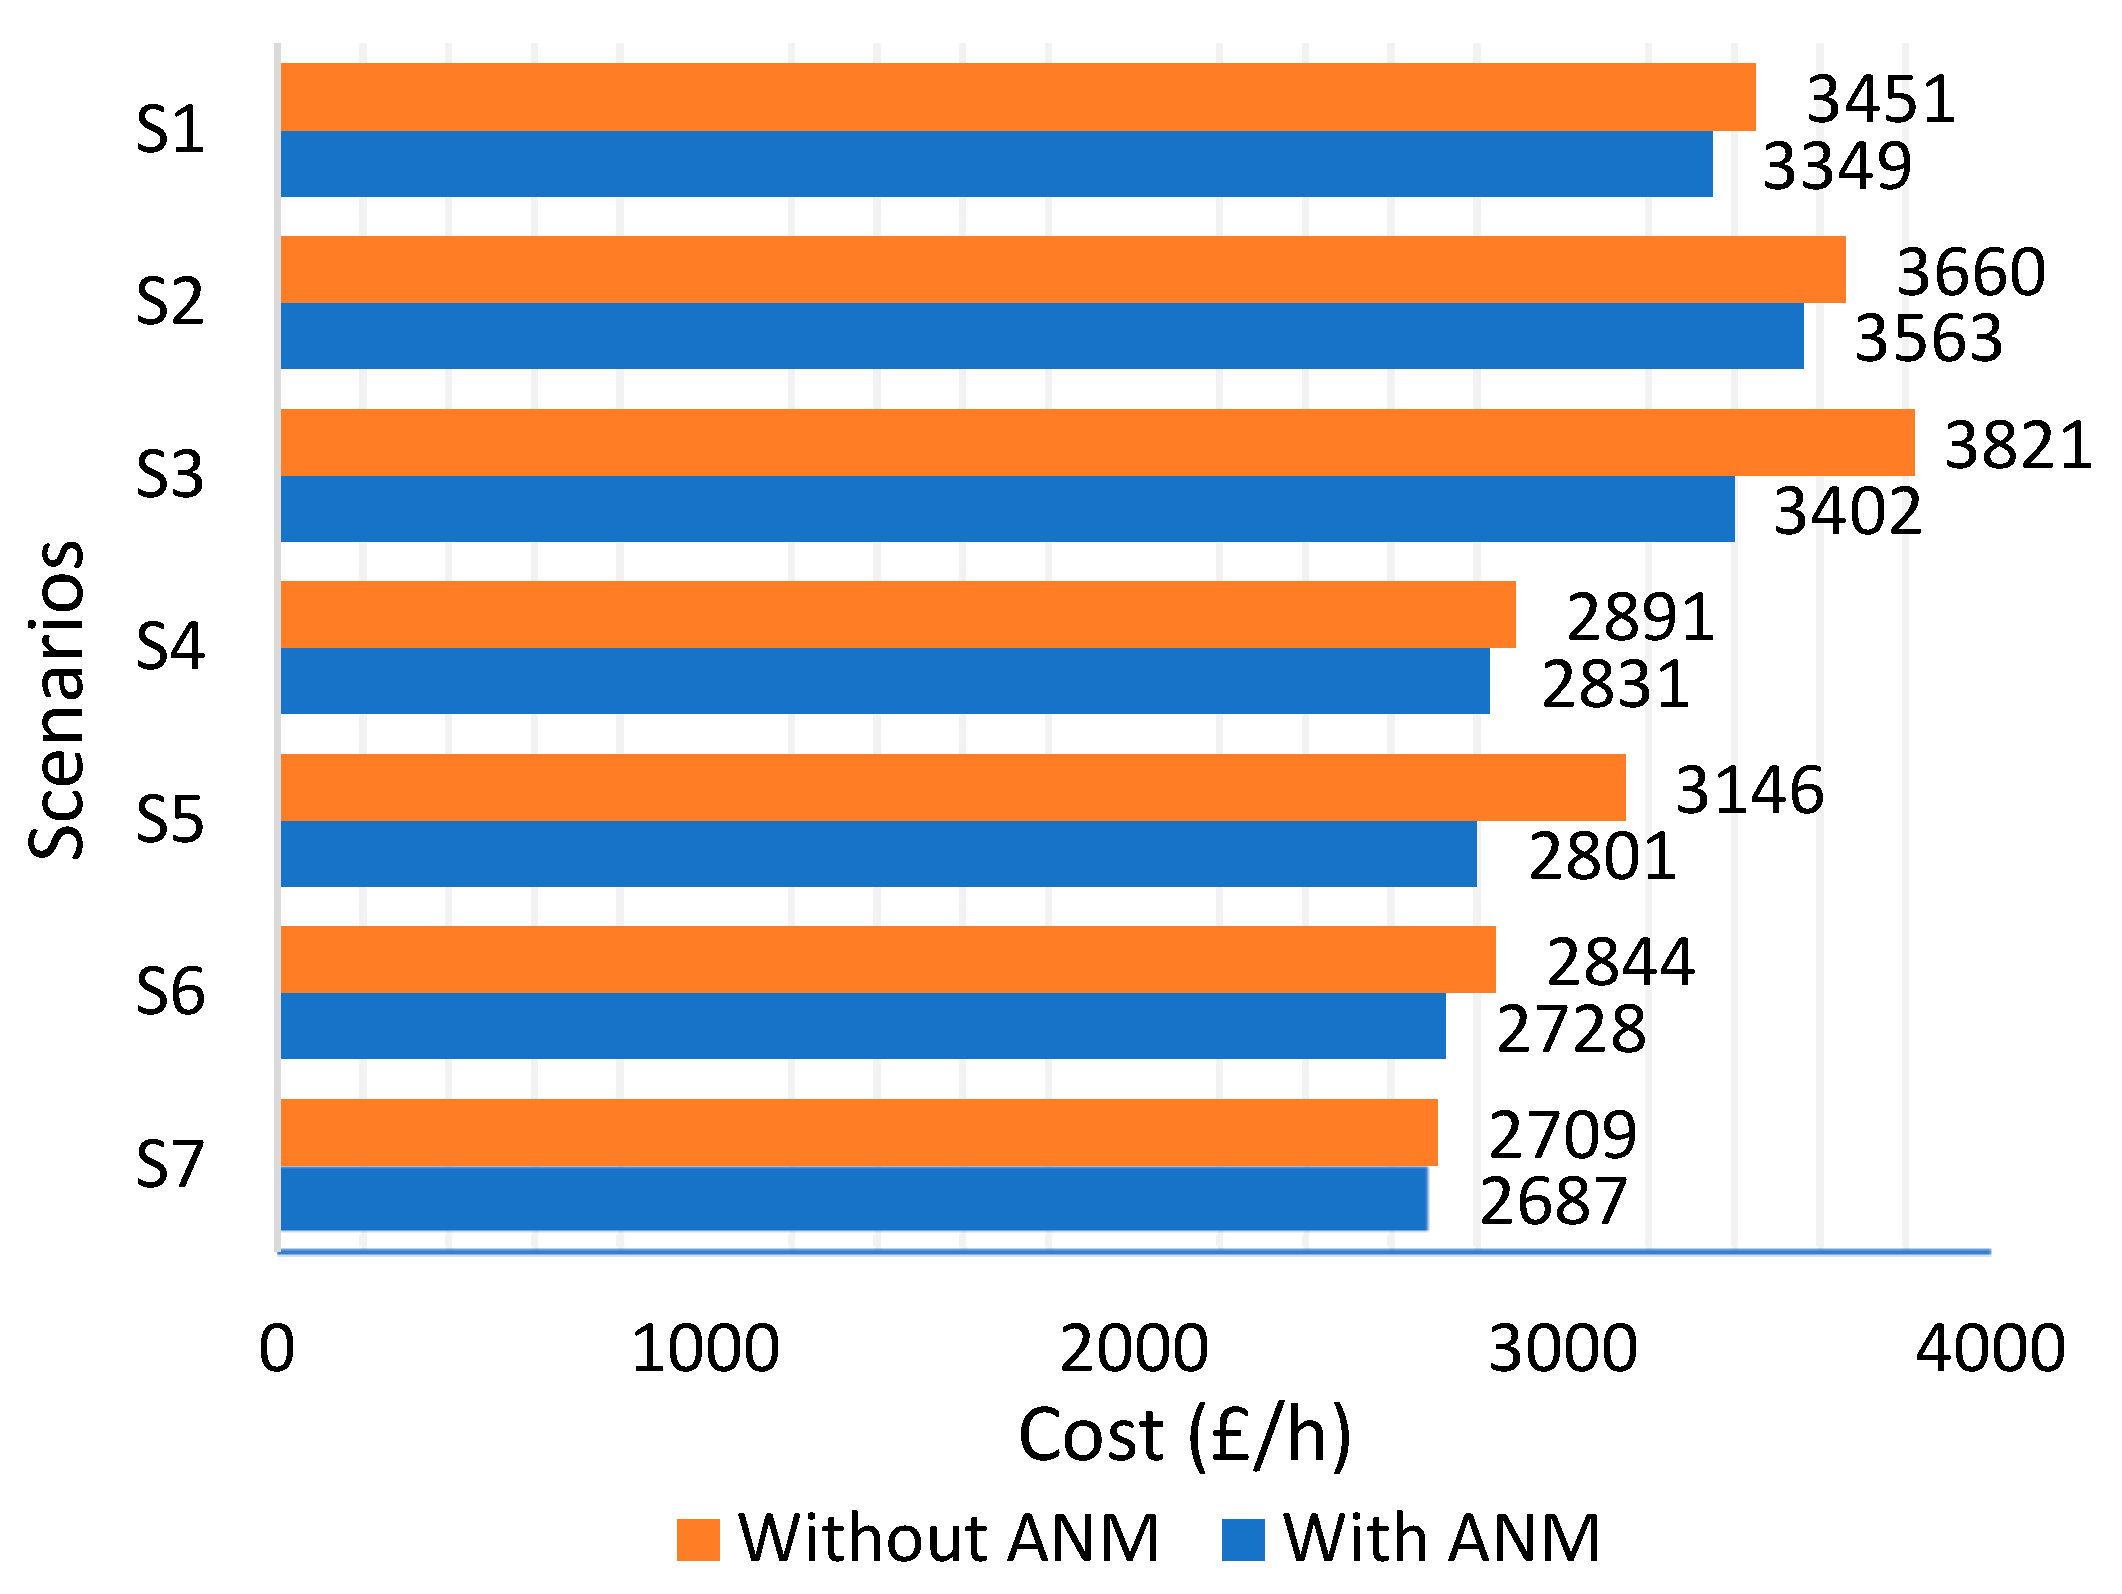
Figure 6 presents the overall network operating cost over the planning horizon for each scenario. It can be noticed that in all scenarios, network operating cost was lower with ANM compared to that without ANM. This is because ANM allowed DGs to generate more power at a cheaper rate, which reduced the expensive power supplied from the grid. Scenario S7 had the lowest operational cost in all years because all three DGs were connected with the network.

5.3. Contingency Analysis

Firstly, SCOPF without considering ANM was performed on all scenarios over the planning horizon. The results were infeasible for most of the cases due to voltage constraint violations under contingency. Then, SCOPF was performed using ANM over the planning horizon for each scenario and considering the outage of one line each time, i.e., the N-1 contingency case. The results were feasible for all contingency cases except for scenarios S1, S3, and S6, when line 9 was under contingency. As in the absence of DG11, the load at bus 11 was disconnected from the network when line 9 was in contingency. In the rest of the scenarios, ANM was able to maintain voltage by controlling the tap setting of the OLTC. This means that with any multi-DG configuration, ANM ensured proper planning and network operation even under the contingency case.
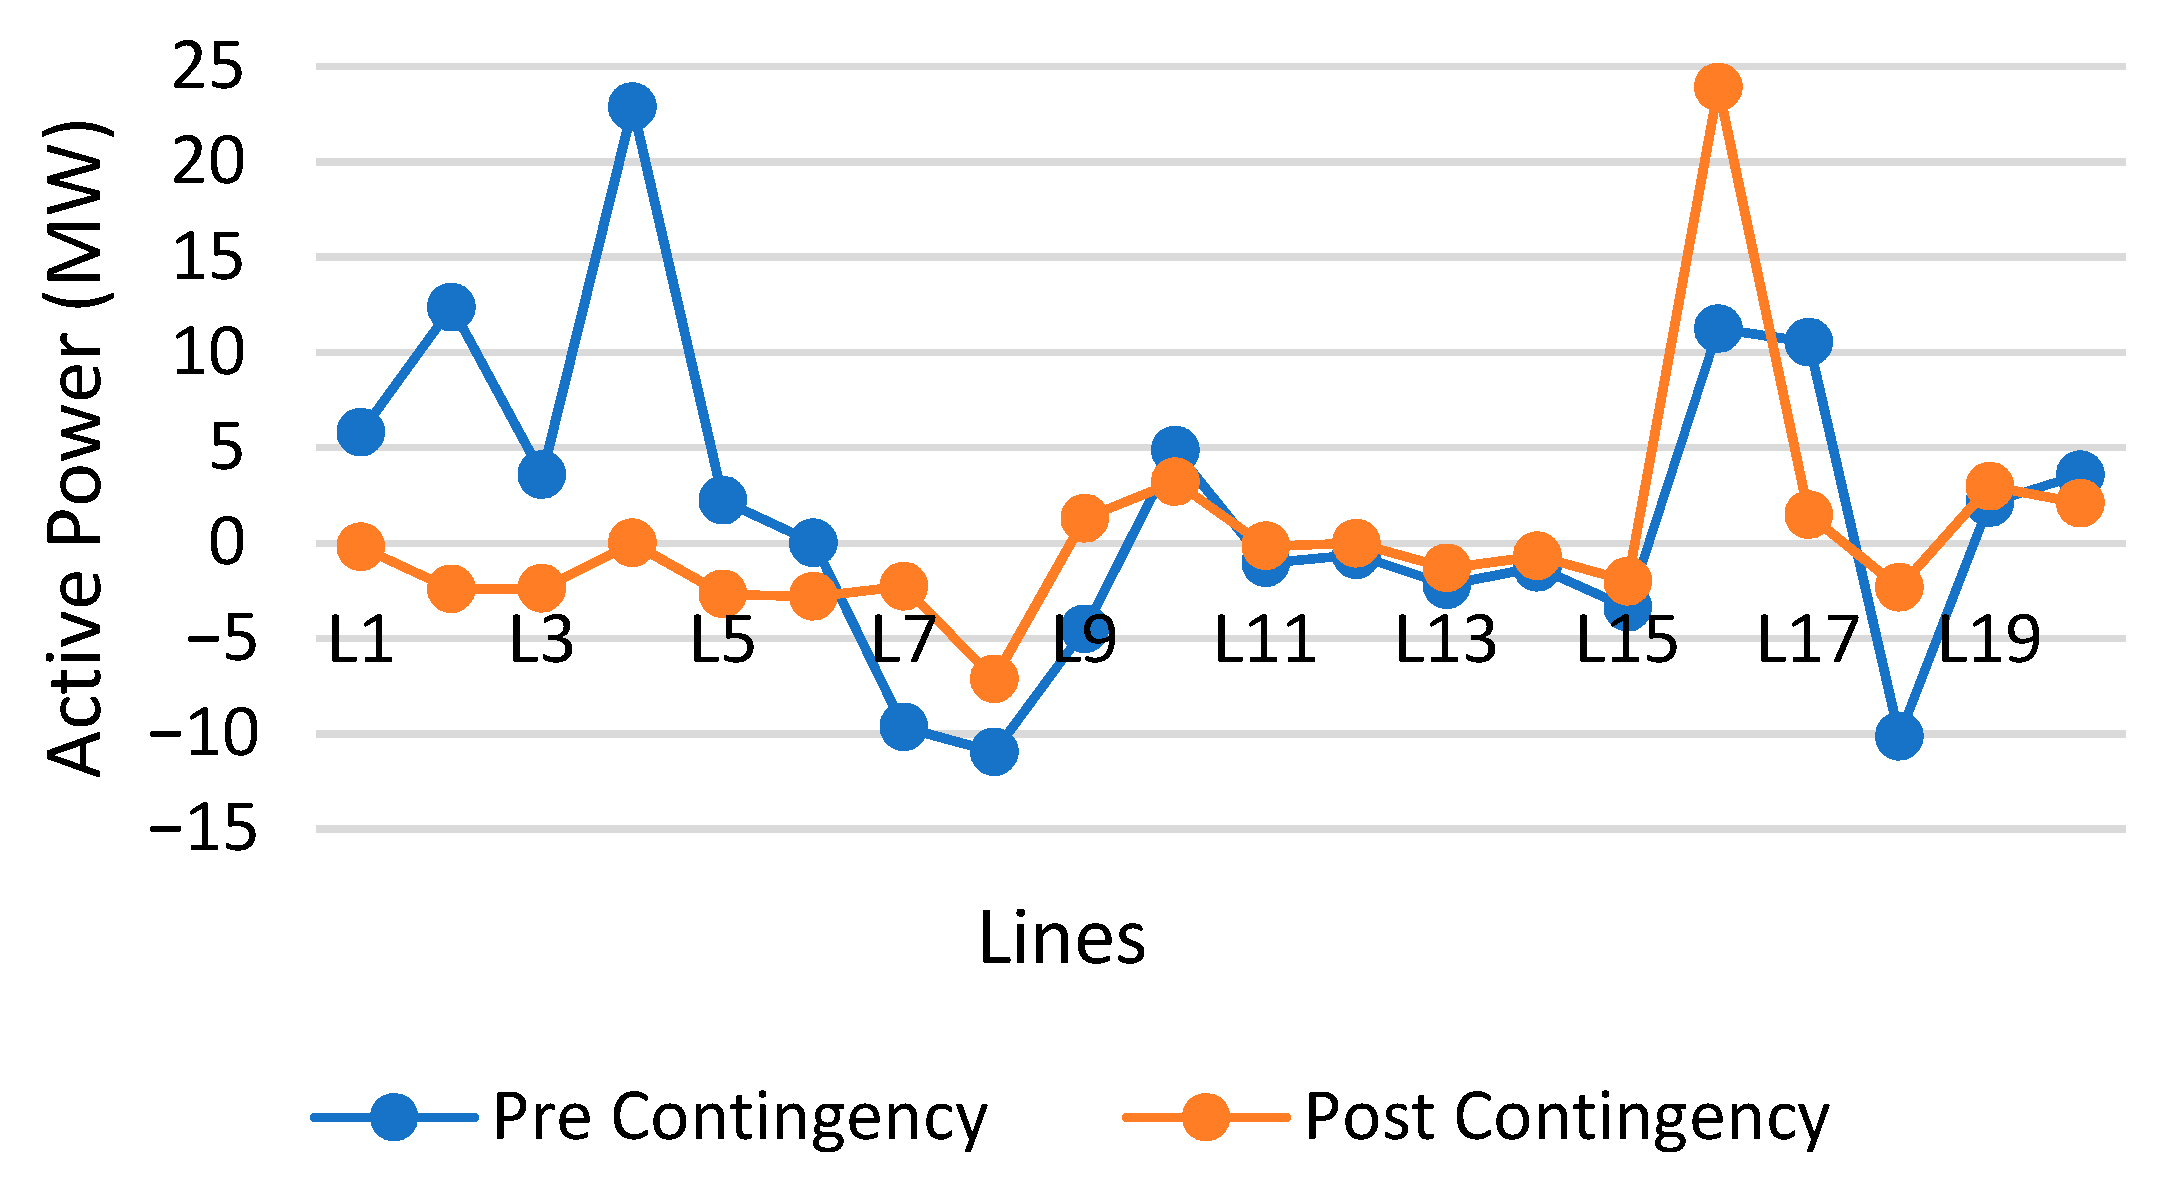
A case involving scenario S5 for planning year Y5 with line L4 in contingency is explained here. In this scenario, two DGs, DG11 and DG16, were available. Figure 7 shows a comparison between the active power flow through each branch in both the pre- and post-contingency cases. It is observed that using the ANM scheme, the system was still in a condition of normal operation even under contingency. As line L4 was considered as in contingency, the active power flow in lines L2 and L4 after the contingency was less than the active power flow before the contingency. However, the active power flow in line L16 was higher for the post-contingency compared to pre-contingency conditions.
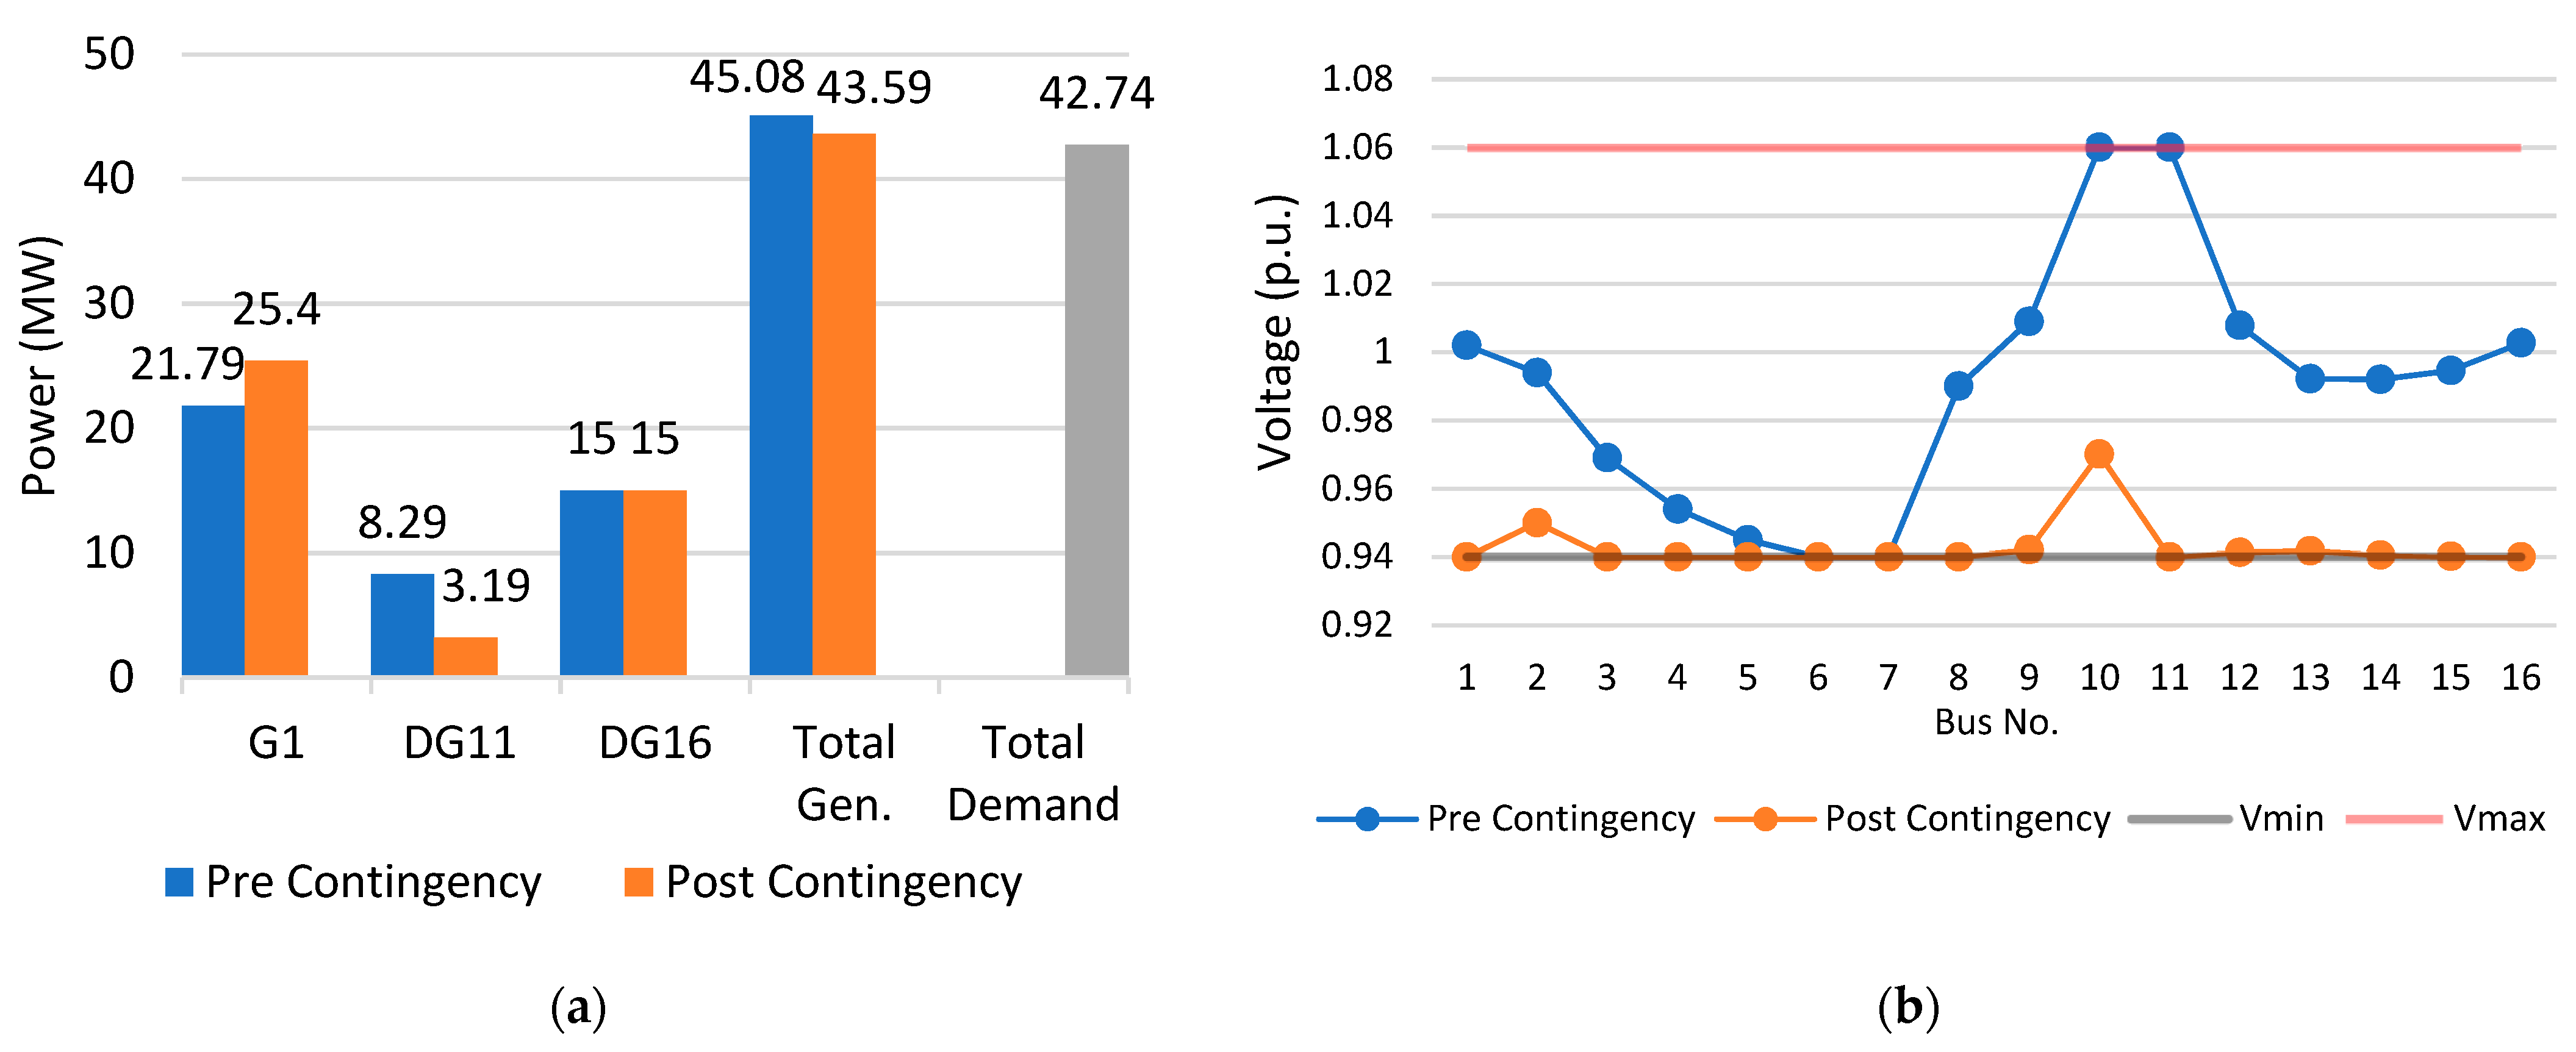
For feasible operation of the network, it is important to meet all network constraints, including network power balance and voltage limits. Figure 8 shows the bus total demand and generation in the network (a) and voltage at each bus (b) for pre- and post-contingency conditions.
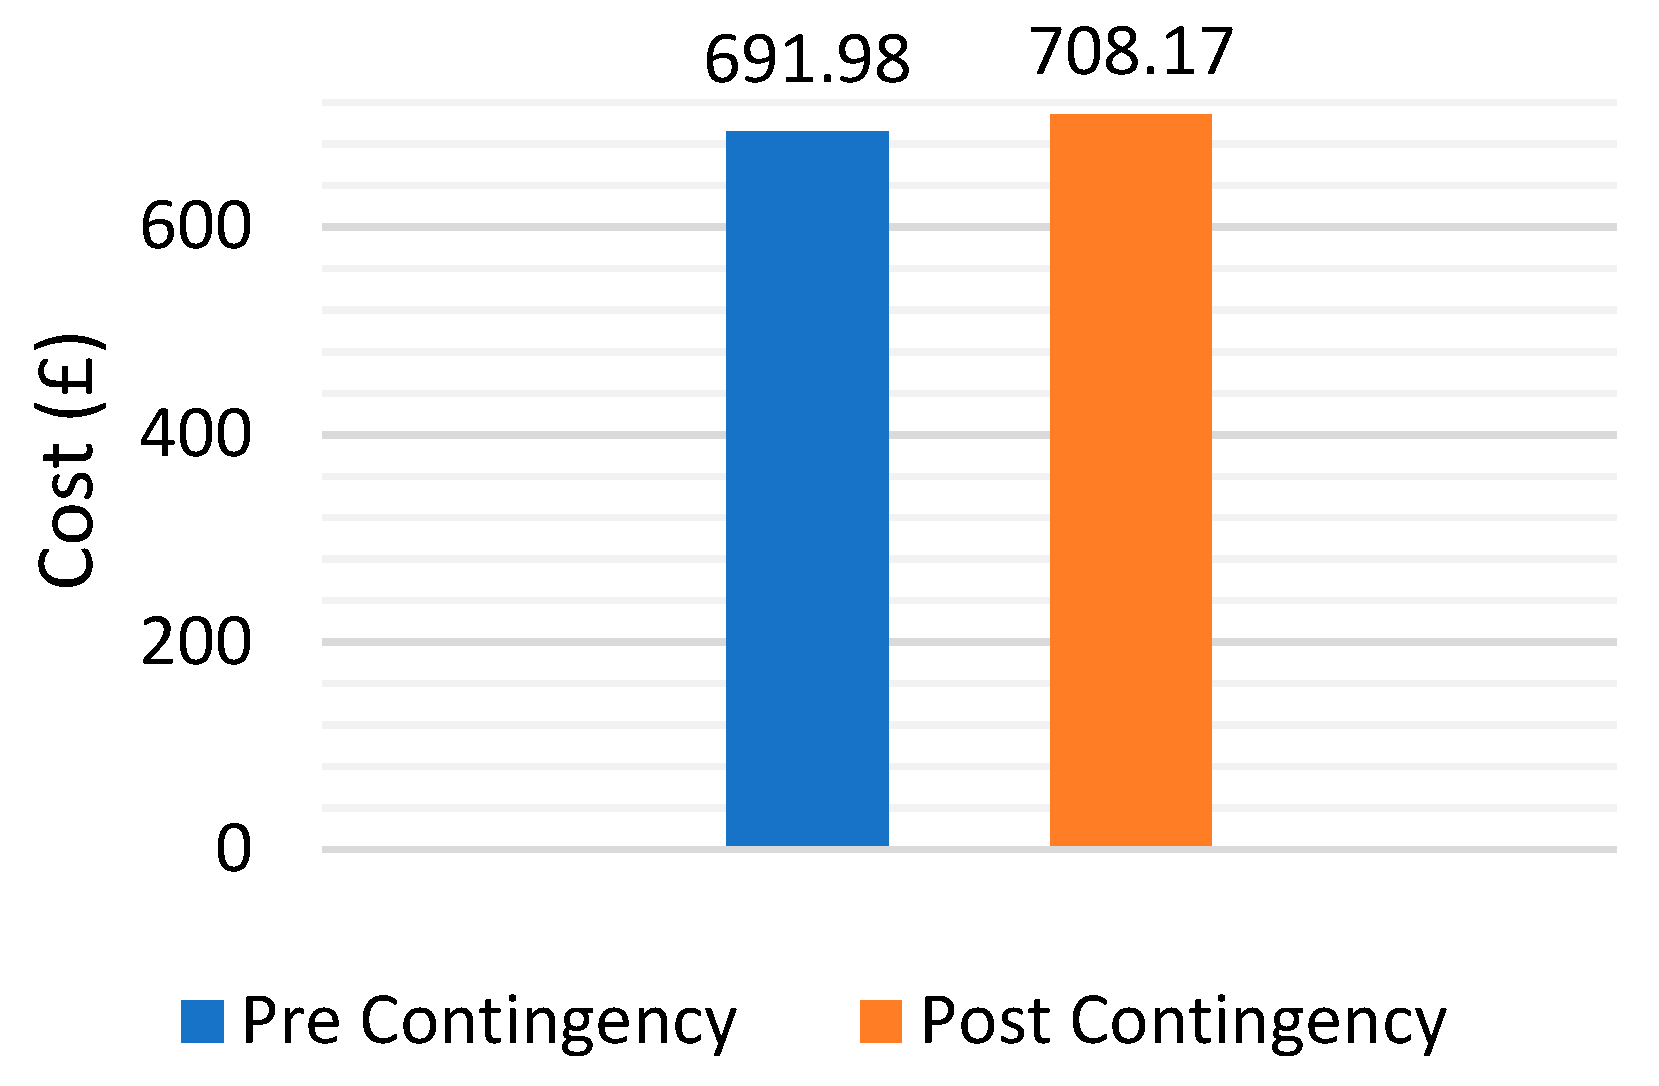
It is observed from Figure 8 that the ANM scheme was able to maintain the power balance and voltage on all buses within limits even under the contingency. In the pre-contingency condition, the total generation was 45.08 MW, of which 21.79 MW was coming from the feeder G1, and 23.29 MW was generated by DGs. After the contingency in L4, to meet total network demand of 42.74 MW, more power was taken from the feeder G1. As the contingency occurred near feeder G1, the network drew more active power from G1 to maintain the voltage at surrounding buses, especially at buses 5, 6, and 7. This resulted in power curtailment at DG11, from 8.29 MW to 3.19 MW. Consequently, the network operating cost also rose, from £691.98 to £708.17, after the contingency because of the more expensive power drawn from the grid. Figure 9 shows the total network operating cost for the pre- and post-contingency conditions.

6. Conclusions

A SCOPF-based meshed distribution network planning problem considering ANM and multi-DG configurations was formulated and validated on a 16-bus UKDGS over the planning period. Initially, an OPF-based network plan without ANM was applied in all scenarios. It was observed that using ANM can keep bus voltage within the statutory limit by selecting the proper OLTC tapping, which allowed DGs to generate more power to satisfy all network constraints. Moreover, the network operational cost with ANM was lower than without ANM in all scenarios. This was because ANM allowed DGs to generate more power, which was cheaper than the power coming from the feeder. The N-1 line contingency analysis proved that ANM can maintain network voltage and keep it operating feasibly under any N-1 contingency for most scenarios, which was not the case in most scenarios without ANM. From the results and the analysis, it can be concluded that integration of ANM can maintain network voltage and keep it operating in feasible conditions. Moreover, ANM mitigates the voltage rise effect caused by DGs, and allows them to generate more power at a cheaper rate. A meshed network with DGs and ANM provides more security to the network for any N-1 contingency case.

Author Contributions

Conceptualization, G.M.; methodology, B.A. and M.A.A.A.-J.; software, B.A.; validation, B.A. and M.A.A.A.-J.; formal analysis, B.A.; investigation, B.A. and M.A.A.A.-J.; resources, G.M.; data curation, M.A.A.A.-J.; writing—original draft preparation, B.A.; writing—review and editing, M.A.A.A.-J. and G.M.; visualization, B.A. and M.A.A.A.-J.; supervision, G.M.; project administration, G.M.; funding acquisition, G.M. All authors have read and agreed to the published version of the manuscript.

Funding

This work was supported in part by Innovate UK GCRF Energy Catalyst Pi-CREST project under Grant number 41358, in part by the British Academy GCRF COMPENSE project under Grant GCRFNGR3\1541 and in part by Mut’ah University, Jordan.

Institutional Review Board Statement

Not applicable.

Informed Consent Statement

Not applicable.

Data Availability Statement

Not applicable.

Conflicts of Interest

The authors declare no conflict of interest. The funders had no role in the design of the study; in the collection, analyses, or interpretation of data; in the writing of the manuscript, or in the decision to publish the results.

References

  1. Baruah, P.J.; Eyre, N.; Qadrdan, M.; Chaudry, M.; Blainey, S.; Hall, J.W.; Jenkins, N.; Tran, M. Energy system impacts from heat and transport electrification. Proc. Inst. Civ. Eng. Energy 2014, 167, 139–151. [Google Scholar] [CrossRef]
  2. Xinyu, C.; McElroy, M.B.; Qiuwei, W.U.; Yinbiao, S.H.U.; Yusheng, X.U.E. Transition towards higher penetration of renewables: An overview of interlinked technical, environmental and socio-economic challenges. J. Mod. Power Syst. Clean Energy 2019, 7, 1–8. [Google Scholar]
  3. Orkney ANM Live. Available online: https://www.ssen.co.uk/ANMGeneration/ (accessed on 4 May 2021).
  4. Powergrid, N. What Is Northern Powergrid Doing to Enable Active Network Management (ANM). Available online: https://northernpowergrid.custhelp.com/app/answers/detail/a_id/285/related/1 (accessed on 4 May 2021).
  5. Ochoa, L.F.; Mancarella, P. Low-carbon LV networks: Challenges for planning and operation. In Proceedings of the 2012 IEEE Power and Energy Society General Meeting, San Diego, CA, USA, 22–26 July 2012; pp. 1–2. [Google Scholar]
  6. Weedy, B.M.; Cory, B.J.; Jenkins, N.; Ekanayake, J.B.; Strbac, G. Electric Power Systems; John Wiley & Sons: Sussex, UK, 2012. [Google Scholar]
  7. Al-Jaafreh, M.A.A.; Mokryani, G. Planning and operation of LV distribution networks: A comprehensive review. IET Energy Syst. Integr. 2019, 1, 133–146. [Google Scholar] [CrossRef]
  8. Satya, J.P.; Bhatt, N.; Pasumarthy, R.; Rajeswaran, A. Identifying Topology of Power Distribution Networks Based on Smart Meter Data. arXiv 2016, arXiv:1609.02678. [Google Scholar]
  9. Taibi, E.; Nikolakakis, T.; Gutierrez, L.; Fernandez del Valle, C.; Kiviluoma, J.; Lindroos, T.; Rissanen, S. Power System Flexibility for the Energy Transition; IRENA: Abu Dhabi, United Arab Emirates, 2018. [Google Scholar]
  10. Liew, S.N.; Strbac, G. Maximising penetration of wind generation in existing distribution networks. IEE Proc. Gener. Transm. Distrib. 2002, 149, 256–262. [Google Scholar] [CrossRef]
  11. Ochoa, L.F.; Dent, C.J.; Harrison, G.P. Distribution network capacity assessment: Variable DG and active networks. IEEE Trans. Power Syst. 2009, 25, 87–95. [Google Scholar] [CrossRef] [Green Version]
  12. Al Kaabi, S.S.; Zeineldin, H.H.; Khadkikar, V. Planning active distribution networks considering multi-DG configurations. IEEE Trans. Power Syst. 2013, 29, 785–793. [Google Scholar] [CrossRef]
  13. Mokryani, G.; Siano, P. Strategic placement of distribution network operator owned wind turbines by using market-based optimal power flow. IET Gener. Transm. Distrib. 2014, 8, 281–289. [Google Scholar] [CrossRef]
  14. Mokryani, G.; Siano, P.; Piccolo, A. Optimal allocation of wind turbines in microgrids by using genetic algorithm. J. Ambient Intell. Humaniz. Comput. 2013, 4, 613–619. [Google Scholar] [CrossRef]
  15. Abapour, S.; Babaei, E.; Khanghah, B.Y. Application of active management on distribution network with considering technical issues. In Proceedings of the 2nd Iranian Conference on Smart Grids, Tehran, Iran, 24 May 2012; pp. 1–6. [Google Scholar]
  16. Barr, J.; Majumder, R. Integration of Distributed Generation in the Volt/VAR Management System for Active Distribution Networks. IEEE Trans. Smart Grid 2015, 6, 576–586. [Google Scholar] [CrossRef]
  17. Hashim, T.J.T.; Mohamed, A.; Shareef, H. A review on voltage control methods for active distribution networks. Prz. Elektrotechniczny (Electr. Rev.) 2012, 88, 304–312. [Google Scholar]
  18. Collinson, A.; Dai, F.; Beddoes, A.; Crabtree, J. Solutions for the connection and operation of distributed generation. In DTI Distributed Generation Programme; Department of Trade and Industry: London, UK, July 2003. [Google Scholar]
  19. Shukla, A.; Verma, K.; Siddiqui, S.A. Optimal voltage regulation of a distribution network by output power management of DGs. In Proceedings of the 2015 Annual IEEE India Conference (INDICON), New Delhi, India, 17–20 December 2015; pp. 1–6. [Google Scholar]
  20. Sansawatt, T.; O’Donnell, J.; Ochoa, L.F.; Harrison, G.P. Decentralised voltage control for active distribution networks. In Proceedings of the 2009 44th International Universities Power Engineering Conference (UPEC), Glasgow, UK, 1–4 September 2009; pp. 1–5. [Google Scholar]
  21. Conti, S.; Greco, A.M. Active MV distribution network planning coordinated with advanced centralized voltage regulation system. In Proceedings of the 2007 IEEE Lausanne Power Tech, Lausanne, Switzerland, 1–5 July 2007; pp. 2105–2109. [Google Scholar]
  22. Mokryani, G.; Hu, Y.F.; Pillai, P.; Rajamani, H.-S. Active distribution networks planning with high penetration of wind power. Renew. Energy 2017, 104, 40–49. [Google Scholar] [CrossRef] [Green Version]
  23. Zubo, R.H.; Mokryani, G. Active distribution network operation: A market-based approach. IEEE Syst. J. 2019, 14, 1405–1416. [Google Scholar] [CrossRef]
  24. Zubo, R.H.A.; Mokryani, G.; Rajamani, H.-S.; Aghaei, J.; Niknam, T.; Pillai, P. Operation and planning of distribution networks with integration of renewable distributed generators considering uncertainties: A review. Renew. Sustain. Energy Rev. 2017, 72, 1177–1198. [Google Scholar] [CrossRef] [Green Version]
  25. Gao, P.; Chen, H.; Zheng, X.; Wu, B. Framework planning of active distribution network considering active management. J. Eng. 2017, 2017, 2093–2097. [Google Scholar] [CrossRef]
  26. Agalgaonkar, Y.P.; Pal, B.C.; Jabr, R.A. Distribution voltage control considering the impact of PV generation on tap changers and autonomous regulators. IEEE Trans. Power Syst. 2013, 29, 182–192. [Google Scholar] [CrossRef] [Green Version]
  27. Anthony, I.O.; Mokryani, G.; Zubo, R.H.; Ezechukwu, O.A.; Ivry, P. Distribution Network Reconfiguration Considering Security-Constraint and Multi-DG Configurations. In Proceedings of the 2020 55th International Universities Power Engineering Conference (UPEC), Torino, Italy, 1–4 September 2020; pp. 1–6. [Google Scholar]
  28. Hughes, J. The Integrated Energy and Communication Systems Architecture; Electric Power Research Institute (EPRI) and and Electricity Innovation Institute: Palo Alto, CA, USA, 2004. [Google Scholar]
  29. Karbalaei, F.; Shahbazi, H.; Mahdavi, M. A new method for solving preventive security-constrained optimal power flow based on linear network compression. Int. J. Electr. Power Energy Syst. 2018, 96, 23–29. [Google Scholar] [CrossRef]
  30. Dvorkin, Y.; Henneaux, P.; Kirschen, D.S.; Pandžić, H. Optimizing primary response in preventive security-constrained optimal power flow. IEEE Syst. J. 2016, 12, 414–423. [Google Scholar] [CrossRef]
  31. Capitanescu, F.; Glavic, M.; Ernst, D.; Wehenkel, L. Contingency filtering techniques for preventive security-constrained optimal power flow. IEEE Trans. Power Syst. 2007, 22, 1690–1697. [Google Scholar] [CrossRef]
  32. Gupta, M.; Abhyankar, A. Impact of Active Distribution Network on Contingency Analysis of Transmission System. In Proceedings of the 2019 North American Power Symposium (NAPS), Wichita, KS, USA, 13–15 October 2019; pp. 1–6. [Google Scholar]
  33. Marcelino, C.G.; Almeida, P.E.; Wanner, E.F.; Baumann, M.; Weil, M.; Carvalho, L.M.; Miranda, V. Solving security constrained optimal power flow problems: A hybrid evolutionary approach. Appl. Intell. 2018, 48, 3672–3690. [Google Scholar] [CrossRef] [Green Version]
  34. Roald, L.; Oldewurtel, F.; Van Parys, B.; Andersson, G. Security constrained optimal power flow with distributionally robust chance constraints. arXiv 2015, arXiv:1508.06061. [Google Scholar]
  35. Papaefthymiou, G.; Verboomen, J.; Schavemaker, P.H.; van der Sluis, L. Impact of stochastic generation in power systems contingency analysis. In Proceedings of the 2006 International Conference on Probabilistic Methods Applied to Power Systems, Stockholm, Sweden, 11–15 June 2006; pp. 1–6. [Google Scholar]
  36. Liu, J.; Cheng, H.; Xu, Q.; Lan, Z.; Zeng, P.; Yao, L. Optimal distributed generation placement and size under uncertainties and contingencies in active distribution networks. In Proceedings of the 2016 IEEE PES Asia-Pacific Power and Energy Engineering Conference (APPEEC), Xi’an, China, 25–28 October 2016; pp. 1245–1249. [Google Scholar]
  37. Ding, T.; Li, C.; Liu, X.; Xie, H.; Tang, Y.; Huang, C. Optimally Allocating Energy Storage for Active Distribution Networks to Reduce the Risk Under N-1 Contingencies. IEEE Syst. J. 2021. [Google Scholar] [CrossRef]
  38. Mendes, A.; Boland, N.; Guiney, P.; Riveros, C. (N-1) contingency planning in radial distribution networks using genetic algorithms. In Proceedings of the 2010 IEEE/PES Transmission and Distribution Conference and Exposition: Latin America (T&D-LA), Sao Paulo, Brazil, 8–10 November 2010; pp. 290–297. [Google Scholar]
  39. Brooke, A.; Kendrick, D.; Meeraus, A.; Raman, R.; America, U. The general algebraic modeling system. GAMS Dev. Corp. 1998. Available online: https://camo.ici.ro/language/ml05.htm (accessed on 30 May 2020).
  40. Smeers, Y. Generalized reduced gradient method as an extension of feasible direction methods. J. Optim. Theory Appl. 1977, 22, 209–226. [Google Scholar] [CrossRef]
  41. Drud, A. CONOPT. Available online: https://www.gams.com/latest/docs/S_CONOPT.html (accessed on 30 May 2020).
  42. Abadie, J.; Carpentier, J. Generalization of the Wolfe Reduced Gradient Method to the Case of Nonlinear Constraints; Academic Press: New York, NY, USA, 1969; pp. 37–48. [Google Scholar]
  43. Lai, C.S.; McCulloch, M.D. Levelized cost of electricity for solar photovoltaic and electrical energy storage. Appl. Energy 2017, 190, 191–203. [Google Scholar] [CrossRef]
  44. Centre for Sustainable Electricity and Distributed Generation (SEDG), United Kingdom Generic Distribution System (UK GDS). 2011. Available online: https://github.com/sedg/ukgds (accessed on 19 September 2019).
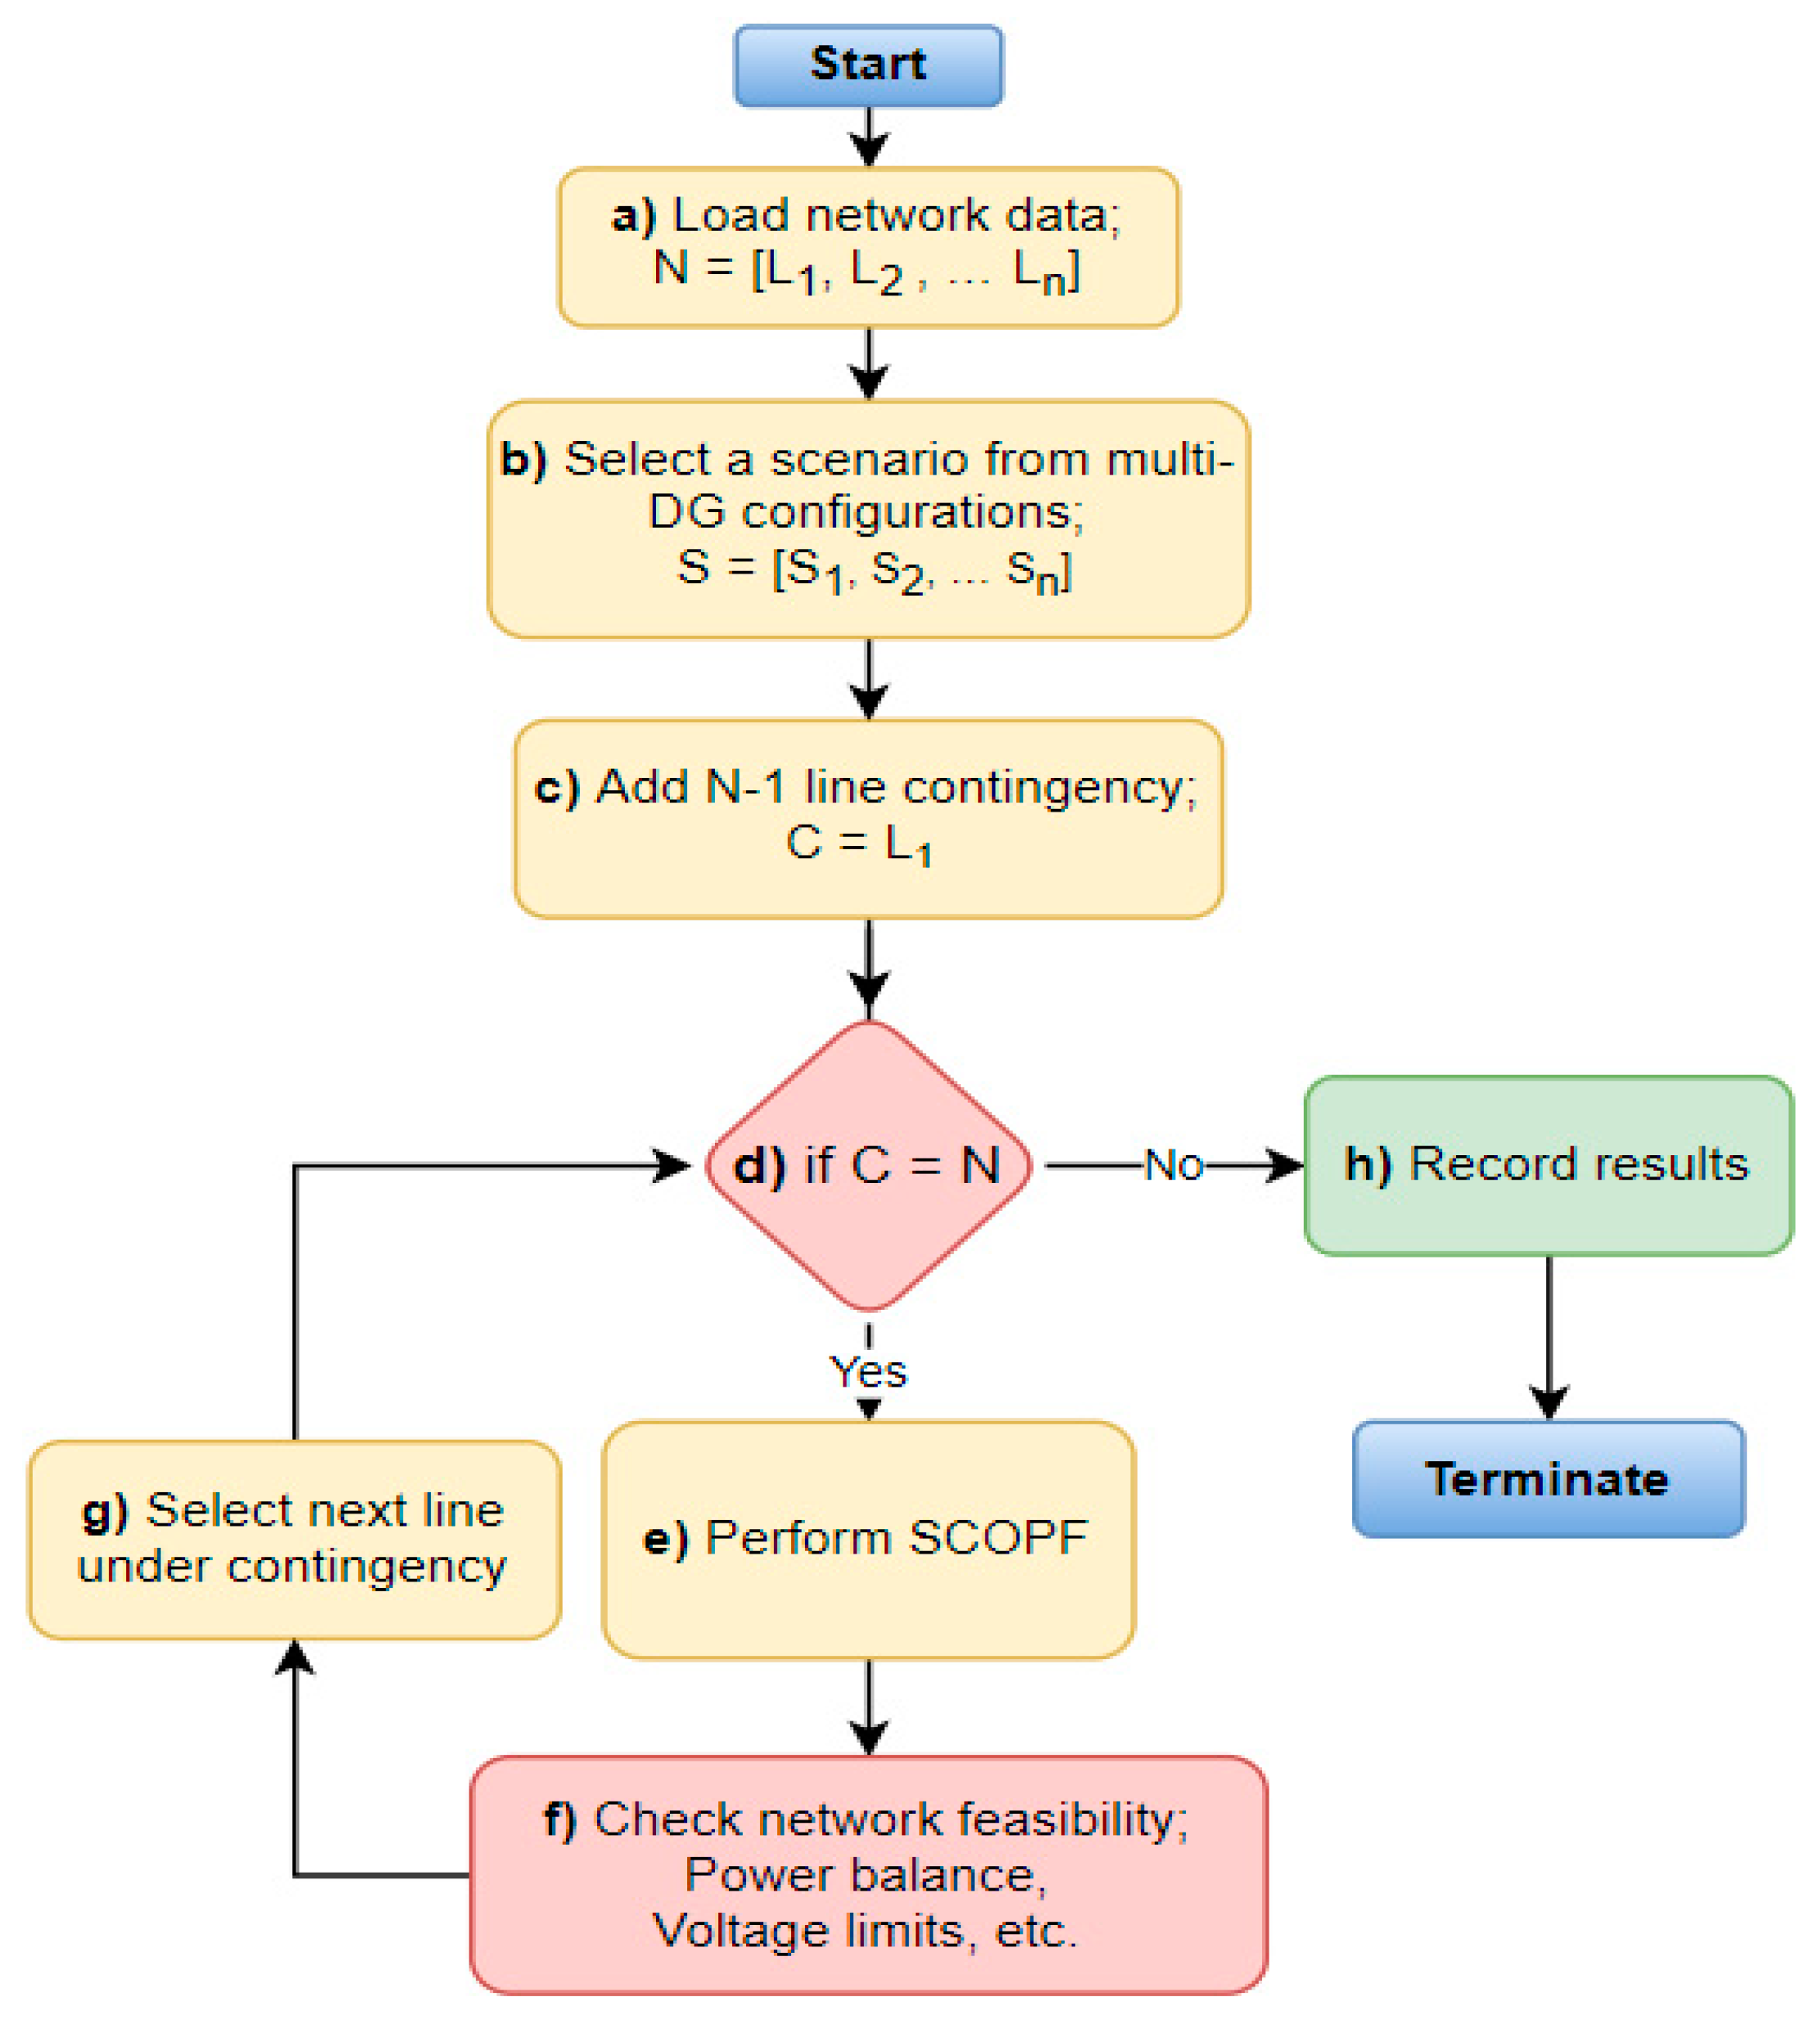
Figure 1. Flowchart of the proposed method for N-1 line contingency analysis.
Energies 14 04361 g001
Figure 2. Weakly meshed 16-bus UKGDS with the allocation of DGs.
Energies 14 04361 g002
Figure 3. Scenario S7: total demand and generation under ANM.
Energies 14 04361 g003
Figure 4. Scenario S7, year Y3: Comparison of planning with and without ANM. (a) Power generation from each generator, (b) voltage at each bus.
Energies 14 04361 g004
Figure 5. Scenario S3, year Y5: Comparison of network planning with and without ANM. (a) Power generated by DG16, (b) voltage at each bus.
Energies 14 04361 g005
Figure 6. Overall network operating cost comparison for network planning with and without ANM.
Energies 14 04361 g006
Figure 7. Pre- and post-contingency active power flow from each line.
Energies 14 04361 g007
Figure 8. Scenario S3, year Y5: pre- and post-contingency results considering line L4 in contingency. (a) Power generation and demand, (b) voltage at each bus.
Energies 14 04361 g008
Figure 9. Scenario S3, year Y5: pre- and post-contingency network operating cost considering line L4 in contingency.
Energies 14 04361 g009
Table 1. Characteristics of radial and meshed distribution networks.
CharacteristicsMeshedRadial
StructureQuite complex network structureClear and simple network structure
Protection system and load flowComplicated to design protection system and control the power flow of the systemEasy to design protection system and control the power flow of the system
Load density and reliabilityHigh load densities and reliability requirementsUsually has low load density where reliability is not so important
OperationEasy operation under normal operating conditions, but an outage of LV lines will be hard to recognizeSimple operation under normal operating conditions
Lines loadingLoading of the lines for normal operating condition up to 70%Loading of lines during normal operation up to 100%
System lossesSystem losses minimalSystem losses comparatively high
Overall network costMuch higher network cost than other topologies, and set-up and maintenance are very difficultLow overall cost, relatively simple to coordinate and design and maintain
Maintenance costHigh maintenance costMaintenance cost rather small
Voltage ProfileVoltage profile flatVoltage profile not very good; distinct voltage drops between the feeding and the receiving ends of lines
Changed load flexibilityFlexibility for changed load conditions highFlexibility for changed load conditions is comparatively small
Reserve (in case of outage)Reserve path is available in case of outage of the feederReserve for loss of the feeder is usually missing
StandardizationStandardization of cross-sections of lines possibleStandardization of cross-sections of lines possible, but not advisable
Table 2. Comparison of the proposed method for SCOPF with existing methods.
Ref No.Type of ProblemNetwork
Topology/Type
Contingency TypeNumber of ContingenciesANM SchemeMulti DG
Configuration
Computational Time (minutes)
[29]OperationRadial DN 1Selected lines and generators10NoNo10
[30]OperationMeshed TN 2Selected generators22NoNo4
[32]OperationRadial DNSelected lines6NoNo-
[33]OperationMeshed TNSelected lines9NoNo-
[36]OperationRadial DNSelected feeder and transformer9YesNo-
[37]OperationRadial DNSelected lines3NoNo1
[38]PlanningRadial DNSelected buses34NoNo-
ProposedPlanningMeshed DNAll lines20YesYes2
1 Distribution network. 2 Transmission network.
Table 3. Multi-DG configuration scenarios.
ScenariosDG5DG11DG16
S1100
S2010
S3001
S4110
S5011
S6101
S7111
Table 4. 16-bus system, network security analysis under radial and meshed topologies.
ScenarioLine in
Contingency
Disconnected Buses as
Result of Contingency
Total Number of
Disconnected Buses
RadialMeshedRadialMeshed
S1L4--00
L56, 7-20
L78, 9, 10, 11, 12-50
S3L45-10
L56, 7-20
L78, 9, 10, 11, 12-50
S5L45-10
L56, 7-20
L7--00
Publisher’s Note: MDPI stays neutral with regard to jurisdictional claims in published maps and institutional affiliations.