Article

Analysis of the Influence of Silicone Rubber Aging on the Transmission Parameters of Terahertz Waves

1
School of Electrical Engineering, Beijing Jiaotong University, Beijing 100044, China
2
Yuxi Power Supply Bureau, China Southern Power Grid Yunnan Power Grid Co., Ltd., Yuxi 653100, China
3
School of Materials Science and Engineering, China University of Petroleum (East China), Qingdao 266580, China
*
Author to whom correspondence should be addressed.
Energies 2021, 14(14), 4238; https://doi.org/10.3390/en14144238
Submission received: 4 June 2021 / Revised: 4 July 2021 / Accepted: 12 July 2021 / Published: 14 July 2021

Abstract

:
In this study, a method for testing the aging of silicone rubber insulators using terahertz waves in the 0.17–0.22 THz frequency band is proposed, aiming at the problem of online non-destructive testing of the aging degree of composite insulators. The relationship between the aging degree of silicone rubber composite insulators and the relative dielectric constant was studied through first-principles calculations and molecular chain scission models. In addition, the electromagnetic model of the terahertz signal incident on the silicon rubber sheet was simulated and the relationship between the aging degree of the silicon rubber and the terahertz input return loss was obtained. Eleven insulator samples with different degrees of aging were selected. In these samples, the degree of aging was calibrated according to the degree of surface deterioration and the average partial discharge voltage. The terahertz return loss measurement experiment was performed after that. Finally, the results of experiment and calculation simulation were compared and the reliability of the relationship between the aging degree of the silicone rubber insulator and the terahertz input return loss was verified.

1. Introduction

Silicone rubber composite insulators have excellent pollution flashover resistance, a light weight, and are easy to transport and install. In recent years, these materials have been widely used in insulating high voltage overhead transmission lines and substation equipment [1]. In the meantime, aging induced performance degradation has become a serious problem [2]. Aging decreases the hydrophobicity and pollution resistance of the material, and both problems may lead to accidents, such as insulation breakdown, which seriously threaten power grid operation safety [3,4]. The aging detection of silicone rubber insulators has been an important topic for a long time both at home and abroad. Existing methods such as hydrophobicity detection, insulation resistance detection, and leakage current detection all require the insulator to be disassembled and tested offline, which further requires cumbersome operational protocols, causes a heavy workload, and even increases the risk of breaking the continuity of the power grid system.
In view of the above problems, domestic and foreign scientific researchers have conducted much research on non-contact and non-destructive aging detection methods for silicone rubber insulators. Among them are infrared imaging methods, ultraviolet imaging methods, ultrasonic methods, X-ray methods, and other detection methods [5]. Infrared imaging consists in performing insulation detection by detecting the infrared signal emitted by the abnormal increase in surface temperature after the deterioration of the insulation material. It can be used for on-site non-destructive testing, but its accuracy will be affected by the surrounding environment and the detection mode of the equipment. [6,7,8]. Ultraviolet imaging consists of detecting the partial discharge signal on the surface of the material, and using this as a basis to determine the type of failure. This method can accurately detect leakage tracking, the adhesion of conductive particles, or the internal carbonization on the surface of the insulator umbrella, and its shortcomings are similar to the infrared imaging method [9]. The principle of ultrasonic testing is to collect the sound waves generated by the partial discharge of insulators and determine the insulation state. However, it is also easy to be affected by the external environment and lead to low accuracy [10,11]. X-ray imaging is feasible for most defect detection of insulators, including umbrella skirt sheath, mandrel, the tightness of the connection between the sheath, etc. [12]. However, X-rays are not sensitive enough to detect the gap between the sheath, the core rod, and the ablation of the core rod. In addition, the energy of X-ray electromagnetic waves is high, and long-term direct contact may cause certain physical damage to the inspectors and require more complex protective measures, which increases the cost of inspection.
Considering the shortcomings of existing testing methods, finding a non-contact testing method with high accuracy that is convenient to operate, safe, and capable of providing reliable diagnoses of the aging status of silicone rubber insulators is of great significance for troubleshooting potential faulty electrical equipment and for discovering external insulation defects in a timely manner. In recent years, terahertz waves have attracted interest for their potential as a non-destructive testing method. Terahertz waves have strong penetrating power, easily penetrating materials that traditional light waves cannot penetrate. The ray energy is also relatively low, safe, and reliable. The frequency exceeds the general electromagnetic wave range but not the light wave range, and there are few interference sources in nature with a high signal-to-noise ratio. To a certain extent, terahertz wave technology makes up for the shortcomings of infrared, X-ray, and other detection methods [13]. The goal of this paper is to use terahertz waves as a detection method, first discussing the micro-aging mechanism of insulators, and then studying the transmission characteristics of terahertz signals in composite insulators through calculations, simulations, and experiments. Finally, we explore a new method for detecting the aging state of insulators using non-contact methods.

2. Theoretical and Computational Methods

Polymethylvinylsiloxane (PMVS) represents the building blocks of silicone rubber composite insulators. These insulators would be deployed outdoors, usually in hostile environments with several temperature variations, strong variations, and mechanical strains. All of these factors would interact with the electronic structure of the materials and, thus, would induce variations in the chemical bonding of the PMVS [14]. Previous studies have revealed that high temperature environments could cause thermal cracking of the material by breaking the main Si—O—Si chain. Some chemical substances such as acid-base substances and ozone could also break the Si—O—Si chain via chemical reactions, and a large number of charged particles produced by a corona arc or partial discharge are able to break the chain directly by strong polarization or scattering with the molecule [15]. Based on the influencing factors above, it can be seen that the influence of external factors on PMVS is mainly manifested as the rupture of the molecular chain. With the increase of working life time, a large number of molecular chain ruptures in the main chain will bring about PMVS insulation performance, which will change the mechanical properties and reduce its reliability. At the same time, molecular chain breaks would also cause changes in some of the material’s electromagnetic parameters, such as the dielectric constant (which provides conditions for accurate detection using terahertz waves).
When an electromagnetic wave is transmitted in an ideal medium, the wave vector k is given by
k = e n k = e n ω μ ε
where e n is the unit vector representing the direction of wave propagation, k is the wave number, ω is the frequency, μ is the magnetic permeability, and ε is the dielectric constant. The amplitude of the wave will not be attenuated.
On the other hand, when the wave above passes through a lossy medium, its wave vector k c changes to
k c = e n ω μ ε c = e n ω μ ( ε j σ ω )
where σ is the conductivity. It can be seen that when the conductivity of the medium is not zero, the wave transmission in the medium will be attenuated. Since the electrical conductivity of PMVS is extremely small ( 10 9 ~ 10 15   S / cm ), it is expected that the effect of electrical conductivity variation is small and negligible. In this work, we used first-principles calculations to explore the influence of the main chain break on the dielectric constant of PMVS. With the help of terahertz medium transmission simulation, the relationship between the change of the dielectric constant and the terahertz input return loss is found. Finally, the aging degree of 11 PMVS sample groups was calibrated through experiments, and the terahertz input return loss was measured. The results of input return loss measurement are used to verify the validity of the relationship between the aging degree of the silicone rubber obtained by the calculation simulation and the input return loss of the terahertz wave. This relationship provides strong support for the use of terahertz waves to accurately determine the aging degree of silicone rubber insulators.

3. First Principle Calculations

To reveal the microscopic mechanism of the aging of silicone rubber, and to construct a quantitative correlation between the chemical structure and macroscopic properties, we performed first principles calculations on the electronic structures of the silicone polymer chains. All of the calculations were conducted using the DMol3 package. We adopt a cluster model with Si—O—Si chain lengths varying from 1 to 18 dimethylsiloxane or methyl(ethyl)siloxane units (Figure 1). The two termini were saturated with methyl groups. To obtain reasonable chain configurations, the structures were optimized with a fixed distance between the terminal methyl groups. For each molecule, different molecular lengths were scanned to locate the potential energy minima. The DFT Semicore Pseudopotntial, the B3LYP scheme of functional and double numerical basis sets with polarization functions were employed to describe the nuclei–electron interactions, the exchange-correlation effects, and to expand the Kohn–Sham wavefunctions [16], respectively. The empirical dispersion correction by Grimme was used to describe the van der Waals interactions.
On the microscopic level, the law between the changes of the molecular structure and the dielectric properties of PMVS during the aging process was explored, and then the relationship between PMVS molecular microscopic parameters and material macroscopic parameters were established. Finally, CST (CST Microwave Studio, Boston, MA, USA) was used to establish an electromagnetic simulation model for terahertz signal detection of aging PMVS, which was used to explore the transmission characteristics of terahertz signal in the aging PMVS medium.

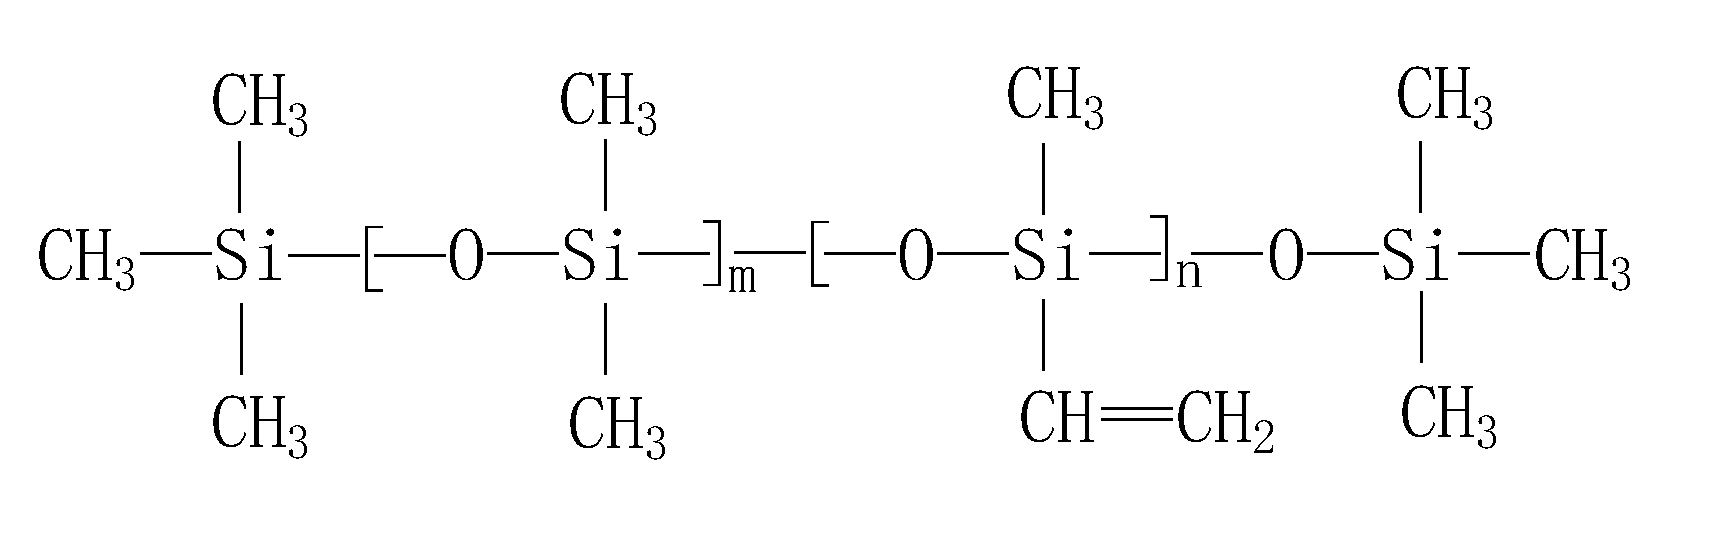
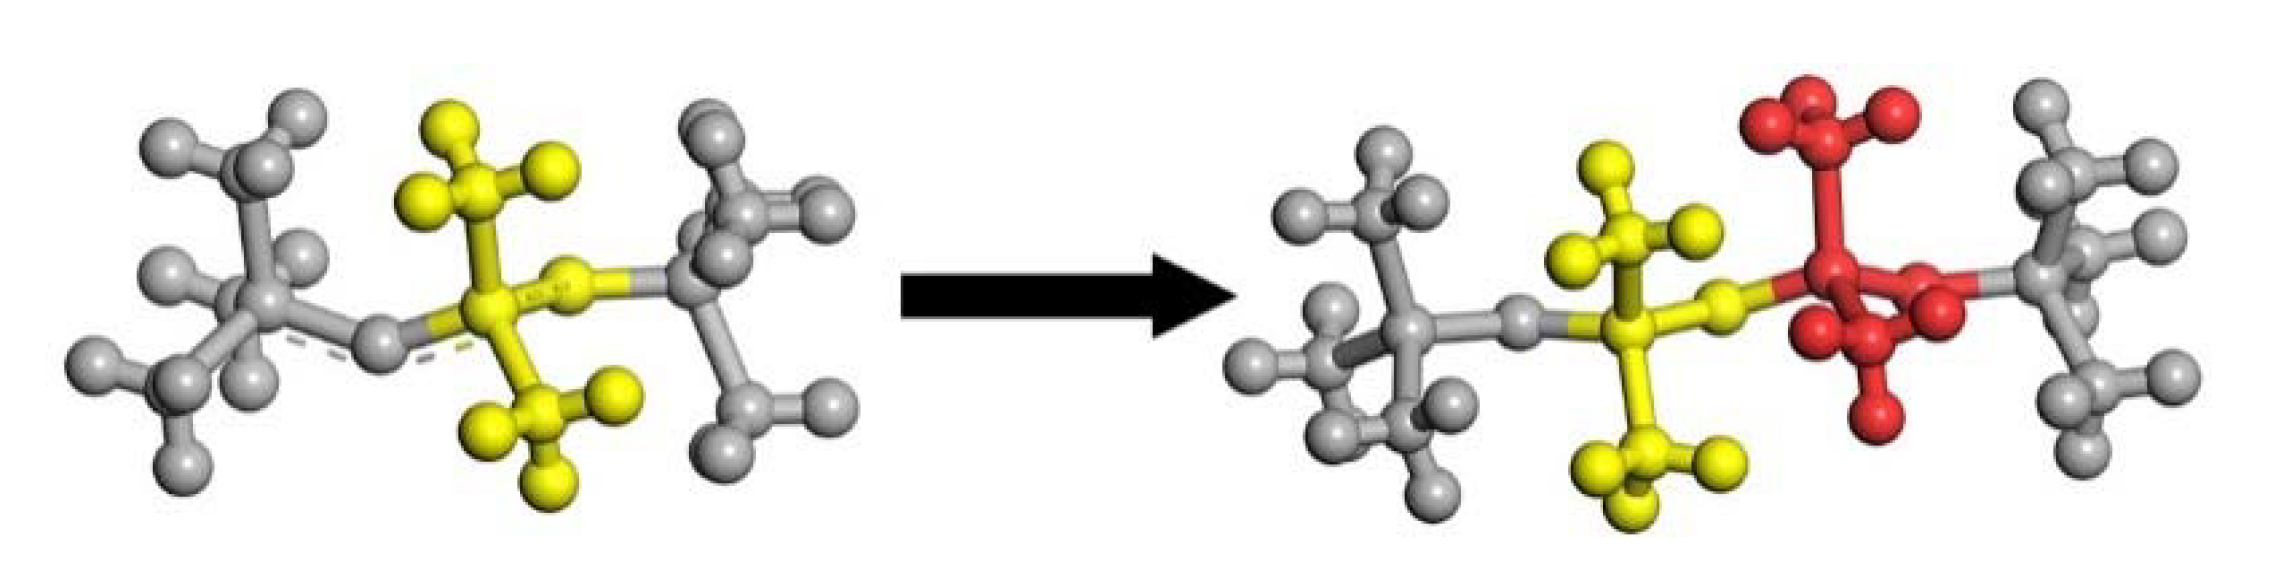
3.1. Molecular Simulation Method PMVS Aging Analysis

PMVS is a polymer of methyl vinyl siloxane chain link and dimethyl siloxane chain link. Its molecular structure is shown in Figure 1.
Vinyl occupies a very small proportion in the entire PMVS molecular chain, about 0.1–0.3% [17]. If the DFT calculation method is used to simulate the proportion of vinyl in the entire molecule, it is necessary to simulate at least a molecule with a chain link number of about 1000, which may greatly increase the difficulty of calculation. In addition, considering that the vibration frequency of vinyl is not in the terahertz band and it has a small influence on the dielectric constant, the vinyl on the side chain is ignored when building the molecular chain model. That is, only the polydimethylsiloxane (PDMS) calculation model is built.
The model used in molecular simulation calculations will be built below. In order to systematically study the influence of chain length increase on molecular dielectric behavior, this model was grown on the basis of the dimethylsiloxane short-chain model with three Si atoms in the main chain (Record the number of chain links as 1). Each additional —Si(CH3)2—O— was recorded as chain link plus 1. The schematic diagram of the increase of PDMS molecular chain is shown in Figure 2.
The number of oligomer chain links on the left side of Figure 2 is marked as 1, and the yellow part was one —Si(CH3)2—O— chain link. The red on the right side of Figure 2 was the chain link which has been added. After the increase, the number of oligomer chains on the right was recorded as 2. Finally, a total of 13 PDMS molecular chain models were built, and the number of chain links was 1–8, 10, 12, 14, 16, and 18. The molecular model of PDMS oligomer with 18 molecular chain links is shown in Figure 3.
The simulation uses the DMol3 module in Materials Studio; the basis set is B3LYP, the temperature was 298 K, the electric field was 0.001 a.u., and the dipole moment was calculated.
After calculating the number of dipole moments, we used the Clausius–Mosotti equation to calculate the dielectric constant [18,19]. The calculation equation is shown in the Equation (3)
{ ε r = 1 + 2 K ρ 1 K ρ K = 4 π N A α 3 M w
where ρ is the dielectric material density, N A is the Avogadro constant, M W is the molar mass of the molecule, α is the volume of the polarizability, and the relationship between α and the polarizability α is α = α / 4 π ε 0 .
The relationship between the number of single molecular chain links and the dielectric constant ε was finally obtained and fitted as shown in Figure 4.
As can be seen from the figure above, for a single silicone rubber molecular chain, when the molecular chain length grows, its relative dielectric constant gradually decreases in the form of a power function and eventually stabilizes.

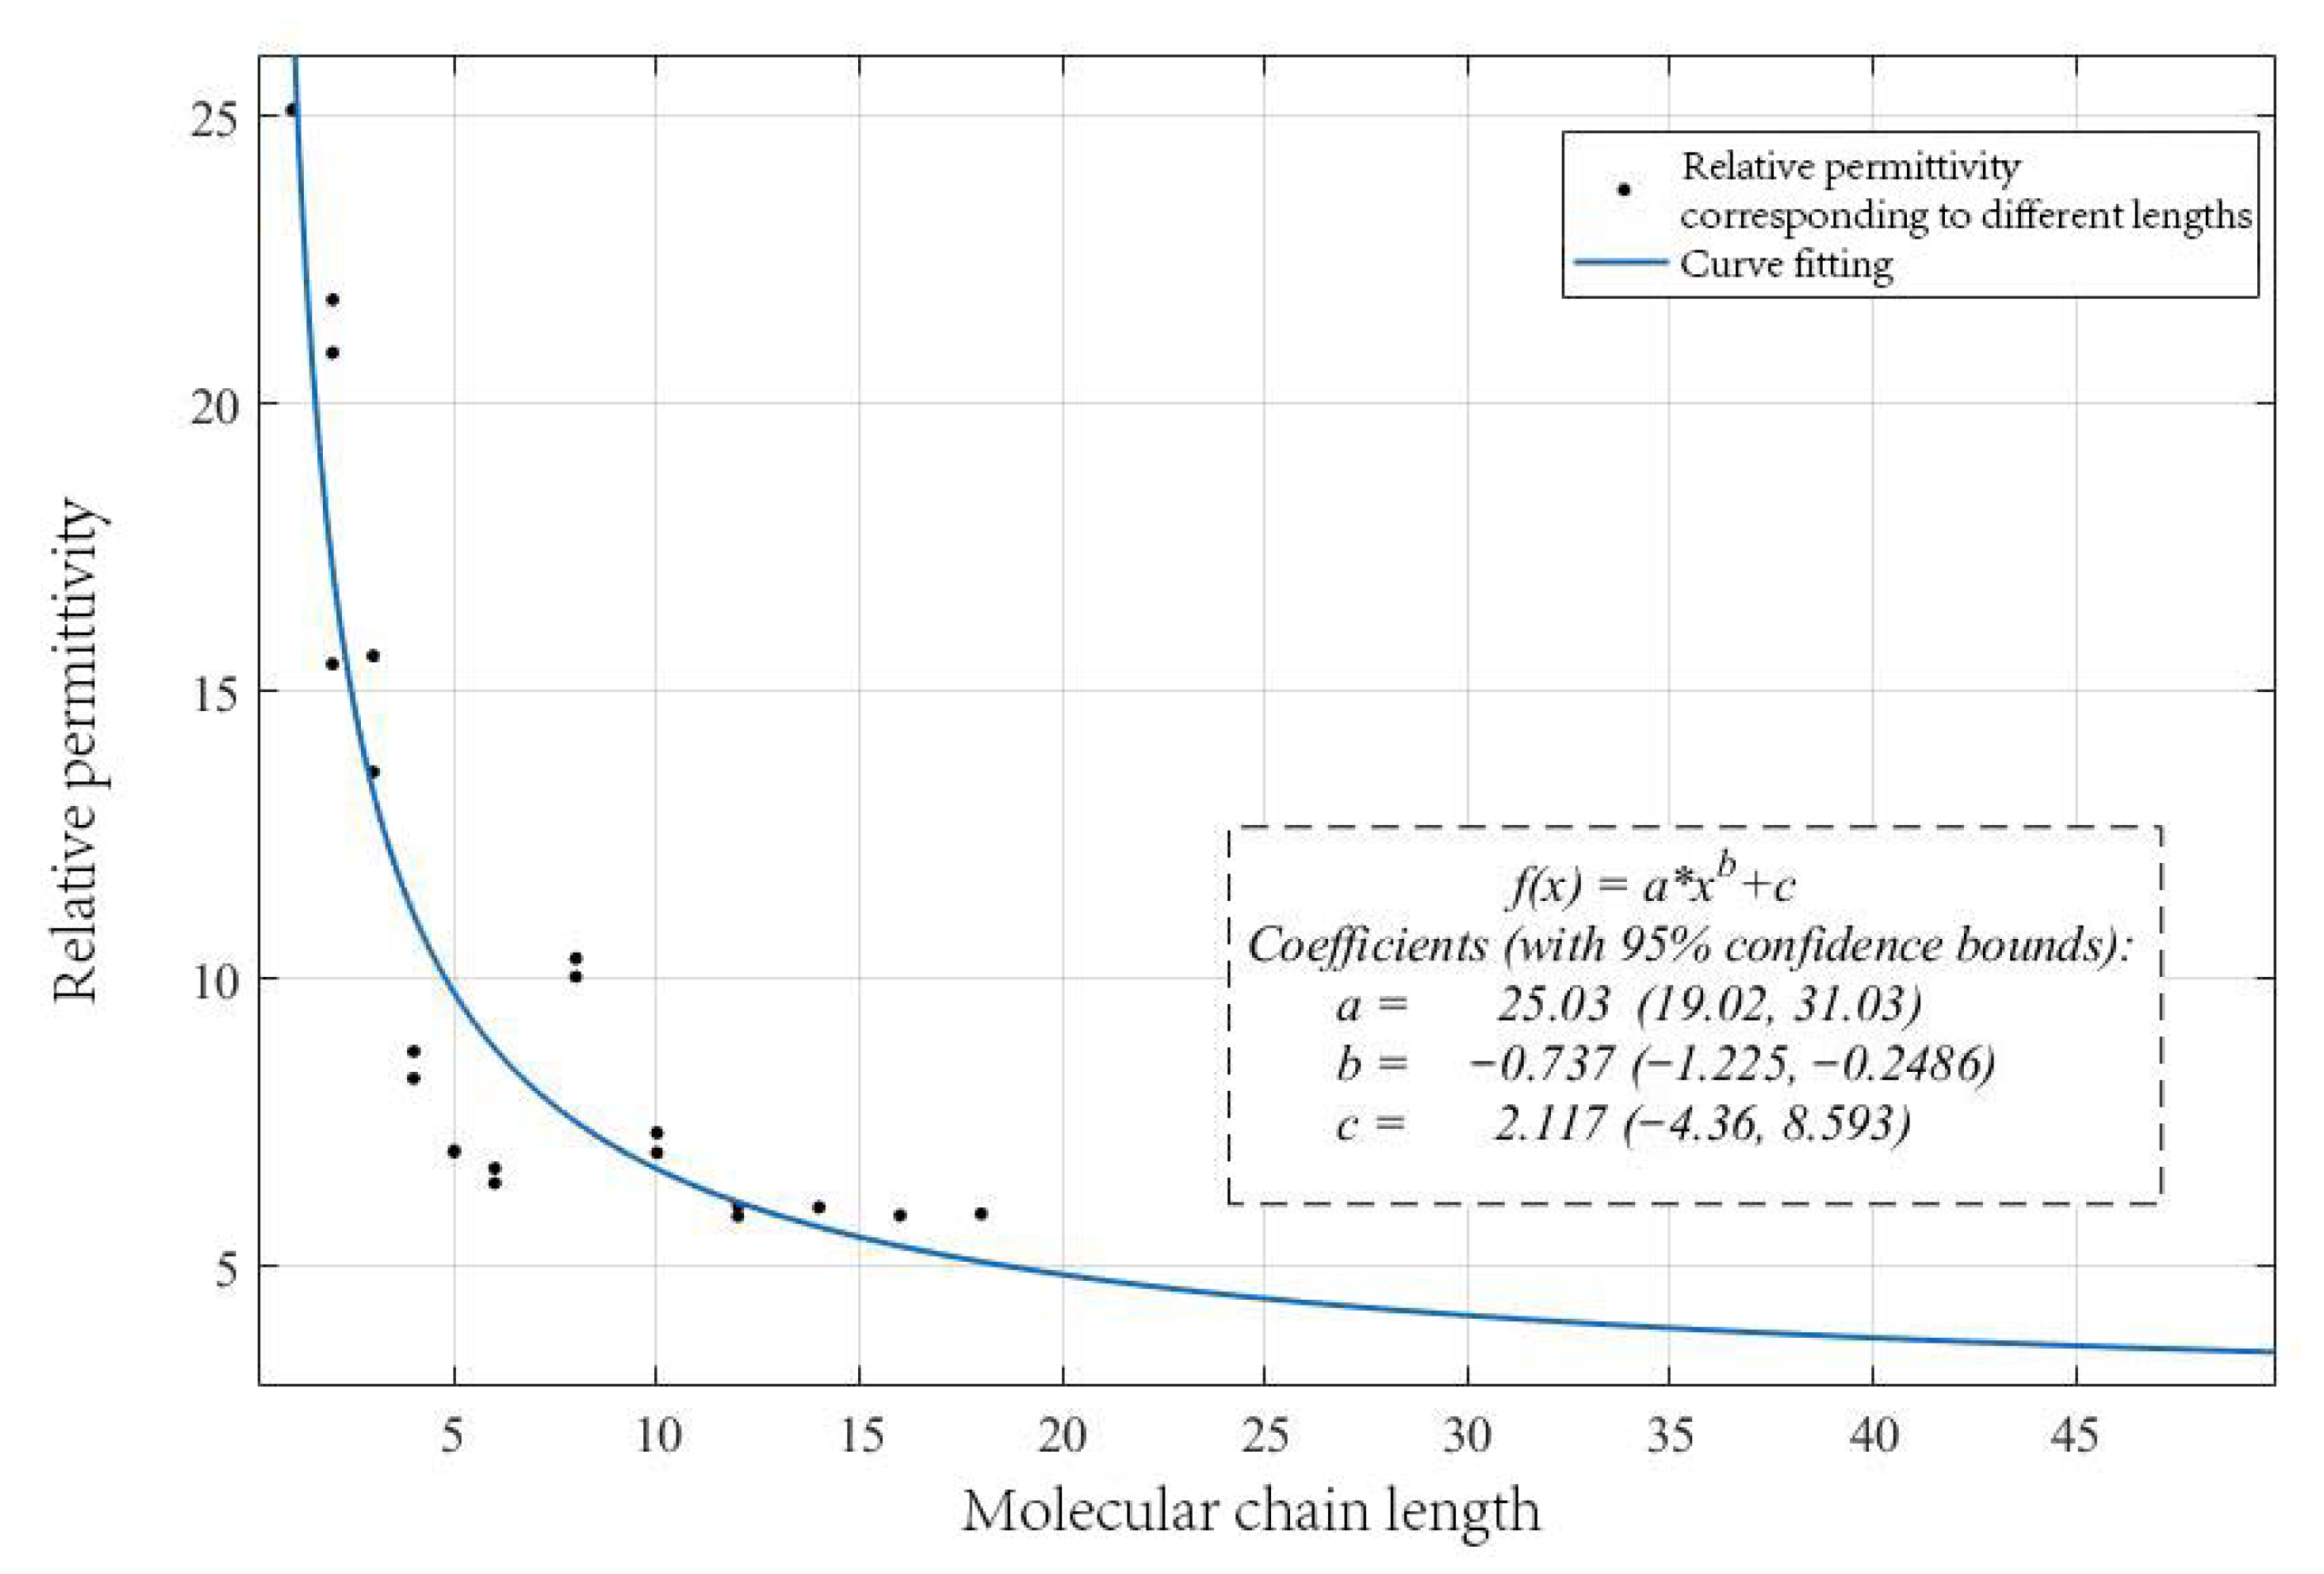
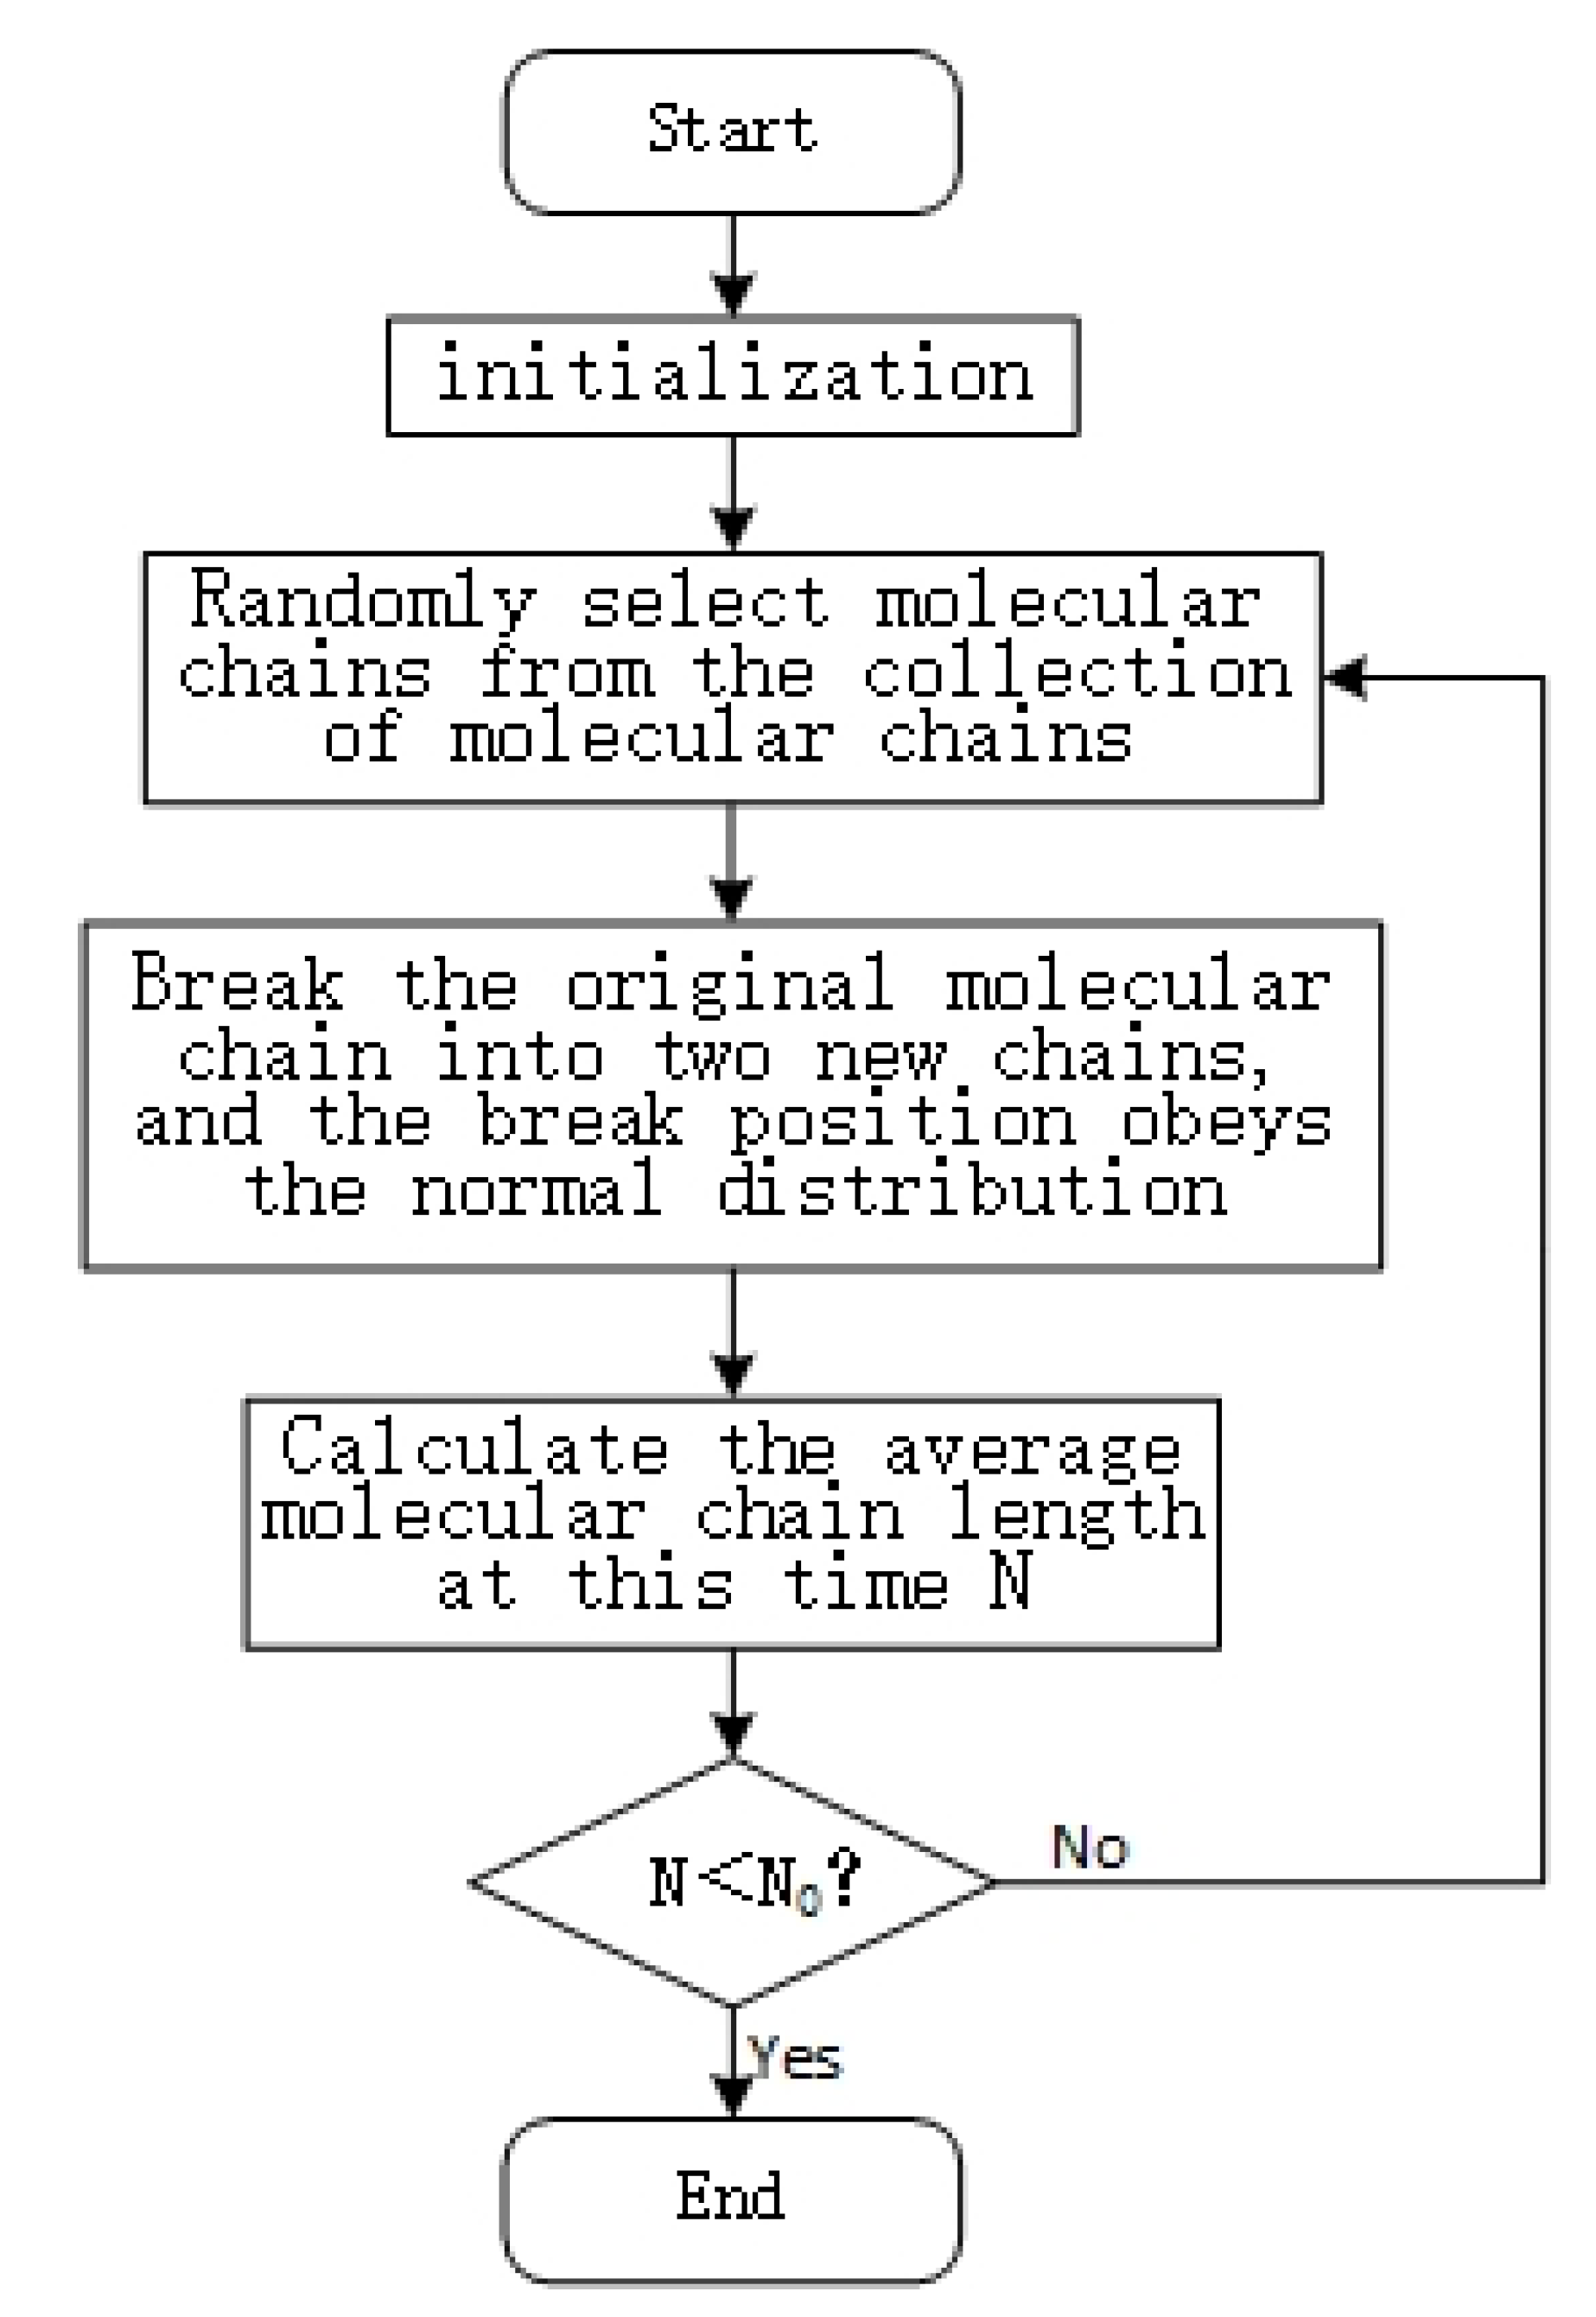
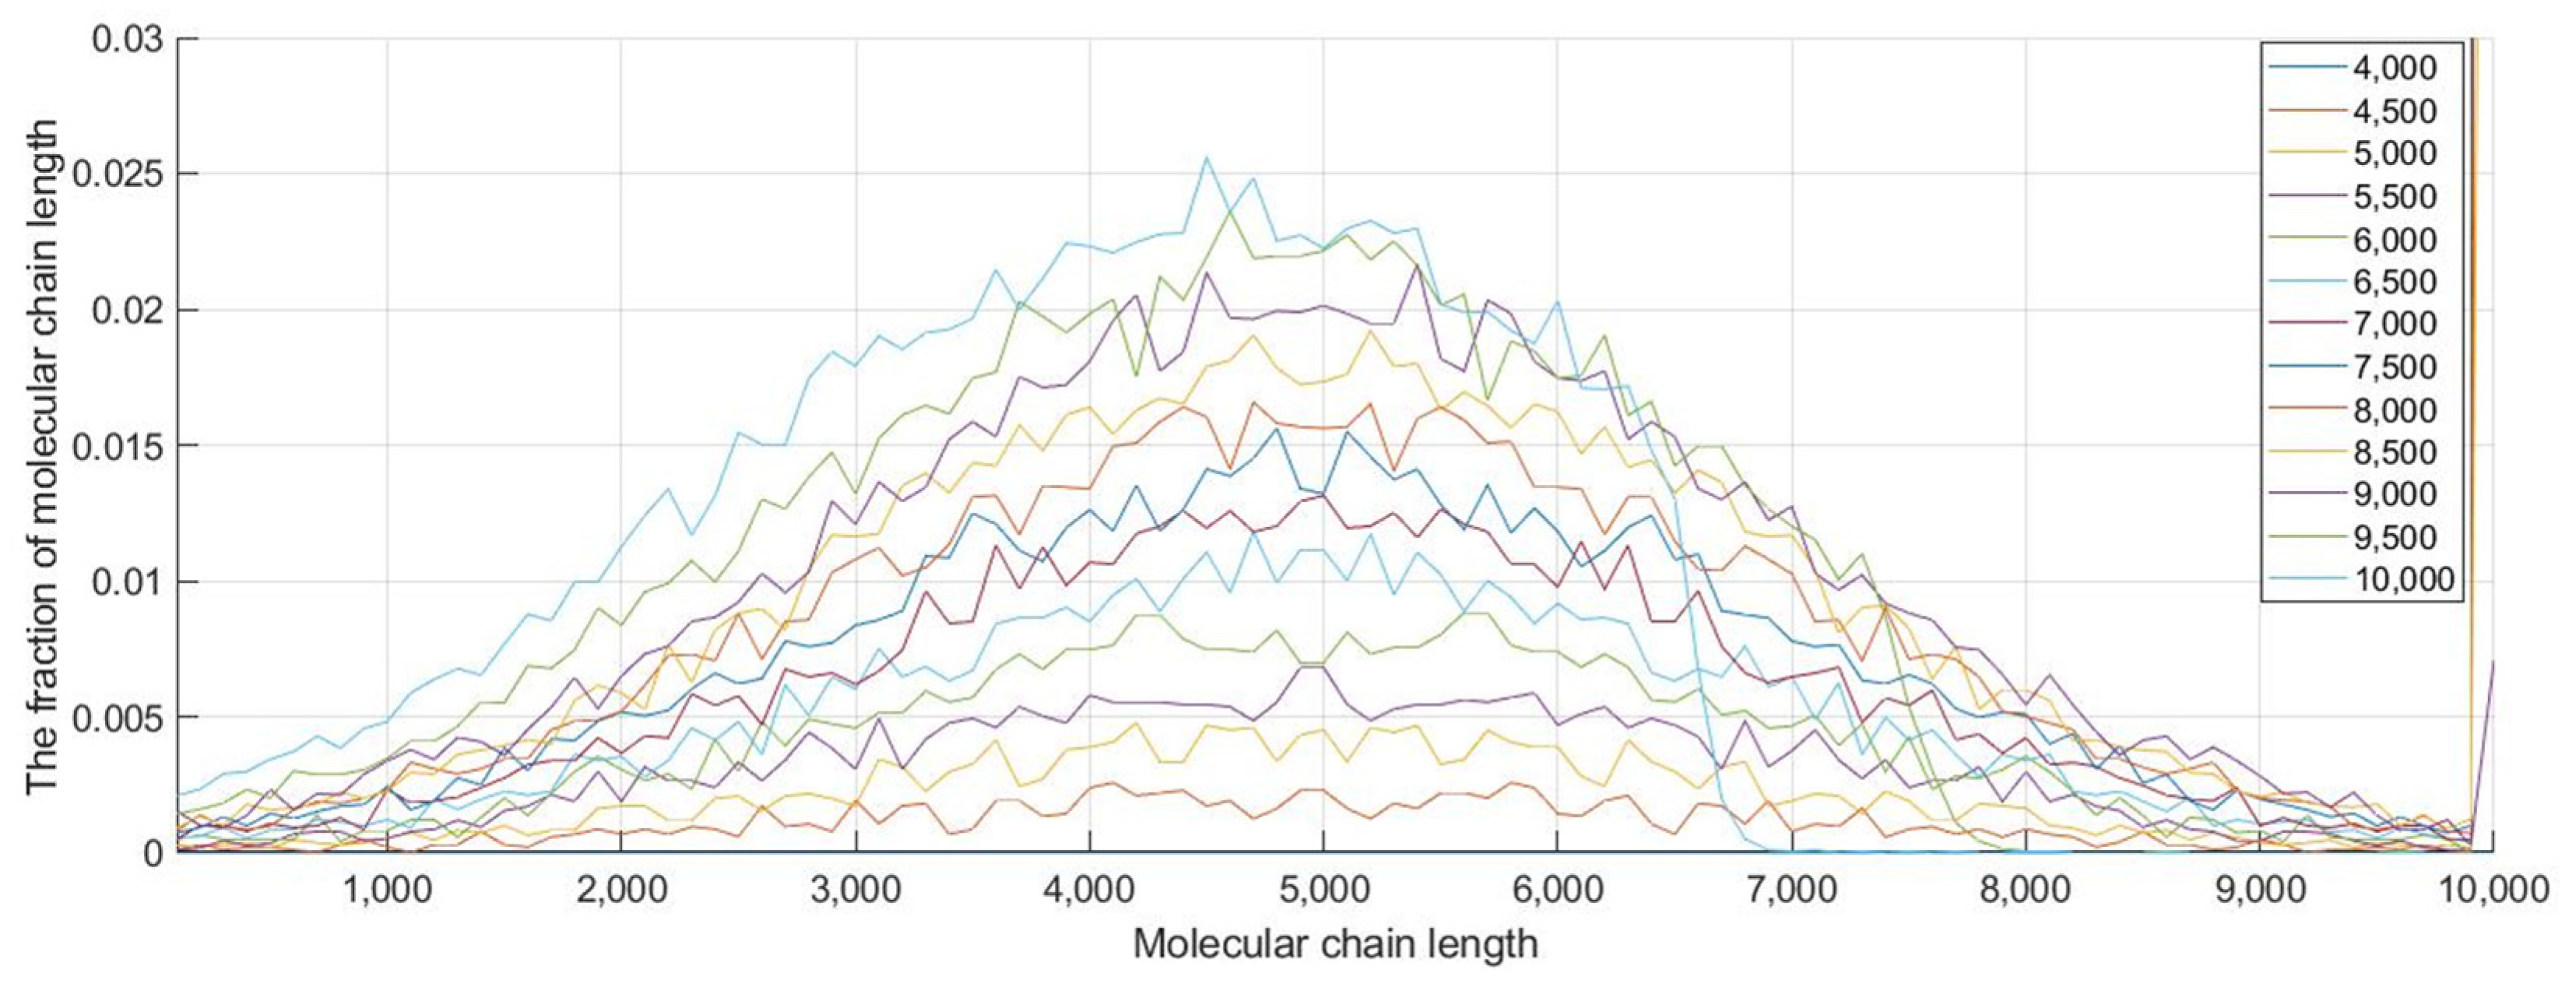
3.2. Molecular Chain Break Model Based on Normal Distribution

After obtaining the relationship between the molecular dielectric constant and the number of chain links, we find that this relationship needs to be applied to macroscopic materials. The PMVS material is cross-linked by hundreds of thousands of molecular chains, and the distribution of molecular chain breaks in the material after aging is more complicated. Therefore, this paper proposes a molecular chain break model based on normal distribution. That is, a system composed of a large number of molecular long chains was established in MATLAB, and the random chain scission operation was performed to simulate the molecular chain rupture during the aging process of macroscopic PMVS materials. The length distribution of molecular chains under different aging degrees was studied. At the same time, the relationship between the average molecular chain length of the material and the dielectric constant was also calculated.
First, the molecular chain system was established. The relative molecular mass of PMVS molecule was about 700,000. After calculation, the relative atomic mass of each —Si(CH3)2—O— chain link was 74. After approximate processing, the length of each silicone rubber molecule PMVS link in the model was 10,000. A total of 10,000 molecular chains were set up in the model. In the aging process, the destruction of the molecular main chain had a greater impact on the overall dielectric constant, so only the break of the main chain Si—O—Si bond was considered. We ignored the impact of broken side chains. At the same time, the concept of aging degree is rather vague. In response to this problem, the average molecular chain length L u was set to define the degree of aging. The value range of L u was 4000–10,000, the step size was 500, and a total of 13 values were taken for the calculations.
PMVS aging factors were complex and random. The randomness of aging factors makes PMVS molecules random when they break. In addition, the influence of various aging factors on molecular chain breakage was almost independent, the force between molecular chains was small and the distance between molecules is large, so the influence of intermolecular force could be ignored. Therefore, it can be approximately considered that the breakage of the chemical bond of the PMVS molecular chain obeys a normal distribution at the break position. At the same time, in the molecular chain scission model, considering that it is difficult to produce too short molecular chains in actual situations, small molecular chains with a degree of polymerization of 5 or less were ignored in the process of random chain scission. The iterative solution process of the molecular chain break model is shown in Figure 5.
The molecular chain length distribution of PMVS under different L u is shown in Figure 6.
It can be seen that the distribution of molecular chain length obeys the normal distribution on the whole. The larger the average molecular chain length is, the greater the difference in length between molecular chains. The relationship curve shown in Figure 4 brings these 13 chain length distribution curves. The curve of the change on the dielectric constant of PMVS material with the average molecular chain length is shown in Figure 7.
It can be seen that as the aging degree of PMVS deepens, the average molecular chain length L u decreases and the relative dielectric constant of the material increases. When the average molecular chain length is more than half of the original length, the relative dielectric constant changes approximately linearly. As the molecular chain continues to break, and when the average length drops below half of the original length, the rate of change of the dielectric constant begins to increase and the curve becomes steeper. The increase in the rate of change of the dielectric constant may be caused by the increase in the proportion of small molecular chains in the silicone rubber. According to the relationship between the number of single molecular chains and the dielectric constant calculated in Figure 4, it can be seen that when the number of molecular chains are smaller, the rate of change of the dielectric constant will be greater. Therefore, when the average molecular chain length of silicone rubber is low, the relative dielectric constant changes more obviously.

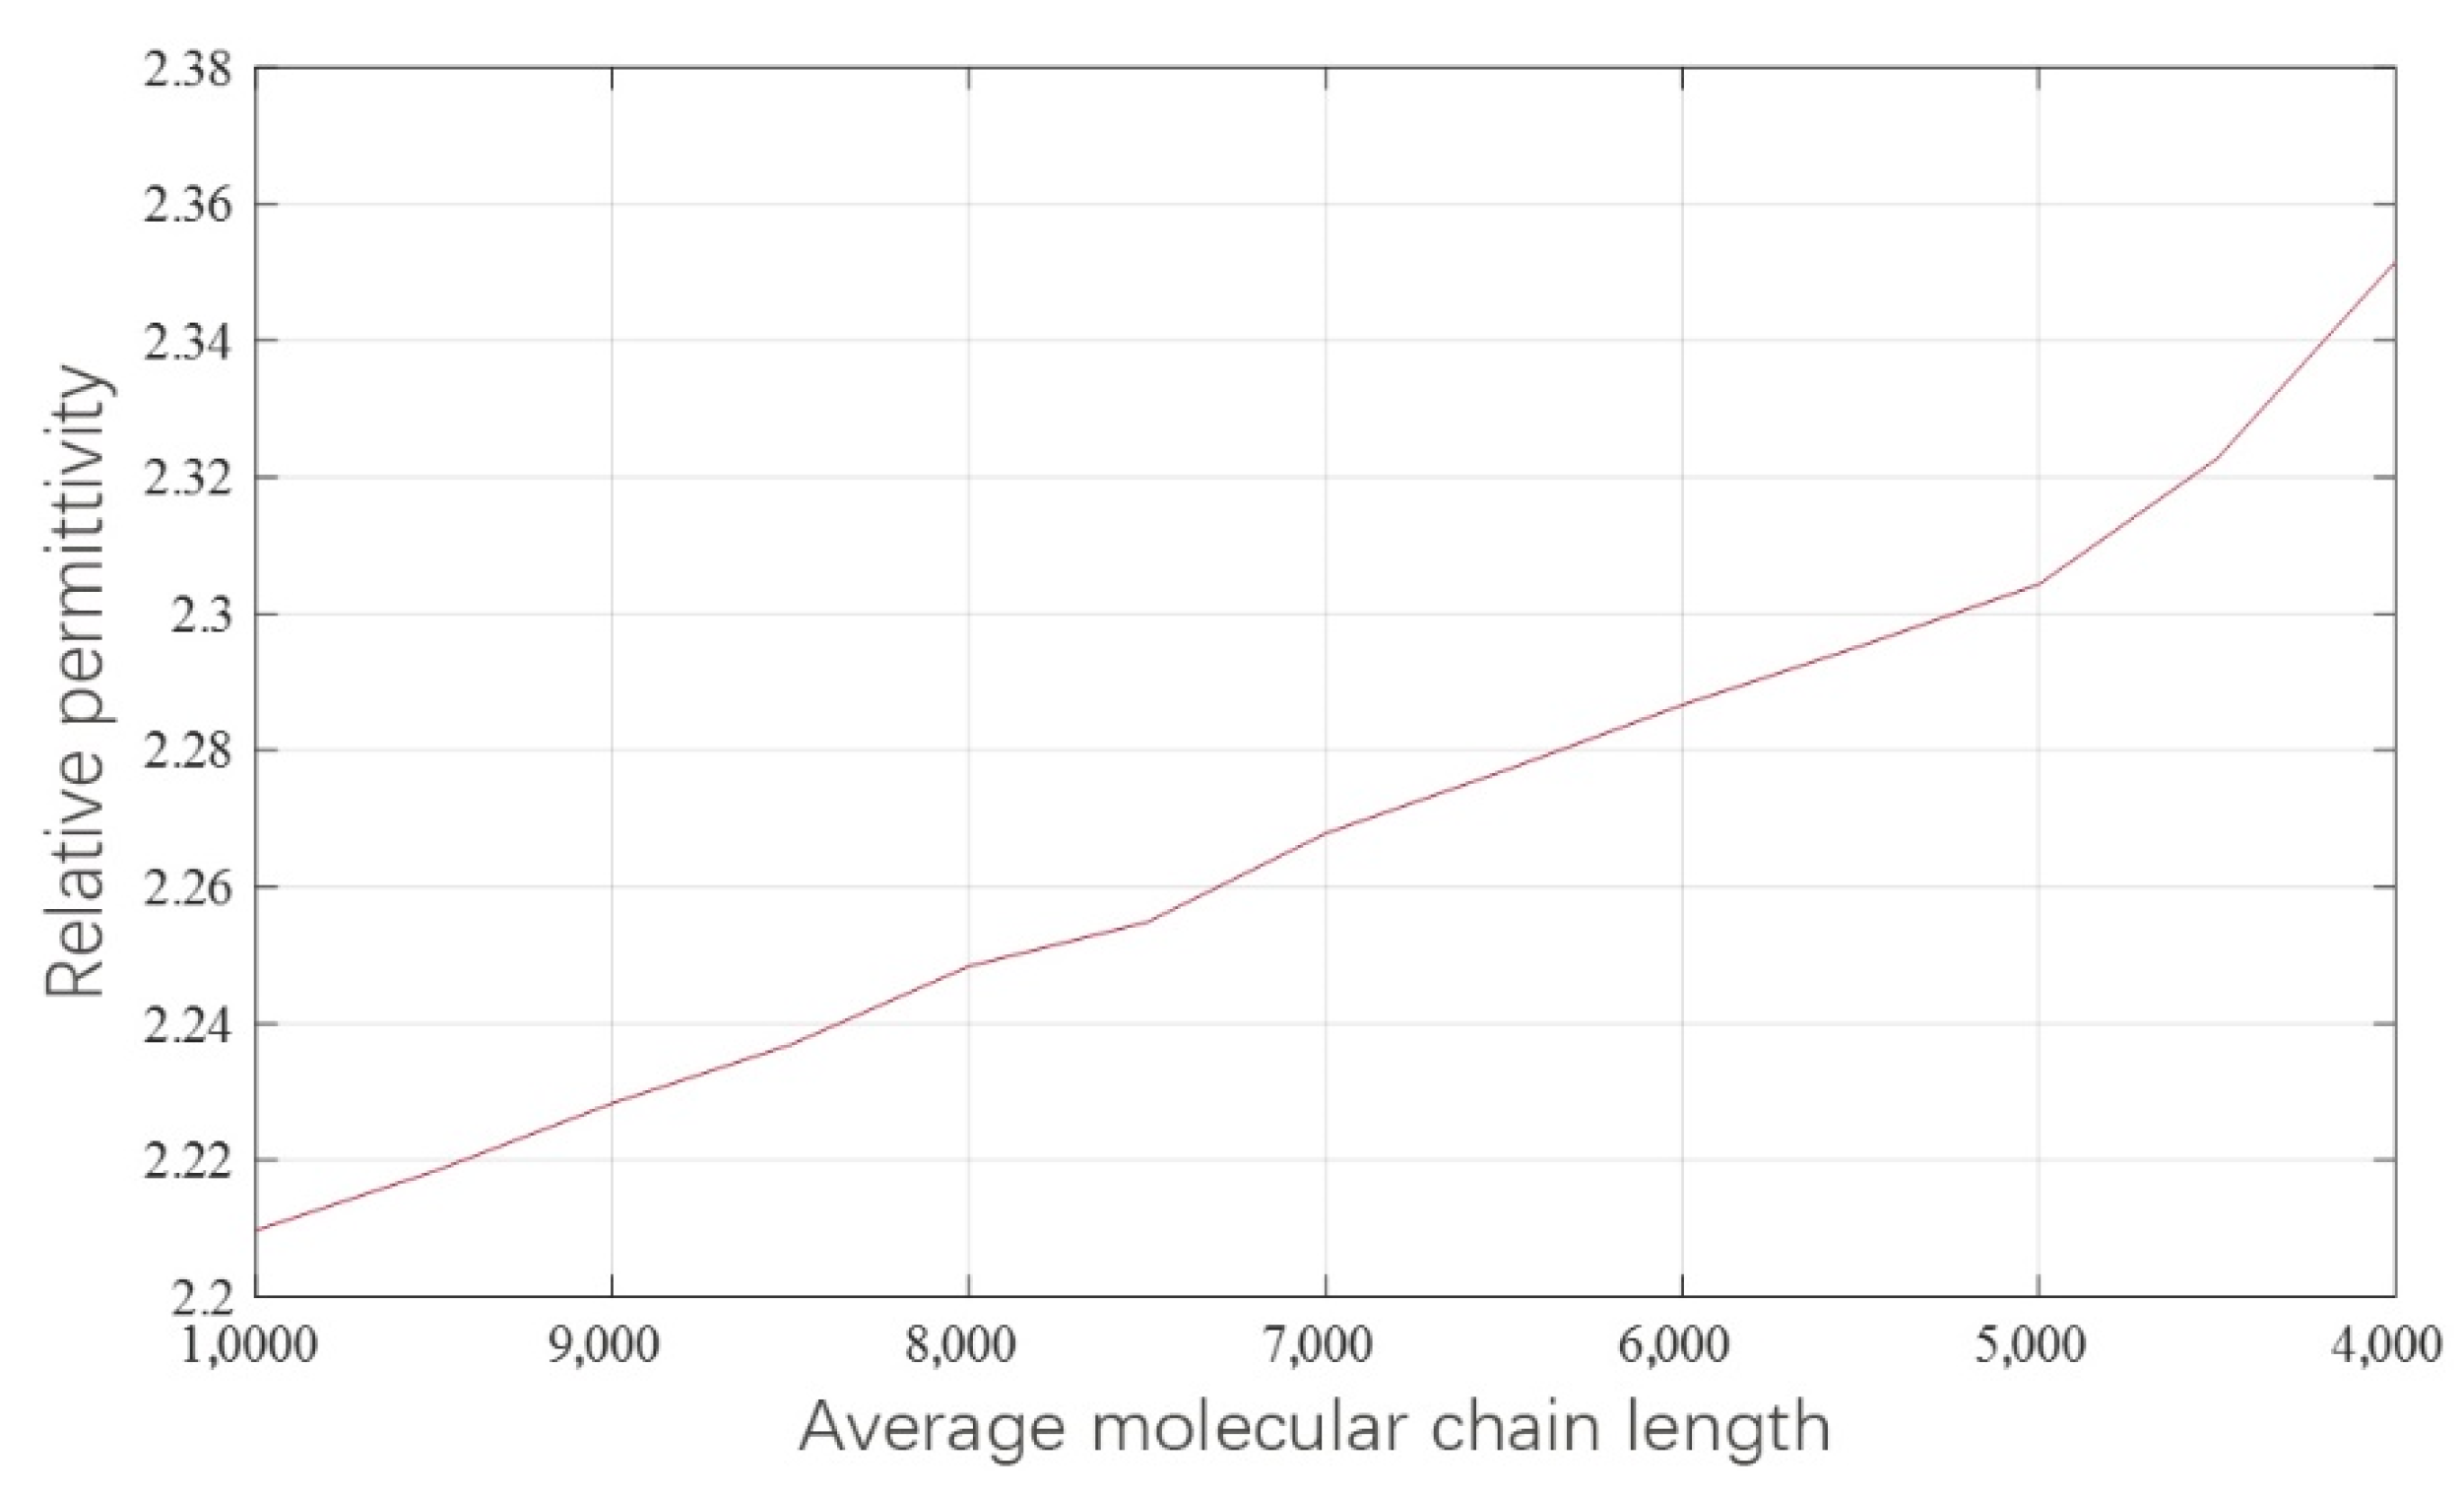
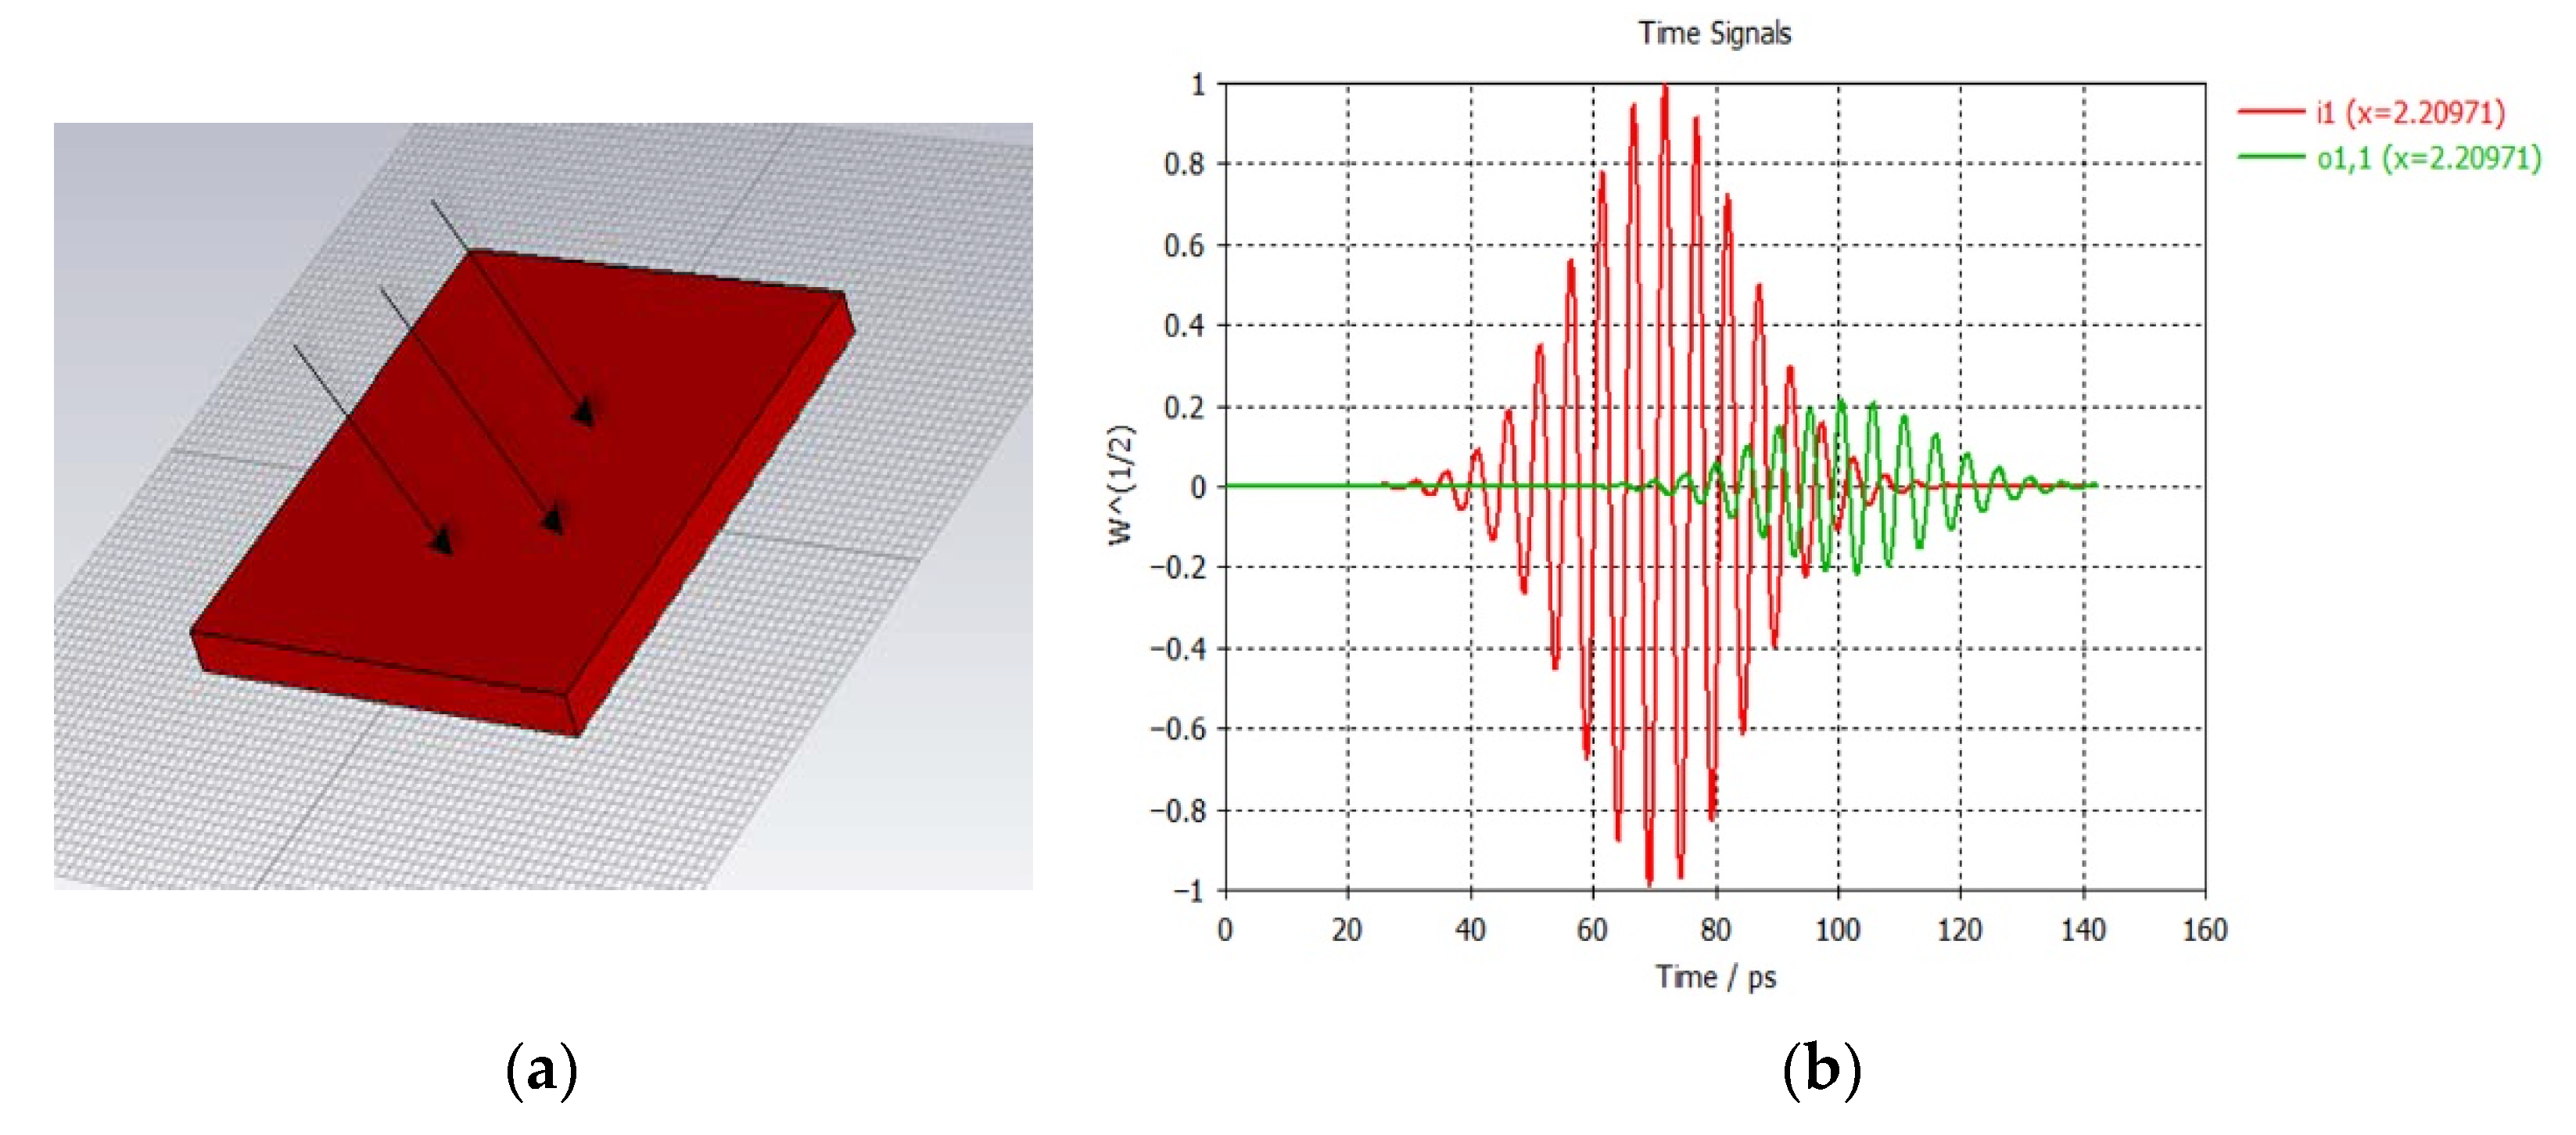
3.3. Simulation Analysis of Terahertz Signal PMVS Medium Transmission

The terahertz wave will scatter when it enters the PMVS material. Transmission media with different characteristics will show different degrees of scattering to the same input signal, and the S parameter is often used to describe this scattering [20]. The S parameter is a transmission parameter which includes the S12 reverse transmission coefficient, the S21 forward transmission coefficient, the S22 output reflection coefficient, and the S11 input reflection coefficient, which is the input return loss. In the actual measurement of silicone rubber insulation aging, the reflection non-contact measurement was mainly used. Therefore, the reflection parameter of the terahertz wave was mainly studied in the simulation, which is the S11 input return loss in the S parameter. The expression is shown in Equation (4).
S 11 = a 1 b 1
where a 1 is the input power and b 1 is the reflected power. Since the S parameter is expressed in the form of a ratio, which is a positive number less than one, for the convenience of comparison, it is often expressed in the form of dB. The conversion relationship between them is shown in Equation (5).
S dB = 20 lgS
The input return loss can be understood as the difference in dB between the incident signal and the reflected signal. When the impedance is completely matched, the input return loss is infinite, and for open circuit, short circuit, and lossless media, the input return loss is 0 dB.
We used CST to build a simulation model and set the background as a vacuum and the PMVS material as a homogeneous medium. The size was 0.5   mm × 0.5   mm × 3   mm , the permeability μ was 1, and the relative permittivity s was given according to the relationship calculated in Section 3.2. The PMVS material slice model established in CST is shown in Figure 8a.
A terahertz pulse with a frequency of 0.17–0.22 THz was used for vertical incidence, and probes were set on the interface of the medium to record the time-domain waveform. Taking the dielectric constant ε of 2.20971 as an example, the waveforms of the terahertz incident pulse and reflected pulse are shown in Figure 8b.
The simulation calculated and recorded the S11 parameters of terahertz signal propagation with different ε . We obtained the change curve of terahertz input return loss S11 as shown in Figure 9.
The figure shows that when the dielectric constant of the material gradually increases from 2.20971 to 2.34771, the S11 parameter also increases. At 0.17 THz, S11 increases from −13.06 dB to −12.52 dB and the absolute value is gradually decreasing. This confirms that the transmission loss of terahertz signals in the medium is affected by the relative permittivity of the material. From a horizontal perspective, each curve has almost the same trend in the entire 170–220 GHz frequency band, the input return loss changes slightly in the 170–180 GHz frequency band. With the increase of the relative permittivity, S11 in 170–180 GHz changes from a slight drop to a gradual increase and then to a slight increase. In the 180–200 GHz frequency band, S11 begins to drop sharply, and the drop rate is not much different on each curve. In the 200–210 GHz frequency band, the rate of decline is slightly flat, but in the 210–220 GHz frequency band, the rate of decline increases again. All S11 parameter curves show a downward trend when increasing frequency.
We took the average value of the S11 input return loss curve in Figure 9 over the entire frequency band, and then combined the molecular simulation to calculate the relationship between the average molecular chain length and the dielectric constant. After normalization, the scatter point of the relationship between the aging degree of the silicone rubber and the terahertz input return loss S11 was obtained. In order to explore its laws, we use the linear functions, quadratic functions, cubic functions, quartic functions, and quintic functions to fit the scattered points. The fitting curve of the relationship between the aging degree of the silicone rubber and the terahertz S11 parameter is shown in Figure 10.
Figure 10 shows that the terahertz echoes in the five fitting curves all increase when increase the dielectric constant (that is, the aggravation of PMVS aging). At the same time, in order to compare the pros and cons of the five fitting functions, the residuals at each point were solved for all fitting functions and the residual norm was calculated. In other words, the maximum absolute value of the difference between each calculated value and the fitted value are solved. The solution results are shown in Figure 11.
It can be seen from the figure that the residual norm of the linear function fitting curve is the largest, the residual norm of the quintic function fitting curve is the smallest, and the curve is closest to the calculated sample point. Therefore, the fifth-order function with the smallest residual norm is selected to describe the relationship between the aging degree of silicone rubber and the terahertz S11 parameter, as shown in Equation (6).
y = 0.1877 x 5 + 0.4663 x 4 0.4094 x 3 + 0.0766 x 2 + 0.7848 x 13.29

4. Experiment and Discussion

To further verify the reliability of the relationship between the S11 parameter and the dielectric constant obtained by calculation and simulation, 11 rod-shaped suspension silicone rubber insulator samples with different aging degrees were selected from the power system for terahertz reflection experiments. This included two new unused insulator samples. One was highly aged sample that have been in operation for more than ten years, and the other one was a sample with varying degrees of aging in between.

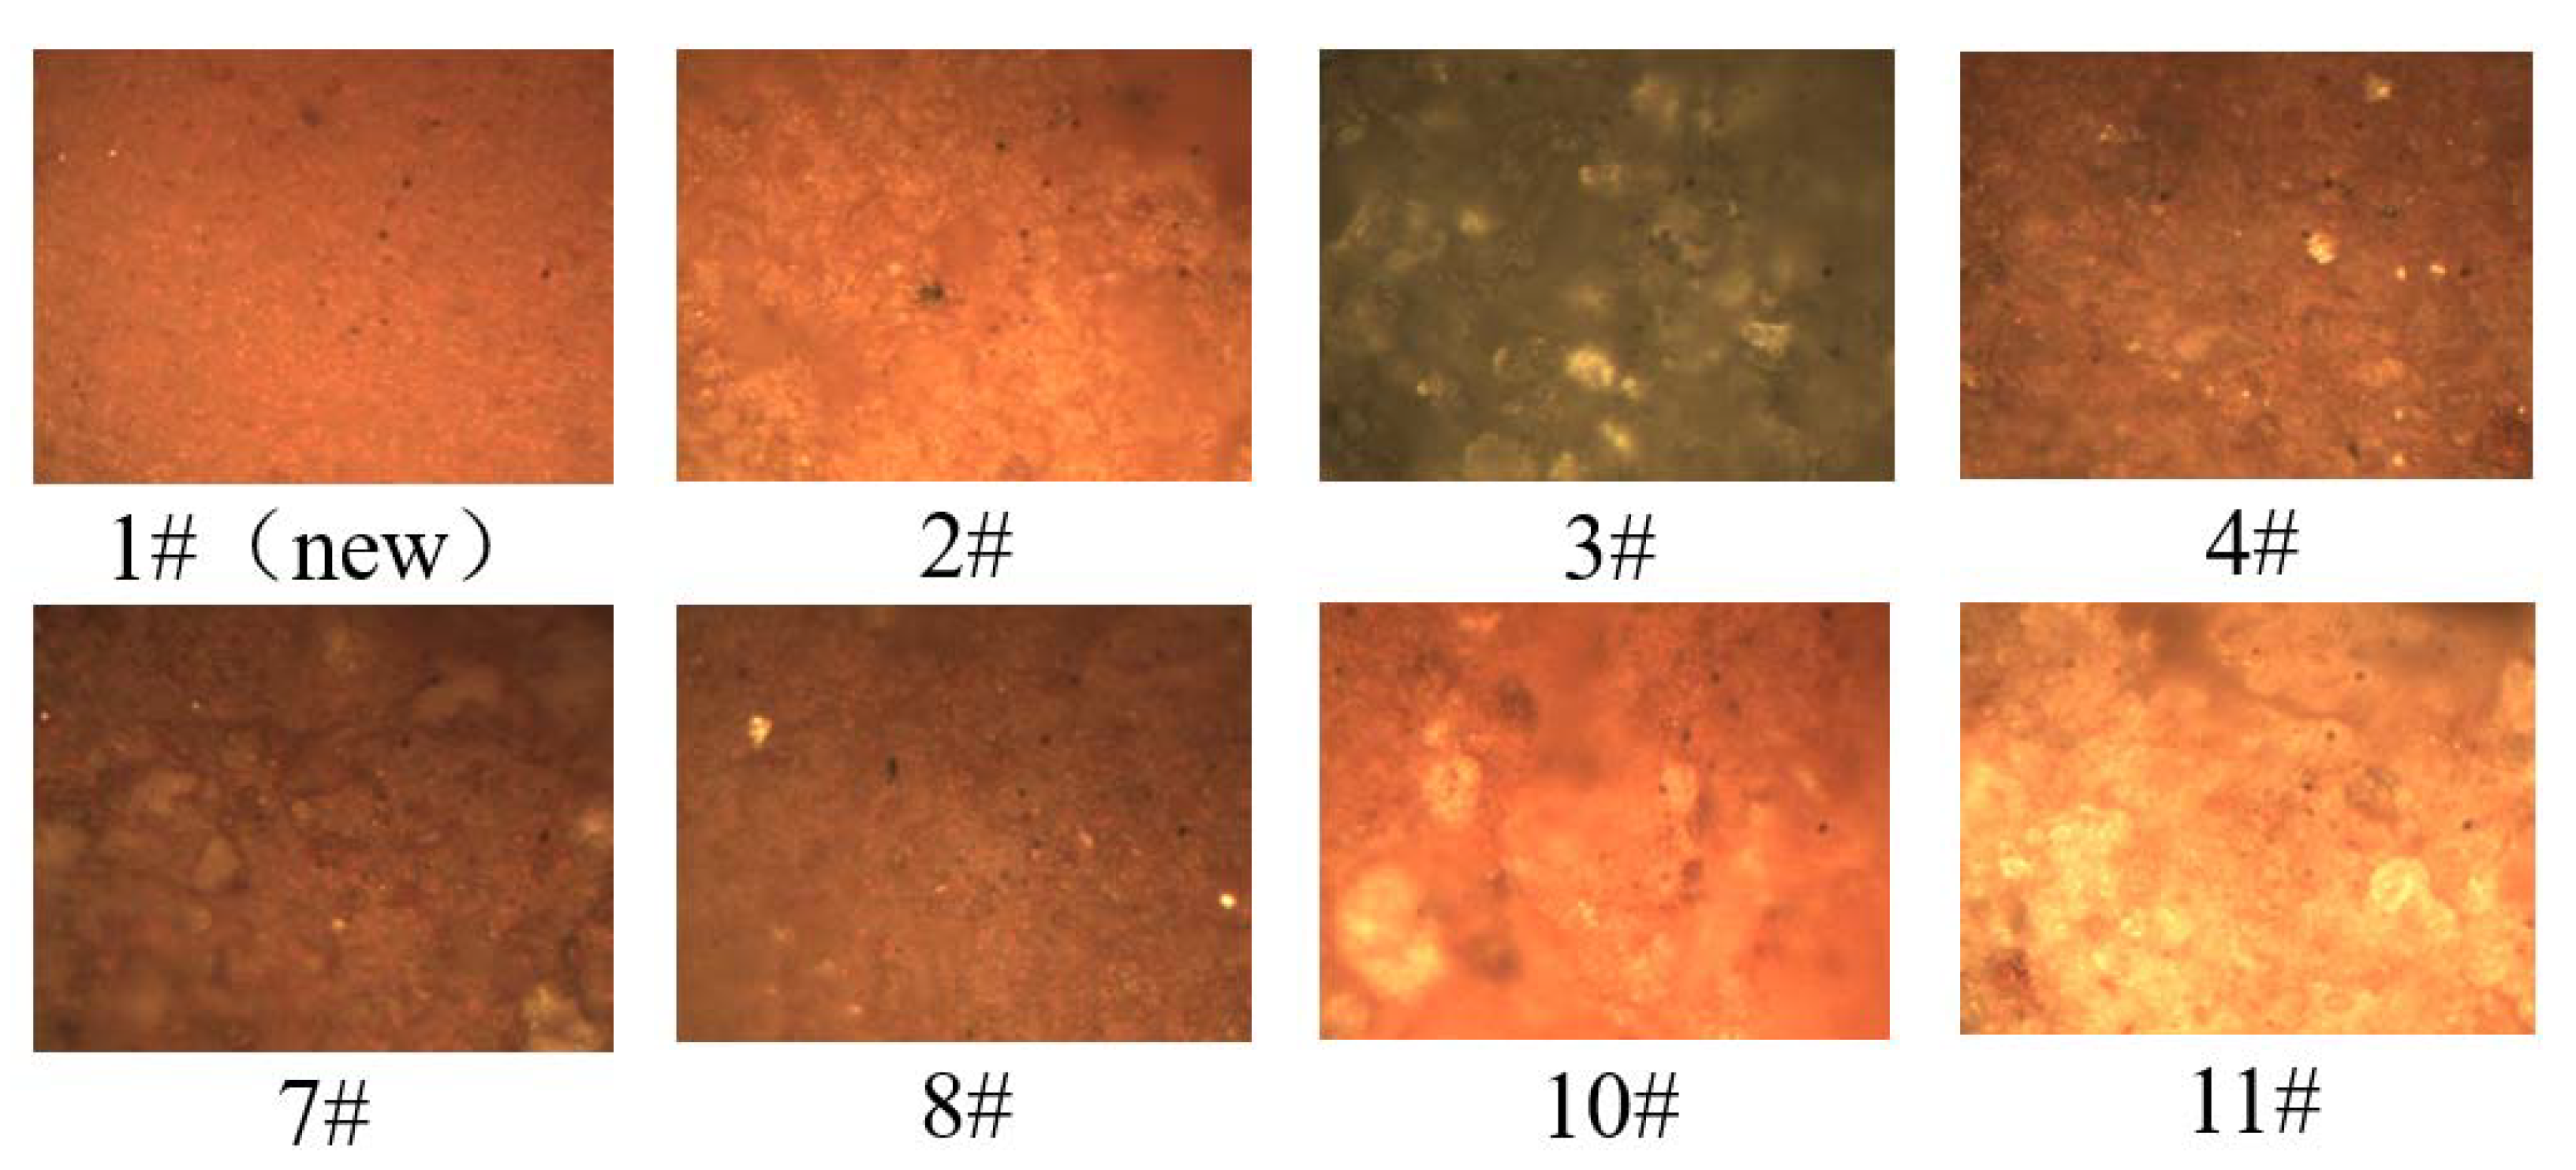
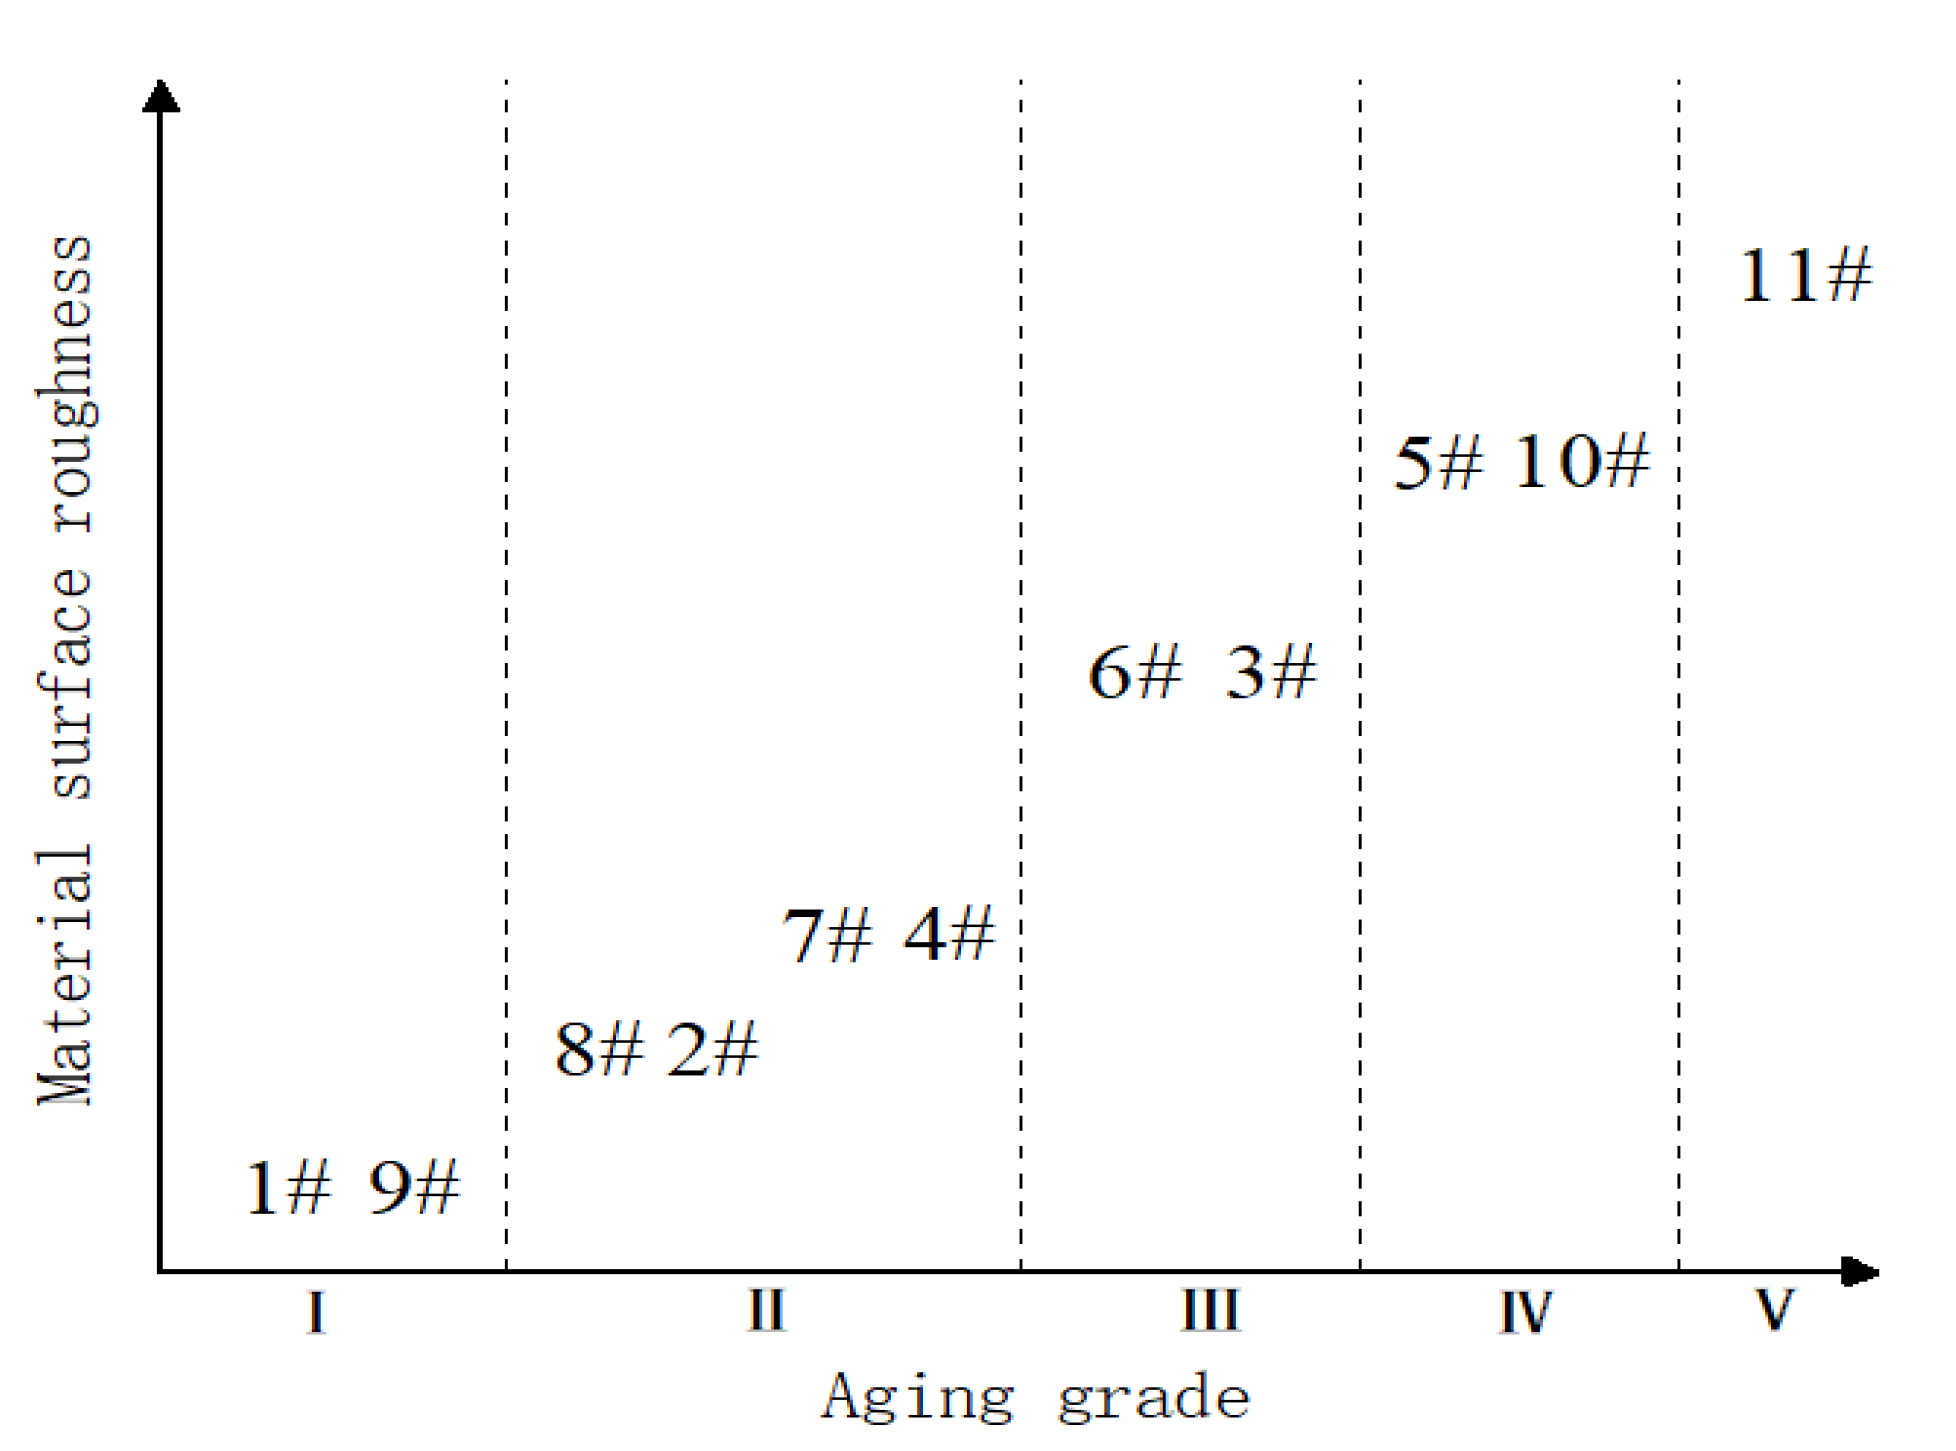
4.1. Sample Aging Degree Calibration

Since the samples were generated by the on-site aging of the power system, the working environment has certain differences, so it is not advisable to calibrate the aging degree based on the service life alone. In order to calibrate the degree of aging more accurately, the roughness of the insulator surface and the average partial discharge voltage of the insulation were used for aging calibration in this study.
First, we label the 11 silicone rubber composite insulators in sequence. Samples of umbrella skirts were taken on the high-voltage side, away from the high-voltage side, and the middle part of the insulator. We took 10 sets of samples for each insulator, a total of 11 sets. The sample was processed into thin slices of 20 mm in length and width and 3 mm in thickness. We then soaked the cut sample with absolute ethanol, cleaned the surface dirt with deionized water, and dried it with a vacuum dryer. After processing, all samples were sealed and stored in a dust-free environment for use.
Then, we observed the surfaces of the insulators with a polarizing microscope. The microscope eyepiece magnification was 10×, the objective lens magnification was 63×, and the total magnification is 630×. The surface morphology of some typical samples are shown in Figure 12.
According to the surface roughness of the silicone rubber observed by the microscope, the 11 groups of samples were calibrated and classified into five categories:
  • Samples 1# and 9#, no aging or very low aging;
  • Samples 8#, 2#, 7#, and 4#, the insulators have detectable aging, the surface hydrophobicity gradually decreases, and there are holes, etc.;
  • Samples 6# and 3#, the water repellency further decreased, some defects appeared, the area of pores increased, and the aging was gradually serious;
  • Samples 5# and 10#, the surface defects of the material increased and deepened, and the insulation performance was affected;
  • Samples 11#, The surface of the material is severely powdered, and the aging extends to the inside of the material.
The sample aging degree calibration classification is shown in Figure 13.
In order to further quantify the degree of aging, the partial discharge characteristics of all samples were analyzed using a plate electrode partial discharge device and HFCT sensor. Both are shown in Figure 14.
When measure the discharge voltage, the voltage between the plates was increased from zero through the step-up transformed. When high-frequency pulse current signal was induced in the HFCT sensor for the first time, the plate voltage was recorded as the starting discharge voltage. We continued to pressurize until the “sizzle” discharge sound between the plates was heard for the first time and recorded the voltage of the plate as the current sound voltage. We then continued to pressurize it until the discharge sound became the loudest, that is, when the sample was about to flashover, and recorded the plate voltage as the breakdown voltage. Finally, the three sets of voltages in the discharge process were averaged and set as the average discharge voltage. The partial discharge data of the slices of different parts of the insulators in each group of samples were also averaged to obtain the partial discharge voltage data of each group of insulator slices, as shown in Table 1.
After comprehensive surface microscopic analysis on the silicone rubber insulators and considering the average partial discharge voltage of the insulator slices, the aging degree among the samples were reordered. The final aging degree ranking of the 11 groups of samples is shown in Figure 15.

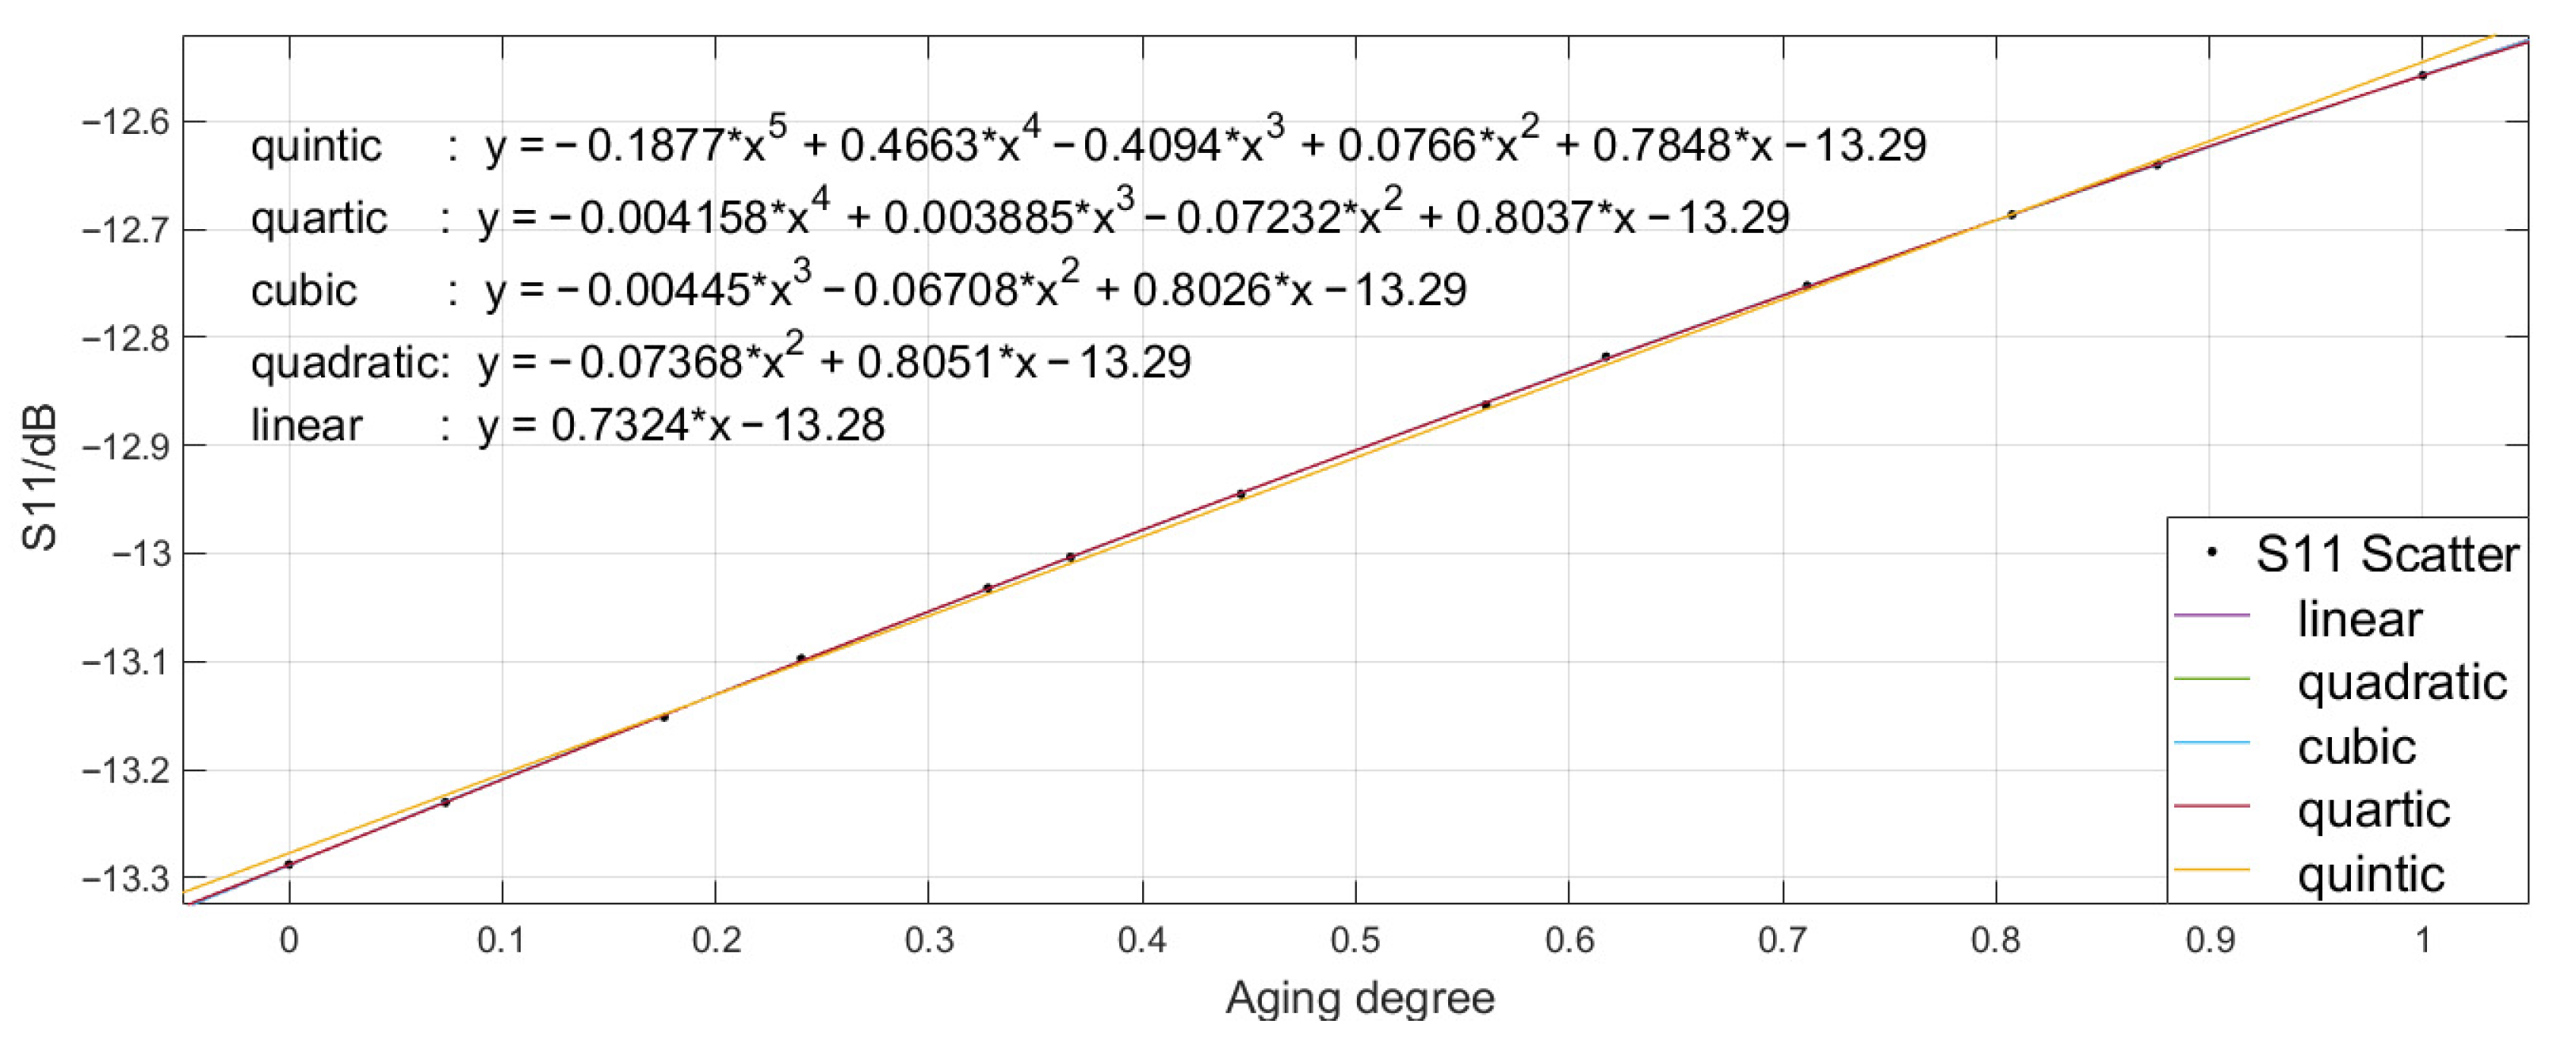
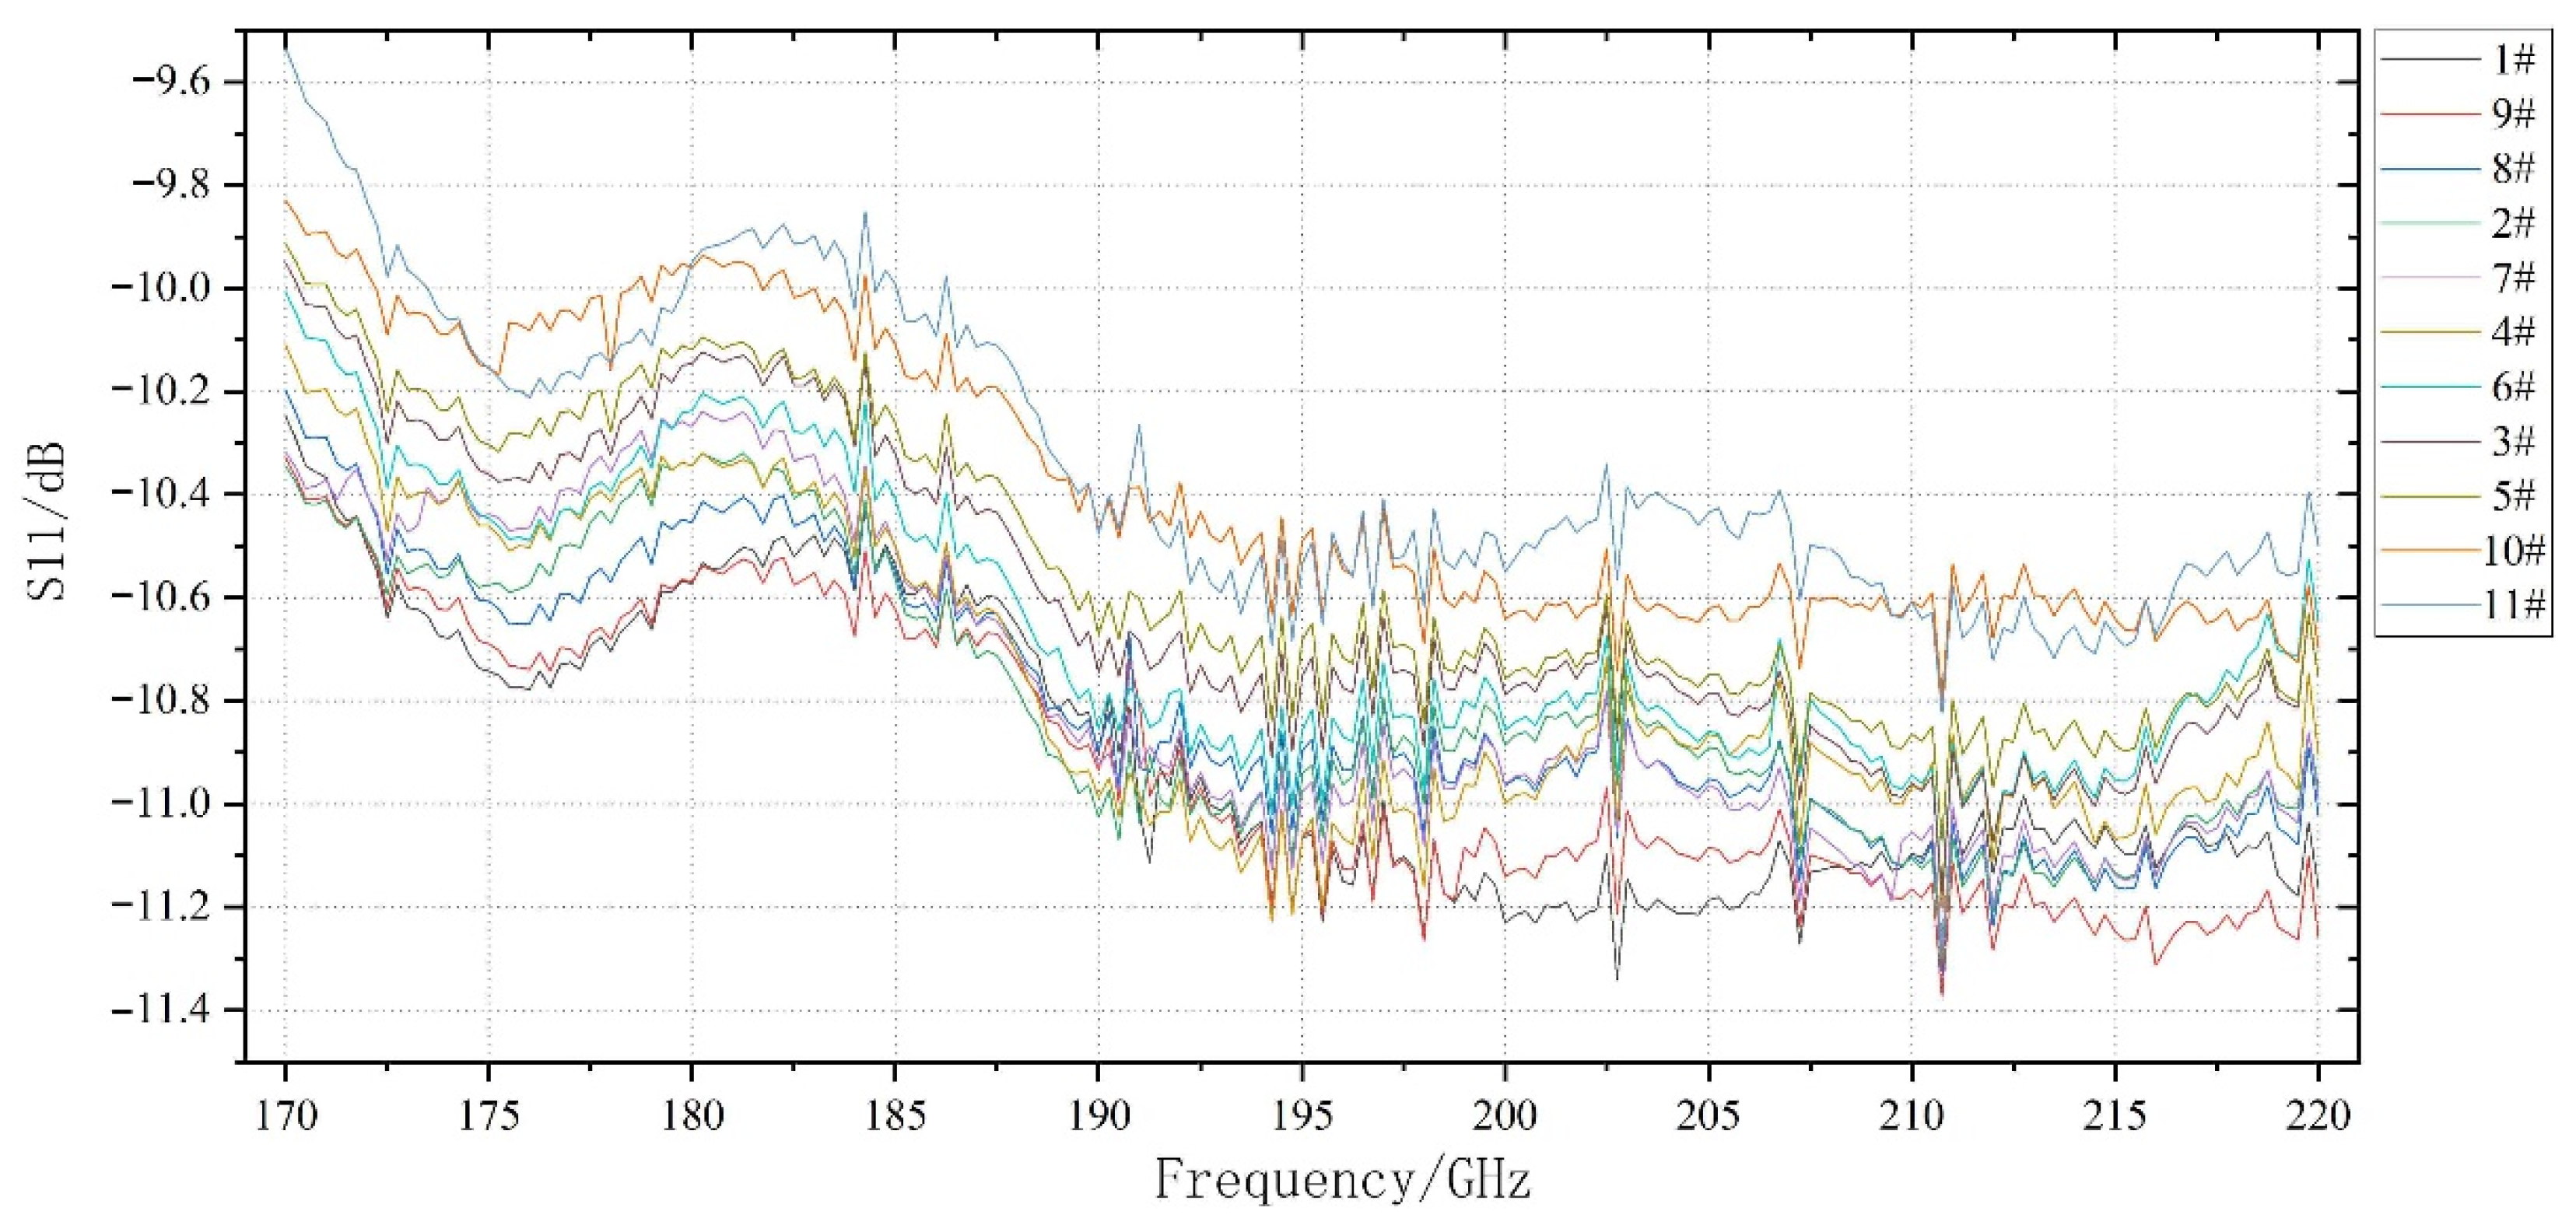
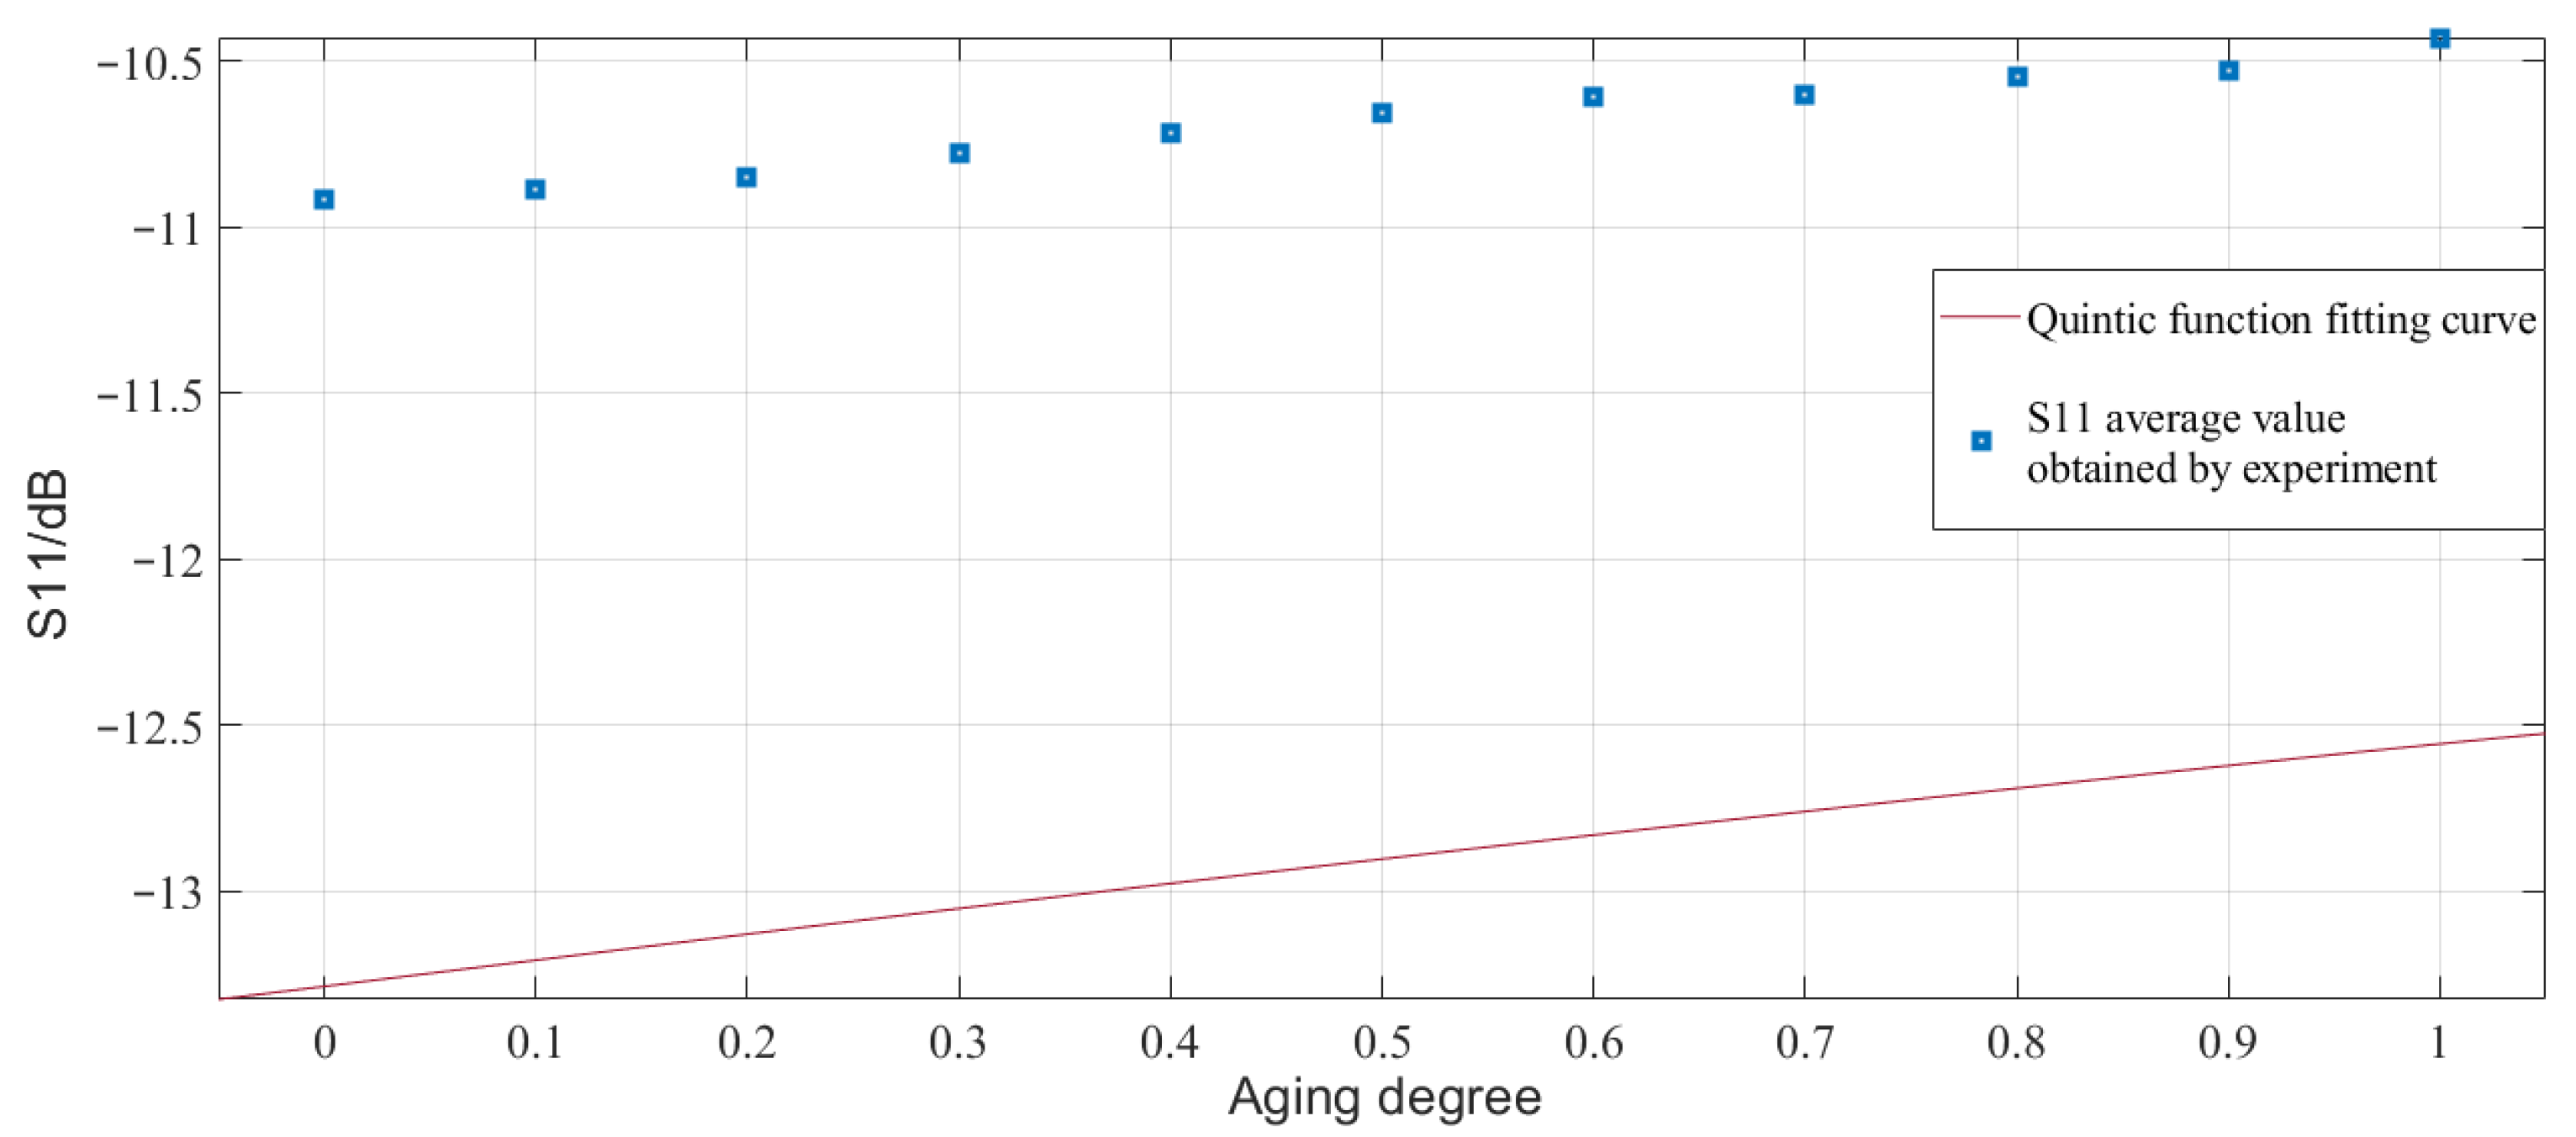
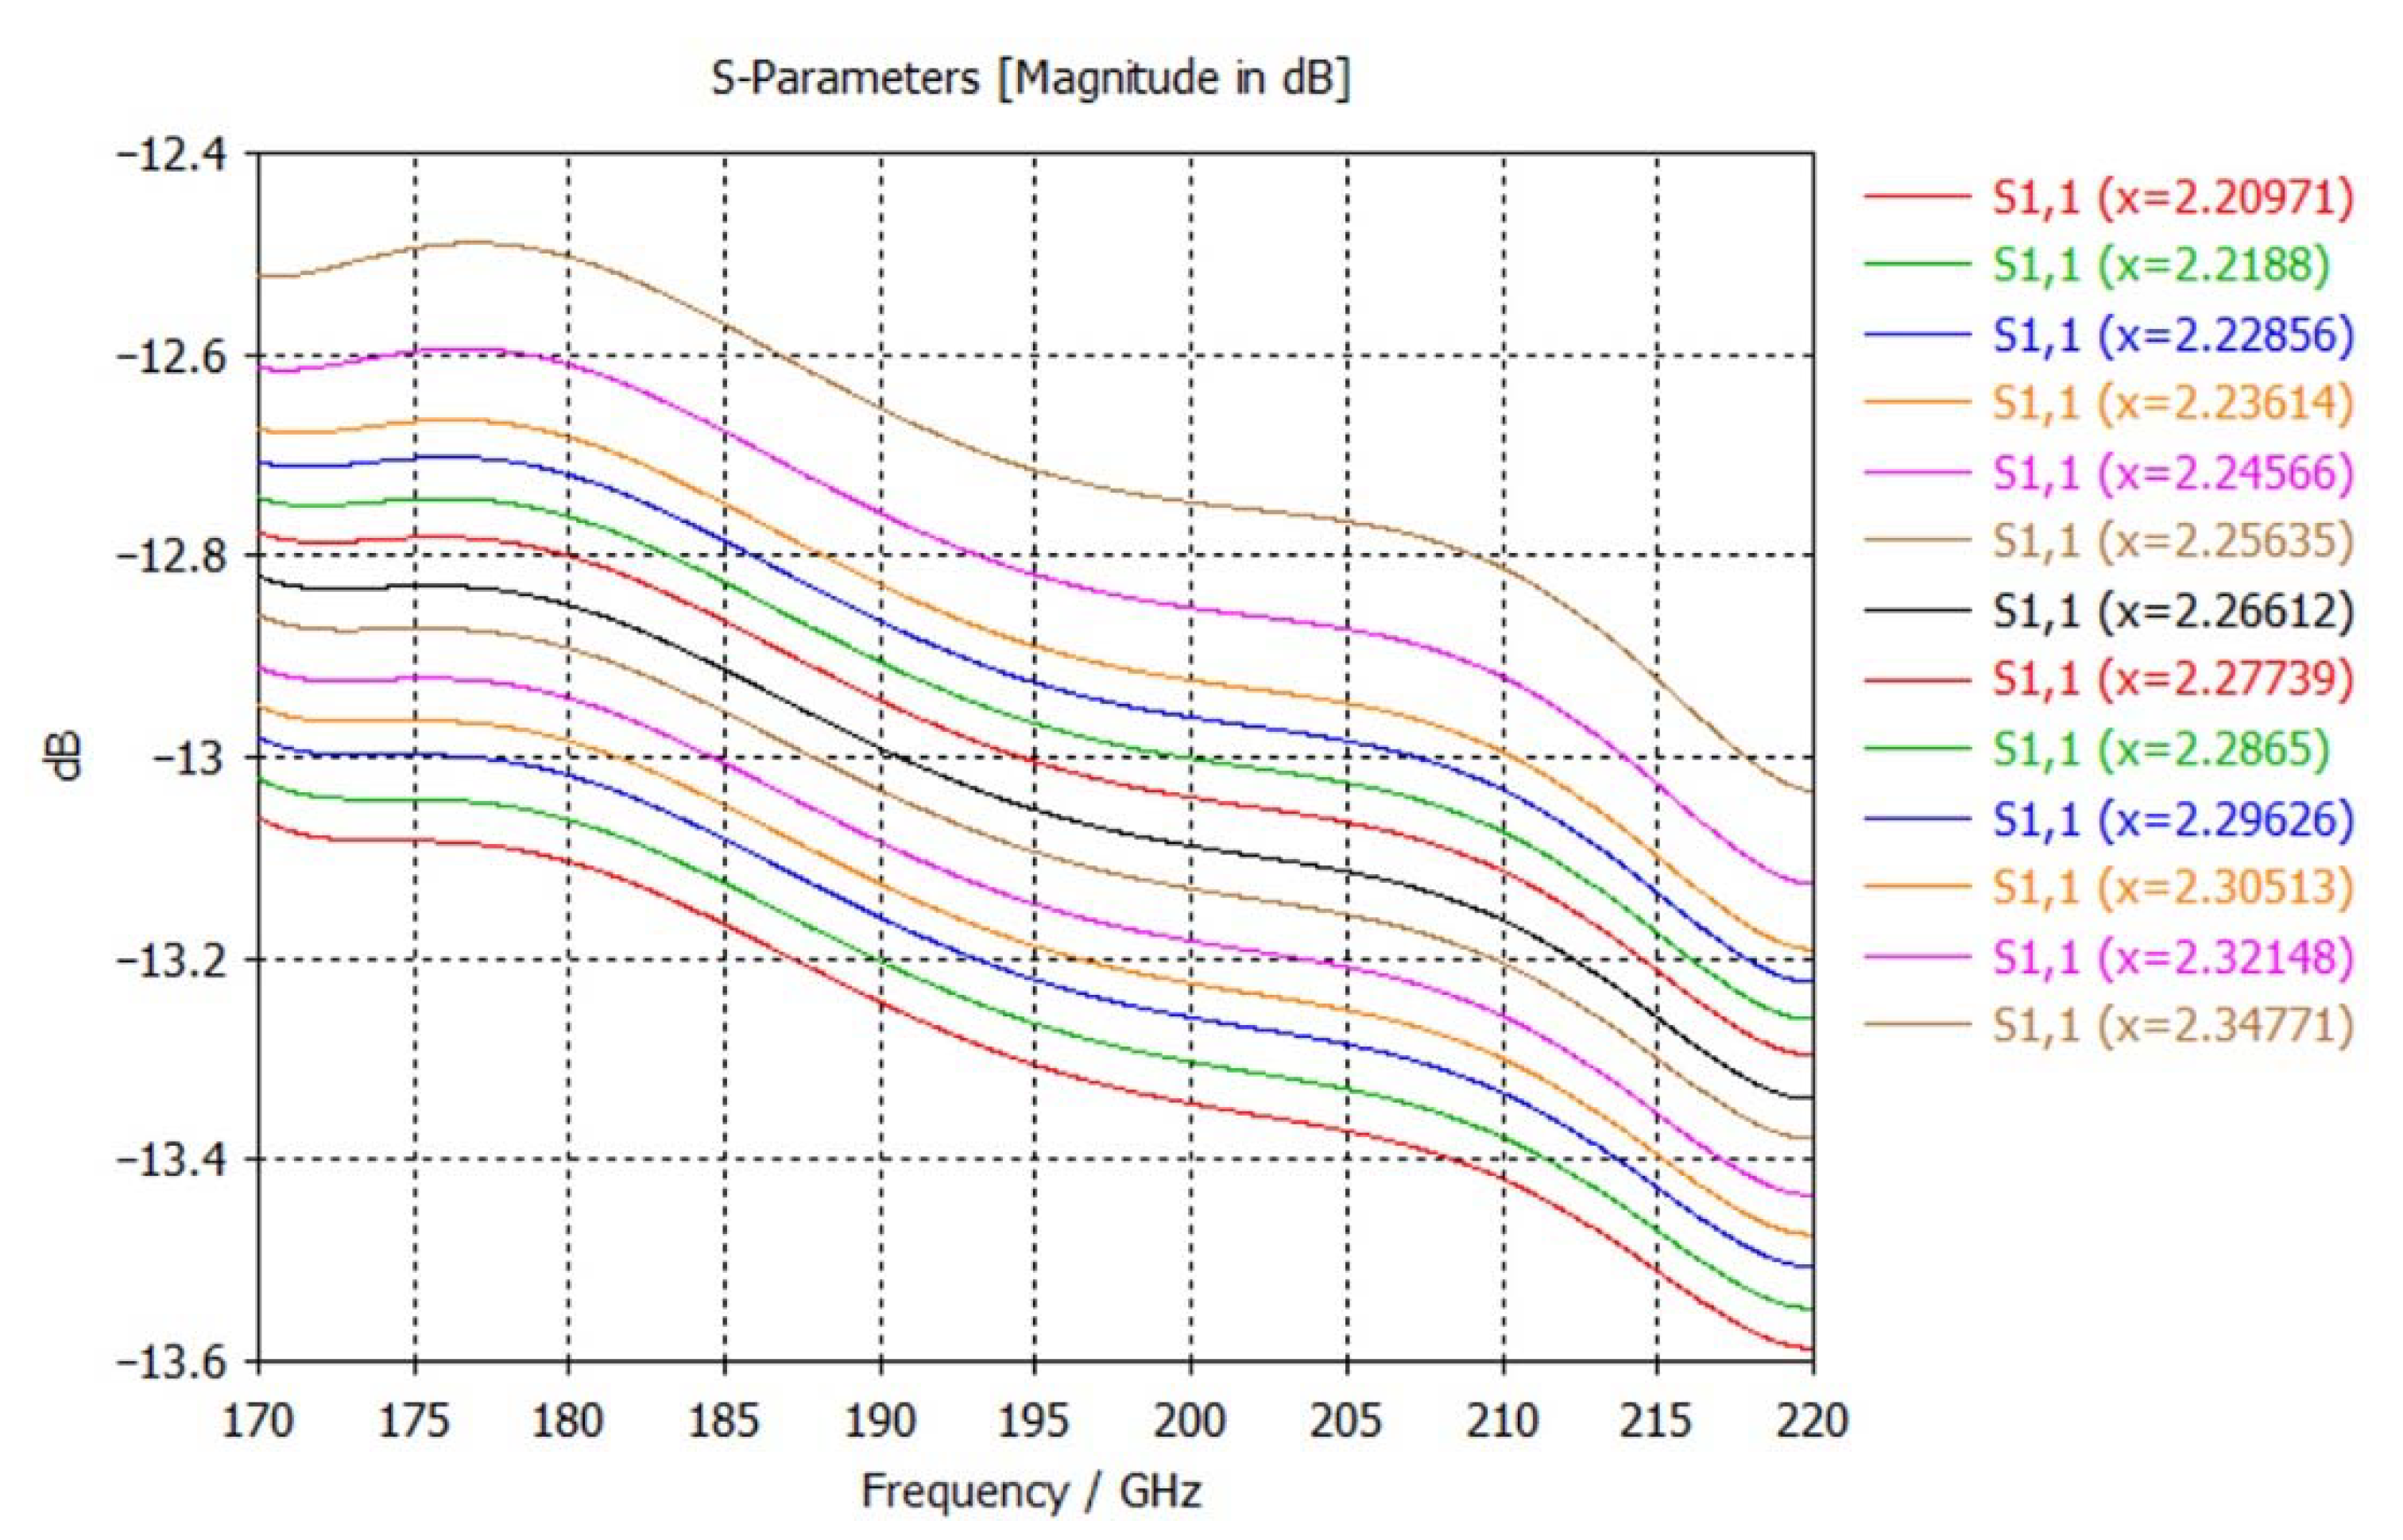
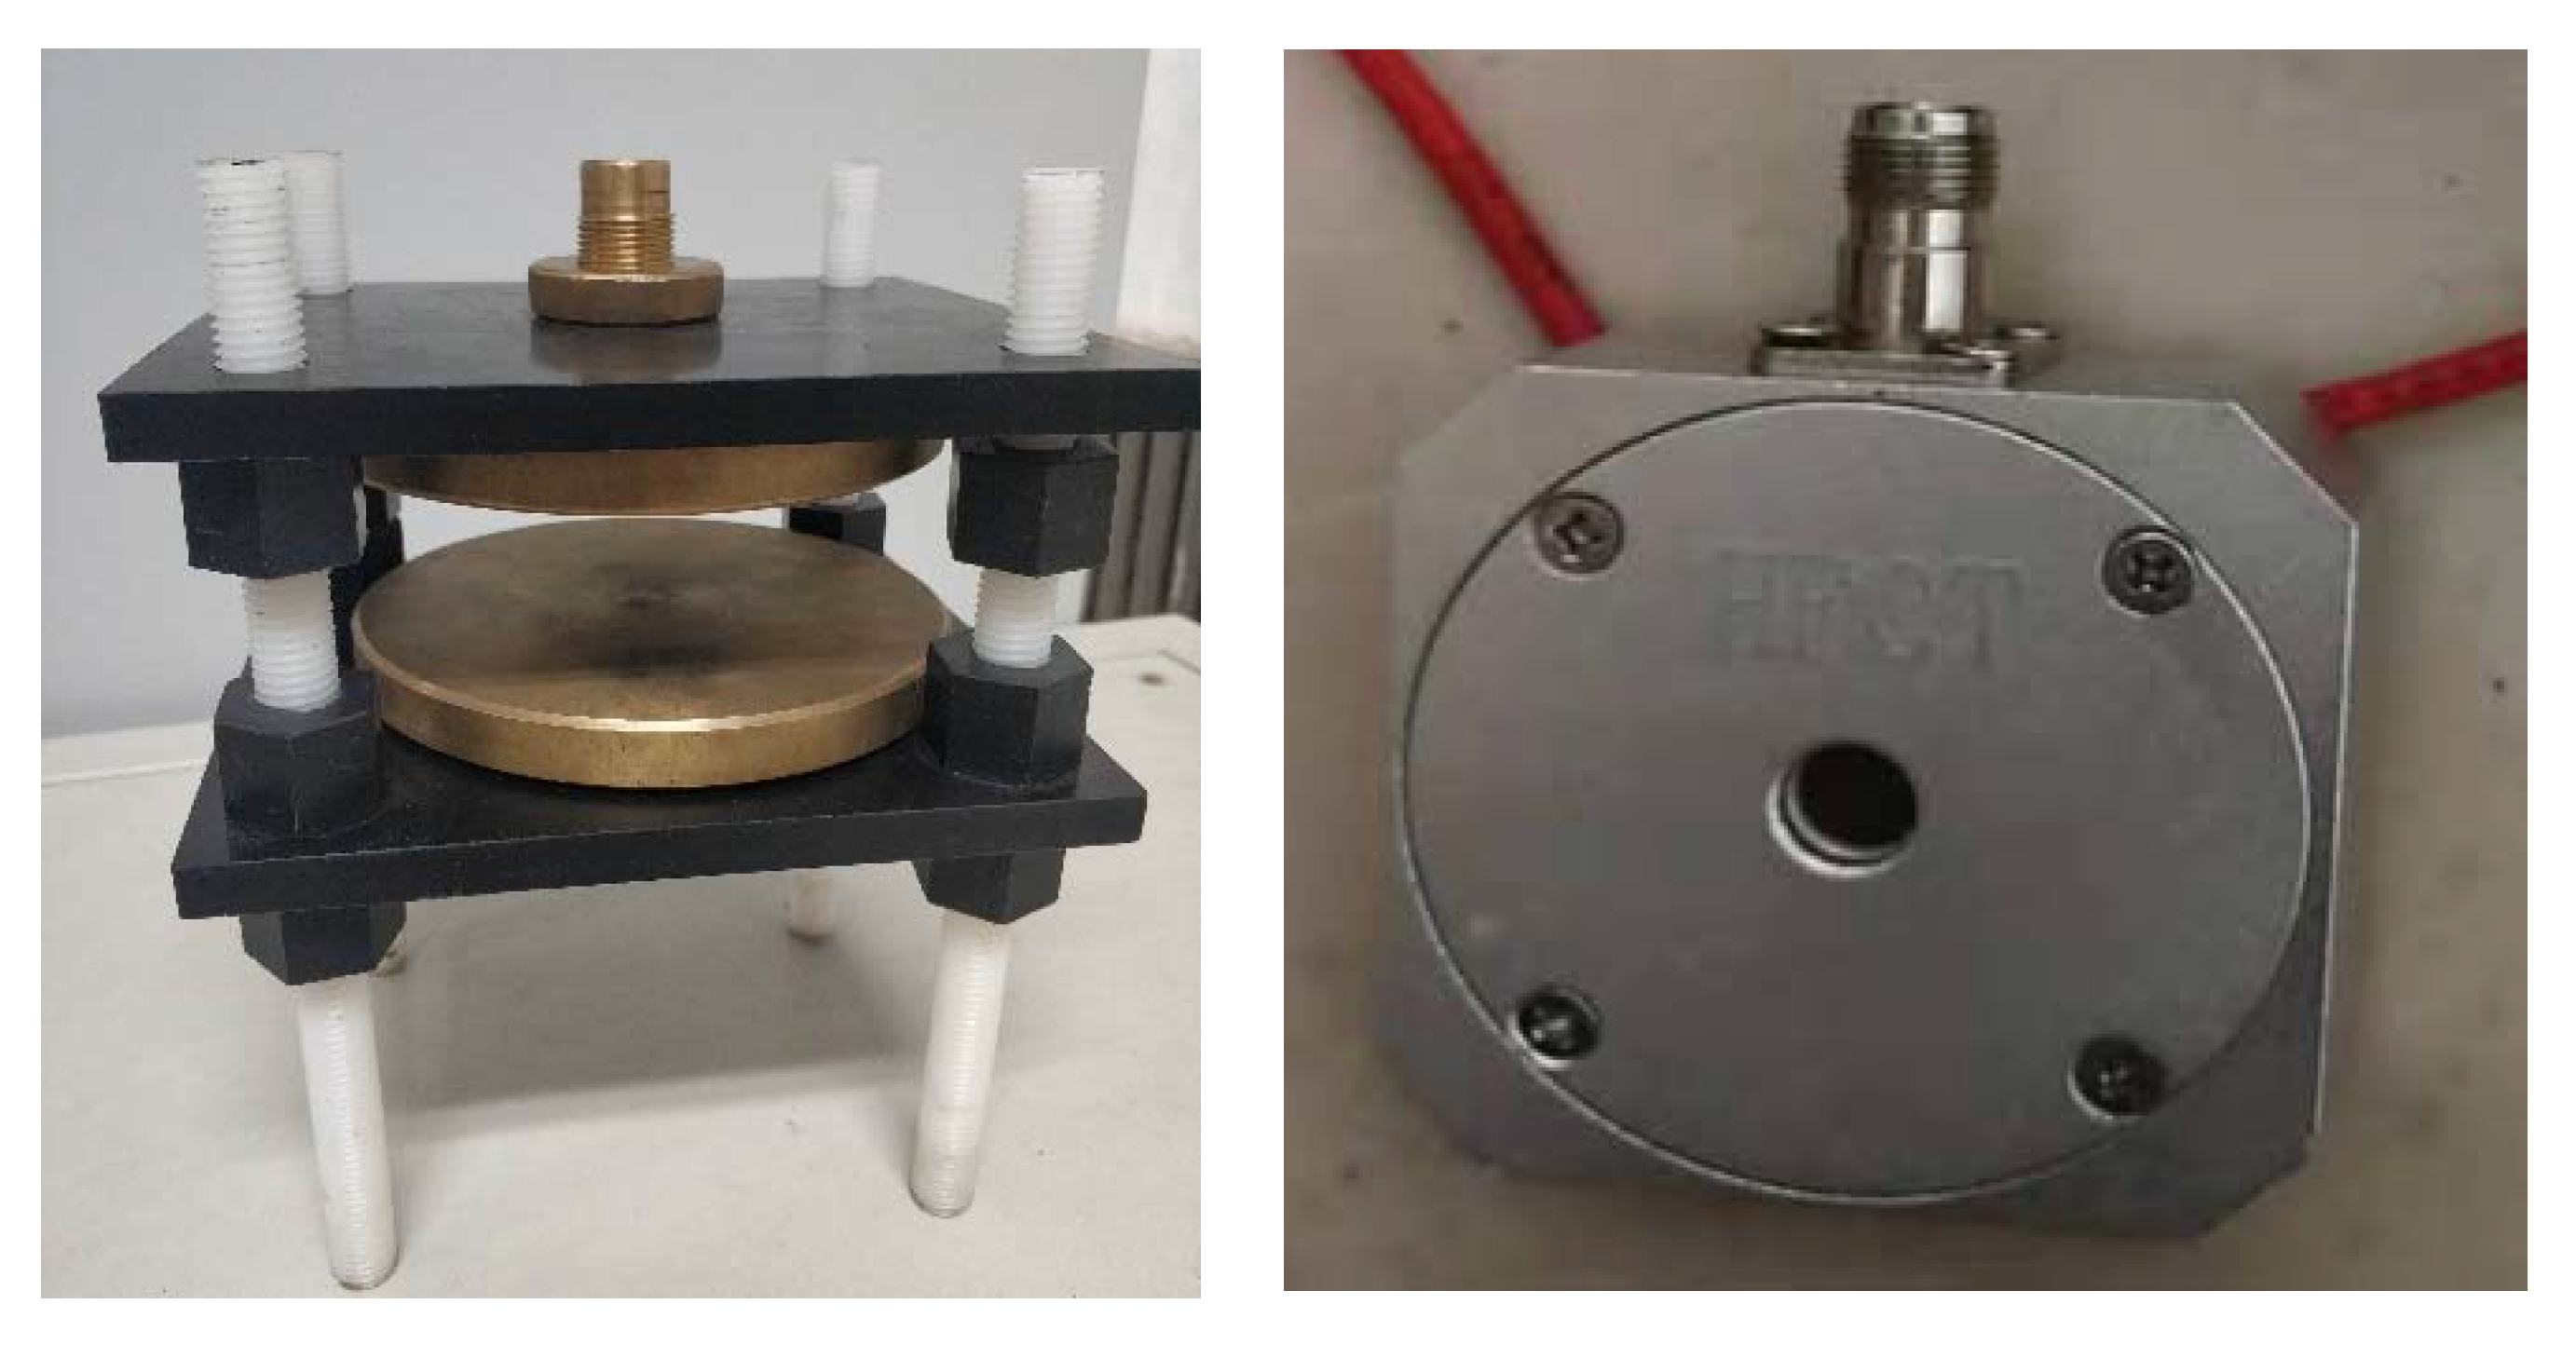
4.2. Terahertz Reflection Experiment and Result Analysis

The experimental equipment uses a 3649 THz vector network analyzer produced by China Electronics Technology Instrument Co., Ltd., (Qingdao, Shandong, China) the signal frequency is set to 170–220 GHz, which is 0.17–0.22 THz. We made the terahertz wave enter the insulator sample perpendicularly then measured and record the input return loss of the terahertz signal with S11 parameter and collected 10 curves for each group of samples. After screening, we took the average value as the spectrum curve of the sample and performed reflection measurements on the 11 groups of samples in turn. The experimental pictures are shown in Figure 16.
The experimentally measured S11 parameter curves of 11 sets of samples are shown in Figure 17.
The S11 parameter curves of these 11 groups of samples from the entire frequency range is different from the theoretical simulation in Section 4. For samples with similar aging degrees, the experimentally measured curves had different degrees of intersection or even overlapped. This may be caused by experimental error or the dispersion of the sample itself, but it can be clearly seen that the more severely aged samples will have greater input return loss measured overall.
The average value of S11 parameters on the curve of each experimental sample was calculated. After normalization, the S11 parameters are sorted in ascending order according to the degree of aging, and a scatter plot of the experimental S11 parameters under different degrees of aging were obtained. Compared with the curve obtained from theoretical calculation and simulation in Section 3, the experimental simulation results of the relationship between the aging degree and the terahertz S11 parameter are compared, as shown in Figure 18.
In order to verify the similarity between the experimental data and the simulation data, it is necessary to solve the Pearson correlation coefficient. We generated the S11 data sequence x i corresponding to the experimental aging degree from the quintic function curve obtained from the simulation, and made the experimentally measured data generate sequence y i . Then, the Pearson correlation coefficient r could be obtained by Equation (7).
r = N x i y i x i y i N x i 2 ( x i ) 2 N y i 2 ( y i ) 2     i = { 0 i 1 | i N }
The Pearson correlation coefficient of the experimental simulation data is 0.9928, which is very strong. It can be considered that the experimental data effectively confirms the validity of the trend obtained by the simulation. At the same time, however, the experimental simulation data have obvious differences in specific values. The Euclidean distance between the two point sets can be calculated, and the difference between the simulation experimental data is about 2.0950 dB. The theoretically derived S11 parameters of the terahertz signal under different aging degrees are lower than the experimental results on the whole. There are basically two factors that lead to the difference. The increase in the molecular chain is the main factor in the construction of the molecular chain model, ignoring the change in shape, which may make the relative dielectric constant calculated by the simulation lower than the true value. The second factor is that the inside of the silicon rubber slice used in the experiment cannot be completely uniform, and there may be delamination and pores in the inside of the severely aged sample. The existence of these internal defects aggravates the transmission loss and reflectivity of the terahertz signal in it. At the same time, errors can be caused by the vector network analyzer itself or the noise inside the device, and also depends on whether the antenna is in close contact with the sample. As a result, the input return loss obtained in the experiment is numerically higher than that of the theoretical simulation.
Due to the error analysis and differences between theory and practice, it can be concluded that the change rule of the terahertz wave S11 parameter with the aging degree of the material is consistent with the change rule obtained by calculation and simulation. The relationship between the S11 parameter and the degree of aging can be expressed by the quintic function fitting curve shown in Equation (6). Taking into account the convenience of engineering application and the excessive residual error of the linear fitting function, the relationship between the S11 parameter and the degree of aging can be approximated by the quadratic function fitting curve in Equation (8).
y = 0.07368 x 2 + 0.8051 x 13.29
After comparison of data from calculation, simulation and experiment, it can be concluded that by measuring the input return loss of the terahertz signal, the aging state of the PMVS insulator can be accurately judged. The use of terahertz wave measuring equipment to track the aging information of insulators in time can ensure the safety and stability of electrical equipment and the power grid.

5. Conclusions

The analysis of the aging principle of methyl vinyl silicone rubber in this study shows that material aging and molecular chain rupture will change the dielectric constant of the material. It is proposed that terahertz waves can be used to detect the aging degree of silicone rubber accurately and reliably.
In order to obtain the relationship between the aging of the silicone rubber insulator and the terahertz input return loss, the molecular simulation calculation of the methyl vinyl silicone rubber was first carried out to study the relationship between the relative permittivity and the molecular chain length. Then, a molecular chain scission model based on the normal distribution was proposed, the dielectric constant of the silicone rubber was calculated, and the results increased gradually with the decrease of the average molecular chain length. After that, the electromagnetic simulation model of the terahertz signal incident on the silicon rubber slice was built and simulated. The results show the relationship between the aging of the silicone rubber insulator and the terahertz input return loss. Finally, the validity of the relationship was verified by conducting terahertz reflection experiments on 11 insulator samples with different degrees of aging.
The work done in this article can provide guidance on the use of terahertz waves in the aging detection of silicone rubber insulators, improve the power system equipment state awareness, and promote equipment health evaluation capabilities.

Author Contributions

Conceptualization, Z.W.; methodology, H.Y.; software, W.D.; validation, H.Y. and W.D.; formal analysis, Z.W.; investigation, W.D.; resources, Z.W. and J.D.; data curation, W.D.; writing—original draft preparation, H.Y.; writing—review and editing, H.Y. and H.R.; visualization, H.Y.; project administration, Z.W.; funding acquisition, Z.W. All authors have read and agreed to the published version of the manuscript.

Funding

This research was funded by the National Key Research and Development Program of China, grant number 2018YFB2100104.

Institutional Review Board Statement

Not applicable.

Informed Consent Statement

Not applicable.

Data Availability Statement

Not applicable.

Conflicts of Interest

The authors declare no conflict of interest.

References

  1. Hackam, R. Outdoor HV Composite Polymeric Insulators. IEEE Trns. Dielectr. Electr. Insul. 1999, 6, 557–585. [Google Scholar] [CrossRef]
  2. Yoshimura, N.; Kumagai, S.; Nishimura, S. Electrical and Environmental Aging of Silicone Rubber Used in Outdoor Insulation. IEEE Trns. Dielectr. Electr. Insul. 1999, 6, 632–650. [Google Scholar] [CrossRef]
  3. Hussain, M.M.; Chaudhary, M.A.; Razaq, A. Mechanism of Saline Deposition and Surface Flashover on High-Voltage Insulators near Shoreline: Mathematical Models and Experimental Validations. Energies 2019, 12, 3685. [Google Scholar] [CrossRef] [Green Version]
  4. Shaik, M.G.; Karuppaiyan, V. Investigation of Surface Degradation of Aged High Temperature Vulcanized (HTV) Silicone Rubber Insulators. Energies 2019, 12, 3769. [Google Scholar] [CrossRef] [Green Version]
  5. Song, W.; Shen, W.W.; Zhang, G.J.; Song, B.P.; Lang, Y.; Su, G.Q.; Mu, H.B.; Deng, J.B. Aging Characterization of High Temperature Vulcanized Silicone Rubber Housing Material Used for Outdoor Insulation. IEEE Trns. Dielectr. Electr. Insul. 2015, 22, 961–969. [Google Scholar] [CrossRef]
  6. Gao, R.M.; Zhang, X.Q.; Guo, Y.J.; Fan, C.; Qiu, Y.; Li, Y.S.; Wu, G.N.; IEEE. Study on Detection Method of Composite Insulator Ageing Based on Hyperspectral Technology. In Proceedings of the 2019 2nd International Conference on Electrical Materials and Power Equipment (Icempe 2019), Guangzhou, China, 7–10 April 2019; IEEE: Piscataway, NJ, USA, 2019; pp. 461–466. [Google Scholar]
  7. Gonchar, N.R.; Treskina, M.N.; Ivanov, G.F. Study of Chemical Changes in Rubber Due to Ionization Aging by Means of Ir-Spectroscopy. Izv. Vyss. Uchebnykh Zaved. Fiz. 1972, 1, 138. [Google Scholar]
  8. Li, J.J.; Zhang, H.H.; Li, G.F.; Zhang, S.G.; Liu, Y.; Dong, K.; Zu, E.D.; Yu, L. Aging Mechanism Analysis of High Temperature Vulcanization Silicone Rubber Irradiated by Ultraviolet Radiation Based on Infrared Spectra. Spectrosc. Spectr. Anal. 2020, 40, 1063–1070. [Google Scholar] [CrossRef]
  9. Yi, Y.; Zhang, C.Y.; Chen, Z.Y.; Wang, L.M.; IEEE. Effect of Surface Aging on UV Intensity Characteristics for Long-Term Energized Conductors of HVDC Transmission Lines. In Proceedings of the IEEE International Conference on High Voltage Engineering and Application (ICHVE), Chengdu, China, 19–22 September 2016. [Google Scholar]
  10. Deng, H.L.; He, Z.F.; Chen, L. Ultrasonic Guided Wave-based Detection of Composite Insulator Debonding. IEEE Trns. Dielectr. Electr. Insul. 2017, 24, 3586–3593. [Google Scholar] [CrossRef]
  11. Yuan, C.; Xie, C.Z.; Li, L.C.; Zhang, F.Z.; Gubanski, S.M. Ultrasonic Phased Array Detection of Internal Defects in Composite Insulators. IEEE Trns. Dielectr. Electr. Insul. 2016, 23, 525–531. [Google Scholar] [CrossRef]
  12. Liang, H.; Rodrigue, D.; Brisson, J. Characterization of Recycled Styrene Butadiene Rubber Ground Tire Rubber: Combining X-Ray Fluorescence, Differential Scanning Calorimetry, and Dynamical Thermal Analysis for Quality Control. J. Appl. Polym. Sci. 2015, 132, 14. [Google Scholar] [CrossRef]
  13. Xu, F.; Mu, Q.D.D.; Li, L.J.; Yang, D.; Xia, B.L. Nondestructive Evaluation of Rubber Composites Using Terahertz Time Domain Spectroscopy. Fibres Text. East. Eur. 2018, 26, 67–72. [Google Scholar] [CrossRef]
  14. Wieczorek, K.; Ranachowski, P.; Ranachowski, Z.; Paplinski, P. Ageing Tests of Samples of Glass-Epoxy Core Rods in Composite Insulators Subjected to High Direct Current (DC) Voltage in a Thermal Chamber. Energies 2020, 13, 6724. [Google Scholar] [CrossRef]
  15. Liang, Y.; Gao, T.; Wang, X.; Sun, M.; Gao, L. Electric Field Intensity Effects on the Microstructural Characteristics Evolution of Methyl Vinyl Silicone Rubber via Molecular Simulation. Molecules 2018, 23, 1861. [Google Scholar] [CrossRef] [PubMed] [Green Version]
  16. Singh, R.; Kumar, A.; Harbola, M.K.; Samal, P. Semianalytical Wavefunctions and Kohn-Sham Exchange-Correlation Potentials for Two-Electron Atomic Systems in Two-Dimensions. J. Phys. B At. Mol. Opt. Phys. 2020, 53, 3. [Google Scholar] [CrossRef]
  17. Alam, S.; Serdyuk, Y.V.; Gubanski, S.M. Temperature and Field Induced Variations of Electric Conductivities of HTV Silicone Rubbers Derived from Measured Currents and Surface Potential Decay Characteristics. Energies 2020, 13, 2982. [Google Scholar] [CrossRef]
  18. Nayak, P.K.; Periasamy, N. Calculation of Ionization Potential of Amorphous Organic Thin-Films Using Solvation Model and DFT. Org. Electron. 2009, 10, 532–535. [Google Scholar] [CrossRef]
  19. Ruuska, H.; Arola, E.; Kortelainen, T.; Rantala, T.T.; Kannus, K.; Valkealahti, S. A Density Functional Study on Dielectric Properties of Acrylic Acid Grafted Polypropylene. J. Chem Phys. 2011, 134, 134904. [Google Scholar] [CrossRef] [PubMed]
  20. Popovic, Z.; Grossman, E.N. THz Metrology and Instrumentation. IEEE Trans. Terahertz Sci. Technol. 2011, 1, 133–144. [Google Scholar] [CrossRef]

Short Biography of Authors

Energies 14 04238 i001Haitao Yang is a PhD student in Beijing Jiaotong University. From September 2013 to July 2020, he studied for bachelor and master degrees in the School of Electrical Engineering of the University of Jinan; From September -now, September 2020-present, PhD in Beijing Jiaotong University; His current research direction is power system and its automation, Insulation detection technology, Sensor Technology...
Energies 14 04238 i002Zhensheng Wu is an associate professor and doctoral supervisor at Beijing Jiaotong University. From September 1993 to July 2003, he studied for bachelor, master and doctorate degrees in the Department of Electrical Engineering and Applied Electronic Technology of Tsinghua University, and finally obtained a doctorate degree in engineering. Since July 2003, he works in the School of Electrical Engineering, Beijing Jiaotong University, undertaking teaching and research work; 2011.02-2011.09, a visiting scholar at the University of California, IRVINE.; His current research direction is power system and its automation, high voltage and insulation technology, electrical engineering. And He is now the Deputy Secretary-General of the IEEE Smart Village China Committee...
Energies 14 04238 i003Dong Weinan is a master of Beijing Jiaotong University. From September 2015 to July 2019, he studied for bachelor’s degree in school of electrical engineering, North China University of technology; From September 2019 to now, I have studied for a master’s degree in Beijing Jiaotong University. His current research direction is intelligent monitoring and diagnosis of electrical equipment...
Energies 14 04238 i004Junpeng Dang, currently working for the Science and Technology Center of Yuxi Power Supply Bureau of Yunnan Power Grid Co., Ltd., graduated from Xi’an Electric Power College in June 2011, graduated from Jilin University in July 2020, and joined Yunnan Power Grid Corporation in July 2011 Work in Yuxi Power Supply Bureau. In 2018, he engaged in voltage management of the Production Technology Department of Yuxi Power Supply Bureau, and carried out professional management of power transformation, distribution voltage quality, line loss, and reactive power. Since 2020, he has been engaged in scientific and technological management of Yuxi Yuxi Power Supply Bureau. He has won the Yunnan Power Grid Corporation Scientific and Technological Progress Award for many times, and won the first prize of CEC Staff Technological Innovation and many other honorary awards...
Energies 14 04238 i005Hao Ren is an associate professor at China University of Petroleum (East China). He received his B.S. degree in Chemistry in 2003 at Shandong University, a Ph.D. degree in Physical Chemistry at University of Science and Technology of China, and a Ph.D degree in Biotechnology at Royal Institute of Technology, Sweden. From 2010 to 2013, he worked as a post-doc at University of California, Irvine. His current research mainly focuses on the development of ab-initio and machine learning methods for molecular spectroscopy...
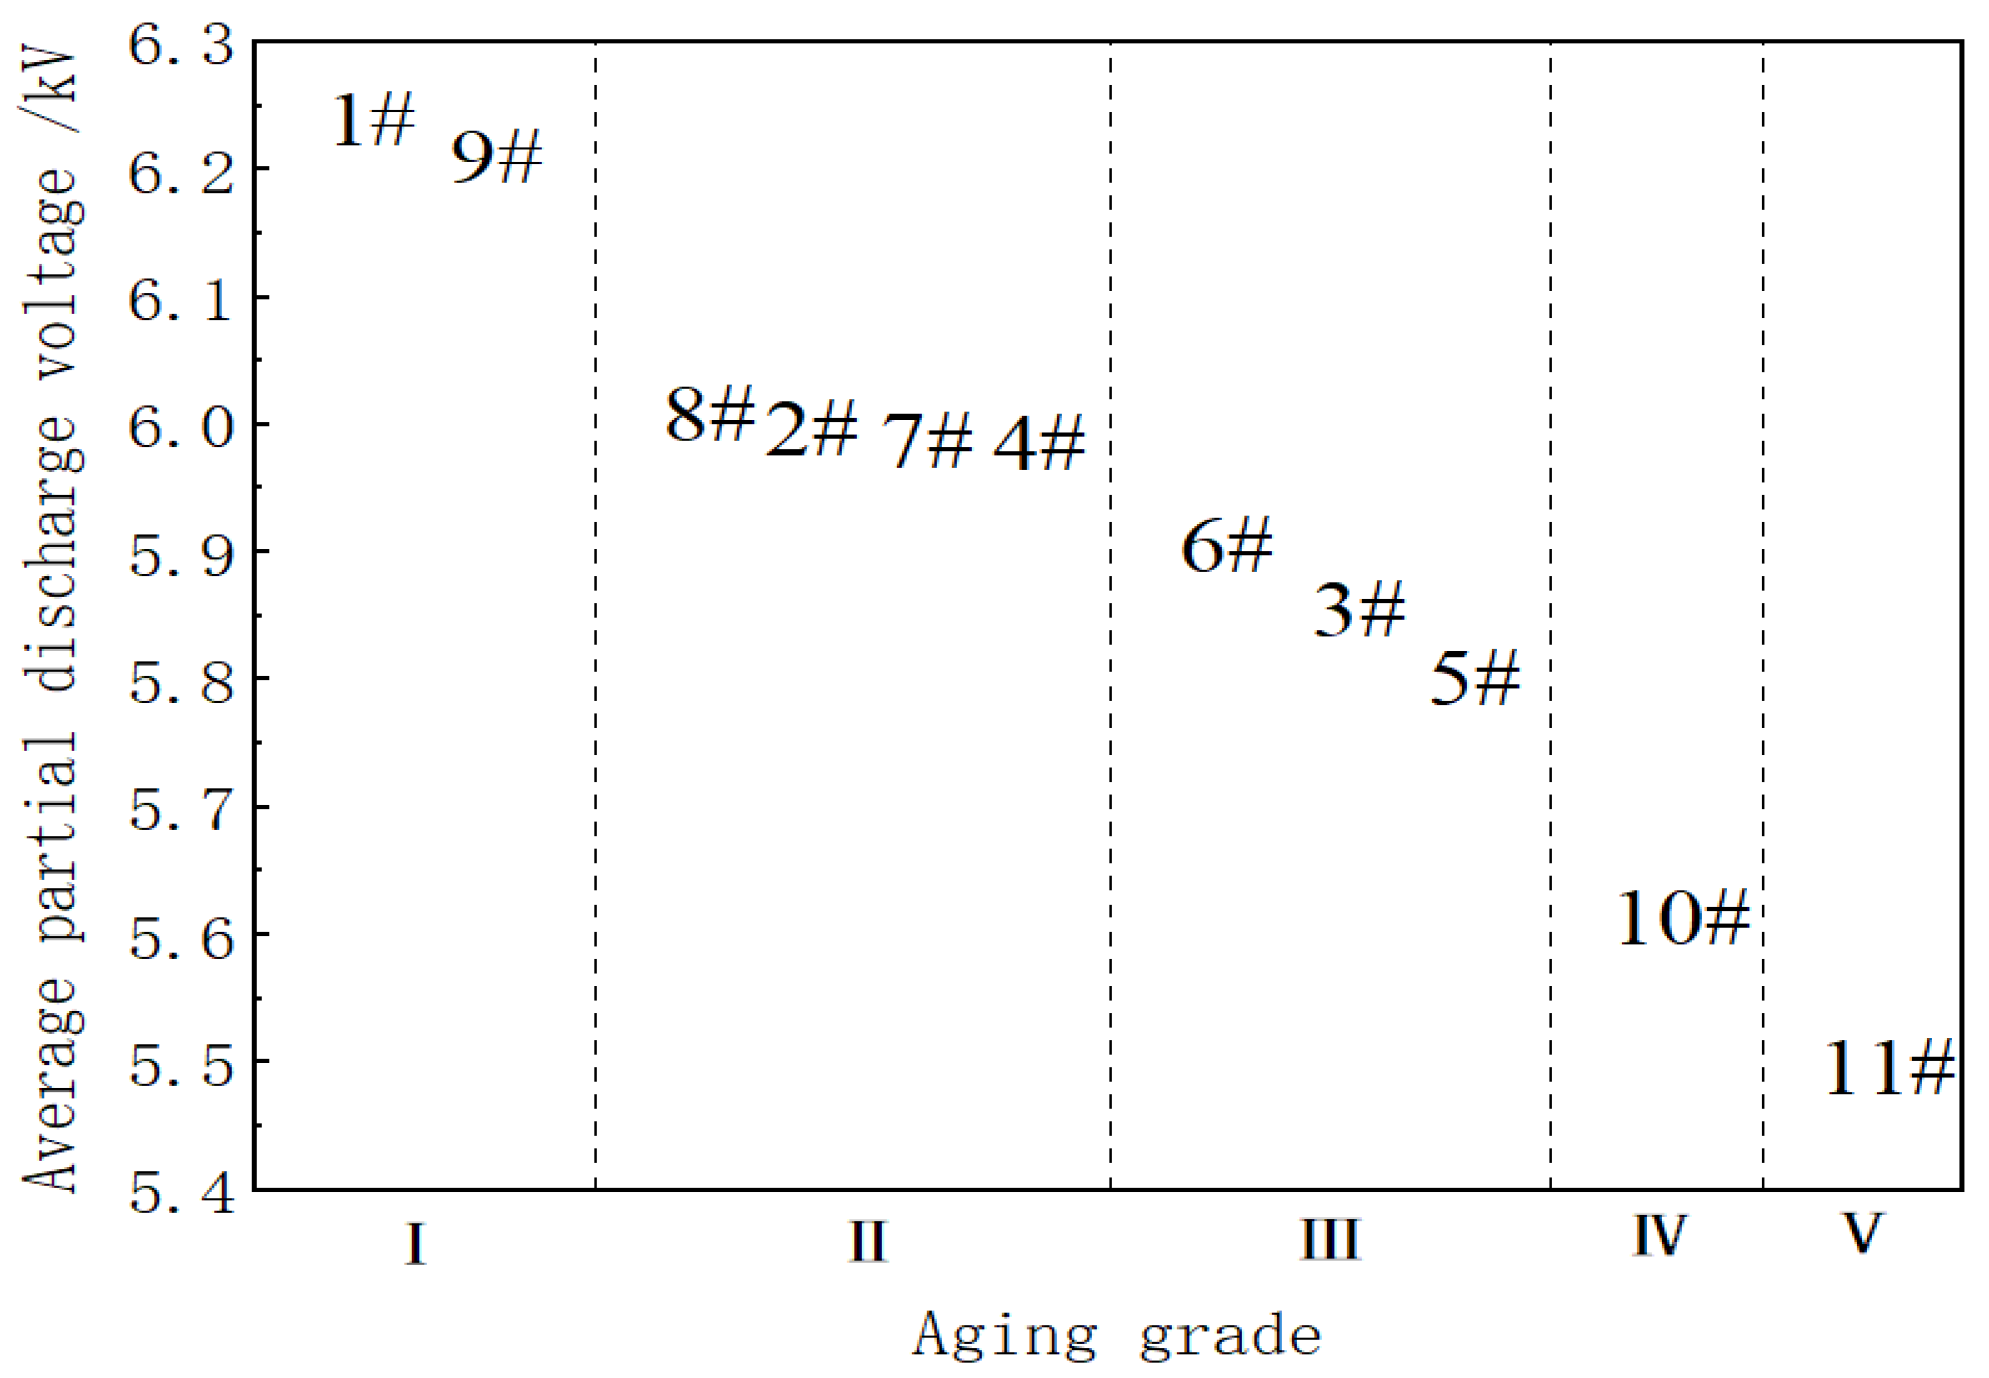
Figure 1. PMVS molecular structure diagram.
Energies 14 04238 g001
Figure 2. Schematic diagram of increase of PDMS molecular chain.
Energies 14 04238 g002
Figure 3. Molecular model diagram of dimethylsiloxane oligomer with chain number of 18.
Energies 14 04238 g003
Figure 4. The relationship between the number of molecular chains and ε .
Energies 14 04238 g004
Figure 5. Molecular chain break model solution flowchart.
Energies 14 04238 g005
Figure 6. The distribution of PMVS molecular chain length under different L u .
Energies 14 04238 g006
Figure 7. The curve diagram of the change of the dielectric constant with the average molecular chain length.
Energies 14 04238 g007
Figure 8. (a) PMVS material slice terahertz simulation model diagram. (b) THz incident and reflected pulse waveform diagram.
Energies 14 04238 g008
Figure 9. THz input return loss S11 change curve.
Energies 14 04238 g009
Figure 10. Fitting curve diagram of the relationship between the aging degree of silicone rubber and the terahertz S11 parameter.
Energies 14 04238 g010
Figure 11. The residual error diagram of the fitting curve of the relationship between the aging degree of silicone rubber and the terahertz S11 parameter.
Energies 14 04238 g011
Figure 12. The surface morphology of some typical samples.
Energies 14 04238 g012
Figure 13. Classification diagram of sample aging degree calibration.
Energies 14 04238 g013
Figure 14. Schematic diagram of plate electrode partial discharge device (left) and HFCT sensor (right).
Energies 14 04238 g014
Figure 15. Sort diagram of aging degree of insulator samples.
Energies 14 04238 g015
Figure 16. Experimental diagram of terahertz input return loss measurement.
Energies 14 04238 g016
Figure 17. S11 parameter curve diagram of 11 sets of samples.
Energies 14 04238 g017
Figure 18. Comparison of experimental simulation results between aging degree and terahertz S11 parameters.
Energies 14 04238 g018
Table 1. Partial discharge voltage data of insulator slice.
Sample NumberStart Discharge
Voltage/kV
Current Sound Voltage/kVImpending Breakdown Voltage/kVAverage Discharge Voltage/kV
1#4.75596.25
2#4.6254.8758.756.083
3#4.54.758.3755.875
4#4.6254.87586.000
5#4.54.8758.1255.833
6#4.75585.917
7#4.754.8758.56.042
8#4.62558.756.125
9#4.754.87596.208
10#4.3754.585.625
11#4.1254.6257.755.5
Publisher’s Note: MDPI stays neutral with regard to jurisdictional claims in published maps and institutional affiliations.

