1. Introduction
Due to the pressure difference, part of the fluid that flows from the pressure surface (PS) side to the suction surface (SS) side of the blade through the blade radial clearance forms the tip leakage flow (TLF). Affected by the mainstream and secondary flow near the endwall, the tip leakage vortex (TLV) is the main form of tip clearance flow [
1,
2]. With the requirement of the high thrust–weight ratio in modern aero-engines, the transverse pressure gradient of the compressor increases continuously, which makes the leakage flow strengthen and the end flow field more complex [
3,
4]. Therefore, the blockage is intensified near the tip region and the loss is increased, resulting in a lower aerodynamic performance. Moreover, the tip leakage flow is closely linked to the flow instability of the compressor, such as the rotating stall [
5,
6].
Tip clearance size (TCS) is a major parameter affecting the intensity of the clearance leakage flow. With the increase in the tip clearance, the scale and intensity of the leakage flow are increased, and the leakage loss is increased [
7]. The increment of total pressure loss brought about by the change of tip clearance mainly comes from the vortex loss part, and the other cause of the flow loss is the wake loss [
8]. The increase in the tip clearance may also lead to the premature breakdown of the leakage vortex [
9,
10]. Hah [
11] found that the double-leakage flow with large tip clearance generates a vortex rope with a lower pressure core, which breaks up the tip leakage core vortex of the adjacent blade and results in a large amount of additional mixing loss.
For the transonic fan or compressor, the interaction between the TLV and the shock wave aggravates the passage blockage and further deteriorates the compressor performance. According to reference [
12,
13], the shock-vortex interaction is enhanced as the tip clearance increases, and the influence range of the TLV downstream of the shock wave is significantly broadened. By adjusting the tip clearance, Wisler [
14] and Moore et al. [
15] found that the compressor faced the loss of peak efficiency for the increase in the tip clearance size, and the variations of the stall margin and the loss of peak pressure rise were similar to that of the loss of peak efficiency.
The unsteady fluctuation of the tip clearance flow is related to the rotating stall of the compressor, and there are two main explanations at present. The first is that the breakdown of the leakage vortex, which induces a self-excited vibration, and, eventually, causes the fluctuation of the tip flow field and compressor instability [
16]. The unsteady breakdown of leakage vortex could trigger the occurrence of a rotating stall with a short-scale spike type [
17]. Wu et al. [
18,
19] analyzed that the vortex breakdown modes of the tip leakage vortex of the transonic compressor rotor are mainly bubble type and spiral type. Both of the types could lead to self-excited unsteady fluctuation, and the secondary vortex structure may appear when the breakdown form is the latter. The spiral-type breakdown structure of the leakage vortex after passing through the shock wave was successfully observed by using the detached eddy simulation by Su et al. [
20] Using a large eddy simulation, it is found that the onset position of the secondary leakage vortex and the angle between the vortex core and the blade chord changed periodically, which was one of the main reasons for the blade tip instability [
21].
The second view about the unsteady fluctuation in the tip field is that the interaction between the mainstream and tip clearance flow causes self-excited instability [
22]. The unsteady fluctuation mechanism in the subsonic compressor proposed by Deng et al. [
23], which is the dynamic balance between the ‘blade force’ formed by the pressure difference and the ‘blade loss force’ formed by the tip leakage flow, and the mechanism in the transonic compressor [
24], which refer to the interference between the leakage flow and shock wave, are also consistent with this viewpoint in essence. By increasing the tip clearance of one of the blades in a transonic fan, Khaleghi et al. [
25] found that the large-tip blade responded to the stall initiation. Under this interpretation, the reason for stall inception is the enhancement of the tip clearance flow intensity, which extends the low-velocity region near the blade tip leading edge (LE), resulting in the tip leakage flow spillage from the LE and the enhancement of an unsteady fluctuation. In addition, Smith et al. [
26] believed that with the increase in tip clearance, the momentum of leakage flow increases and contributes to the forward spillage of the leakage flow, which makes the LE separate and leads to the inception of a spike type compressor rotating stall. Reasonably controlling the magnitude and distribution of axial momentum of tip leakage flow is a very potent way to improve the compressor stall margin.
Although there is some research that has been carried out on the tip clearance effect of single rotors [
12,
13,
27] and the hub clearance effect of stators [
28,
29], the understanding of the tip clearance on the performance and stall mechanism of the axial-flow transonic compressor, including the stator, is still insufficient. Various tip clearance sizes may cause different stall mechanisms, which are closely associated with the development of an interaction between the tip clearance flow and shock wave, while the mechanism of their internal correlation has not been explained. What role does the stator play? What are the reasons for the discrepancy in the stall mechanisms? Based on this background, the effect of tip leakage flow on the compressor performance is investigated numerically, which may provide a guide for a better understanding of the leakage flow structure and mechanism.
The research contents and layout are as follows. Firstly, the researched object and numerical method are introduced and verified. Then, in
Section 3, the influence of rotor tip clearance on the rotor leakage flow, stator flow field, and overall compressor performance is analyzed in detail, and the mechanism of its effect on the stall margin is included. Finally, the main conclusions are summarized.
2. Investigated Compressor and Numerical Method
The investigated object is the single-stage axial-flow transonic compressor NASA Stage35 [
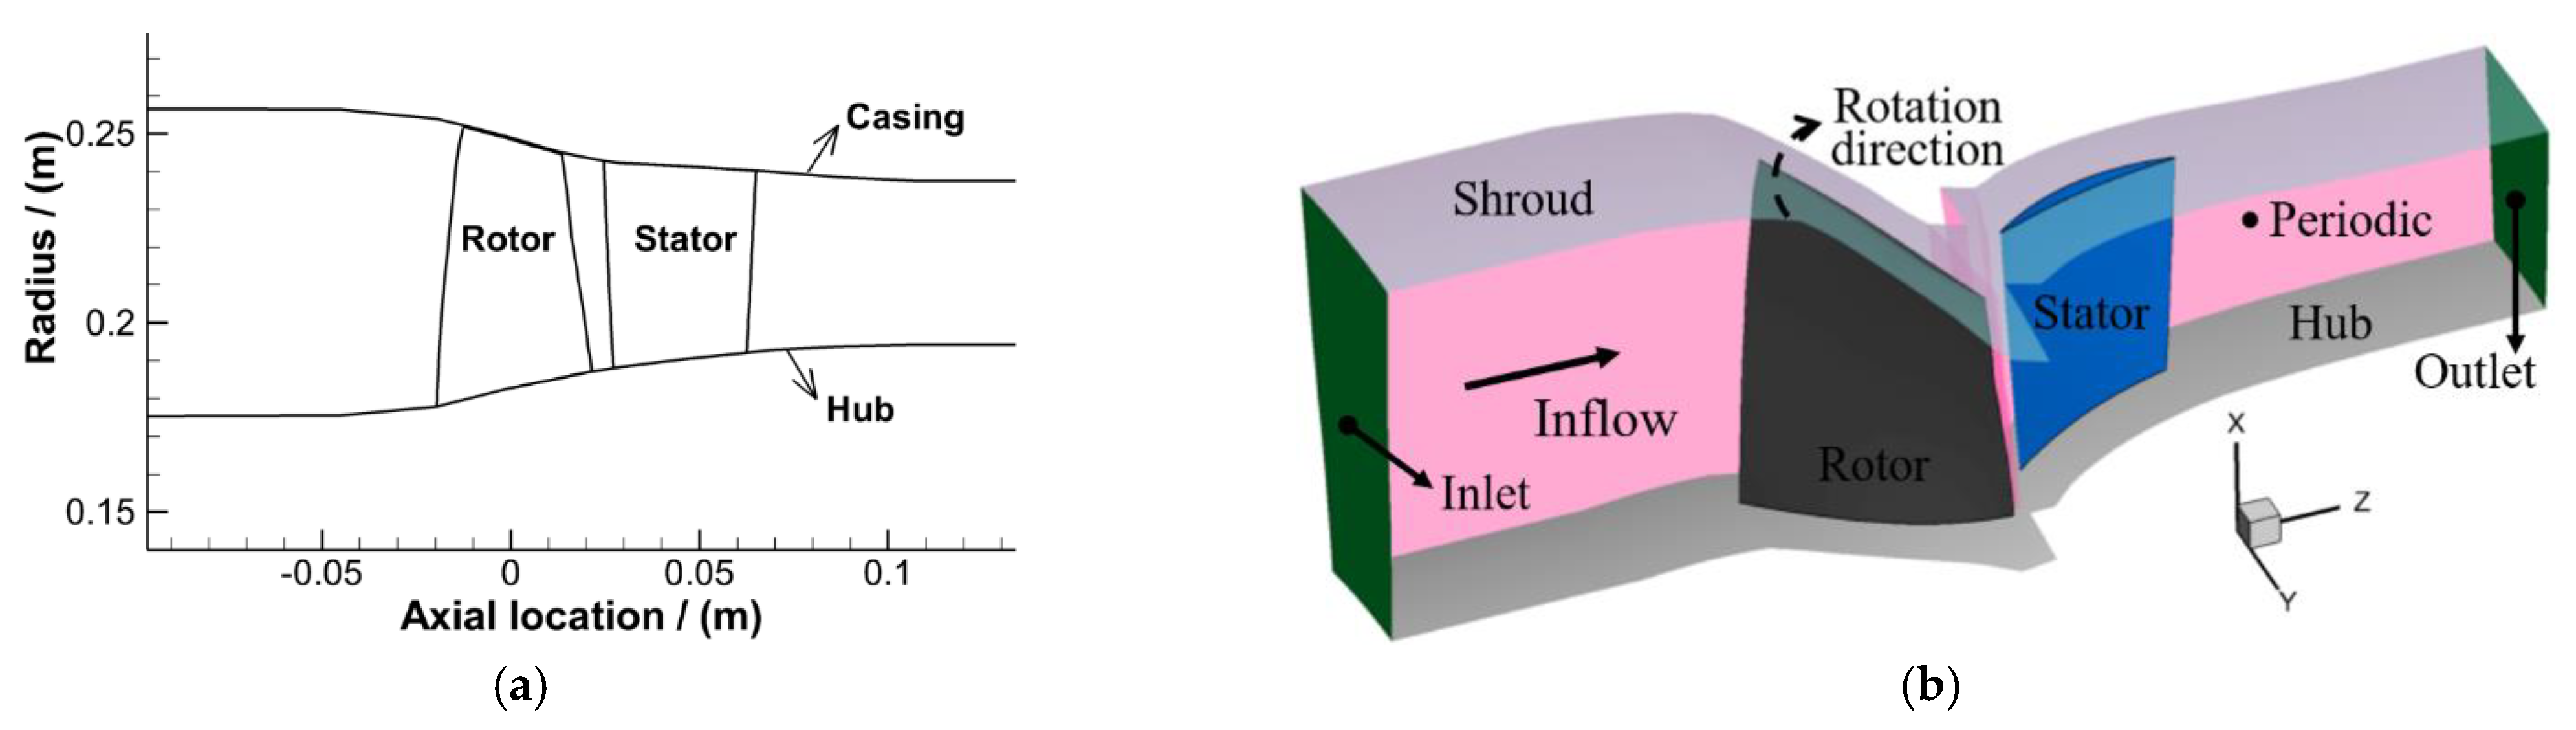
30], and the research about the effect of rotor tip clearance size on the stage performance was investigated by adjusting the rotor tip clearance. The prototype geometry and computational domain are shown in
Figure 1, and
Table 1 lists the design parameters. The rotor tip clearances are set to 0.25
τ, 0.5
τ, 1.0
τ, 1.5
τ and 2.0
τ, where
τ is the design radial clearance of the rotor blade.
The computational domain was meshed by NUMECA/Autogrid5 to generate an H-O4H-H topology for a single passage. There were 17 nodes in the rotor tip radial gap along the radial direction, and the butterfly grid was applied to improve the capture ability of the blade tip flow field. Depending on the previous grid independence [
31], as shown in
Figure 2, when the grid number exceeds 2 million, the variation of compressor performance decreases significantly, in where the total pressure ratio (
) and isentropic efficiency (
) are defined as equation 1 and equation 2. Therefore, according to reference [
32] and taking the computational accuracy and cost into account, the total number of grids in the current study was about 2.08 million. The mesh near the solid wall was encrypted locally and the first layer cell width was set to
, which made the dimensionless parameter
. The computational mesh is shown in
Figure 3, and the enlarged local view of butterfly mesh at the LE and trailing edge (TE) of the rotor blade tip is given.
where
and
indicate the total pressure and the total temperature, respectively, and the subscripts 1 and 3 indicate the inlet and outlet sections of the compressor, respectively.
is the specific heat ratio.
Referring to the detailed setup of the numerical calculation described by Lungu [
33], the numerical method setting of the current research is introduced below. NUMECA Fine
TM/Turbo was utilized to solve Reynolds averaged Navier–Stokes (RANS) equations. The Runge–Kutta iteration scheme and central difference scheme were used to discretize the time and spatial terms in the governing equations, respectively. The Spalart–Allmaras (S–A) turbulence model [
34] was selected because of good convergence and stability, as well as the appropriate prediction, which was consistent with the experiments. The kinematic turbulent viscosity is specified for the turbulence model. The CFL number was 3.0. Meanwhile, the multigrid and implicit residual smoothing techniques were employed to accelerate the convergence. To save computational resources, the actual computational domain of this study is a single passage, and periodic boundary conditions are added on the passage sides. The inlet condition of the calculation domain was given as the inflow direction, total temperature and total pressure. The average static pressure was given as the outlet boundary. Moreover, the solid walls were non-slip and adiabatic.
To verify the accuracy of the calculation method, a comparison between the numerical (CFD) and experimental results (Exp.) of the stage at three speeds (n) is given in
Figure 4. The test results are from report [
30], and the abscissa is normalized by the mass flow rate at the choke condition. Although the pressure ratio and efficiency obtained by calculating the near stall condition are a little lower than the test results, the prediction of the overall trend and stability operation range is more accurate.
Figure 5 displays the spanwise distribution of the aerodynamic parameters at the compressor outlet at the peak efficiency point (PEP) and near stall point (NSP) at design speed,
Figure 5a shows the total pressure ratio comparison, and
Figure 5b shows the total temperature ratio (
) comparison. One can see that, except for the stage tip at the NSP, the distribution of the numerical total pressure ratio is almost completely consistent with the experimental results in other low span areas and conditions, and the overall distribution trend is consistent. The total temperature ratio distribution of the numerical and experimental results coincides well with each other.
Furthermore,
Figure 6 shows the axial velocity (
) contour obtained by experiment and calculation at a 92% blade span near the PEP at an 80% design speed. The experimental results are measured using a laser Doppler velocimeter (LDV) [
35]. The experimental results show two complete blade passages, while the numerical results show one complete blade passage and two half-passages, in which the complete blade passage is focused on and compared. The shock wave location and the trajectory of the tip leakage vortex obtained by experiment and numerical calculation is consistent. Combined with
Figure 4,
Figure 5 and
Figure 6, it is indicated that the stage overall performance can be predicted accurately and the flow field details can be captured reliably by the calculation method introduced in this paper. As a consequence, it is reasonable to believe that the conclusion about the flow characteristics of the compressor can be drawn through numerical simulation.
3. Results and Discussion
3.1. Effect of Rotor Tip Clearance on Stage Overall Aerodynamic Performance
Firstly, the effects of the rotor TCS on the stage overall aerodynamic performance are analyzed.
Figure 7 shows the variation trend of the compressor performance curves with different rotor TCS. In the figure, the PEP is the peak efficiency point under each rotor clearance, and P1 represents the condition under each rotor’s TCS with the same mass flow as the NSP with a rotor TCS of 2.0
τ. In this study, the numerical stall limiting is used as the compressor stall point, that is, the point with the minimum mass flow corresponds to the last convergence point in the calculation. With the increase in the rotor TCS, the compressor performance curve moves to the small flow direction as a whole, the choke flow rate decreases, and the degree of reduction is positively related to the increment of the rotor TCS.
The stage stable operating range is widened with the smaller clearance, while that is shortened with the larger clearance. When the inlet mass flow is more than 19 kg/s, the total pressure ratio of the compressors with the smaller rotor tip clearances is higher than that with the design clearance, but it is lower when the mass flow is less. Similarly, the variation of the total pressure ratio with a rotor TCS of 0.25τ compared with that of 0.5τ is the same as above. The total pressure ratio under the larger rotor radial clearance is lower than that with design TCS in the whole stable operating range, and the total pressure ratio is reduced with the large rotor TCS. In the process of compressor throttling, the isentropic efficiency decreases with the increase in the rotor TCS when the mass flow is greater than that corresponding to the PEP. Additionally, then, it grows with the increment of the rotor TCS. At the NSP, the isentropic efficiency of the compressor with a rotor TCS of 0.25τ and 0.5τ is slightly less than that with the design clearance. Moreover, the isentropic efficiency of the two smaller rotor tip clearances is essentially in an agreement under the condition of approaching stall.
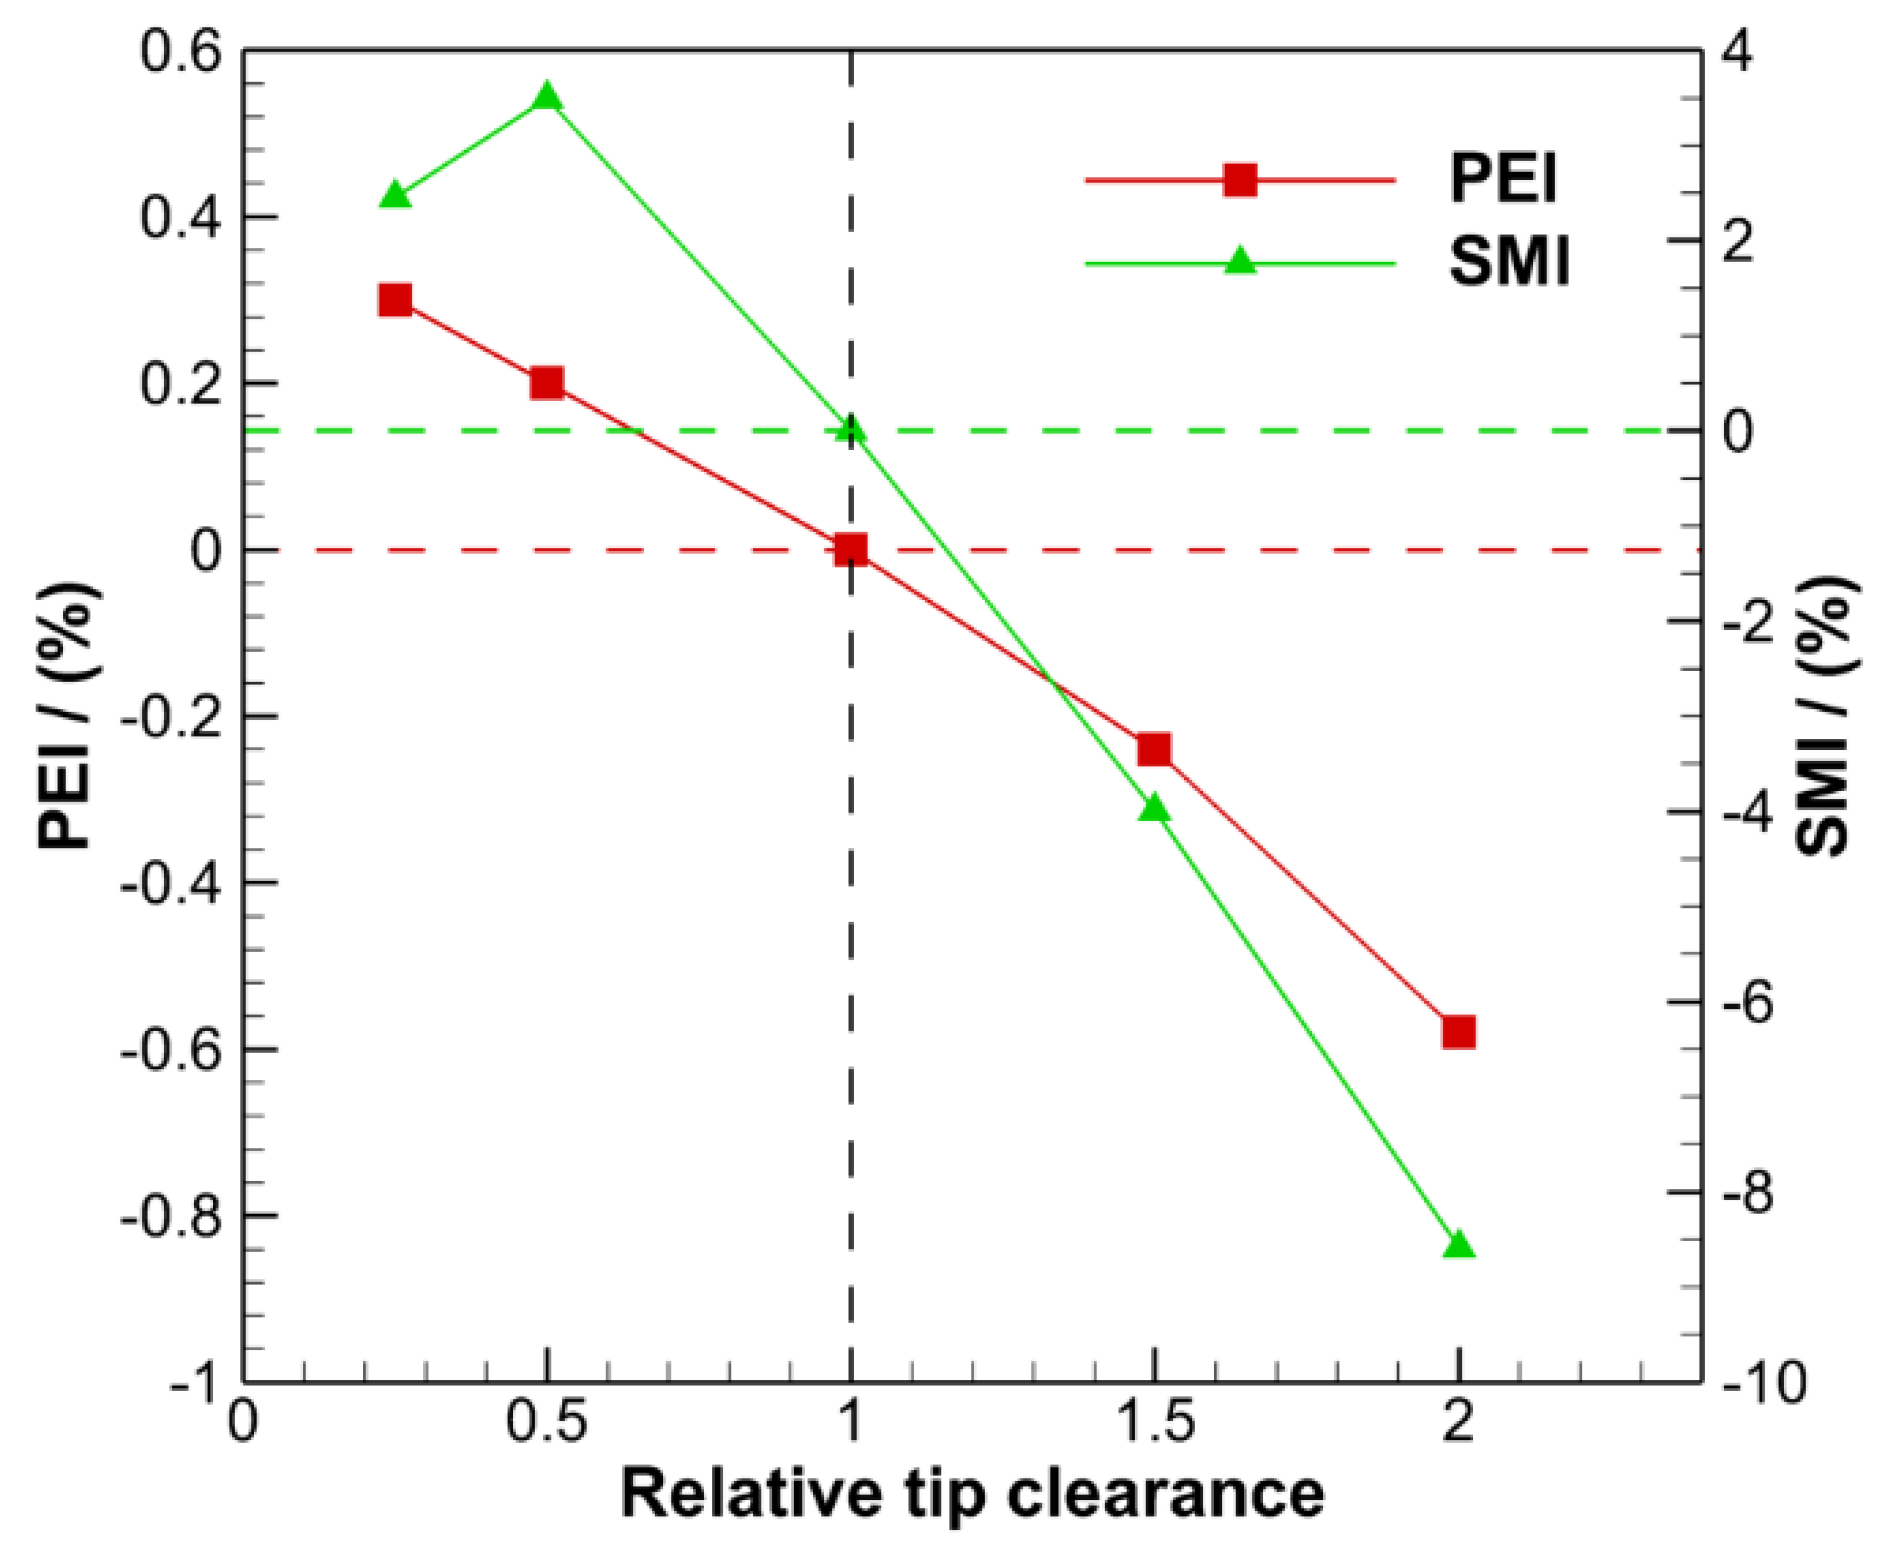
Figure 8 shows the peak efficiency improvement (
PEI) and stall margin improvement (
SMI) with the rotor TCS compared with the design clearance, and the
PEI and
SMI are defined as follows [
36]:
where
is the peak efficient, and
and
are the mass flow and total pressure ratio corresponding to the NSP, respectively. The subscripts
and
indicate the compressors with various tip clearance size and design clearance, respectively.
It can be seen from the figure that the peak efficiency almost linearly decreases as the rotor TCS increases from 0.25τ to 2.0τ. It increases by about 0.3% when the rotor tip clearance is 0.25τ and decreases by about 0.58% when the rotor TCS is 2.0τ. Compared with the design clearance, the stall margin with the smaller rotor TCS is improved. In the range of the rotor TCS from 0.5τ to 2.0τ, the SMI also decreases linearly with the increase in the rotor TCS, which is about 8.6% less than the design clearance at a rotor TCS of 2.0τ. Considering the influence of the rotor TCS on the PEI and SMI of the stage, the compressor performance can be improved by reducing the rotor TCS to 0.5τ. In this condition, the compressor peak efficiency and stall margin are increased by about 0.2% and 3.5%, respectively.
3.2. Effect of Rotor Tip Clearance on Tip Leakage Flow and Rotor Tip Flow Field
Next, the influence of the rotor TCS on the TLF and passage shock wave is investigated with four rotor tip clearances of 0.5
τ, 1.0
τ, 1.5
τ, and 2.0
τ.
Figure 9 shows the three-dimensional leakage flow streamlines near the rotor blade LE, which are identified by the normalized helicity (
). The definition of the normalized helicity is as follows [
9]:
where
and
denote the relative velocity and absolute vorticity vectors, respectively, and
is the magnitude of the vector. The black curves in the figure are the contour lines with the relative Mach number of 1, which characterize the position of the shock wave.
When increasing the rotor TCS, the TLF intensity increases obviously, and the onset position of the double leakage flow moves upstream. The TLV/shock wave interaction results in the deflection of the shock wave. The shock wave near the blade PS is gradually pushed out of the rotor blade passage as the rotor clearance enlarges, while that on the rotor blade SS moves downstream, thus increasing the corresponding flow loss. Downstream of the shock wave, the TLV expands rapidly (black dotted circle), the normalized helicity decreases, and the blockage of the flow passage is intensified. Especially for the compressor with a rotor TCS of 2.0τ, the P1 condition also corresponds to the NSP, the winding structure of leakage streamlines is much stronger than other cases.
The absolute vorticity (
) [
22] distribution is shown in
Figure 10. The absolute vorticity is defined in equation 6, which can be used to characterize the TLV intensity, as follows:
where
denotes the angular velocity of rotor rotation. There are eight slices perpendicular to the axial direction from the rotor blade tip LE to TE shown in
Figure 10. The high absolute vorticity region near the blade SS represents the influence region of the TLV. The area of high absolute vorticity increases from the LE to the 20% axial blade chord and then decreases downstream of the shock wave, which shows that the TLF intensity increases first from the LE and weakens under the action of the shock wave. With the increase in the rotor TCS, the area of the high absolute vorticity region increases along with the spanwise and pitchwise, and the TLV intensity increases obviously.
A comparison of the relative Mach number (
) distribution of a rotor blade tip plane for different rotor tip clearances at the P1 condition is shown in
Figure 11. The TLV/passage shock wave interaction leads to a low-velocity region surrounded by a black ellipse downstream of the shock wave, which seriously blocks the passage and worsens the flow capacity near the tip region. Due to this low-velocity region, the main flow moves towards the blade PS, which leads to the increment of the incidence angle at the blade LE and the possibility of the stall. With the increase in the rotor TCS, the area of the low-velocity region increases and moves towards the blade PS and LE, and the tip flow field further deteriorates. The extension of the low-velocity region also inflates the risk of the leakage flow spillage from the blade LE to the adjacent passage. That is to say, the LE spillage of the mainstream/TLF interface is accelerated, which is very unfavorable to the compressor stall margin. Additionally, there is another low-velocity region close to the blade SS, which is owing to the boundary layer separation due to the shock wave interaction. The interaction position of the shock wave on the blade SS moves backward as the rotor TCS increases; therefore, the boundary layer development length downstream of the shock wave is shortened, resulting in the area of this low-velocity region being gradually reduced.
Figure 12 exhibits the comparison of the static pressure coefficient (
Cp) at 98% rotor blade span of each case to reflect the variation of blade load and pressurization capacity. The coefficient is the normalized local static pressure, which is dimensionless by the inlet total pressure. The abscissa is the dimensionless axial chord normalized by the rotor blade tip chord length, the same below. When the rotor clearance gradually increases, the blade tip load decreases upstream of the 50% axial chord length and increases downstream. According to the characteristic of the differential pressure driving of the TLF, the TLF intensity would be varied with the load changes at the blade tip. Furthermore, refer to the analysis method of reference [
36],
Figure 13 shows the tip leakage flow angle (TLA) distribution along the rotor blade tip chord, the TLA is the angle between the TLF at the mid-gap exit and the axial direction. It decreases from the LE, except for the case with a TCS of 2.0
τ, then increases from 20% axial blade chord to the location of the shock wave and, subsequently, decreases gradually downstream of the shock wave. Considering the static pressure distribution of the rotor blade tip, the TLF intensity increases as a whole but decreases near the blade LE by increasing the rotor TCS. This conclusion can also be obtained by comparing the area and value of the high absolute vorticity region in
Figure 10.
3.3. Effect of Rotor Tip Clearance Size on Compressor Stage Flow Field
The effect of the rotor TCS on the performance of the whole compressor blade span, including the stator, is analyzed.
Figure 14 shows the limit streamlines on the blade SS of the rotor and the stator. The fluid in the red box near the rotor LE migrates radially due to the entrainment of the TLV. With the increase in the rotor TCS, the spanwise and axial influence range of the TLF increase, and the related leakage loss and blockage near the rotor tip passage increase. The change of the rotor TCS not only changes the tip flow field but also influents the whole rotor span flow field. In
Figure 14a, there is a separation line (
) induced by the shock wave. The separation line moves backward when increasing the rotor TCS, that is, the shock wave action position on the rotor blade SS moves downstream. When the rotor tip clearance sizes are 0.5
τ, 1.0
τ, 1.5
τ, and 2
τ, the corresponding shock positions at the rotor tip are 52, 57, 60, and 67% of the axial blade tip chord, respectively, which indicates that the interference effect between the TLV and the shock wave intensifies. The flow separation occurs under the shock wave/TLV action, and then reattaches at the reattachment line (
) position. The reattachment line does not move with the change of the rotor TCS. It can be summarized that the increase in the rotor TCS mainly worsens the tip flow field by increasing the TLF intensity and modifies the flow field in other spans by moving the shock position backward.
One can see from
Figure 14b that the change of the rotor TCS also has an important impact on the downstream stator flow field. Due to the TLF and TE wake of the upstream rotor, there is a recirculation zone (red box) near the LE on the SS of the stator blade tip, and its area is increased with an enlarging rotor TCS. The flow separation occurs in the stator casing corner, and a shedding vortex structure is formed near the stator blade TE. The concentrated vortex shedding position from the stator blade gradually moves to the low blade span, from about 80% span under a rotor TCS of 0.5
τ to about 68% span under a rotor TCS of 2.0
τ. The range of casing corner separation increases significantly, resulting in the deterioration of the flow field in the stator high blade span. A separation line and a reattachment line on the SS near the LE of the stator blade for each case with different rotor blade tip clearances also existed. When the rotor TCS increases from 0.5
τ to 2
τ, the position of the separation line almost remains unchanged, while the reattachment line gradually moves forward, thereby the separation zone is shortened and the flow field is modified. Meanwhile, the stator LE separation and the lifting phenomenon of streamlines near the TE is also significantly improved, and the flow field near the stator blade root is also modified.
Figure 15 further shows the pitch-averaged entropy and flow angle (
) distribution at the rotor outlet. Increasing the rotor TCS, increases the high-entropy region at the blade tip because of the enhancement of the TLF intensity and the shock wave/TLV interference. The entropy above an 83% blade span gradually increases, while that below an 83% span decreases and the loss decreases.
For
Figure 15b, the variation trend of the flow angle at the rotor outlet with the rotor TCS is consistent with the spanwise distribution of entropy. The flow angle above an 86% blade span decreases, and the flow capacity decreases, while that of the region below an 86% blade span increases. The intensity of the TLF and its interference with shock wave is enhanced and the tip flow field blockage is intensified as the rotor tip clearance increases, which makes the contraction degree of middle and low blade span increase and the blade load decrease.
Figure 15b also shows the spanwise distribution of the pitch-averaged flow angle at the stage outlet. The outlet flow angle in the tip region gradually decreases, while it increases in the blade root region, and changes little in the middle blade span as the rotor clearance increases.
3.4. Effect of Rotor Tip Clearance Size on Compressor Stall Mechanism
Finally, the effect of the rotor TCS on the stage stall margin is investigated, and the relationship between the rotor radial clearance and stall mechanism is explained.
Figure 16 displays the entropy contours at a 98% blade span at P1. With the increase in the rotor TCS, the entropy of this section is increased, especially the value and area of the high-entropy region influenced by the TLF. The interface with the sudden increase in entropy is marked by a purple curve to represent the interface between the mainstream and the TLF. The intersection point between the interface and the rotor blade PS moves to the LE as the rotor TCS increases. Similarly, the interface is gradually flush with the LE plane, and the risk of the tip clearance flow spillage from the blade tip LE is increased. As there is an inevitable relationship between the leakage flow spillage at the LE and the occurrence of stall inception [
37], increasing the rotor TCS may advance the possibility of the compressor stall. In addition, another high-entropy region (red dotted circle) appears close to the rotor blade SS, which is generated by the boundary layer separation due to the shock wave/boundary layer interaction. This high-entropy region also shrinks as the rotor TCS increases.
To illustrate the effect of rotor TLF on the compressor stall, the entropy distributions on a 98% blade span under the near stall condition are given in
Figure 17. Compared with the entropy distribution under the P1 condition, the compressor tip flow at the NSP has changed significantly. The interface between the TLF and the mainstream under a rotor TCS of 0.5τ is completely pushed out of the rotor passage, while that protrudes from the rotor blade LE and flush with the LE plane at other circumferential positions under a rotor TCS of 1.0τ. The TLF of the case with the TCS of 1.0τ moves to an adjacent rotor blade PS, then spills from the blade LE and leakage occurs many times along the pitchwise. For the case with a rotor TCS of 1.5τ, the interface is flat with the blade tip LE. It is located in the blade passage under a rotor TCS of 2.0τ, the TLF moves to the adjacent blade pressure side and then flows directly to the downstream.
Comparing the tip flow fields of rotor and stator under P1 and near stall conditions, it is found that the rotor TCS may change the process and form of compressor stall. The TLF is the main reason of the compressor stall for the case with a rotor TCS of 2.0τ because the increasing intensity and unsteady fluctuation of the TLF. The case with a rotor TCS of 0.5τ has a larger stall margin because of the smaller TLF intensity and the smaller momentum ratio between the TLF and mainstream at the same flow rate, which fails to reach the momentum ratio limited for stall inception. The boundary layer separation on both the rotor and stator blade SS is very serious under this condition, which results in serious blockage of the stage passage. Therefore, the compressor stall for the case with a rotor TCS of 0.5τ is due to the joint action of the boundary layer separation and clearance leakage flow.
Figure 18 shows the suction surface streamlines of the rotor and stator at the NSP. In contrast with the P1 condition, the distribution of the blade SS streamlines is similar except that the shock wave position is closer to the LE, but that on the stator blade SS has a vast variation. The flow structure on a stator blade SS of the compressors with a rotor TCS of 0.5τ and 1.0τ changes from a small range of casing corner separation to a large range of boundary layer separation that occupies almost the whole blade span. When the rotor TCS is 1.5τ, the corner separation range near the stator casing is also increased. As the rotor TCS increases, the stall mass flow gradually increases, the stator blade SS boundary layer separation becomes weaker, and the area of the recirculation zone decreases, thus the flow loss proportion of the stator decreases.
The relative Mach number contours on the rotor blade tip plane at the NSP are shown in
Figure 19. When the rotor TCS is 0.5
τ, there are three low-velocity regions. It is worth noting that the small low-velocity region ahead of region A at the tip clearance size is only because of the problem of the numerical display, which actually belongs to zone A. This can also be obtained by referring to the distribution of region A at other clearance sizes. Besides the low-velocity region A formed by the interaction of the TLV and shock wave near the blade PS and the low-velocity region C formed by the wake mixing at the blade TE, there is another low-velocity region B close to the rotor blade SS. Region B is generated by the separation of the boundary layer due to interaction with the shock wave. As the shock wave in the rotor passage with a TCS of 0.5
τ is closer to the LE, the interaction strength is enhanced. The boundary layer downstream of the shock wave is seriously separated, which weakens the flow capacity of the rotor passage, resulting in the large low-velocity reverse flow region B.
Figure 20 further shows the contours of the relative Mach number at the mid-span stage at the NSP. In accordance with the analysis of
Figure 18, when the rotor TCS increases, the passage shock wave position moves backward, and the boundary layer separation on the blade SS of the rotor and stator is alleviated. On the basis of the analysis in
Figure 18,
Figure 19 and
Figure 20, the mechanism of the stall for the compressor with a rotor TCS of 0.5
τ should be the joint action of the rotor tip stall due to the TLF spillage and the whole blade span stall caused by the large area of boundary layer separation. The contribution of two stall types to the compressor stall needs to be further explained by multi-passage and unsteady calculation.
Based on the above analysis, the rotor TCS is of great significance to the compressor stall occurrence. On the one hand, the rotor TCS affects the strength of the TLF and TLV and changes the momentum balance relationship between the TLF and mainstream, to ensure that the mass flow refers to the compressor flow instability changes. On the other hand, it affects the passage shock wave position, and thus influences the TLV/shock wave interaction, as well as the effective region of the shock wave/boundary layer interaction.


