Article

Reliability of ERA5 Reanalysis Data for Wind Resource Assessment: A Comparison against Tall Towers

by
Giovanni Gualtieri
National Research Council, Institute of Bioecomony (CNR-IBE), Via Caproni 8, 50145 Firenze, Italy
Energies 2021, 14(14), 4169; https://doi.org/10.3390/en14144169
Submission received: 16 June 2021 / Revised: 7 July 2021 / Accepted: 8 July 2021 / Published: 10 July 2021

Abstract

:
The reliability of ERA5 reanalyses for directly predicting wind resources and energy production has been assessed against observations from six tall towers installed over very heterogeneous sites around the world. Scores were acceptable at the FINO3 (Germany) offshore platform for both wind speed (bias within 1%, r = 0.95−0.96) and capacity factor (CF, at worst biased by 6.70%) and at the flat and sea-level site of Cabauw (Netherlands) for both wind speed (bias within 7%, r = 0.93−0.94) and CF (bias within 6.82%). Conversely, due to the ERA5 limited resolution (~31 km), large under-predictions were found at the Boulder (US) and Ghoroghchi (Iran) mountain sites, and large over-predictions were found at the Wallaby Creek (Australia) forested site. Therefore, using ERA5 in place of higher-resolution regional reanalysis products or numerical weather prediction models should be avoided when addressing sites with high variation of topography and, in particular, land use. ERA5 scores at the Humansdorp (South Africa) coastal location were generally acceptable, at least for wind speed (bias of 14%, r = 0.84) if not for CF (biased by 20.84%). However, due to the inherent sea–land discontinuity resulting in large differences in both surface roughness and solar irradiation (and thus stability conditions), a particular caution should be paid when applying ERA5 over coastal locations.

Graphical Abstract

1. Introduction

Due to the stochastic character of wind energy [1], accurate assessment of wind energy potential, preferably relying on sufficiently long wind speed time series, is a fundamental pre-requisite for planning a site wind energy project [2]. Reanalysis data, assimilating a large amount of historical observations into a numerical weather prediction (NWP) model to accurately represent the state of the atmosphere [3], are increasingly being used as a source of long-term time series for wind energy assessment studies. They are an appealing alternative when measured observations are sparse or have limited temporal coverage [4]. Reanalysis products may be regional, i.e., specific to given areas such as Europe (e.g., COSMOS-REA2 [5], HARMONIE [6], MESCAN-SURFEX [7]), or global, i.e., covering the whole world. Regional reanalyses offer a higher spatial resolution, while global reanalyses, albeit with a lower resolution, could theoretically be applied everywhere. Among the latter, Climate Forecast System Reanalysis (CFSR, [8]), Modern-Era Retrospective Analysis for Research and Applications (MERRA, [9]), Japanese 55-year Reanalysis (JRA55 [10]), and ERA [11] are the most commonly used worldwide [12]. Global reanalyses have frequently been used as boundary conditions for producing data at higher spatial and temporal resolutions, e.g., when running the Weather Research and Forecasting (WRF) model [13] to generate wind atlases at the global [14], continental [15], or local [16] scale. Unfortunately, wind atlas data are usually only available to the public at selected levels or in the form of summarised information, such as monthly wind speed averages [12].
In recent years, significant improvements in reanalysis products have fostered their use as a direct input for wind energy studies. ERA5 is the fifth generation and the most updated (2019) global reanalysis product developed by the European Centre for Medium-Range Weather Forecasts (ECMWF, [17]) within the Copernicus Climate Change Service (CDS, [18]). ERA5 marks a significant improvement with respect to its predecessor, ERA-Interim: 1 h vs. 6 h time resolution, ~31 km vs. ~79 km horizontal grid spacing, wind availability at 100 m (and not only at 10 m) [11]. Among all global reanalysis products with the highest temporal resolution (1 h), ERA5 is the one with both the highest spatial resolution (~31 km) and wind speed height (100 m) [12]. By comparison, MERRA2 has a ~50 km spatial resolution and a 50-m highest wind speed level [19]. The availability of higher wind speed levels is an instrumental feature that should be be taken into account when planning the use of reanalysis data for wind energy purposes. To date, the steadily increasing size of modern wind turbines (WTs) has led to hub heights regularly reaching above 60 m onshore [20] and between 70 and 120 m offshore [21]. Furthermore, wind energy studies from various authors have demonstrated that ERA5 generally outperforms the other global reanalysis products. For example, [19] demonstrated that in predicting wind power generation, ERA5 outperforms MERRA2 both at the country-scale (Germany, Denmark, France, and Sweden) and while considering 1051 individual WTs in Sweden, as the reported mean absolute and root mean square errors were on average lower by around 20%. Therefore, ERA5 is now widely accepted as a reliable source of data for directly addressing wind energy studies. For example, ERA5 has been used to assess the wind energy potential on various offshore locations worldwide, such as in northeastern Scotland [22], Lebanon [23], Qatar [2], south and southeastern Brazil [24], the Mediterranean Sea [25], the Caspian Sea [26], and the Indian Sea [27] as well as globally [21]. ERA5 onshore applications include wind energy assessments e.g., over Poland [28], Ethiopia [29], Qatar [2], and the Caribbean coast of Colombia [30]. A gap detected in these studies is the lack of a thorough validation of ERA5 reanalyses against measurements at elevated heights. For example, ERA5 data have been compared against 10-m stations in Colombia [30] or against meteo-oceanographic buoys in Brazil [24]. Extensive validations of ERA5 elevated data have actually been addressed, but only at the local or continental scale. These include, for example, validations by [31] in France vs. 7 masts at heights between 55 and 90 m and vs. one wind-lidar at 100 m, by [19] within the aforementioned study in central and northern Europe, or by [15] vs. 291 European masts from the Vestas database at heights of 40–150 m in the making of the New European Wind Atlas (NEWA).
The present study fits into this framework, aiming at investigating to what extent ERA5 data can be actually trusted in driving a reliable site’s wind resource assessment for a pre-feasibility study of a wind energy project throughout the world. Its main contribution to the field lies in that ERA5 reanalyses have been validated to be used (i) for modern WTs; (ii) for real-world wind energy applications; (iii) at the global scale (i.e., worldwide) and not only the local or continental scales; and (iv) over any possible type of location. As for (i), medium (40–60 m) and elevated (80–100 m) WT hub heights have been targeted so that ERA5 data at 10 and 100 m have been extracted and then compared (either directly or after vertical interpolation) against observations collected from tall towers. As for the latter, an extensive dataset of existing met masts around the world has been analysed in order to detect the towers that are the most suitable for the purposes of this study. In pursuing (ii), only commercially available WTs have been considered, while a thorough computation of wind power losses has been implemented in order to achieve the actual net wind energy production. In an effort to ensure the maximum representativeness of ERA5 (goals ‘iii’ and ‘iv’), six sites around the world featuring very heterogeneous characteristics have been selected. Sites are appreciably different in terms of (a) worldwide location, as all continents (in both hemispheres) are covered; (b) environment, including coastal, inland, mountain, and offshore; (c) prevailing wind regime, i.e., strong, medium, and low; (d) altitude, i.e., sea-level, hilly, and mountainous; (e) topography, including flat, rolling, and complex terrain; and (f) land use (and thus roughness), i.e., barren, smooth, and rough surfaces. Hourly time series of reanalysis data and tower observations have been processed, based on a full 2-year time period at three locations and a full 1-year one at the other three.

2. Materials and Methods

2.1. Wind Resource and Wind Power Output

Annual wind speed frequency distribution is usually approximated through the two-parameter Weibull probability density function f(v) as it has been proven to best fit real wind speed data observed at a site [32]. It is defined as:
f ( v )   =   k c   ( v c ) k 1   exp [ ( v c ) k ] ,
where v is wind speed, c is the scale parameter, and k the shape parameter [32].
If considering a WT whose rotor disc has an area A, hit by a wind speed v, the wind power P(v) available at the site is given by [33]:
P ( v )   =   1 2   ρ   A   v 3 ,
where ρ is the air density, which may be computed from the ideal gas as [3]:
ρ   =   P a t m R d   T ,
with Patm as the atmospheric pressure, T as the air temperature, and Rd = 287.05 J/kg K as the gas constant for dry air.
WT rotor shaft power Pm(v), or the mechanical power that can be extracted from site’s available wind power, is [34]:
P m   ( v )   =   C p   P (   v )   =   1 2   C p   ρ   A   v 3 ,
where Cp is the WT power coefficient.
The electric power Pe(v) generated by a real WT is [34]:
P e   ( v )   =   η m   η e   P m ( v )   = 1 2   C p   η m   η e ρ   A   v 3   = 1 2   η T ρ   A   v 3 ,
where ηm and ηe are efficiencies of mechanical transmission and electric generation, respectively, and ηT = Cpηmηe is the total power efficiency.
Assuming a Weibull wind speed distribution, a site’s average WT power output Pave can be calculated by convoluting the WT power output Pe(v) (Equation (5)) and the probability density function f(v) (Equation (1)) at each wind speed bin [33]:
P a v e = 0 P e ( v ) f ( v ) d v   =   0 η m   η e   P m ( v ) f ( v ) d v =   0 1 2   η T ρ   A   v 3 f ( v ) d v .
The net value of WT annual energy yield (AEY) can be calculated by multiplying Pave by 8760 h [34]:
AEY = Pave* 8760 * (1 − Ftot),
where Ftot is the WT total power losses.
The capacity factor CF is the ratio of AEY to the energy (Er) produced by the WT if operated at its rated power across the same period [33]:
C F   =   A E Y E r   .
If considering a single WT, thus disregarding all wake losses resulting from an array of WTs installed in a wind farm, the total power losses Ftot can be quantified by applying the method described in [20] as a combination of WT-specific losses FWT and site-specific losses Fsite:
Ftot = 1 − [(1 − FWT)(1 − Fsite)].
WT-specific losses are given by:
FWT = 1 − [(1 − fgearbox)(1 − fgenerator)(1 − fconverter)(1 − funavailability)],
where fgearbox, fgenerator, fconverter, and funavailability account for the losses linked to the gearbox, generator, converter, and unavailability and repair, respectively.
Site-specific losses are given by:
Fsite = 1 − [(1 − fgrid)(1 − fice)(1 − fother)],
where fgrid, fice, and fother account for losses due to electric grid connection, icing/soiling, and other generic factors, respectively.

2.2. Variables Vertical Profiles

In Equation (2), P(v) and all of the related parameters are calculated based on v and ρ values generally referred to WT hub height.
When v at hub height is not available, a common practice in wind energy is to vertically extrapolate it by applying the power law (PL), which is the most largely used wind speed extrapolation model because of its simplicity and high level of accuracy [35]. Thus, a known wind speed value at height z1 can be extrapolated to height z2 (i.e., WT hub height) by [32]:
v ( z 2 )   =   v ( z 1 )   ( z 2 z 1 ) α 12 ,
where v(z1) and v(z2) are wind speeds at heights z1 and z2, respectively, and α12 is the wind shear coefficient between the two heights. Conversely, when v1 = v(z1) and v2 = v(z2) are known, α12 can be derived from Equation (12) as:
α 12   =   ln ( v 2 / v 1 ) ln ( z 2 / z 1 ) .
The availability of ρ at WT hub height requires that both Patm and T are known at the same height (Equation (3)). When this is not the case, both Patm and T need to be extrapolated according to their respective profiles. An atmospheric pressure vertical profile Patm(z) may be approximated by [36]:
P a t m ( z )   =   P 0   exp [ ( 0.0342 / T ) z ] ,
where P0 is the atmospheric pressure at ground level. As for the air temperature, an approximation of its vertical profile T(z) can be achieved by considering the standard atmospheric lapse rate L = −0.0065 K/m, i.e., [36]:
T(z) = L*z,

2.3. ERA5 Reanalysis

ERA5 provides hourly estimates of several atmospheric, land, and oceanic climate variables. It covers the entirety of the Earth using 137 vertical levels ranging from the surface up to 0.01 hPa (~80 km). The native ERA5 spatial resolution is 0.28125 deg (~31 km), yet downloaded data are interpolated to a regular lat/lon grid of 0.25 by 0.25 deg [37]. ERA5 covers the period from 1979 to about 2–3 months prior to real time, while a preliminary back extension dataset from 1950 to 1978 is currently available. ERA5 output are generated by the 41r2 model cycle of the integrated forecast system (IFS), which uses a ten-member ensemble of 4D variational data assimilation according to a 12 h temporal window. Whenever and wherever available, historical observations that include satellite as well as in-situ data such as Synop, Metar, radiosounding, wind profiler, radar, aircraft, buoy, and ship data are assimilated [17].
ERA5 replaces ERA-Interim reanalysis, which was progressively becoming outdated and was terminated at the end of August 2019. ERA5 implements a number of improvements with respect to the former product, including an increase in horizontal resolution (was 79 km) and vertical resolution (were 60 levels up to 0.1 hPa) as well as time step (was 6 h). Additionally, the 41r2 model cycle (dated 2016) marks an upgrade with respect to the previous 31r2 (dated 2006) that had been implemented in ERA-Interim. Furthermore, thanks to the underlying ten-member ensemble 4D-Var data assimilation system, ERA5 delivers an uncertainty estimate that was not available in ERA-Interim [11]. Along with the increased time resolution to 1 h, a pivotal feature in using ERA5 reanalysis for wind energy purposes is the availability of an enhanced number of output parameters, particularly wind speed at 100 m. In ERA5, spatial interpolation and the regridding of meteorological fields are performed through a library of routines called Meteorological Interpolation and Regridding (MIR), which is based on a triangular linear interpolation method [38].

2.4. The Tall Tower Dataset
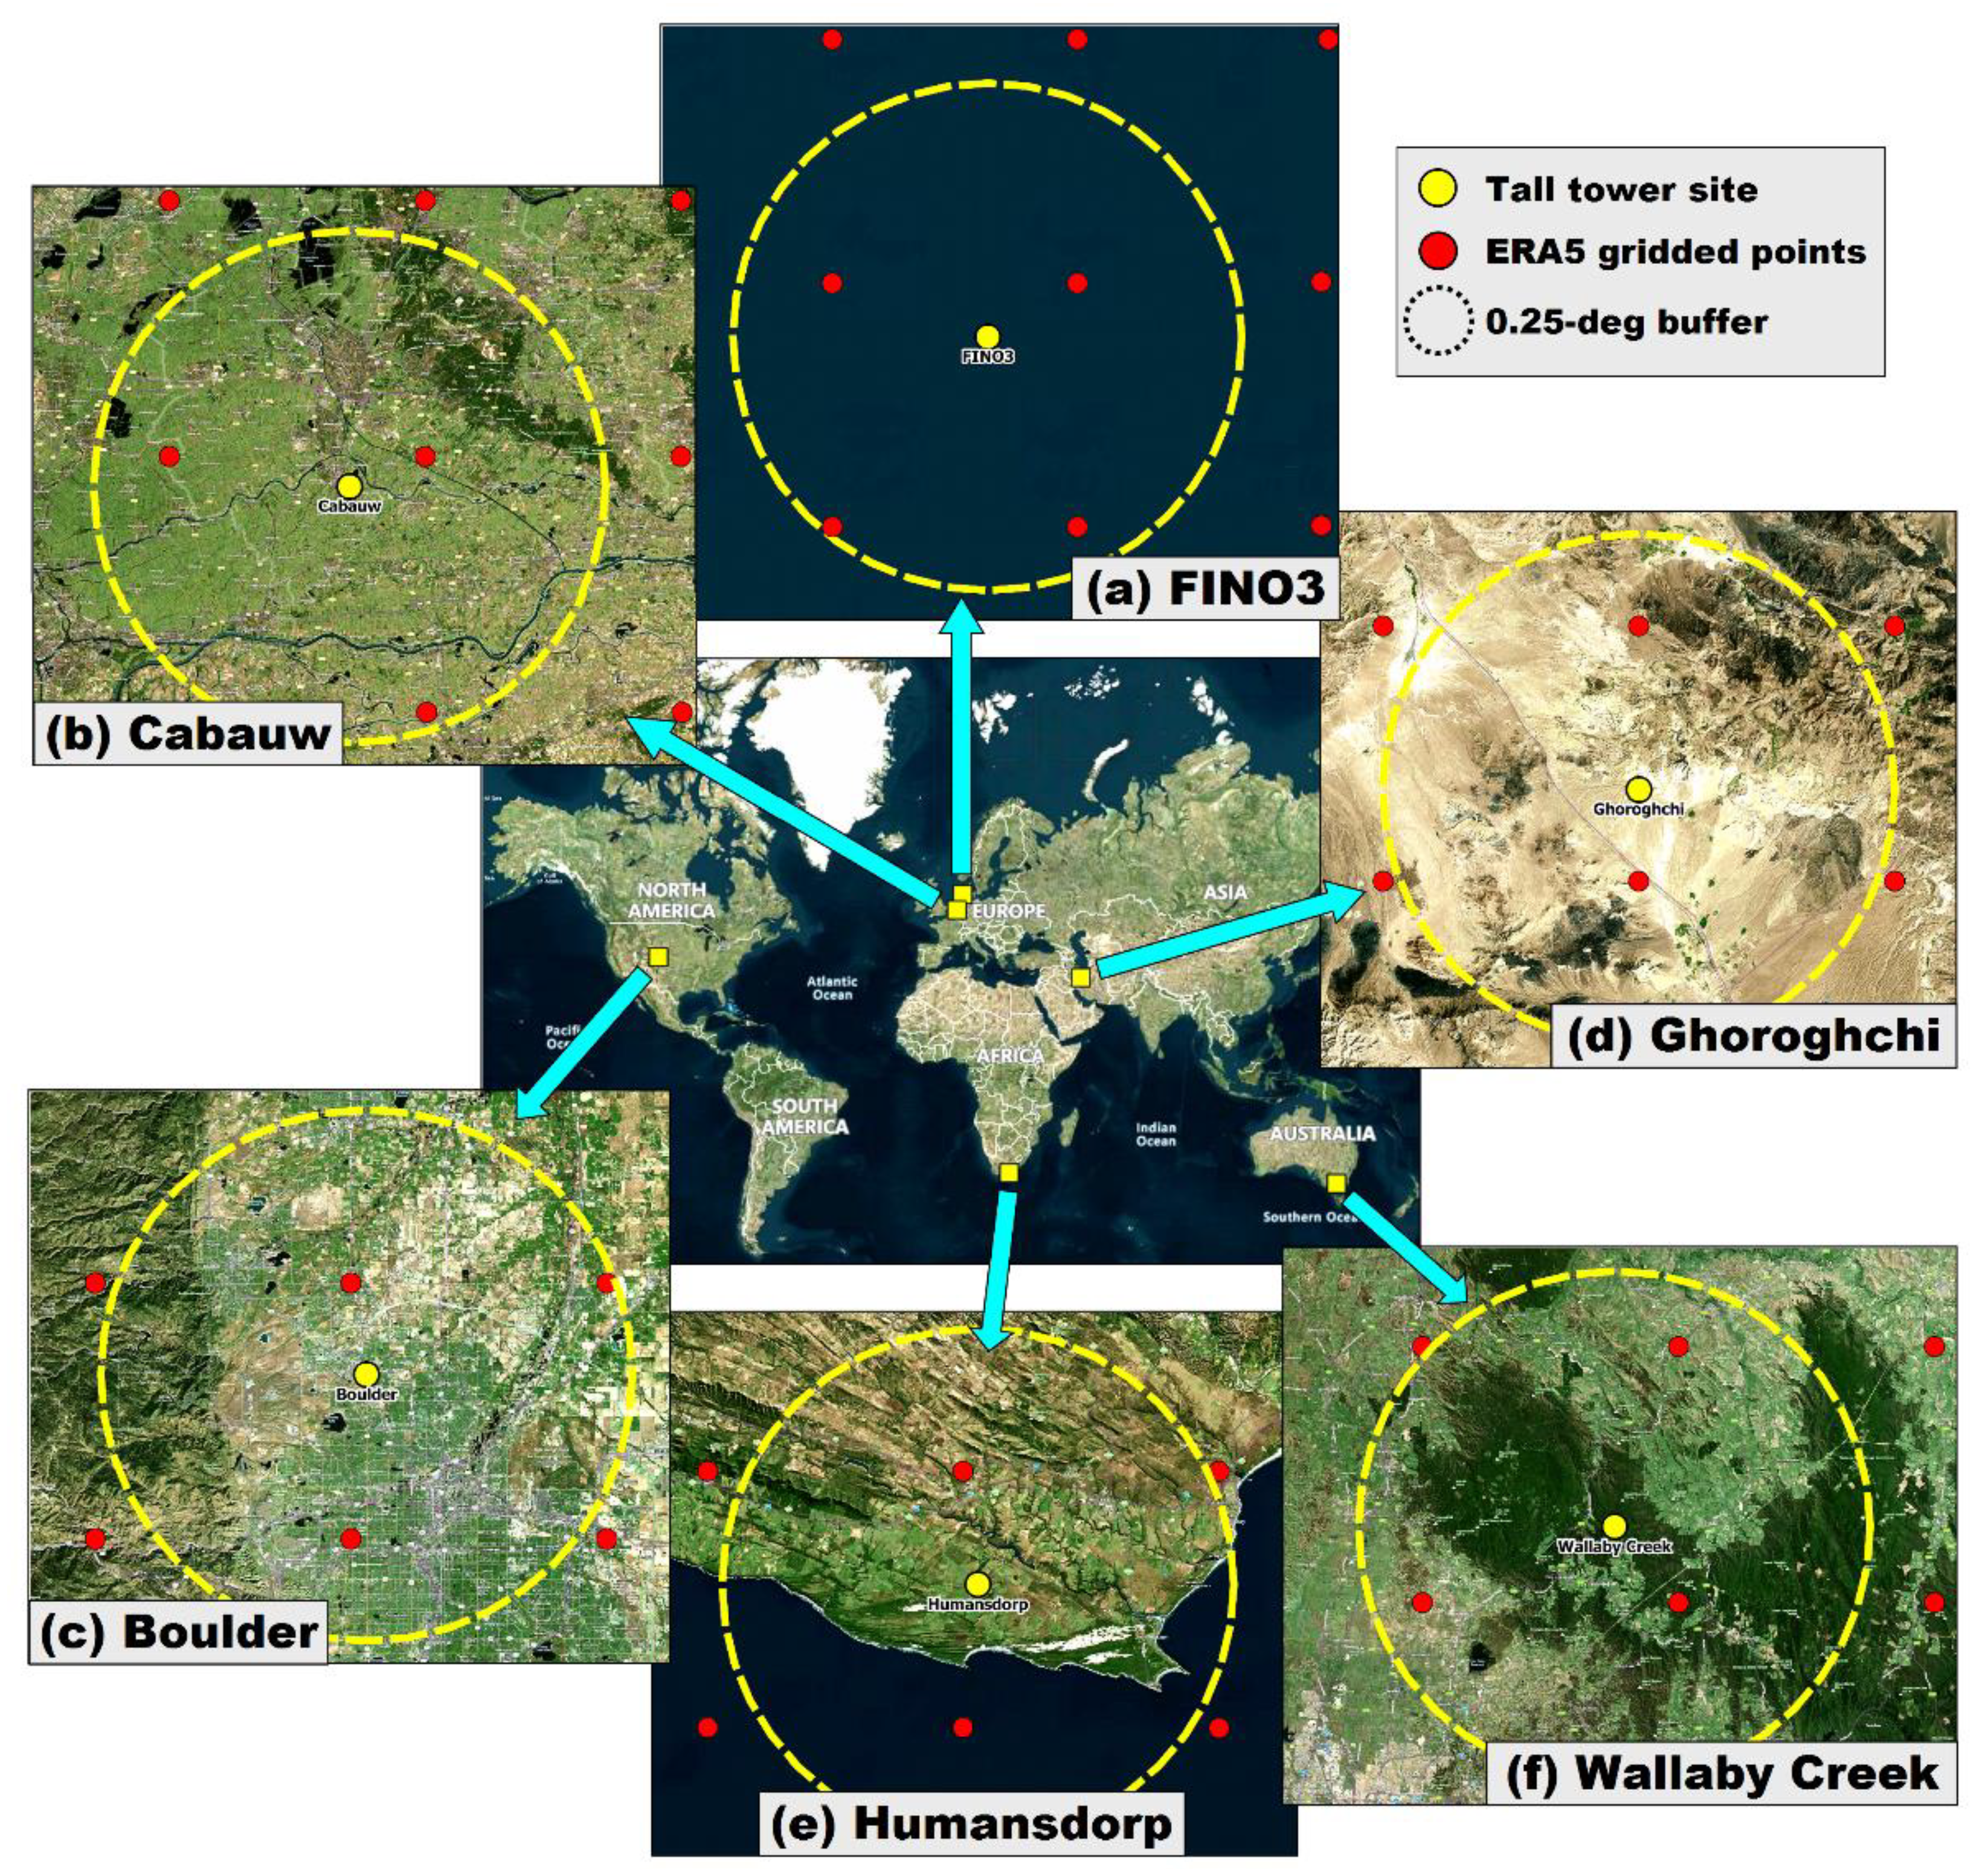
An extensive dataset collected from existing tall towers around the world was developed that includes data from 222 met masts [39]. All continents are covered, including Asia (51%), North America (23%), Europe (16%), Africa (8%), Oceania (1%), and Antarctica (1%). Observations—covering the 1984–2017 period—include variables such as wind speed and direction, temperature, pressure, and relative humidity, although the latter three are not always available. Measurements collected at heights above 10 m have been retrieved from various towers worldwide and have been organized into a unique dataset featuring a common format, access, documentation, and quality control. Masts deployed in historical observatories used to be shorter, generally showing one single measuring level with heights ranging between 18 and 50 m. Most of the masts in northern Europe have been installed over the last 15–20 years and are generally taller than 80 m, usually reaching 150 to 200 m. However, the tallest structures are located in the USA, where heights of 300 m (BAO), 379 m (West Branch), 396 m (WLEF), and even 488 m (Walnut Grove) are reached. Almost 80% of tall towers are located inland, while the remaining 20% are deployed offshore. The time resolution of the mast data varies from 10 min to 1 h, while the length spans from a few months to over 30 years [39]. The Tall Tower Dataset is published in the EUDAT repository [40]. Data from about 80% of the towers are freely available for download therein, while those from the other towers may be downloaded from specific tower websites (mostly after registration).

2.5. Study Sites

Six sites located all over the world have been selected, each supplied with an instrumented tall tower (Figure 1). The general characteristics of the sites are summarised in Table 1.
FINO3 (Figure 1a) is an offshore research platform established by the German federal government in 2009 [41]. It is located in the North Sea (Germany), 80 km NW of the island of Sylt [42]. The platform, built at a water depth of 22 m, is equipped with a 120-m met mast [4], whose data, maintained by the Bundesamt fuer Seeschifffahrt und Hydrographie (BSH), have been stored into a database of 10 min averages since September 2009. As detailed in Table 1 of [41], several sensors are installed on the mast, including both cup and sonic anemometers ranging from 30 to 106 m a.s.l.
At Cabauw (Netherlands, Figure 1b), a 213 m met tower has been operated by the Royal Netherlands Meteorological Institute (KNMI) since 1972. The tower is located in a polder 0.7 m below average sea level, about 2 km away from the village of Cabauw and 20 km from the city of Utrecht. The North Sea coastline lies about 45 km NW of the mast [43]. The site is completely flat within a radius of 20 km, with open pasture largely prevailing for at least 400 m in all directions [44]. Cabauw’s tower is equipped with very comprehensive instrumentation, with wind sensors ranging from 10 m up to 200 m [39]. Mast data are available as 10 min averages and have been documented since February 1986.
The site of Boulder (CO, USA, Figure 1c) is home to the National Wind Technology Center (NWTC), which is managed by the National Renewable Energy Laboratory (NREL) for the US Department of Energy. The NWTC is located at the foot of the Rocky Mountains, about 8 km S of Boulder and 36 km NW of Denver. Deployed at the western edge of the NWTC, the 82 m M2 met mast has been in operation since 1996 [45]. It is located over a mountainous area at an elevation of 1855 m, about 4 km E of Colorado’s Front Range mountains. In all other directions, the mast is free from major obstacles, with the landscape overall featuring rolling hills with no trees and bodies of water [46]. Additionally, the M2 mast is equipped with a large number of sensors, with wind anemometers ranging from 10 to 80 m. M2 data have been available as 10 min averages since September 1996.
At Ghoroghchi (Iran, Figure 1d), in the framework of a national monitoring campaign aimed at promoting the use of renewable energies at a national level, the Renewable Energy and Energy Efficiency Organization (SATBA) erected a 100 m met mast [39]. It is located about 120 km NW of the city of Isfahan and 600 km E of Baghdad. The mast is situated at an average elevation of 2140 m, over a completely flat area that is dominated by barren desert land. Data are available as 10-min averages covering the period from May 2013 to August 2014 and include all main variables, notably, wind readings from 40 to 100 m.
In the framework of the Wind Atlas for South Africa (WASA) project, the South African National Energy Development Institute (SANEDI) erected and instrumented a WM08 60-m mast (Figure 1e). It lies over a completely flat area at an elevation of 110 m, 30 km SW of the small town of Humansdorp and 550 km E of Cape Town. The mast, which is about 6 km away from the southern coast of South Africa, is surrounded by grassland [47]. Data are available as 10-min averages covering the period from August 2010 to January 2017, and include all main variables, notably, wind readings from 10 to 62 m [39].
The Wallaby Creek flux mast was located in Kinglake National Park, South Eastern Australia, about 45 km NE of Melbourne (Figure 1f). The flux tower, managed by Monash University as part of the Australia Flux Tower network (OzFlux), was established in August 2005 and was destroyed in February 2009 by bushfires. The site, lying at an elevation of 720 m, is located on the southern edge of the Hume Plateau, within a forest of Mountain Ash, whose trees can reach heights of more than 90 m. The forest is confined to cool mountain regions with elevations ranging from 460 to 1100 m [48]. Data from the Wallaby Creek tower are available as 30-min averages covering the period between January 2005 and December 2008 and include wind readings ranging from 10 to 110 m [39].

2.6. Selected ERA5 and Tall Tower Meteorological Data

In order to be compared against observations retrieved from met masts, ERA5 reanalysis data have been downloaded by entering the exact coordinates of each tower location (Table 1), thus achieving six location-dependent ERA5 time series. Since no location corresponds exactly to any 0.25-deg spaced ERA5 grid node, the extracted time series were forced to be spatially interpolated from the grid nodes to each tower location. Table 2 summarises the characteristics of the ERA5 time series by height analysed at each site as well as those of the met masts they have been compared against.
In order to be adjusted to ERA5 time resolution, original records from all met masts have been averaged to hourly data. Aiming at extracting at least one full year of consecutive observations while maximizing the valid sample size, a 2-year sample was selected for FINO3, Cabauw, and Boulder, while a 1-year sample for the other masts.
Wind speed heights falling into the two targeted WT hub height categories with respect to ERA5 levels have been chosen for the comparison. Thus, both the intermediate and upper levels were considered for FINO3, Cabauw, Boulder, and Ghoroghchi towers (ranging 40–60 and 80–100 m, respectively), while only one level was considered for Humansdorp (60 m) and Wallaby Creek (95 m). These wind speed heights were therefore set as target heights for air density as well. Unfortunately, for wind energy purposes, ERA5 data are affected by two main drawbacks: (i) unavailability of a direct estimate of air density; (ii) availability of wind speed records at 10 and 100 m only. To cope with (i), records of atmospheric pressure and air temperature are needed to approximate air density, while to address (ii), vertical extrapolation of wind speed is required. Therefore, agreeing with similar studies in the literature (e.g., [2,22]), in the present work, the ERA5 hourly values of the following variables have been retrieved: surface pressure (P), temperature at 2 m (T), and wind speed components u and v at 10 m (u10, v10) and 100 m (u100, v100).
When required, the PL was applied for adjusting 10-m and 100-m ERA5 wind speed estimates to the target height. A wind shear coefficient between 10-m and 100-m wind speeds (α10–100) was calculated via Equation (13) for each 1-h record and then applied in Equation (12) to calculate 1-h wind speed at the desired height z. As for air density, estimates of ERA5 surface pressure and 2-m temperature have been extrapolated using Equations (14) and (15), respectively, in order to approximate the ρ-value at WT hub height via Equation (3).
Unfortunately, air density observations were unavailable from tall towers as well. In addition, as detailed in Table 2, for the majority of cases, temperature and pressure observations were unavailable at the target wind speed heights. Therefore, tower data, specifically air density data, were also approximated. This was accomplished according to a two-fold approach: (i) air density observations were approximated using temperature and pressure records using Equation (3), and (ii) when not available at the target heights, temperature and pressure records were vertically adjusted by applying the same extrapolation profiles used for ERA5 data. For the specific case of the Ghoroghchi mast, where neither surface pressure observations were available, the latter were approximated by applying Equation (14) after extrapolating a reference pressure P0 = 1013.25 hPa (at sea level) to the site’s altitude (z = 2140 m), while time-varying T was vertically extrapolated using Equation (15).

2.7. Selected ERA5 Geophysical Data

To achieve a thorough characterization of the analysed sites, further parameters have been downloaded from the ERA5 reanalysis. Referring to the 0.25-deg square tiles of the ERA5 grid points nearest to each site’s location, the following time-invariant geophysical data have been retrieved: geopotential (z, m2/s2), standard deviation of orography (sdor, m), forecast surface roughness (fsr, m), low vegetation cover (cvl, 0–1) and type (tvl), high vegetation cover (cvh, 0–1) and type (tvh). Low and high vegetation types are referred to the ECMWF classification implemented in ERA5 [49]. Each node’s geopotential height (corresponding to orography, in m) has been achieved by dividing the geopotential by g = 9.80665 m/s2.
As shown in Figure 1, a buffer of 0.25 deg (corresponding to ERA5 horizontal resolution) has been set from each site’s location in an effort to encompass the nearest ERA5 grid points that have the most affect. Their detailed geophysical characteristics, along with the relative distance from each tower’s location, are given in Table S1 of the Supplementary material. In addition, for each site, the mean values of altitude and roughness length of grid points closest to tower locations are shown in the maps plotted in Figures S1 and S2, respectively. In order to derive a sort of ensemble geophysical characterization of each site, the features of these ERA5 grid points (Table S1) have been processed so as to calculate their statistics integrated to each site’s location. For each location, the arithmetic mean of the relative distance of all grid points has been calculated, while for altitude, surface roughness length, and low/high vegetation cover, the weighted mean has been calculated. A full range for all parameters has been also reported, which refers to the absolute minima and maxima for the relative distance and to the weighted minima and weighted maxima for all of the other variables. Weighted means and the corresponding weighted minima and maxima have been calculated using the inverse of distance. The results of this procedure are summarised in Table 3.

3. Results

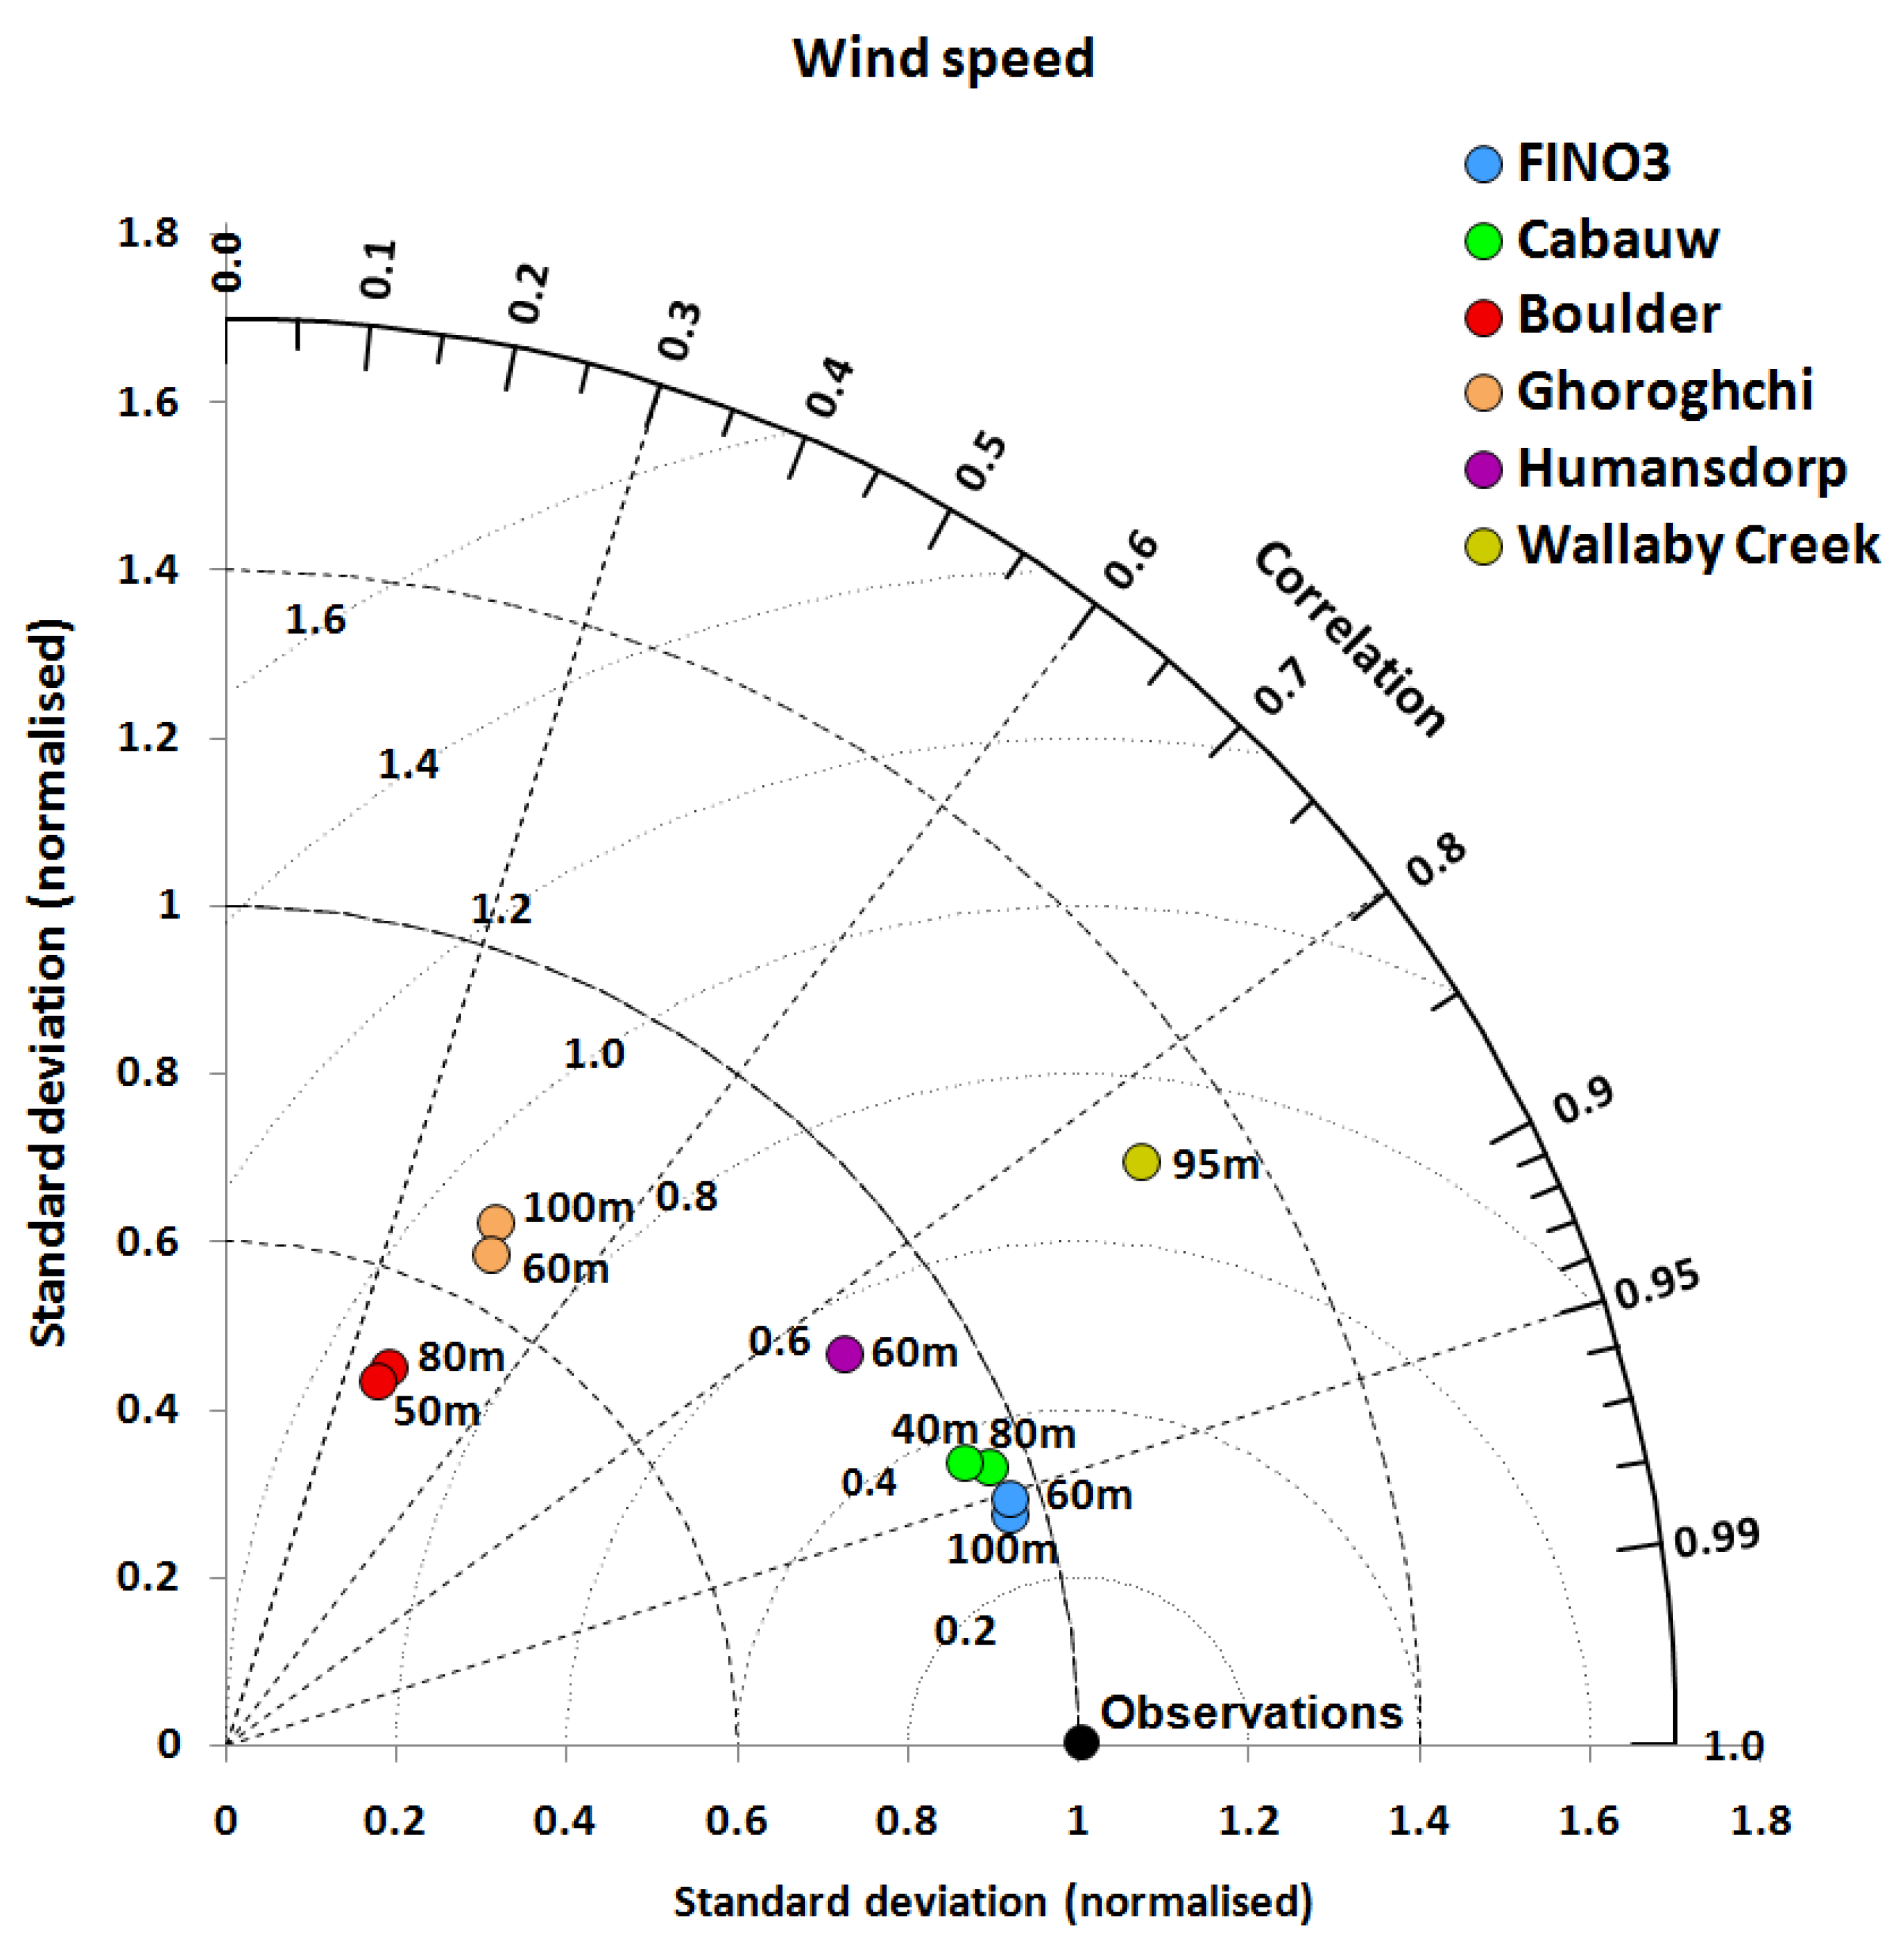
3.1. Wind Speed and Air Density

The capability of ERA5 reanalysis in capturing wind speed and air density patterns observed by each met mast has been assessed by calculating statistical indicators as mean and normalised bias (MB and NB), root and normalised mean square error (RMSE and NRMSE), and correlation coefficient (r). The results of this analysis are summarised in Table 4 for wind speed and in Table S2 for air density.
As shown in Table 4, annual observed mean wind speed values indicate a remarkable potential at FINO3 (µo = 9.50–9.98 m/s), a relevant potential at Humansdorp (7.07 m/s) and Cabauw (5.79–6.97 m/s), and a lower potential at Ghoroghchi (5.58–5.86 m/s), Boulder (4.46–4.70 m/s), and Wallaby Creek (4.18 m/s). If referring to the NREL wind power classification at 50 m [50], FINO3 is a “superb” (class 7) site, Humansdorp is a “fair” (class 3) site, Cabauw is a “marginal” (class 2) site, while Boulder, Ghoroghchi, and Wallaby Creek are “poor” (class 1) sites. Overall, the capability of ERA5 in capturing both wind speed magnitude and temporal variation is remarkable at FINO3, where at worst, NB = 1%, NRMSE = 14%, and r = 0.95 are achieved. Scores are once again satisfying at Cabauw (NB = 4–7%, NRMSE = 18–19%, r = 0.93–0.94), while higher biases may be observed at Humansdorp (NB = 14%) and Wallaby Creek (NB = −18%) as well as lower r (0.84). Conversely, at the mountain sites of Boulder and Ghoroghchi, wind speed magnitude and time variation are significantly biased (NB = 47–53%, NRMSE = 75–100%, r = 0.38–0.47).
Annual mean air density values observed at FINO3 and Cabauw are higher than the 1.225 kg/m3 standard value, while they are remarkably lower at the two mountain sites (Table S2). Air density observations are well captured by ERA5, as at worst, NB = ±5% and NRMSE = 5% are achieved, with the exception of Cabauw, where poor scores are achieved, particularly in terms of NRMSE (up to 0.26) and r (0.21–0.28). ERA5 accuracy in predicting air density time variation is higher at FINO3 (r = 0.85–0.98), Wallaby Creek (0.91), and Humansdorp (0.90), while it is lower at the two mountain sites of Boulder (0.68) and Ghoroghchi (0.55).
A Taylor diagram [51] has also been used to further investigate ERA5 performance in predicting wind speed (Figure 2) and air density (Figure S3). ERA5 capability is evaluated in terms of the correlation (r), standard deviation (σp), and root mean square difference (RMSD) of predictions vs. observations. The values of σp and RMSD are normalised to the standard deviation of observations (σo), which leaves r unchanged. The normalised RMSD is proportional to the radial distance from the observation point.
Figure 2 straightforwardly shows the ranking of ERA5 accuracy in predicting observed wind speed, which is higher at FINO3, Cabauw, and Humansdorp and lower at Ghoroghchi and Boulder. In particular, the normalised RMSD ranges are 0.29–0.30 (corresponding to σpo = 0.96) at FINO3, 0.35–0.36 (σpo = 0.93–0.96) at Cabauw, 0.92 (σpo = 0.47–0.49) at Boulder, and 0.90–0.92 (σpo = 0.66–0.70) at Ghoroghchi. ERA5 wind speed predictions exhibit less variability than observations (σpo < 1) at all sites with the exception of Wallaby Creek, where σpo = 1.28.
In terms of air density (Figure S3), the finest ERA5 simulations are observed at FINO3 at 100 m (normalised RMSD equal to 0.18, σpo = 0.96) and Humansdorp (0.43, σpo = 0.93). As it exhibited the highest radial distance from the observations (normalised RMSD ranging 1.08–1.09), it is confirmed that at Cabauw, the ERA5 predictions belong to a population clearly different from elsewhere. Remarkably, the variability of the ERA5 predictions is quite close to the observations (σpo = 0.83–1.01) at all sites, with the exception of those from Wallaby Creek (σpo = 1.25) and particularly those from Cabauw (σpo = 0.09–0.29).

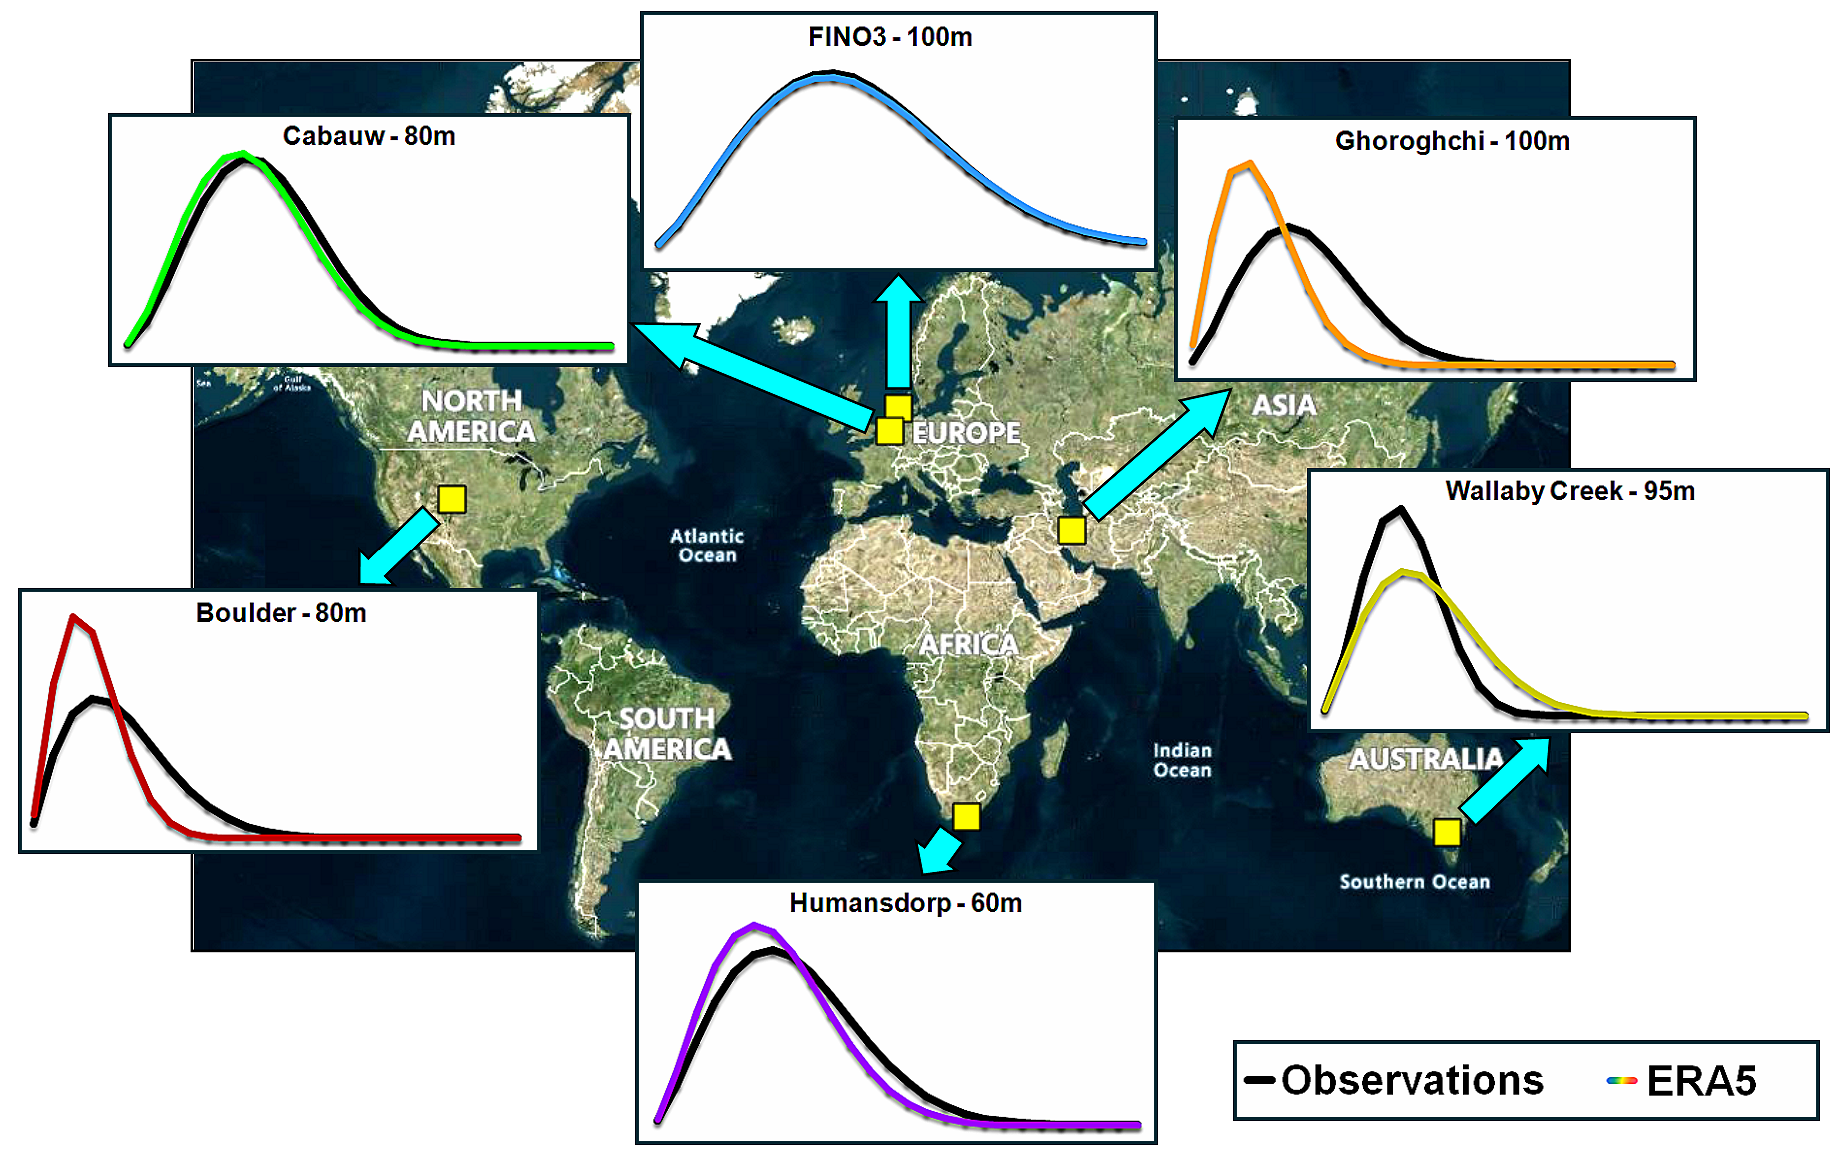
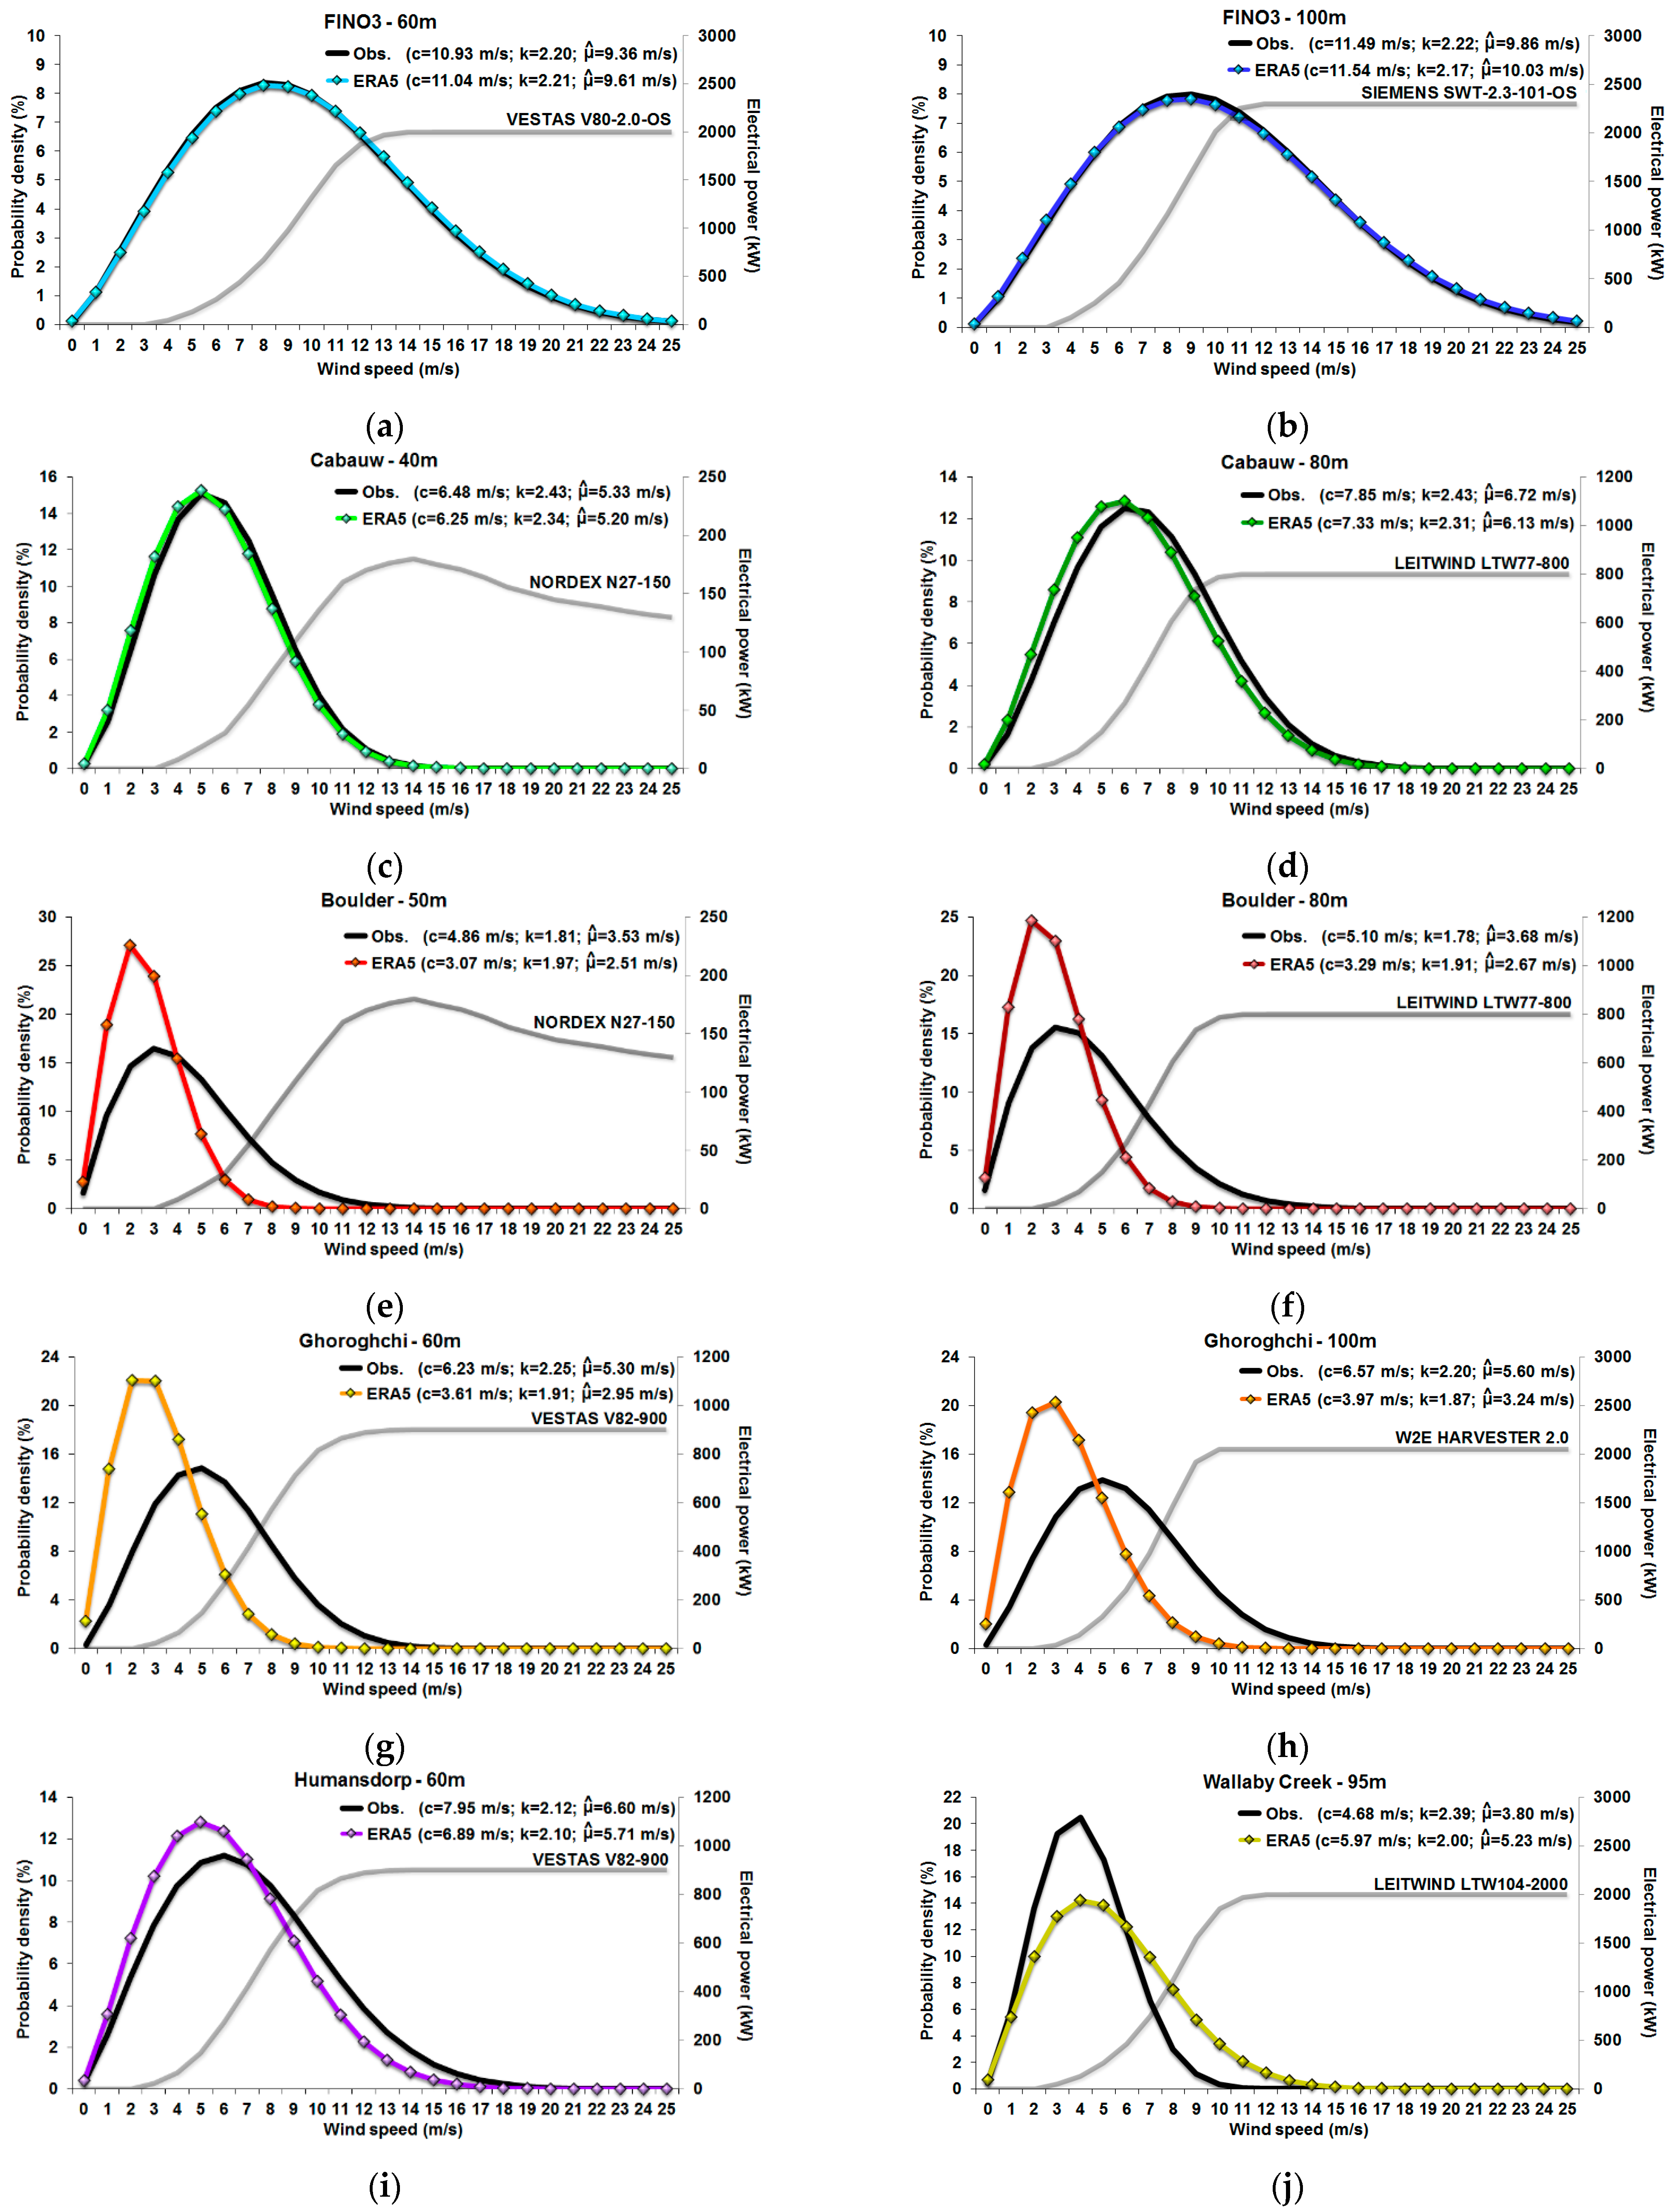
3.2. Wind Speed Weibull Distribution

The skills of ERA5 in predicting wind resource at the tower locations have been also assessed by means of the annual Weibull probability density functions between the observed and estimated wind speed records (Figure 3).
ERA5 scores are particularly fine at FINO3, where observed wind speed Weibull distribution is almost perfectly fitted at both 60 m (Figure 3a) and 100 m (Figure 3b). Herein, observed wind speed median values ( μ ^ ) are biased at worst by 2.7% (over-estimation), with c at worst biased by 1% and k by 2.2%. Additionally, 40-m wind speed distribution at Cabauw is acceptably reproduced (Figure 3c), as both the scale and shape factors are marginally biased (3.5–3.7%), resulting in μ ^ only being biased by 2.4% (under-prediction). Herein, 80-m Weibull distribution (Figure 3d) is slightly less accurately reproduced, both in shape (k under-predicted by 4.9%) and scale (c under-predicted by 6.6%), returning a value of μ ^ that is under-predicted by 8.8%. At Humansdorp, the observed 60-m μ ^ is biased by 13.5% (Figure 3i), which is merely the result of a scale mismatch (c under-predicted by 13.3%), as the shape between the two distributions is basically the same (k under-predicted by 0.9%). By contrast, at the two mountain sites, ERA5 estimations largely fail to capture the annual Weibull probability density functions of observed wind speeds. At Boulder, the observed μ ^ is under-predicted by 27.4–28.9% (Figure 3e,f), which is essentially because of a scale error (35.5–36.8%), while at Ghoroghchi the error in under-estimating the observed μ ^ reaches 42.1–44.3% (Figure 3g,h), resulting from an inaccuracy in estimating both k (under-predicted by 15%) and c (under-predicted by 39.5–42%). Unlike elsewhere, at Wallaby Creek, the observed Weibull distribution is largely over-predicted (Figure 3j), with the observed μ ^ biased by 37.6%, mostly as a result of a bias in estimating c (27.6%).

3.3. Wind Energy Production

To assess ERA5 skills in predicting wind energy production, indicators such as AEY (Equation (7)) and CF (Equation (8)) have been chosen. A set of commercially available WTs was identified as having a hub height matching (or strictly approximating) those of each site’s met mast. Using wind speed records observed at each site and each height, a preliminary WT application was then performed in order to detect the single WT model maximizing observed CF regardless of its rated power. Eventually, WTs deemed as the most suitable for each site and each height were used to perform a computation of both the observed and predicted wind energy production indicators. Wind energy calculations have been performed by applying the tool described in [52], which includes a database of 420 (397 onshore and 23 offshore) WT models.
Net energy produced by each WT (Equation (7)) has been considered in all computations, thus requiring the quantification of the WT total losses (Ftot). In calculating AEY and CF, total losses for any WT—excluding wake losses—were computed using Equation (9) as a function of the WT-specific losses (FWT) and site-specific losses (Fsite). For the WT-specific losses, fx quantities depending on WT system, derived from [20] and given in Table S3, were used in Equation (10); for site-specific losses, the quantities given in Table S4 for fgrid, fice, and fother were set to be used in Equation (11). To deliver a further information layer, the losses due to the departure between the measured or estimated air density values and the standard air density value (1.225 kg/m3) are provided for each site and each height in Table S5. Note that at FINO3 and Cabauw (40 m), air density gains and not losses were experienced (see Table S2).
In Table 5, the performances of each comparison by site and height are presented along with characteristics of the selected WTs. ERA5 scores are expressed in terms of the normalised error (NE) between the measured and estimated values. Note that the WT corresponding power curves are plotted in Figure 3.
As for the annual measured wind energy production, FINO3 was confirmed to be a tremendous site, as CF values of 46.85% (at 60 m) and 56.88% (at 101 m) are achieved. Remarkable scores are also experienced at 80 m at Cabauw (CF = 43.50%) and at 59 m at Humansdorp (CF = 40.54%). Fair wind energy exploitations have been found at 40 m at Cabauw (CF = 25.66%) and at Ghoroghchi (CF = 20.30–25.13%), while Boulder (CF = 11.22–16.92%) and particularly Wallaby Creek (CF = 9.87%) were confirmed to be unfeasible sites.
Analysing ERA5 scores in predicting AEY and CF values measured at the six tall towers, the highest accuracy is achieved at 60 m at FINO3, where a mere 1.22% over-estimation is achieved, while a 6.70% under-estimation is found at 101 m. ERA5 scores are also fine at Cabauw, where at worst, they are under-estimated by 6.82%, while a significantly higher bias (20.84%) was found at Humansdorp. By contrast, ERA5 estimations prove to largely fail to approximate the energy production observed at all other sites, as NE values ranging 69.08–73.30% (Ghoroghchi), 70.57–80.12% (Boulder), and −119.76 (Wallaby Creek) were achieved. Notably, barring FINO3 at 60 m—where observations are actually almost perfectly fitted—ERA5 reanalyses prove to under-predict the measured energy production at all sites except Wallaby Creek, where a substantial over-prediction (higher than a factor of 1) was found.

4. Discussion

4.1. Wind Speed

The availability of several geophysical parameters to thoroughly characterize the topography and land use of each grid point is an important feature of ERA5 reanalysis. Following the analysis addressed in Section 2.7, this enabled a reliable characterization of each tower site (Table 3). Availability of these data is also useful as they sheds light on the geophysical information internally used by ERA5 to perform its estimations so that any possible flaw/inconsistency or over-simplification may be clearly put to the fore.
Agreeing with several findings in the literature (e.g., [15,31]), ERA5 tends to under-estimate wind speed observed at elevated tower heights, however, at Wallaby Creek, the opposite occurred (Table 4, Figure 2).
At the FINO3 offshore mast (Figure 1a), ERA5 predictions clearly benefit from the fully homogeneous surface characteristics of the area (Figures S1a and S2a), as all grid points closest to tower’s location lie over the sea (Table 3). Herein, ERA5 scores proved to be even finer than those exhibited at the same site by the WRF model forced by ERA-Interim reanalyses and run according to three nested domains with grid sizes of 18, 6, and 2 km, respectively. As reported by [4], once compared against a wind-lidar installed on the FINO3 platform between 29 August and 30 November 2013 at 126 m, these WRF wind speed estimations showed a mean bias of ~0.3 m/s (under-estimation), RMSE of ~2.2 m/s, and r ranging 0.87–0.90. By comparison, at the 60-m and 100-m heights, ERA5 predicted wind speed at worst biased by 0.08 m/s, with RMSE of 1.35 m/s, and r ranging 0.95–0.96 (Table 4). Notably, current ERA5 r values at FINO3 were comparable to those exhibited at similar offshore platforms by regional reanalysis products with a higher grid resolution. As reported by [53], in the period of 2006–2010 at the FINO1 (100 m) and FINO2 (102 m) met masts, r values of 0.94–0.95 were achieved in predicting 1-h wind speed by regional reanalyses (COSMO-REA6, COSMO-REA12, and HARMONIE) run at 6-, 12-, and 11-km resolution, respectively.
Similarly to FINO3, no significant altitude and land use variation affected the completely flat and sea-level site of Cabauw (Figure 1b), which is mostly dominated by crops and mixed farming and exhibits an average roughness length of z0 ≈ 0.30 m (Table 3). These very homogeneous surface features (Figures S1b and S2b) likely account for the good scores in predicting the 40-m and 80-m wind speed that ERA5 returns herein as well (Table 4, Figure 2). The r values (0.93–0.94) are higher than those reported by [53] within the aforementioned study where higher-resolution regional reanalysis products were assessed: application of COSMO-REA6, COSMO-REA12, and HARMONIE, for example, returned r values of ~0.90 at 140 m at the same tower, while ranging from 0.84–0.87 at 98 m at the Lindenberg tower (Germany). Present r values at Cabauw are also higher than those achieved by [31], who analysed the performances of reanalysis products (ERA5, MERRA2, and COSMO-REA6) and of an NWP model (AROME) using wind observations in France from seven 55–90 m masts and from one 100-m wind-lidar. Remarkably, over comparably flat terrains, they achieved lower r values (0.87–0.91) even when using higher-resolution models, i.e., COSMO-REA6 (6 km) and AROME (3 km). In terms of mean biases, they reported values by COSMO-REA6 (0.1–0.4 m/s) that are essentially in line with those achieved at Cabauw (0.24–0.48 m/s), while finer scores by AROME were returned. After a comparison vs. 110 European masts from the Vestas database at heights of 40–150 m, over simple terrain sites, [15] reported for ERA5 performances in predicting wind speed a mean bias of 0.72 m/s (under-estimation), which is higher than the values achieved at Cabauw. In terms of RMSE, results currently achieved at Cabauw (1.06–1.20 m/s) are better than those (RMSE = 1.9 m/s) reported overall by [53] using COSMO-REA12 (12 km).
The coastal site of Humansdorp proved to be rather challenging to analyse by ERA5, mostly because of the sea–land discontinuity dominating the area (Figure 1e). Over coastal regions, complex flow regimes often develop due to coastline transition, across which large differences in surface roughness and temperature (and thus stability) generally occur [54]. As pointed out by [25], ERA5 accuracy in predicting wind speed should be assessed in combination with accuracy in predicting solar irradiation, as the two variables are strictly tied. To this aim, comparing ERA5 surface irradiance estimations vs. satellite data all over the world [55] concluded that the current ERA5 resolution is inadequate for places with highly varying solar irradiance (e.g., coasts and mountains). Within their study over East Asia, in particular, [56] found that ERA5 tends to under-estimate surface diffuse solar radiation, which is an issue for wind energy purposes, as this leads to an under-estimation of the more convective (and thus more energetic) stability conditions. In addition to this inherent limitation, another specific drawback affects ERA5 at Humansdorp. If analysing the grid points lying over the sea, ERA5 assigns to the corresponding tiles a mean altitude higher than 0 m (Figure S1e). This also affects the grid point below the WM08 tower location (#2, Table S1), whose tile is assumed to be 60% covered by interrupted forest and 20% covered by crops and mixed farming, yet no sea coverage is considered. Its average value of altitude is 39 ± 23 m (Figure S1e) and z0 is 0.20 m (Figure S2e). Thus, the site is completely misinterpreted by ERA5, as within the 0.25-deg buffer, it is assumed to be a quite flat and smooth (z0 = 0.16 m) site with small changes in orography and roughness and with no sea–land discontinuity (Figure S1e, Table 3). An investigation of ERA5 performances by wind direction seems to confirm that main source of ERA5 inaccuracy herein may well be ascribed to its inability of resolving local sea–land breezes. If considering winds blowing from the sea (approx. 90–270° with respect to WM08 tower location, Figure S2e), ERA5 underestimates the measured wind speeds by 31.6% (with frequencies of occurrence quite similar, i.e., 43.1% vs. 40.5%), while a mere 1.7% mismatch between measured and estimated wind speed averages is found across all other directions. In any case, despite all of these problems, ERA5 scores at Humansdorp are generally acceptable. Wind speed mean bias (0.95 m/s) lies at the lower bottom part of the range (0.94–1.35 m/s) achieved by [31] using MERRA2 over flat sites in France, and it is lower than the average value (1.39 m/s) returned for ERA5 by [15] after comparison vs. 96 masts located over sites with medium terrain complexity. Scores are also finer than those reported by [57], who intercompared various global reanalysis products in predicting wind speed at heights close to 100 m using a set of 77 instrumented tall towers worldwide. Although referring to 24-h records, they achieved r values of about 0.81–0.82 (ERA5 and MERRA2), 0.79 (ERA-Interim), and 0.76 (JRA55), while for 1-h records, r = 0.84 was achieved for ERA5 at Humansdorp. They also returned values of normalised RMSD equal to about 0.62 (ERA5 and MERRA2), 0.74 (JRA55), and 0.80 (ERA-Interim), all outperformed by the value (0.54) achieved by ERA5 at the WM08 mast (Figure 2). The RMSE returned by ERA5 at Humansdorp (2.17 m/s) is slightly higher than that (1.9 m/s) reported by [53] using COSMO-REA12.
At Wallaby Creek (Figure 1f, Table 3), the tower lies over a hilly area (324 m a.s.l.) with little orography changes (Figure S1f), yet it is affected by a very heterogeneous land cover: crops and mixed farming are interspersed with interrupted forests and evergreen broadleaf trees, so z0 (overall averaging 1.27 m) spans across a wide range (0.50–1.60 m). The highly changing land use (and thus roughness) of the ERA5 tiles (Table S1, Figure S2f) make this site a particularly challenging one to be resolved by ERA5. Herein, wind speed scores are comparable with those achieved at Humansdorp, except that wind speed is over-estimated (mean bias of −0.84 m/s) rather than under-estimated, as is the case at all other sites (Table 4, Figure 2). This is likely due to the fact that the tower was actually installed within a forest of very tall trees, thus, able to appreciably reduce the wind strength, a feature that ERA5 proved unable to capture. This is confirmed by the analysis of the wind directions: if considering winds bearing from the second quadrant (90–180°) with respect to the tower location (Figure S2f), i.e., the one encompassing the highest average roughness length (1.60 m), the average of the measured wind speeds is 3.56 m/s, while the average of the estimated wind speeds is 5.38, with frequencies of occurrence that are quite similar (15.4% vs. 20.3%). Therefore, a 51.3% over-estimation results across this wind sector, while it is significantly lower (20.1%) for all other directions.
Overall, ERA5 wind speed scores proved to be the worst at the two mountain sites, where the observed wind speed is largely under-estimated (Figure 2) thus confirming findings from the literature. According to [31], a resolution of a few dozen kilometres—typically affecting global reanalysis products—is not sufficient to capture small-scale features to accurately simulate wind speed and the resulting energy production at the local scale. Agreeing with [15], due to its limited resolution, ERA5 tends to under-resolve orographic speed-up effects occurring at the more complex sites, as met towers are usually installed on top of hills and ridges, where stronger wind is expected. According to [55], the limited ERA5 resolution also prevents it from fully resolving the high variation of solar irradiance that typically affects mountainous sites, which is generally under-estimated [56], thus resulting in a significant wind speed under-estimation. At Boulder (Figure 1c), the M2 mast lies over an elevated area (~2000 m) that is mostly dominated by short grass resulting in z0 varying between 0.10 and 0.60 m (Figure S2c, Table 3). A significant topography variation occurs not only between one tile and another (μ = 1623–2131 m, Figure S1c), but also inside each single tile (σ = 108–190 m, Table S1). The mean bias of 1.71–1.74 m/s returned by ERA5 at Boulder essentially matches the one (1.7 m/s) observed for ERA5 by [31] over mountainous sites in France, while it is lower than the overall mean value (2.64 m/s) reported by [15] from the comparison vs. 85 masts located over sites with high terrain complexity. At Ghoroghchi (Figure 1d), the tower lies over an elevated area (2054 m) mostly occupied by semidesert terrain with negligible roughness (Figure S2d, Table 3). This site also exhibits a significant topography variation (Figure S1d, Table S1). Herein, ERA5 returns the highest mean bias (2.25 m/s), which is slightly lower than the above overall mean value (2.64 m/s) found by [15] over highly complex terrains. RMSE values observed herein (3.3–3.4 m/s) are comparable with those found at Boulder (3.5–3.7 m/s).
In general, a real difference in ERA5 scores as a function of mast height cannot be clearly ascertained, neither in wind speed magnitude nor in time variation (Table 4, Figure 2). This outcome substantially confirms that using the PL to vertically interpolate wind speed at intermediate heights based on data at 10-m and 100-m heights does not introduce a significant inaccuracy.

4.2. Wind Energy Production

Within the aforementioned study, using an NREL 5-MW reference WT, [15] reported the distribution of ERA5 errors in predicting wind energy production. The mean of these distributions, always indicating an ERA5 underestimation, was 20.5 ± 20.5% on flat sites, 37.0 ± 31.6% on moderately complex terrains, and 69.4 ± 24.9% on highly complex terrains. Therefore, ERA5 scores achieved at FINO3 and Cabauw fall largely below the mean of error distribution reconstructed by [15] for flat sites. Although not particularly accurate, ERA5 performances at Humansdorp are also worth noticing when being reminded this is a very challenging coastal site where local sea–land breezes are unresolved (Figure S1e). The corresponding mean error (20.5%) ranks below the mean of error distribution reconstructed by [15] for moderately complex terrains. Conversely, ERA5 scores at Ghoroghchi and Boulder agree with those found by [15] on highly complex terrains. Compared against ERA5 scores reported by [31], at Cabauw, ERA5 scores are slightly better than the mean underestimation (8%) they observed over flat sites in northern France, while at Ghoroghchi and Boulder, ERA5 scores are worse than the ERA5 mean underestimation (48%) they observed over mountainous sites in southern France.
Unfortunately, the currently achieved results confirm findings, e.g., by [31], that ERA5 tendency to underestimate wind speed (Table 4) is magnified when predicting wind energy production (Table 5). As it is well known, inaccuracy in predicting wind speed follows a cubed rule when predicting power output (Equation (2)). In addition, the combined analysis of the wind speed Weibull distribution and the power curve of WTs selected for each site highlights that not quite the full wind speed range but rather the wind regimes that are the most fruitful for WTs need to be captured with particular care (Figure 3). Again consistently with [31], this ERA5 issue is exacerbated when predicting energy output over complex topography areas (Table 5). According to [15], orographic complexity explains most of the variance in the ERA5 scores. However, current ERA5 performances at Wallaby Creek highlight that land use (and thus roughness) complexity may play an even more prominent role than orographic complexity in (negatively) affecting ERA5 variance to predict energy production. Herein, a fair (18%) wind speed overestimation (Table 4) proved to result in a very large (~120%) wind energy over-estimation, likely as a result of the ERA5’s inability to resolve the marked land use heterogeneity (Figure S2f).

5. Conclusions

As a global reanalysis product, ERA5 has the advantage over regional reanalysis products that it can be applied everywhere, and thus even over the most remote and least accessible locations for instrumentation installation. This study confirmed that over offshore sites, ~31-km resolution ERA5 is well capable of predicting wind speed and energy production for medium (40–60 m) and elevated (80–100 m) WT hub heights. Not only in predicting wind speed magnitude and temporal variation, but also energy production, ERA5 scores proved to be finer than those achieved on comparable offshore sites when using higher-resolution regional reanalysis products or even NWP models. This outcome is not particularly surprising since the majority of ERA5 applications for directly addressing wind energy potential is performed at offshore locations (e.g., [2,21,22,23,24,25,26,27]). ERA5 also proved reliable for assessing wind energy potential over flat and sea-level sites with mostly homogeneous land cover, where ERA5 outperforms higher-resolution regional reanalyses or NWP models as well. Therefore, both on offshore locations and on sea-level inland locations that are substantially homogeneous in terms of orography and land use, the direct application of ERA5 proved to be far less expensive than the former in both implementation and data retrieval. By contrast, using ERA5 data as a direct source for wind energy studies should be avoided when dealing with more challenging sites either in terms of topography or land use. Over complex terrains such as mountains, confirming findings from various authors (e.g., [15,31]), due to its coarse resolution, ERA5 tends to under-resolve speed-up effects occurring on top of hills or ridges, i.e., where wind farms may be preferably developed, thus resulting in a substantial wind speed and power output underestimation. Again, because of its limited resolution, directly using ERA5 reanalyses is strongly discouraged when addressing sites that are very heterogeneous in terms of land use resulting in highly changing roughness conditions. Contrary to previous findings, the present study demonstrated that land use complexity may (negatively) affect ERA5 wind energy prediction skills even more so than topography complexity. A particular caution should be paid when applying ERA5 over coastal locations, as the sea–land discontinuity affecting these areas may result in large differences not only in surface roughness, but also in solar irradiation. ERA5 resolution may be inadequate for regions with highly varying solar radiation [55], which is generally underestimated [56], an issue leading to the underestimation of the most convective stability conditions, and thus of the associated most energetic wind regimes. Applied over these locations, however, in the present study ERA5 scores were generally acceptable, at least for wind speed.
Unfortunately, the current results confirm findings from the literature that errors in predicting wind speed may be dramatically magnified when predicting energy production, as not quite the full wind speed range but rather the wind regimes most profitable for WTs need to be captured with particular care. This outcome applied to both ERA5 underestimations over complex topography sites (mountains) and ERA5 overestimations over complex land use sites (forests).
An important outcome of this study is that the lack of an intermediate level (between 10 and 100 m) in ERA5 wind speed data does not significantly impact its performance, neither in predicting wind speed magnitude nor time variation. Vertical interpolation between these two levels performed through the PL proved sufficient enough to efficiently cope with this gap. Conversely, a desirable improvement in the ERA5 product for wind energy purposes could be the availability of air density estimations both at 10 and 100 m heights, or alternatively, the availability of both the temperature and pressure at 100 m in order to calculate 100-m air density.
In the future, it could be interesting to assess how wind energy predictions over the most critical sites may improve when using ERA5 data as boundary conditions for a high-resolution NWP model such as WRF. For example, this would allow to better understand to what extent a more resolved description of terrain features and/or land cover may help as well as the beneficial role played by a finer prediction of the surface radiation budget.

Supplementary Materials

The supplementary materials are available online at https://www.mdpi.com/article/10.3390/en14144169/s1. Table S1. Terrain and land cover characteristics of ERA5 grid points falling within a 0.25-deg buffer from each site’s location. Table S2. Statistical values of annual air density observed vs. estimated by ERA5 at the six towers. Table S3. WT power losses (%) accounted for by WT system and cause/component [20]. Table S4. WT power losses (%) accounted for by site. Table S5. WT power losses (%) accounted for by site and height-related air density. Figure S1. Mean altitude (m) of ERA5 grid points closest to each tower’s location: (a) FINO3; (b) Cabauw; (c) Boulder; (d) Ghoroghchi; (e) Humansdorp; (f) Wallaby Creek. The values of grid points within a 0.25-deg buffer from towers (shown as black dashed circle) are also reported. Cartography basemap: OpenStreetMap. Figure S2. Mean roughness length (m) of ERA5 grid points closest to each tower’s location: (a) FINO3; (b) Cabauw; (c) Boulder; (d) Ghoroghchi; (e) Humansdorp; (f) Wallaby Creek. The values of grid points within a 0.25-deg buffer from towers (shown as black dashed circle) are also reported. Cartography basemap: OpenStreetMap. Figure S3. Taylor diagram of annual average air density predicted by height by ERA5 reanalysis data at the six study locations. Standard deviations of predictions (σP) and RMSD (proportional to the radial distance from observations) are normalised by the standard deviation of observations (σO).

Funding

This research received no external funding.

Data Availability Statement

Data used in this study may be accessed at the following URLs. ERA5 reanalysis data on single levels from 1979 to present can be freely downloaded at: https://cds.climate.copernicus.eu/cdsapp#!/dataset/reanalysis-era5-single-levels?tab=form (accessed on 11 June 2021). All data and information from the Tall Tower Dataset may be accessed at: http://talltowers.bsc.es (accessed on 11 June 2021). Data of the FINO3 mast (Germany) may be requested from: http://www.fino3.de (accessed on 11 June 2021). Cabauw tower data (Netherlands) can be freely downloaded from the Experimental Site for Atmospheric Research (CESAR) website: (accessed on 11 June 2021). Data from the M2 mast at Boulder (USA) can be freely accessed at: http://www.nrel.gov/midc/nwtc_m2 (accessed on 11 June 2021). Data from the Ghoroghchi mast (Iran) are freely accessible at: http://www.satba.gov.ir/en/iranresourceassesment/atlas/map-map (accessed on 11 June 2021). Data from the WM08 mast at Humansdorp (South Africa) can be freely downloaded after registration at: http://wasadata.csir.co.za/wasa1/WASAData (accessed on 11 June 2021). Data from the Wallaby Creek tower (Australia) can be downloaded after registration from: http://www.ozflux.org.au/monitoringsites/wallabycreek/wallabyck_measurements.html (accessed on 11 June 2021).

Conflicts of Interest

The author declares no conflict of interest.

References

  1. Calif, R.; Schmitt, F.G.; Huang, Y. Multifractal description of wind power fluctuations using arbitrary order Hilbert spectral analysis. Phys. A Stat. Mech. Its Appl. 2013, 392, 4106–4120. [Google Scholar] [CrossRef]
  2. Aboobacker, V.M.; Shanas, P.R.; Veerasingam, S.; Al-Ansari, E.M.; Sadooni, F.N.; Vethamony, P. Long-term assessment of onshore and offshore wind energy potentials of Qatar. Energies 2021, 14, 1178. [Google Scholar] [CrossRef]
  3. Floors, R.; Nielsen, M. Estimating air density using observations and re-analysis outputs for wind energy purposes. Energies 2019, 12, 2038. [Google Scholar] [CrossRef] [Green Version]
  4. Gryning, S.E.; Floors, R. Investigating predictability of offshore winds using a mesoscale model driven by forecast and reanalysis data. Meteorol. Z. 2020, 29, 117–130. [Google Scholar] [CrossRef]
  5. Wahl, S.; Bollmeyer, C.; Crewell, S.; Figura, C.; Friederichs, P.; Hense, A.; Keller, J.D.; Ohlwein, C. A novel convective-scale regional reanalysis COSMO-REA2: Improving the representation of precipitation. Meteorol. Z. 2017, 26, 345–361. [Google Scholar] [CrossRef]
  6. Ridal, M.; Olsson, E.; Unden, P.; Zimmermann, K.; Ohlsson, A. Uncertainties in Ensembles of Regional Re-Analyses. Deliverable D2.7 HARMONIE Reanalysis Report of Results and Dataset 2017. Available online: http://www.uerra.eu/component/dpattachments/?task=attachment.download&id=296 (accessed on 11 June 2021).
  7. Bazile, E.; Abida, R.; Szczypta, C.; Verelle, A.; Soci, C.; Le Moigne, P. MESCAN-SURFEX Surface Analysis. Deliverable D2.9 of the UERRA Project 2017. Available online: http://www.uerra.eu/publications/deliverable-reports.html (accessed on 11 June 2021).
  8. Saha, S.; Moorthi, S.; Wu, X.; Wang, J.; Nadiga, S.; Tripp, P.; Behringer, D.; Hou, Y.-T.; Chuang, H.-Y.; Iredell, M.; et al. The NCEP Climate Forecast System Version 2. J. Clim. 2014, 27, 2185–2208. [Google Scholar] [CrossRef]
  9. Gelaro, R.; Mccarty, W.; Suárez, M.J.; Todling, R.; Molod, A.; Takacs, L.; Randles, C.A.; Darmenov, A.; Bosilovich, M.G.; Reichle, R.H.; et al. The Modern-Era Retrospective Analysis for Research and Applications, Version 2 (MERRA-2). J. Clim. 2017, 30, 5419–5454. [Google Scholar] [CrossRef] [PubMed]
  10. Kobayashi, S.; Ota, Y.; Harada, Y.; Ebita, A.; Moriya, M.; Onoda, H.; Onogi, K.; Kamahori, H.; Kobayashi, C.; Endo, H.; et al. The JRA-55 reanalysis: General specifications and basic characteristics. J. Meteorol. Soc. Jpn. 2015, 93, 5–48. [Google Scholar] [CrossRef] [Green Version]
  11. Hersbach, H.; Bell, B.; Berrisford, P.; Hirahara, S.; Horányi, A.; Muñoz-Sabater, J.; Nicolas, J.; Peubey, C.; Radu, R.; Schepers, D.; et al. The ERA5 global reanalysis. Q. J. R. Meteorol. Soc. 2020, 146, 1999–2049. [Google Scholar] [CrossRef]
  12. Camargo, L.R.; Gruber, K.; Nitsch, F. Assessing variables of regional reanalysis data sets relevant for modelling small-scale renewable energy systems. Renew. Energy 2019, 133, 1468–1478. [Google Scholar] [CrossRef]
  13. Skamarock, W.C.; Klemp, J.B.; Dudhia, J.; Gill, D.O.; Barker, D.M.; Wang, W.; Powers, J.G. A Description of the Advanced Research WRF Version 2; National Center For Atmospheric Research Boulder Co Mesoscale and Microscale Meteorology Div: Boulder, CO, USA, 2005. [Google Scholar]
  14. Global Wind Atlas. Available online: https://globalwindatlas.info/about/introduction (accessed on 11 June 2021).
  15. Dörenkämper, M.; Olsen, B.T.; Witha, B.; Hahmann, A.N.; Davis, N.N.; Barcons, J.; Ezber, Y.; García-Bustamante, E.; González-Rouco, J.F.; Navarro, J.; et al. The making of the new european wind atlas–part 2: Production and evaluation. Geosci. Model Dev. 2020, 13, 5079–5102. [Google Scholar] [CrossRef]
  16. Janjai, S.; Masiri, I.; Promsen, W.; Pattarapanitchai, S.; Pankaew, P.; Laksanaboonsong, J.; Bischoff-Gauss, I.; Kalthoff, N. Evaluation of wind energy potential over Thailand by using an atmospheric mesoscale model and a GIS approach. J. Wind. Eng. Ind. Aerodyn. 2014, 129, 1–108. [Google Scholar] [CrossRef]
  17. ECMWF Reanalysis v5 (ERA5). Available online: https://www.ecmwf.int/en/forecasts/dataset/ecmwf-reanalysis-v5 (accessed on 11 June 2021).
  18. Climate Data Store. Available online: https://cds.climate.copernicus.eu (accessed on 11 June 2021).
  19. Olauson, J. ERA5: The new champion of wind power modelling? Renew. Energy 2018, 126, 322–331. [Google Scholar] [CrossRef] [Green Version]
  20. Gualtieri, G. Improving investigation of wind turbine optimal site matching through the self-organizing maps. Energy Convers. Manag. 2017, 143, 295–311. [Google Scholar] [CrossRef] [Green Version]
  21. Soares, P.M.; Lima, D.C.; Nogueira, M. Global offshore wind energy resources using the new ERA-5 reanalysis. Environ. Res. Lett. 2020, 15, 1040a2. [Google Scholar] [CrossRef]
  22. Ulazia, A.; Nafarrate, A.; Ibarra-Berastegi, G.; Sáenz, J.; Carreno-Madinabeitia, S. The consequences of air density variations over Northeastern Scotland for offshore wind energy potential. Energies 2019, 12, 2635. [Google Scholar] [CrossRef] [Green Version]
  23. Ibarra-Berastegi, G.; Ulazia, A.; Saénz, J.; González-Rojí, S.J. Evaluation of Lebanon’s offshore-wind-energy potential. J. Mar. Sci. Eng. 2019, 7, 361. [Google Scholar] [CrossRef] [Green Version]
  24. Tavares, L.F.D.; Shadman, M.; Assad, L.P.D.; Silva, C.; Landau, L.; Estefen, S.F. Assessment of the offshore wind technical potential for the Brazilian Southeast and South regions. Energy 2020, 196, 117097. [Google Scholar] [CrossRef]
  25. Soukissian, T.H.; Karathanasi, F.E.; Zaragkas, D.K. Exploiting offshore wind and solar resources in the Mediterranean using ERA5 reanalysis data. Energy Convers. Manag. 2021, 237, 114092. [Google Scholar] [CrossRef]
  26. Farjami, H.; Hesari, A.R.E. Assessment of sea surface wind field pattern over the Caspian Sea using EOF analysis. Reg. Stud. Mar. Sci. 2020, 35, 101254. [Google Scholar] [CrossRef]
  27. Kumar, V.S.; Asok, A.B.; George, J.; Amrutha, M.M. Regional Study of Changes in Wind Power in the Indian Shelf Seas over the Last 40 Years. Energies 2020, 13, 2295. [Google Scholar] [CrossRef]
  28. Jurasz, J.; Mikulik, J.; Dąbek, P.B.; Guezgouz, M.; Kaźmierczak, B. Complementarity and ‘Resource Droughts’ of Solar and Wind Energy in Poland: An ERA5-Based Analysis. Energies 2021, 14, 1118. [Google Scholar] [CrossRef]
  29. Nefabas, K.L.; Söder, L.; Mamo, M.; Olauson, J. Modeling of Ethiopian Wind Power Production Using ERA5 Reanalysis Data. Energies 2021, 14, 2573. [Google Scholar] [CrossRef]
  30. Ruiz, S.A.G.; Barriga, J.E.C.; Martínez, J.A. Wind power assessment in the Caribbean region of Colombia, using ten-minute wind observations and ERA5 data. Renew. Energy 2021, 172, 158–176. [Google Scholar] [CrossRef]
  31. Jourdier, B. Evaluation of ERA5, MERRA-2, COSMO-REA6, NEWA and AROME to simulate wind power production over France. Adv. Sci. Res. 2020, 17, 63–77. [Google Scholar] [CrossRef]
  32. Justus, C.G.; Hargraves, W.R.; Yalcin, A. National assessment of potential output from wind-powered generators. J. Appl. Meteorol. 1976, 15, 673–678. [Google Scholar] [CrossRef] [Green Version]
  33. Chang, T.J.; Wu, Y.T.; Hsu, H.Y.; Chu, C.R.; Liao, C.M. Assessment of wind characteristics and wind turbine characteristics in Taiwan. Renew. Energy 2003, 28, 851–871. [Google Scholar] [CrossRef]
  34. Chen, J.; Wang, F.; Stelson, K.A. A mathematical approach to minimizing the cost of energy for large utility wind turbines. Appl. Energy 2018, 228, 1413–1422. [Google Scholar] [CrossRef]
  35. Drew, D.R.; Barlow, J.F.; Lane, S.E. Observations of wind speed profiles over Greater London, UK, using a Doppler lidar. J. Wind. Eng. Ind. Aerodyn. 2013, 121, 98–105. [Google Scholar] [CrossRef] [Green Version]
  36. Stull, R. Practical Meteorology: An Algebra-Based Survey of Atmospheric Science; University of British Columbia: Vancouver, BC, Canada, 2015; pp. 8, 70. ISBN 978-0-88865-176-1. [Google Scholar]
  37. Hersbach, H.; Bell, B.; Berrisford, P.; Biavati, G.; Horányi, A.; Muñoz Sabater, J.; Nicolas, J.; Peubey, C.; Radu, R.; Rozum, I.; et al. ERA5 hourly data on single levels from 1979 to present. In Copernicus Climate Change Service (C3S) Climate Data Store (CDS); 14/06/2018; Available online: https://cds.climate.copernicus.eu/cdsapp#!/dataset/reanalysis-era5-single-levels?tab=overview (accessed on 1 June 2021). [CrossRef]
  38. ECMWF. Newsletter No. 152—Summer 2017. 39, pp. 36–39. Available online: https://www.ecmwf.int/sites/default/files/elibrary/2017/17439-newsletter-no-152-summer-2017.pdf (accessed on 11 June 2021). [CrossRef]
  39. Ramon, J.; Lledó, L.; Pérez-Zanón, N.; Soret, A.; Doblas-Reyes, F.J. The Tall Tower Dataset: A unique initiative to boost wind energy research. Earth Syst. Sci. Data 2020, 12, 429–439. [Google Scholar] [CrossRef] [Green Version]
  40. Ramon, J.; Lledó, L. The Tall Tower Dataset. Latest Version: 07/01/2021. Available online: https://b2share.eudat.eu/records/3ac9362f1cee49178236c9e03aec884d (accessed on 11 June 2021).
  41. Gualtieri, G. Surface turbulence intensity as a predictor of extrapolated wind resource to the turbine hub height: Method’s test at an offshore site. Renew. Energy 2017, 111, 175–186. [Google Scholar] [CrossRef]
  42. Gottschall, J.; Dörenkämper, M. Understanding and mitigating the impact of data gaps on offshore wind resource estimates. Wind. Energy Sci. 2021, 6, 505–520. [Google Scholar] [CrossRef]
  43. Gualtieri, G. Wind resource extrapolating tools for modern multi-MW wind turbines: Comparison of the Deaves and Harris model vs. the power law. J. Wind. Eng. Ind. Aerodyn. 2017, 170, 107–117. [Google Scholar] [CrossRef]
  44. Van den Berg, G.P. Wind turbine power and sound in relation to atmospheric stability. Wind. Energy 2008, 11, 151–169. [Google Scholar] [CrossRef]
  45. Jager, D.; Andreas, A. NREL National Wind Technology Center (NWTC): M2 Tower; Boulder, Colorado (Data); NREL Report No. DA-5500-56489; National Renewable Energy Lab.(NREL): Golden, CO, USA, 1996. [CrossRef]
  46. Gualtieri, G. Surface turbulence intensity as a predictor of extrapolated wind resource to the turbine hub height: Method’s test at a mountain site. Renew. Energy 2018, 120, 457–467. [Google Scholar] [CrossRef]
  47. Mortensen, N.G.; Hansen, J.C.; Kelly, M.C.; Prinsloo, E.; Mabille, E.; Szewczuk, S. Wind Atlas for South Africa (WASA). Western Cape and parts of Northern and Eastern Cape. Station and Site Description Report. Tech. Rep. April 2014. Available online: https://orbit. dtu. dk/ws/files/110948908/DTU_Wind_Energy_E_0072. pdf (accessed on 1 June 2021).
  48. OzFlux: Australian and New Zealand Flux Research and Monitoring. Available online: http://www.ozflux.org.au/monitoringsites/wallabycreek/index.html (accessed on 11 June 2021).
  49. ECMWF Vegetation Types and Parameter Values. Available online: https://rda.ucar.edu/datasets/ds630.0/docs/ECMWF_vegetation_types.html (accessed on 11 June 2021).
  50. Bailey, B.H.; McDonald, S.L.; Bernadett, D.W.; Markus, M.J.; Elsholz, K.V. Wind Resource Assessment Handbook: Fundamentals for Conducting a Successful Monitoring Program; (No. NREL/SR-440-22223; ON: DE97000250); National Renewable Energy Lab.: Golden, CO, USA; AWS Scientific, Inc.: Albany, NY, USA, 1997. [Google Scholar]
  51. Taylor, K.E. Summarizing multiple aspects of model performance in a single diagram. J. Geophys. Res. 2001, 106, 7183–7192. [Google Scholar] [CrossRef]
  52. Gualtieri, G. Development and application of an integrated wind resource assessment tool for wind farm planning. Int. J. Renew. Energy Res. 2012, 2, 674–685. [Google Scholar]
  53. Kaiser-Weiss, A.K.; Borsche, M.; Niermann, D.; Kaspar, F.; Lussana, C.; Isotta, F.A.; van den Besselaar, E.; van der Schrier, G.; Undén, P. Added value of regional reanalyses for climatological applications. Environ. Res. Commun. 2019, 1, 071004. [Google Scholar] [CrossRef]
  54. Dörenkämper, M.; Optis, M.; Monahan, A.; Steinfeld, G. On the Offshore advection of Boundary-Layer Structures and the Influence on Offshore Wind Conditions. Bound. Layer Meteorol. 2015, 155, 459–482. [Google Scholar] [CrossRef]
  55. Urraca, R.; Huld, T.; Gracia-Amillo, A.; Martinez-de-Pison, F.J.; Kaspar, F.; Sanz-Garcia, A. Evaluation of global horizontal irradiance estimates from ERA5 and COSMO-REA6 reanalyses using ground and satellite-based data. Sol. Energy 2018, 164, 339–354. [Google Scholar] [CrossRef]
  56. Jiang, H.; Yang, Y.; Wang, H.; Bai, Y.; Bai, Y. Surface Diffuse Solar Radiation Determined by Reanalysis and Satellite over East Asia: Evaluation and Comparison. Remote Sens. 2020, 12, 1387. [Google Scholar] [CrossRef]
  57. Ramon, J.; Lledo, L.; Torralba, V.; Soret, A.; Doblas-Reyes, F.J. What global reanalysis best represents near-surface winds? Q. J. R. Meteorol. Soc. 2019, 145, 3236–3251. [Google Scholar] [CrossRef] [Green Version]
Figure 1. Worldwide location and aerial view of the six study sites: (a) FINO3; (b) Cabauw; (c) Boulder; (d) Ghoroghchi; (e) Humansdorp; and (f) Wallaby Creek. Yellow dots indicate the locations of the towers, while red dots indicate 0.25-deg ERA5 grid points. A 0.25-deg buffer from each tall tower is shown by a yellow dashed circle. Cartography basemap: Bing Aerial.
Energies 14 04169 g001
Figure 2. Taylor diagram of annual mean wind speed predicted by height by ERA5 reanalysis data at the six tower locations. Standard deviations of predictions (σP) and RMSD (proportional to the radial distance from observations) are normalised by the standard deviation of observations (σO).
Energies 14 04169 g002
Figure 3. Weibull distribution of annual wind speed observed vs. estimated at: (a) FINO3 60 m; (b) FINO3 100 m; (c) Cabauw 40 m; (d) Cabauw 80 m; (e) Boulder 50 m; (f) Boulder 80 m; (g) Ghoroghchi 60 m; (h) Ghoroghchi 100 m; (i) Humansdorp 60 m; and (j) Wallaby Creek 95 m. Scale (c) and shape (k) factors are also reported along with median wind speed ( μ ^ ). Power curves of WTs used in wind energy yield calculation are also shown.
Energies 14 04169 g003
Table 1. Characteristics of the study sites where tall towers are installed.
SiteCountryTower’s OperatorLatitude (deg N)Longitude (deg E)Altitude (m a.s.l.)Environment
FINO3GermanyBSH55.19497.1583<0Offshore
CabauwNetherlandsKNMI51.97034.9262−0.7Inland
BoulderUSANWTC39.9106–105.23481855Mountainous
GhoroghchiIranSATBA33.590051.00002140 1Desert
HumansdorpSouth AfricaSANEDI−34.110024.5144110Coastal
Wallaby CreekAustraliaMonash University−37.4262145.1872720Forested
1 Approximated from Google Earth.
Table 2. Variables by height and period of time series used at each site for ERA5 and tower data.
SiteHeight by Variable (m)Time Period
Wind Speed 1TemperaturePressure
ERA5
All10, 10020Same as tower data
Tall towers
FINO360, 10029, 55, 9423, 941 January 2014–31 December 2015
Cabauw40, 8040, 8001 January 2014–31 December 2015
Boulder50, 802, 50, 8001 January 2014–31 December 2015
Ghoroghchi60, 1000NA1 June 2013–31 May 2014
Humansdorp60001 January 2016–31 December 2016
Wallaby Creek95201 September 2005–31 August 2006
1 Heights of towers’ wind speed records are set as target heights for comparison.
Table 3. Ensemble statistics of terrain and land cover characteristics of ERA5 grid points falling within a 0.25-deg buffer from each site’s location 1,2,3,4,5.
SiteNo. Grid PointsDistance (km)Altitude
(m a.s.l.)
Surface Roughness Length (m)Low VegetationHigh Vegetation
Cover (%)CategoriesCover (%)Categories
Aritmetic Mean
(Range)
Weighted Mean
(Range)
Weighted Mean
(Range)
Weighted Mean
(Range)
Weighted Mean
(Range)
FINO3416.6
(8.8–23.5)
<00.00100Sea
Cabauw314.5
(5.8–24.9)
−1
(−1–+2)
0.29
(0.26–0.36)
92
(86–92)
Crops and mixed farming7
(6–13)
Interrupted forest
Boulder316.7
(10.2–22.0)
1992
(1623–2131)
0.44
(0.12–0.58)
91
(84–93)
Short grass7
(5–16)
Deciduous broadleaf trees
Ghoroghchi213.9
(10.0–17.8)
2054
(2019–2065)
0.0273
(72–74)
Semidesert
Humansdorp213.9
(12.3–15.6)
142
(39–206)
0.16
(0.15–0.19)
61
(18–87)
Short grass; Crops and mixed farming28
(10–58)
Deciduous broadleaf trees; Interrupted forest
Wallaby Creek316.2
(9.4–20.7)
324
(260–339)
1.27
(0.48–1.60)
17
(0–66)
Crops and mixed farming82
(34–100)
Interrupted forest; Evergreen broadleaf trees
1 Coordinates of sites’ locations are reported in Table 1. 2 Location of each grid point is graphically shown as red dots in Figure 1, where the 0.25-deg buffer from each tower they fall within is shown through a yellow dashed circle. 3 Weighted means and weighted minima and maxima calculated using the inverse of distance. 4 Missing range means no variation. 5 ECMWF low/high vegetation types considered as land cover categories [49].
Table 4. Statistical values of annual wind speed observed vs. estimated by ERA5 at the six towers 1.
Height (m)N (%)ObservationsEstimationsStatistical Indicators
µo (m/s)σo (m/s)µp (m/s)σp (m/s)MB (m/s)NBRMSE (m/s)NRMSEr
FINO3
6015815 (90.27)9.504.439.494.270.010.001.350.140.95
10015439 (88.12)9.984.719.904.520.080.011.350.140.96
Cabauw
4017512 (99.95)5.792.865.562.660.240.041.060.190.93
8017511 (99.95)6.973.196.493.050.480.071.200.180.94
Boulder
5017321 (98.86)4.463.312.751.551.710.493.521.000.38
8017321 (98.86)4.703.522.961.721.740.473.690.990.39
Ghoroghchi
606267 (71.54)5.582.733.301.812.280.533.360.780.47
1006267 (71.54)5.862.823.621.972.250.493.440.750.45
Humansdorp
608758 (99.70)7.073.606.123.100.950.142.170.330.84
Wallaby Creek
954741 (54.12)4.182.105.022.69−0.84−0.181.690.370.84
N (%): number of observations/predictions (valid data percent); µo: mean of observations; σo: standard deviation of observations; µp: mean of predictions; σp: standard deviation of predictions; MB: mean bias; NB: normalised bias; RMSE: root mean square error; NRMSE: normalised root mean square error; r: correlation coefficient. 1 For each site, time periods as shown in Table 2 have been considered.
Table 5. Statistical values calculated by wind turbine and hub height of annual energy production observed vs. estimated by ERA5 at the six towers 1,2.
Wind TurbineObservationsEstimations
ModelHhub (m)Pr (kW)D (m)Type 3AEY (MWh/y)CF (%)AEY (MWh/y)CF (%)NE (%)
FINO3
Vestas V80-2.0-OS60200080B821446.85831447.42−1.22
Siemens SWT-2.3-101-OS101 42300101D1146856.881068853.076.70
Cabauw
Nordex N27-1504015027A33725.6631423.916.82
Leitwind LTW77-8008080076.7D305143.50288041.085.56
Boulder
Nordex N27-1505015017A14811.22292.2380.12
Leitwind LTW77-8008080076.7D118716.923504.9870.57
Ghoroghchi
Vestas V82-90059 590082B160220.304285.4273.30
W2E Harvester 2.01002000116C440625.1313627.7769.08
Humansdorp
Vestas V82-90059 590082B319840.54253232.0920.84
Wallaby Creek
Leitwind LTW104-2000952000104.1D17309.87380221.69−119.76
Hhub: turbine hub height; Pr: turbine rated power; D: turbine diameter; AEY: annual energy yield; CF: capacity factor; NE: normalised error. 1 For each site, time periods as shown in Table 2 have been considered. 2 Total losses by single WT (Equation (9)) have been calculated, as WT wake losses have been disregarded. 3 Wind turbine types are described in Table S3. 4 Wind speed at 100 m approximated for 101-m hub heights. 5 Wind speed at 60 m approximated for 59-m hub heights.
Publisher’s Note: MDPI stays neutral with regard to jurisdictional claims in published maps and institutional affiliations.

