Article

Influence of Input and Control Parameters on the Process of Pelleting Powdered Biomass

1
The National Institute of Research—Development for Machines and Installations Designed for Agriculture and Food Industry—INMA Bucharest, 013811 Bucharest, Romania
2
Department of Management and Entrepreneurship, Politehnica University of Bucharest, 060042 Bucharest, Romania
3
Department of Biotechnical Systems, Politehnica University of Bucharest, 060042 Bucharest, Romania
*
Authors to whom correspondence should be addressed.
Energies 2021, 14(14), 4104; https://doi.org/10.3390/en14144104
Submission received: 27 April 2021 / Revised: 29 June 2021 / Accepted: 5 July 2021 / Published: 7 July 2021
(This article belongs to the Special Issue Advanced Technologies for Wastewater and Solid Waste Treatment)

Abstract

:
This paper presents theoretical and experimental research studying the influence of process parameters on the quality of biomass pellets. A validated mathematical model was developed, expressing the density of biomass pellets as determined by moisture content, compression pressure, process heat, the initial density of the material, pelleting speed and initial volume of the material. The experiments for determining the influence of these parameters on the compression of biomass into pellets and optimizing the process were conducted on a heated single pellet compression device, using fir sawdust as raw material. To describe and study the process, four input and control parameters were varied—raw material moisture, pelleting speed, maximum force applied and pelleting die temperature. From the experiments, it was noticed that overall, moisture and pressure have the most important effect on the compression process and pelleting speed, and heat applied also affected the process. Pellet density decreased when pelleting speed and material moisture increase and the density increased with a higher compression pressure and higher heat during the process.

1. Introduction

A sustainable global society requires making a substantial change in the manner of how our society today obtains its energy, leading to the development of new sources of energy. Increasing the percentage of energy obtained from renewable sources would allow the replacement of conventional energy sources with high carbon emissions and would lead to a reduction in global warming [1].
Given that the calorific value of biomass at 20% moisture content is situated between 13 and 15 MJ kg−1, compared to coal that has a calorific value between 27 and 31 MJ kg−1 and that wood/straws/other plant residues can be obtained every year, unlike fossil fuels, biomass represents a viable solution for yearlong available raw materials to obtain solid, liquid or gaseous fuels [2,3,4,5].
Biomass presents a series of drawbacks due mainly to its high moisture content and low bulk density that make it difficult to transport, store and use in its natural state. In order to use biomass for combustion, it is therefore transformed into solid biofuels, such as pellets and briquettes, through a compression process [6,7,8,9].
The technological process of biomass densification by pelleting has a number of special characteristics that fundamentally distinguish it from the densification of other types of materials (metal powders, pharmaceutical powders, etc.) due to the fact that biomass densification is strongly influenced by a multitude of disruptive factors, whose study requires deepening, both from a theoretical and experimental point of view. For this reason, it is important to take into account these disruptive factors in conducting experiments and in interpreting data in a direct connection with the conditions for conducting experimental tests [10,11].
Currently, researches in the field of obtaining solid biofuels represent a concern in the field of mechanical engineering, with the major goal of optimizing densification processes, improving the quality of biomass products, minimizing costs, increasing the efficiency of compression equipment and contributing to environmental protection [12,13,14,15,16].
It is important to correlate researches in the field with current trends in switching from fossil fuels to the use of renewable energy, with the best possible combustion attributes and the highest possible durability [17,18,19].
Various types of wood (sawdust, tree trimming branches, vine ropes, walnut shells, hazelnuts, etc.) or agricultural (cereal straw, cobs and corn cobs, legumes, etc.) residues are suitable for use in obtaining energy. The use of these types of waste avoids their transformation into unused waste and ensures the full use of significant resources, which may eventually decrease or, in some cases where there are sufficient biomass resources, replace the demand for fossil fuels such as coal, oil or gas. Careful planning is needed at national and local levels, as well as the installation of infrastructure for the production of biofuels for the efficient use of biomass [20].
Pellets are solid biofuel normally produced from wood and agricultural waste. They are presented as cylindrical granules of standard sizes, with diameters generally between 5 and 8 mm (sometimes even up to 25 mm) and with variable length, from 5 to about 40 mm and irregular (broken) ends [21,22,23]. They have high mechanical strength and good combustion characteristics. The process of obtaining pellets is similar to that of producing briquettes, except that the biomass passes through much smaller orifices (holes) and the finished product has much smaller dimensions [24].
In order to obtain pellets with adequate density and durability, there must be a very good correlation between the physical–chemical properties of the biomass used as raw material (composition, moisture, granulation, etc.) and the characteristics of pelleting equipment (type of die, size of pelleting orifices, type of action on the material, pelleting speed, etc.). Single pelleting devices can be used to create compaction conditions and have been used in various researches in the field [25].
Powder compression models have been developed starting in the 1920s and were focused on the compaction of metal and pharmaceutical powders. The majority of these models expressed the density of the products compacted in relation to the pressure required to achieve the compacted product and the density or volume of the raw material [26,27,28,29,30,31,32,33,34,35].
The densification or compaction of agricultural and wood biomass into pellets is an essential process for the production of biofuels. Ground biomass particles behave differently under the action of different applied forces, as determined in the research conducted by Adapa et al., Nielsen et al., Obidzinski et al. and Puig Arnavat et al. [36,37,38]. Therefore, it is important to study the changes in the density and volume of compressed material when applying pressure. One of the most important reasons for putting experimental data into an equation is generally the development of charts in order to make it easier to compare different data sets [39].
In the practice of biomass densification, it was found that between the output parameters expressing the quality of the pellets obtained and the accumulation of influencing factors represented by the properties of the material and compression conditions, there is a strong link, the adjustment of these factors being essential in obtaining quality biofuels [40,41].
Holm and Krizan [42,43,44] developed compression models that help reveal the behavior of biomass/particles during the compaction process (pelleting or briquetting) and can help in optimizing the parameters needed to obtain good quality pellets/briquettes. Pellets can be formed either by using agglomerations by pressure or compaction, in which the particles join together with or without the use of binding agents [45,46].
Xu et al. [47] modeled the effect of input parameters on the density of biomass pellets, the analysis determining that the moisture content, piston speed and particle size significantly affected the density of the pellets, while the influence of die length was negligible.
Said et al. [48] studied the effect of die pelleting orifice diameter on the quality of straw pellets and have found that the diameter of pellets is close to the diameter of the pelleting orifices, but the length of pellets decreased considerably while increasing the compression length of the die.
Poddar et al. [49] studied the effect of pelleting pressure on improving the calorific value of compressed biomass. It was found that increased pressures do not influence the heating values.
The paper presents both theoretical and experimental research on the parameters influencing the pelleting process through an experimentally validated mathematical model that expresses the density of the pellets as determined by moisture content, compression pressure, process heat, the initial density of the material, pelleting speed and the initial volume of the material.

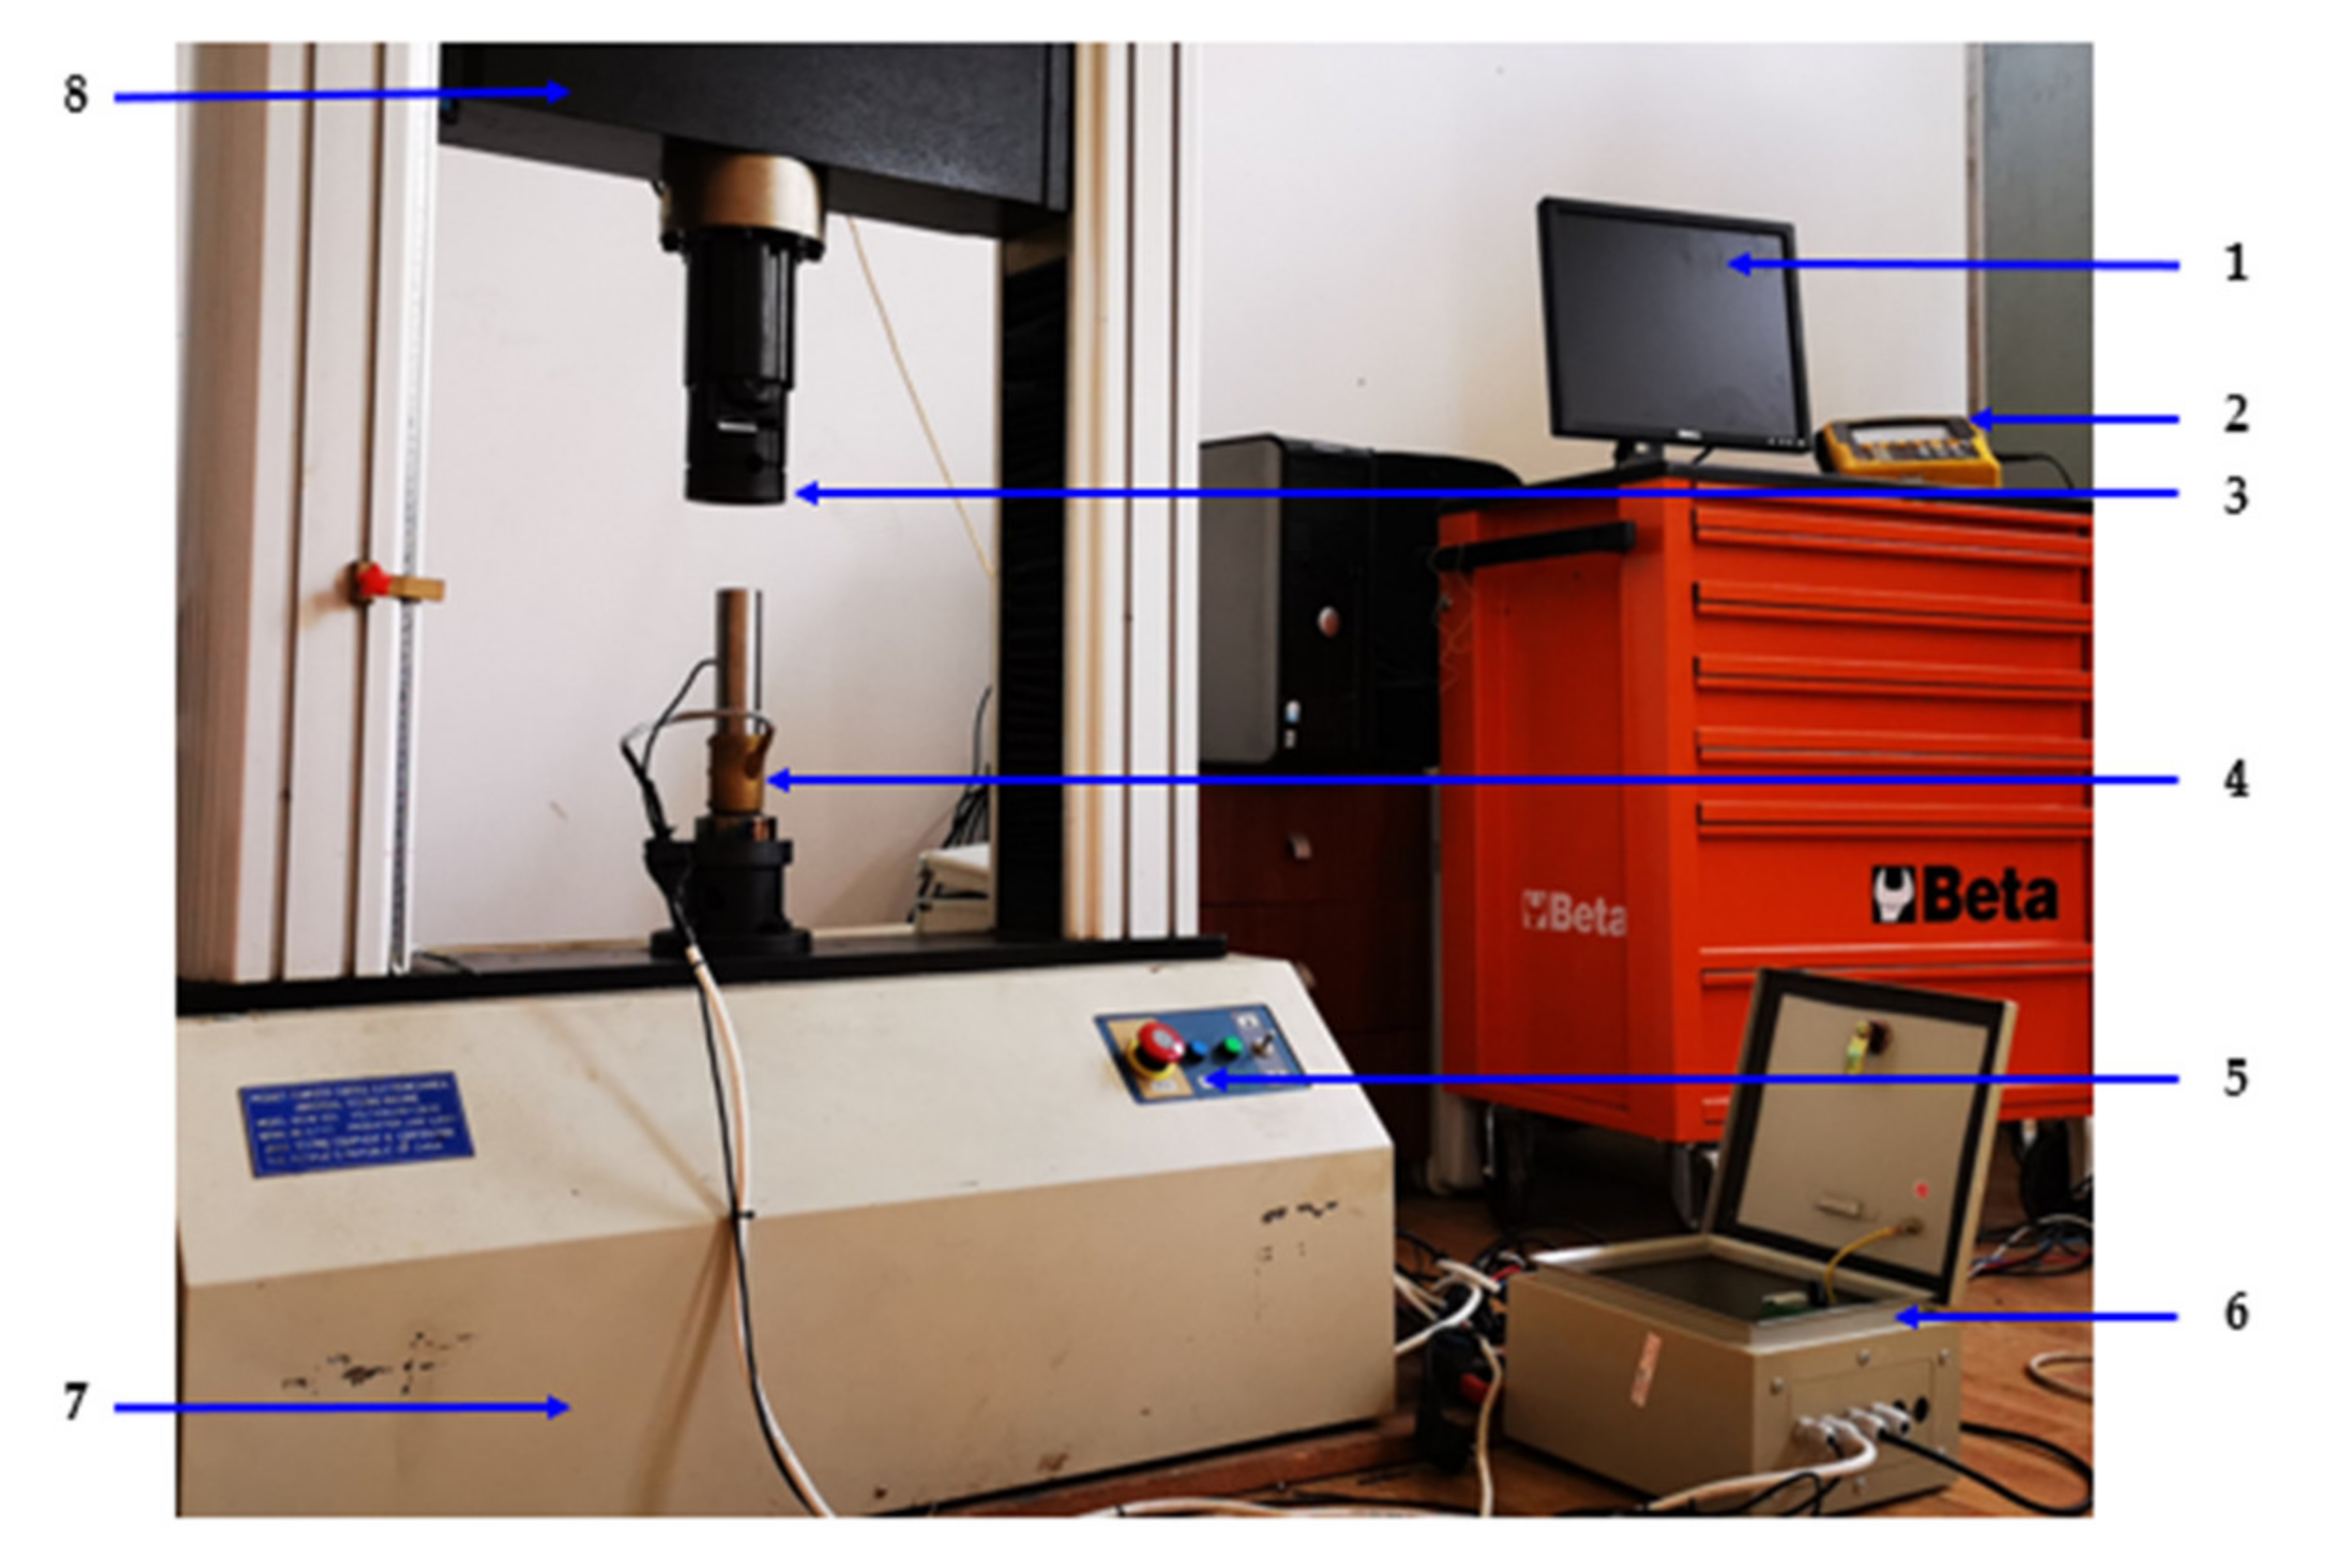
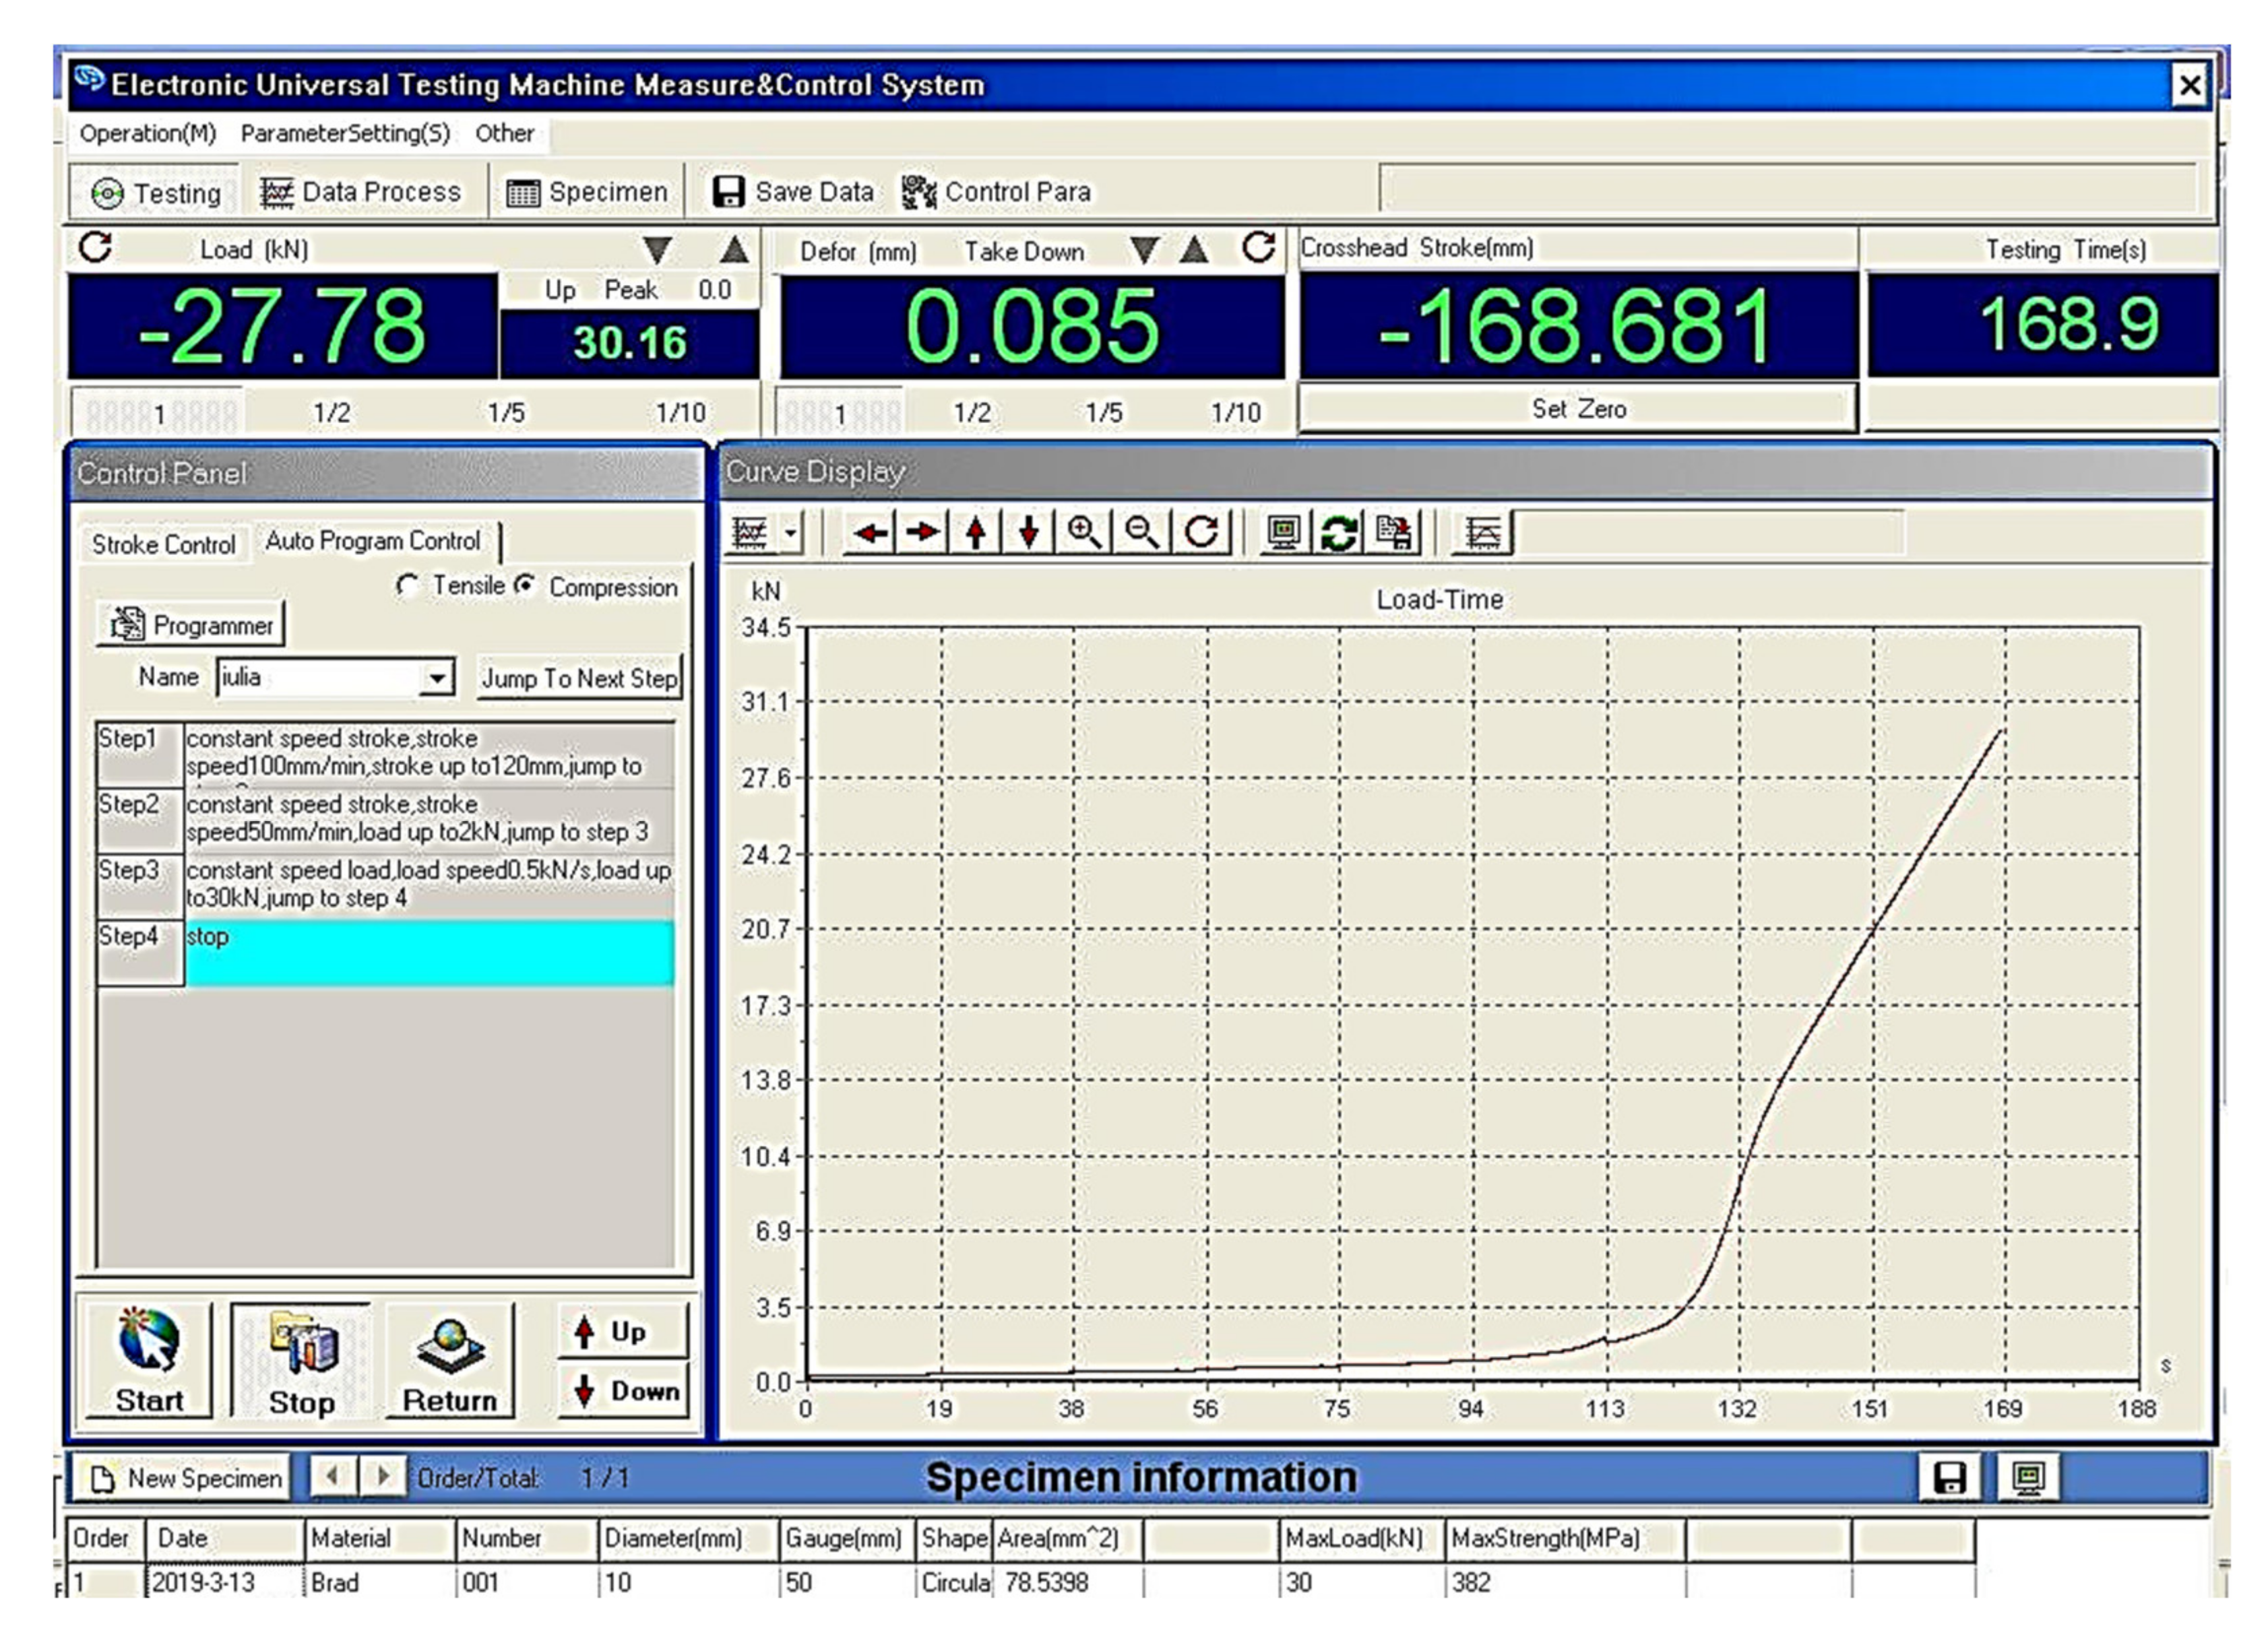
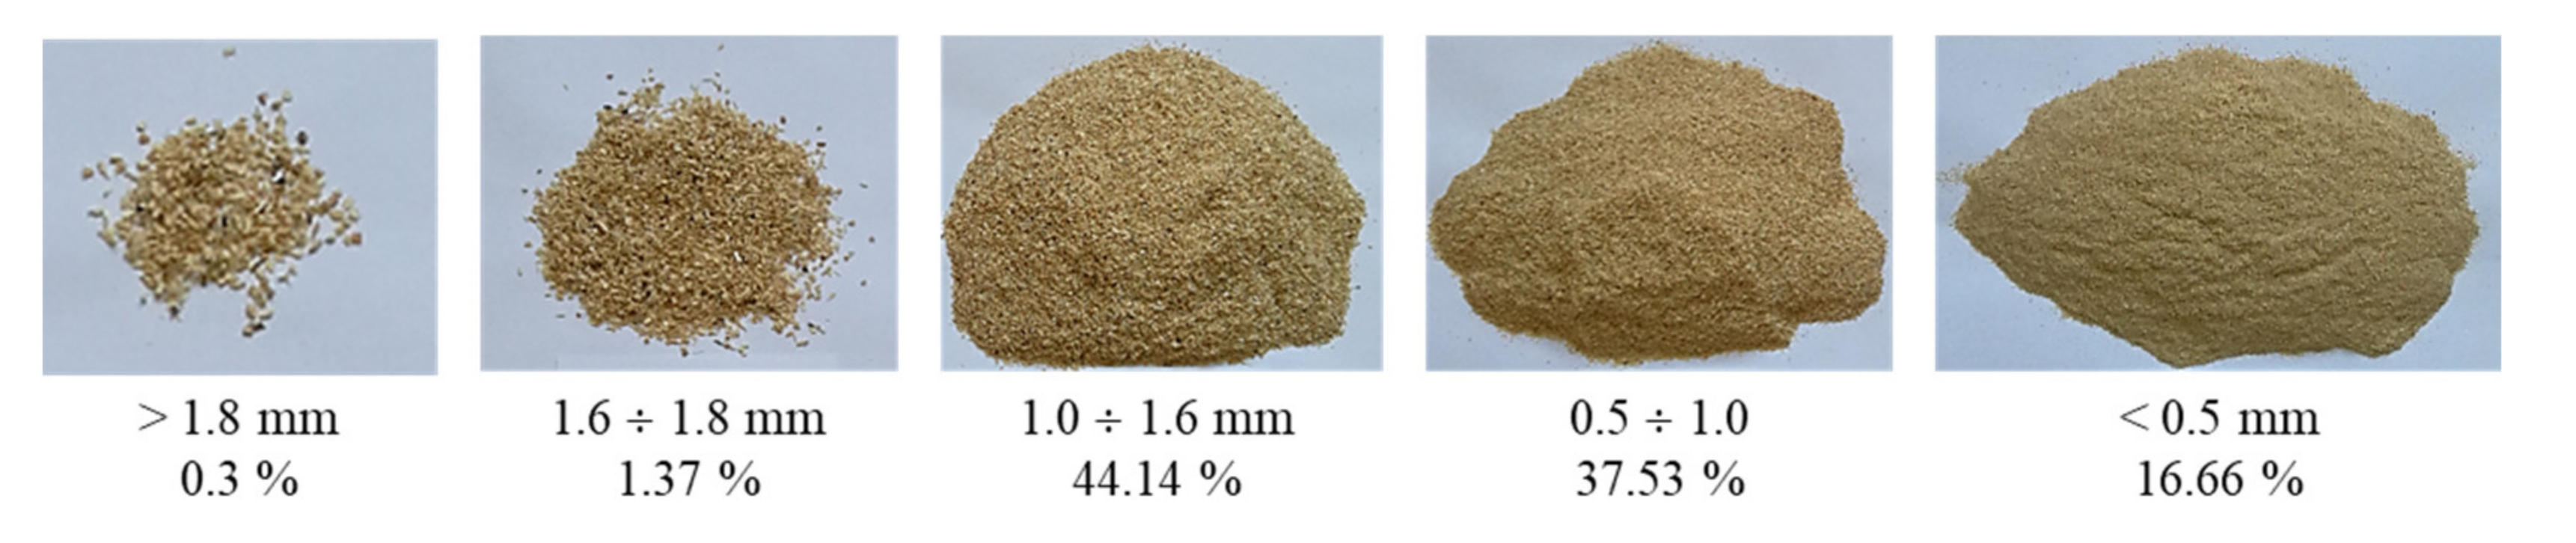
2. Materials and Methods

The theory of dimensional analysis was applied to the study of the process of compressing biomass materials to achieve the mathematical modeling of this process. From the theory of dimensional analysis, the Π theorem, stated by Buckingham, was applied [50].
According to this theorem, the number of independent criteria in the criterion function is given by the difference n-r, where n is the number of variables and dimensional constants and r is the rank of the dimensional matrix, which is equal to the number of fundamental quantities according to which the variables taken for analysis can be expressed. The number of fundamental quantities is relatively small and depends on the complexity of the phenomenon.
From the theoretical research of the biomass powdery materials pelleting process, a number of 7 main parameters influencing the compaction process, presented in Table 1, were considered in the study.
The command parameter die temperature was introduced, and because we wanted to respect the calculation formula dimensionally, we introduced temperature in a non-dimensional factor considering temperature as having an energy nature (the second factor in the right member is exponentiated to the power a). In this manner, a mathematical model was obtained, taking into account the input and command parameters during the pelleting process, given in Formula (1).
ρ p ( ρ 0 , p , U i ) = ρ 0 Q ρ 0 · v 2 · V 0 a p p 0 b U     i c
where:
-
a, b and c are non-dimensional model parameters;
-
p0 is the atmospheric pressure;
-
p is obtained using the force during the compression process and the geometrical characteristics of the die:
P = 4 F m a x π 2
The procedure of mathematical regression was used for determining the values of coefficients a, b and c. Therefore, relation (1) was transformed logarithmically, obtaining the following formula:
l n ρ p = l n ρ 0 + a · l n Q ρ 0 · v 2 · V 0 + b · l n p p 0 + c l n U i
The functional T (a,b,c,ρ0,vi,Vi,θi,p0,pi,ui,ρi) was made as a sum of differences between the values calculated applying Equation (1) and the real values obtained from experiments, all squared, where i is situated in the interval [1, n] and n represents the number of experiments conducted.
T = i = 1 n l n ρ 0 i + a l n Q i ρ 0 i · v i 2 · V 0 i + b l n p i p 0 + c l n U i l n ρ i 2
Partial derivatives were calculated:
T b = 2 i = 1 n ( l n ρ 0 i + a l n Q i ρ 0 i · v i 2 · V 0 i + b · l n p i p 0 + c · l n U i l n ρ i ) · l n Q i ρ 0 i · v i 2 · V 0 i = 0 T b = 2 i = 1 n l n ρ 0 i + a l n Q i ρ 0 i · v i 2 · V 0 i + b · l n p i p o + c · l n U i l n ρ i · l n p i p o = 0 T c = 2 i = 1 n l n ρ 0 i + a l n Q i ρ 0 i · v i 2 · V 0 i + b · l n p i p o + c · l n U i l n ρ i · l n U i = 0
To solve the system numerically, the constants were removed, and the equivalent form was obtained, which can be written as matrix multiplication:
a i = 1 n l n Q ρ 0 i · v 2 · V 0 + i = 1 n l n ρ 0 i · l n Q i ρ 0 i · v i 2 · V 0 i + a i = 1 n l n Q i ρ 0 i · v i 2 · V 0 i 2 + b i = 1 n l n p i p o · l n Q i ρ 0 i · v i 2 · V 0 i + + c i = 1 n l n U i · l n Q i ρ 0 i · v i 2 · V 0 i = i = 1 n l n ρ i · l n Q i ρ 0 i · v i 2 · V 0 i a i = 1 n l n P i P 0 + i = 1 n l n ρ 0 i · l n p i p o + a i = 1 n l n Q i ρ 0 i · v i 2 · V 0 i · l n p i p o + b i = 1 n l n p i p o 2 + + c i = 1 n l n U i · l n p i p o = i = 1 n l n ρ i · l n p i p o a i = 1 n l n U i + i = 1 n l n ρ 0 i · l n U i + a i = 1 n l n Q i ρ 0 i · v i 2 · V 0 i · l n U i + b i = 1 n l n p i p o · l n U i + + c i = 1 n l n U i 2 = i = 1 n l n ρ i · l n U i
where
A = i = 1 n l n P i P 0 2 i = 0 n l n U i l n P i P 0 i = 0 n l n P i P 0 i = 1 n l n U i l n U i P 0 i = 0 n l n U i 2 i = 0 n l n U i i = 1 n l n P i P 0 i = 0 n l n U i i = 0 n 1
B = i = 1 n l n ρ i ρ 0 · l n P i P 0 i = 1 n l n ρ i ρ 0 · l n U i i = 1 n ρ i ρ 0
C = b c k
Vector C, consisting of unknown coefficients, is calculated using experimental data, solving the equation by mathematical regression, in a calculation program (Mathcad), with unknown C:
C = A−1 * B
Two norms were used to measure the error between the calculated and the experimental data:
ε g = i = 1 n ρ p   e x p   i ρ p ( ρ 0 e x p i , P i ) 2   n · ρ p   e x p ¯
and
ε m a x = m a x i = 1 , , n ρ p   e x p   i ρ p ( ρ 0 e x p i , P i ) ρ p   e x p ¯
where εg is the global error, εmax is the maximum error, ρpexpi represents the value of pellets obtained from experiments with the order index i, ρp (ρpexpi, Pi) is the theoretical value of pellet density resulted from experiments with the order index i, ρpexi is the average value of experimental densities row and n is the number of experiments.
The experimental researches were conducted on a specially designed single-pellet device (Figure 1), with two dies, with a pelleting orifice of 8 and 10 mm in diameter.
The pelleting stand was connected to a force machine (Figure 2), that is in turn connected to a computer, thus having the possibility, through the means of specialized software, to vary the pelleting speed and the compaction force.
The software offers the possibility of developing a program for the compression of biomass sawdust by controlling the movement speed of the pelleting piston and the compression force. During each test, the software generates a diagram, Figure 3, representing the curve of applying force relative to time or deformation.
During the biomass pelleting process, a series of input and control parameters of the compaction process were followed, respectively, output parameters of the quality of the finished products.
In order to conduct the experimental researches on biomass pelleting, material consisting of fir tree was used. After grinding the material down to the form of sawdust, it was screened using a Retsch sieving system type AS 200 basic to separate the sawdust by size (sawdust with dimensions <2 mm was used for the experimental research), respectively, to determine the particle size distribution of the material (Figure 4).
The moisture content of sawdust was measured using both a Memmert UFE 500 Model: 100–800 drying stove and a Shimadzu MOC63u thermobalance, obtaining an average value of 12.97%. This value was chosen as the average value of the material moisture content, along with two other values: one lower and one higher, the moisture content values of the material used for experiments being:
-
10% ± 0.1% (by drying the material);
-
13% ± 0,1% (initial moisture content of the material);
-
16% ± 0.1% (by spraying the material with water and leaving for about 30 min to equalize the moisture).
For pellets obtained using the ∅ 10 mm die, a quantity of 2.5 g of sawdust was weighed, and for pellets obtained using the ∅ 8 mm die, 1.65 g of sawdust was weighed, samples being separately placed in a sealed small container to preserve the moisture content.
To measure the energy consumption for each sample, a Chauvin Arnoux C.A. 8334 phase and frequency analyzer was used. The phase and frequency analyzer is connected to the power cable of the force machine and to that of the heating element, and records the energy consumed in the interval from the start to the end of pelleting process.
To perform the experiments, the heating of the die is started and the desired temperature is expected to be reached. The sawdust is introduced in the die using a metal funnel; the piston is positioned inside the orifice, the piston is attached to the pressing head of the force machine and, using the computer software, the biomass pelleting process is initiated. At the same moment of initializing the pelleting process, the phase and frequency analyzer is switched on, measuring the energy consumed for the sample in progress. When the compression force set in the software is reached, the pelleting process finishes, and the analyzer also stops recording, displaying the energy consumed for the completed sample.
The factorial experiment method was used to design the experiments [51]. This method is used to perform the study to optimize the process. An experiment is factorial complete if each level of one factor is combined with each level of the other factors in the experiment, namely, the experimental samples are given by any possible combination of factor levels. Taking into account the fact that there were a number of 4 combined factors (raw material moisture Ui, maximum applied force Fmax, pelleting speed v, die temperature during the process, θ) which each take 3 distinct values (Ui: 10%, 13% and 16%; Fmax: 10 kN, 20 kN and 30 kN; v: 1.3 mm s−1; 2.1 mm s−1; 2.8 mm s−1; θ: 70 °C, 80 °C, 90 °C) and a number of 3 repetitions of the experiment for each possible combination thereof, results in a need for 35 = 243 samples to describe the process using each of the two pelleting dies of the single pellet device.

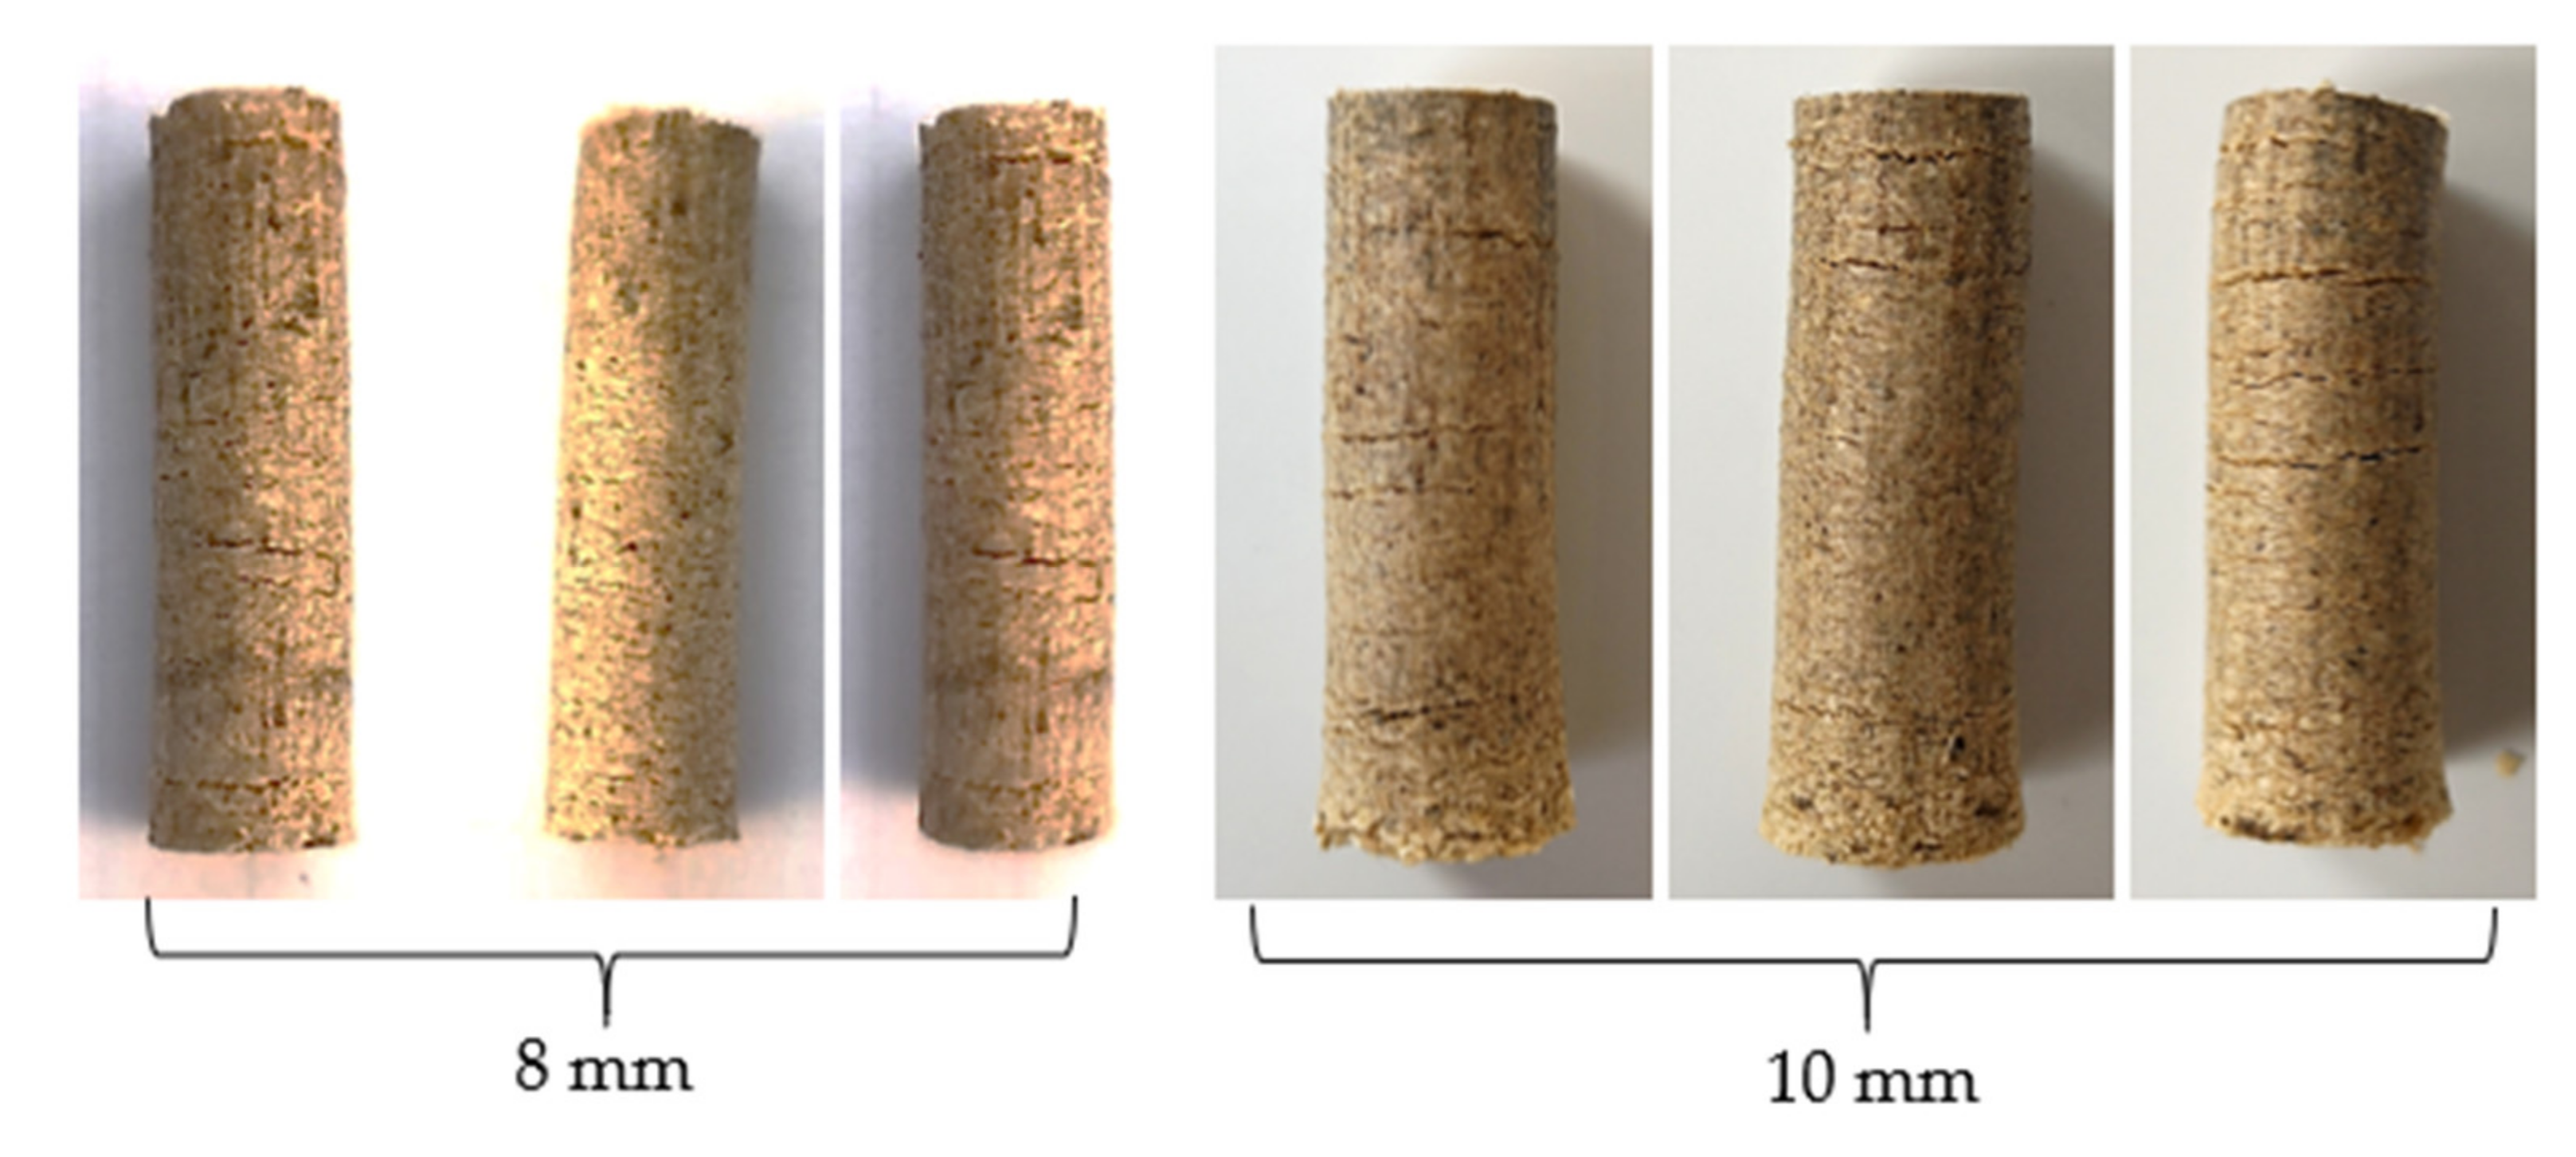
3. Results and Discussion

After performing the experimental researches, a number of 243 pellets were obtained for each die used, Figure 5, for which a series of parameters were recorded, which are synthetically presented in Table 2 and Table 3.
Each sample obtained was allowed to reach room temperature, after which the length was recorded, then the volume and density were calculated. The samples were placed individually in bags inscribed with the number of the sample and the parameters used during the process, to maintain the moisture recorded at the time of obtaining them, moisture which was calculated by drying the samples in the oven.
For determining individual pellet density, each sample was first weighed using a Shimadzu MOC63u analytical balance; then, the diameter was measured in three points (at each of the pellet ends and in the middle) using electronic calipers. The average diameter was calculated for each sample, followed by a measurement of pellet length. After determining the diameter and length, the volume of the pellet was calculated using the formula for cylinder volume (π r2 h). Pellet density was calculated as the ratio between pellet mass and its volume.
For each die, the values of model parameters were obtained by applying the least-squares method for all 243 experiments, for the parameters involved in relation (1):
∅ 8 mm die: a = 0.094; b = 0.13; c = −0445
∅ 10 mm die: a = 0.097; b = 0.133; c = −0514
By replacing the values of the model parameters in relation (1), we obtained:
  8   mm   die :   ρ p ( ρ 0 , p , U i ) = ρ 0 Q ρ 0 · v 2 · V 0 0.094 p i p 0 0.13 U   i   0.445
  10   mm   die :   ρ p ( ρ 0 , p , U i ) = ρ 0 Q ρ 0 · v 2 · V 0 0.097 p i p 0 0.133 U   i   0.514 .
Figure 6 and Figure 7 present the graphical comparisons between the calculated and the experimental data for the two dies used.
The graphical representation of the dependence of the pellet density on the initial sawdust moisture and on the die temperature during the process is given in Figure 8.
The diagram shows that as the initial material moisture increases, the density of the pellets decreases regardless of the value of the temperature reached inside the pelleting die. The maximum obtained density of the pellets is obtained for values of the material moisture of 10% and for values of 90 °C for the temperature.
The precision estimators were calculated for the dependency law, determined using the method described in relations (11) and (12), obtaining the following results:
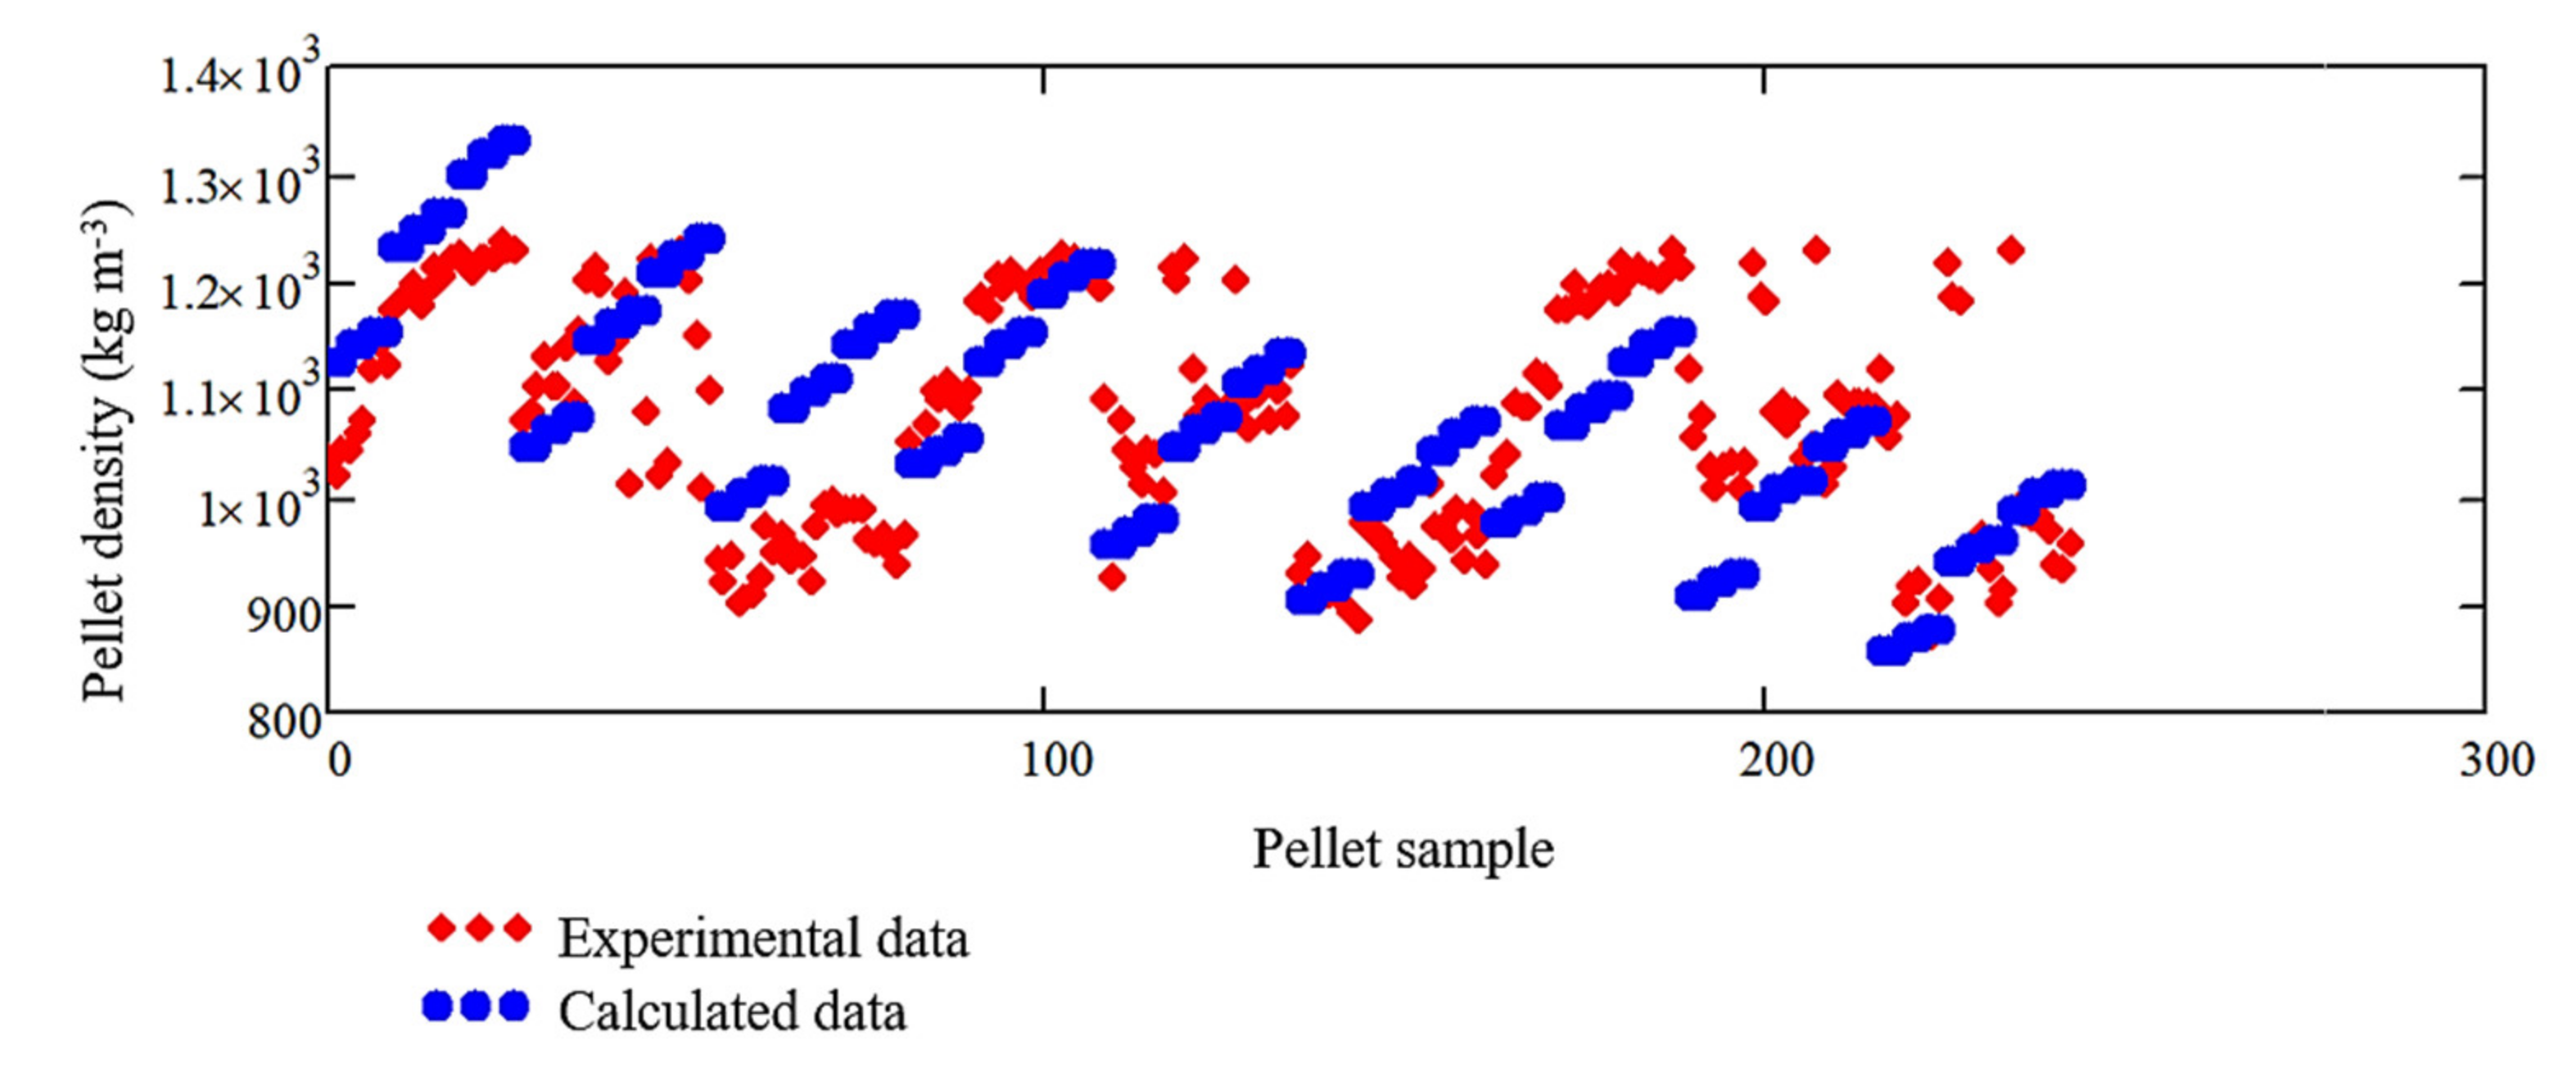
  • 8 mm die: εg = 0.005714 and εmax = 0.26034853.
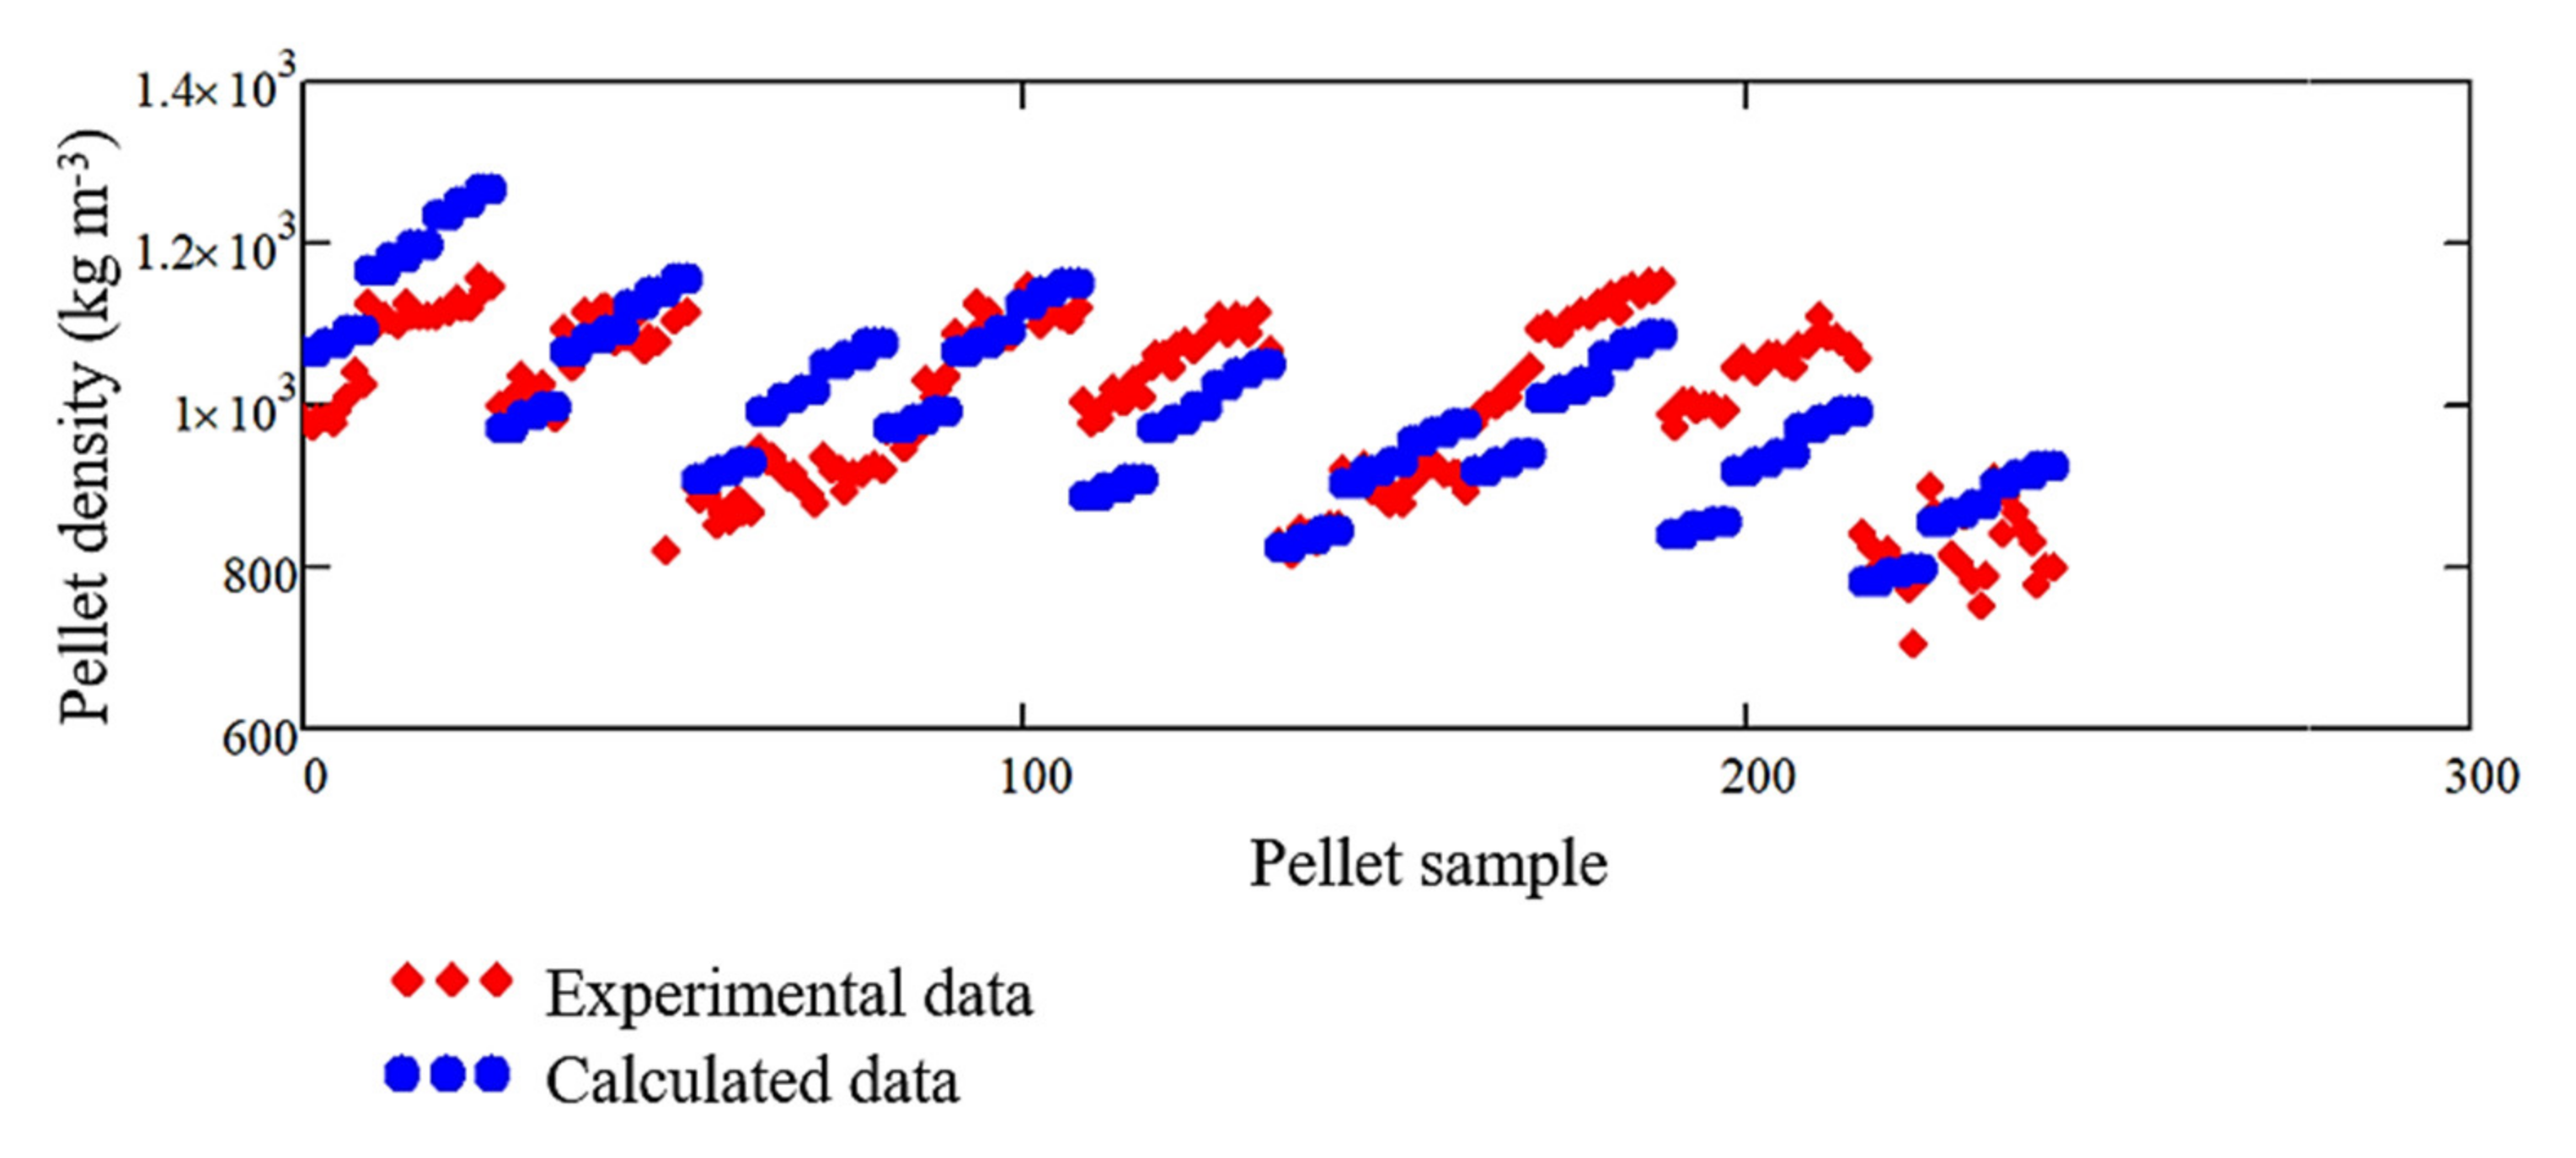
  • 10 mm die: εg = 0.005267 and εmax = 0.32460689.
The dependence of pellet density on the considered process parameters does not present considerable critical points, but intermediate optimum points have been identified. The only extreme points are on the boundaries of the field of definition considered experimentally.
In order to develop a series of empirical relations between the parameters of the pelleting process, the statistical analysis of the experimental data is essential. Initially, the elementary statistical analysis is performed (for the values of the main estimators of the parameters involved in the process and the correlations between them) and the higher-level statistical analysis is based on the data from the first stage, followed by the interpolation of the experimental data. The values of the main statistical estimators of the process parameters are presented in Table 4 for the 8 mm die.
The values of the correlation between the parameters involved in the process (parameters are given in Table 5).
A high value of correlation was between: the density of the raw material and its moisture content; the density of the raw material and the initial moisture content of pellets obtained; the initial material moisture content and the initial pellet moisture content; the volume and length of the pellets; the initial volume of pellets and their length or moisture content. Intense negative correlations were found between: raw material density and pellet density; the volume, length and moisture content of pellets and their initial density; pellet density and pellet moisture.
Figure 9, Figure 10, Figure 11 and Figure 12 presented the comparative results obtained after determining the density of pellets immediately after exiting the die, for the two dies used (8 and 10 mm), depending on the parameters varied.
Pellet density increased from the highest moisture content of the material (16%) to the lowest (10%). For all three moistures used, the density was higher in the case of the 8 mm die compared to that which was 10 mm.
Depending on the pelleting force, the density increases when increasing the compression force in the case of both dies. On average, the density has higher values for the pellets obtained with the 8 mm die compared to the 10 mm one.
Depending on the pelleting speed, on average, the density decreases from the lowest pelleting speed (1.3 mm s−1) to the highest (2.8 mm s−1) for both dies; the highest values are obtained for the speed of 1.3 mm s−1 and the lowest for the speed of 2.1 mm s−1.
Depending on the pelleting temperature, on average, the density does not show important changes between the three temperatures used, but a higher density was recorded in the case of 8 mm pellets.
The energy consumed to obtain a pellet had the lowest values for 16% material moisture, with an average of 4.98 Wh for the 8 mm die and 5.05 for the 10 mm die. The values of the consumed energy have higher values for 13% and 10% material moisture, reaching an average of 6.51 Wh in the case of the 8 mm die and 6.25 Wh in the case of the 10 mm die at 10% material moisture. A decrease in energy consumption when increasing moisture was also observed by other researchers [15,17,52,53].
Depending on the temperature of the die during the process, the energy consumed had the lowest values at 90 °C, intermediate values at 80 °C and the highest values at 70 °C. From the analysis of the experimental data, it was observed that the energy consumed has higher values for the 10 mm die than for the 8 mm die for all three temperatures.
It is also found that the energy consumed is in a close correlation with the compaction force, registering the lowest values for 10 kN force and the highest for 30 kN force.
The temperature of 90 °C has proven to be the most indicated one, because it led on average to a lower energy consumption and to denser and well-bound pellets, this being in agreement with other researches [16,24,43,54].
Based on the results obtained from experiments, correlations were made between the quality of products obtained, translated into pellet density and the input and control parameters.
Figure 13, Figure 14 and Figure 15 graphically show the results obtained for density with the variation of the compaction force while maintaining the other parameters constant for the three pelleting speeds used.
As it can be seen from Figure 13, in the case of a 1.3 mm/s pelleting speed, a strong correlation of the density obtained with the compaction force can be observed in the case of the initial material moisture content of 10% for both pelleting dies, the correlation decreasing for the middle and maximum moisture contents used for both dies. In the case of the 8 mm die and a 13% material moisture, there was no correlation between the density of pellets and the process parameter.
Overall, a better correlation was registered for the results obtained with the 10 mm pelleting die.
As it can be observed from Figure 14, the strongest correlation was obtained for the 10% initial material moisture content for both pelleting dies, decreasing for the other two, the lowest being recorded for the 13% initial moisture content for the 10 mm die and for the 16% moisture content for the 8 mm pelleting die.
For the pelleting speed of 2.8 mm s−1, similar to the other two speeds, a very strong correlation was obtained for the 10% material moisture content, but in this case, better overall correlations were obtained for the 8 mm die.
Figure 16, Figure 17 and Figure 18 graphically show the results obtained for density with the variation of the compaction force while maintaining the other parameters constant for the three pelleting temperatures used.
From Figure 16, for a temperature of 70 °C and a pelleting speed of 2.8 mm s−1, for the 10 mm die, a strong correlation of the density obtained with the compaction force can be observed in the case of 10% moisture content, a good correlation for the initial moisture content of 13% and a low correlation in the case of 16% moisture content. For the 8 mm die, the results show the best correlation in the case of 16% moisture content and low correlations for the other two moisture contents.
From the figure above, in the conditions of using the temperature of 80 °C, for the 10 mm die, a strong correlation of the density obtained with the compaction force can be observed for initial moisture content of 10%, a good correlation for 13% and a low correlation for 16%. For the 8 mm die, the results show the best correlation in the case of 16% moisture content and lower correlations for the other two moisture contents. Additionally, a better correlation is observed in the case of the temperature of 80 °C than in the case of the temperature of 70 °C.
In the case of the temperature of 90 °C, a very good correlation of the density obtained with the compaction force is observed for both the 8 mm and the 10 mm die, for the raw material moisture of 10%, good correlations for the moisture of 13% and in the case of 16% moisture, a good correlation only in the case of the 8 mm die.
We considered that the value 1 for R2 would represent a perfect correlation between variables; a value higher than 0.7 but lower than 1 signifies a strong dependency between the parameters, a value between 0.5 and 0.7 is a moderate dependency, a value between 0.3 and 0.5 signifies a low correlation and a value of situated between 0 and 0.3 is interpreted as nonsignificant dependencies between the variables.

4. Conclusions

The dependency law presented in this paper validated with the experimental data obtained from pelleting fir sawdust is linear in terms of raw material density. This means that pellet density depends linearly on the density and the volume of the fir sawdust introduced in the pelleting process. Pellet density depends nonlinearly on pressure and implicitly on the maximum force used during the pelleting process.
The pellet density dependence model of the proposed process parameters shows that:
-
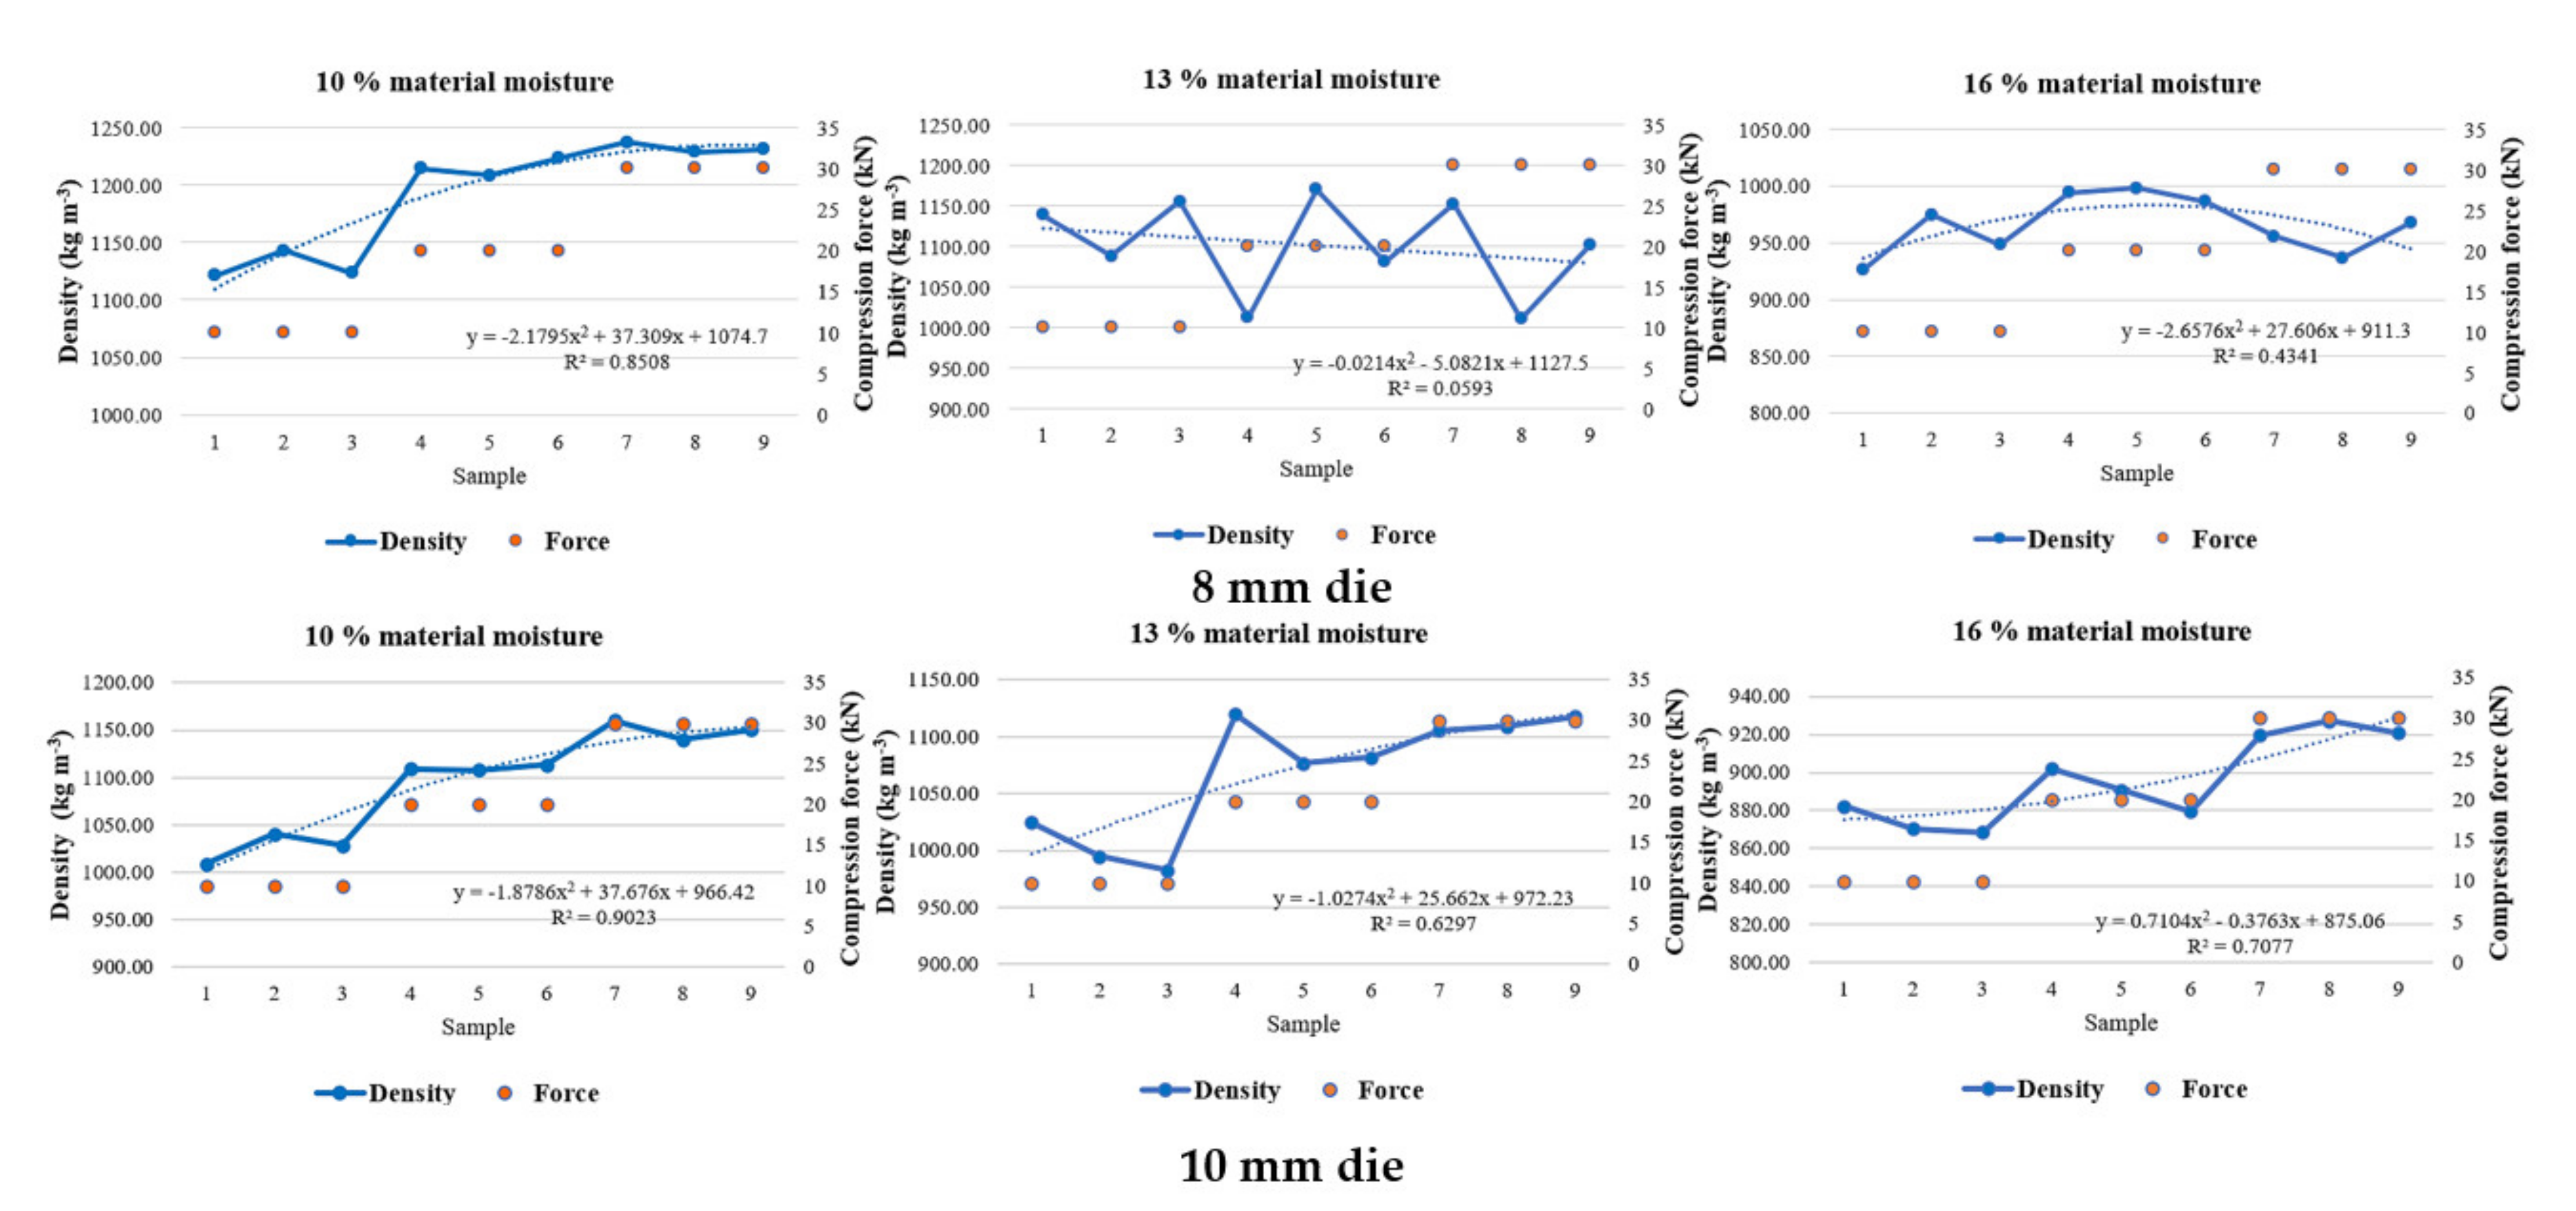
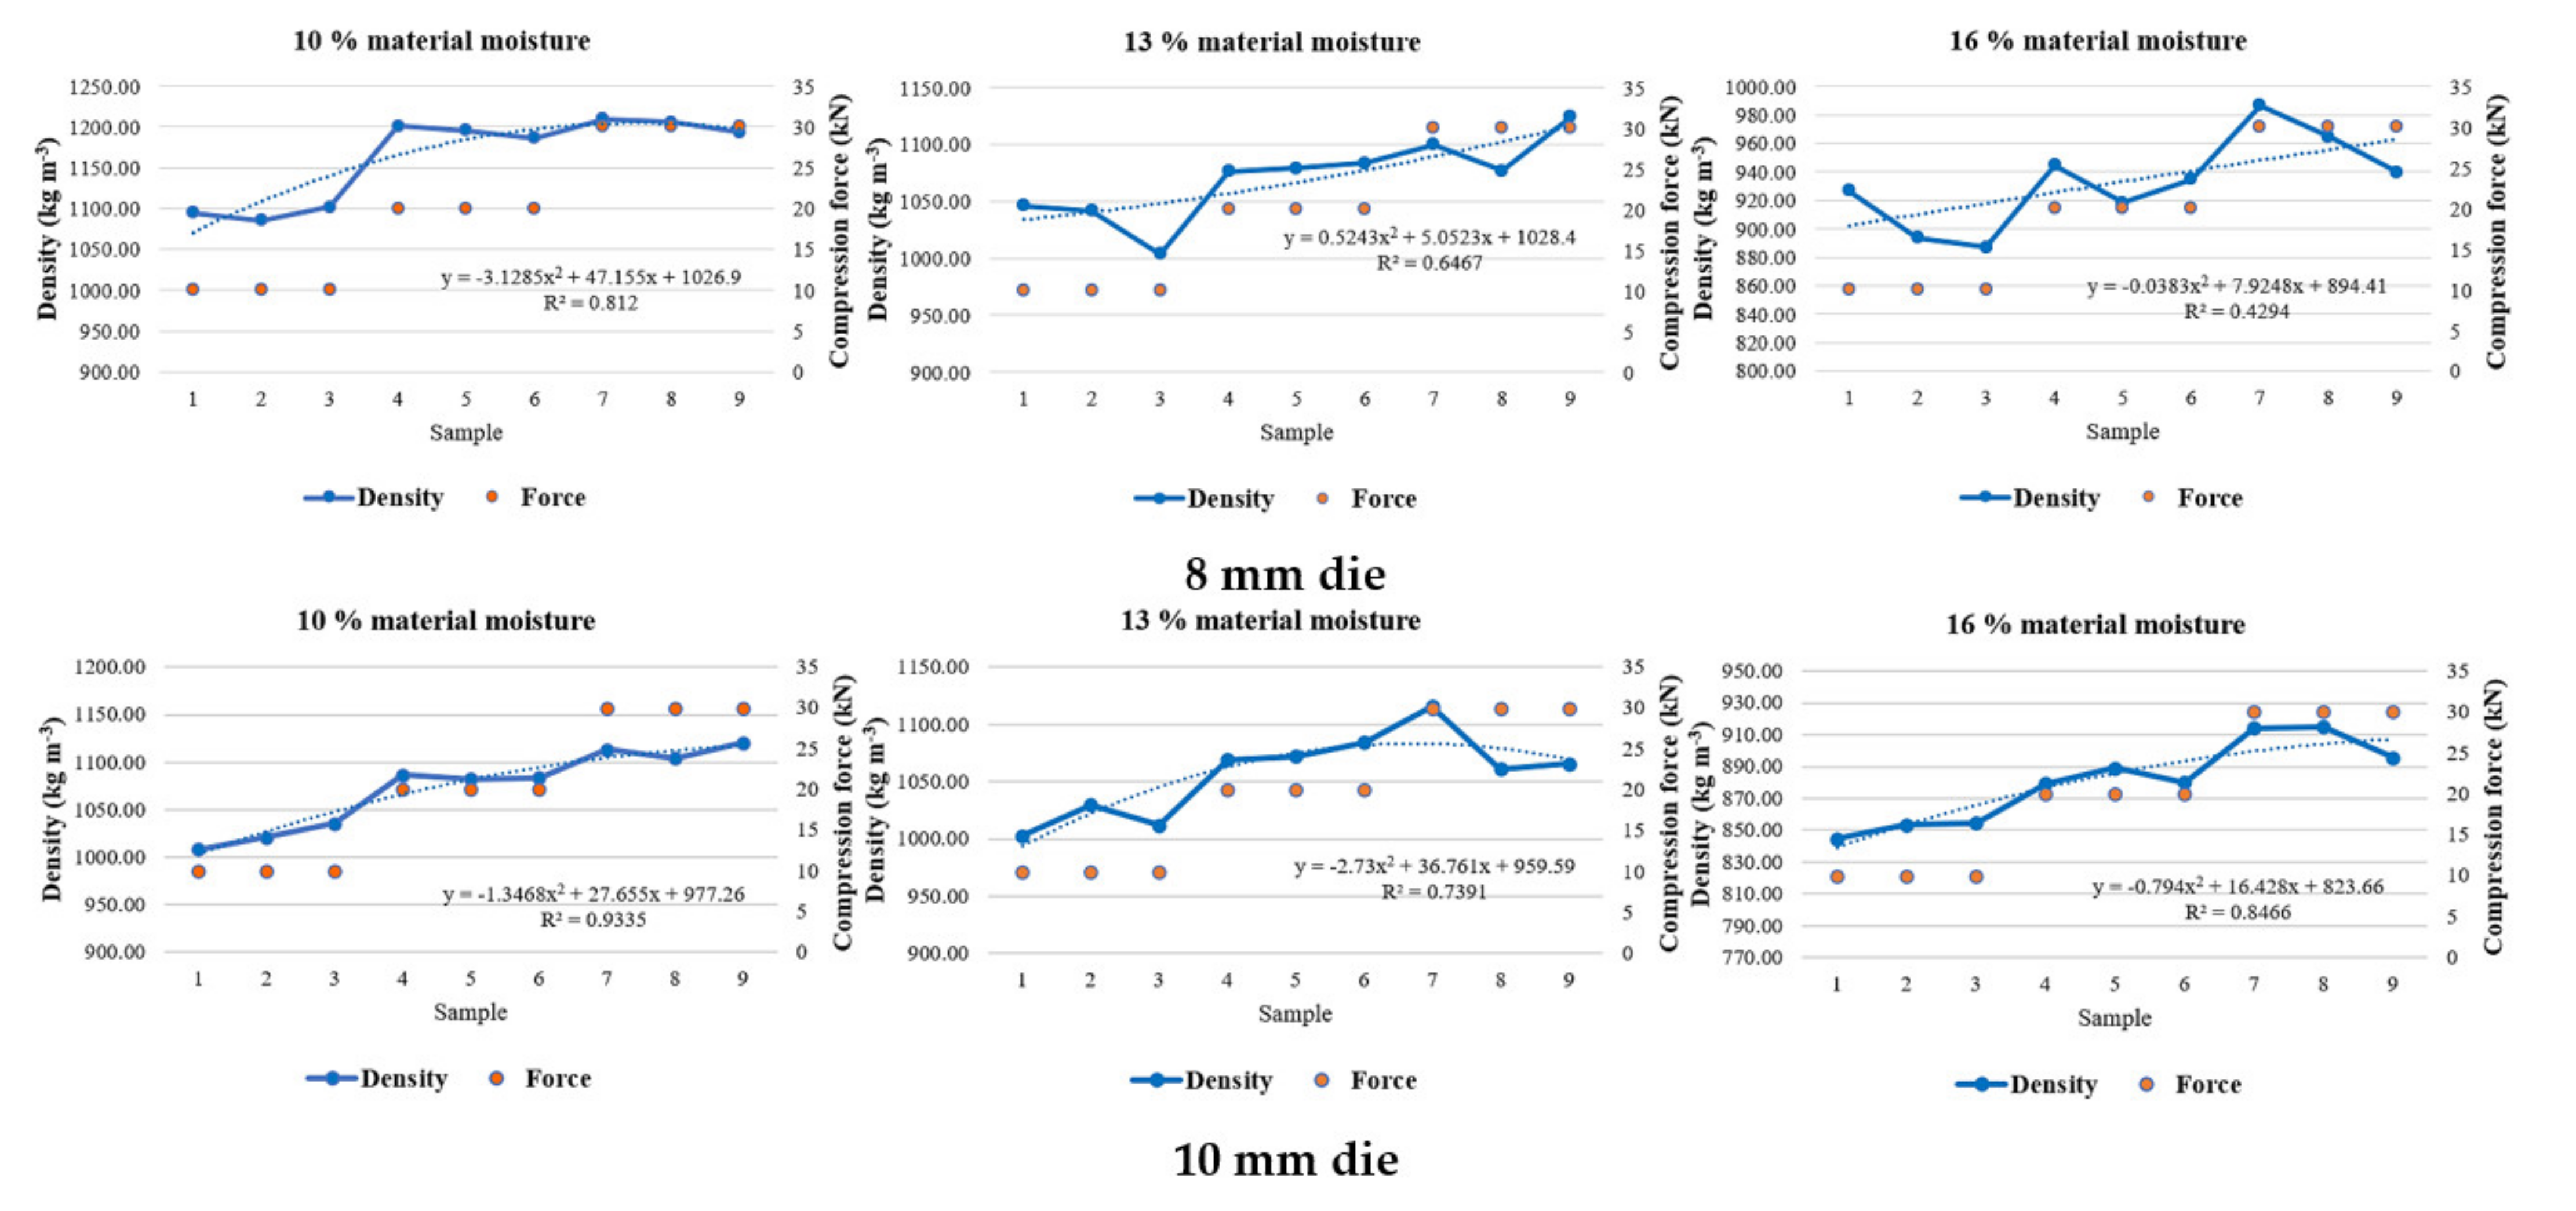
The density of pellets increases (nonlinearly) with the maximum pelleting pressure (implicitly with the maximum force reached);
-
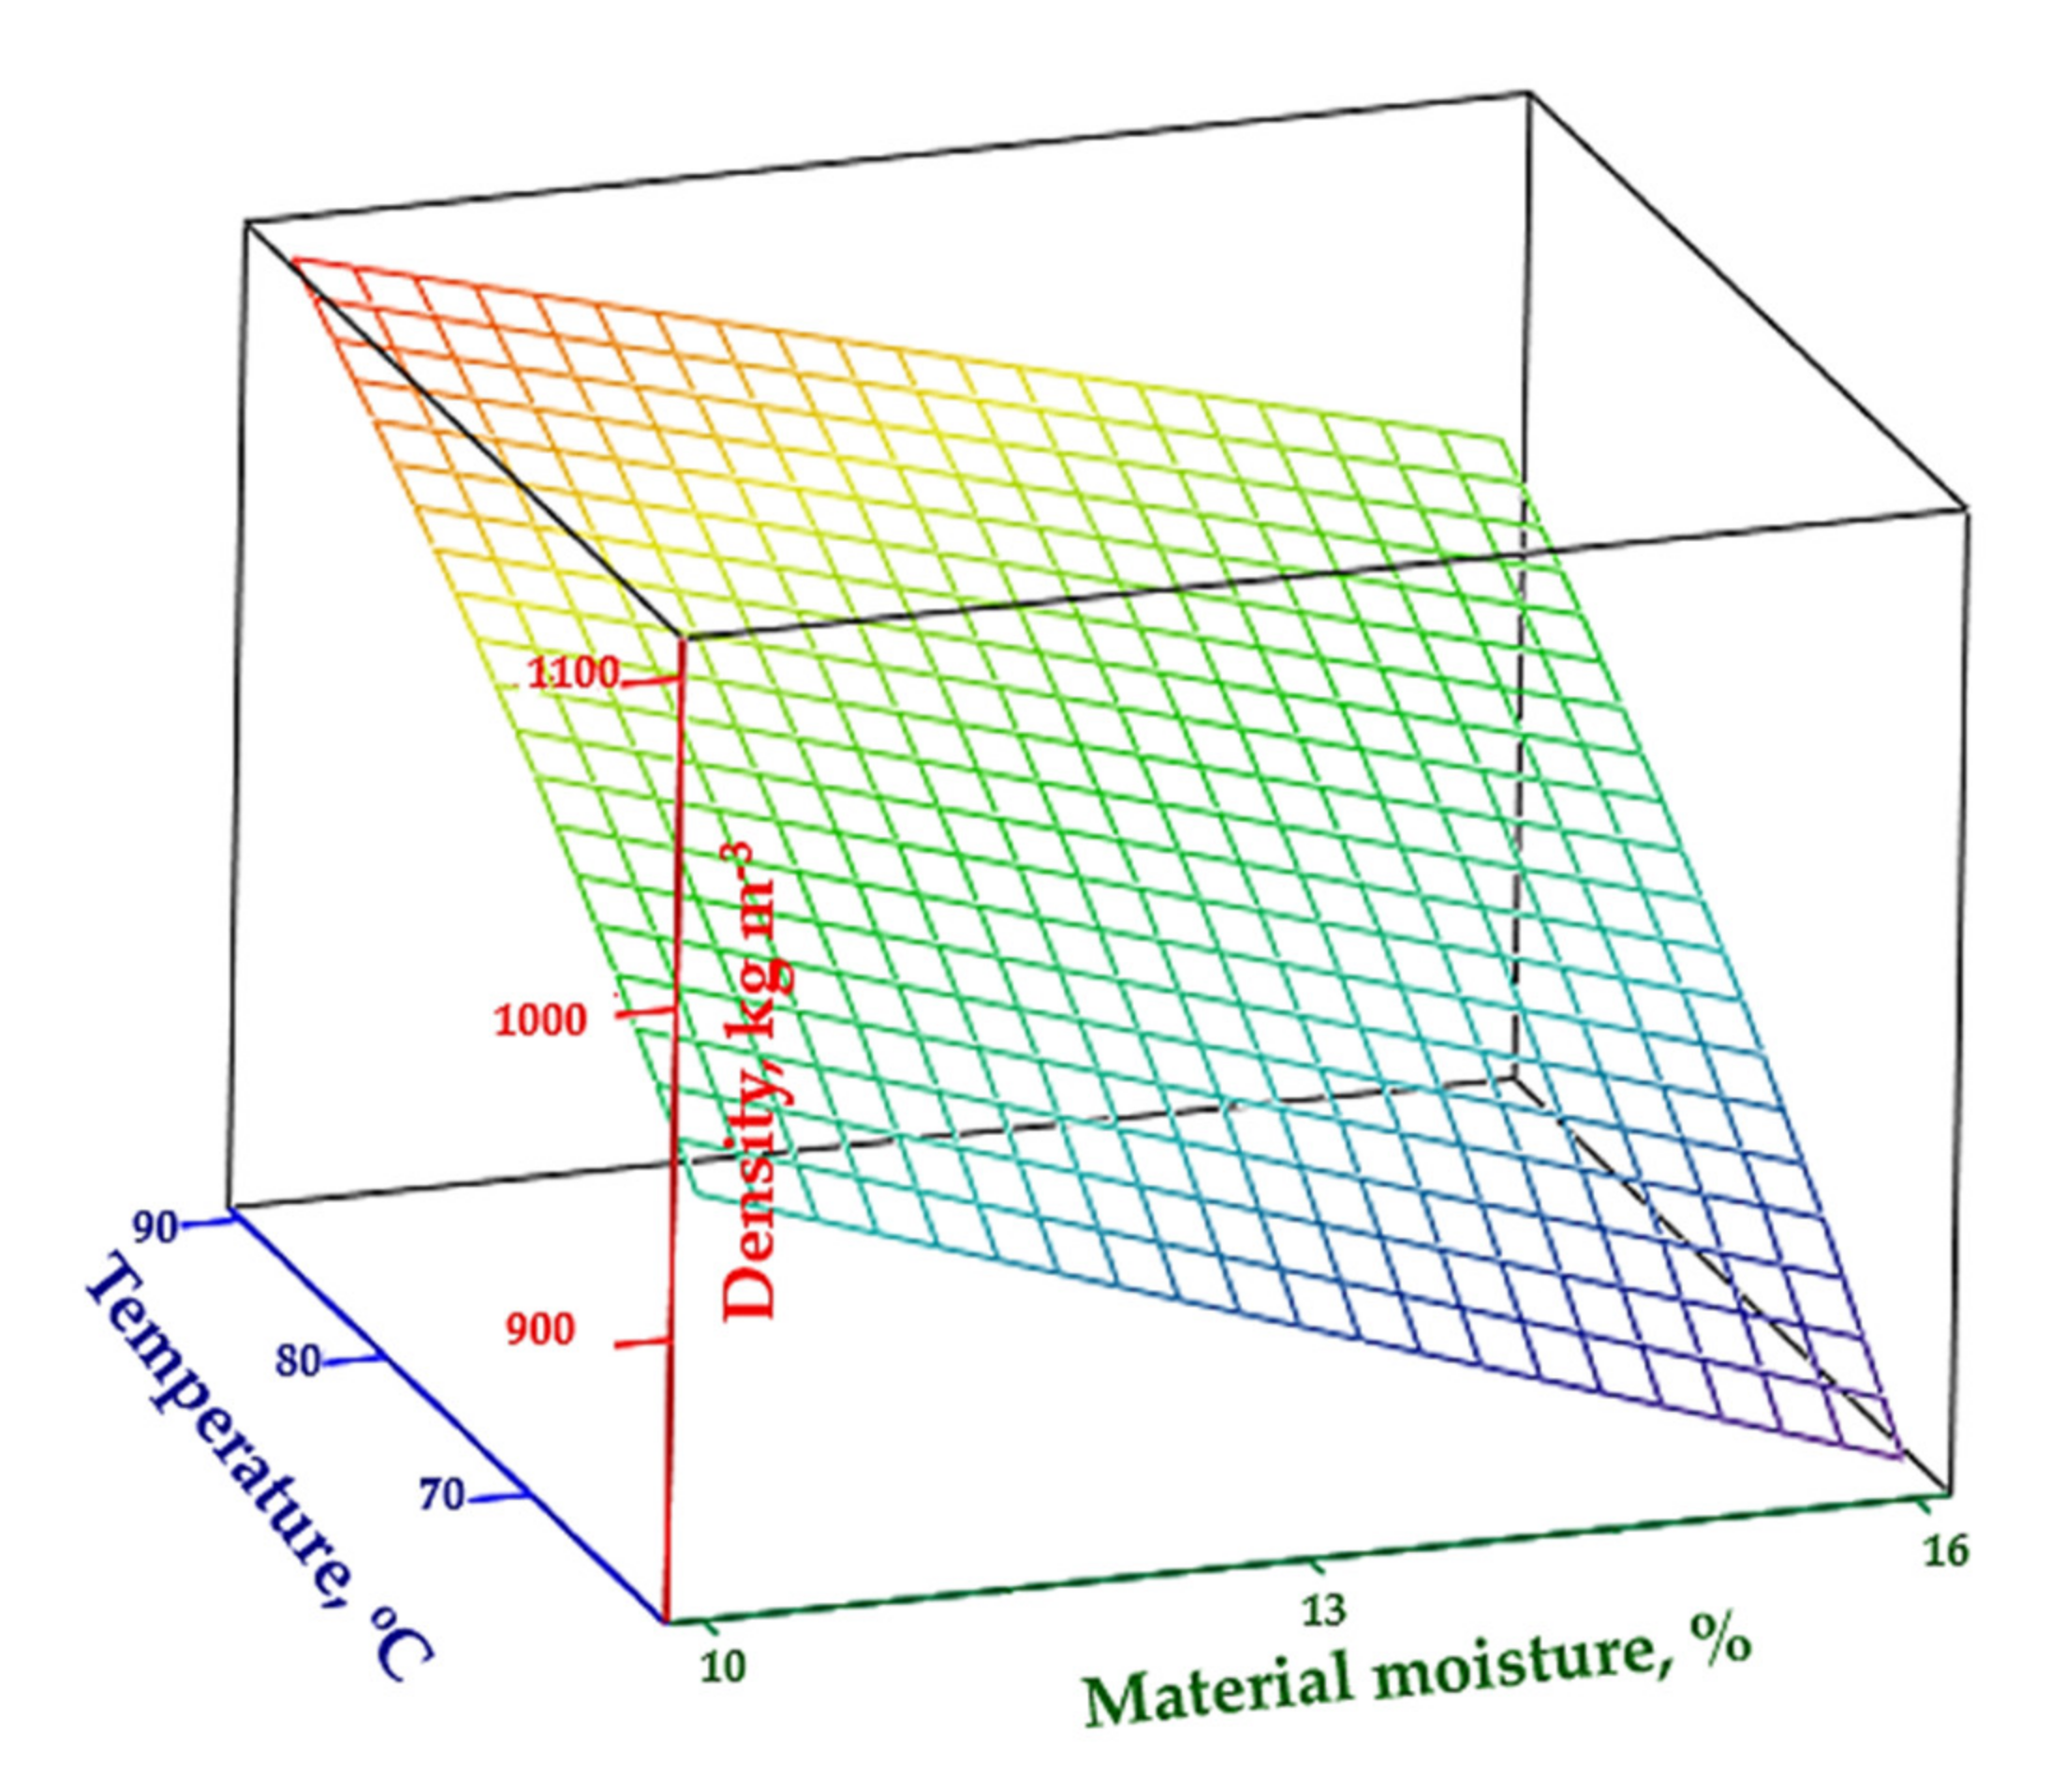
The density of pellets decreases nonlinearly with the increase of the moisture content of the raw material introduced in the pelleting process;
-
The density of pellets increases with the increase of the energetic factor, which means that it increases with the temperature, but decreases with the pelleting speed and with the initial volume of material introduced in the pelleting die.
The correlations between the parameters of the working process give a series of definite information about the intensity of the connection between the different variables that describe the process of compressing biomass powders. Intense connections are noticed between the density of pellets and the compaction force (and implicitly the pressure) for both, the moisture content of the raw material.
Following the analysis of the experimental results, it was found that:
-
On average, the energy consumed for the production of a pellet sample was higher for the 10 mm die than for the 8 mm for the initial moisture content of 10% and 16%, and lower for the initial moisture of 13%;
-
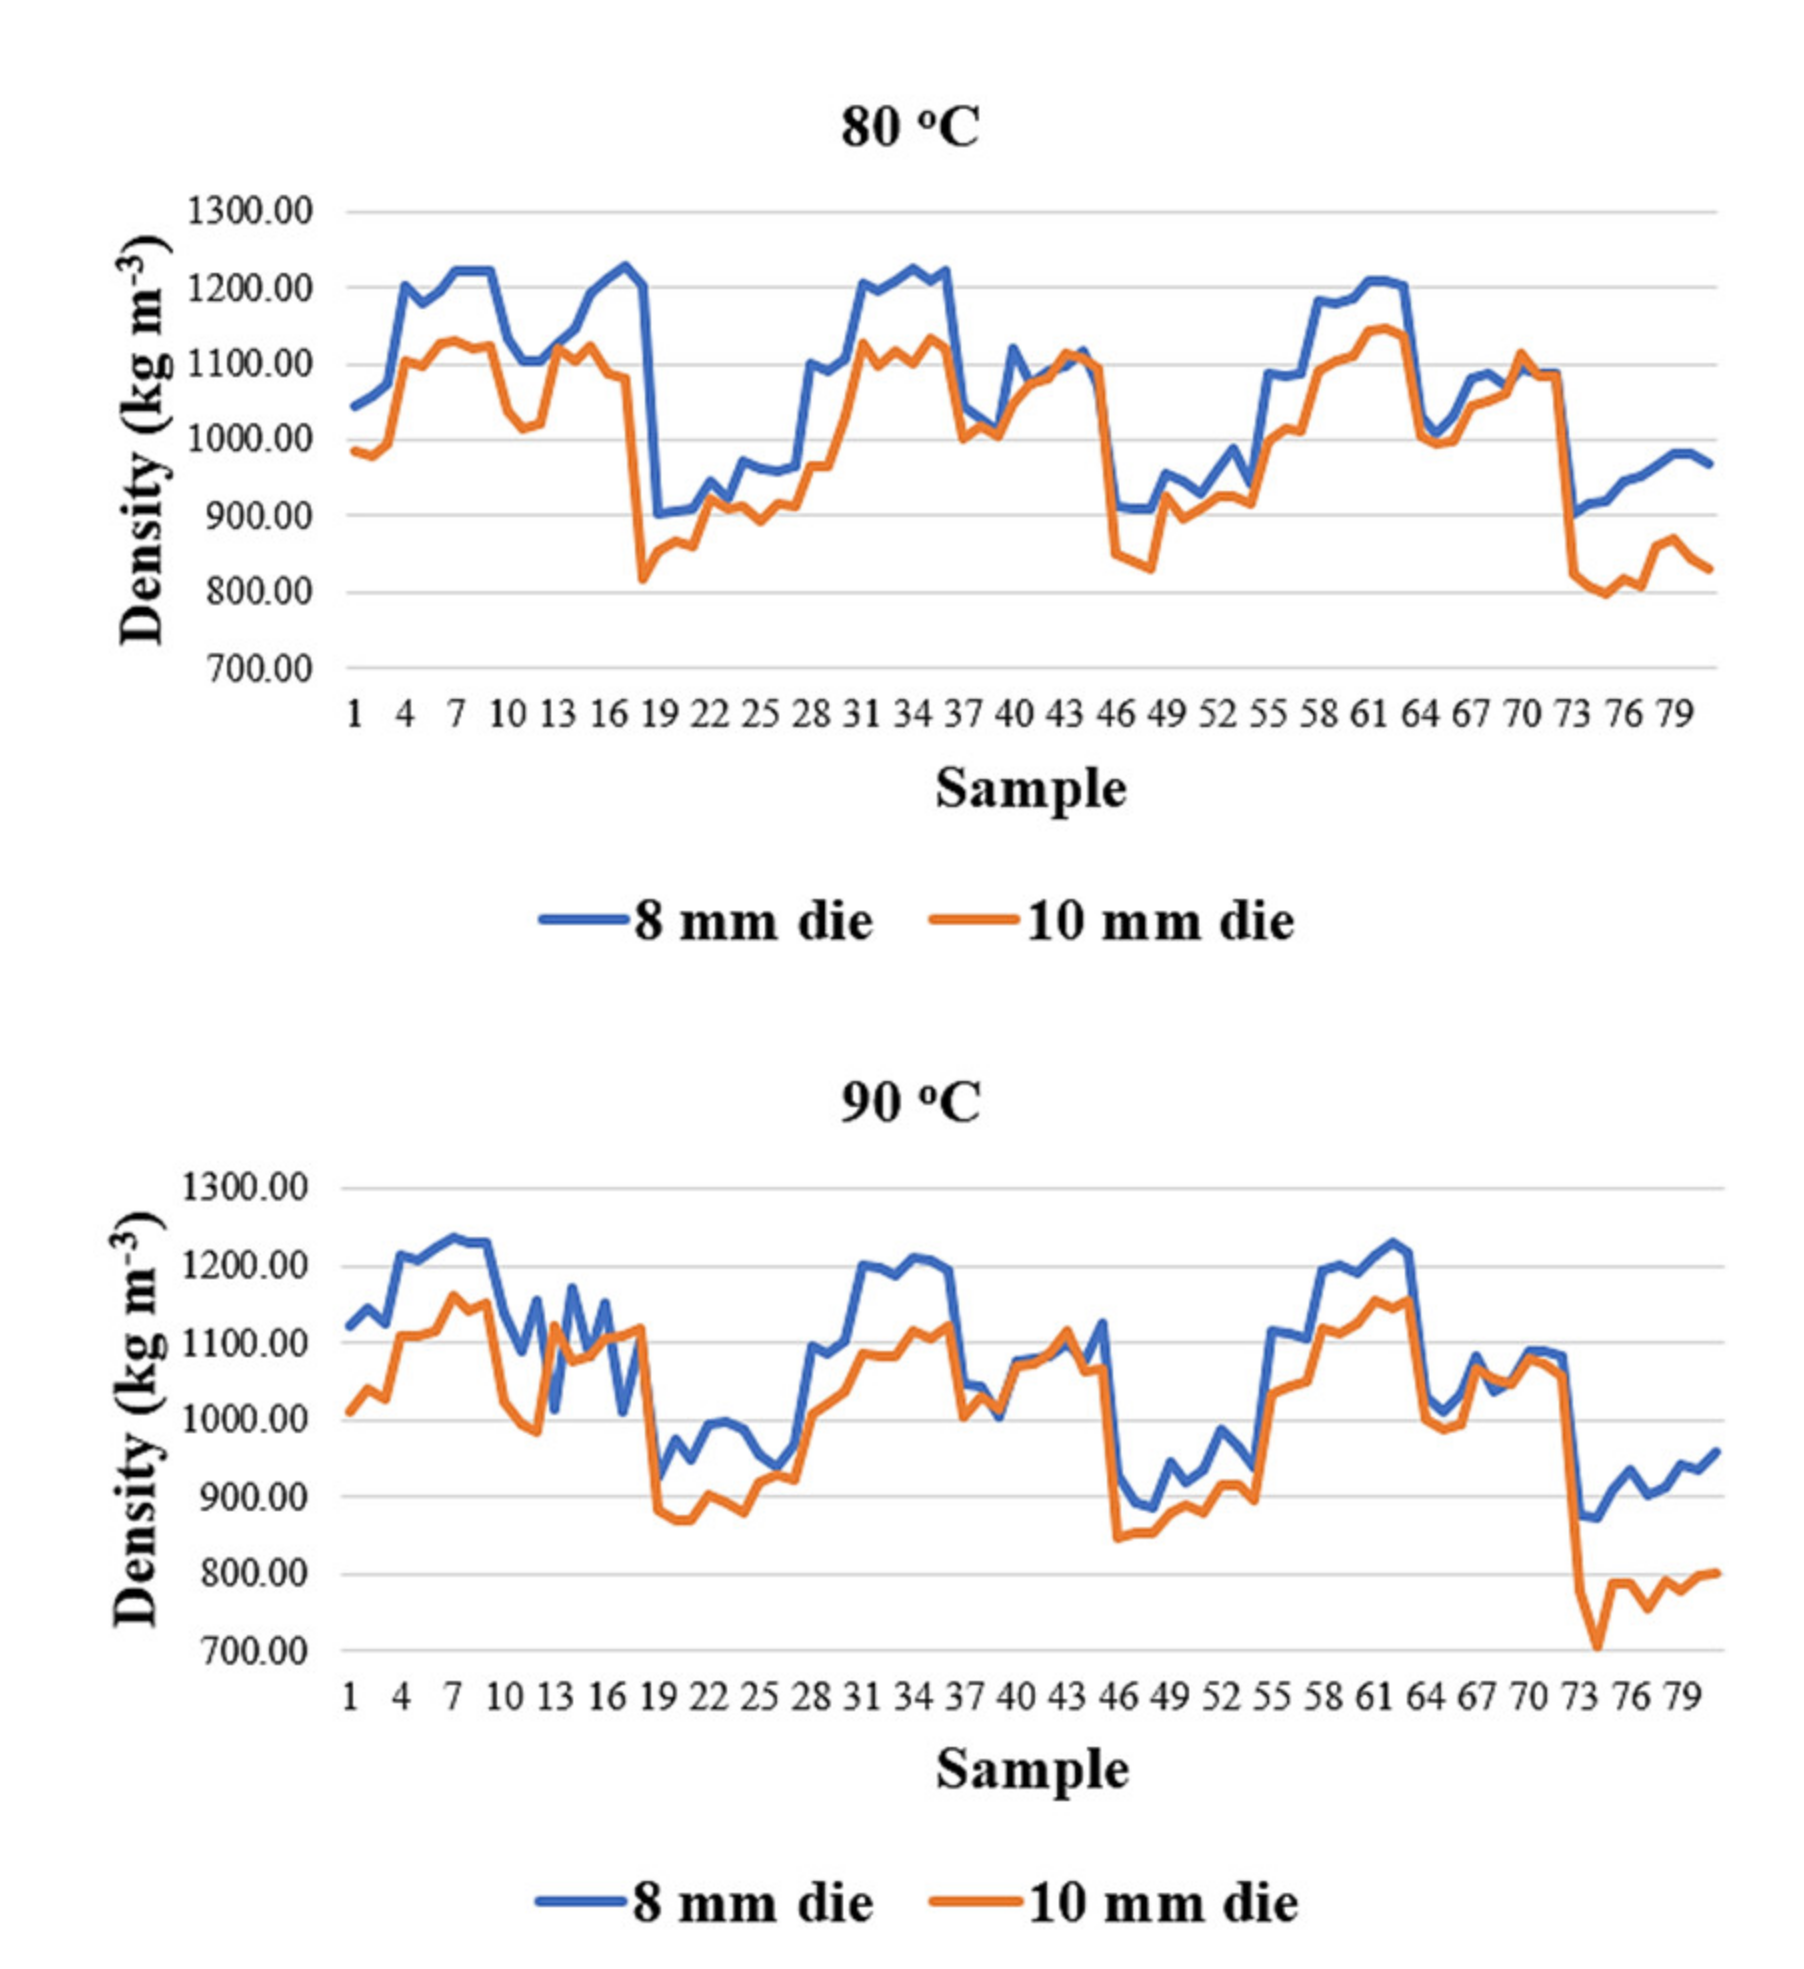
Under the same production conditions, pellets obtained using the 8 mm die had a higher moisture content than the ones obtained using the 10 mm die;
-
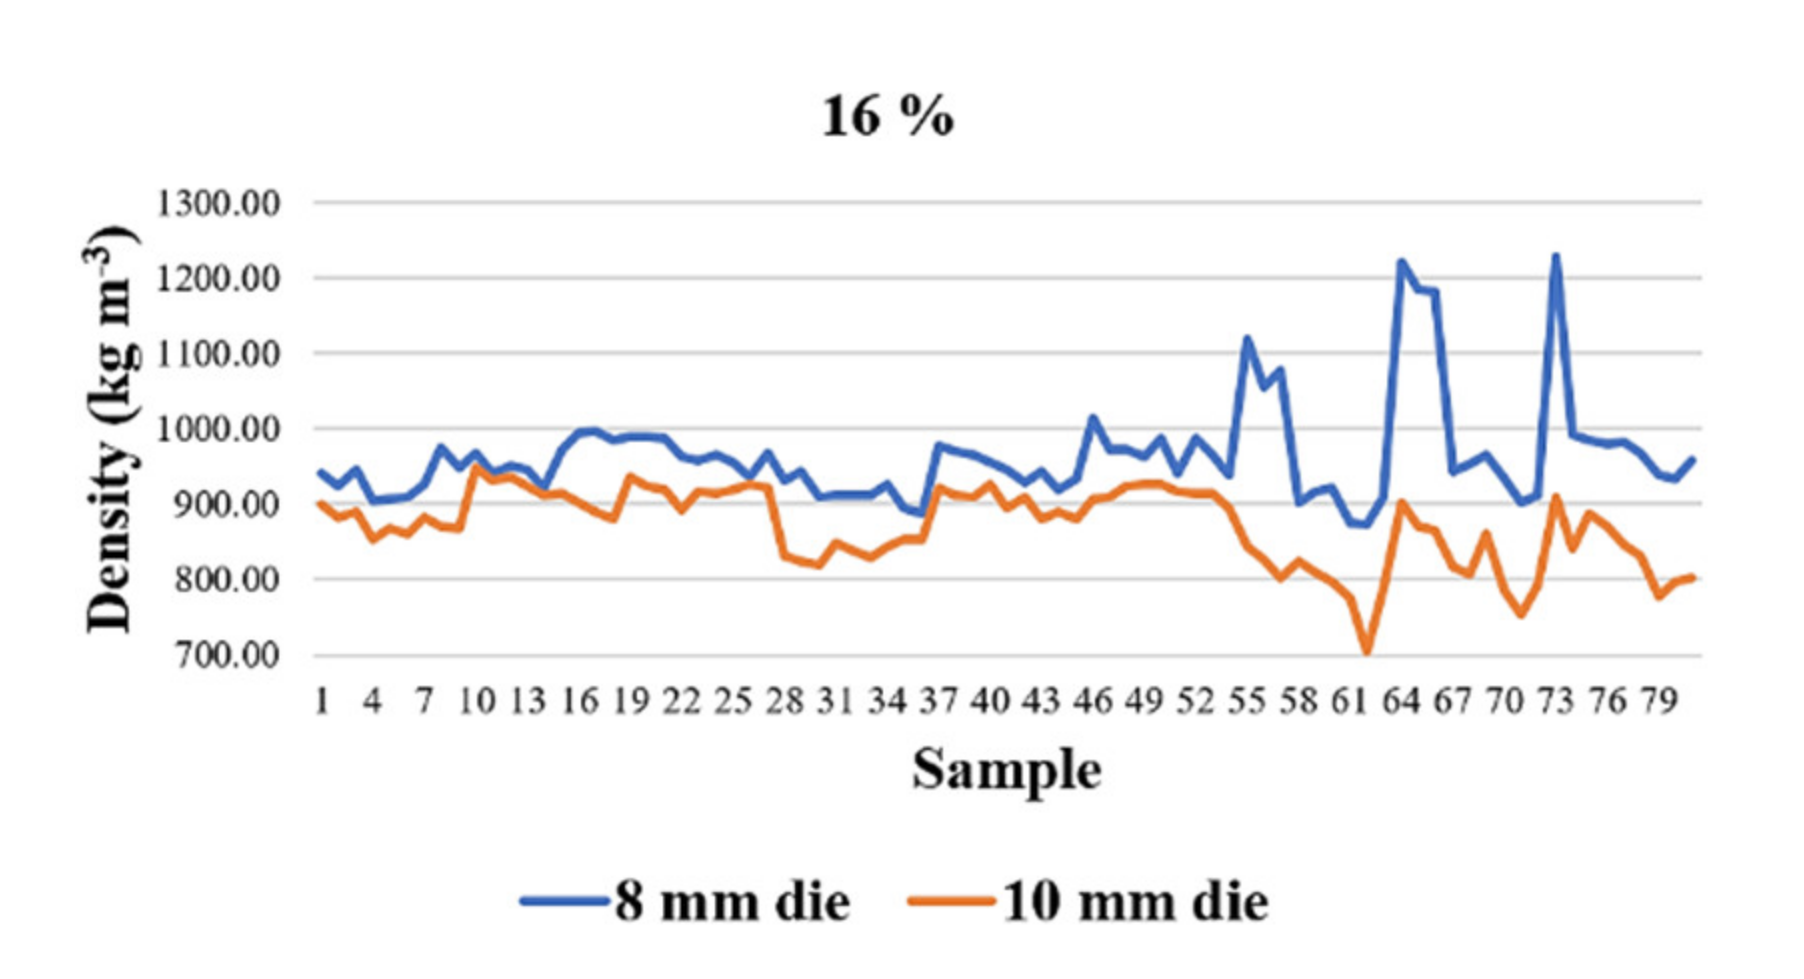
Pellets obtained with the 8 mm die had a total density higher than those obtained with the 10 mm die, the average density of the 8 mm pellets being 1075.22 kg m−3 and that of the 10 mm pellets being 999.66 kg m−3;
-
the greatest influence on the average density of pellets was that of the initial moisture content of the material; on average, the density increasing from 964.30 kg m−3 (8 mm die) and 870.10 kg m−3 (10 mm die) for the 16% material moisture content to 1099.54 kg m−3 (8 mm die) and 1051.16 kg m−3 (10 mm die) at a 13% material moisture content, reaching 1161.83 kg m−3 (8 mm die) and 1077.73 kg m−3 (10 mm die) for the 10% material moisture content.
Overall, the research showed that, using the same type of material, with the same dimensions and moisture content, at the same pelleting speeds and temperatures, applying the same compaction forces, which translates into different pressures in the pelleting die, similar quality pellets were obtained for both dies (8 mm and 10 mm in diameter), showing that increasing the compaction force for the 10 mm die, leading to pressures similar to the 8 mm die, would lead to a further increase in energy consumption that would not be justified by the improvement of overall quality, represented mainly by density.

Author Contributions

Conceptualization, I.G., D.C. and N.U.; methodology, I.G., P.C. and C.P.; software, M.M.; validation, S.B., V.V. and I.V.; formal analysis, S.B., P.T. and C.P.; investigation, I.G., D.C. and C.P.; resources, N.U.; data curation, P.C.; writing—original draft preparation, V.V., I.V. and M.M.; writing—review and editing, C.P. and P.T.; supervision, I.G., D.C. and N.U. All authors have read and agreed to the published version of the manuscript.

Funding

The APC was funded by the University Politehnica of Bucharest, within the PubArt Program.

Institutional Review Board Statement

Not applicable.

Informed Consent Statement

Not applicable.

Data Availability Statement

Data presented in this manuscript are available upon request from the corresponding author.

Conflicts of Interest

The authors declare no conflict of interest. The funders had no role in the design of the study; in the collection, analyses or interpretation of data; in the writing of the manuscript or in the decision to publish the results.

References

  1. Garcia-Maraver, A.; Rodriguez, M.L.; Serrano-Bernardo, F.; Diaz, L.F.; Zamorano, M. Factors affecting the quality of pellets made from residual biomass of olive trees. Fuel Process. Technol. 2015, 129, 1–7. [Google Scholar] [CrossRef]
  2. Krajnc, N. Wood Fuels Handbook; Food and Agriculture Organization of the United Nations: Pristina, Kosovo, 2015; ISBN 978-92-5-108728-2. [Google Scholar]
  3. Paniagua, S.; García-Pérez, A.I.; Calvo, L.F. Biofuel consisting of wheat straw–poplar wood blends: Thermogravimetric studies and combustion characteristic indexes estimation. Biomass Conv. Biorefinery 2019, 9, 433–443. [Google Scholar] [CrossRef]
  4. Boehmel, C.; Lewandowski, I.; Claupein, W. Comparing annual and perennial energy cropping systems with different management intensities. Agric. Syst. 2008, 96, 224–236, ISSN 0308-521X. [Google Scholar] [CrossRef]
  5. Purohit, P.; Chaturvedi, V. Biomass pellets for power generation in India: A techno-economic evaluation. Environ. Sci. Pollut. Res. 2018, 25, 29614–29632. [Google Scholar] [CrossRef] [Green Version]
  6. Tumuluru, J.S.; Wright, C.T.; Hess, J.R.; Kenney, K.L. A review of biomass densification systems to develop uniform feedstock commodities for bioenergy application. Biofuel Bioprod. Biorefining 2011, 5, 683–707. [Google Scholar] [CrossRef]
  7. Hammerschmid, M.; Müller, S.; Fuchs, J.; Hofbauer, H. Evaluation of biomass-based production of below zero emission reducing gas for the iron and steel industry. Biomass Conv. Biorefinery 2021, 11, 169–187. [Google Scholar] [CrossRef]
  8. Gilvari, H.; van Battum, C.; van Dijk, S.A.; de Jong, W.; Schott, D.L. Large-scale transportation and storage of wood pellets: Investigation of the change in physical properties. Particuology 2021. Available online: https://doi.org/10.1016/j.partic.2020.12.006 (accessed on 21 January 2021). [CrossRef]
  9. Mani, S.; Tabil, L.G.; Sokhansanj, S. An overview of compaction of biomass grinds. Powder Handl. Process. 2003, 15, 1–9. [Google Scholar]
  10. Trinh, Q.V.; Nagy, S.; Faitli, J.; Csőke, B. Determination of radial pressure distribution con the wall of the press channel of a novel biomass single die pelletiser. Eur. J. Wood Prod. 2020, 78, 1075–1086. [Google Scholar] [CrossRef]
  11. Lisowski, A.; Pajor, M.; Świętochowski, A.; Dąbrowska, M.; Klonowski, J.; Mieszkalski, L.; Piątek, M. Effect of moisture content, temperature, and die thickness on the compaction process and the density and strength of walnut shell pellets. Renew. Energy 2019, 141, 770–781. [Google Scholar] [CrossRef]
  12. Whittaker, C.; Shield, I. Factors affecting wood, energy grass and straw pellet durability—A review. Renew. Sustain. Energy Rev. 2017, 71, 1–11. [Google Scholar] [CrossRef]
  13. Golub, G.; Kukharets, S.; Cesna, J.; Yaroch, Y.; Kukharets, M. Research on changes in biomass during gasification. INMATEH Agric. Eng. 2020, 61, 17–24. [Google Scholar] [CrossRef]
  14. Shaw, M. Feedstock and Process Variables Influencing Biomass Densification. Master’s Thesis, Department of Agricultural and Bioresource Engineering, University of Saskatchewan, Saskatoon, SK, Canada, March 2008. [Google Scholar]
  15. Frodeson, S.; Henrikssonb, G.; Berghela, J. Effects of moisture content during densification of biomass pellets, focusing on polysaccharide substances. Biomass Bioenergy 2019, 122, 322–330. [Google Scholar] [CrossRef]
  16. Stelte, W.; Clemons, C.; Holm, J.K.; Ahrenfeldt, J.; Henriksen, U.B.; Sanadi, A.R. Fuel pellets from wheat straw: The effect of lignin glass transition and surface waxes on pelletizing properties. BioEnergy Res. 2012, 5, 450–458. [Google Scholar] [CrossRef] [Green Version]
  17. Yanming, W.; Zhongjia, C.; Xiangyue, Y.; Guosheng, Y. Influence of die temperature and moisture content on the densification of bamboo powder using die heating method. Wood Res. 2018, 63, 655–668. [Google Scholar]
  18. Scatolino, M.V.; Neto, C.; Protásio, L.F.; Carneiro, T.P.; Andrade, A.C.O.; Guimarães, C.R.; Júnior, J.B.; Mendes, L.M. Options for generation of sustainable energy: Production of pellets based on combinations between lignocellulosic biomasses. Waste Biomass Valorization 2018, 9, 479–489. [Google Scholar] [CrossRef]
  19. Lisowski, A.; Matkowski, P.; Dąbrowska, M.; Piątek, M.; Świętochowski, A.; Klonowski, J.; Mieszkalski, L.; Reshetiuk, V. Particle size distribution and physicochemical properties of pellets made of straw, hay, and their blends. Waste Biomass Valorization 2020, 11, 63–75. [Google Scholar] [CrossRef] [Green Version]
  20. Shastri, Y.; Hansen, A.; Rodrigues, L.; Ting, K.C. Engineering and Science of Biomass Feedstock Production and Provision; Springer: New York, NY, USA, 2014; ISBN 978-1-4899-8013-7. [Google Scholar] [CrossRef]
  21. ISO. ISO 17225-2:2014. Solid Biofuels—Fuel Specifications and Classes—Part 2: Graded Wood Pellets; ISO: Geneva, Switzerland, May 2014. [Google Scholar]
  22. O’Dogherty, M.J.; Wheeler, J.A. Compression of straw to high densities in closed cylindrical dies. J. Agric. Eng. Res. 1984, 29, 61–72. [Google Scholar] [CrossRef]
  23. Castellano, J.M.; Gómez, M.; Fernández, M.; Esteban, L.S.; Carrasco, J.E. Study on the effects of raw materials composition and pelletization conditions on the quality and properties of pellets obtained from different woody and non woody biomasses. Fuel 2015, 139, 629–636. [Google Scholar] [CrossRef]
  24. Puig-Arnavat, M.; Shang, L.; Sarossy, Z.; Ahrenfeldt, J.; Henriksen, U. From a single pellet press to a bench scale pellet mill—Pelletizing six different biomass feedstocks. Fuel Process. Technol. 2016, 142, 27–33. [Google Scholar] [CrossRef] [Green Version]
  25. Krizan, P.; Matus, M.; Soos, L.; Beniak, J. Behavior of beech sawdust during densification into a solid biofuel. Energies 2015, 8, 6382–6398. [Google Scholar] [CrossRef] [Green Version]
  26. Jones, W.D. Fundamental Principles of Powder Metallurgy; Edward Arnold Publishers Ltd.: London, UK, 1960; pp. 242–370. [Google Scholar]
  27. Cooper, A.R.; Eaton, L.E. Compaction behaviour of several ceramic powders. J. Am. Ceram. Soc. 1962, 45, 97–101. [Google Scholar] [CrossRef]
  28. Ge, R.D. Constitutive model for hot pressing of powders. J. Mater. Sci. Technol. 1994, 10, 374–380. [Google Scholar]
  29. Denny, P.J. Compaction equations: A comparison of the Heckel and Kawakita equations. Powder Technol. 2002, 127, 162–172. [Google Scholar] [CrossRef]
  30. Huang, P.Y. Powder Metallurgy Principle; Metallurgical Industry Press: Beijing, China, 1982. [Google Scholar]
  31. Kawakita, K.; Ludde, K.H. Some considerations on powder compression equations. Powder Technol. 1971, 4, 61–68. [Google Scholar] [CrossRef]
  32. Panelli, R.; Filho, F.A. A study of a new phenomenological compacting equation. Powder Technol. 2001, 114, 255–261. [Google Scholar] [CrossRef]
  33. Shapiro, I. Compaction of powders X. Development of a general compaction equation. Adv. Powder Metall. Part. Mater. 1993, 3, 229–243. [Google Scholar]
  34. Sonnegaard, J.M. Investigation of a new mathematical model for compression of pharmaceutical powders. Eur. J. Pharm. Sci. 2001, 14, 149–157. [Google Scholar] [CrossRef]
  35. Cardei, P.; Gageanu, I. A critical analysis of empirical formulas describing the phenomenon of compaction of the powders. J. Mod. Technol. Eng. 2017, 2, 1–20. [Google Scholar]
  36. Adapa, P.K.; Tabil, L.G.; Schoenau, G. Compression characteristics of selected ground agricultural biomass. Agric. Eng. Int. CIGR Ejournal 2009, 11, 1347. [Google Scholar]
  37. Nielsen, N.P.K.; Gardner, D.J.; Poulsen, T. Importance of temperature, moisture content, and species for the conversion process of wood residues into fuel pellets. Wood Fiber Sci. 2009, 41, 414–415. [Google Scholar]
  38. Obidzinski, S.; Dolzynska, M.; Kowczyk-Sadowy, M.; Sosna, K. Agglomeration of straw and hard coal with an additive of potato pulp—Experimental study. J. Res. Appl. Agric. Eng. 2008, 63, 46–50. [Google Scholar]
  39. Comoglu, T. An overview of compaction equations. J. Fac. Pharm. Ank. 2007, 36, 123–133. [Google Scholar]
  40. Tabil, L.; Kashaninejad, M. Biomass feedstock preprocessing—Part 2: Densification. In Biofuel’s Engineering Process Technology; IntechOpen: London, UK, 2011; Chapter 19; pp. 439–464. ISBN 978-953-307-480-1. [Google Scholar]
  41. Stelte, W.; Holm, J.; Sanadi, A.R.; Barsberg, S.; Ahrenfeldt, J. Fuel pellets from biomass: The importance of the pelletizing pressure and its dependency on the processing conditions. Fuel 2011, 90, 3285–3290. [Google Scholar] [CrossRef] [Green Version]
  42. Holm, J.K.; Henriksen, U.B.; Hustad, J.E.; Sorensen, L.H. Toward an understanding of controlling parameters in softwood and hardwood pellets production. Energy Fuels 2006, 20, 2686–2694. [Google Scholar] [CrossRef]
  43. Holm, J.K.; Stelte, W.; Posselt, D.; Ahrendfeldt, J.; Henriksen, U. Optimization of a multiparameter model for biomass pelletization to investigate temperature dependence and to facilitate fast testing of pelletization behavior. Energy Fuels 2011, 25, 3706–3711. [Google Scholar] [CrossRef]
  44. Križan, P.; Matůš, M. Impact of pressing chamber conicalness on the quality of briquetts produced from biofuels in briquetting machines. Fuels 2012, 4, 122–127. [Google Scholar]
  45. Ivanova, T.; Muntean, A.; Havrland, B.; Pobedinsky, V. Theoretical modelling of the briquetting process with different pressing equipment. Agronomy Res. 2013, 11, 47–52. [Google Scholar]
  46. Li, Y.; Liu, H. High pressure densification of wood residues to form an upgraded fuel. Biomass Bioenergy 2000, 19, 177–186. [Google Scholar] [CrossRef]
  47. Xu, G.; Wei, H.; Zhang, Z.; Yu, S.; Wang, C.; Huang, G. Analysis of deformation and equivalent stress during biomass material compression molding. IOP Conf. Ser. Mater. Sci. Eng. 2018, 307. [Google Scholar] [CrossRef] [Green Version]
  48. Said, N.; Abdel daiem, M.M.; García-Maraver, A.; Zamorano, M. Influence of densification parameters on quality properties of rice straw pellets. Fuel Process. Technol. 2015, 138, 56–64. [Google Scholar] [CrossRef]
  49. Poddar, S.; Kamruzzaman, M.; Sujan, S.M.A.; Hossain, M.; Jamal, M.S.; Gafur, M.A.; Khanam, M. Effect of compression pressure on lignocellulosic biomass pellet to improve fuel properties: Higher heating value. Fuel 2014, 131, 43–48. [Google Scholar] [CrossRef]
  50. Buckingham, E. On physically similar systems. Illustrations of the use of dimensional equations. Phys. Rev. 1914, 4, 345–376. [Google Scholar] [CrossRef]
  51. Montgomery, D. Design and Analysis of Experiments, 8th ed.; John Wiley & Sons, Inc.: New Jersey, NJ, USA, 2012; ISBN 978-1118-14692-7. [Google Scholar]
  52. Mani, S.; Tabil, L.G.; Sokhansanj, S. Effects of compressive force, particle size and moisture content on mechanical properties of biomass pellets from grasses. Biomass Bioenergy 2006, 30, 648–654. [Google Scholar] [CrossRef]
  53. Andreiko, D.; Grochowicz, J. Effect of moisture content on compression energy and strength characteristics of lupine briquettes. J. Food Eng. 2007, 83, 116–120. [Google Scholar] [CrossRef]
  54. Serrano, C.; Monedero, E.; Lapuerta, M.; Poertero, H. Effect of moisture content, particle size and pine addition on quality of barley straw pellets. Fuel Process. Technol. 2011, 92, 699–706. [Google Scholar] [CrossRef]
Figure 1. Pelleting device used for experiments. 1. piston; 2. interchangeable die (8, 10 mm for the pelleting orifice); 3. temperature sensor; 4. heating element; 5. blocking plate; 6. pressing head; 7. pelleting orifice; 8. automation box.
Energies 14 04104 g001
Figure 2. Force machine connected to the pelleting device. 1. computer; 2. phase and frequency analyzer; 3. pressing head; 4. pelleting device; 5. force machine control panel; 6. automation box; 7. casing; 8. pressing support.
Energies 14 04104 g002
Figure 3. Time-force curve generated by the software for a pelleting sample.
Energies 14 04104 g003
Figure 4. Fir sawdust measuring <2 mm separated on fractions.
Energies 14 04104 g004
Figure 5. Pellet samples obtained from fir sawdust.
Energies 14 04104 g005
Figure 6. Graphical comparison between the data calculated using relation (15) and the experimental data for the 8 mm die.
Energies 14 04104 g006
Figure 7. Graphical comparison between the data calculated using relation (15) and the experimental data for the 10 mm die.
Energies 14 04104 g007
Figure 8. Pellet density dependency on initial sawdust moisture and on the temperature reached in the pelleting die.
Energies 14 04104 g008
Figure 9. Comparisons between the variation of pellet density depending on the initial moisture of the raw material, for the two dies used.
Energies 14 04104 g009aEnergies 14 04104 g009b
Figure 10. Comparisons between the variation of pellet density depending on the compression force for the two dies used.
Energies 14 04104 g010
Figure 11. Comparisons between the variation of pellet density depending on the pelleting speed for the two dies used.
Energies 14 04104 g011
Figure 12. Comparisons between the variation of pellet density depending on the pelleting temperature for the two dies used.
Energies 14 04104 g012aEnergies 14 04104 g012b
Figure 13. Graphical representation of the density of pellets obtained at the temperature of 90 °C and a pelleting speed of 1.3 mm s−1 for the three moistures used.
Energies 14 04104 g013
Figure 14. Graphical representation of the density of pellets obtained at the temperature of 90 °C and a pelleting speed of 2.1 mm s−1 for the three moistures used.
Energies 14 04104 g014
Figure 15. Graphical representation of the density of pellets obtained at the temperature of 90 °C and a pelleting speed of 2.8 mm s−1 for the three moistures used.
Energies 14 04104 g015
Figure 16. Graphical representation of the density of pellets obtained at the temperature of 70 °C and a pelleting speed of 2.8 mm s−1 for the three moistures used.
Energies 14 04104 g016
Figure 17. Graphical representation of the density of pellets obtained at the temperature of 80 °C and a pelleting speed of 2.8 mm s−1 for the three moistures used.
Energies 14 04104 g017
Figure 18. Graphical representation of the density of pellets obtained at the temperature of 90 °C and a pelleting speed of 2.8 mm s−1 for the three moistures used.
Energies 14 04104 g018
Table 1. Parameters of the pelleting process considered in the dimensional analysis.
Parameter NameNotationMeasurement UnitPhysical Dimension
Heat quantityQkg m2/s2ML2T−2
Compression pressurepN/m2ML−1T−2
Initial material moistureUp%-
Pellet densityρpkg/m3ML−3
Raw material densityρ0kg/m3ML−3
Raw material initial volumeV0m3L3
Pelleting speedvm/sLT−1
Table 2. Result obtained for the ∅ 8 mm die.
SampleRaw Material Density
ρ0 (kg/m3)
Initial Moisture
Ui (%)
Temperature
θ (°C)
Pelleting Speed
v (m/s)
Maximum Force
Fmax (kN)
Energy Consumed
Ec (Wh)
Pellet Density
ρp (kg/m3)
Pellet Moisture
Up (%)
1136.0810700.00211081035.188.81
2136.0810700.00211071020.708.74
118142.1813700.00212051213.5210.17
119142.1813700.00212051203.7310.04
120142.1813700.00212061223.9310.15
121142.1813800.00212051119.199.91
122142.1813800.00212061075.559.87
242147.3716900.0028305934.4112.74
243147.3716900.028306957.0212.53
Table 3. Result obtained for the ∅ 10 mm die.
SampleRaw Material Density
ρ0 (kg/m3)
Initial Moisture
Ui (%)
Temperature
θ (°C)
Pelleting Speed
v (m/s)
Maximum Force
Fmax (kN)
Energy Consumed
Ec (Wh)
Pellet Density
ρp (kg/m3)
Pellet Moisture
Up (%)
1136.0810700.0021104982.818.94
2136.0810700.0021105972.198.72
118142.1813700.00212041049.2110.12
119142.1813700.00212051060.859.90
120142.1813700.00212061064.549.97
121142.1813800.0021205046.3410.13
122142.1813800.00212041074.269.92
242147.3716900.0028307797.7812.42
243147.3716900.028305801.7512.51
Table 4. Values of the main statistical estimators of the process parameters for the ∅ 8 mm die.
ParameterAverageMedianKurtSkewMean Square DeviationVariance
ρ0141.9142.2−1.506−0.0984.61821.327
ρp999.6581016−0.891−0.487106.4611,333.822
Fmax2020−1.50608.16566.667
Ui1313−1.50602.4496
θ8080−1.50608.16566.667
v0.0020.002−1.506−0.0820.0013.7 × 10−7
Ec5.8355−0.490.72.024.08
Vp2.5312.46−0.1860.8140.2890.084
L30.98730.1−0.2240.8023.55412.628
Up10.4789.94−1.3940.4251.8643.475
243147.3716900.028305
Table 5. Correlations between the variable parameters involved in the process for the ∅ 8 mm die.
Correlationsρ0ρpFmaxUi θ vEcVpLUp
ρ0 −0.7500.99900−0.2870.7620.7620.942
ρp−0.75 0.2950.762−0.119−0.0240.395−0.996−0.996−0.783
Fmax00.295 0000.569−0.281−0.2810.080
Ui0.999−0.7620 00−0.2870.7730.7720.953
θ 0−0.11900 0−0.1160.1210.121−0.059
v0−0.024000 −0.3790.0200.0200.143
Ec−0.2870.3950.569−0.287−0.116−0.379 −0.390−0.390−0.389
Vp0.763−0.996−0.2810.7730.1210.020−0.390 0.9990.799
L0.762−0.996−0.2810.7720.1210.020−0.3900.999 0.799
Up0.942−0.7830.0800.953−0.0590.143−0.3890.7990.799
Publisher’s Note: MDPI stays neutral with regard to jurisdictional claims in published maps and institutional affiliations.

