Article

Gas Transition: Renewable Hydrogen’s Future in Eastern Australia’s Energy Networks

1
Priority Research Centre for Frontier Energy Technologies & Utilisation, The University of Newcastle, Callaghan, NSW 2308, Australia
2
Particles and Catalysis Research Laboratory, School of Chemical Engineering, University of New South Wales, Sydney, NSW 2052, Australia
*
Author to whom correspondence should be addressed.
Current address: Newcastle Institute for Energy and Resources, The University of Newcastle, University Drive, Callaghan, NSW 2308, Australia.
Energies 2021, 14(13), 3968; https://doi.org/10.3390/en14133968
Submission received: 21 May 2021 / Revised: 24 June 2021 / Accepted: 29 June 2021 / Published: 1 July 2021
(This article belongs to the Special Issue Alternative Energy: Harvesting and Applications)

Abstract

:
The energy transition for a net-zero future will require deep decarbonisation that hydrogen is uniquely positioned to facilitate. This technoeconomic study considers renewable hydrogen production, transmission and storage for energy networks using the National Electricity Market (NEM) region of Eastern Australia as a case study. Plausible growth projections are developed to meet domestic demands for gas out to 2040 based on industry commitments and scalable technology deployment. Analysis using the discounted cash flow technique is performed to determine possible levelised cost figures for key processes out to 2050. Variables include geographic limitations, growth rates and capacity factors to minimise abatement costs compared to business-as-usual natural gas forecasts. The study provides an optimistic outlook considering renewable power-to-X opportunities for blending, replacement and gas-to-power to show viable pathways for the gas transition to green hydrogen. Blending is achievable with modest (3%) green premiums this decade, and substitution for natural gas combustion in the long-term is likely to represent an abatement cost of AUD 18/tCO2-e including transmission and storage.

Graphical Abstract

1. Introduction

The world is embarking on an unprecedented energy transition to meet mid-century net-zero goals. Hydrogen is expected to play an important role due to its flexibility as both an energy vector and versatile molecular building block [1]. Australia is the global leader in the deployment of wind and solar photovoltaics (PV) on a per capita basis [2] and Australia’s energy networks are planning for energy futures including hydrogen [3,4]. Australian governments and their agencies are supporting this through the National Hydrogen Strategy [5] and associated initiatives to enable domestic and international supply chains [6].
Hydrogen is currently produced almost exclusively from coal and natural gas, referred to as grey hydrogen, predominately for use in oil refining and ammonia production [7]. For an expanded role in the clean energy systems of net zero futures the emissions from fossil fuel sources must be captured and stored, or the hydrogen must be produced from renewables. Future development is thus focusing on clean hydrogen; blue hydrogen utilising steam methane reforming (SMR) or coal gasification with carbon capture and storage (CCS), or green hydrogen from the electrolysis of water using renewable energy.
The largest blue hydrogen production initiative in Australia is the Hydrogen Energy Supply Chain (HESC) coal gasification project in the Latrobe Valley aimed at exporting liquified hydrogen to Japan [8]. CCS is only viable at scale where there are opportunities to sequester large quantities of carbon dioxide (CO2) and this installation is proposed to link to the Gippsland Basin CarbonNet CCS project [9] in a commercial operation phase in the 2030s. CCS features heavily in other gas decarbonisation analysis [10] though it has a poor track record for meeting targets [11]. Blue hydrogen also relies on finite fossil fuel resources.
The history and outlook for blue hydrogen contrasts starkly to green hydrogen, which relies on abundant renewable resources and scalable technology that is rapidly improving as it is deployed. Green hydrogen is thus likely to be cheaper and more widely accessible than blue hydrogen by 2030, and this situation will only improve out to 2050 [12]. Australia’s trading partners, such as the European Union (EU), are prioritising green hydrogen over the long term [13], which is an opportunity to utilise Australia’s world-class renewable energy resources. A joint study with Germany is building on other international collaborations to assess export opportunities [14].
There are two competing electrolyser technologies for renewable hydrogen production. Alkaline electrolysers are currently cheaper than polymer exchange membrane (PEM) electrolysers; however, the cost of the more flexible PEM systems is expected to drop below alkaline by 2030 [15]. PEM electrolysis powered by wind and solar, therefore, is likely to account for most of the Australian hydrogen production in the long-term and forms the basis for this work. At the utility-scale it will be integrated into the gas network, as shown in Figure 1, which will be more strongly coupled to the electricity network than it is at present [16].
The gas network has the potential to facilitate the transmission, distribution and storage of hydrogen in large quantities. Like natural gas, hydrogen can also be stored and transported as a compressed gas. It can also be converted into methane for use with existing natural gas systems. Pure hydrogen can be blended up to 5–15% by volume without major infrastructure modifications and safety concerns [17]. Alternatively, full substitution to a hydrogen gas network is also possible, and there is precedent for such a large-scale transformation [18]. Gas networks in Australia and overseas have undergone a transition from town gas to natural gas in the past, and Singapore is presently undergoing the same change [19]. Manufacturers are preparing for future 100% hydrogen conversions [20] which would proceed via the staged conversion of local networks, industrial clusters and residential communities [21,22].
Gas and electricity have historically played different roles, with gas focussed on the thermal energy requirements in residential, commercial and industrial sectors. Some of this is relatively easy to electrify; however, there are significant challenges in certain use cases. Space is one important consideration. For example, gas hot water boilers used extensively in apartment buildings and electric alternatives have a larger footprint. The gas and electricity networks are already coupled though, via Gas Powered Generation (GPG) which draws from the gas network to fuel turbines and engines that supply power to the electricity network, as shown in Figure 2.
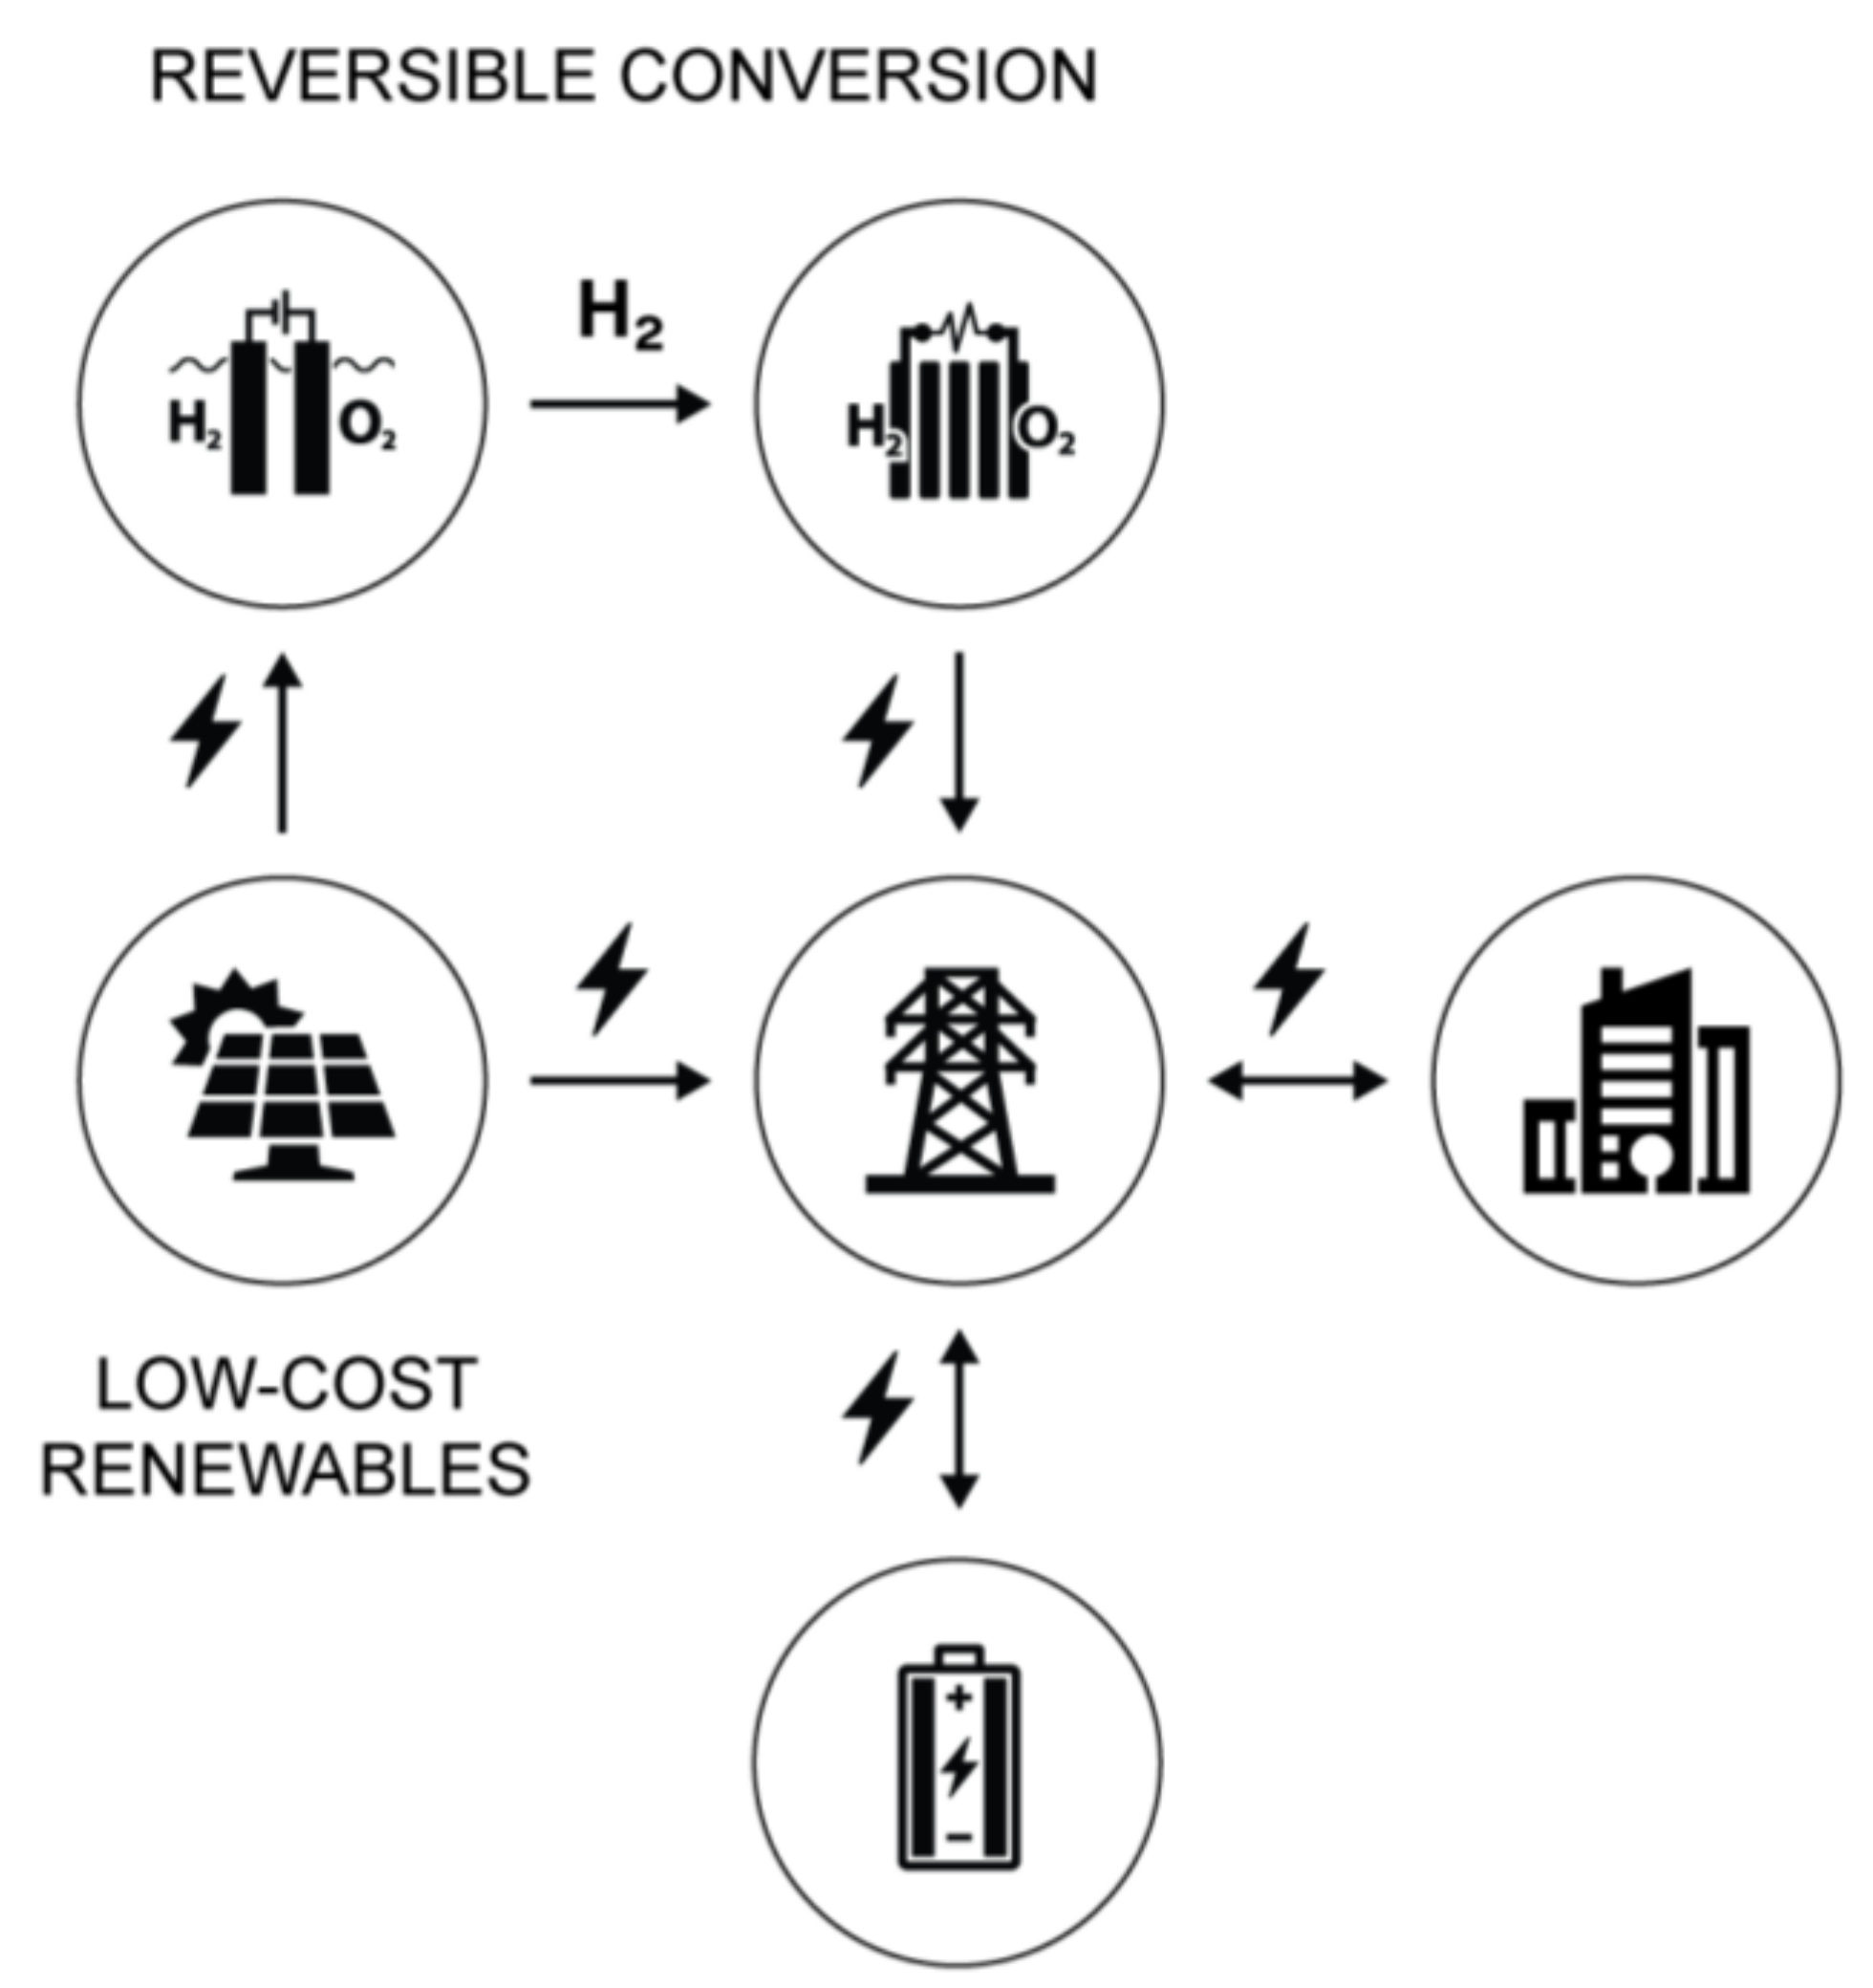
GPG is expected to continue to remain a significant part of the NEM [23]. High penetrations of Variable Renewable Energy (VRE), predominately wind and solar, create large supply variations. This is an opportunity and a challenge. Firming using storage or other forms of dispatchable power is required to follow loads. On the flip side, low or negative power prices during periods of excess supply can be used to power processes such as electrolysis. The generated hydrogen can then replace natural gas in reciprocating engines and turbines with modifications. This makes Power-to-Gas (PtG) a reversible process when combined with GPG or fuel cells. Low round trip energy efficiency is the primary weakness of this approach to energy storage, shown below in Figure 3.
Salt caverns and depleted gas fields are typically proposed for the large-scale storage needs for hydrogen, though this is a longer-term solution and location-specific. Using existing natural gas storage infrastructure beyond small, blended volumes is still possible; however, this may require the methanation of hydrogen. Synthetic methane can be produced using carbon dioxide (CO2), captured from the air or the waste stream of another industrial process, in a Power-to-Gas plant with catalysis. The CO2 is combined with renewable hydrogen through the Sabatier methanation process at temperatures between 150–500 °C and pressures of 1–3 bar. This is shown below in Figure 4 as a simplified process diagram.
Several synthetic methane facilities are already in operation globally and the first such project was developed by Audi in Germany, operating since 2013, generating 1000 tonnes of renewable methane that is then utilized by Audi’s gas-powered vehicles [24]. Recently, a 3.5 million cubic meter per year facility was proposed in China, which would emerge as the world’s largest synthetic methane facility once operational [25]. In Australia, Southern Green Gas and the APA group, one of Australia’s largest natural gas providers, are developing a state of art demonstration facility in Queensland that will generate methane using CO2 sourced from using direct air capture technology and renewable electricity [26].

2. Methods

The aim of this study is to investigate renewable hydrogen’s future role in Eastern Australia’s gas and electricity networks through a technoeconomic analysis of transition pathways integrating opportunities from 2025 to a net-zero future in 2050. Plausible domestic renewable hydrogen scenarios were developed based on public literature, discussion and industry plans [4,21]. This paper discusses the implications of supply, demand, and levelised costs assessed using technoeconomic models in Microsoft Excel®. Unlike previous studies [27], this work examines the cost of delivering hydrogen domestically in Australia past 2030, including long-distance transmission and large-scale storage. The costs of other processes that may be required for integration, including synthetic natural gas (SNG) production, are also considered in the Australian context.

2.1. Scope

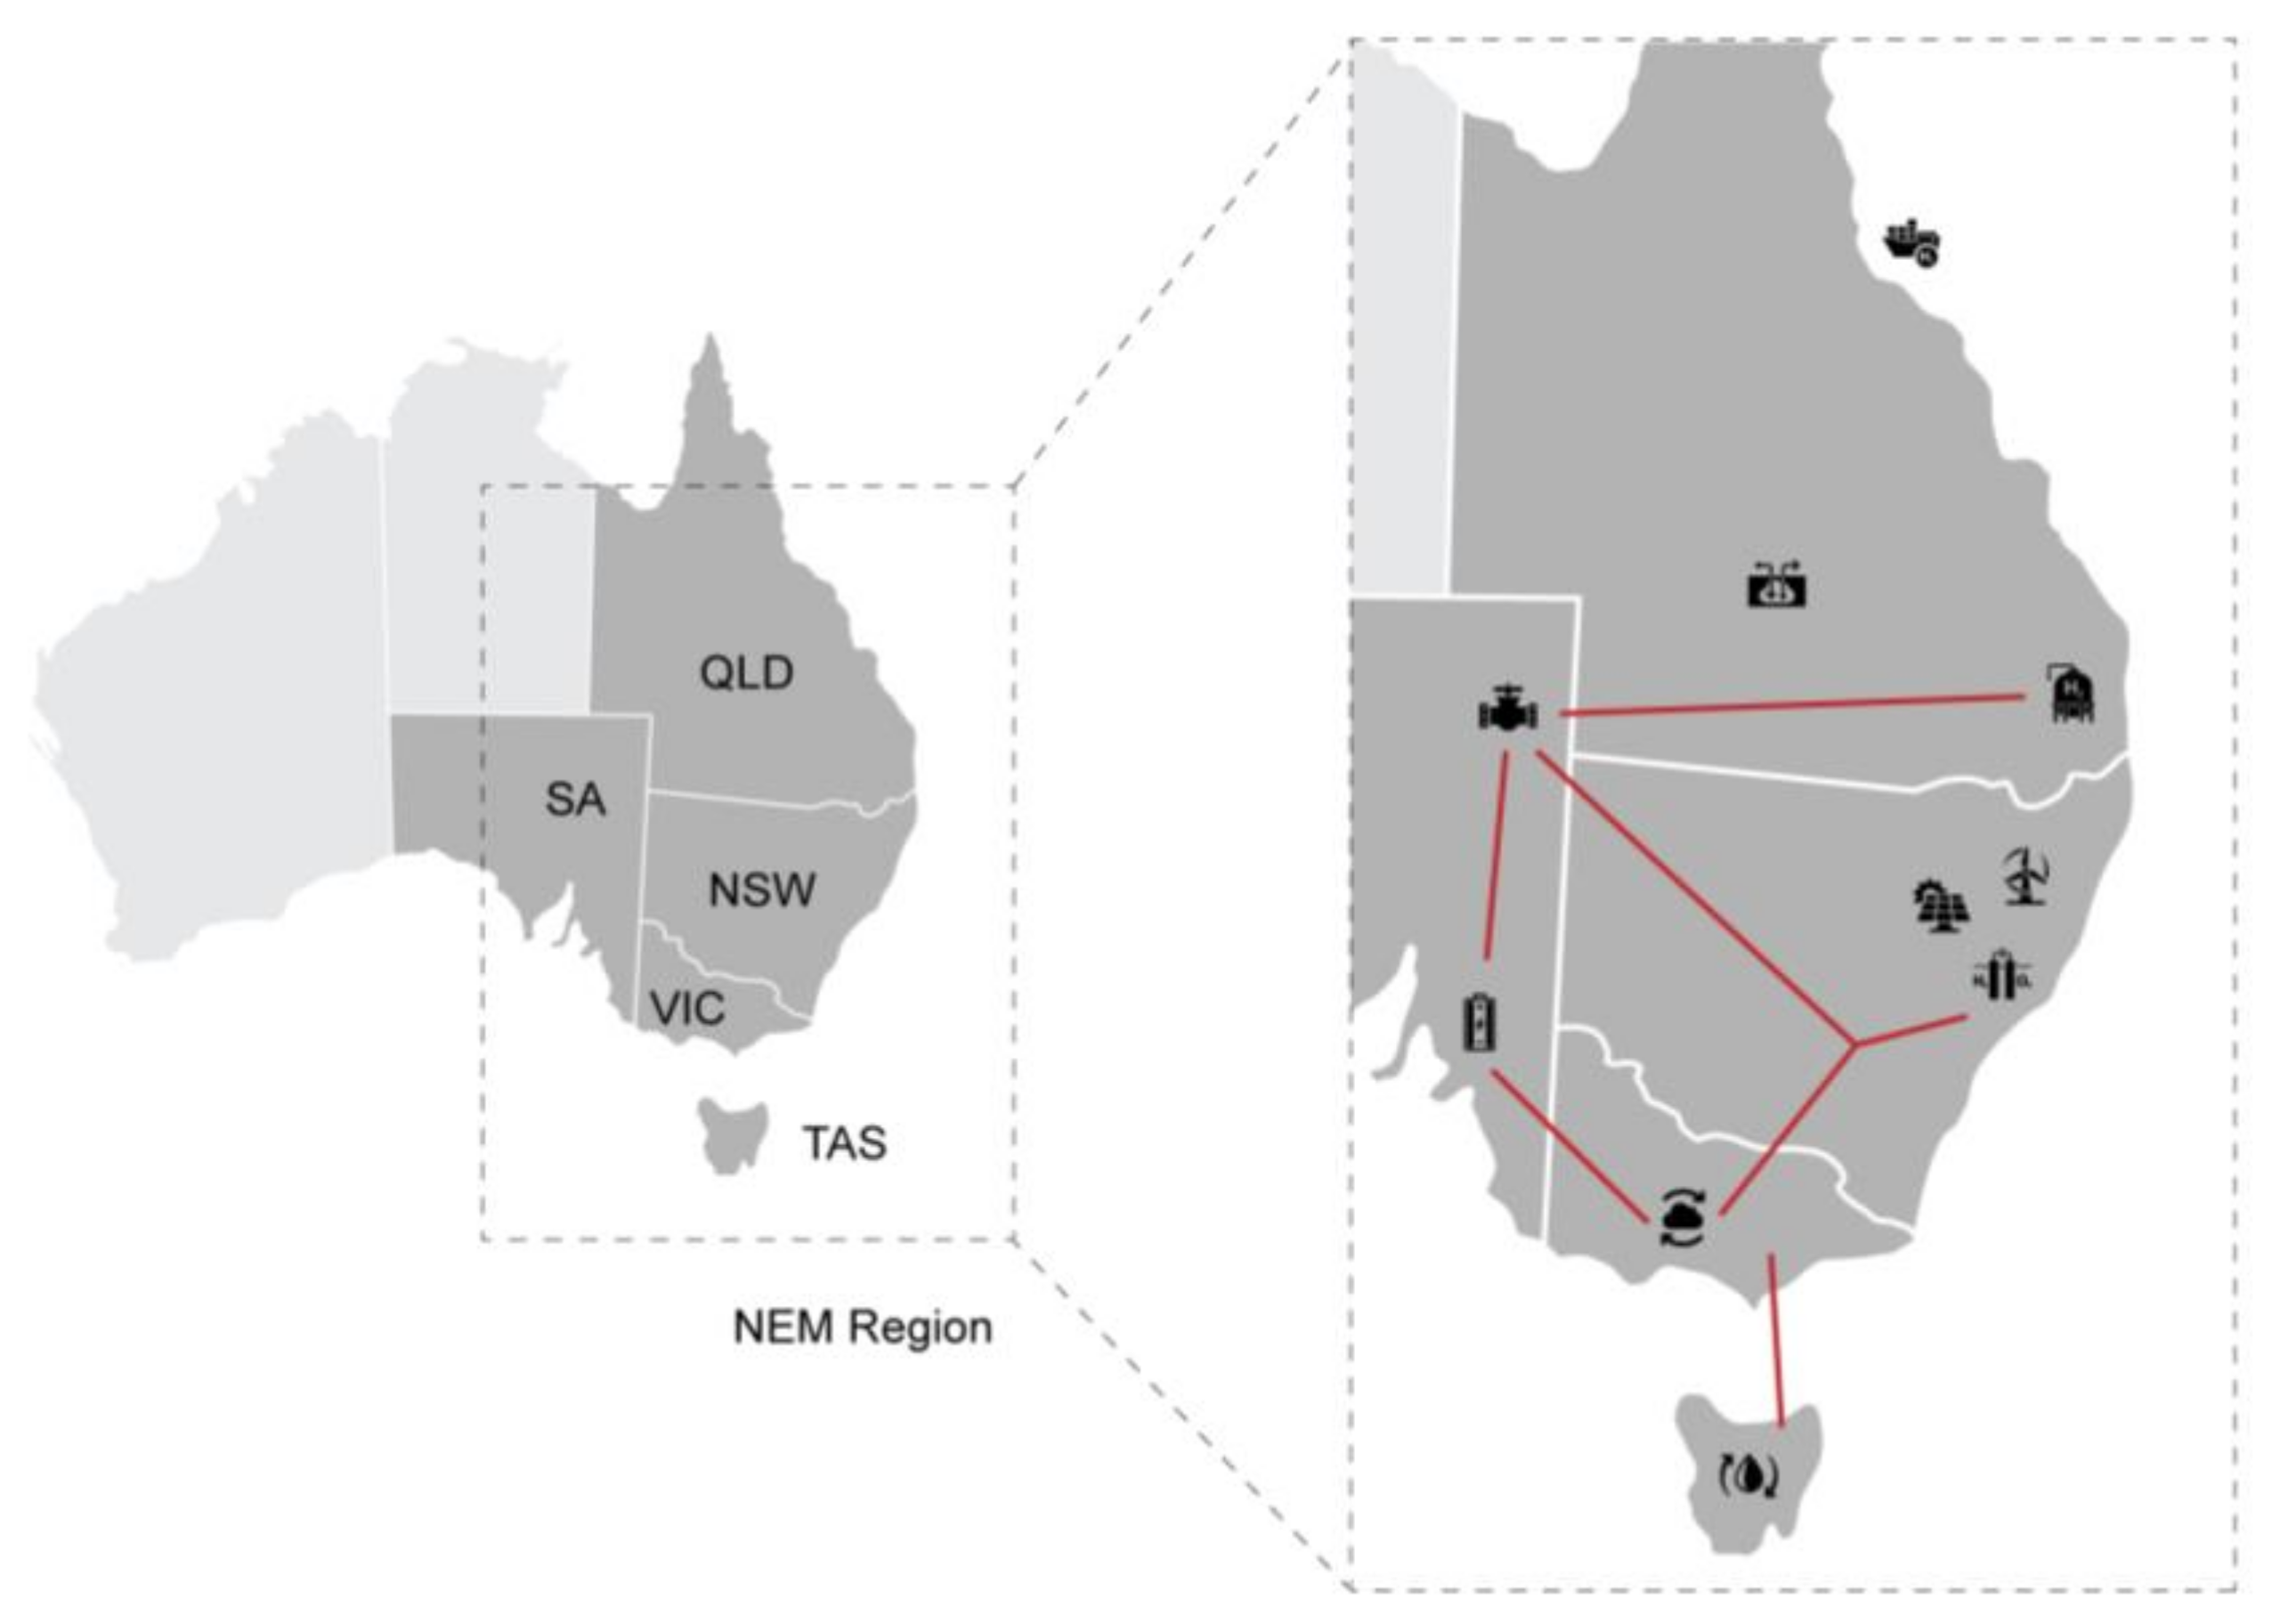
The study is restricted to the role of hydrogen in the gas and electricity networks of the National Electricity Market (NEM) region of South-Eastern Australia, shown in Figure 5. This includes New South Wales (NSW), Queensland (QLD), Victoria (VIC), South Australia (SA) and Tasmania (TAS). Western Australia (WA) and the Northern Territory (NT) are excluded. Gas demand for Liquified Natural Gas (LNG) is also excluded from this analysis as it dwarfs domestic requirements. In the future this export demand may be filled by large off-grid renewable hydrogen projects such as the 26 GW Asian Renewable Energy Hub (AREH) [28].
A window out to 2050 was considered; however, growth modelling is limited to 2040 due to the availability of reputable forecast data. This study uses the “Central” scenario from Australian Energy Market Operator’s (AEMO) 2020 Integrated System Plan (ISP) [23] and Gas Statement Of Opportunities (GSOO) [29] for demand values. The labelled datasets are publicly available as comma separated values (CSV) files, which were manipulated using pivot tables in Excel®. Optimising the NEM is beyond the scope of this study, which does not seek to replicate AEMO’s ISP, instead aiming to provide exploratory assessments of possible futures.

2.2. Model

This study uses a levelised cost approach to evaluate the economics of gas production and storage. A discounted cash flow (DCF) model in was used to calculate the Levelised Cost of X (LCOX) [30,31]. This can be expressed as shown below in Equation (1)
LCOX = i = 0 n c o s t   in   year   i 1 + d i s c o u n t   r a t e i / i = 0 n u n i t s   o f   X   in   year   i 1 + d i s c o u n t   r a t e i
where X represents energy production or storage. The cost in a given year is the sum of capital expenditure (CAPEX) and operating expenditure (OPEX).
CAPEX includes key equipment and balance of plant (BOP). In a PEM electrolyser system, 55% of the cost relates to balance of plant, with power supplies the single largest component of cost [32]. The remaining cost relates to the core of the technology, the stack. This includes the catalyst coated membrane (CCM), which uses rare earth metals, and bipolar plates. BOP and stack costs account for similar shares of fuel cell system costs, with membrane electrode assemblies (MEA) and bipolar plates comprising 62% and 28% of stack costs, respectively [33].
OPEX consists of fixed operations and maintenance (O&M) costs and the variable expense of energy input (i.e., electricity). The cost of water and stack replacement is included in the fixed OPEX costs for electrolysis [34], while stack replacement is accounted for separately as additional CAPEX at 10 year intervals for methanation plant.
For ready comparison cost values are shown in both AUD/kgH2, which is the reference for the hydrogen enterprise, and AUD/GJ which is the reference for domestic gas costs. This study uses the Australian dollar (AUD). Where a cited cost in another currency has been used it was converted to AUD based on the exchange rate at the time the reference document was published, with inflation to determine the present value.

2.3. Assumptions

Discount rates in the literature vary between 6% [30] and 7% [31]. The Commonwealth Scientific and Industrial Research Organisation (CSIRO) has previously used 6.42% for low emission technologies [35]: though for this work the discount rate was set at 6% to align with the latest GenCost assumptions [36]. This and other assumptions are listed in Table 1.
Lifetime was assumed to be 20 years [31,37], consistent with Australian Renewable Energy Agency (ARENA) assumptions [34]. A three year construction and commissioning period is used where CAPEX is paid 20% in year 0, 50% in year 1 and 30% in year 2 [31]. Decommissioning costs were not included, as it is assumed much of the installation would be reused in a renewable net-zero future.
Table 1. Modelling assumptions.
ParameterValueUnitReferences
Discount rate6%[36]
Electrolyser Operating Life20years[34]
Methanation Plant Life30years[30]
Direct Air Capture Plant Life30years[38]
Commissioning Time3years[30]
Electricity and electrolyser costs are sourced from the GenCost 2020–21 consultation draft [36]. Electrolysis will rely on the cheapest electricity available [39], hence the “Low” values for electricity generation costs from wind and solar over the 2020 to 2050 period are used. Electrolyser capital costs are sourced from the “High VRE” scenario.
Manufacturing engineering and economies of scale are expected to deliver the greatest cost reductions for large MW scale electrolysis systems [40]. This work applies an optimistic view of costs for scalable renewable technologies, though it is possible that these are still conservative figures; forecasts have a history of underestimating renewable developments [41,42]. Base case costs are used for other chemical engineering plants required for Power-to-X, namely Catalytic Methanation (CM) and Direct Air Capture (DAC) for carbon dioxide.
Efficiency values were sourced from the CSIRO’s National Hydrogen Roadmap [43] and Higher Heating Values (HHV) from McAllister et al. [44] were used for the gross energy density of fuels. These are summarised below in Table 2. Carbon dioxide, methane and nitrous oxide emission factors are sourced from Australia’s National Greenhouse Accounts Factors [45].

3. Results and Discussion

The study results are presented below starting with growth scenarios, followed by economic analysis and discussion of the renewable gas transition.

3.1. Growth Scenarios

One hundred percent renewable generation in Australia has been discussed since at least 2010, with the presentation of a 10 year transition roadmap [46]. Subsequent research demonstrated the feasibility to meet actual hourly demand [47], later with predominately wind and solar photovoltaic (PV) power [48]. Here, it is considered what these technologies could deliver with scalable electrolyser technology to meet forecasted energy demand.

3.1.1. Gas Blending

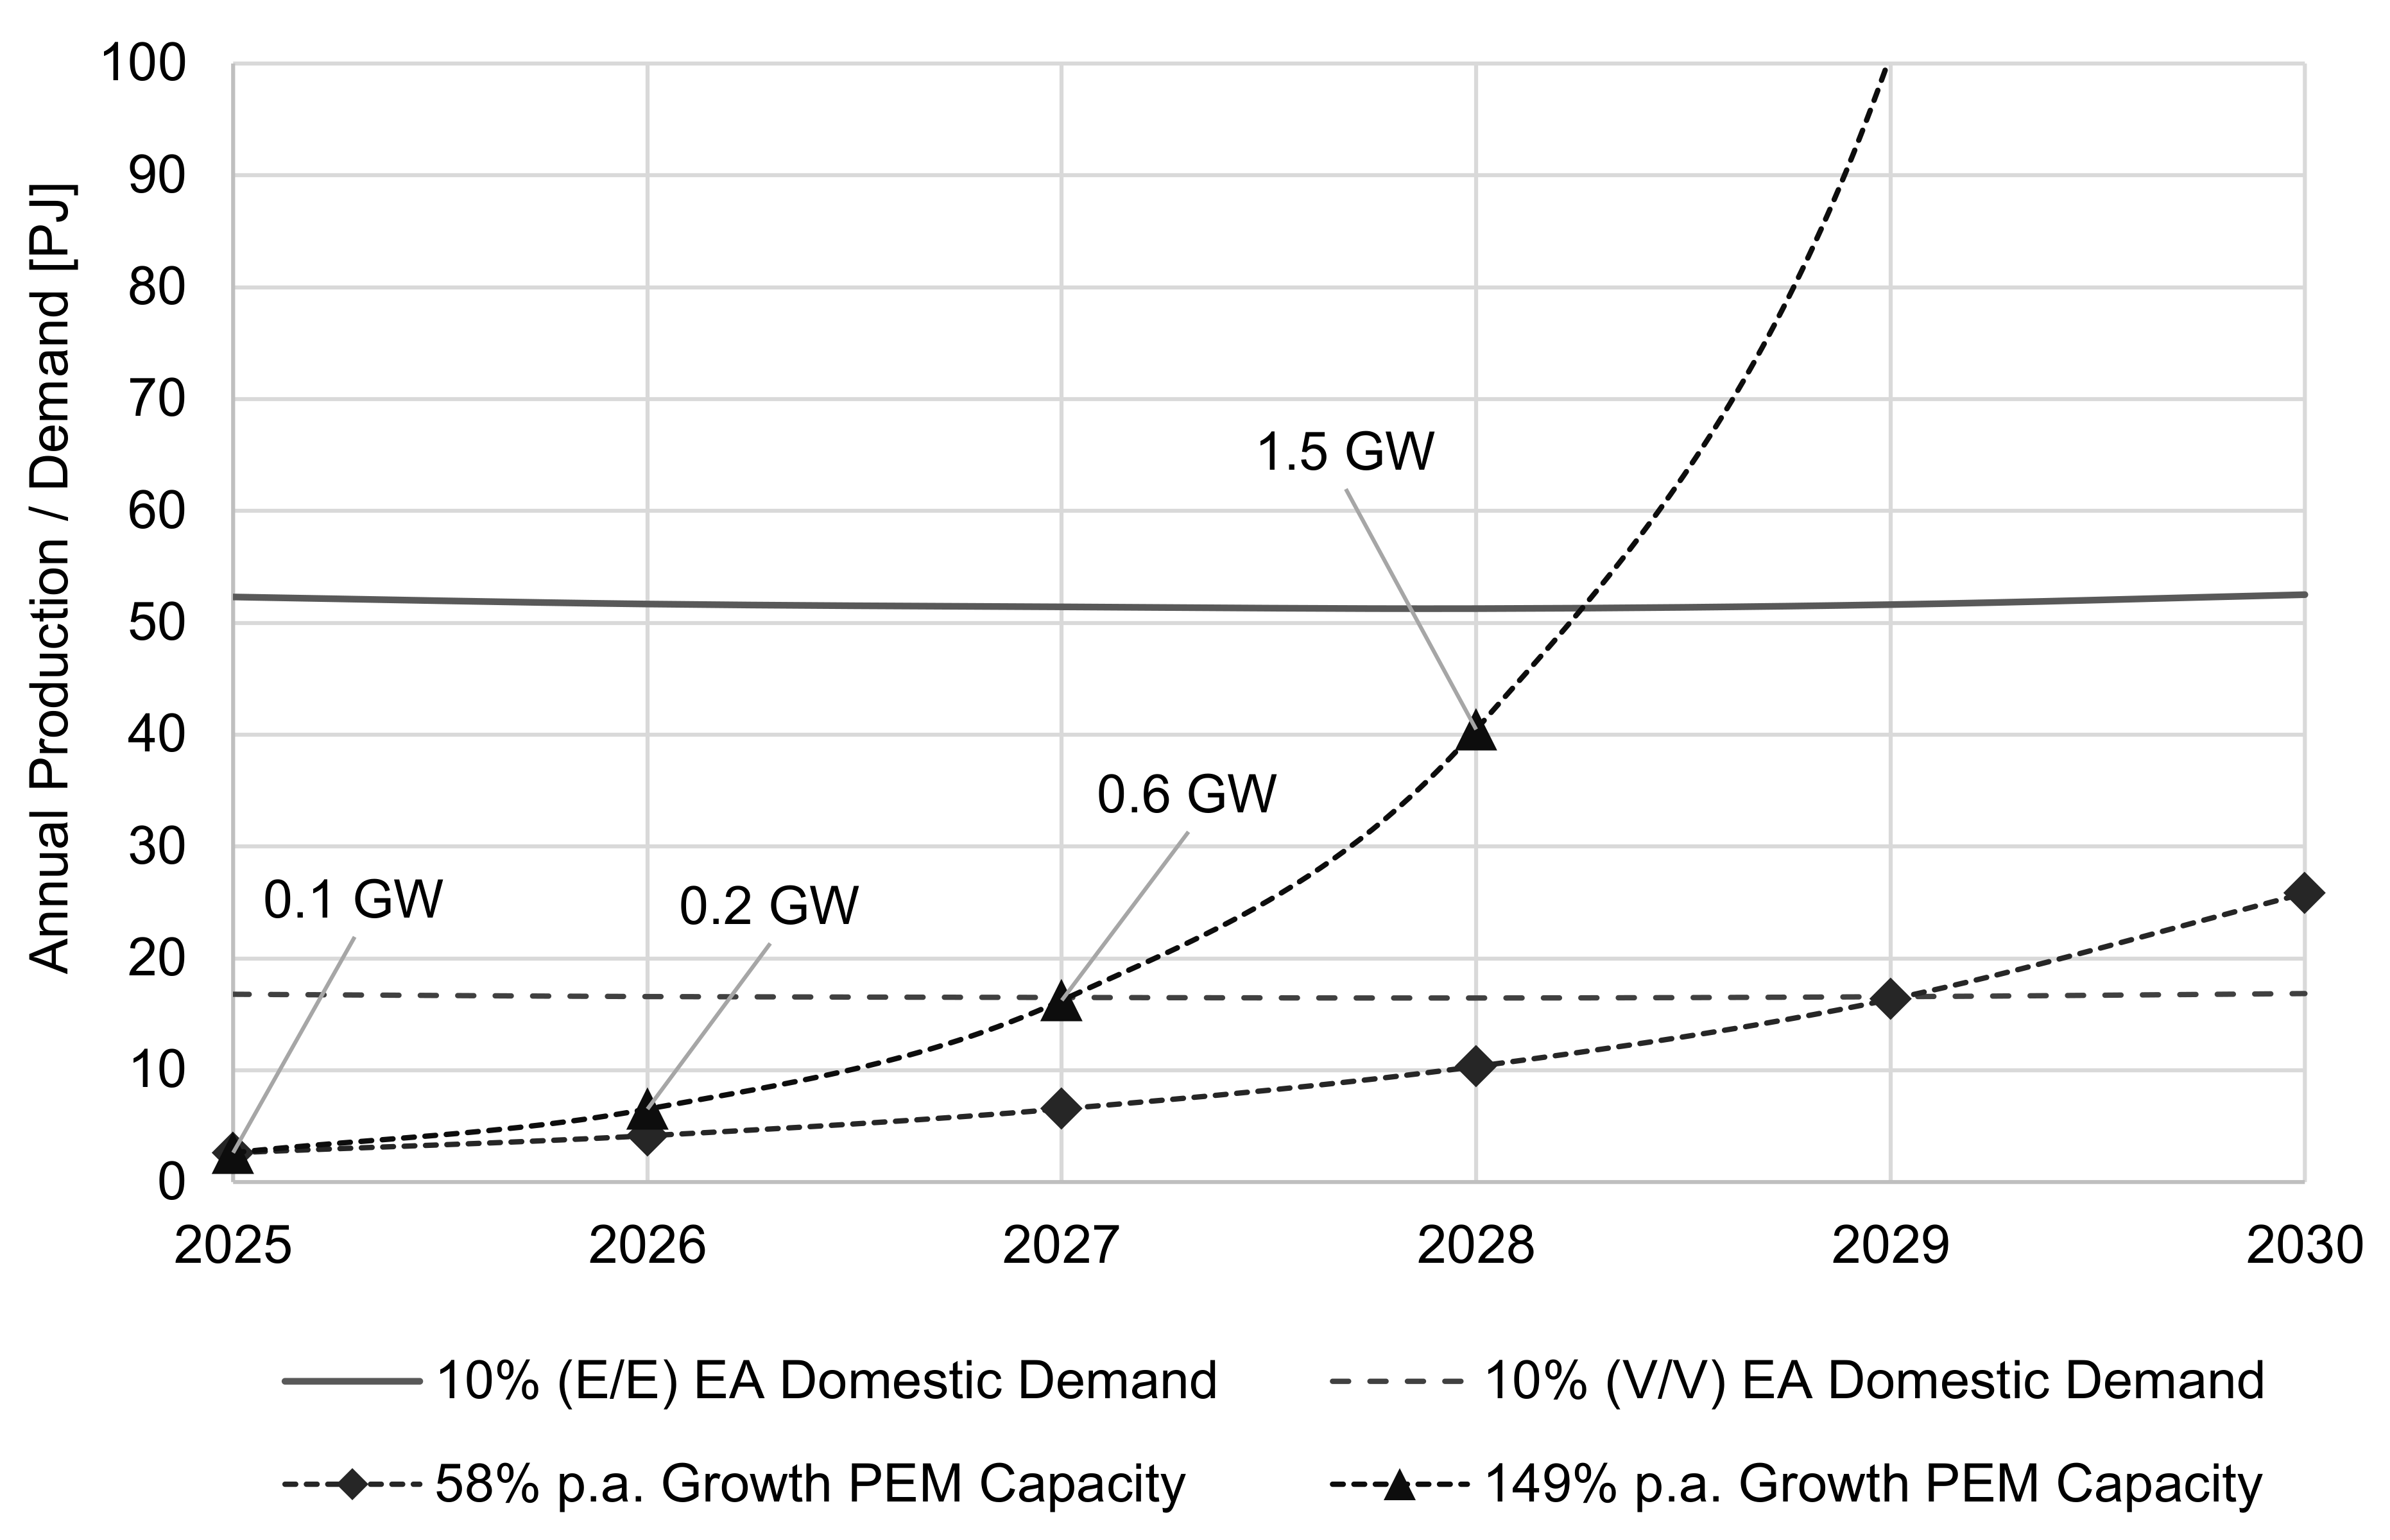
It is considered technically feasible to blend up to 10% v/v hydrogen into existing Australian natural gas distribution networks [19]. This is the target most frequently discussed out to 2030, though here a more ambitious target of 10% of demand by energy fraction (e/e) is also considered, which could be achieved by the selective conversion of local regional networks as proposed by industry. Figure 6 shows the annual hydrogen production from PEM electrolysers operating at 95% capacity installed from 100 MW in 2025. Two growth rates are shown, modelled off Australian PV growth. Installed capacity in Australia grew at an average 58% compound annual growth rate over the 10 years from January 2010 to January 2020, with extremely rapid growth averaging 149% for the 3 years to 2013 [49].
Eastern Australia’s natural gas consumption (excluding LNG) is in the order of 500 PJ per annum. Ten percent of this by energy fraction, 50 PJ, is approximately 14 TWh, which is in the order of the contribution of hydro to the NEM. Distributed PV, or rooftop solar, is forecast to generate approximately 18 TWh of energy in the financial year ending 2022. That is 9 % of forecast electricity generation in that period, and close to the energy required to produce 50 PJ of hydrogen (HHV) via electrolysis. The rapid deployment of PEM electrolysers over three years would deliver this hydrogen production capacity. A more modest 50% growth over 5 years would deliver 10% by volume fraction by the 2030 target. By way of comparison, the global average growth in solar PV capacity over the 5 years from 2013 to 2018 was 30% [50].

3.1.2. Gas Replacement

The continued deployment of renewable hydrogen after 2030 would start to replace significant quantities of natural gas. This is encouraging, as Eastern Australia is projected to require significant new gas developments in the period to 2040. There are significant supply gaps upwards of 120 PJ per year in the gas network forecast for the financial year ending 2025 and onwards. Supplying this 120 to 285 PJ of additional gas each year is a potential opportunity for hydrogen, which could achievably fill the fuel demand for GPG as coal plants continue to retire from the NEM. If electrolysers are installed at a 50% compounding annual growth rate from a 2 GW base in 2030 renewable hydrogen could replace natural gas entirely by 2040, as shown in Figure 7.
This will compete for renewable electricity as the NEM, which has 51 GW of installed capacity [51], also transitions to net-zero. Australia has over 31 TW of installable renewable generation capacity [52], however, and a low capacity factor has been assumed to utilise abundant solar resources. For a sense of scale, the Sun Cable Australia-ASEAN Power Link (AAPL) project in the Northern Territory proposes to build 10 GW of solar PV with up to 30 GWh of battery storage [53]. The project has been given Major Project Status and commercial operation is slated for the end of 2027 with a view to provide 20% of Singapore’s electricity. Transmission and distribution will be challenging, which is why utilising existing gas distribution infrastructure is key [54].
Hydrogen is approximately one third the volumetric energy density of methane, so replacing methane will require more storage infrastructure, and not only for seasonal storage. Pressure cycling, or line packing, is commonly used in the natural gas transmission network for short-term supply security (intraday storage). This is promoted as a method of storing hydrogen in gas pipelines [43]. Due to different volumetric gas properties, however, the linepack-energy of hydrogen can be four times smaller than natural gas [55]. This poses a significant issue for gas supply security, which suggests that relying on this for additional energy storage capacity is problematic. Additional intraday storage was included in the H21 Leeds City Gate project design for this reason [18] and will need to be considered for Australian networks.

3.1.3. Electricity Storage

AEMO’s 2020 ISP includes significant deployment of electricity storage capacity over the forecast period. This is distinct from gas powered generation, and ranges from hours to days of discharge time. Where hydrogen can be integrated effectively, such as facilities which also require back-up power capacity, fuel cells may be a viable solution for short-duration storage. Efficiency and scalability means batteries will likely meet most behind the meter and shallow to medium depth storage requirements (less than 12 h). Lithium–ion is capturing the majority of the short-duration market; however, the inability to decouple power (kW) from energy (kWh) is a fundamental weakness of conventional batteries such as these. Flow batteries are more suited to longer duration energy storage with vanadium projected to achieve capacity costs as low as USD 40/kWh, though hydrogen may reach USD 1–5/kWh [56]. This scenario models hydrogen fuel cells capturing 10% of the demand for medium and deep dispatchable storage. Figure 8 shows that the scale of hydrogen storage required to provide 24 h at nominal power is modest. The plot is labelled with storage sizes for reference based on system level analysis from Ahluwalia et al. [57].

3.2. Cost Assessment

The analysis above shows what could be achieved with the ambitious deployment of green hydrogen production. The scale of development required is challenging; however, the energy industry in Australia has demonstrated the ability to deliver gas infrastructure and renewables at this pace. The question of cost remains—at what price? This section considers the cost of renewable hydrogen production out to 2050.

3.2.1. Production to 2050

As the industry scales the cost of renewable hydrogen will unarguably reduce, the concern is meeting a target where it can be competitive. There are two primary factors, the capital cost of electrolysers and the price of the electricity used to power them. Currently a higher capacity factor is optimal to reduce the capital cost component, which for 100% renewables means a hybrid of wind, solar and storage. Over time though, the primary cost will move from plant to power and minimising the electricity price input becomes the key requirement after 2030. The impact of these variables can be seen in Figure 9, which shows the price of hydrogen produced by wind and solar. Wind has a higher capacity factor, reducing the relative contribution of capital expenditure; however, this advantage is quickly lost to solar power, which offers a lower cost of energy.
This work uses lower estimates by government agencies; however, there are still more optimistic projections and it is possible the AUD 2/kg target may be reached earlier [39]. Industry believes this is possible by 2030 with favourable commercial circumstances including government support and co-investments, declining costs of electrolysers and cheap renewable electricity [21]. Lower costs are certainly achievable in exceptional locations such as Pilbara region of Western Australia, though this will be exported or used by large industrial consumers which is not the focus of this study.

3.2.2. Valorisation in 2025

Developers are expecting to adopt phased project implementation to take advantage of falling costs over time as the industry develops with economies of scale [34]. Blending is another option for affordable early integration of renewable hydrogen. Some businesses have expressed a willingness to pay a “green premium” [34]. If hydrogen at AUD 18.28/GJ was blended at 10% by volume into natural gas at AUD 10.20/GJ the cost premium would be a modest 2.7% (AUD 0.28/GJ). Sector coupling opportunities also exist for industrial clusters.
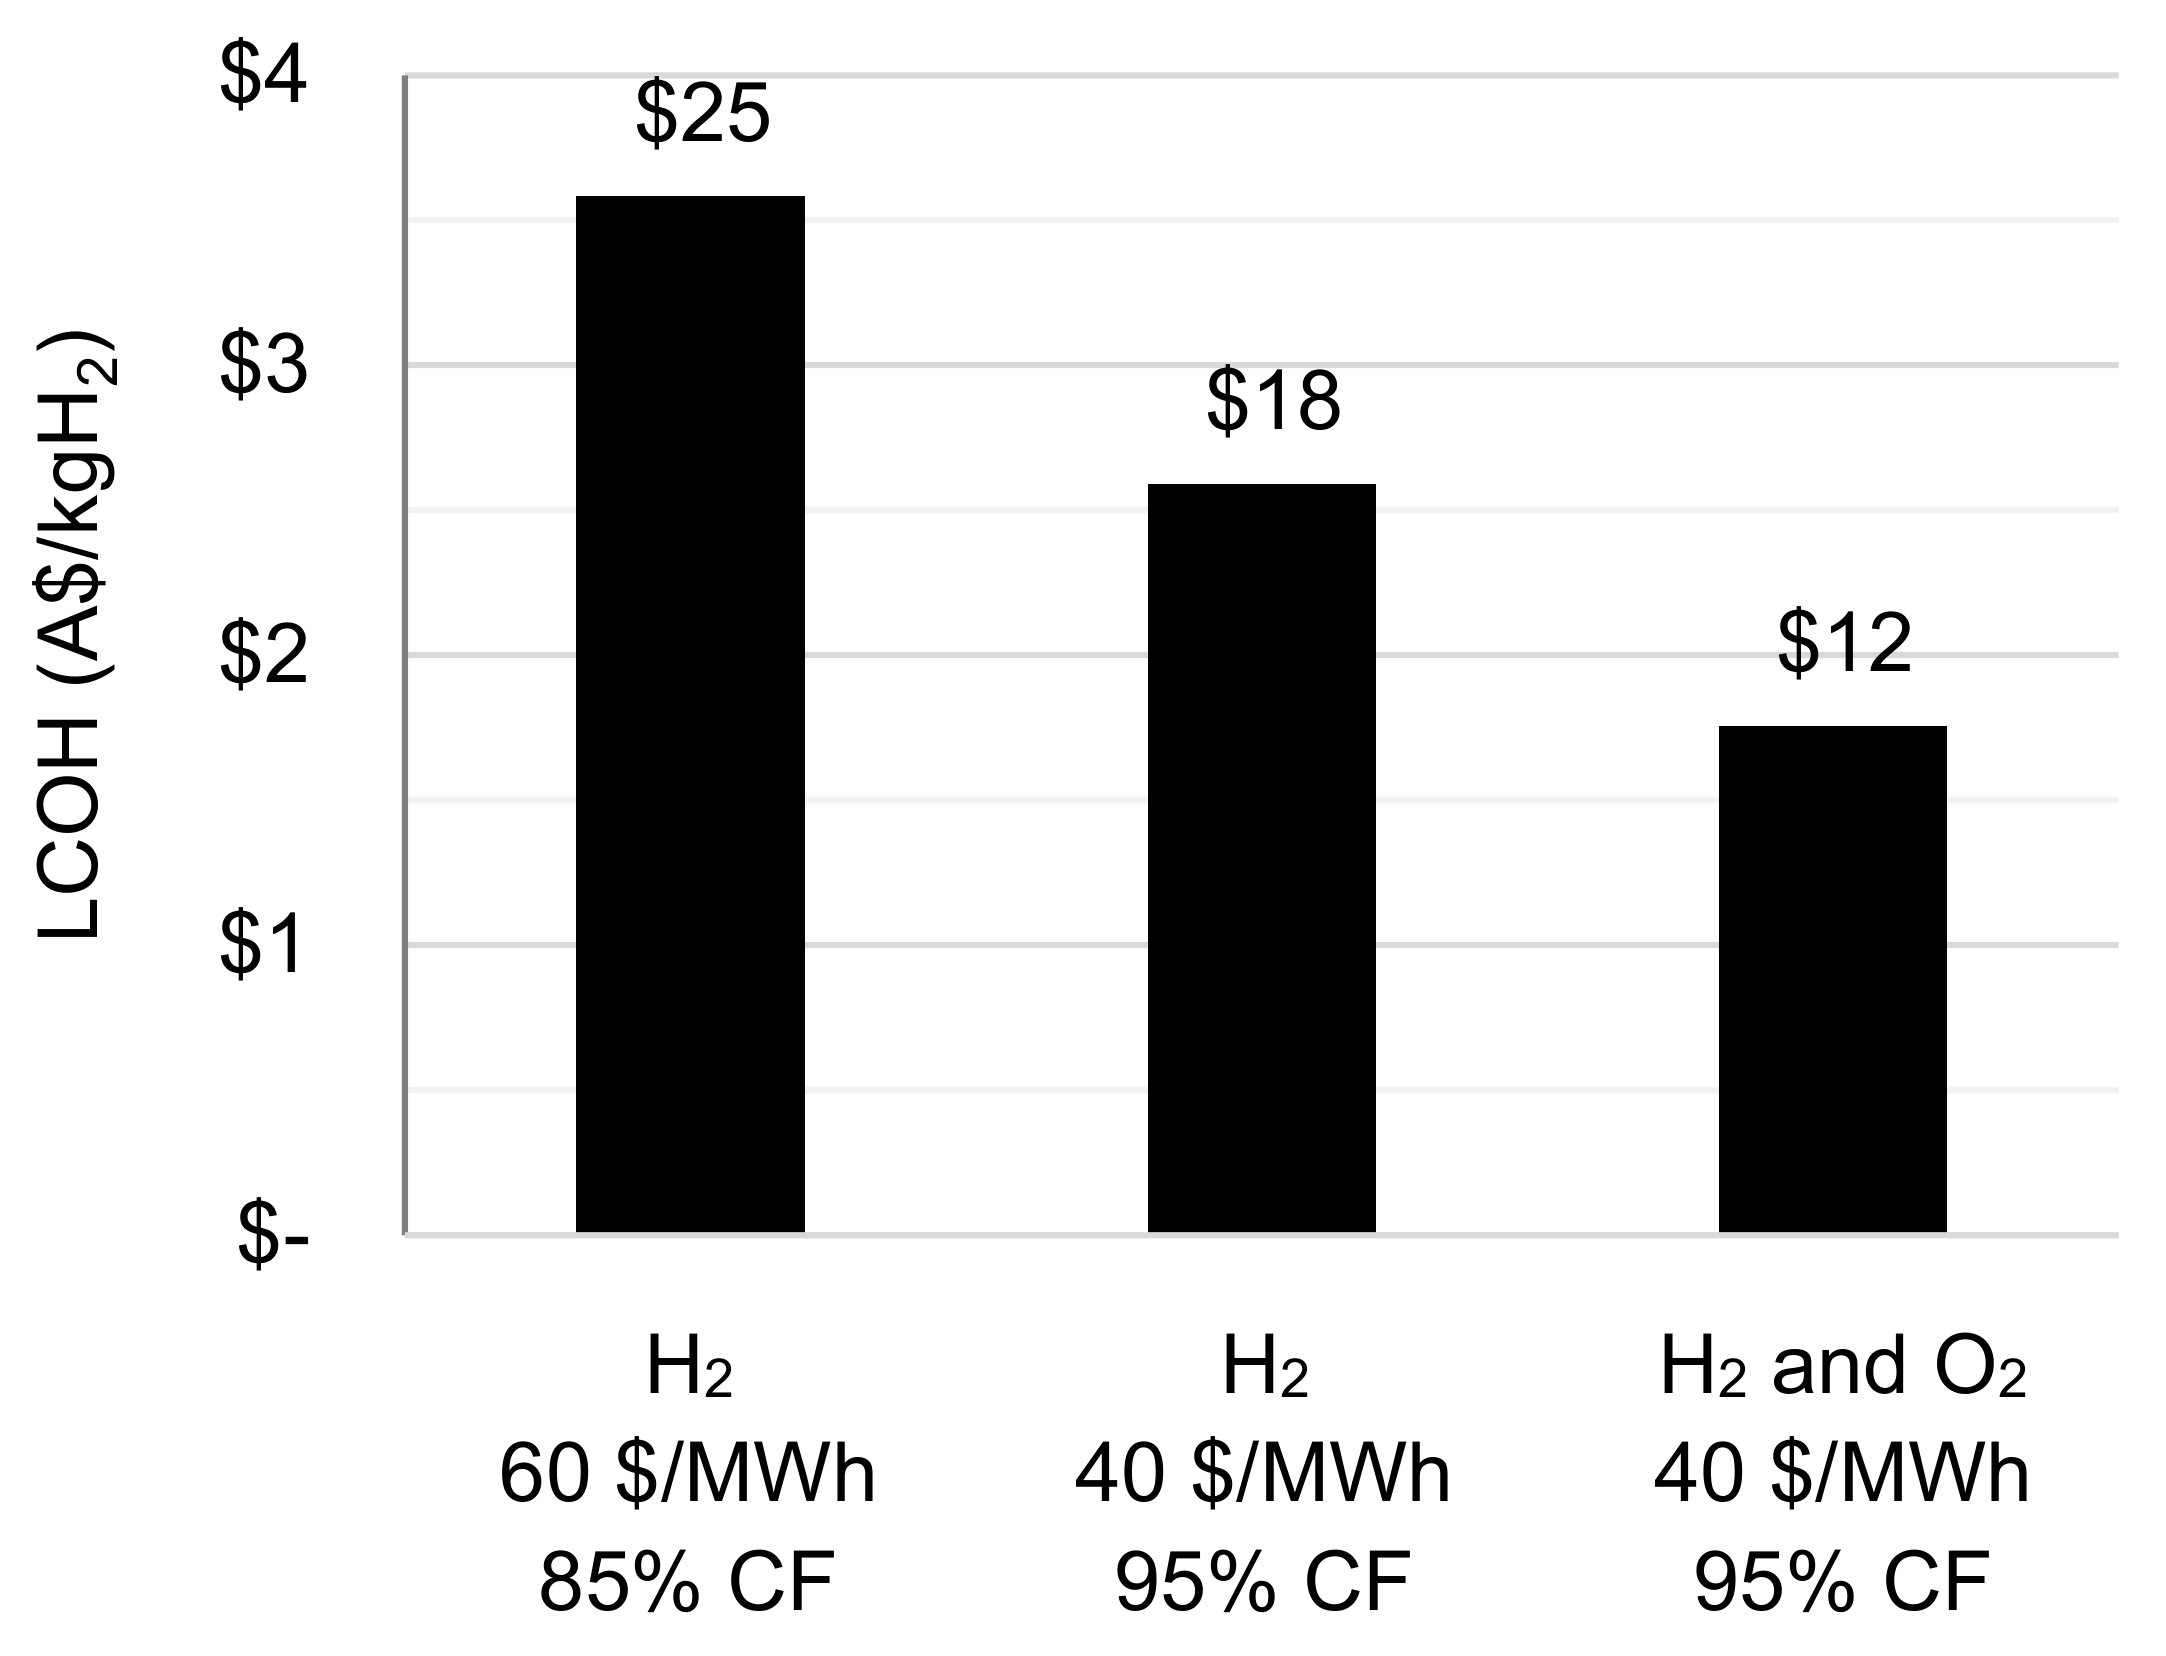
Power-to-X exists in emerging sustainable resource ecosystems where byproducts and ancillary services can be valued. Oxygen is the most obvious example of potential coproduction value, being the other component of water that is released during electrolysis. Figure 10 below shows the price impact of valuing oxygen coproduction at AUD 0.10/kgO2 (AUD 0.15/m3O2). Combined with a high capacity factor and a low electricity price this brings the breakeven price of hydrogen below AUD 2/kgH2 in 2025.
A 1 MW electrolysis plant would produce approximately 2 tonnes per day (tpd) of oxygen. This is useful in a range of applications, from chemicals and metals, to health and water treatment. High-grade oxygen (99.5% purity) can be used in hospitals for ventilators, or as an input for integrated local hydrogen peroxide manufacturing [58]. Other chemicals that require oxygen include ethylene oxide, acrylic acid and benzylic acid. The value of oxygen for wastewater treatment has also long been recognised [59], and aquaculture is another opportunity for microgrids [60]. In industrial settings oxygen is used at various scales for metals processing.
Grid ancillary services are often discussed as another supplementary revenue stream for power-to-gas plants [61]; however, the market is small and will be quickly saturated by batteries [62,63]. Hydrogen needs to be produced at under AUD 1.75/kg (AUD 12.34/GJ) for fuel cells to be competitive against batteries for energy storage [62]. The oxygen market is also smaller than the potential market for hydrogen. The value of cobenefits for hydrogen price reduction is therefore limited to the medium term.
Another approach to reducing the cost is coupling waste biomass oxidation with hydrogen generation during electrolysis [64,65]. Biomass oxidation requires a much lower energy input compared to oxygen evolution reaction, thereby reducing the energy consumption and at the same time creating niche value-added chemicals whilst at the same time enabling a circular economy. This is an emerging strategy and, while promising, is also limited in scope.

3.2.3. Methanation in 2030

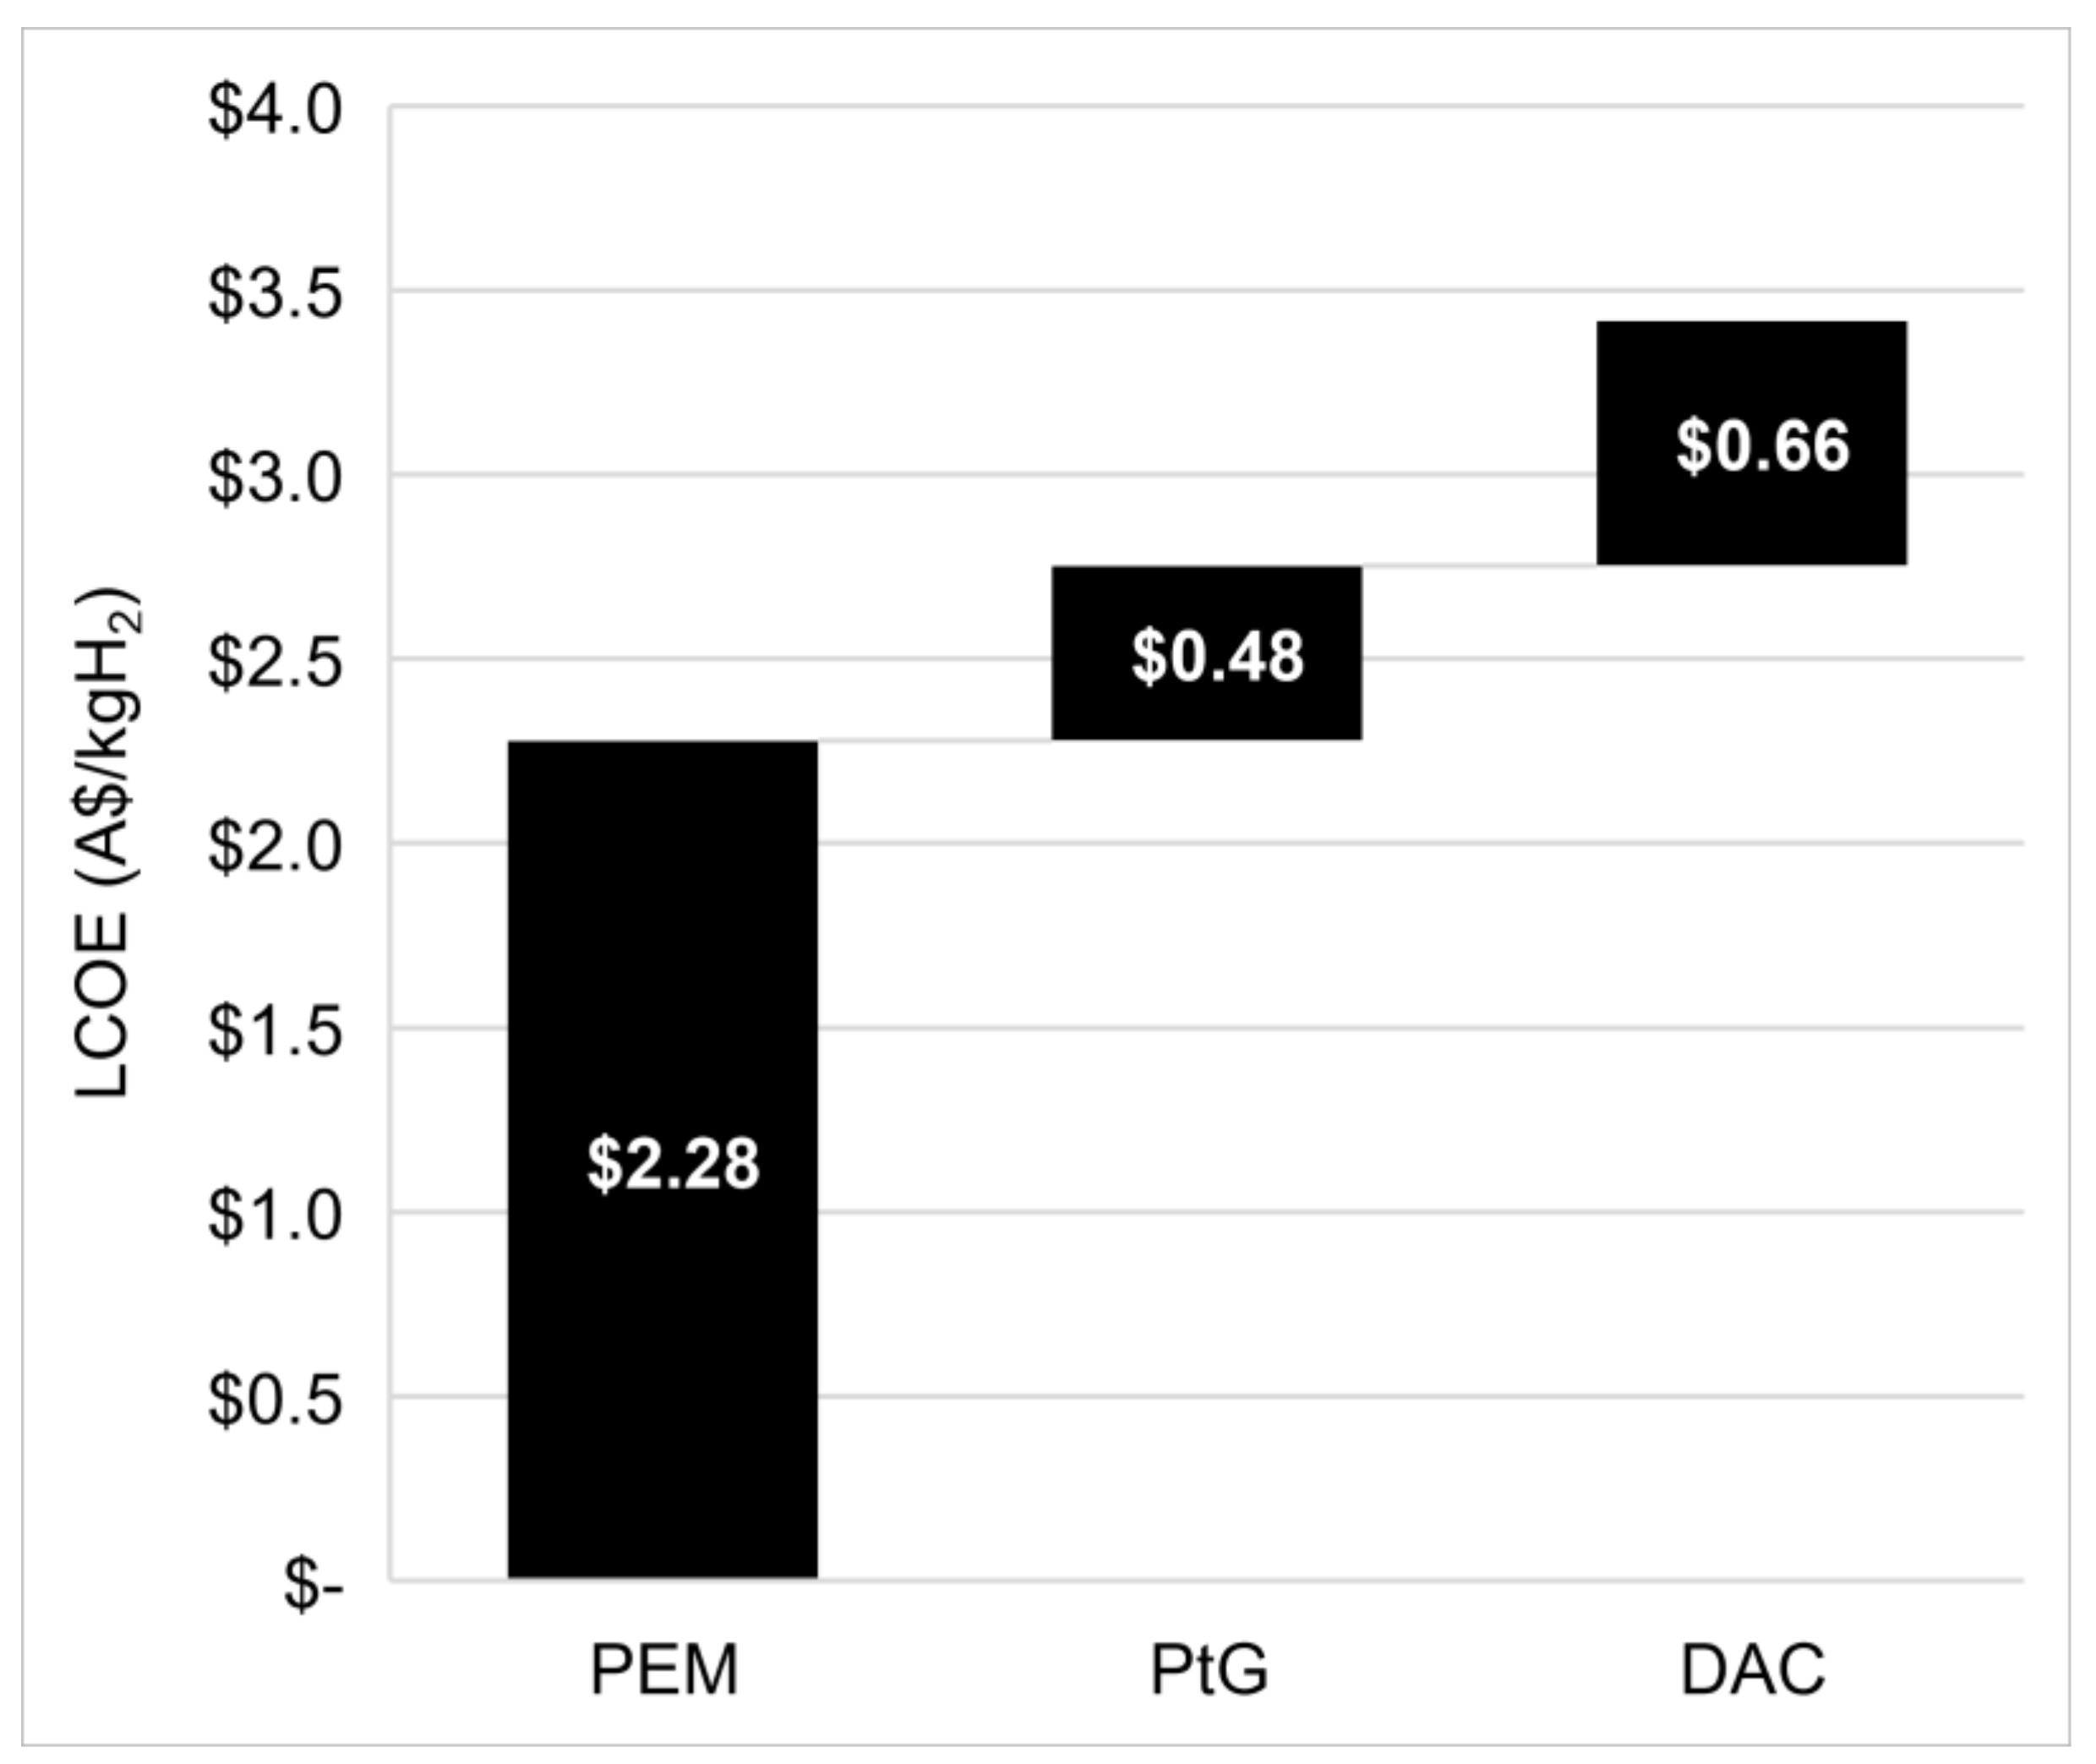
Another medium-term consideration is the integration of hydrogen into the gas network. As discussed earlier in this paper, hydrogen can be blended in small quantities in the existing network, or full conversion can be undertaken. The challenge is the transition between partial and full displacement of natural gas. Synthetic methane may play a role in this, enabling the continuing use of natural gas infrastructure including critical, large-scale underground storage capacity. Figure 11 shows the cost of methane production via a Power-to-Gas plant using 2030 base case costs for high temperature electrified DAC [38] and CM [30] operating at 8000 Full Load Hours (FLH, approximately 91% CF).
It is worthwhile considering here the potential impact of exports. Australia’s domestic energy prices have been heavily impacted by overseas demand for LNG [66,67]. Industry may face similar challenges with renewable hydrogen exports which, as discussed in the introduction, may be enabled by ammonia produced from very low cost green hydrogen resources. Recent, ongoing developments in electrocatalysis for the direct production of renewable ammonia could have a dramatic impact on future outcomes [68].

3.2.4. Storage in 2050

The costs of long-term hydrogen storage are not well understood in the Australian context [69]. Here, potential solutions for securing gas supply are assessed, incorporating the associated transport costs. Storage costs are drawn from the “possible future” Levelised Cost of Storage (LCOS) values of the 2020 Bloomberg New Energy Finance (BNEF) Hydrogen Economy Outlook [12].
To account for the location of large-scale storage sites, transmission costs were drawn from pipeline tariffs in AEMO’s GSOO Reserves Costs assumptions. The value for both directions between Moomba and Sydney (MSP) and between Moomba and Wallumbilla (SWQP) was used for salt cavern storage, and both directions between Wallumbilla and Brisbane (RBP) was used for depleted field storage. Although hydrogen is lower density than methane it flows almost three times faster through pipes over distance and the chosen values are consistent with intercity transmission pipeline costs derived by BNEF [12].
An alternative to storage would be to ramp up electrolyser output during periods of high gas demand. Assuming there is additional physical capacity in electricity supply, this would draw on firmed renewables rather than low cost solar. The on-demand cost is calculated herein from electrolysis powered by battery firmed wind at AUD 55/MWh [70] running a PEM electrolyser at 50% capacity. The LCOH for the same electrolyser running at 32% capacity powered by solar at AUD 22/MWh is subtracted to give the premium or marginal cost of production.
Figure 12 compares the costs of storage and associated transmission in 2050. The base cost of input hydrogen is excluded or subtracted for the premium for hydrogen produced on demand via electrolysis. Whether this is practical depends heavily on network conditions, for example if the hydrogen is providing a back-stop for low renewable output via GPG then on-demand grid-powered electrolysis is not an option. Optimising distribution and curtailment also requires further research for efficiently coupled electricity and gas networks [71].

3.2.5. Wholesale in 2050

Meeting industry and consumer gas demand using green hydrogen in the gas network requires the consideration of production, storage and transmission together. Figure 13 shows the abatement cost of renewable hydrogen when compared to the natural gas wholesale, transmission and storage cost forecast used in the GSOO.
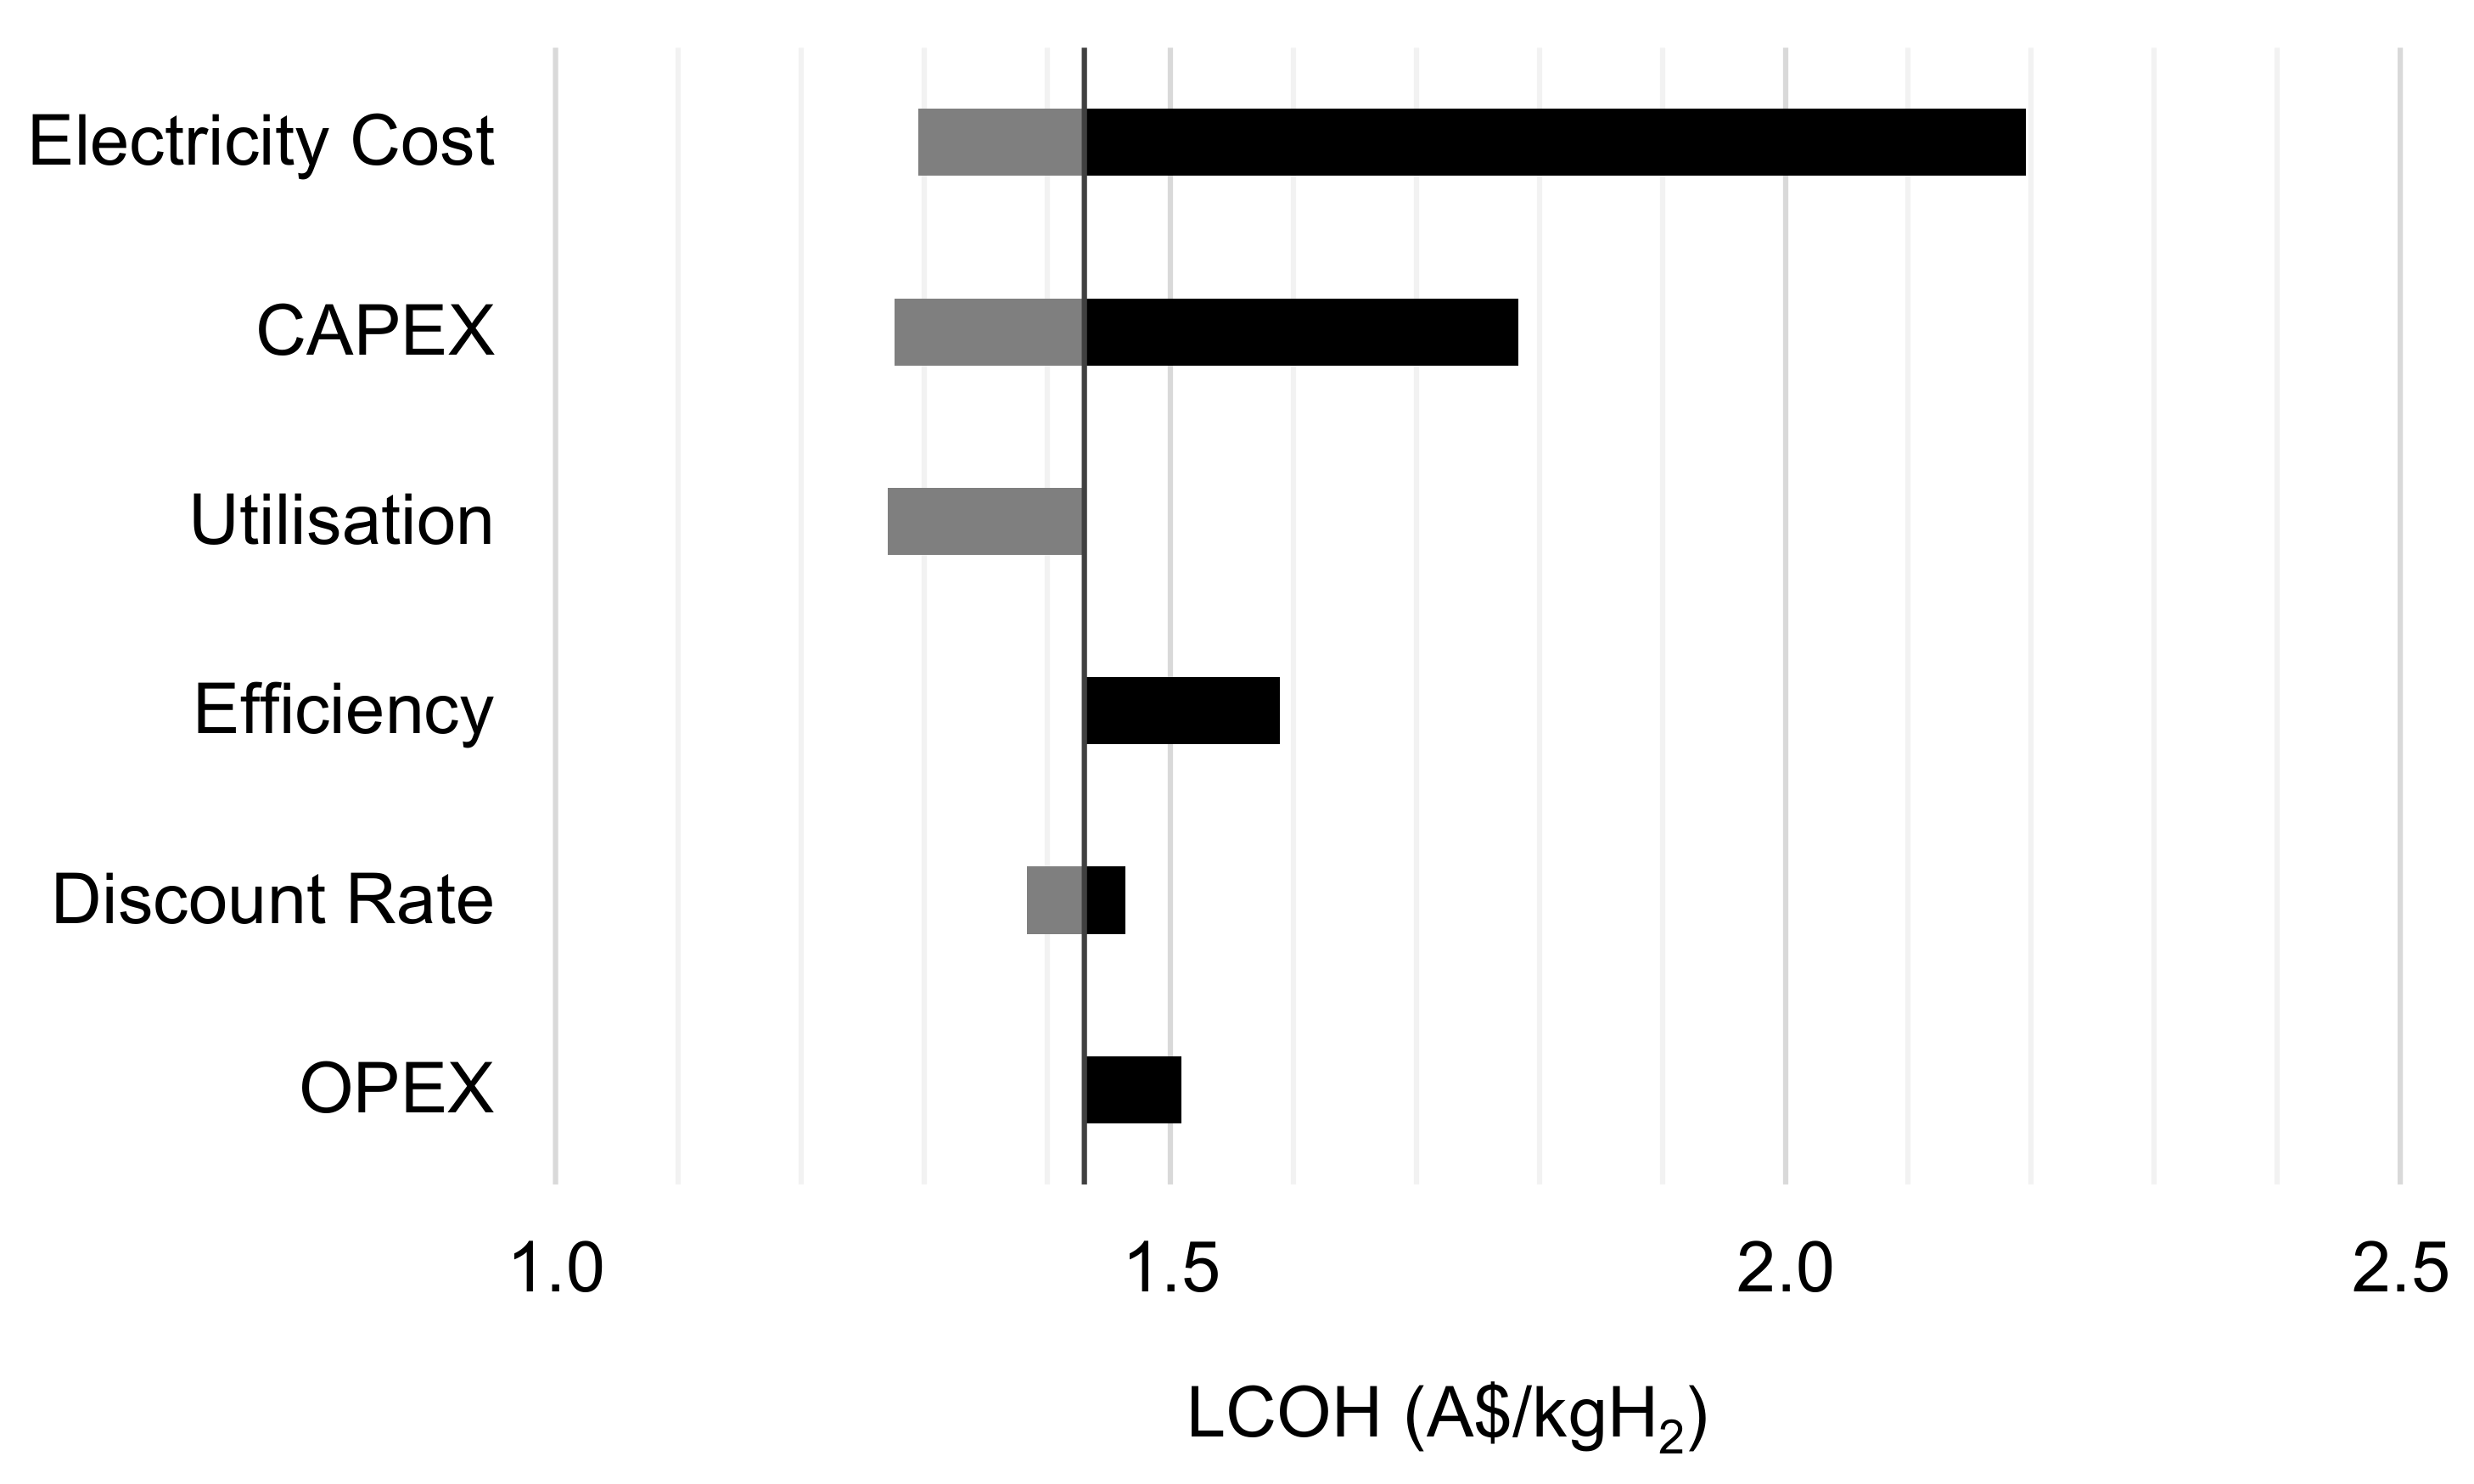
Methane leaks from the natural gas industry are a significant concern [72] and may change abatement values. The cost of renewable hydrogen is also sensitive to a range of other variables, as shown in Figure 14. CAPEX forecasts for 2050 vary between AUD 159/kW [12] and AUD 441/kW [36], and OPEX may be as high as 4% [30]. As shown earlier, the electricity price, potentially as low as AUD 19/MWh [12] or as high as AUD 19/MWh [36], has a dramatic impact on the cost of renewable hydrogen. Improving the utilisation to 50% [3] while maintaining a low average electricity price could bring the price down to AUD 1.27/kgH2. Higher energy consumption of 50 kWh/kgH2 [3] could lead to higher prices. Nevertheless, these results are consistent with the BNEF conclusion that it is likely still necessary to place a value on emission reductions even if renewable hydrogen experiences the predicted dramatic cost reductions.

3.3. Gas Transition

The largest uncertainty in energy scenario modelling is demand [73], and this study is no exception. Blakers et al. posit Australia may already be aligned with the ISP “Step Change” scenario in terms of renewable generating capacity [2]. The GSOO forecasts increased gas consumption in that future and policies such as a green hydrogen target [74] may help drive gas decarbonisation at the early stage to 2030. The environment is much less certain post-2030 as the economy transitions to net zero by 2050. Independent researchers expect that gas is likely to play a diminished role in Australia’s energy mix [75] though hydrogen with gas infrastructure is uniquely positioned to provide strategic energy storage [76] and supply security.
The debate largely hinges on a comparison with deep, widespread, direct electrification. Research commissioned by the gas industry claims decarbonising gas with hydrogen will be less expensive [77]. Hydrogen pipelines have a longer lifespan and can transport more energy at a lower cost than electricity transmission lines [78], and using renewable hydrogen for heating avoids the severe energy penalty from round-trip reconversions to electricity [79]. Hydrogen has the highest probability of providing the lowest levelized cost of seasonal storage in the long term when compared to eight other electricity storage technologies [80]. Scenarios with low gas prices and CCS cost reductions are, however, contentious [81].
A future fall in demand for gas for energy may be partially offset by growing demands for clean hydrogen in other sectors which are difficult to transition to a sustainable paradigm in any other way. Via Power-to-X [82], renewable hydrogen has the capability to be more than an energy carrier and storage medium; it also serves as a key feedstock for chemical manufacturing and heavy industries. Using direct reduction of iron ore (DRI), hydrogen can replace metallurgical coal in steel making, where every tonne of steel requires 0.051 tonnes of hydrogen [83]. This is considered a significant opportunity for Australia [84]. Similarly, clean hydrogen can feed ammonia production and other chemical synthesis. Hydrogen is projected to fuel up to 100% of Australian and international steel manufacturing, and up to 50% of the market for chemical feedstock [85].

4. Conclusions

Hydrogen is expected to play a critical role in Eastern Australia’s energy networks, enabling the transition from fossil fuels to sustainable, decarbonised grids for a net zero future. This study investigated a transition pathway for the gas network with renewable hydrogen, including plausible growth projections and technoeconomic assessment of key technologies. Based on Australia’s experience with scalable renewable technology it is possible to achieve the medium-term target of blending 10% v/v hydrogen into the existing natural gas infrastructure by 2030.
It is possible to achieve 10% v/v renewable hydrogen substitution with a 50% growth rate, as demonstrated by the solar industry, with costs as low as AUD 12/GJ including coproduction valorisation or modest (3%) green premiums. Power-to-gas plants including methanation can deliver flexibility during a phased conversion to 100% hydrogen while economies of scale drive down costs and new infrastructure (such as salt caverns) is developed. The costs associated with large-scale transmission and storage may be almost AUD 1/kgH2; however, the long-term abatement cost when compared to natural gas combustion is likely to be modest (AUD 18/tCO2-e).
Gas will face strong competition from direct electrification over the longer term, though seasonal storage capacity remains a key strength of the gas network. Industry will also continue to use gas for a range of applications, relying on the ability to transport molecules rather than only electrons. In any case, government support and industry collaboration will be key for the long-term viability of Eastern Australia’s increasingly coupled energy networks. Future research will focus on scaling and integrating the renewable gas technologies that will enable the gas transition, and foresight studies to better inform strategic investment and policy development.

Author Contributions

Conceptualization, N.G., B.M., R.D. and R.A.; Formal analysis, N.G.; Funding acquisition, B.M. and R.A.; Investigation, N.G. and R.D.; Methodology, N.G.; Project administration, B.M. and R.A.; Supervision, B.M. and R.A.; Visualization, N.G.; Writing—review & editing, B.M., R.D. and R.A. All authors have read and agreed to the published version of the manuscript.

Funding

This research received no external funding.

Data Availability Statement

Data is available through the Archives of the University of Newcastle.

Conflicts of Interest

The Priority Research Centre for Frontier Energy Technologies & Utilisation and Particles and Catalysis Research Laboratory receive grant funding from organisations including the Australian and NSW Governments, the APA Group and Southern Green Gas Pty Limited.

Abbreviations

AAPLAustralia-ASEAN Power Link
AEMOAustralian Energy Market Operator
AREHAustralian Renewable Energy Hub
ARENAAustralian Renewable Energy Agency
AUDAustralian Dollar
BOPBalance of Plant
CAPEXCapital Expenditure
CCMCatalyst Coated Membrane
CCSCarbon Capture and Storage
CMCatalytic Methanation
CSIROCommonwealth Scientific and Industrial Research Organisation
DACDirect Air Capture
DCFDiscounted Cash Flow
DRIDirect Reduced Iron
EAEastern Australia
EUEuropean Union
GPGGas Powered Generation
GSOOGas Statement of Opportunities
HESCHydrogen Energy Supply Chain
HHVHigher Heating ValueMJ/kg
ISPIntegrated System Plan
LCOELevelised Cost of EnergyAUD/GJ
LCOHLevelised Cost of HydrogenAUD/kgH2
LCOSLevelised Cost of StorageAUD/kgH2
LCOXLevelised Cost of XAUD/GJ
LNGLiquified Natural Gas
MEAMembrane Electrode Assembly
NEMNational Electricity Market
NSWNew South Wales
NTNorthern Territory
OPEXOperating Expenditure
O&MOperations and Maintenance
PEMPolymer Exchange Membrane
PtGPower-to-Gas
PVPhotovoltaic
QLDQueensland
SASouth Australia
SMRSteam Methane Reforming
TASTasmania
VICVictoria
VREVariable Renewable Energy
WAWestern Australia

References

  1. International Energy Agency. The Future of Hydrogen. 2019. Available online: https://www.iea.org/reports/the-future-of-hydrogen/ (accessed on 14 June 2020).
  2. Blakers, A.; Baldwin, K.; Stocks, M. Australia, the Global Renewable Energy Pathfinder. 2020. Available online: http://re100.eng.anu.edu.au/news/2020-09-03.php (accessed on 27 January 2021).
  3. Australian Energy Market Operator. Draft 2021 Inputs, Assumptions and Scenarios Report; AEMO: Melbourne, Australia, 2020. [Google Scholar]
  4. Energy Networks Australia. Gas Vision 2050. 2020. Available online: https://www.energynetworks.com.au/projects/gas-vision-2050/ (accessed on 19 January 2021).
  5. Commonwealth of Australia. Australia’s National Hydrogen Strategy. 2019. Available online: https://www.industry.gov.au/data-and-publications/australias-national-hydrogen-strategy (accessed on 10 July 2020).
  6. Australian Government Department of Industry Science Energy and Resources. National Hydrogen Strategy Priorities and Delivery 2020. Available online: https://www.industry.gov.au/news/national-hydrogen-strategy-priorities-and-delivery-for-2020 (accessed on 22 February 2021).
  7. International Renewable Energy Agency. Hydrogen: A Renewable Energy Perspective. 2019. Available online: https://www.irena.org/publications/2019/Sep/Hydrogen-A-renewable-energy-perspective (accessed on 14 July 2020).
  8. Hydrogen Engineering Australia. Hydrogen Energy Supply Chain 2020. Available online: https://hydrogenenergysupplychain.com/ (accessed on 5 August 2020).
  9. Victoria State Government. The CarbonNet Project 2020. Available online: https://earthresources.vic.gov.au/projects/carbonnet-project (accessed on 5 August 2020).
  10. Deloitte Access Economics. Decarbonising Australia’s Gas Distribution Networks 2017. Available online: https://www2.deloitte.com/au/en/pages/economics/articles/decarbonising-australias-gas-distribution-networks.html (accessed on 27 January 2021).
  11. Browne, B. Sunk costs: Carbon Capture and Storage Will Miss Every Target Set for It; The Australia Institute: Canberra, Australia, 2018. [Google Scholar]
  12. Bloomberg New Energy Finance. Hydrogen Economy Outlook. 2020. Available online: https://assets.bbhub.io/professional/sites/24/BNEF-Hydrogen-Economy-Outlook-Key-Messages-30-Mar-2020.pdf (accessed on 2 September 2020).
  13. European Commission. A Hydrogen Strategy for a Climate-Neutral Europe; European Comission: Brussels, Belgium, 2020. [Google Scholar]
  14. Taylor, A.; Birmingham, S.; Pitt, K. Exploring Australia’s Hydrogen Future with Germany 2020. Available online: https://www.minister.industry.gov.au/ministers/taylor/media-releases/exploring-australias-hydrogen-future-germany (accessed on 22 February 2021).
  15. Saba, S.M.; Müller, M.; Robinius, M.; Stolten, D. The investment costs of electrolysis—A comparison of cost studies from the past 30 years. Int. J. Hydrog. Energy 2018, 43, 1209–1223. [Google Scholar] [CrossRef]
  16. Quarton, C.J.; Samsatli, S. Power-to-gas for injection into the gas grid: What can we learn from real-life projects, economic assessments and systems modelling? Renew. Sustain. Energy Rev. 2018, 98, 302–316. [Google Scholar] [CrossRef]
  17. Melaina, M.W.; Penev, M.; Zuboy, J. Hydrogen Blending in Natural Gas Pipelines. In Handbook of Clean Energy Systems; John Wiley & Sons, Ltd.: Chichester, UK, 2015; pp. 1–13. [Google Scholar] [CrossRef]
  18. Sadler, D.; Cargill, A.; Crowther, M.; Rennie, A.; Watt, J.; Burton, S.; Haines, M.; Trapps, J.; Hand, M.; Pomroy, R.; et al. H21 Leeds City Gate Report. 2016. Available online: https://h21.green/projects/h21-leeds-city-gate/ (accessed on 15 September 2020).
  19. GPA Engineering. Hydrogen in the Gas Distribution Networks; GPA Engineering: Adelaide, Australia, 2019. [Google Scholar]
  20. Sampson, J. Worcester Bosch Wants only Hydrogen-Ready Boilers on the Market by 2025; H2 View: Truro, Cornwall, UK, 2020. [Google Scholar]
  21. Wilson, B. Gas in Australia: Low Carbon Today, Zero Carbon Tomorrow; Australian Institute of Energy: Canberra, Australia, 2020. [Google Scholar]
  22. Cadent. HyNet North West; Cadent Gas Ltd.: Coventry, United Kingdom, 2020. [Google Scholar]
  23. Australian Energy Market Operator. 2020 Integrated System Plan. AEMO: Melbourne, Australia, 2020. [Google Scholar]
  24. BioAge Group. Audi Opens Power-to-Gas Facility in Werlte/Emsland. Green Car Congress 2013. Available online: https://www.greencarcongress.com/2013/06/audi-20130625.html (accessed on 5 March 2021).
  25. Ogawa, K. Japan to Help Build Giant Methane Production Plant in China. Nikkei 2020. Available online: https://asia.nikkei.com/Spotlight/Environment/Japan-to-help-build-giant-methane-production-plant-in-China (accessed on 20 December 2020).
  26. Australian Renewable Energy Agency. APA Renewable Methane Demonstration Project 2020. Available online: https://arena.gov.au/news/trialling-renewable-methane-in-australias-gas-pipelines/ (accessed on 10 August 2020).
  27. Ali Khan, M.H.; Daiyan, R.; Han, Z.; Hablutzel, M.; Haque, N.; Amal, R.; MacGill, I. Designing Optimal Integrated Electricity Supply Configurations for Renewable Hydrogen Generation in Australia. IScience 2021, 24, 102539. [Google Scholar] [CrossRef]
  28. Dickson, A. The Asian Renewable Energy Hub: Renewable Energy at Oil and Gas Scale; Australian Institute of Energy: Perth, Australia, 2020. [Google Scholar]
  29. Australian Energy Market Operator. 2020 Gas Statement of Opportunities; AEMO: Melbourne, Australia, 2020. [Google Scholar]
  30. McDonagh, S.; O’Shea, R.; Wall, D.M.; Deane, J.P.; Murphy, J.D. Modelling of a power-to-gas system to predict the levelised cost of energy of an advanced renewable gaseous transport fuel. Appl. Energy 2018, 215, 444–456. [Google Scholar] [CrossRef]
  31. Gorre, J.; Ortloff, F.; van Leeuwen, C. Production costs for synthetic methane in 2030 and 2050 of an optimized Power-to-Gas plant with intermediate hydrogen storage. Appl. Energy 2019, 253, 113594. [Google Scholar] [CrossRef]
  32. IRENA. Green Hydrogen Cost Reduction: Scaling up Electrolysers to Meet the 1.5 °C Climate Goal. Abu Dhabi, United Arab Emirates: 2020. Available online: https://www.irena.org/publications/2020/Dec/Green-hydrogen-cost-reduction (accessed on 7 June 2021).
  33. Thompson, S.T.; James, B.D.; Huya-Kouadio, J.M.; Houchins, C.; DeSantis, D.A.; Ahluwalia, R.; Wilson, A.R.; Kleen, G.; Papageorgopoulos, D. Direct hydrogen fuel cell electric vehicle cost analysis: System and high-volume manufacturing description, validation, and outlook. J. Power Sources 2018, 399, 304–313. [Google Scholar] [CrossRef]
  34. Freeman, A.; Miller, D.; Simon, F.; Maloney, R.; Norman, D. Australia’s Hydrogen Future. In Proceedings of the All Energy Australia Virtual Conference, Melbourne, Australia, 6 October–12 November 2020. [Google Scholar]
  35. Campey, T.; Bruce, S.; Yankos, T.; Hayward, J.; Graham, P.; Reedman, L.; Brinsmead, T.; Deverell, J. Low Emissions Technology Roadmap: Technical Report; CSIRO: Canberra, Australia, 2017. [Google Scholar]
  36. Graham, P.; Hayward, J.; Foster, J.; Havas, L. GenCost 2020–21: Consultation Draft; CSIRO: Canberra, Australia, 2020. [Google Scholar]
  37. Yates, J.; Daiyan, R.; Patterson, R.; Egan, R.; Amal, R.; Ho-Baille, A.; Chang, N.L. Techno-economic Analysis of Hydrogen Electrolysis from Off-Grid Stand-Alone Photovoltaics Incorporating Uncertainty Analysis. Cell Rep. Phys. Sci. 2020. [Google Scholar] [CrossRef]
  38. Fasihi, M.; Efimova, O.; Breyer, C. Techno-economic assessment of CO2 direct air capture plants. J. Clean. Prod. 2019, 224, 957–980. [Google Scholar] [CrossRef]
  39. Longden, T.; Jotzo, F.; Prasad, M.; Andrews, R. Green Hydrogen Production Costs in AUSTRALIA: Implications of Renewable Energy and Electrolyser Costs; Australian National University: Canberra, Australia, 2020. [Google Scholar]
  40. Mayyas, A.; Ruth, M.; Pivovar, B.; Bender, G.; Wipke, K. Manufacturing Cost Analysis for Proton Exchange Membrane Water Electrolyzers; National Renewable Energy Laboratory (NREL): Golden, CO, USA, 2019.
  41. Gilbert, A.Q.; Sovacool, B.K. Looking the wrong way: Bias, renewable electricity, and energy modelling in the United States. Energy 2016, 94, 533–541. [Google Scholar] [CrossRef] [Green Version]
  42. Teske, S. The IEA World Energy Outlook: A critical review 2000–2020; University of Technology Sydney: Sydney, Australia, 2020. [Google Scholar]
  43. Bruce, S.; Temminghoff, M.; Hayward, J.; Schmidt, E.; Munnings, C.; Palfreyman, D.; Hartley, P. National Hydrogen Roadmap; CSIRO: Canberra, Australia, 2018. [Google Scholar]
  44. McAllister, S.; Chen, J.-Y.; Fernandez-Pello, A.C. Fundamentals of Combustion Processes; Springer: New York, NY, USA, 2011. [Google Scholar] [CrossRef]
  45. Australian Government Department of Industry, Science, Energy and Resources. National Greenhouse Accounts Factors. 2020. Available online: https://www.industry.gov.au/data-and-publications/national-greenhouse-accounts-factors (accessed on 21 January 2021).
  46. Wright, M.; Hearps, P. Zero Carbon Australia Stationary Energy Plan. 2010. Available online: https://bze.org.au/wp-content/uploads/2021/02/stationary-energy-plan-bze-report-2010.pdf (accessed on 5 March 2021).
  47. Elliston, B.; Diesendorf, M.; Macgill, I. Simulations of scenarios with 100% renewable electricity in the Australian National Electricity Market. Energy Policy 2012, 45, 606–613. [Google Scholar] [CrossRef]
  48. Blakers, A.; Lu, B.; Stocks, M. 100% renewable electricity in Australia. Energy 2017, 133, 471–482. [Google Scholar] [CrossRef]
  49. Australian PV Institute. APVI/ARENA Solar Map. Funded by Aust Renew Energy Agency 2021. Available online: pv-map.apvi.org.au (accessed on 21 January 2021).
  50. Masson, G.; Kaizuka, I. Trends in Photovoltaic Applications 2019. 2019. Available online: 10.13140/RG.2.2.10332.00647 (accessed on 9 October 2020).
  51. Australian Energy Regulator. Annual Generation Capacity and Peak Demand—NEM. Wholesale Statistics 2021. Available online: https://www.aer.gov.au/wholesale-markets/wholesale-statistics/annual-generation-capacity-and-peak-demand-nem (accessed on 5 February 2021).
  52. The Climate Council of Australia. The Australian Renewable Energy Race: Which States are Winning or Losing? Climate Council of Australia Limited: Sydney, Australia, 2014. [Google Scholar]
  53. Sun Cable. Australia-ASEAN Power Link 2020. Available online: https://www.suncable.sg/ (accessed on 6 August 2020).
  54. Frontier Economics. The Benefits of Gas Infrastructure to Decarbonise Australia. 2020. Available online: https://www.energynetworks.com.au/resources/reports/2020-reports-and-publications/the-benefits-of-gas-infrastructure-to-decarbonise-australia-frontier-economics/ (accessed on 12 October 2020).
  55. Haeseldonckx, D.; D’haeseleer, W. The use of the natural-gas pipeline infrastructure for hydrogen transport in a changing market structure. Int. J. Hydrog. Energy 2007, 32, 1381–1386. [Google Scholar] [CrossRef]
  56. Sepulveda, N.A.; Jenkins, J.D.; Edington, A.; Mallapragada, D.S.; Lester, R.K. The design space for long-duration energy storage in decarbonized power systems. Nat. Energy 2021. [Google Scholar] [CrossRef]
  57. Ahluwalia, R.K.; Papadias, D.D.; Peng, J.; Roh, H.S. System Level Analysis of Hydrogen Storage Options. 2019. Available online: https://www.hydrogen.energy.gov/pdfs/review19/st001_ahluwalia_2019_o.pdf (accessed on 15 September 2020).
  58. Gurieff, N.; Green, D.; Koskinen, I.; Lipson, M.; Baldry, M.; Maddocks, A.; Menictas, C.; Noack, J.; Moghtaderi, B.; Doroodchi, E. Healthy Power: Reimagining Hospitals as Sustainable Energy Hubs. Sustainability 2020, 12, 8554. [Google Scholar] [CrossRef]
  59. Boon, A.G. Use of oxygen in the treatment of waste water. H2O 1977, 10, 219–222. [Google Scholar]
  60. Brand, E.; Gray, E.; Ashworth, P.; Hodgson, P.; Broadbent, A. Hydrogen Unpacked: Learnings on the adoption of hydrogen in Australia and globally. In Proceedings of the National Cleantech Conference, Brisbane, Australia, 24–26 November 2020. [Google Scholar]
  61. Breyer, C.; Tsupari, E.; Tikka, V.; Vainikka, P. Power-to-gas as an emerging profitable business through creating an integrated value chain. Energy Procedia 2015, 73, 182–189. [Google Scholar] [CrossRef] [Green Version]
  62. Percy, S.; Hayward, J.; McConnell, D. Electricity Storage Economics: Contemporary Developments. In Proceedings of the ERICA Webinar Series, Melbourne, Australia, 10 December 2020. [Google Scholar]
  63. Aurecon. Large-Scale Battery Storage Knowledge Sharing Report. 2019. Available online: https://arena.gov.au/knowledge-bank/large-scale-battery-storage-knowledge-sharing-report/ (accessed on 22 January 2021).
  64. Liu, W.; Cui, Y.; Du, X.; Zhang, Z.; Chao, Z.; Deng, Y. High efficiency hydrogen evolution from native biomass electrolysis. Energy Environ. Sci. 2016, 9, 467–472. [Google Scholar] [CrossRef]
  65. Chen, Y.X.; Lavacchi, A.; Miller, H.A.; Bevilacqua, M.; Filippi, J.; Innocenti, M.; Marchionni, A.; Oberhauser, W.; Wang, L.; Vizza, F. Nanotechnology makes biomass electrolysis more energy efficient than water electrolysis. Nat. Commun. 2014, 5, 1–6. [Google Scholar] [CrossRef]
  66. Australian Competition & Consumer Commission. Gas Inquiry 2017–2025. 2021. Available online: https://www.accc.gov.au/publications/serial-publications/gas-inquiry-2017-2025 (accessed on 4 March 2020).
  67. McConnell, D.; Sandiford, M. Impacts of LNG Export and Market Power on Australian Electricity Market Dynamics, 2016–2019. Curr. Sustain. Energy Rep. 2020, 7, 176–185. [Google Scholar] [CrossRef]
  68. Sun, J.; Alam, D.; Daiyan, R.; Masood, H.; Zhang, T.; Zhou, R.; Cullen, P.J.; Lovell, E.C.; Jalili, A.R.; Amal, R. A hybrid plasma electrocatalytic process for sustainable ammonia production. Energy Environ. Sci. 2021, 14. [Google Scholar] [CrossRef]
  69. Commonwealth of Australia. Hydrogen for Australia’s Future. 2018. Available online: https://arena.gov.au/knowledge-bank/hydrogen-for-australias-future/ (accessed on 27 January 2021).
  70. Graham, P.; Hayward, J.; Foster, J.; Havas, L. GenCost 2019–20. 2020. Available online: https://doi.org/10.25919/5eb5ac371d372 (accessed on 14 October 2020).
  71. Henni, S.; Staudt, P.; Kandiah, B.; Weinhardt, C. Infrastructural coupling of the electricity and gas distribution grid to reduce renewable energy curtailment. Appl. Energy 2021, 288, 116597. [Google Scholar] [CrossRef]
  72. International Energy Agency. Methane Tracker 2021. 2021. Available online: https://www.iea.org/reports/methane-tracker-2021 (accessed on 25 January 2021).
  73. Pilpola, S.; Lund, P.D. Analyzing the effects of uncertainties on the modelling of low-carbon energy system pathways. Energy 2020, 201, 117652. [Google Scholar] [CrossRef]
  74. Hamilton, S.; Court, S.H.À. Australia Needs a Green Hydrogen Target. Here’s Why; The Canberra Times: Fyshwick, ACT, Australia, 2021. [Google Scholar]
  75. Wood, T.; Dundas, G. Flame Out. 2020. Available online: https://grattan.edu.au/report/flame-out-the-future-of-natural-gas/ (accessed on 16 November 2020).
  76. Liebreich, M.; Separating Hype from Hydrogen—Part 2: The Demand Side. BloombergNEF 2020. Available online: https://about.bnef.com/blog/liebreich-separating-hype-from-hydrogen-part-two-the-demand-side/ (accessed on 16 October 2020).
  77. AGIG. Using hydrogen to decarbonise natural gas consumption in Victoria is 40% less expensive than full electrification. 2018. Available online: https://www.energynetworks.com.au/resources/reports/decarbonising-victorian-gas-consumption-australian-gas-infrastructure-group/ (accessed on 27 January 2021).
  78. Hydrogen Council, McKinsey & Company. Hydrogen Insights. 2021. Available online: https://hydrogencouncil.com/en/hydrogen-insights-2021/ (accessed on 3 June 2021).
  79. Nastasi, B.; Lo Basso, G. Hydrogen to link heat and electricity in the transition towards future Smart Energy Systems. Energy 2016, 110, 5–22. [Google Scholar] [CrossRef]
  80. Schmidt, O.; Melchior, S.; Hawkes, A.; Staffell, I. Projecting the Future Levelized Cost of Electricity Storage Technologies. Joule 2019, 3, 81–100. [Google Scholar] [CrossRef] [Green Version]
  81. AEMO Planning and Forecasting. Draft 2021 Inputs, Assumptions and Scenarios Consultation Feedback. 2021. Available online: https://aemo.com.au/en/consultations/current-and-closed-consultations/2021-planning-and-forecasting-consultation-on-inputs-assumptions-and-scenarios (accessed on 4 March 2021).
  82. Siemens Energy. Power-to-X: The Crucial Business on the Way to a Carbon-Free World. Texas, USA: 2020. Available online: https://www.siemens-energy.com/global/en/offerings/technical-papers/download-power-to-x.html (accessed on 22 July 2020).
  83. Deloitte Touche Tohmatsu. Australian and Global Hydrogen Demand Growth Scenario Analysis (Erratum). 2020. Available online: https://energyministers.gov.au/sites/prod.energycouncil/files/publications/documents/Erratum%20-%20COAG%20report%20_Accessible%20version.pdf (accessed on 4 August 2020).
  84. Wood, T.; Dundas, G.; Ha, J. Start with Steel. 2020. Available online: https://grattan.edu.au/report/start-with-steel/ (accessed on 4 August 2020).
  85. Deloitte Touche Tohmatsu. Australian and Global Hydrogen Demand Growth Scenario Analysis. 2019. Available online: https://www2.deloitte.com/content/dam/Deloitte/au/Documents/future-of-cities/deloitte-au-australian-global-hydrogen-demand-growth-scenario-analysis-091219.pdf (accessed on 4 August 2020).
Figure 1. Renewable hydrogen displacing methane for storage and consumption through the gas network.
Energies 14 03968 g001
Figure 2. Conventional electricity and gas networks with one-way coupling via Gas Powered Generation (GPG).
Energies 14 03968 g002
Figure 3. Renewable hydrogen-powered fuel cells providing electricity network storage to complement batteries and pumped-hydro.
Energies 14 03968 g003
Figure 4. Power-to-gas system for synthetic methane production from renewable hydrogen including carbon recycling via carbon dioxide (CO2) capture.
Energies 14 03968 g004
Figure 5. Simplified map of the National Electricity Market (NEM) region of Eastern Australia considered in this study. Australia’s gas network faces significant geographic challenges due to long distances between demand centres and potential large-scale renewable gas storage sites such as the Adavale Basin in central Queensland (QLD).
Energies 14 03968 g005
Figure 6. Annual hydrogen production from PEM electrolysers at 95% capacity installed at 58% and 149% compounding annual growth rates from 100 MW in 2025. Ten percent of Eastern Australia’s (EA) total gas demand excluding LNG from the Australian Energy Market Operator’s (AEMO) Gas Statement Of Opportunities (GSOO) [29] as energy (E/E) and volume (V/V) fractions.
Energies 14 03968 g006
Figure 7. Annual hydrogen production from PEM electrolysers installed at a 50% annual growth rate from a 2 GW base in 2030 to replace methane in the gas network. A 32% capacity factor is assumed for operation with low-cost power from high quality solar resources. EA gas demand from AEMO GSOO [29].
Energies 14 03968 g007
Figure 8. Hydrogen fuel cells installed at 50% growth rate over 10 years starting with 10 MW in 2025 to meet 10% of forecast medium and deep dispatchable storage for the NEM. Demand from AEMO Integrated System Plan (ISP) [23]. The quantity of hydrogen storage required for 24 h at nominal power is also shown, labelled for scale. Note: salt cavern storage is in the order of 3000 t H2.
Energies 14 03968 g008
Figure 9. Levelised cost of hydrogen (LCOH) produced from wind and solar operating at highest respective capacities at lowest forecast levelised costs of energy (LCOE) with forecast PEM electrolyser costs out to 2050. LCOE with associated capacity factors for wind and solar obtained from Commonwealth Scientific and Industrial Research Organisation (CSIRO) GenCost [36]. Data labels are cost expressed as AUDAUD/GJ (HHV).
Energies 14 03968 g009
Figure 10. Levelised cost of hydrogen (LCOH) in 2025 with valorisation of oxygen (AUD 0.10/kg-O2) coproduced via electrolysis at 1 MW scale with a PEM electrolyser supplied via power purchase agreement (PPA). Electrolyser cost from CSIRO GenCost [36] and PPA prices from the National Hydrogen Roadmap [43]. Data labels show LCOH expressed as AUD/GJ (HHV).
Energies 14 03968 g010
Figure 11. Levelised cost (LCOE) of synthetic methane production (PtG) via electrolysis (PEM) and catalytic methanation (CM) [30] with carbon dioxide from electrified aqueous direct air capture (DAC) [38]: 10 MW scale operating at 8000 FLH with electricity at AUD 40/MWh. Data labels show the cost of each component in AUD/kgH2.
Energies 14 03968 g011
Figure 12. Levelised cost of storage (LCOS) for hydrogen in 2050 with associated transmission required due to geographic limitations. The base cost of the hydrogen input is excluded or subtracted for the premium for hydrogen produced on demand via electrolysis powered by battery firmed wind. Data labels are cost expressed as AUD/GJ (HHV).
Energies 14 03968 g012
Figure 13. Levelised cost of energy (LCOE) for hydrogen (H2) produced in 2050 compared to forecast average wholesale gas (NG) price including transmission and storage. 50% of the hydrogen is assumed to pass through transmission and storage (salt cavern). Data label shows cost of abatement in AUD/tonne CO2-equivalent.
Energies 14 03968 g013
Figure 14. Sensitivity analysis for the levelised cost of hydrogen (LCOH) in 2050 showing variation from the AUD 1.43/kgH2 baseline.
Energies 14 03968 g014
Table 2. Energy values.
ParameterValueUnitReferences
Hydrogen Higher Heating Value (HHV)141.72MJ/kg[44]
Methane Higher Heating Value (HHV)55.536MJ/kg[44]
Electrolyser Efficiency45kWh/kgH2[43]
Fuel Cell Efficiency0.05427kgH2/kWh[43]
Publisher’s Note: MDPI stays neutral with regard to jurisdictional claims in published maps and institutional affiliations.