1. Introduction
Currently, supplying electronic devices with alternative power sources is one of the most important issues of the dynamically developing technology called the Internet of Things (IoT). In a system based on the IoT, various devices, including those of everyday use, are connected with each other using different communication technologies in order to exchange data. The data are sent among the devices automatically and are often related to monitoring their readiness to operate, sending information concerning current energy consumption, or other measurement data connected with the analysis of functioning of household automatic systems, monitoring environmental factors, etc. Recently, a new research trend has been observed related to supplying IoT devices with simple solutions based on the idea of energy harvesting [
1,
2,
3].
Then, low-energy electronic devices can be supplied by alternative energy sources, for example, in the form of specialized thermoelectric modules, which obtain energy from the heat emitted by, for example, the human body, or even from the fuselage structure of an aircraft, in a non-standard way [
4,
5,
6]. Such non-standard solutions have inspired engineers to design new constructions for devices supplied with renewable energy.
The solutions mentioned above are often executed using thermoelectric generators (TEG) with greater efficiency for energy harvesting relative to piezoelectric generators which obtain energy from vibrations. Therefore, it is easier to supply IoT devices from generators of this type, but mainly in the case of significant temperature gradient conservation between the outer surfaces of the thermocouple. In order to eliminate this discrepancy and to enhance the energetic efficiency of the TEG thermocouples, which are active at smaller temperature differences, various studies have been conducted on using alternative materials to construct the TEGs thermocouples [
7,
8,
9].
Since the solution proposed in this study is connected with supplying a water consumption meter, it is reasonable to mention other studies on the same issue. For example, in a study describing energy harvesting in a household from hot water taps, the authors focused on presenting a construction solution based on TEG modules connected to a DC/DC converter. The applied LTC 3109 converter was connected to a capacitor bank with a buffer of 500 µF capacity [
10]. Applying a capacitor of this type enabled an effective and stable supply to the microprocessor circuit. In other studies, the authors have used converters of a similar construction, but they concentrated on presenting some general concepts of the power system construction or on analyzing the method of locating the TEG cells on the water pipe [
11,
12].
Having in mind the mentioned works, it was decided to conduct additional tests which would fill in the gap of information concerning the possibilities of energy harvesting from thermocouples of different types. Additionally, in this study, we complemented this with the possibilities of employing various configurations of DC/DC converters supplying devices of small energetic demands. The results were based on experimental measurements of the load characteristics of the TEG cells alone, as well as the TEG cells connected to the DC/DC converters dedicated for energy harvesting. The mentioned power systems were adjusted to the applied water consumption meter optimized according to the low energy consumption factor. This allowed supplying the meter efficiently at a small temperature gradient.
The focus of this study was on a clear way to present the results of experiments concerning supply systems consisting of TEG thermoelectric generators and DC/DC converters. Such a system may constitute a new alternative power supply approach which was experimentally verified and evaluated. Therefore, the main objective of this study was to analyze the relation of generated voltage by the thermoelectric cell to the resistance load. All experiments were accomplished for various temperature differences between the top and bottom of the thermoelectric cell. In this way, the optimal power supply solution for supplying a water consumption meter was selected. The optimum performance power generation curves for the selected parameters as supplying voltage and storage capacity were created based on realized experiments.
2. Analysis of the Components Used in the Experimental Study
In this study, we focus on powering an electronic system to measure water flow. The presented device acts as a water consumption meter that can be installed in a household. The advantage of such a solution is the possibility of using renewable energy sources, which in our case are Peltier cells. These cells, as mentioned earlier, are able to generate electricity which can then be used to power electronic devices.
Regarding these issues, in this study, we present individual stages of research on the issue of obtaining energy from the differences in water flowing in a water supply pipe and ambient temperature. First, the technical solution of the water meter is described in general, followed by the measurement station on which the energy harvesting power supplying system performance was carried out. Then, we present the extensive study results and conclusions based on them.
2.1. General Scheme of the Consumption Meter Application
Because the construction of an electronic water consumption meter is not the main topic of this study, only its general principle of working is described in this section. Moreover, it is worthwhile stressing that the presented body of the developed flow meter does not actually contain the energy component for obtaining electricity from the heating process. It is assumed that the components themselves ensure the temperature difference on the sides of the Peltier cell externally. This power generation section was tested only in the laboratory environment where a different temperature was set in a controlled manner on the opposite sides of the Peltier cell.
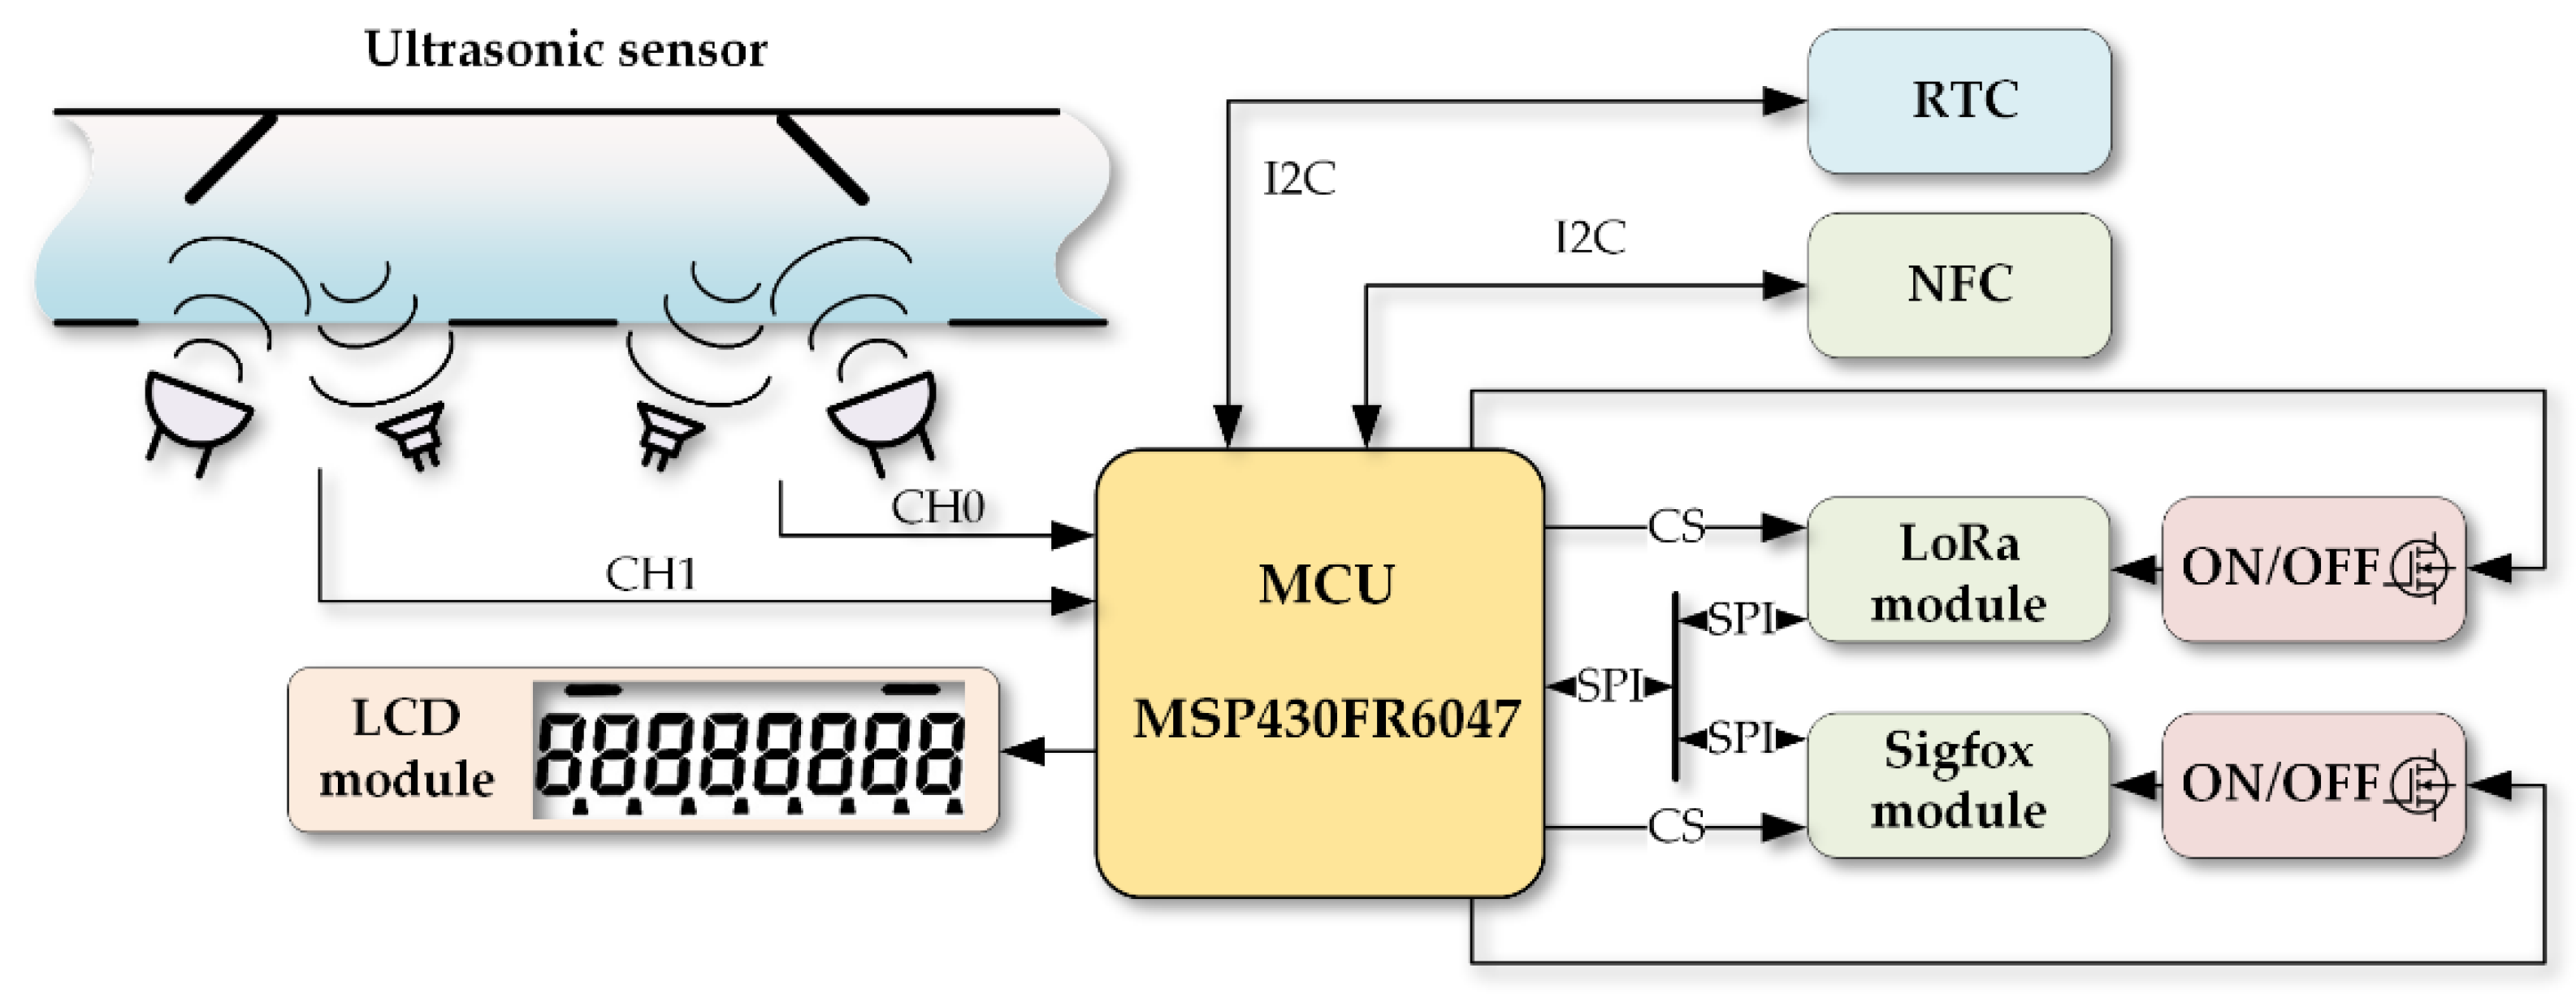
The meter used in the study was based on the ultrasound method of water consumption measurement (
Figure 1).
The main components of the meter (
Figure 2) are: a microcontroller unit (MCU) dedicated for measurements with the use of ultrasound sensors MSP430FR6047; a liquid-crystal display (LCD); a real-time clock (RTC); and a set of peripheral communication devices [
13].
In order to enable low-energy communication in a small range, a module of near-field communication (NFC) was applied, and to obtain a greater range of communication, a Sigfox module and a LoRa module were used. Taking into consideration the objective of this study, the level of the consumption of energy used by the measurement system and its mean value are important. Therefore,
Table 1 provides these values in relation to the tested current values supplying the device. On the basis of the conducted tests, it was eventually decided that the values of 2.60 V and 3.30 V DC would be analyzed, as they provided stable work of the meter. The energy consumption of the supply voltages listed in
Table 1 are characteristic for the operating mode of measurement and storage of the measured data, which are periodically repeated eight times per second for a time interval of 10 ms. For the remainder of the time, the microcontroller is switched to a low power saving mode with a current consumption of up to 0.5 µA. Thus, the total consumption of the water consumption meter reaches a maximum average current value of 44.62 µA and an average power consumption of 116 µW at 2.60 V DC, and a maximum average current value of 41.9 µA and an average power consumption of 138 µW at 3.30 V DC.
Within the design, the power system is divided into three possible basic configurations. Each layout has its advantages and disadvantages, therefore, it is necessary to use the appropriate configuration for analyzing the most optimal solution.
The easiest configuration uses only one DC/DC converter, since a smaller number of components leads to higher reliability (less fault) and a lower price. The main disadvantage of this solution is that energy cannot be accumulated. In this case, when the power supply is connected, the voltage is controlled by the start-up DC/DC converter. Therefore, a stable voltage supply for a particular appliance is delivered. Moreover, in some cases, a capacitor that is capable of covering short-term outages is additionally connected [
14].
The second option is to extend the supply circuit with a supercapacitor which enlarges the possibility of accumulating electrical energy. Thus, it is possible to cover a longer power outage. The disadvantage is the usage of two DC/DC converters, resulting in a lower efficiency of the power supply system, for example, at the efficiency of DC/DC converters of 80%, the total efficiency can reach around 60%. Furthermore, the use of supercapacitors increases the size of the power supply device and the failure rate [
15].
The third configuration for the power supply system includes a primary cell in the form of a battery that can be used in power failure events. Unfortunately, the most significant drawback of this configuration is that the primary cell has a limited lifetime and must be changed at regular intervals. Especially, in this application, there is space for changing the primary cell because all other components in the system are often renewed. Using batteries or accumulators presents new problems such as voltage compatibility, size of elements, and need for charging the supporting circuits, and therefore their deployment is not currently required.
With regard to the requirements of the water consumption meter, the simplest power supply non-battery solution was evaluated in the present study.
2.2. Physical Phenomena Associated with the Generation of Electricity from Heat
In general, the essence of the Peltier cell operating principle is based on three basic physical phenomena.
The first basic and most important phenomenon is the Seebeck effect, which concerns the formation of the thermoelectric force in an open circuit. Such a circuit consists of two different metals or semiconductors. Their ends are connected permanently and at different temperatures, then, the thermoelectric force value is [
16,
17,
18] as follows:
where
is the potential difference (
V),
is the Seebeck coefficient given for the two connected materials
A and
B (V/K),
is the temperature at the hot end (K), and
is the temperature at the cold end (K).
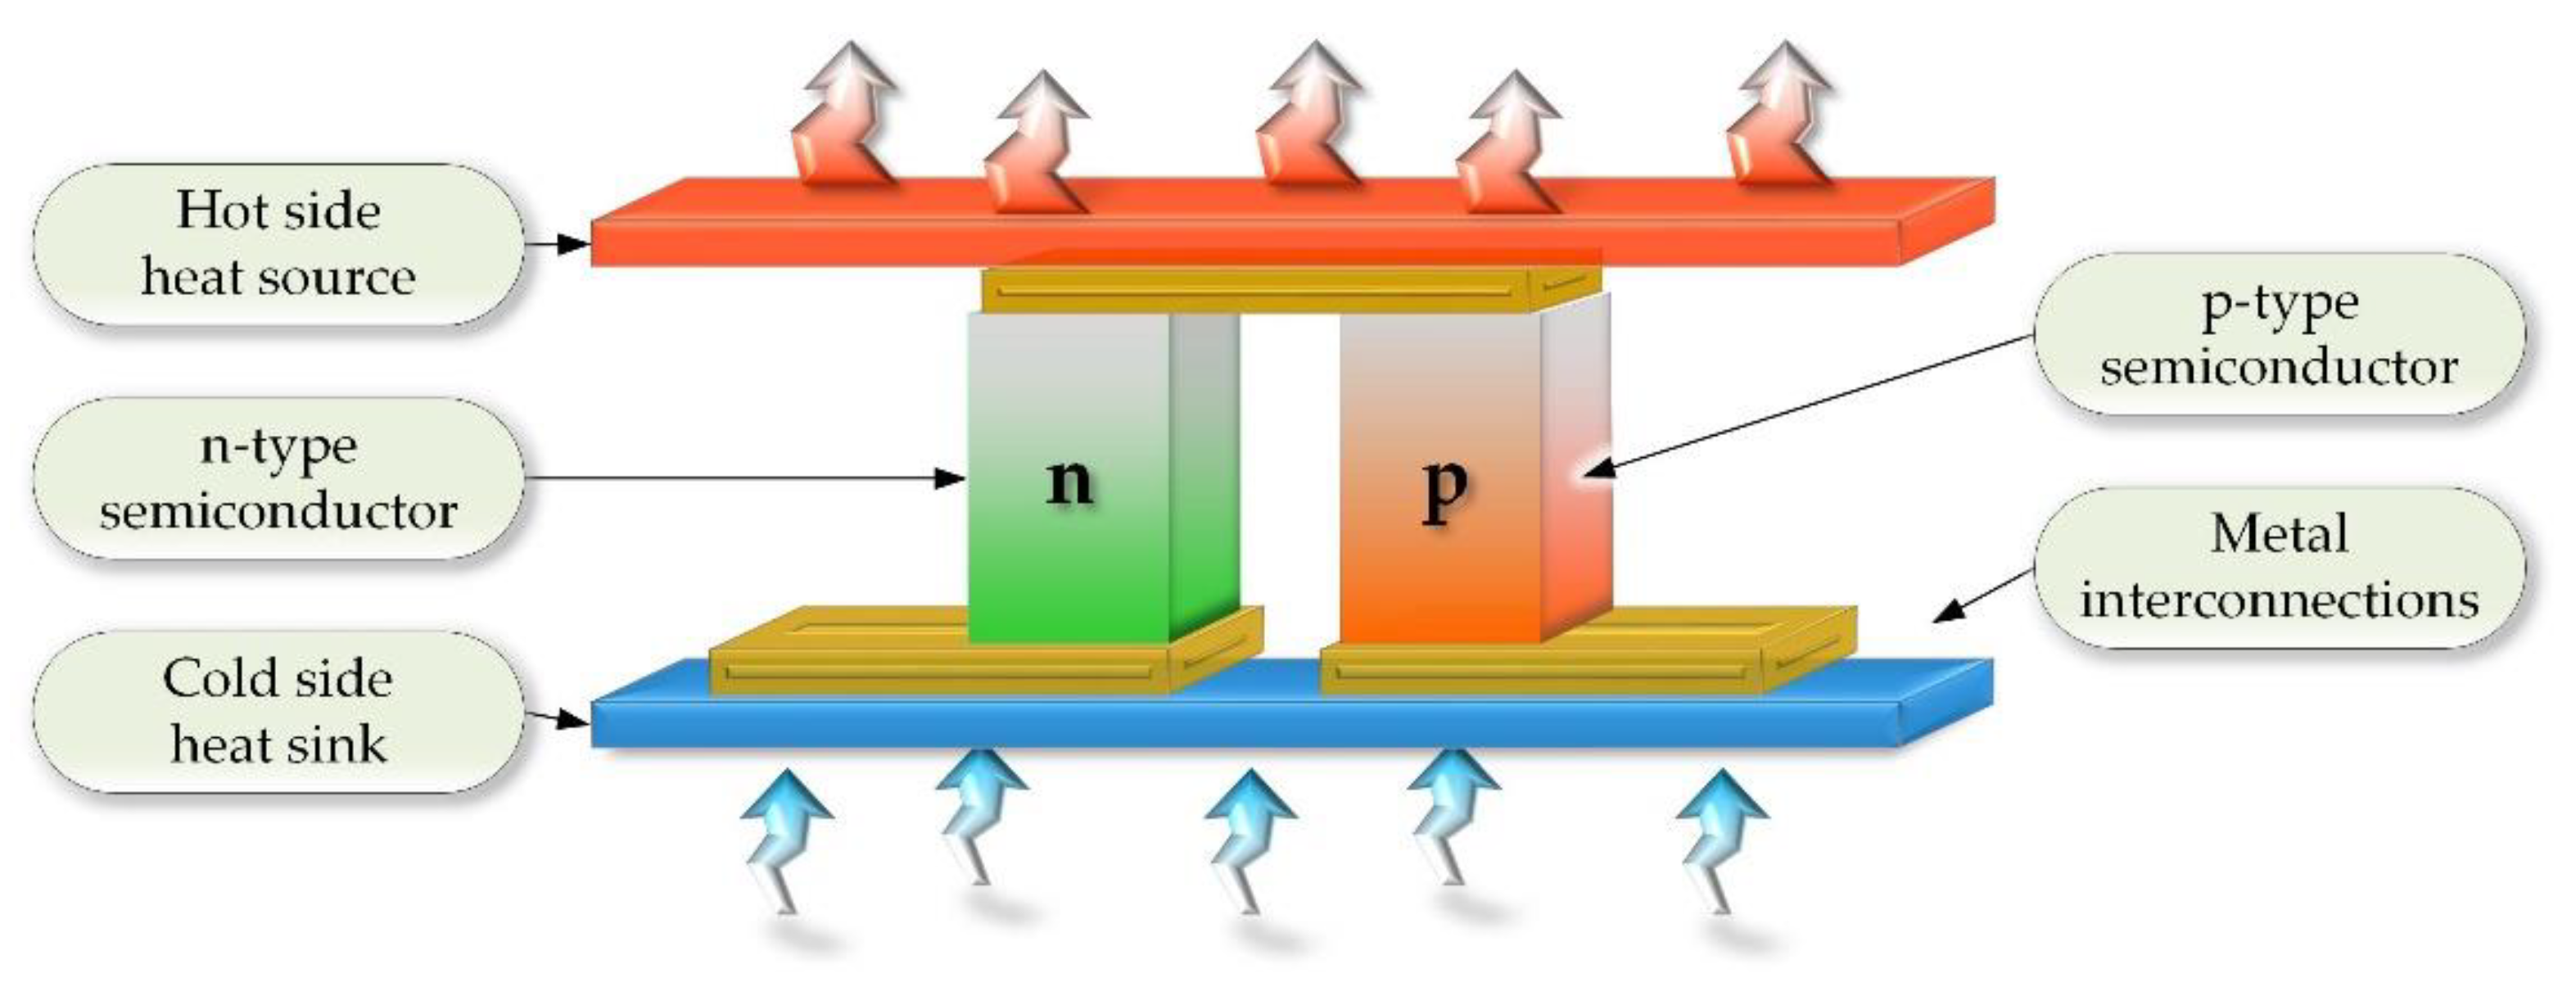
In the theoretical, i.e., ideal model of this phenomenon, the value of the resulting voltage is directly proportional to the temperature difference between the two connectors. Therefore, it is important to achieve a high temperature gradient that guarantees a proportionally higher electromotive force (EMF) (
Figure 3). It is also worthwhile noting that the Seebeck factor can take a different sign, depending on the types of materials combined. Moreover, for semiconductor materials, it takes on a much higher value as compared with metals. The semiconductor components significantly improve the efficiency of generating the thermoelectric force, but, unfortunately, they affect the effects associated with nonlinearity and repeatability in the production process. As it can be seen, this phenomenon is directly analogical to the operating principles of TEG and TEC cells.
The second phenomenon is the Peltier effect, which is essentially the opposite of the Seebeck effect. If the aforementioned set of conductors or semiconductors is connected to a DC source, one connector will start to heat up and the other will cool down. Heating or cooling the connectors depends on the direction of the current flow, i.e., when the current flow direction changes, the direction of the heat flow also changes. Moreover, the amount of heat taken or released is proportional to the value of the current flowing through the weld. Similar to the Seebeck coefficient, the Peltier coefficient,
, is defined as the coefficient of the heat current
to the electric current
I (A) by means of the following Equation [
16,
19,
20,
21]:
where
is the Peltier coefficient given for the two connected materials, i.e.,
A and
B (V).
The third accompanying phenomenon is the Thomson effect. It is a thermoelectric effect in which a conductor is formed through which current flows. It is important that there is a temperature gradient along this conductor. Then, the amount of heat absorbed or emitted,
(W/m
2), by a given conductor in a unit of time is proportional to the flowing current and the temperature gradient [
22,
23]. A simplified formula describing this dependence can be presented as follows:
where
is the Thomson coefficient with a plus or minus sign, depending on the direction of the current flow and the temperature gradient (V/K),
is the current density passed through a conductor (A/m
2), and
is the temperature gradient (K).
All the described phenomena exist interdependently in systems generating electricity from heat and are interrelated by the following equations:
The dependencies (4) and (5) are important for all types of materials from which voltage generators are manufactured. The coefficient values are most frequently obtained from Seebeck measurements, and then the remaining coefficients are calculated. Therefore, it can be assumed that the basic parameter describing the ability to generate voltage with thermoelectric generators is the Seebeck factor. These dependencies and the described phenomena allow an easier analysis of the parameters of the TEC cells used, i.e., TEC, the thermoelectric Peltier cooler module; TES, the thermoelectric micro-Peltier cooler module; and TEG, the thermoelectric Seebeck generator module.
2.3. Thermoelectric Power Sources Used in the Study
This study uses widely available and relatively inexpensive TEC, TES, and TEG modules. These modules seem to look similar to each other but differ significantly in the operational parameters (
Table 2 and
Table 3). The parameters presented in
Table 2 and
Table 3 have a significant impact on the use of these elements in energy harvesting devices, in which the designers do not pay attention to the factors determining the optimal electricity generating, but only to their cost. It is worthwhile mentioning that the TEC, TES, and TEG modules have been especially optimized by manufacturers for different temperature ranges of their nominal operation. Thus, the TEG modules are optimized for higher temperatures, and the TEC modules are more efficient at temperatures close to room temperature, i.e., at lower temperature ranges. Furthermore, the TEC modules typically use thicker power cords due to the significant currents flowing during their power supply. Large current values also determine the size of the semiconductor components used, which in these modules may be larger than TEG modules. The incisions on the surface of the ceramic tile in TEG modules are an additional difference that can be noticed when comparing modules, and therefore the stresses of the warm side relative to the cold side are minimized at high temperature gradients [
24].
2.4. Laboratory Test Stand Used in the Experiments
The main aim of the experimental study was to test various thermoelectric generators and DC/DC converters. The converters were tested in two configurations, i.e., with a 470 µF capacitor and without it being connected at the output of the converter. Additionally, tests for three values of the output voltage, corresponding to the values commonly used to supply electronic circuits, were tested. The converters used for the purpose of this testing were referred to as DC-DC1, DC-DC2, and DC-DC3, as shown in
Table 4.
While conducting the analysis of the converters, we applied the manufacturers’ recommendations and the final constructions were based on the application notes [
26,
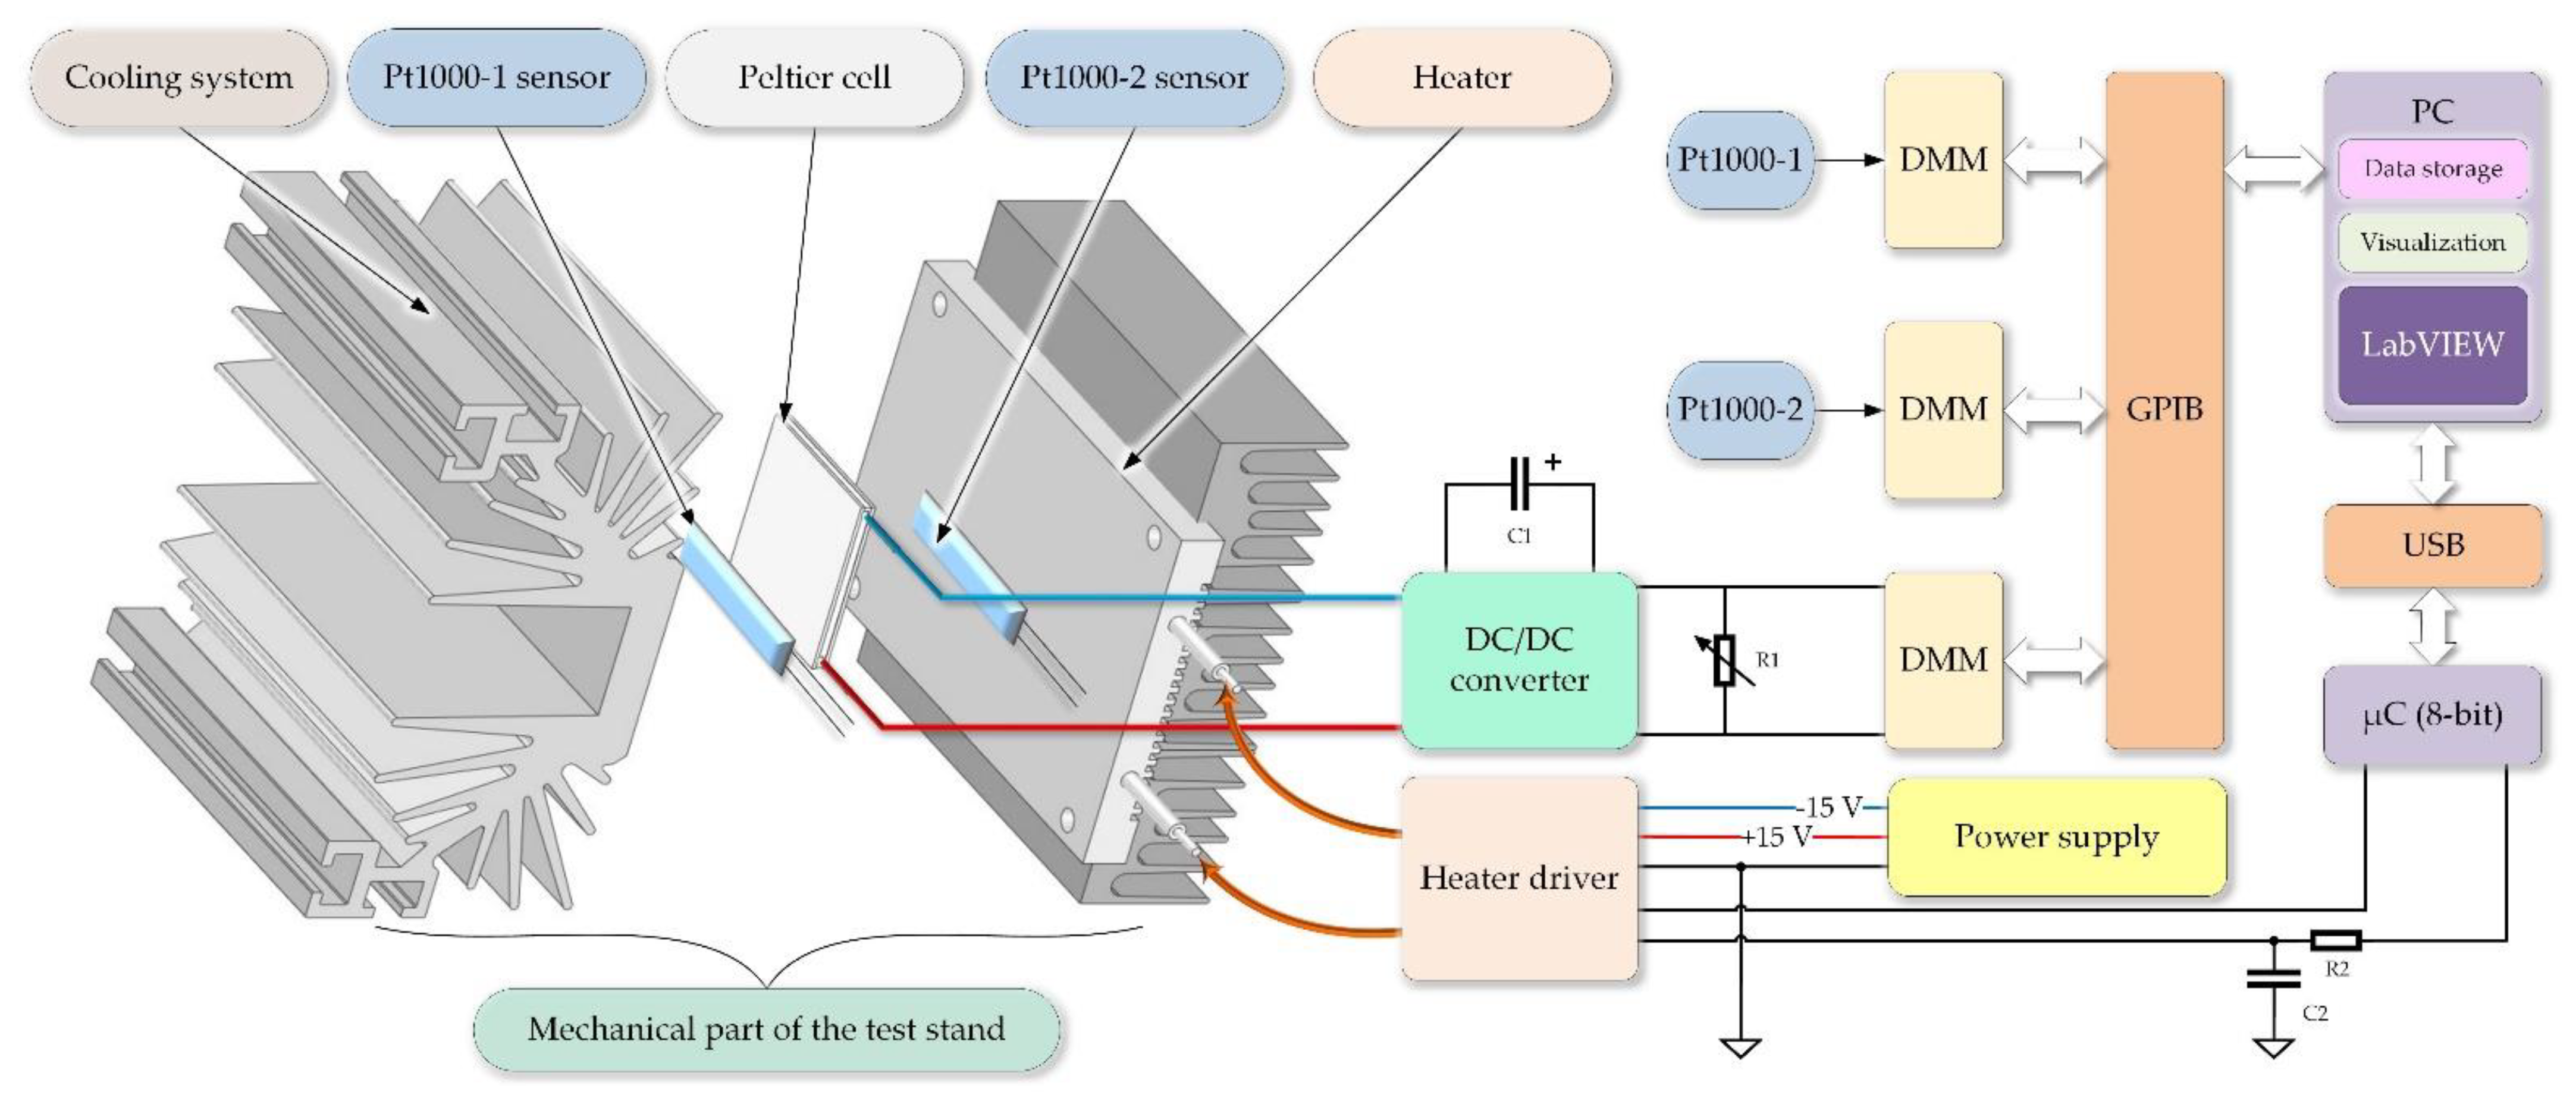
27]. Single TEC and TEG cells, as well as the serial connection of the 2x TEPS5 cells, were chosen to supply the water consumption meter. A laboratory system, whose diagram is presented in
Figure 4, was created for the purpose of conducting tests for the possibility of employing the mentioned thermoelectric generators to supply the meter circuit.
Figure 4 describes the main components of the thermoelectric set used for the experimental tasks. To ensure the same conditions for all measurements, it was necessary to mount the Peltier cells and temperature sensors on the hot and cold sides of the radiators or a metal mass, respectively, which guaranteed stable measurement conditions. Subsequently, the components were pressed together so that the heatsink on the hot and cold side was attached directly on the maximum area of the Peltier cell. The measured values were recorded if the required temperature drop was reached, and the measurement was repeated several times. For simplicity, however, the average values of these individual measurements were used in this study.
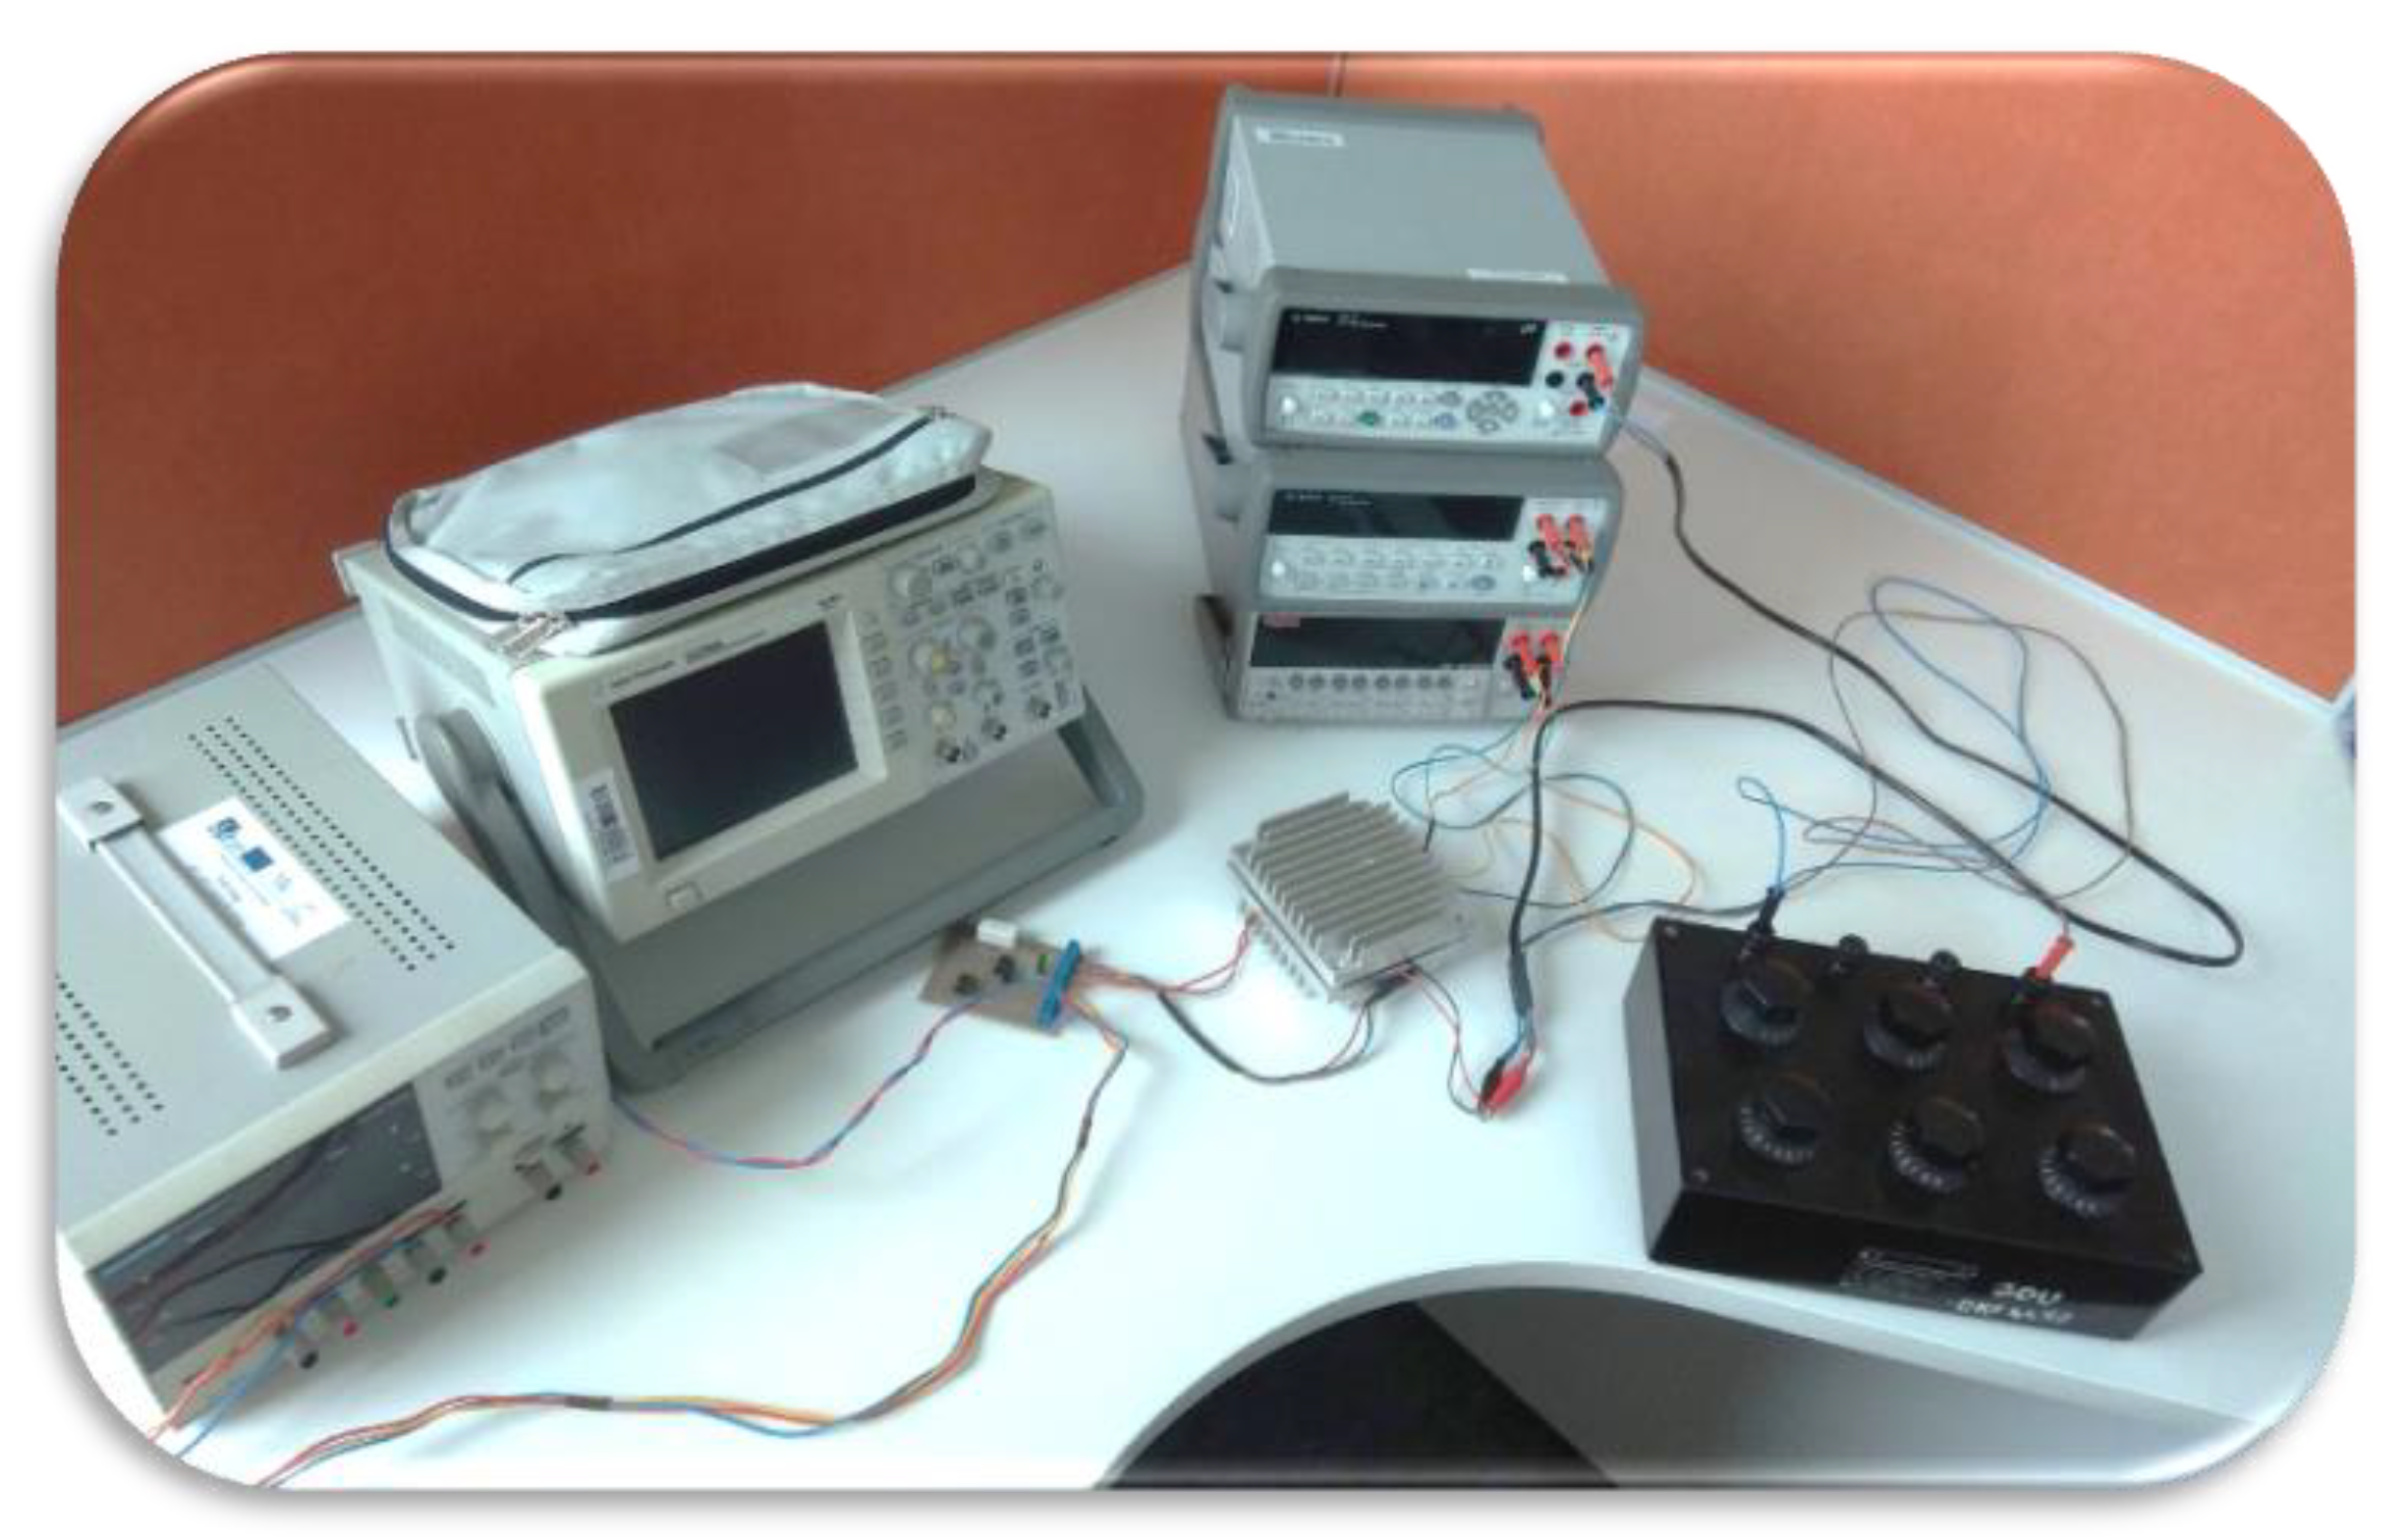
The created experimental test stand consisted of a set of components (
Figure 5) which could be functionally divided into three categories. One category consisted of the mechanical system which included the tested thermoelectric cell, an outer radiator located in the ambient temperature, a heater producing the temperature difference, and Pt1000 sensors serving as components measuring temperature at both sides of the thermoelectric cell. It is worthwhile stressing that all mechanical components (
Figure 4) of the test stand system were connected with thermal adhesive glue. The measurement sensors were of class A, according to the manufacturer’s declaration, i.e., their limiting error should be 0.15 + 0.002 |
T|, according to IEC751.
Another category of the experimental test stand components consisted of a set of meters connected to the LabVIEW measurement system, which enabled the measurement data acquisition. It is worthwhile mentioning that the temperature values measured with the Pt1000 sensors were sent to an 8-bit microcontroller which was responsible for controlling the heater adjusted to the tested thermoelectric cell. The purpose of this complex control-measurement chain was to obtain a possibly high precision of temperature measurement, which was provided by digital multimeters (DMM). Then, proper temperature values were sent with the use of an ATmega328P microcontroller through a LabVIEW program.
The DC/DC converters with an additional C1 capacity and a load in the form of an R1 resistance decade box were yet another important category of the components of the measurement system. This enabled measuring the voltage characteristics and the power of the thermoelectric cells in relation to the load impedance connected with each of the DC/DC converters. The described tests were conducted for a temperature range of the thermoelectric cell from 1 K to 10 K.
2.5. Measurement Uncertainty
The laboratory instruments used for the purpose of the study were selected with regard to the required ranges and accuracy of voltage, current, resistance, and temperature values. For the temperature measurements, platinum resistance sensors Pt1000 Class A were used, which were connected with a KEITHLEY 2000 multimeter with an accuracy of ±(100 + 10) ppm. They were used to measure the resistance values corresponding to the temperature on the top of the Peltier cells. To measure the resistance values corresponding to the temperature on the underside of the Peltier cells, an AGILENT 34401A multimeter with an accuracy of ±(100 + 10) ppm (±(ppm of reading + ppm of range)) with the same parameters as the previous type was used. The total limiting error of the temperature measurement was Δ = ± (0.20 + 0.04·T), which resulted from the above parameters of instruments and sensors. As the temperature gradient was set in units of one degree, it was assumed that the tests were conducted with sufficient accuracy. The above multimeters were set at the measurement range of 10 kΩ because their measuring current was kept below 500 µA, which was necessary to prevent the phenomenon of self-heating of the measuring sensors. During the measurements, the oscilloscope was used only for informative readings of the voltage course shape related to the operation of the DC/DC converter and verification of the principle of the measurement correctness. The voltage measurements of the Peltier cells were performed with a 6½ digit Keysight 34411A digital multimeter with an accuracy of 30 ppm. The resistance of the accuracy of 0.2%, whose lowest adjustable value was 0.1 Ω, was set manually during the experiments.
3. Analysis of the Power Performance of the Energy Harvesting Systems
The tests were conducted for different connection configurations of the thermoelectric cells with DC/DC converters and for different load impedance values of the systems generating the electric voltage (
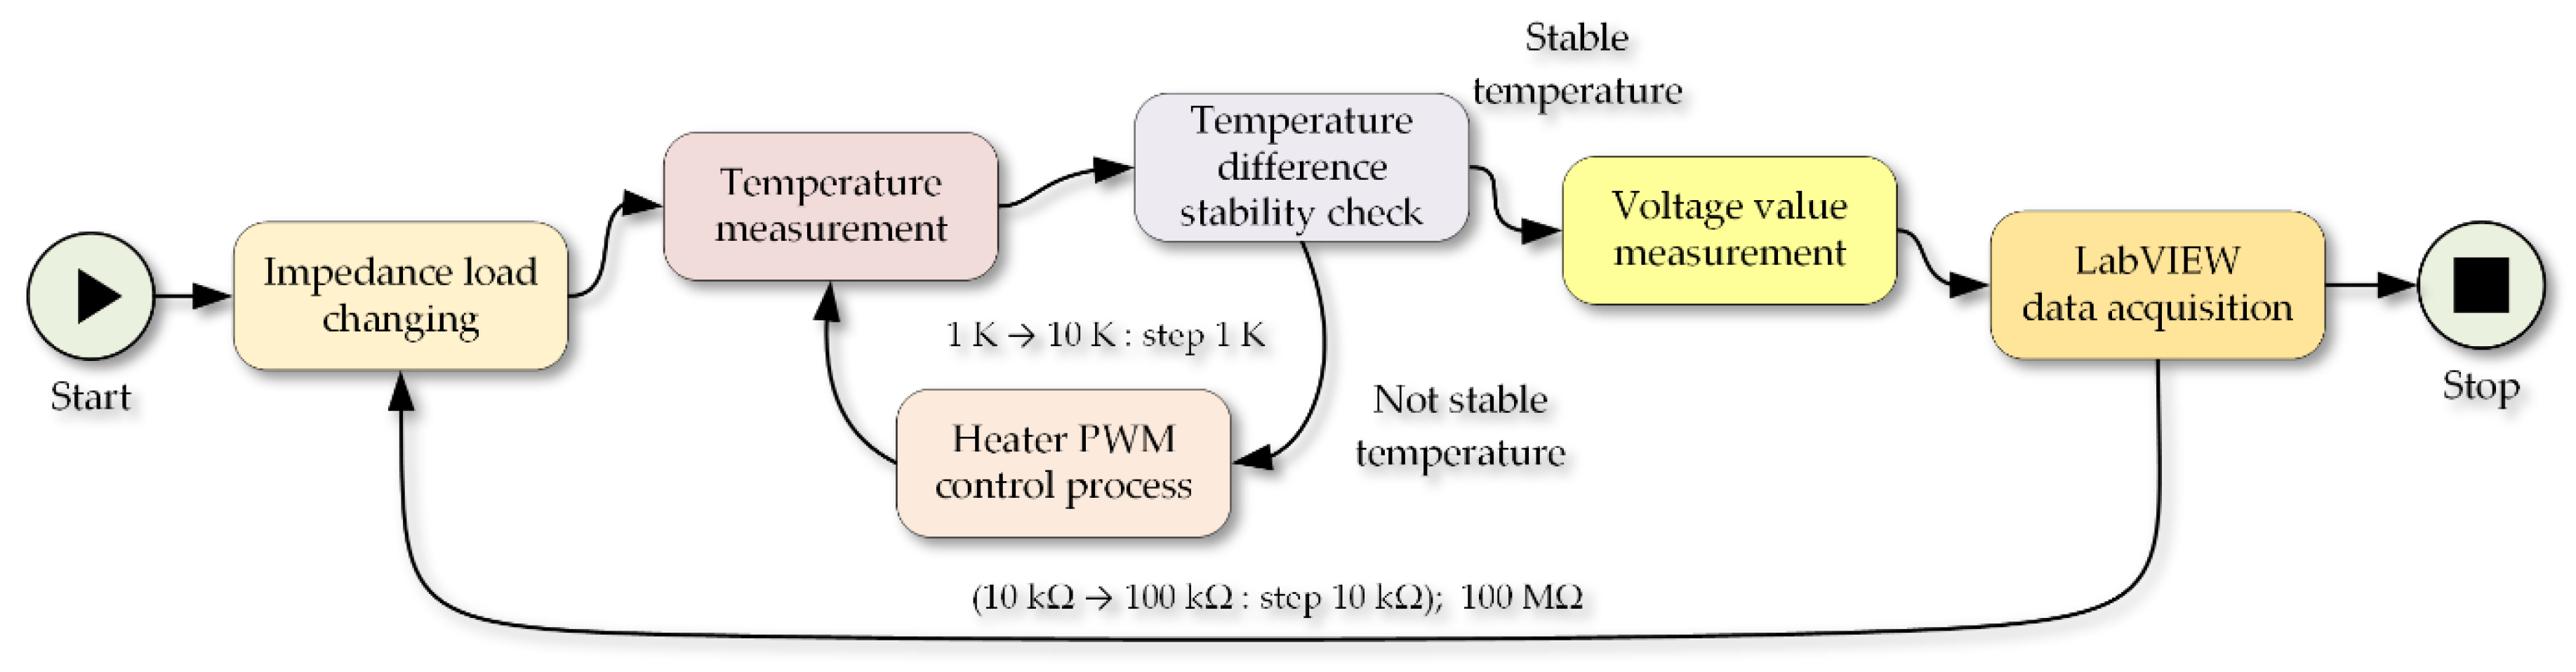
Figure 6). Moreover, it was assumed, for the purpose of the study, that the thermoelectric cells would be tested within the range of the temperature differences from 1 to 10 K with a 1 K step.
In the first run of tests, all measurement devices were switched on for about an hour, maintaining a stable air temperature in the laboratory. Next, a proper impedance value of the load was set on the resistance decade box, and the process of temperature stabilizing, executed with the use of an electric heater controlled by the pulse-width modulation (PWM) signal, was initiated. In this way, a temperature difference on both sides of the thermoelectric cell was obtained. Then, it was assigned in relation to the ambient temperature, i.e., the temperature of the air surrounding the outer radiator (
Figure 4, the cooling system).
After stabilizing the temperature, the LabVIEW program measured the output voltage mean value (out of five measurements) obtained on the tested supply systems. Then, the obtained data were visualized, and the obtained results were recorded in a comma-separated values (CSV) file.
Obviously, during the tests, the computer program executed the data acquisition from the multimeters measuring the temperature from the Pt1000 sensors and sending the obtained results to a microcontroller on the electric heater. Eventually, the testing was conducted for all the selected thermoelectric cells, all combinations of the values of the temperature increment, and various values of the load impedance. There were as many as 3000 measurements for each single thermoelectric cell, which are presented in diagrams.
3.1. TEPS1 Research Results
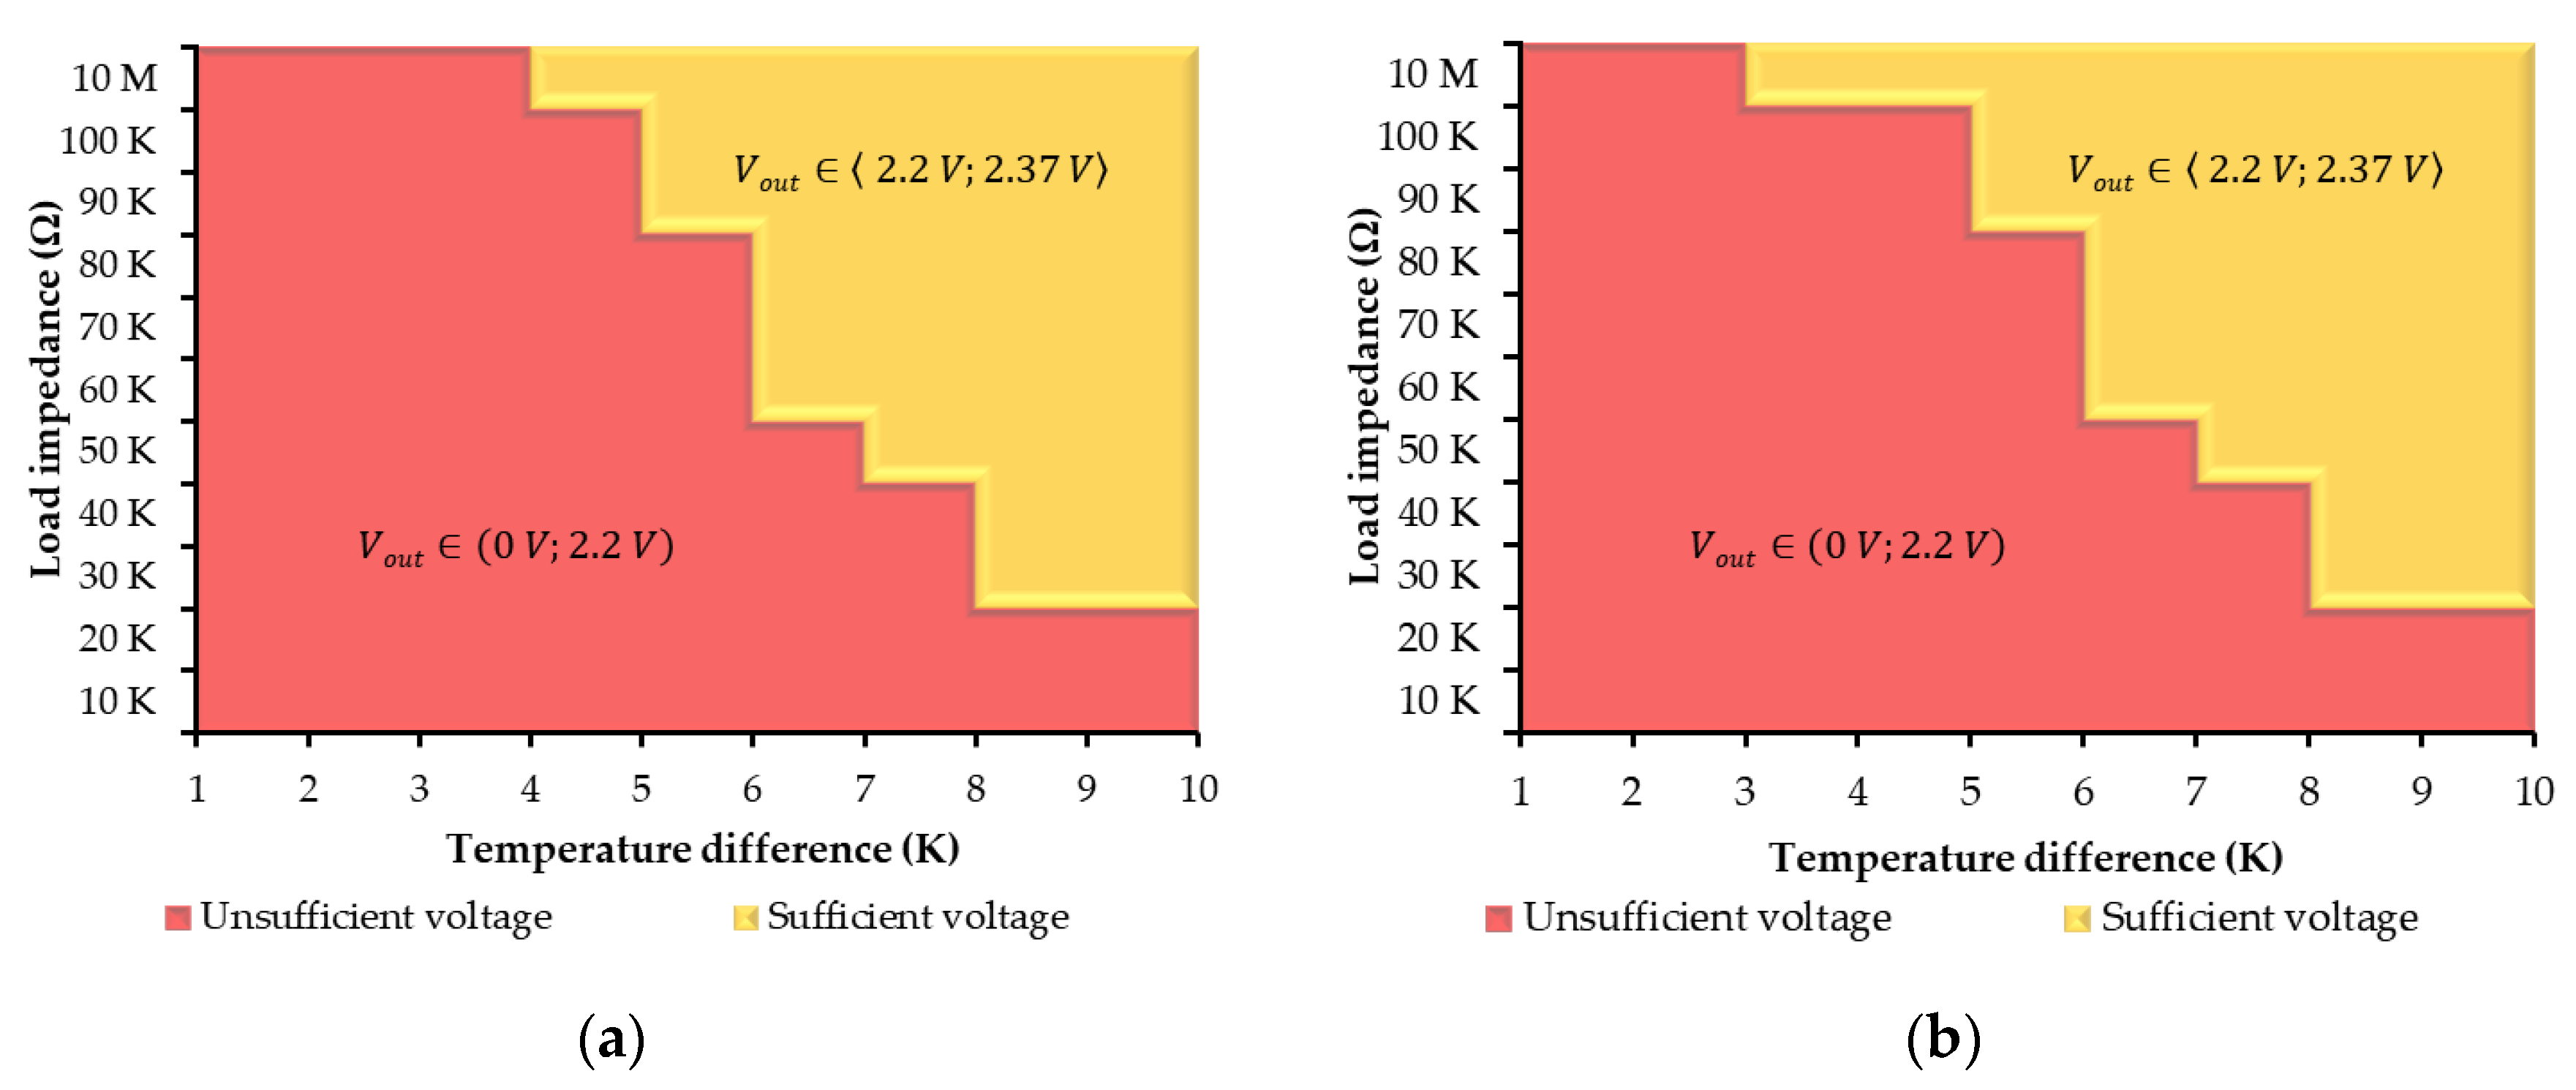
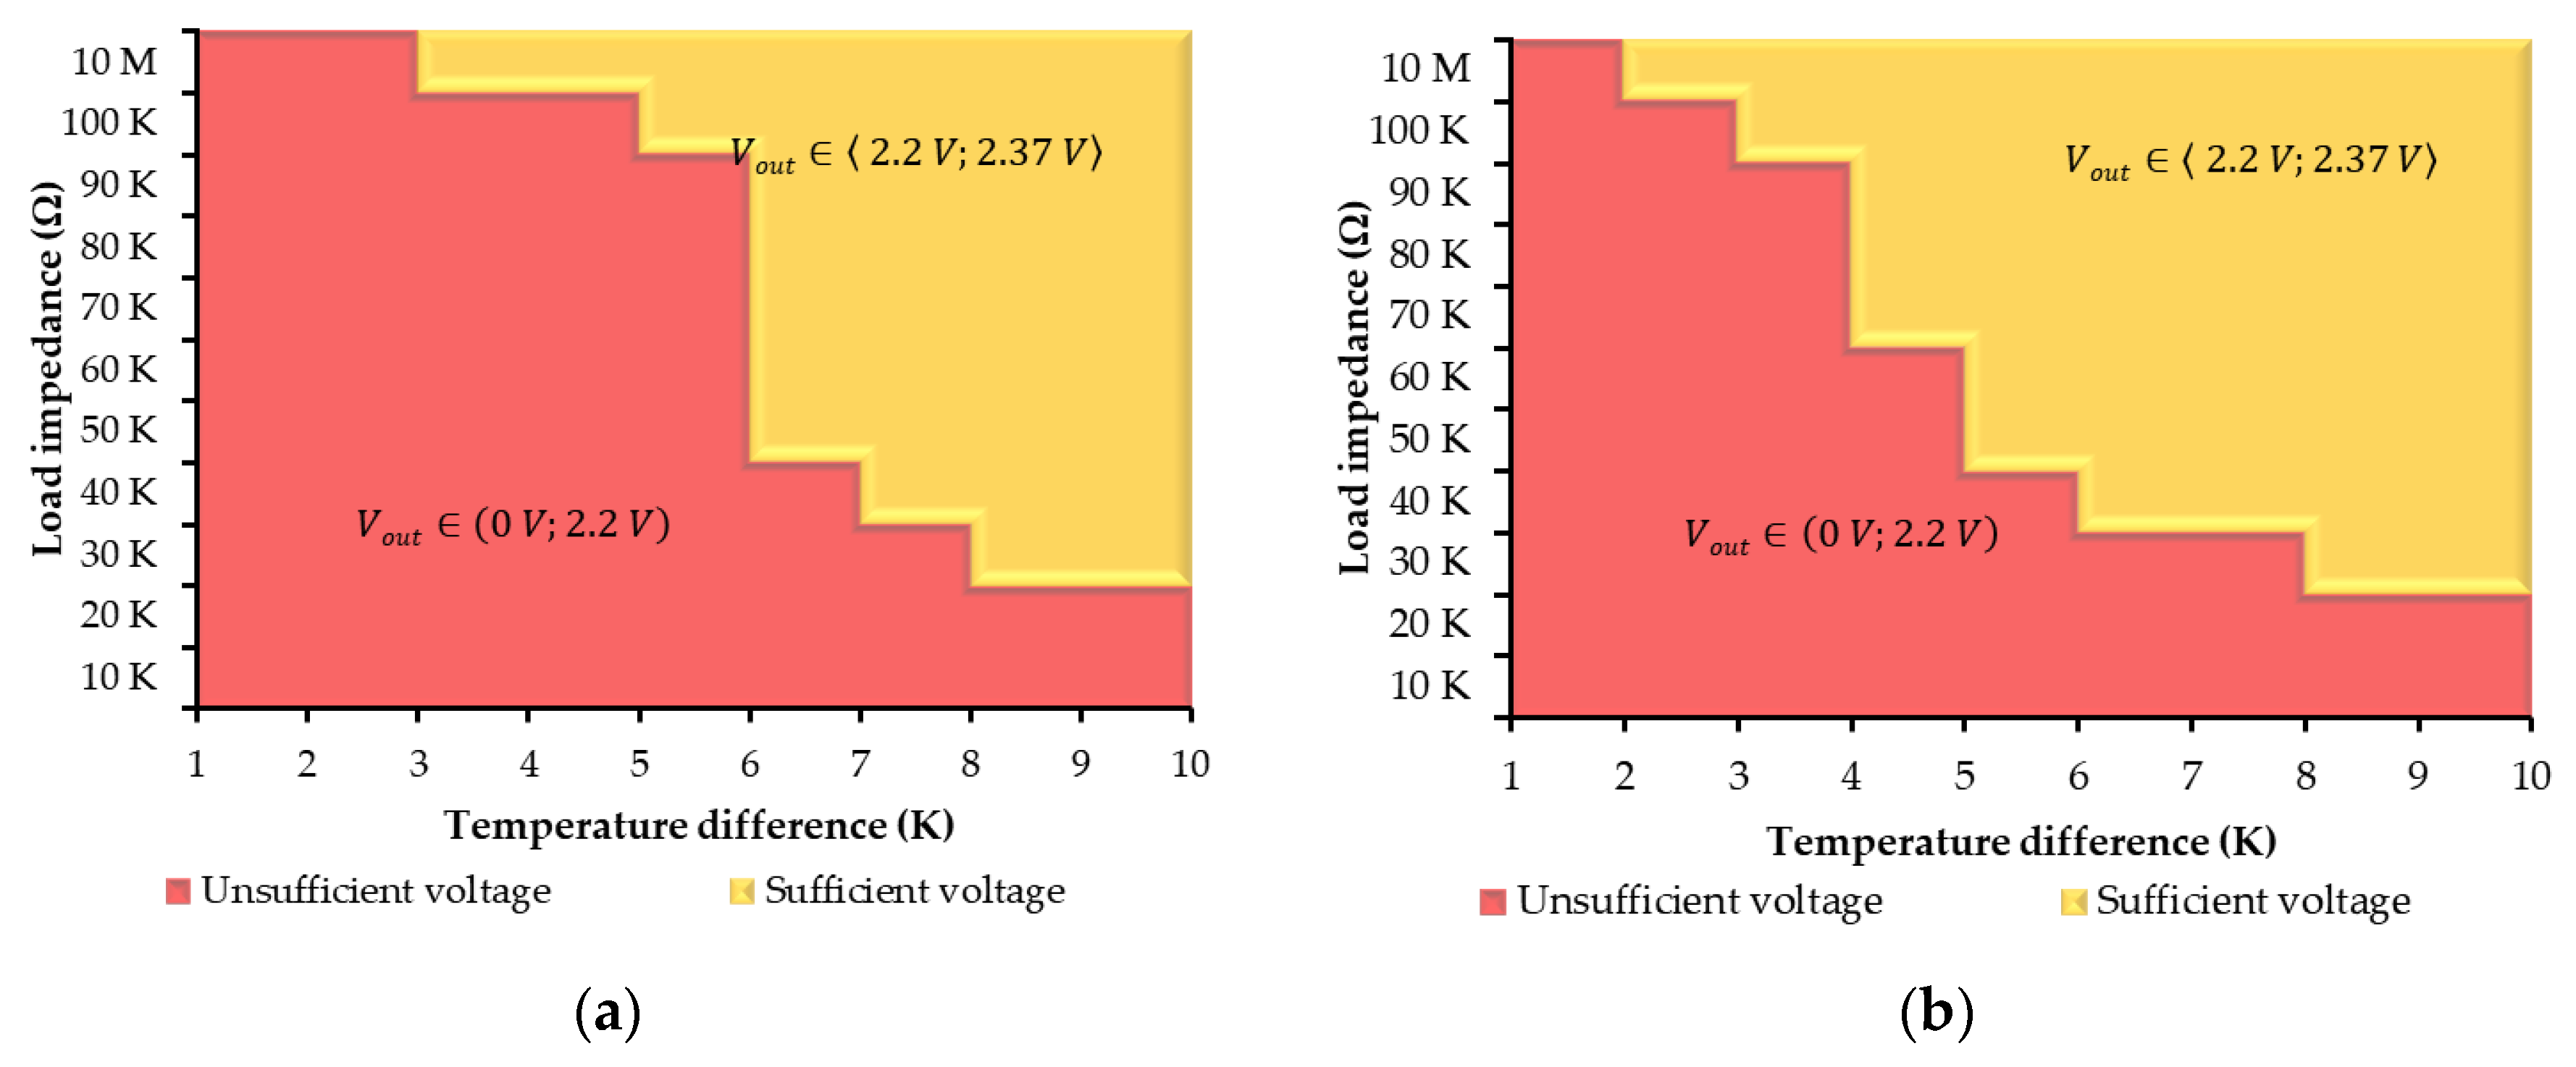
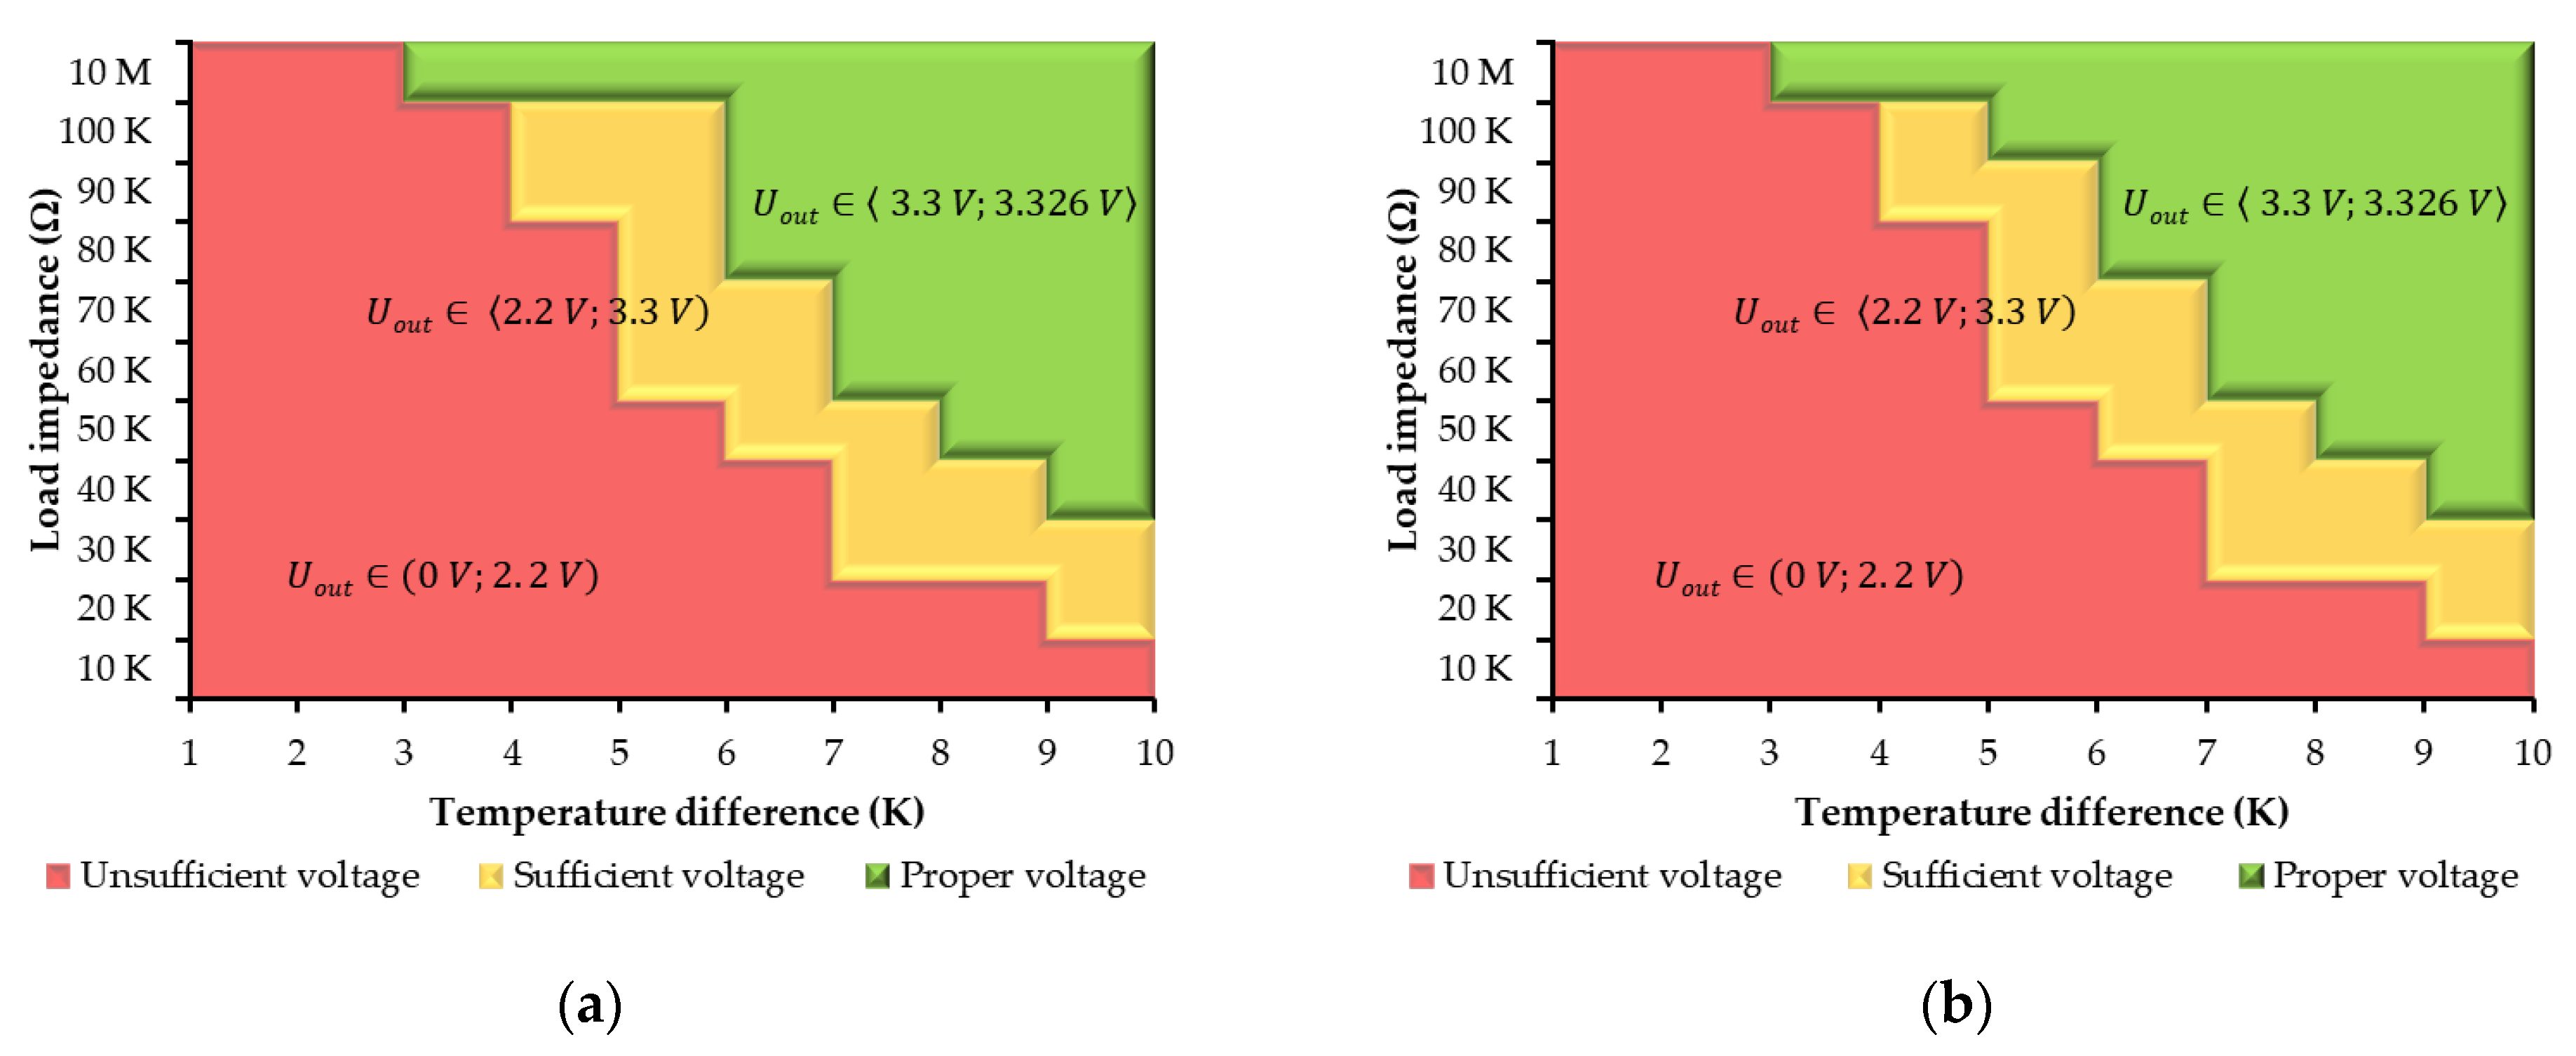
By measuring and analyzing the circuit of the TEG-127020 cell connected with a DC/DC converter, the characteristics were obtained, which are shown on the graphs in
Figure 7 and
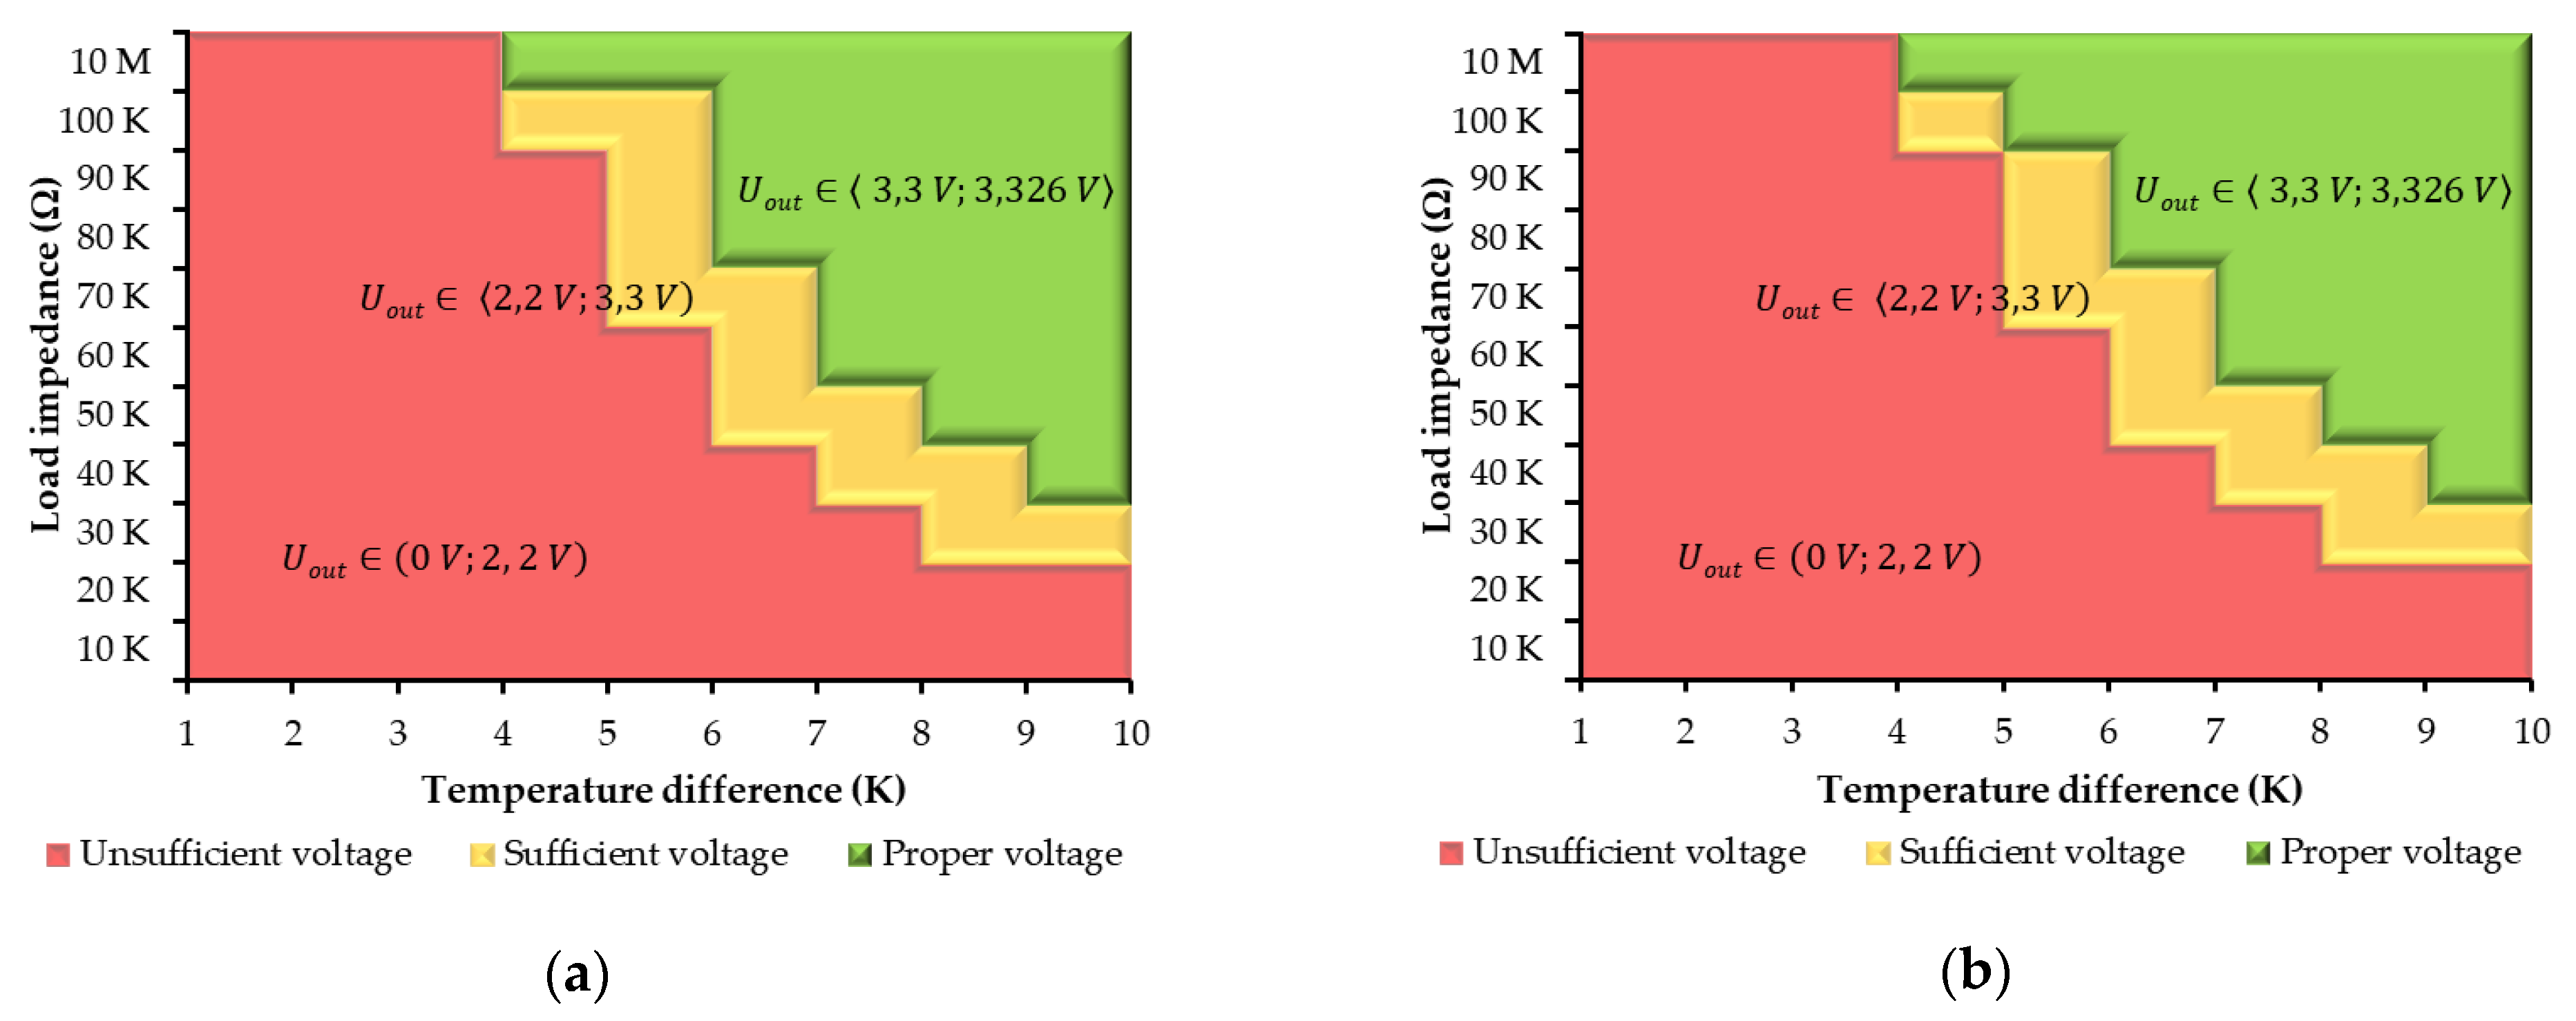
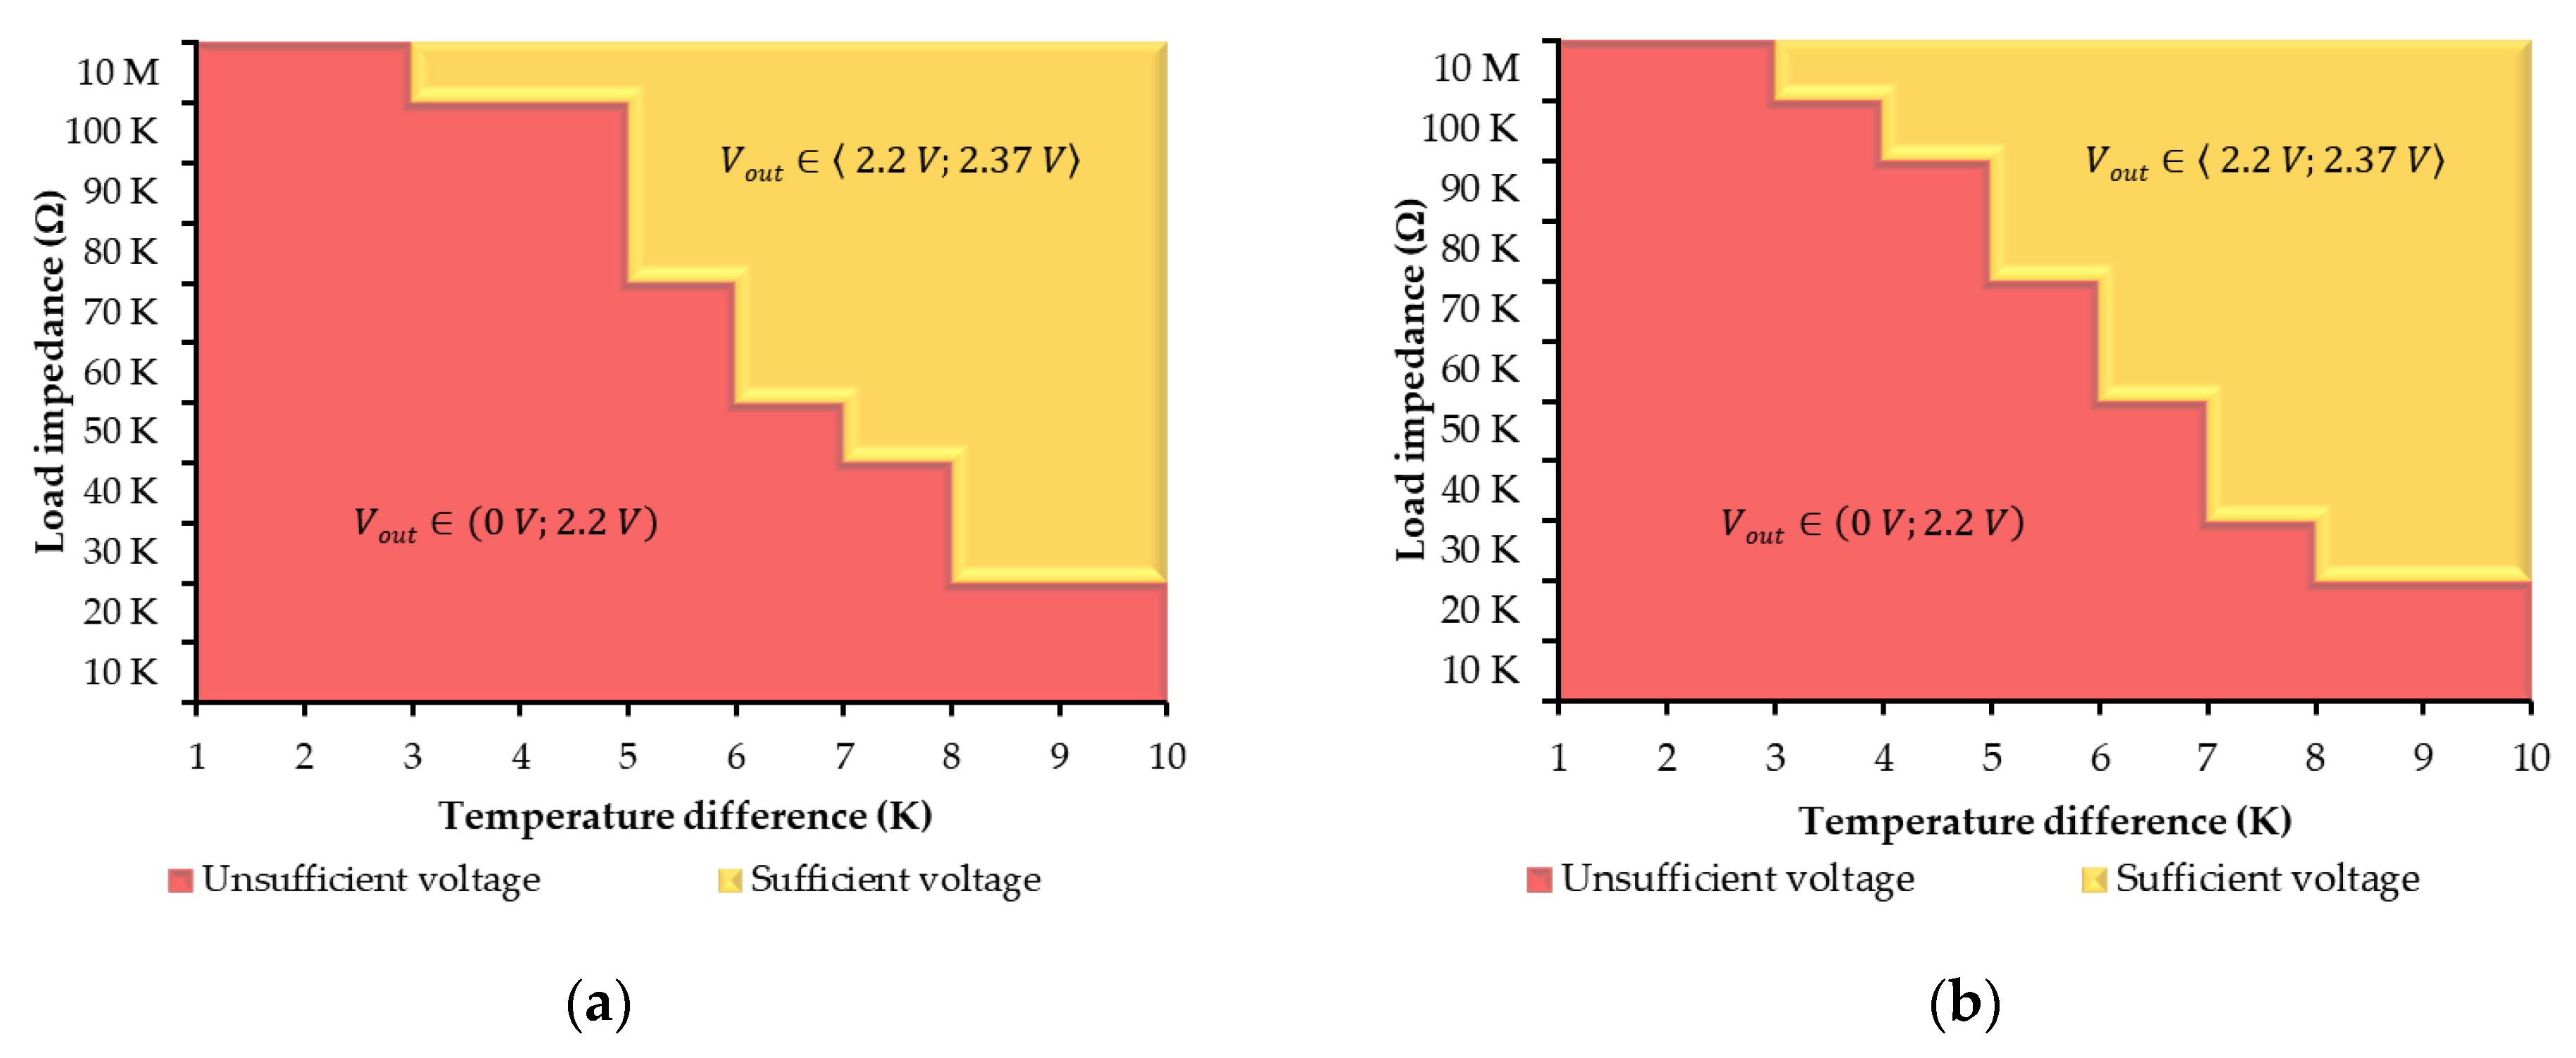
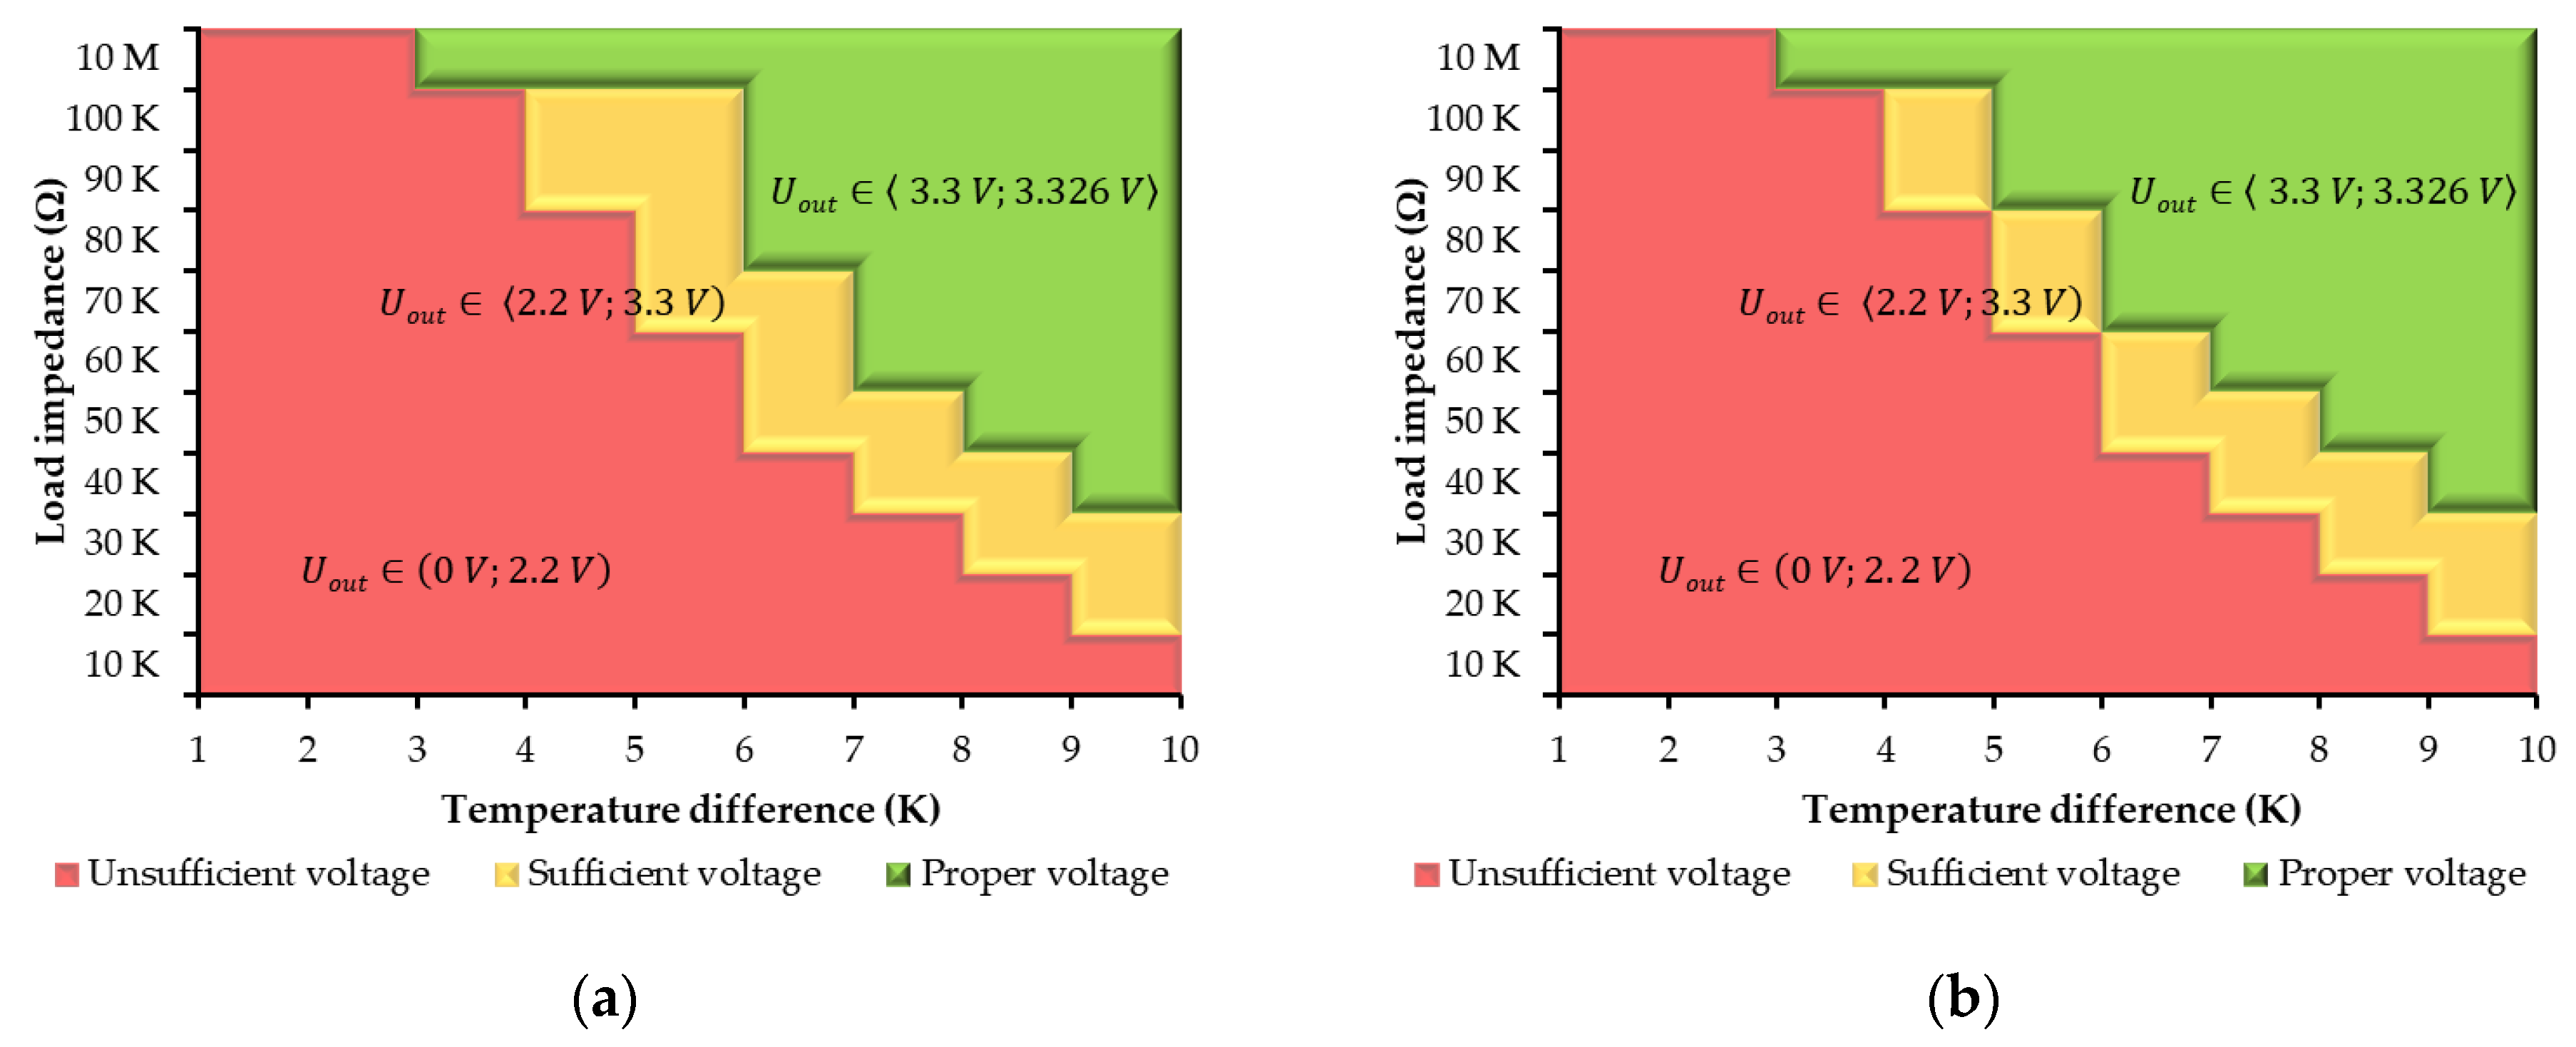
Figure 8. The figures present the operating areas of the generated voltage defined by the load resistance depending on the temperature differences at the top and bottom of the thermoelectric cell. The characteristics are investigated in variants: (a) without a storage capacitor 0 F and (b) with a storage capacitor 470 μF. The red operating area shows the generated voltages that cannot be used to supply the microcontroller unit (MCU). The green working area represents a valid voltage area for the MCU proper functioning. Then, the yellow operating area can be used conditionally, without a full guarantee of the microcontroller operating correctly.
The performed measurements and analyses show that the converter set at 3.3 V is more stable and usable as compared with its setting at 2.35 V.
Figure 7 shows that the TEPS1 with the converter set at 2.35 V is in the operating range of a load greater than 20 kΩ and at a temperature difference of 8 K. In contrast, the TEPS1 with the DC/DC converter set at 3.30 V works in the red area, similar to the lower voltage, but, for example, for a load >40 kΩ at a temperature difference of 8 K, the generated energy is already in the green range (stable). The differences in characteristics between variants (i.e., (a) without a storage capacitor and (b) with a storage capacitor) are then negligible.
3.2. TEPS2 Research Results
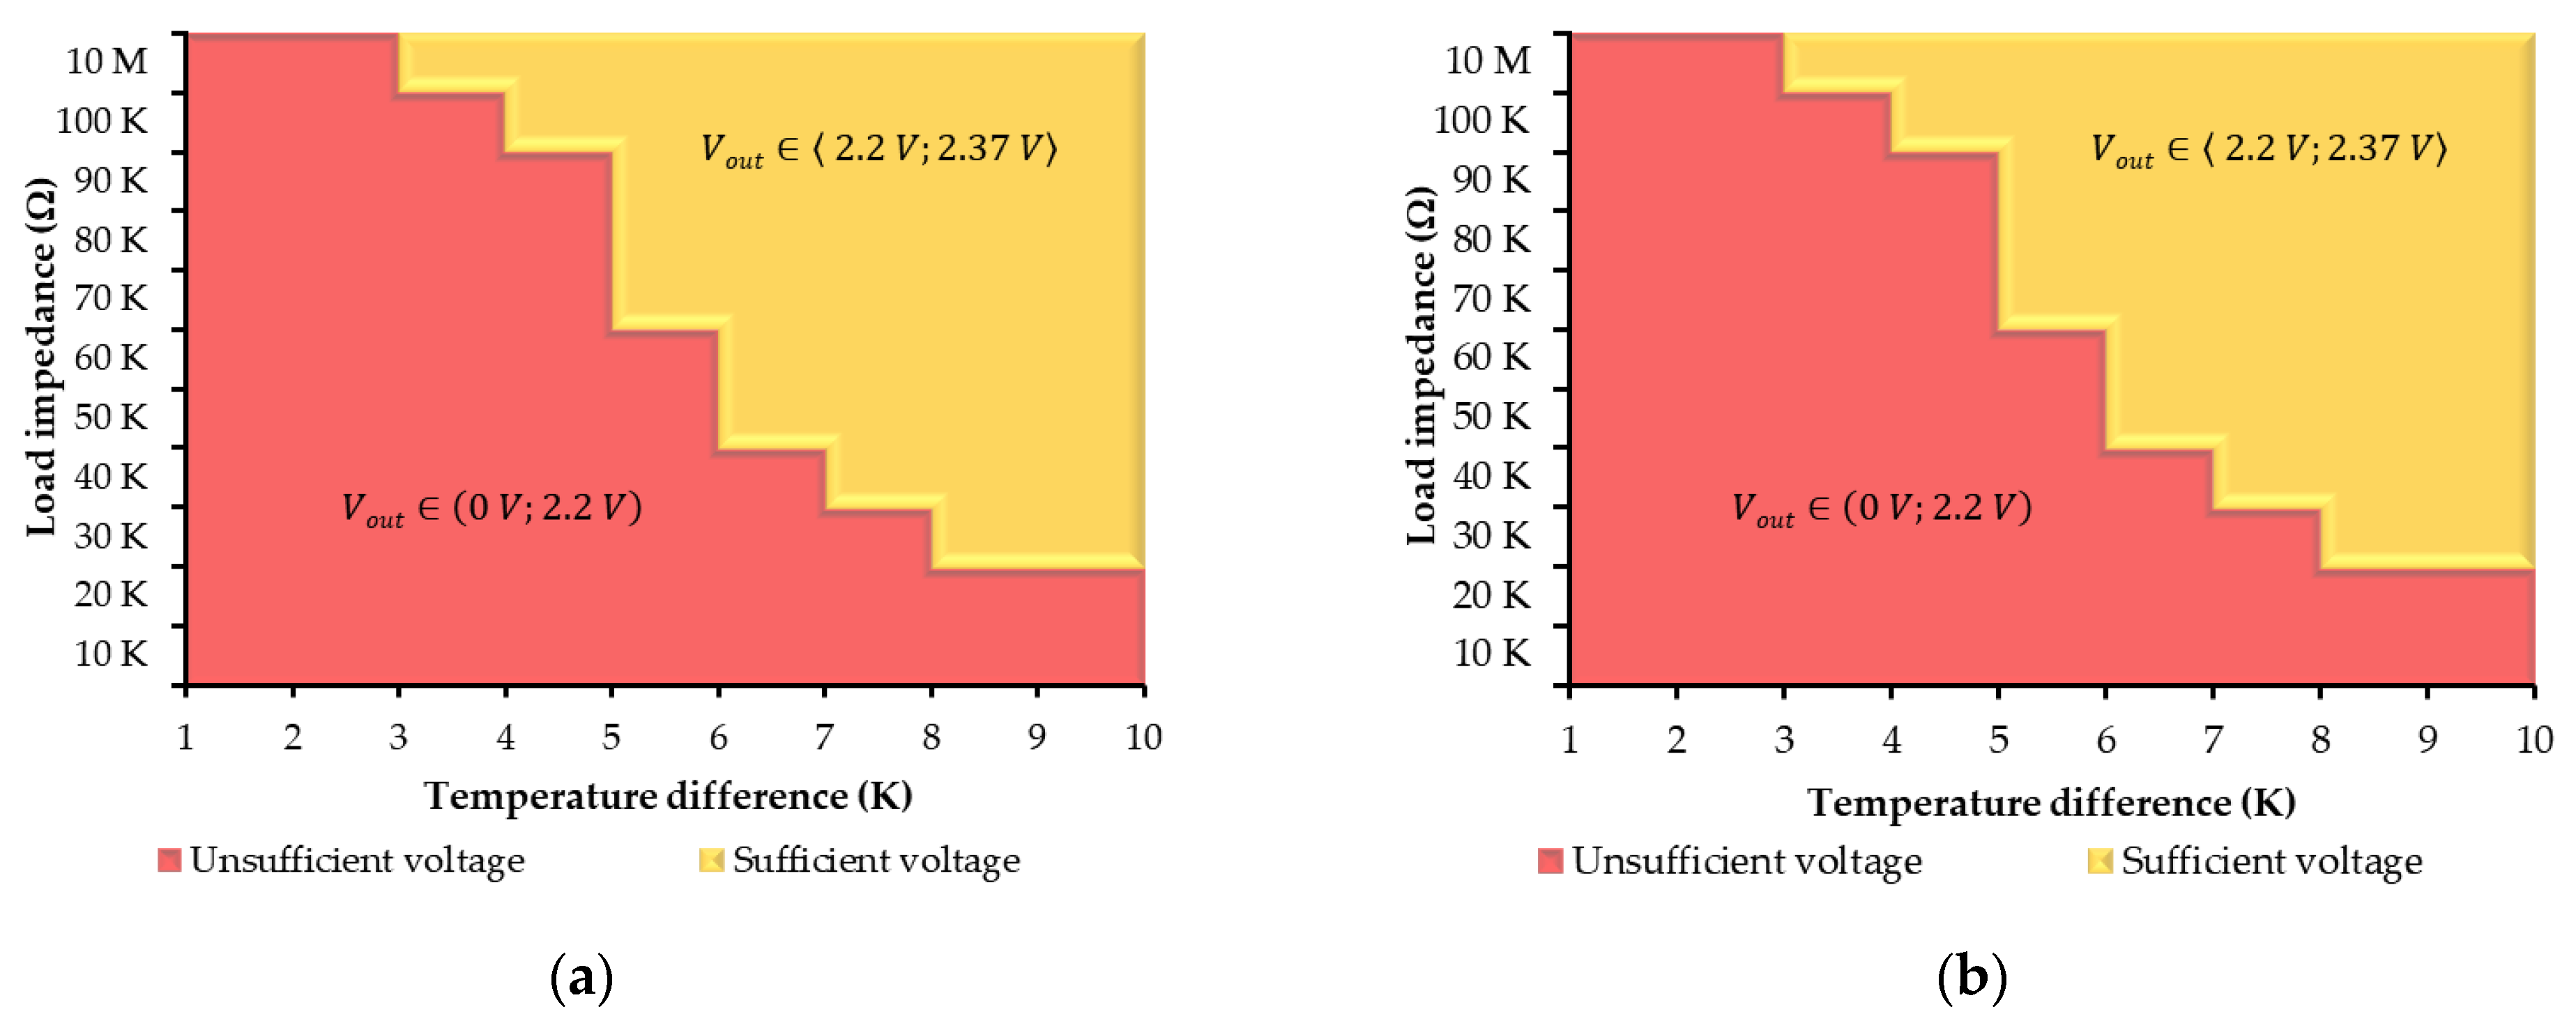
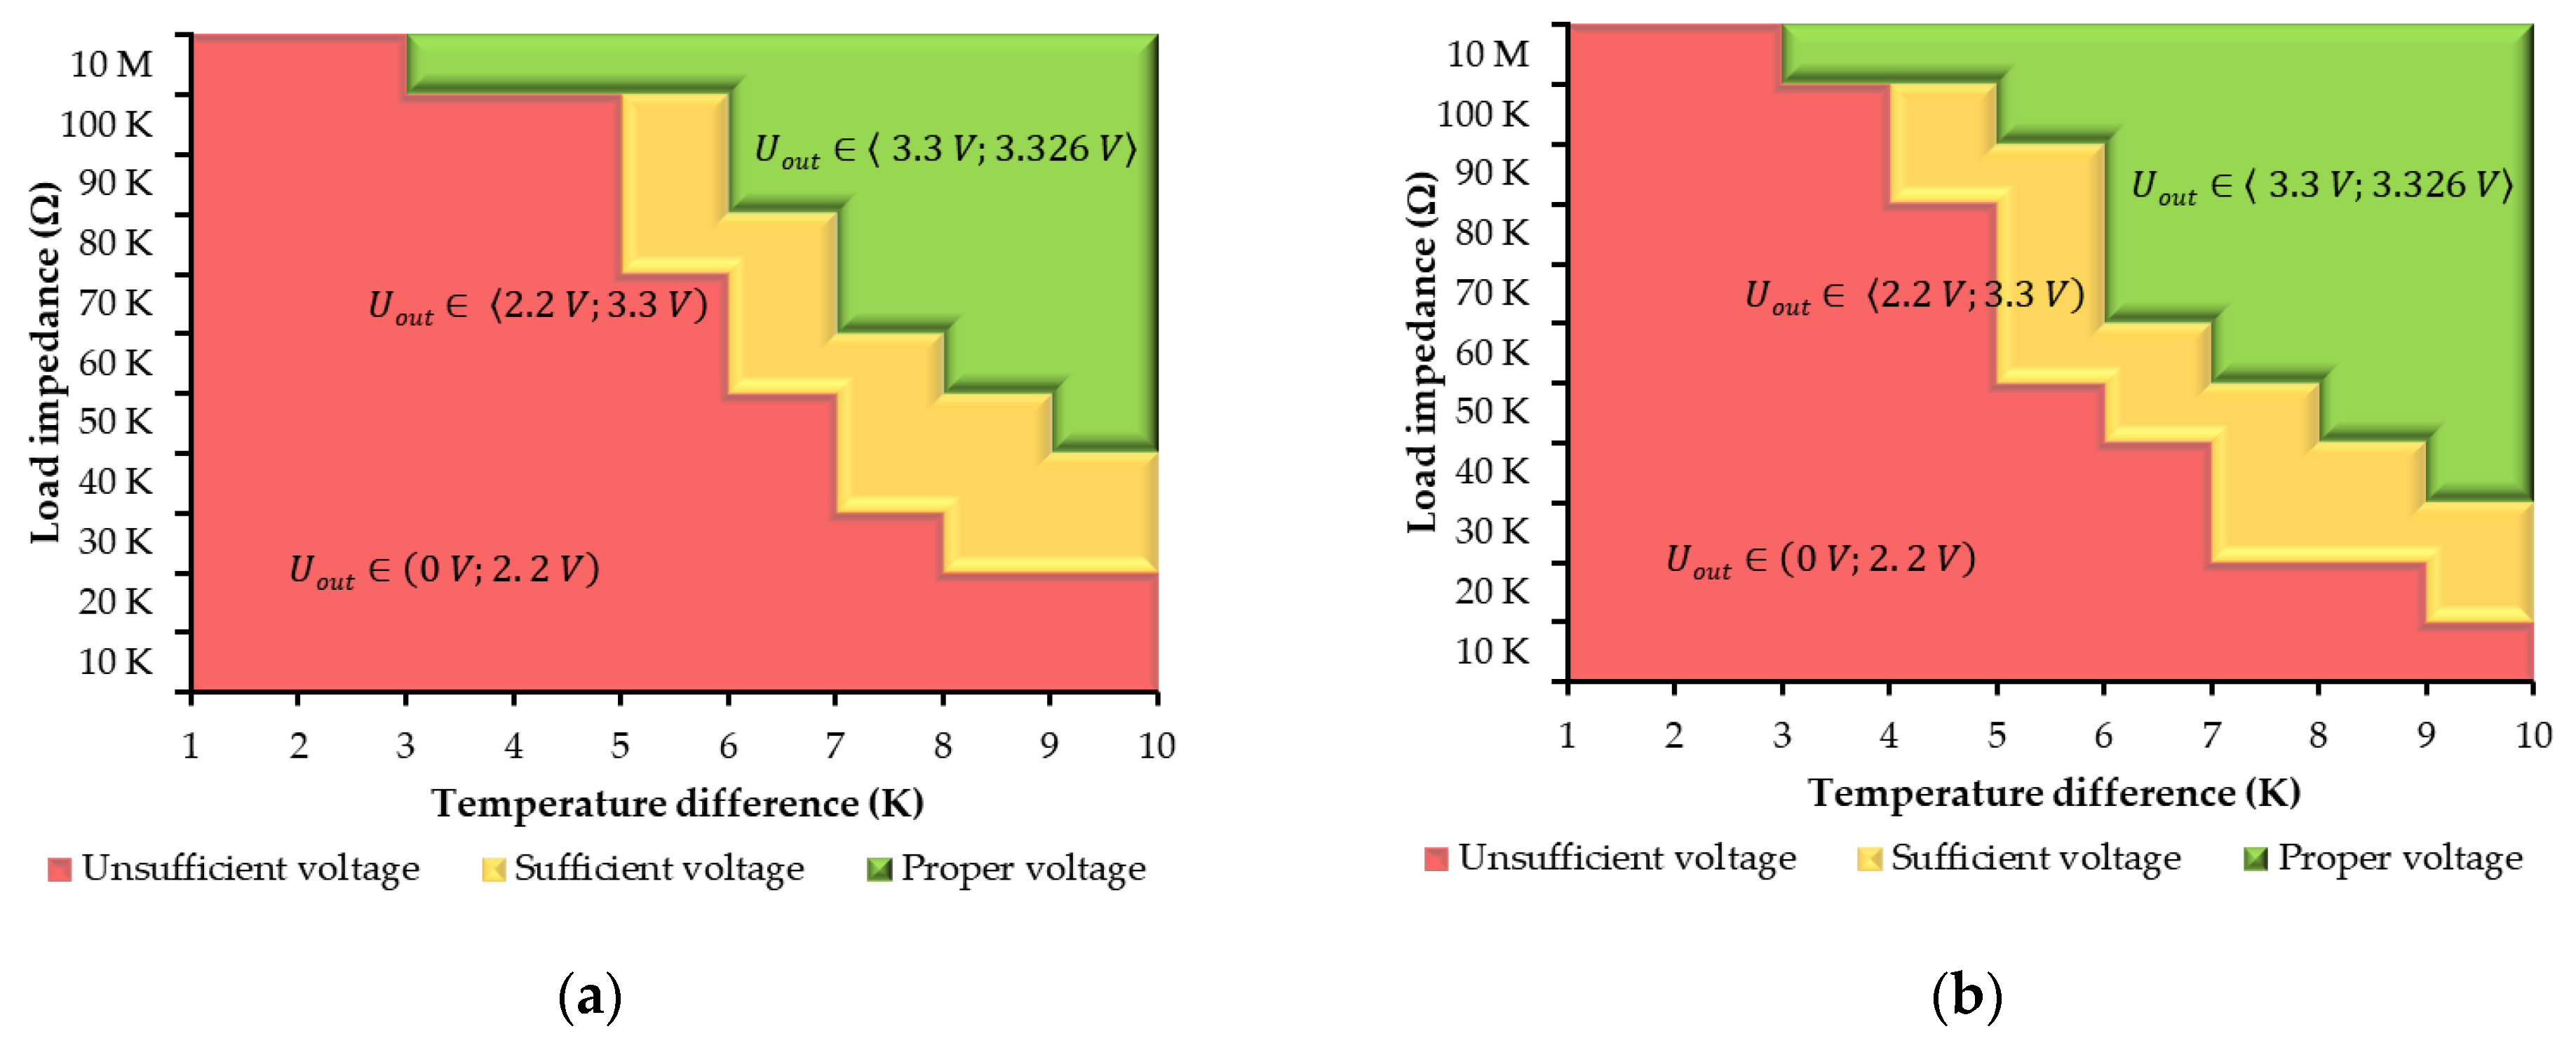
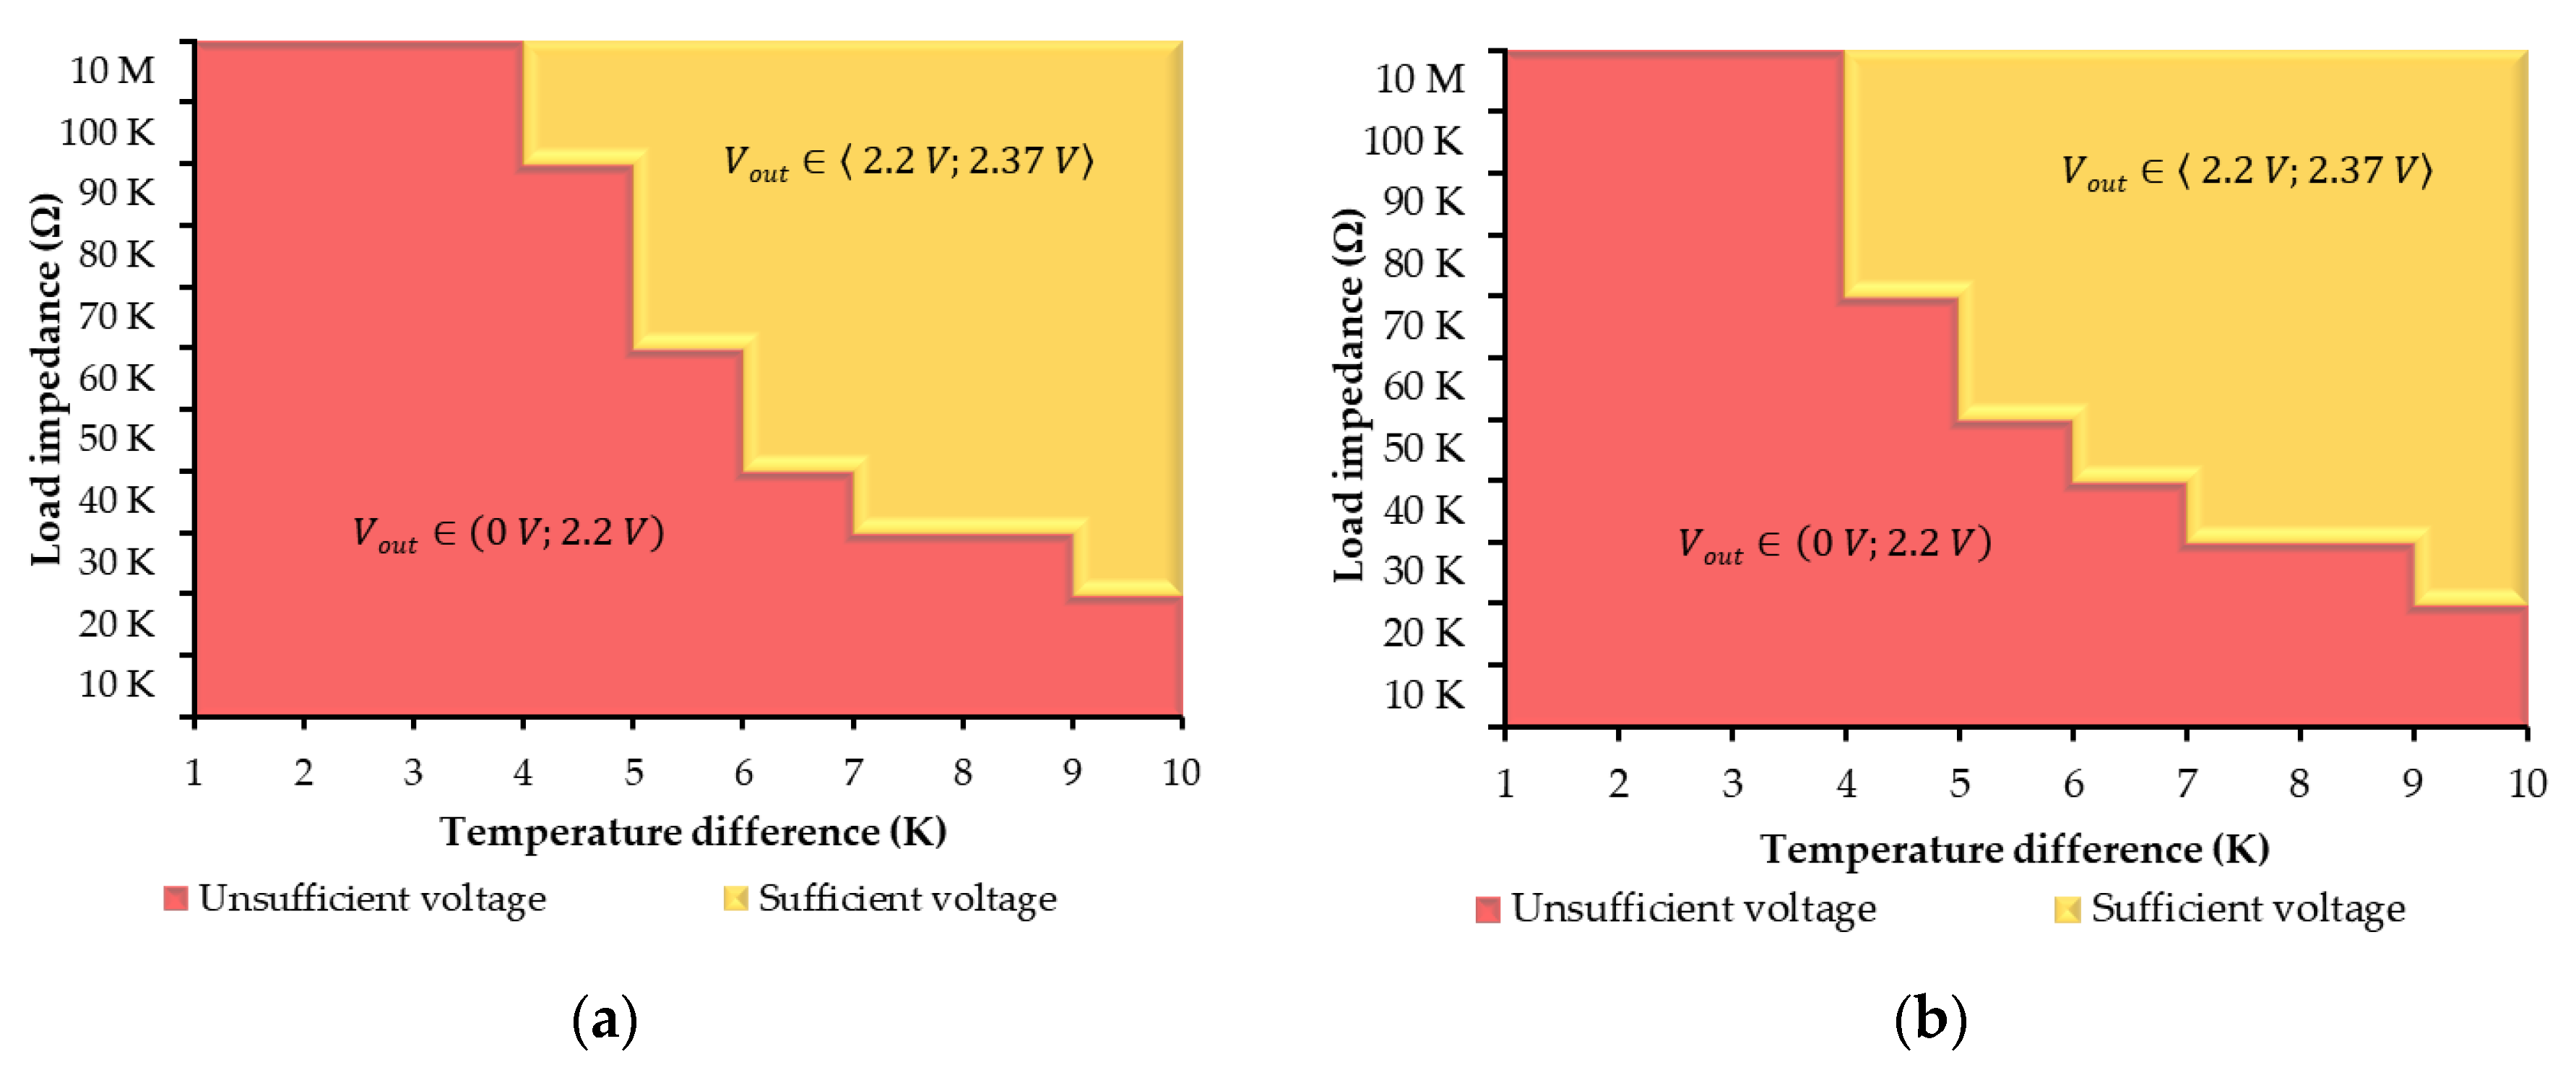
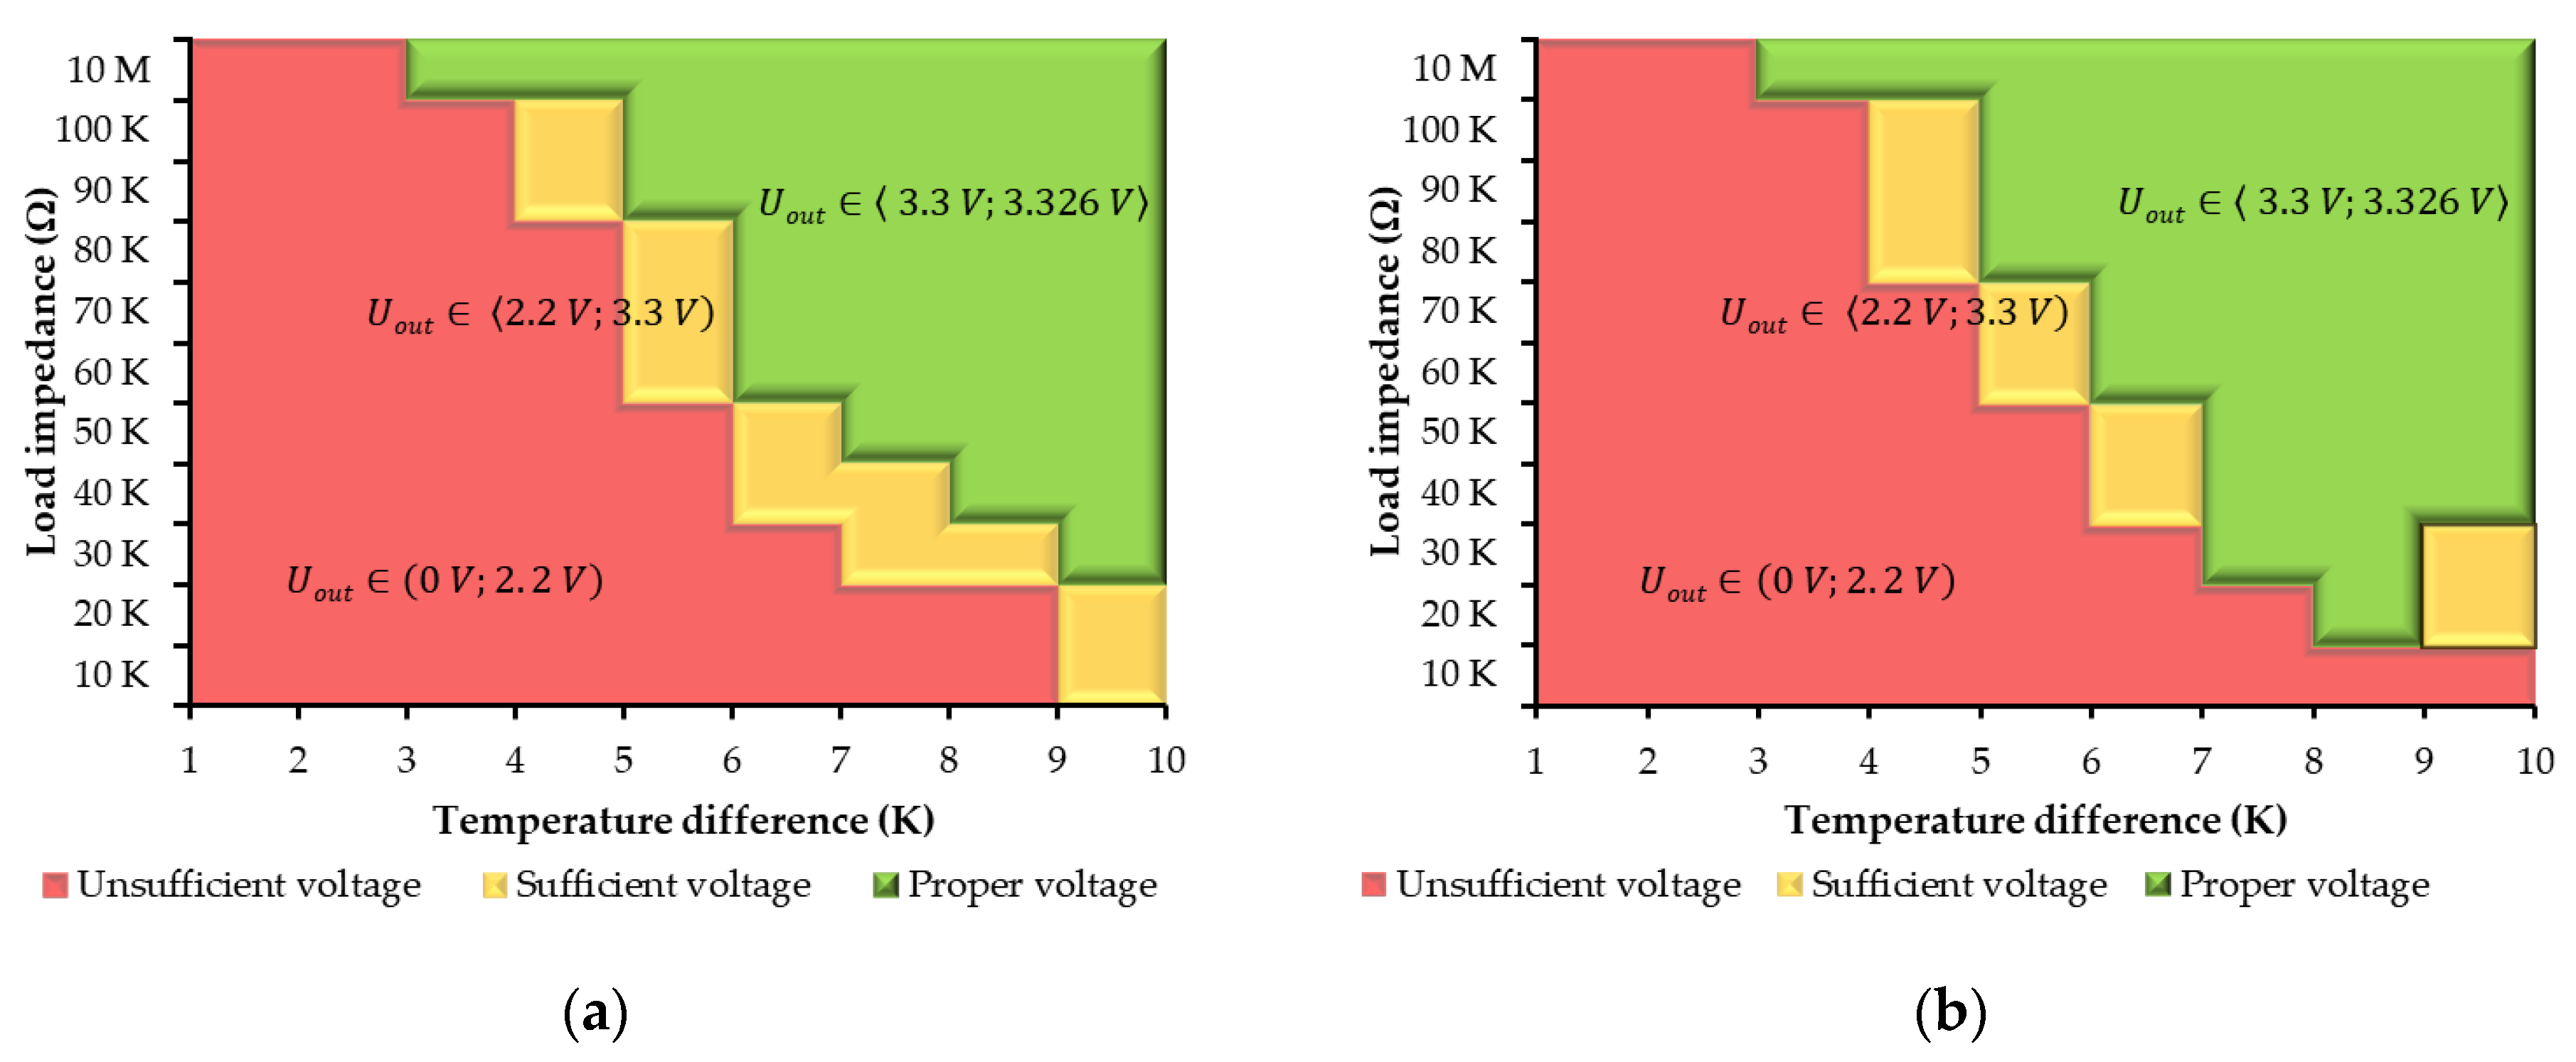
On the basis of the conducted measurements of the TEG-127009 supply circuit,
Figure 9 and
Figure 10 were created. As it can be observed, slightly better results as compared with TEPS1 were achieved, especially for the 3.30 V configuration. The above-mentioned graphs show that, on the one hand, the DC/DC converter set at 2.35 V is in the yellow operating area when the load exceeds 20 kΩ and when a temperature difference of 8 K occurs. On the other hand, TEPS2 with the converter set at 3.30 V, at a load of more than 100 kΩ and a temperature difference of 3 K, achieves energy generating in a stable (green) operating area.
3.3. TEPS3 Research Results
From the conducted measurements of the TES1-12703 with a converter circuit applied (
Figure 11 and
Figure 12), almost identical characteristics as TEPS2 for both voltage configurations were achieved. For 2.35 V supply systems, both graphs are identical as presented for the previous cases, and also a stable power supply is not guaranteed. Moreover, it is noticeable that the operating area marked with yellow color increases (
Figure 12). This area symbolizes the possibility of conditional operating of the DC/DC converter, which does not guarantee full stability of the power supply system.
3.4. TEPS4 Research Results
The measurements performed for the TES1-12704 converter (
Figure 13 and
Figure 14) show a difference from the TEPS2 and TEPS3 results analyzed above. In the case of 2.35 V supply, the operating area for 8 K occurs when the load is more than 20 kΩ. For the 3.30 V converter configuration, the stable operating area starts from 7 K when the load exceeds 20 kΩ.
3.5. TEPS5 Research Results
On the basis of the conducted measurements and analyses of the converter TEC1-127060 (
Figure 15 and
Figure 16), it is clear from the graphs that at 2.35 V, the TEPS5 setting at least partially works in the operating area from 9 K, which is the worst result. However, when configuring the DC/DC converter at 3.30 V, the operating area is stable from 7 K, in addition, with a temperature difference of 9 K, it even reaches the full operating range. This configuration can be considered to be the best of all previously investigated cases. In this way, it can be assumed that the combination of two TEPS5 cells would be the optimal solution used in the water meter consumption supply system.
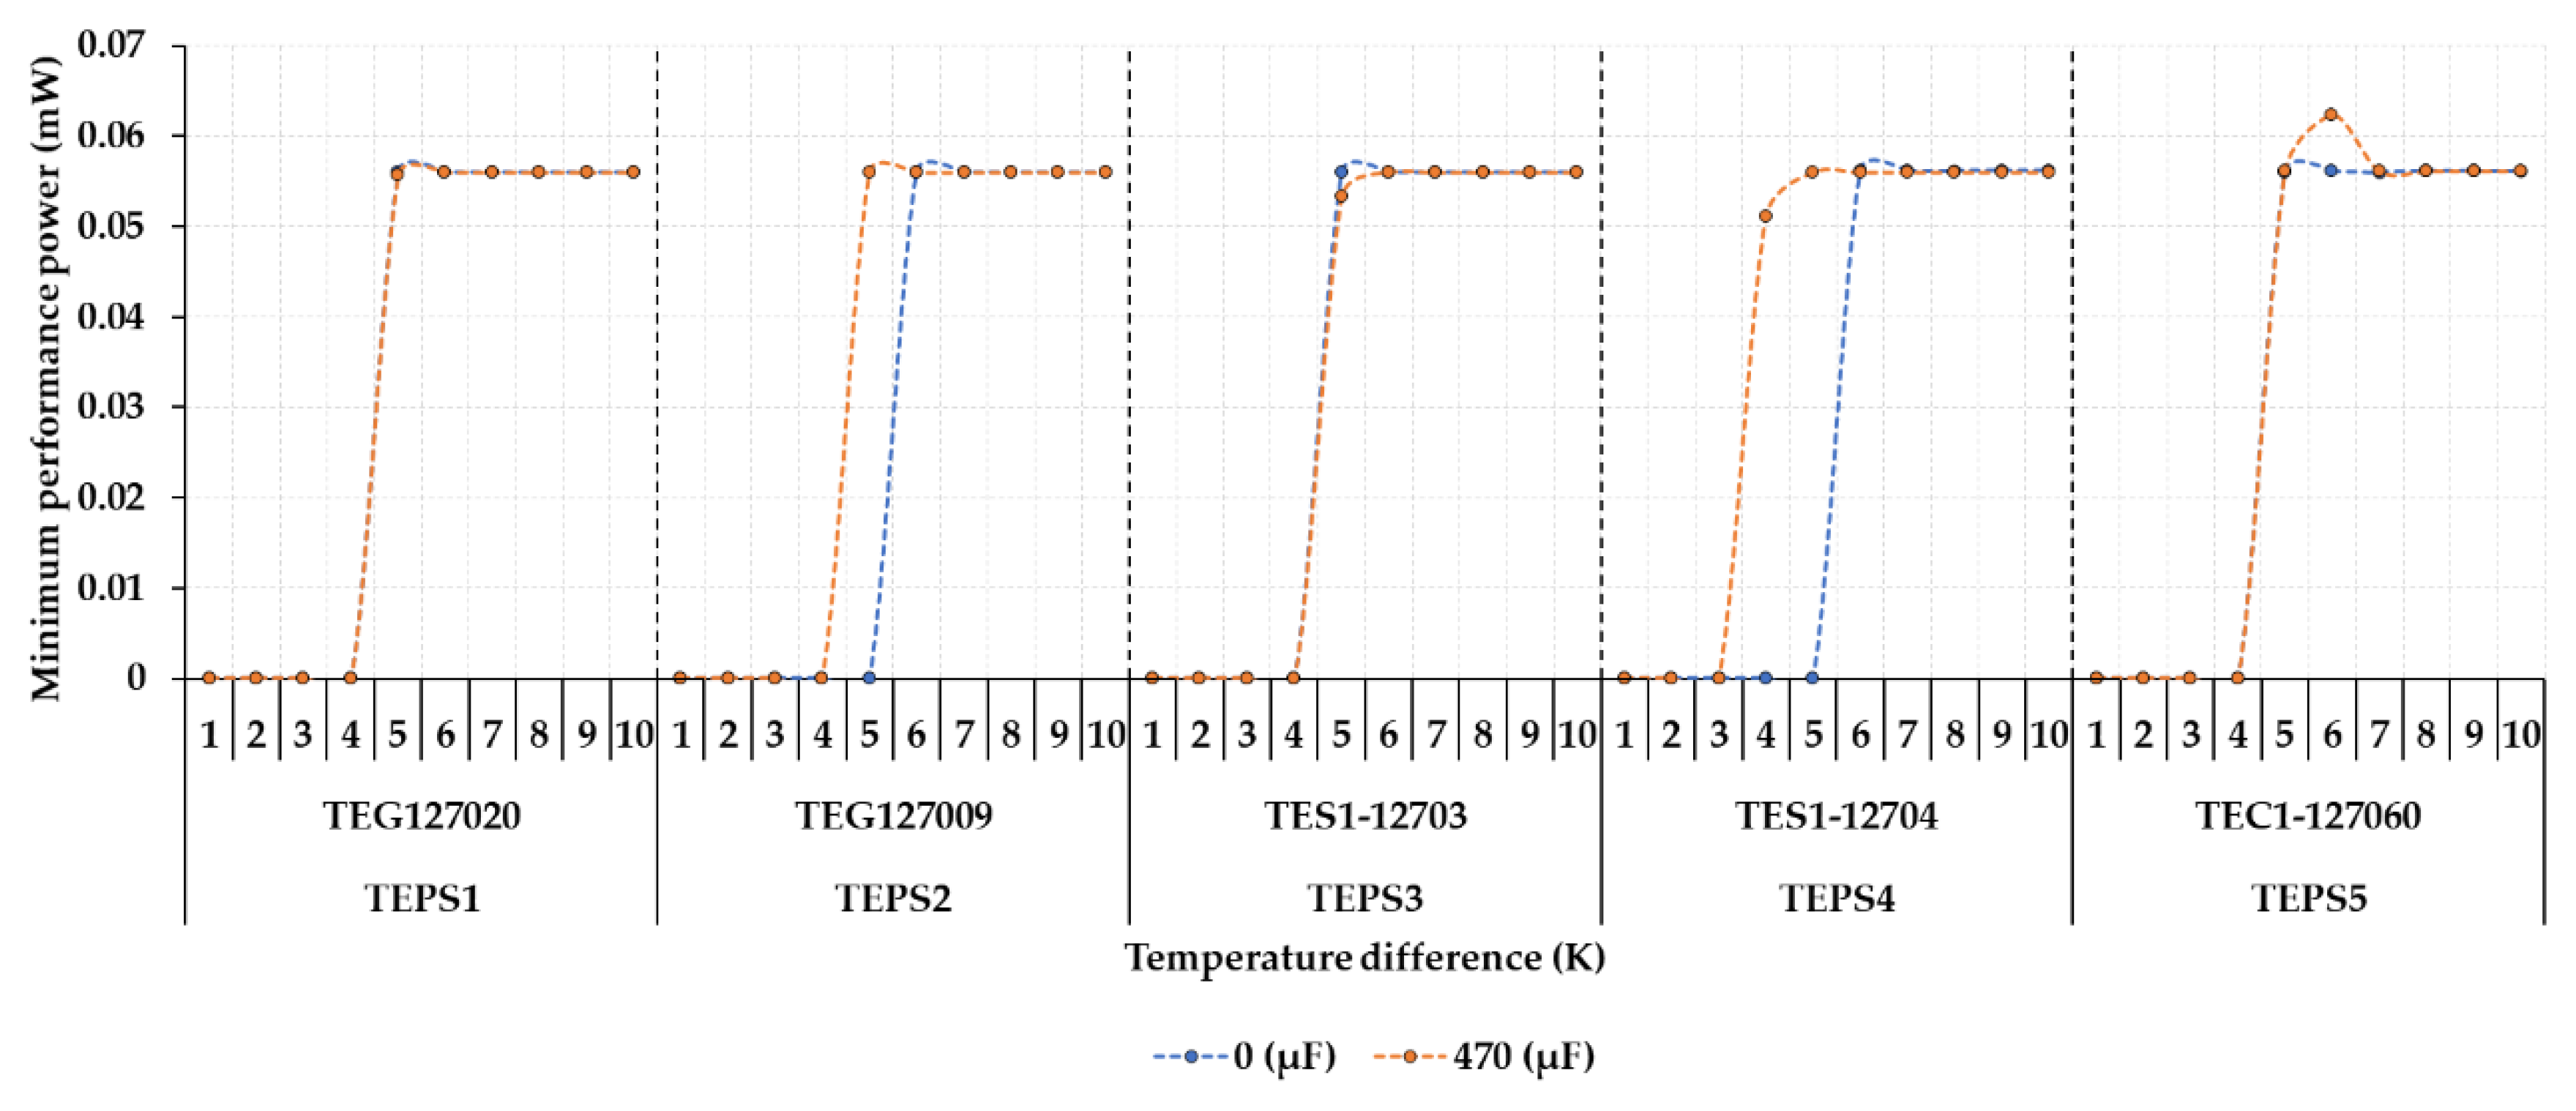
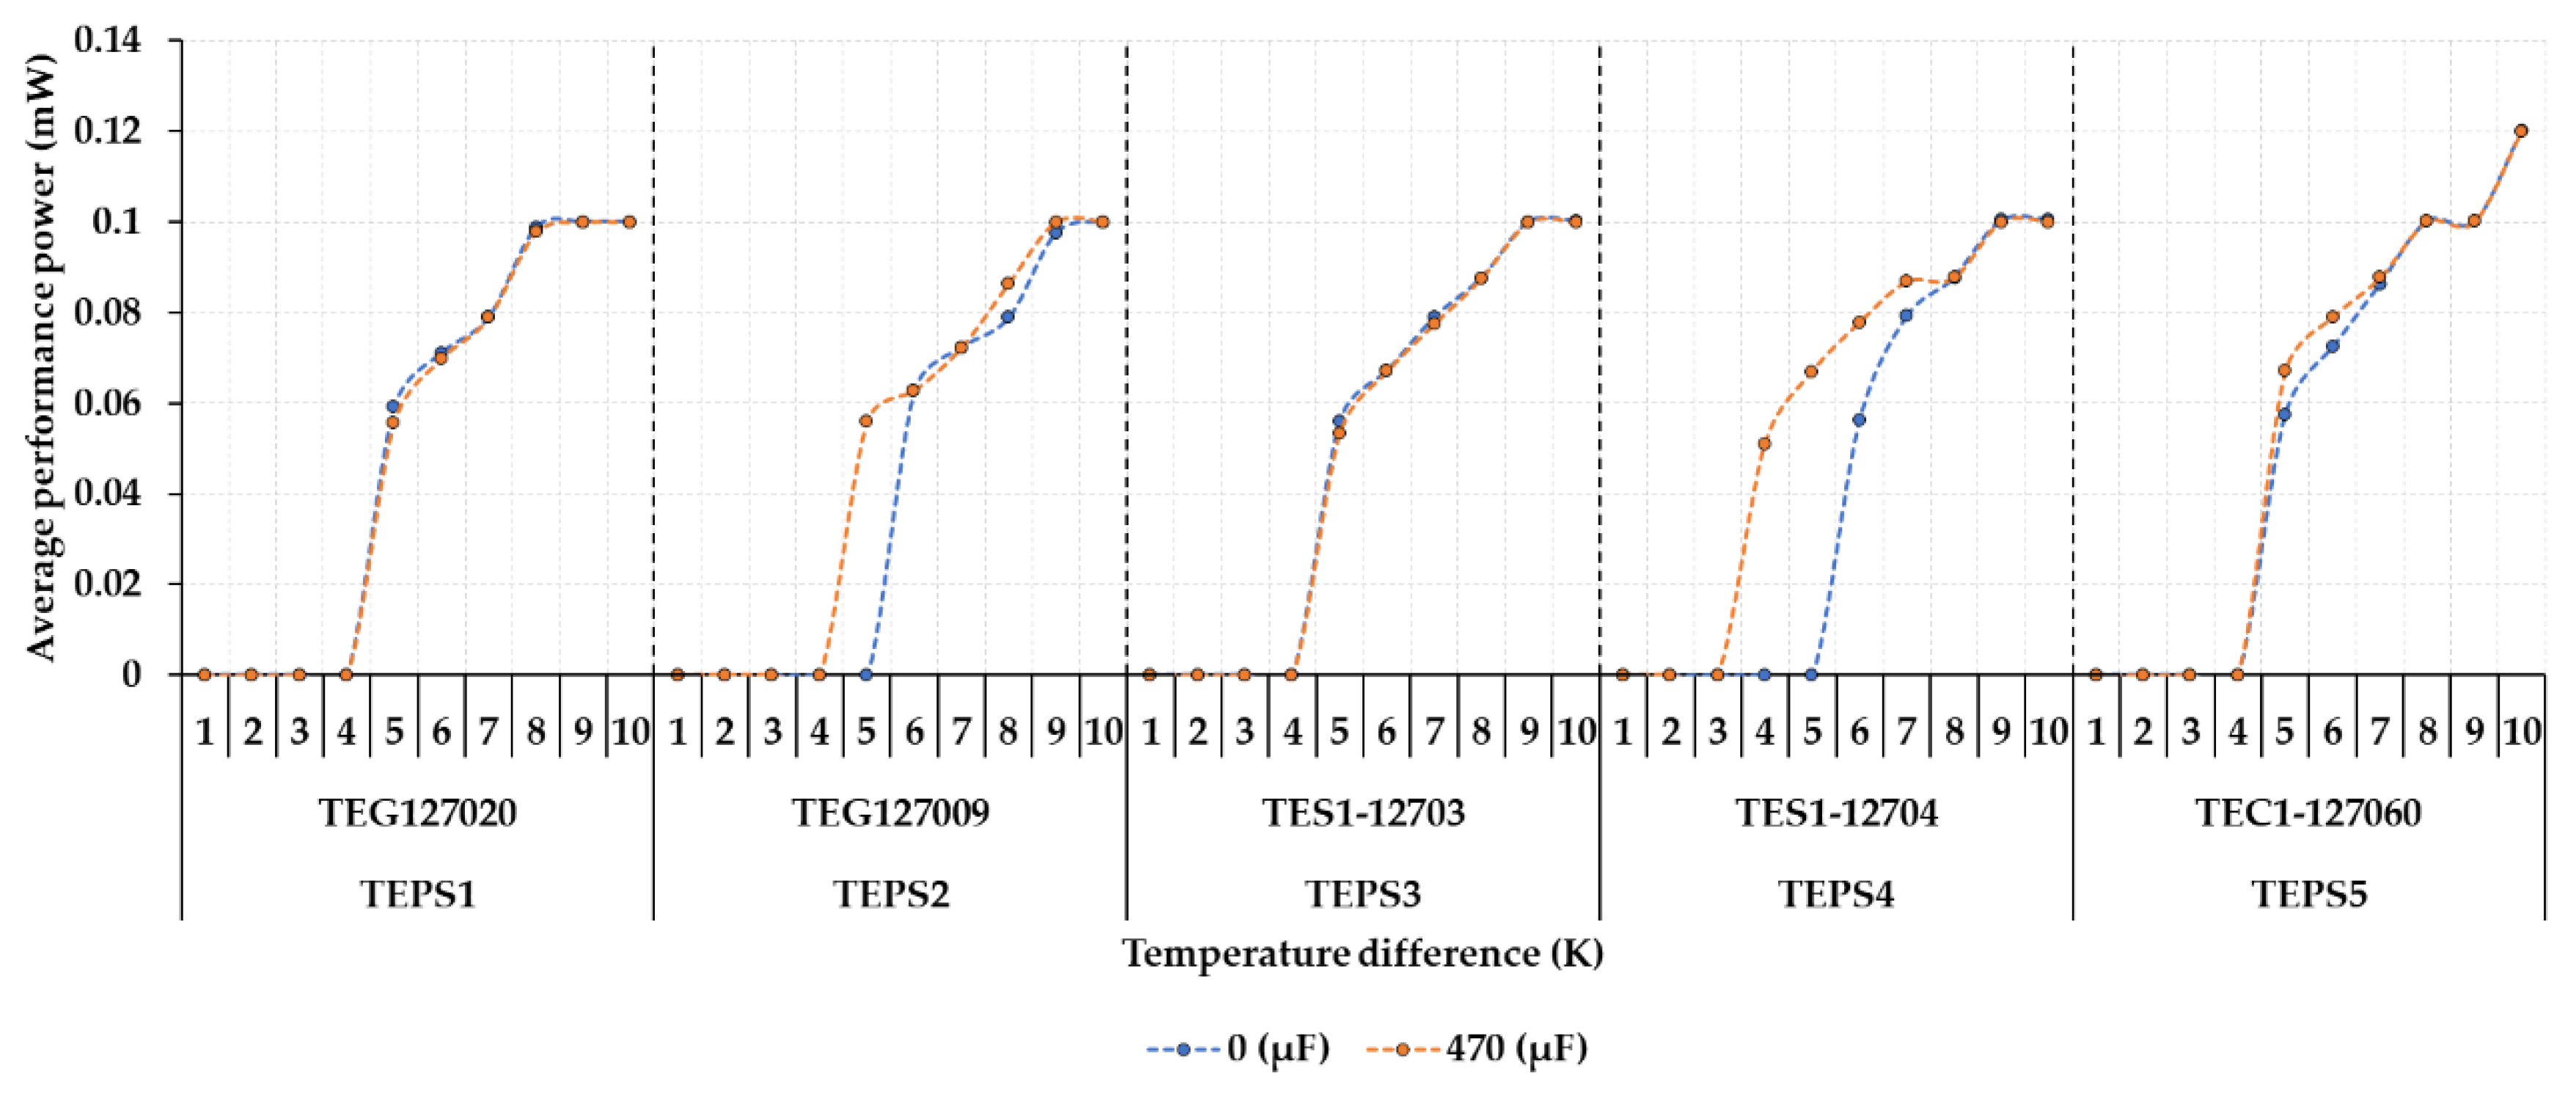
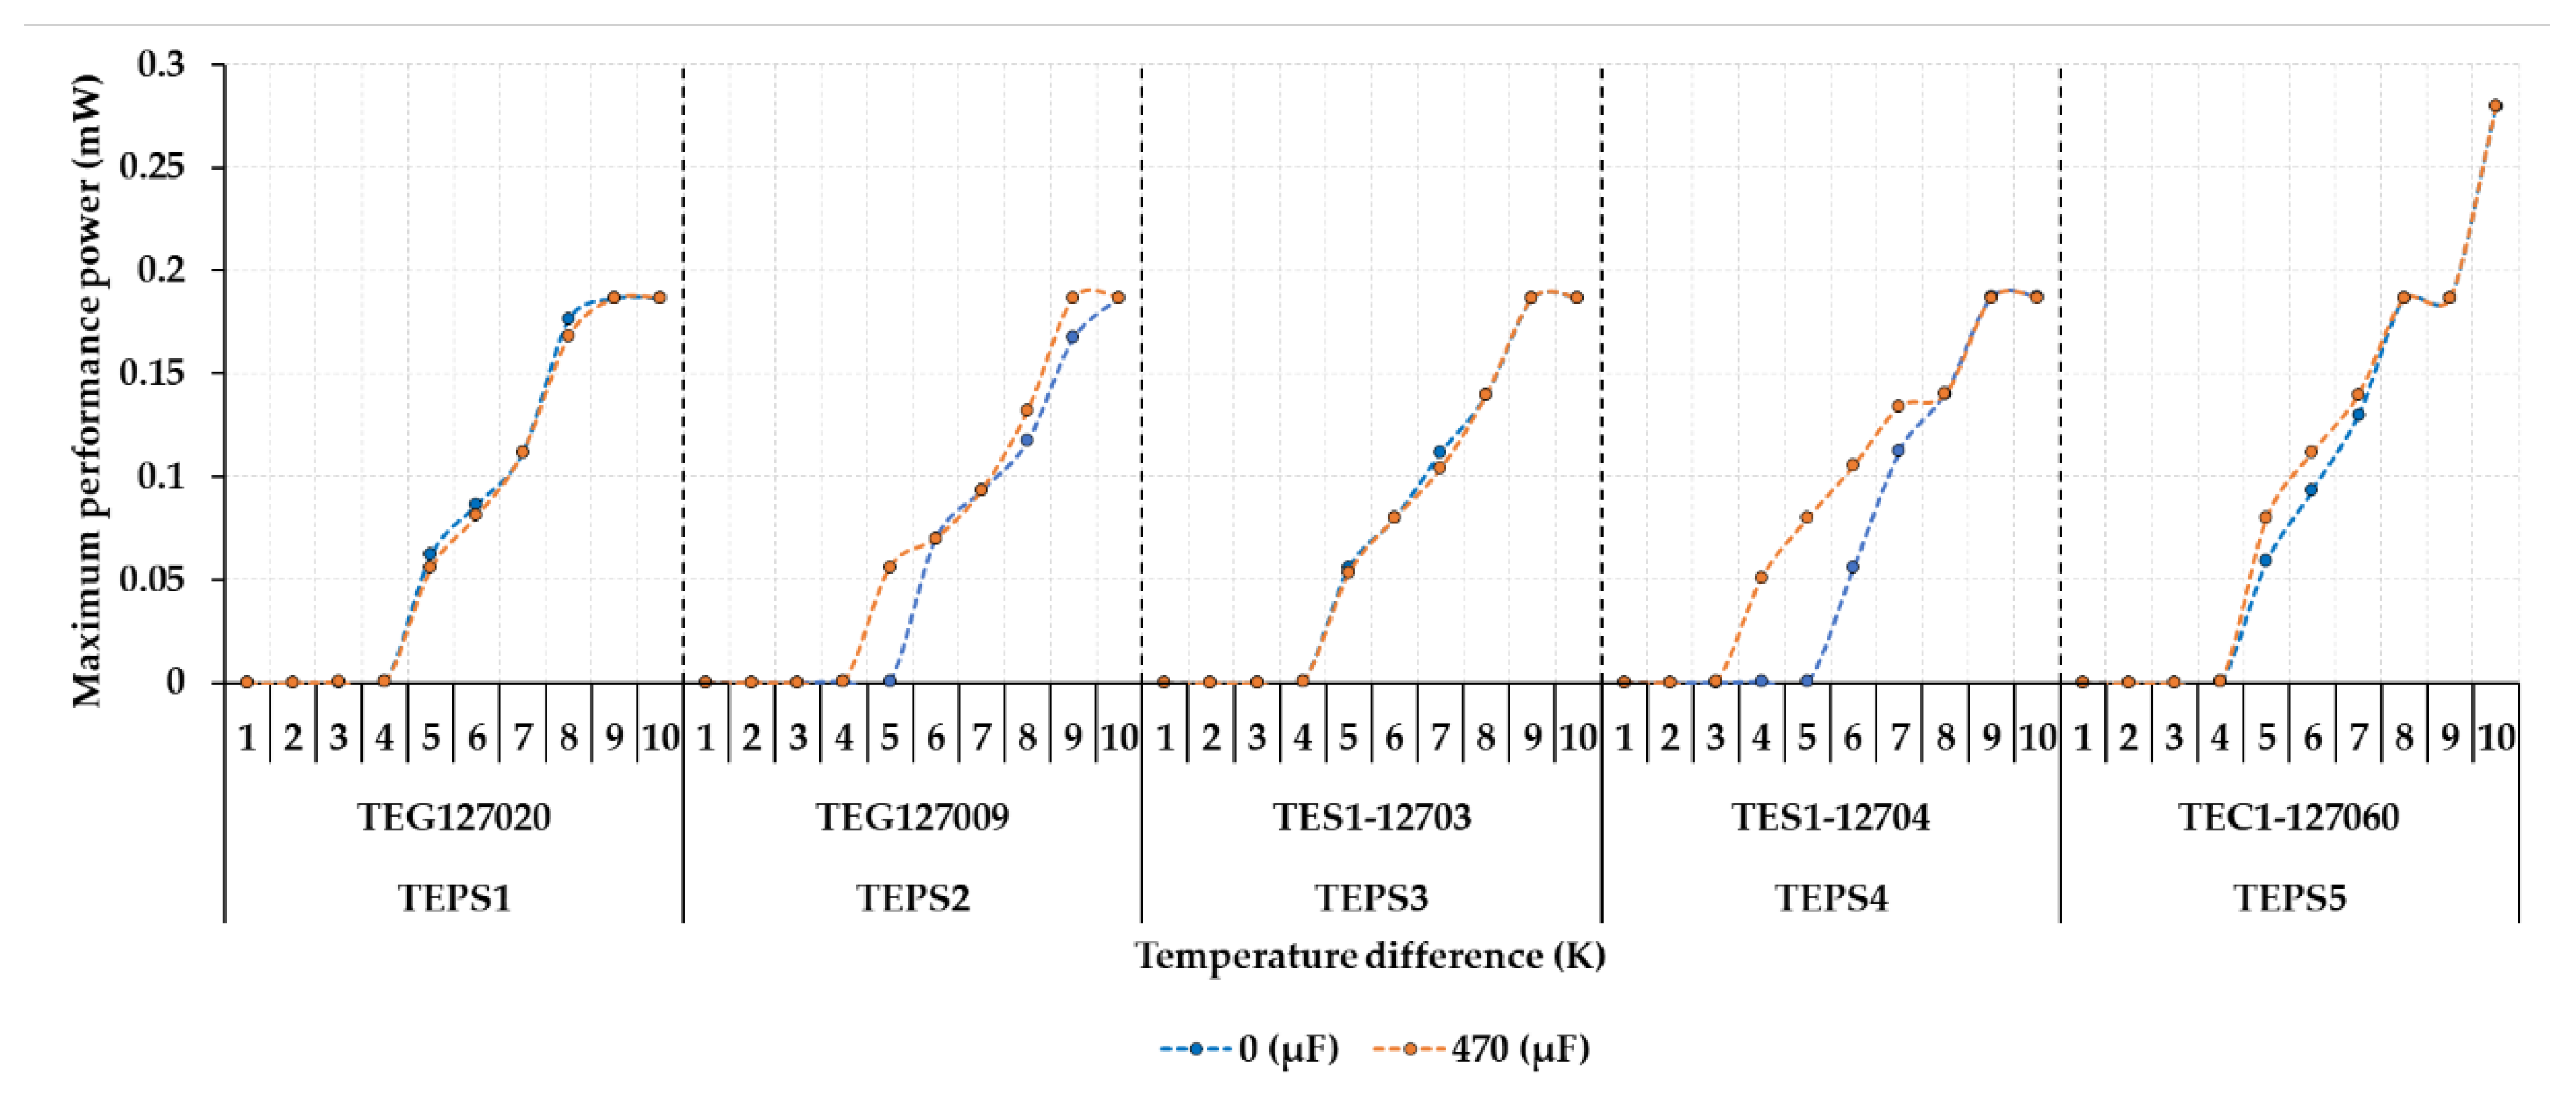
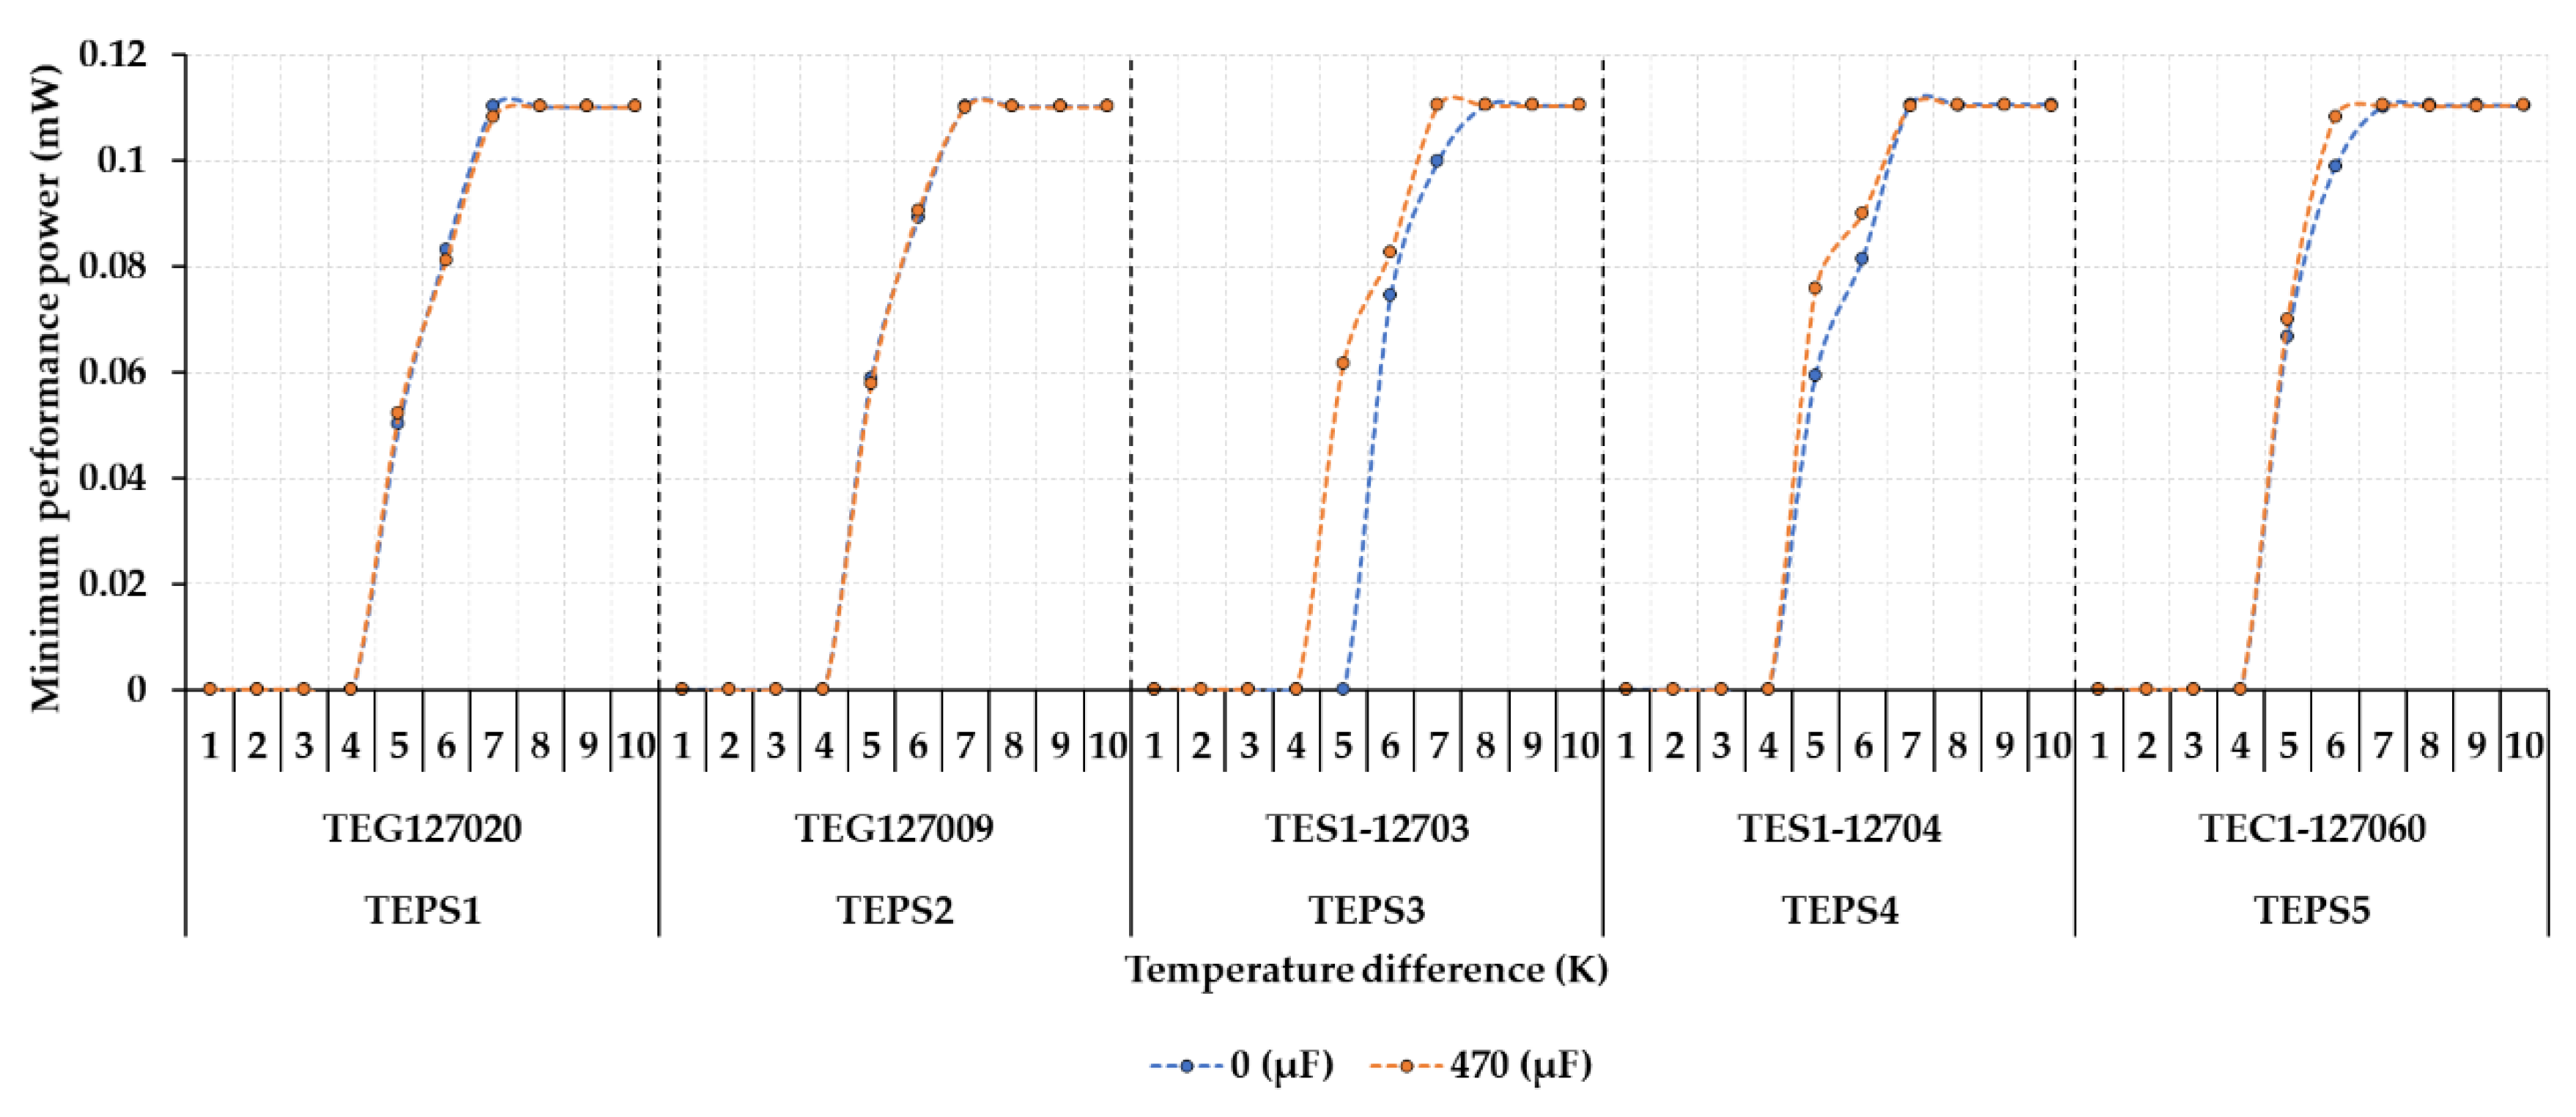
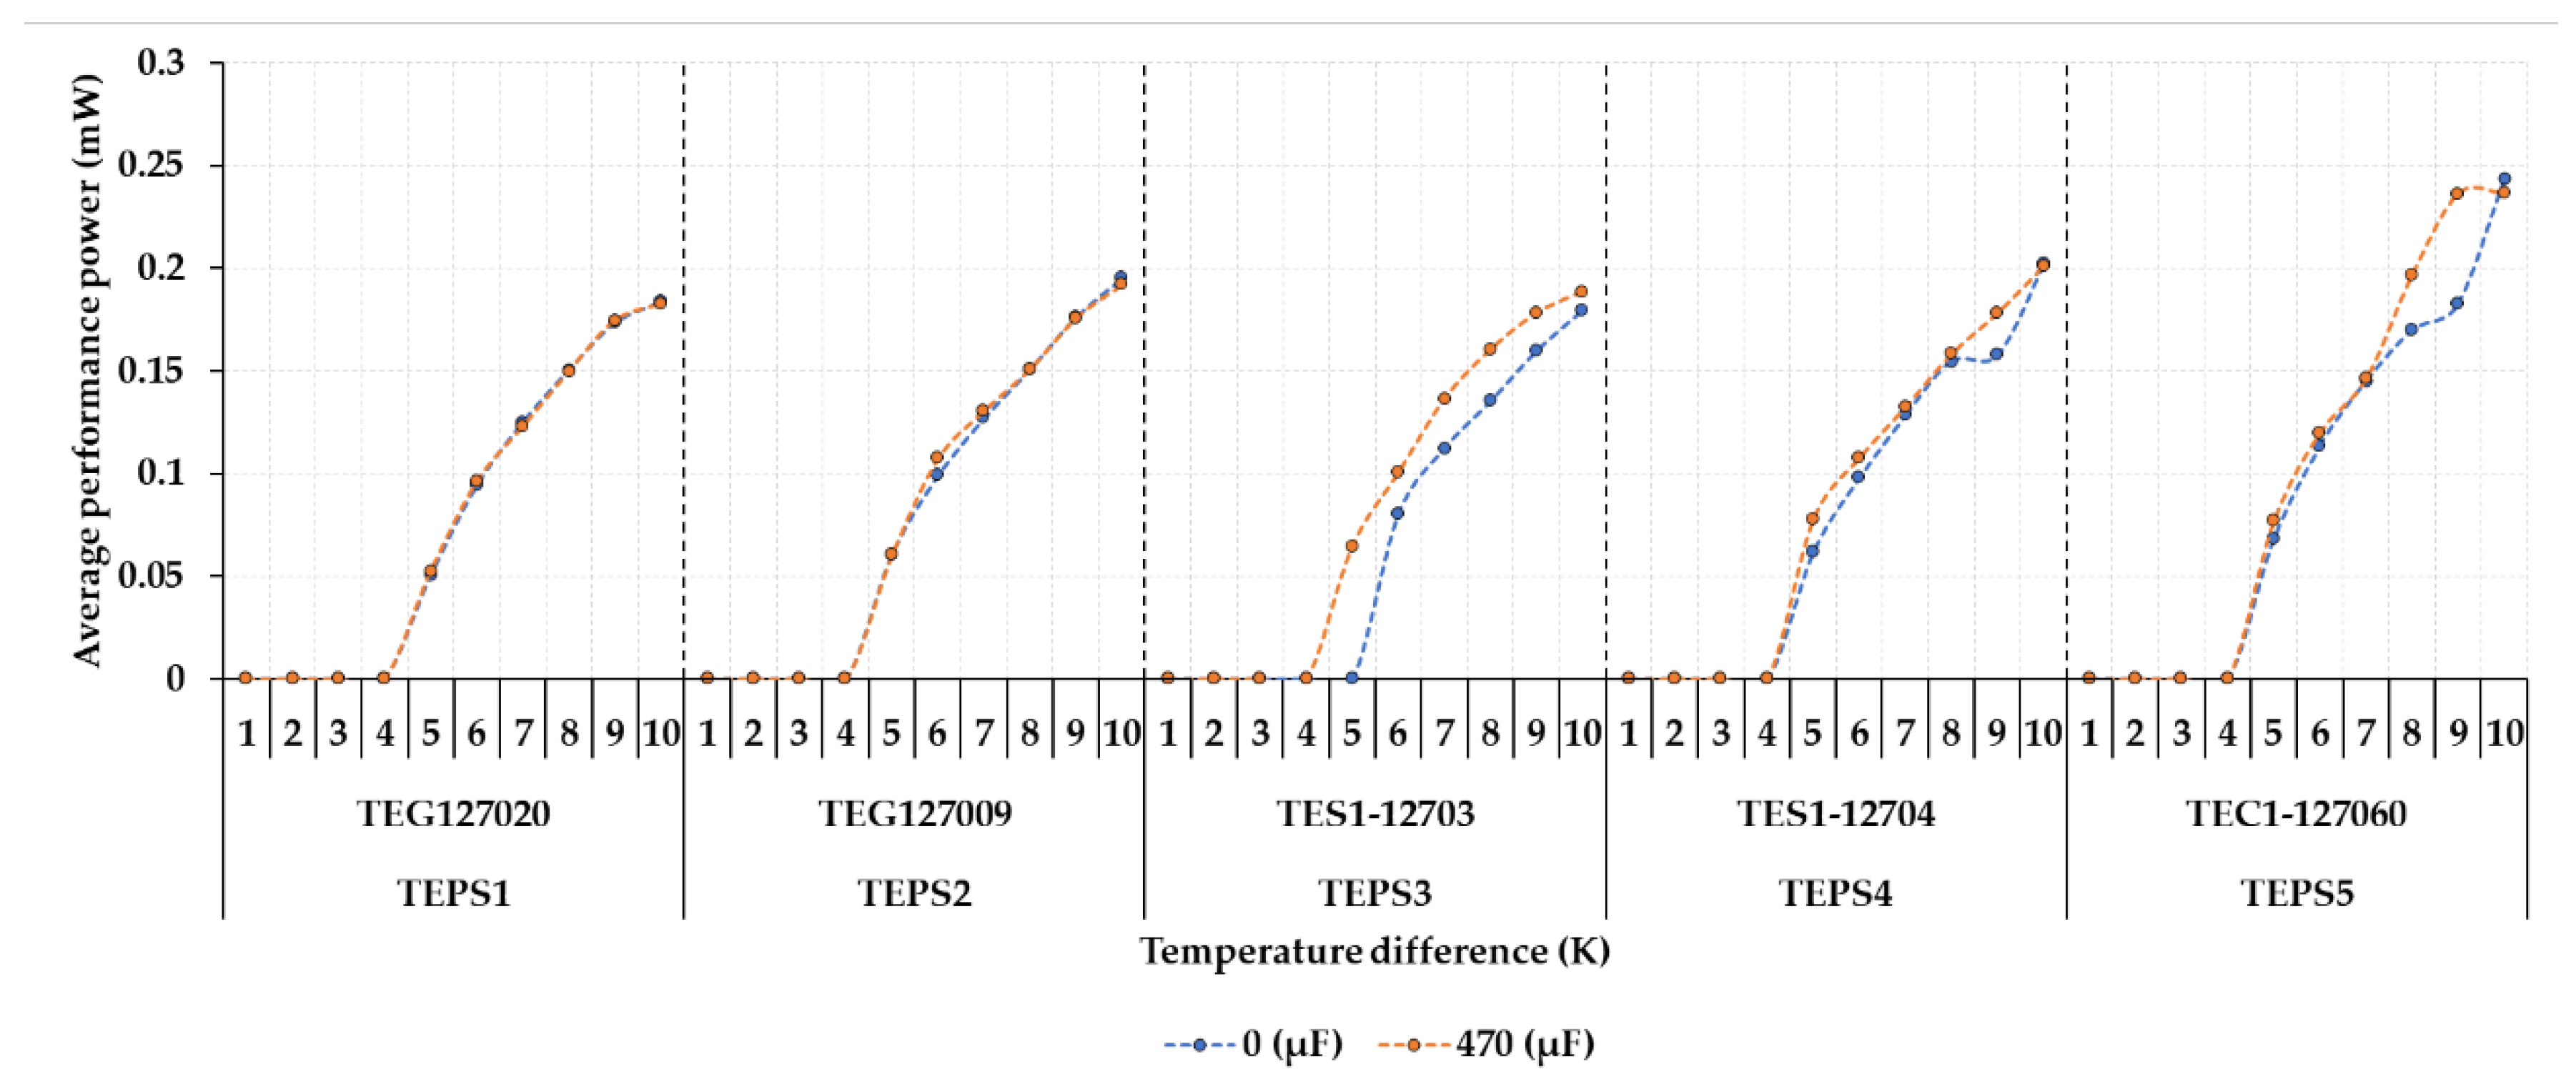
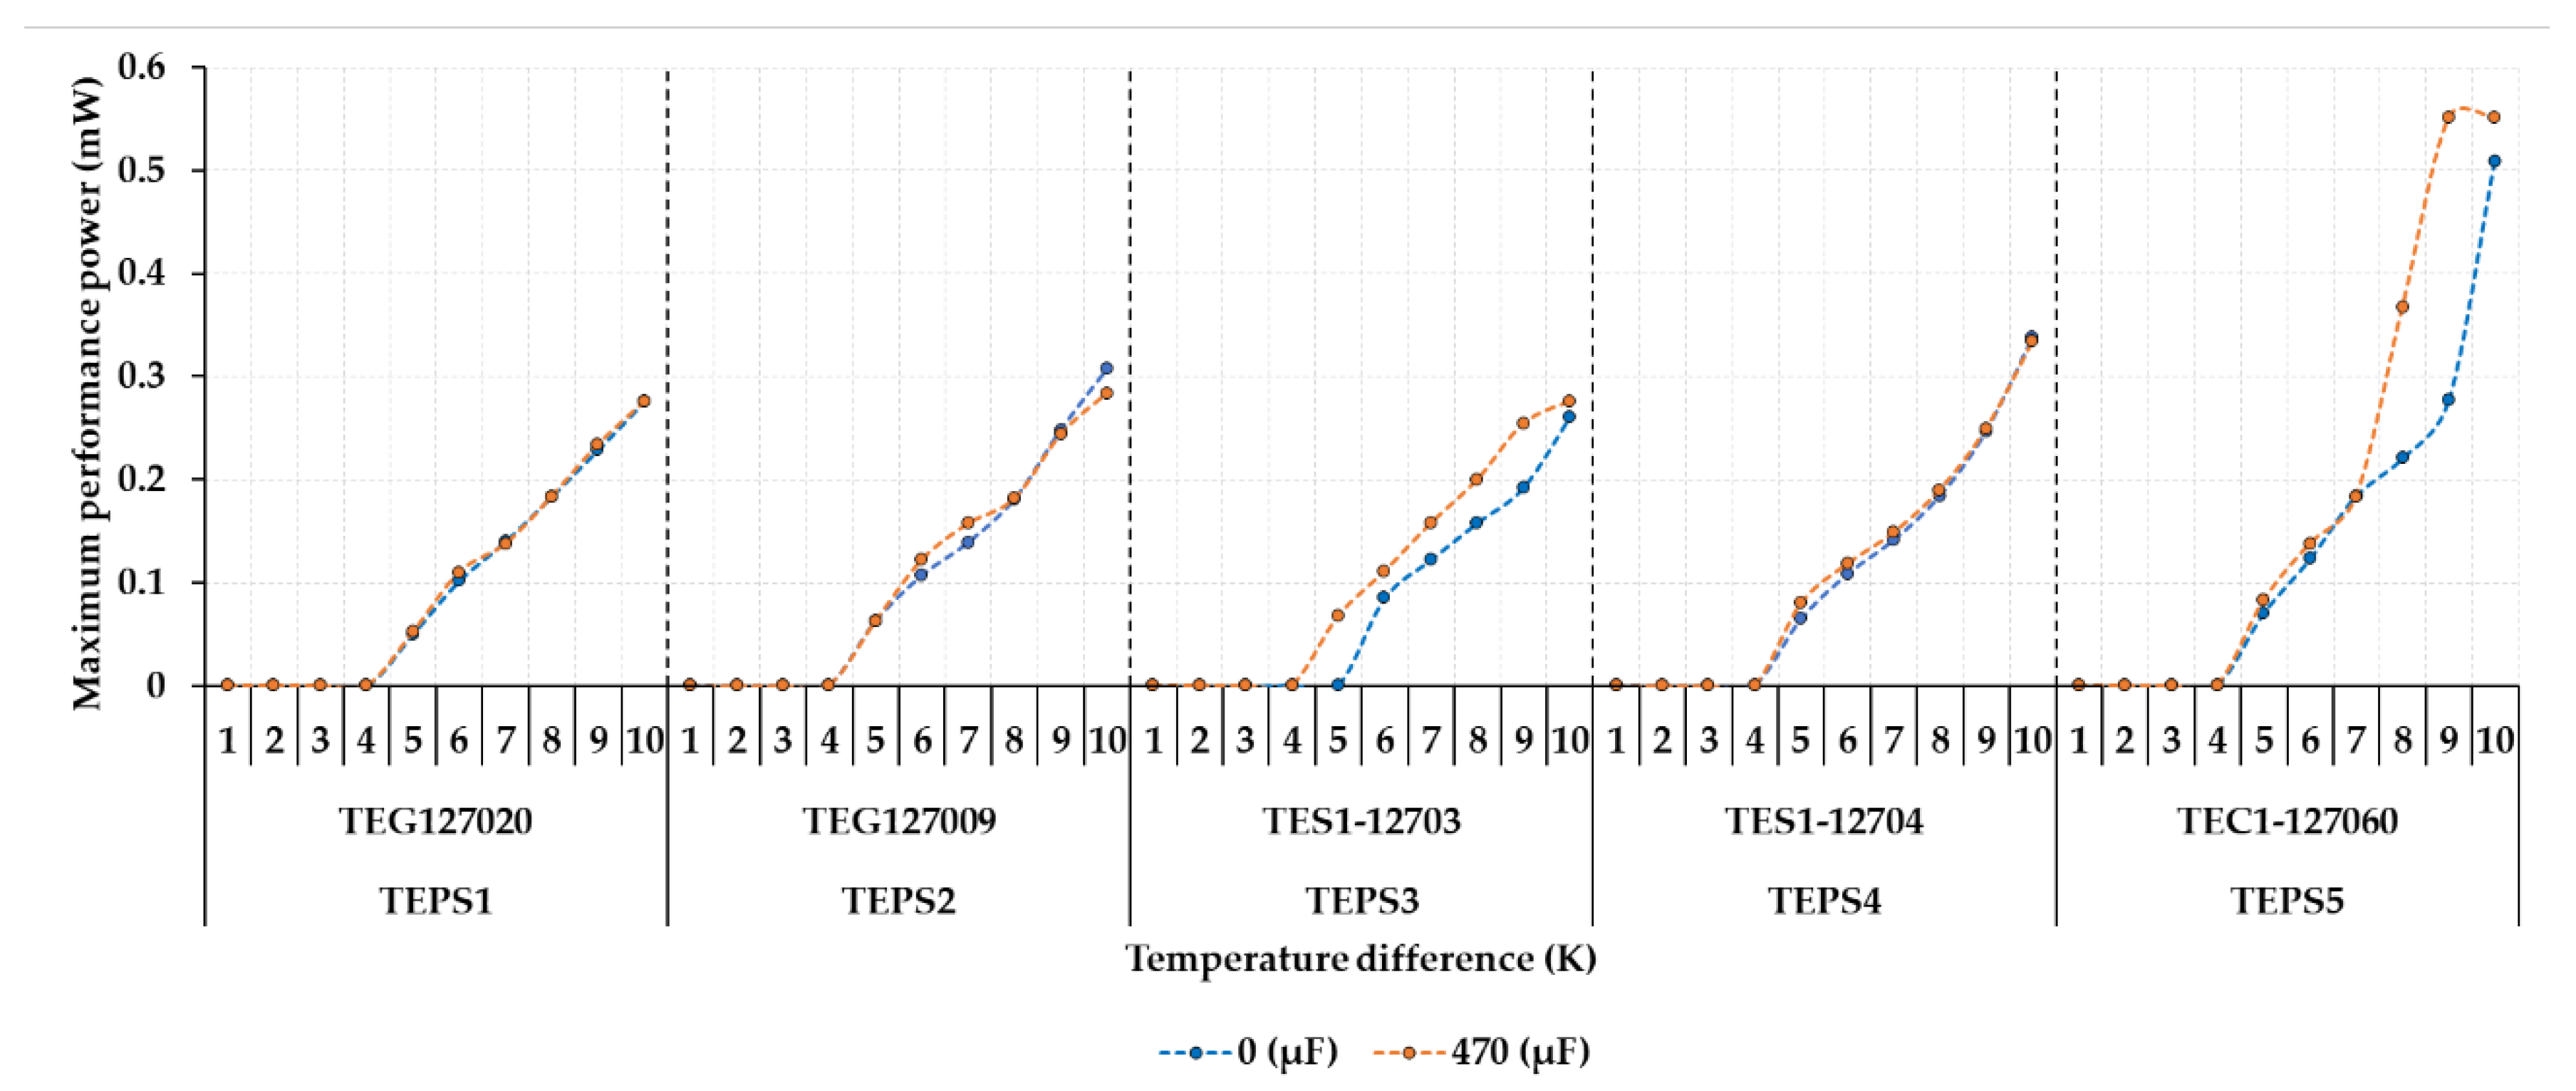
3.6. Generated TEPS Power Efficiency Analysis
The power performance analyses were performed by measuring and analyzing the functionality of the generated energy with the use of selected types of thermoelectric generators. These analyses of the power generated by the thermoelectric generator, depending on the temperature difference between the top and the bottom of the thermoelectric cells, presented below, are interpreted to visualize and evaluate the possibility of applying the source type to a water consumption meter. For the performance, the power performance analyses were divided into individual graphs for each type of thermoelectric cell, which was supplemented by a dependence curve for variants without a storage capacitor and with a storage capacitor 470 μF. The power analyses were performed in accordance with the measurement variants, i.e., the converters were configured for the voltages of 2.35 V and 3.30 V. Then, the curves (
Figure 10,
Figure 12,
Figure 14 and
Figure 16) of the generated power were achieved from the combined yellow and green areas which represent the sufficient supply power for the MCU. Therefore, the data (
Figure 17,
Figure 18,
Figure 19,
Figure 20,
Figure 21 and
Figure 22) were divided into three types of graphs to simplify further analysis of the research results, which are represented as follows:
mean value of the generated power (
Figure 18 and
Figure 21)—the measurement results obtained are average;
The temperature difference dependence of the power generation is partially linear. The output generated power is close to zero for low temperature differences, because the DC/DC converter does not have suitable operating conditions given by a low input voltage below the defined operating limit. The next working part of the power generation increases with an almost linear curve. The physical assumption is proven by increasing the output power of the generator with an increasing temperature difference in this part. Deviations from linearity can be caused by nonlinearity of electronic components and residual capacities, but they do not have a significant effect on the increasing character of the curves. The last constant part of the power generation characteristics is given by the maximum possible power that the DC/DC converter can provide in the given set configuration.
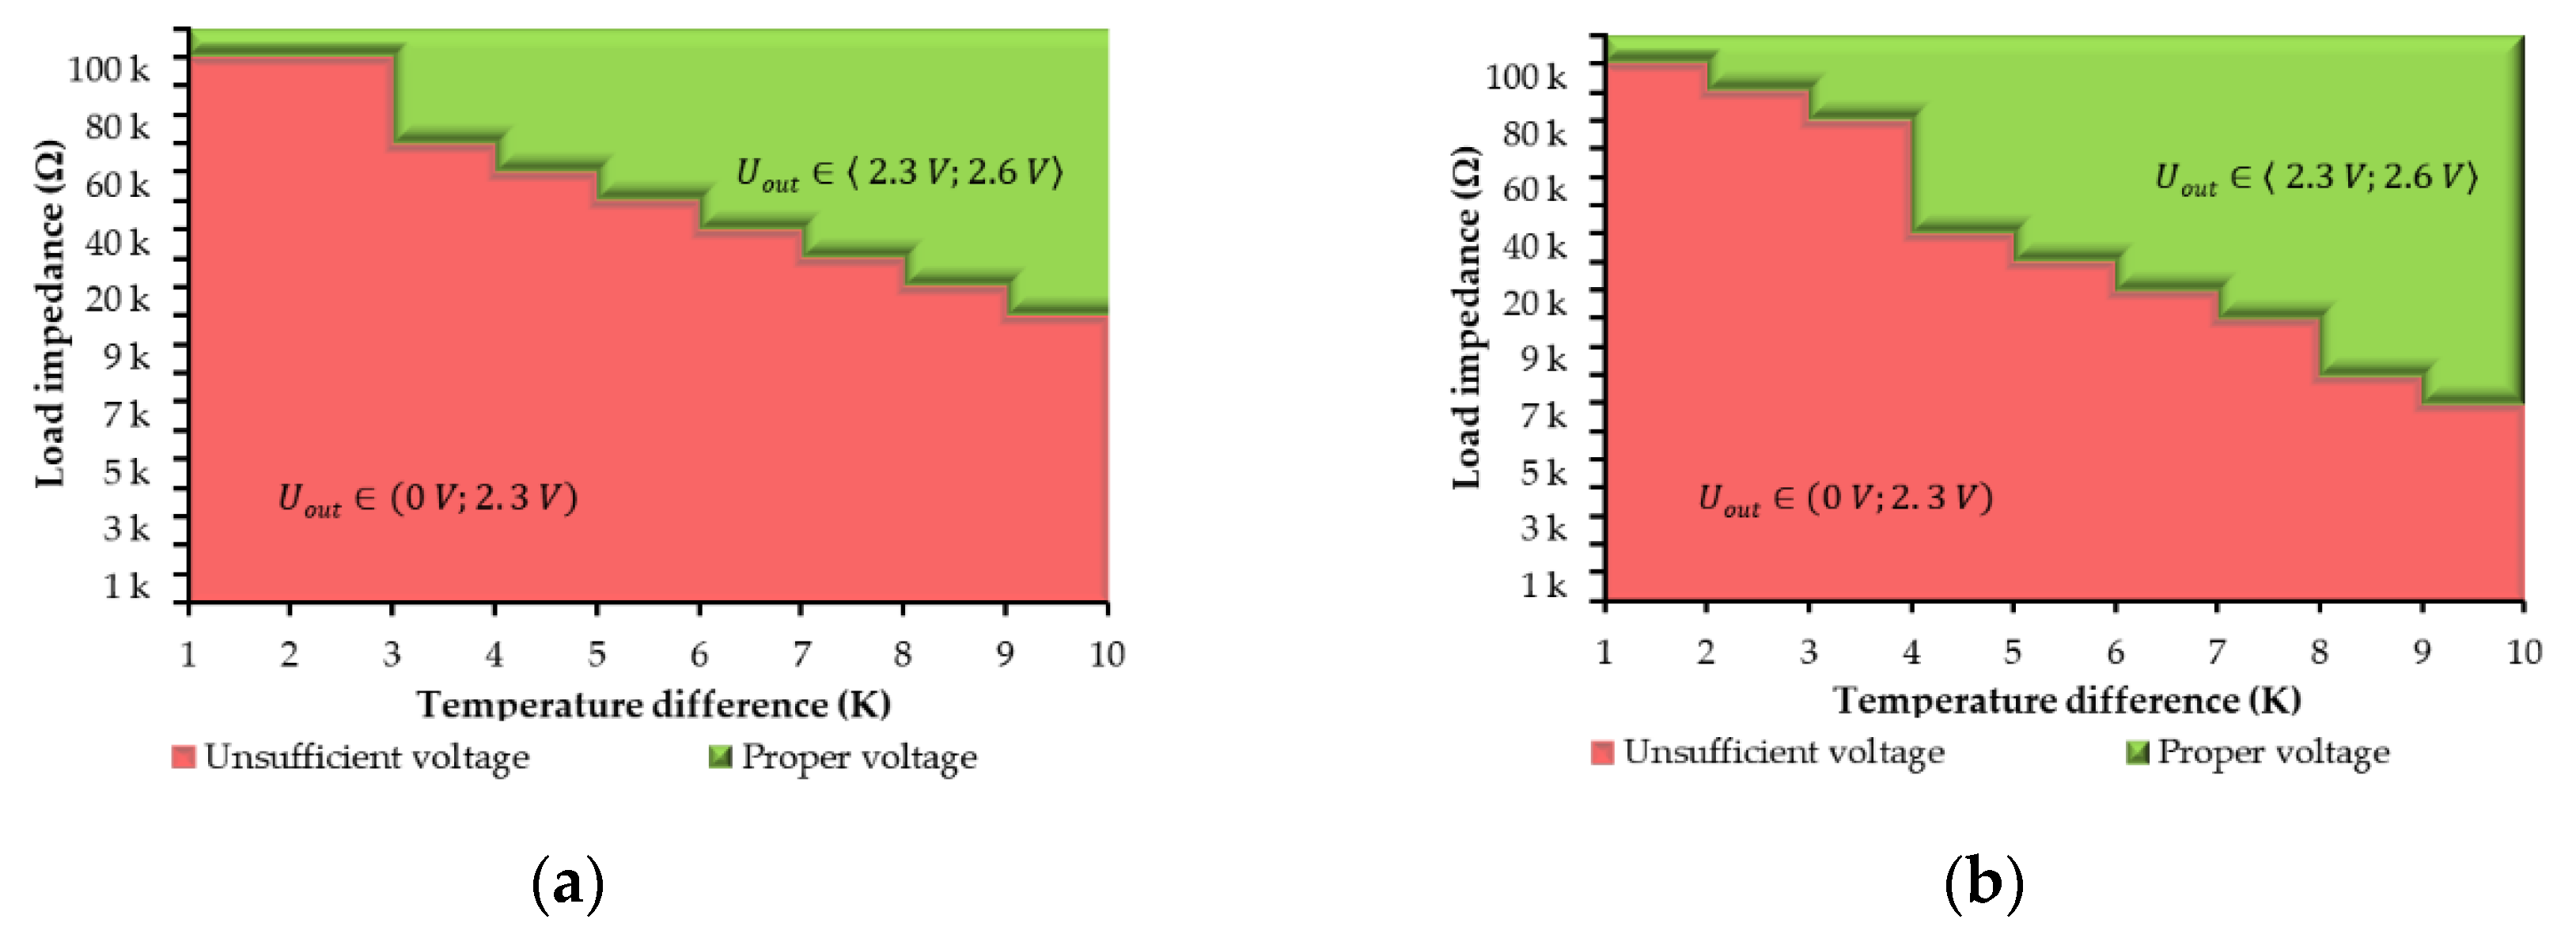
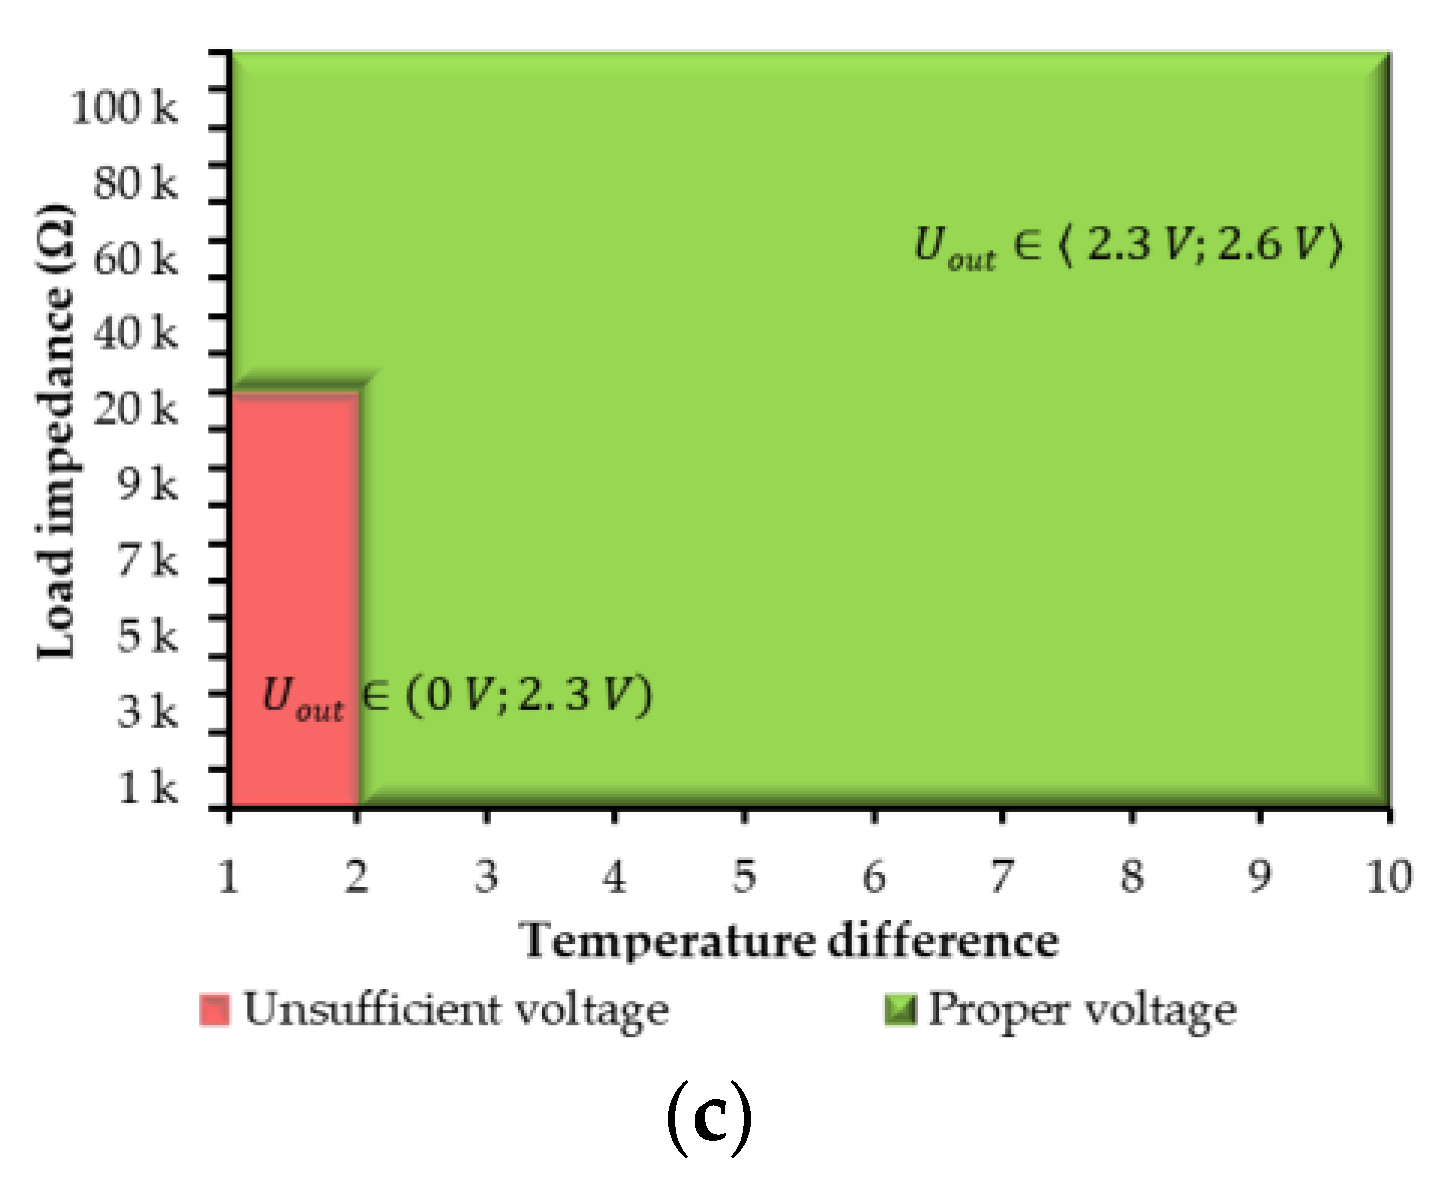
3.7. Optimal Power System Solution Selection
By performing analyses of the designed and measured thermoelectric generators, TEPS5 was chosen as the most optimal one, mainly due to the usable working power already generated for the 4 K temperature difference. Other differences between the TEPS1 to TEPS4 generators were considered to be negligible. The TEPS5 thermoelectric generator showed higher performance, but only in the area of a more significant temperature difference, which was not required in our case. The optimal power system that was developed still did not reach the required generated power and operating area, even at a temperature difference of 2 K. For the reasons described above, the LTC 3108 converter used was replaced by electronic circuits guaranteeing a possible higher energy performance. Thus, it was decided to analyze and test a drive based on a combination of EM8900 and EM8502 chips (EM8900 is a self-oscillating oscillator, EM8502 is a stabilizer and power management circuit). In addition to the variant analyzed using a 470 µF capacitor, which provided a stable power supply, a supercapacitor with an even higher value of 1 F was connected. It turned out that such a large capacity perfectly supported the work of distributing the operating state of the water meter in short-term moments, when the energy consumption was highest. In order to efficiently charge the 1 F capacity at rest (when the MCU is not running), even at small temperature gradients, the method of series connection of two thermoelectric generators, namely TEPS4, was chosen.
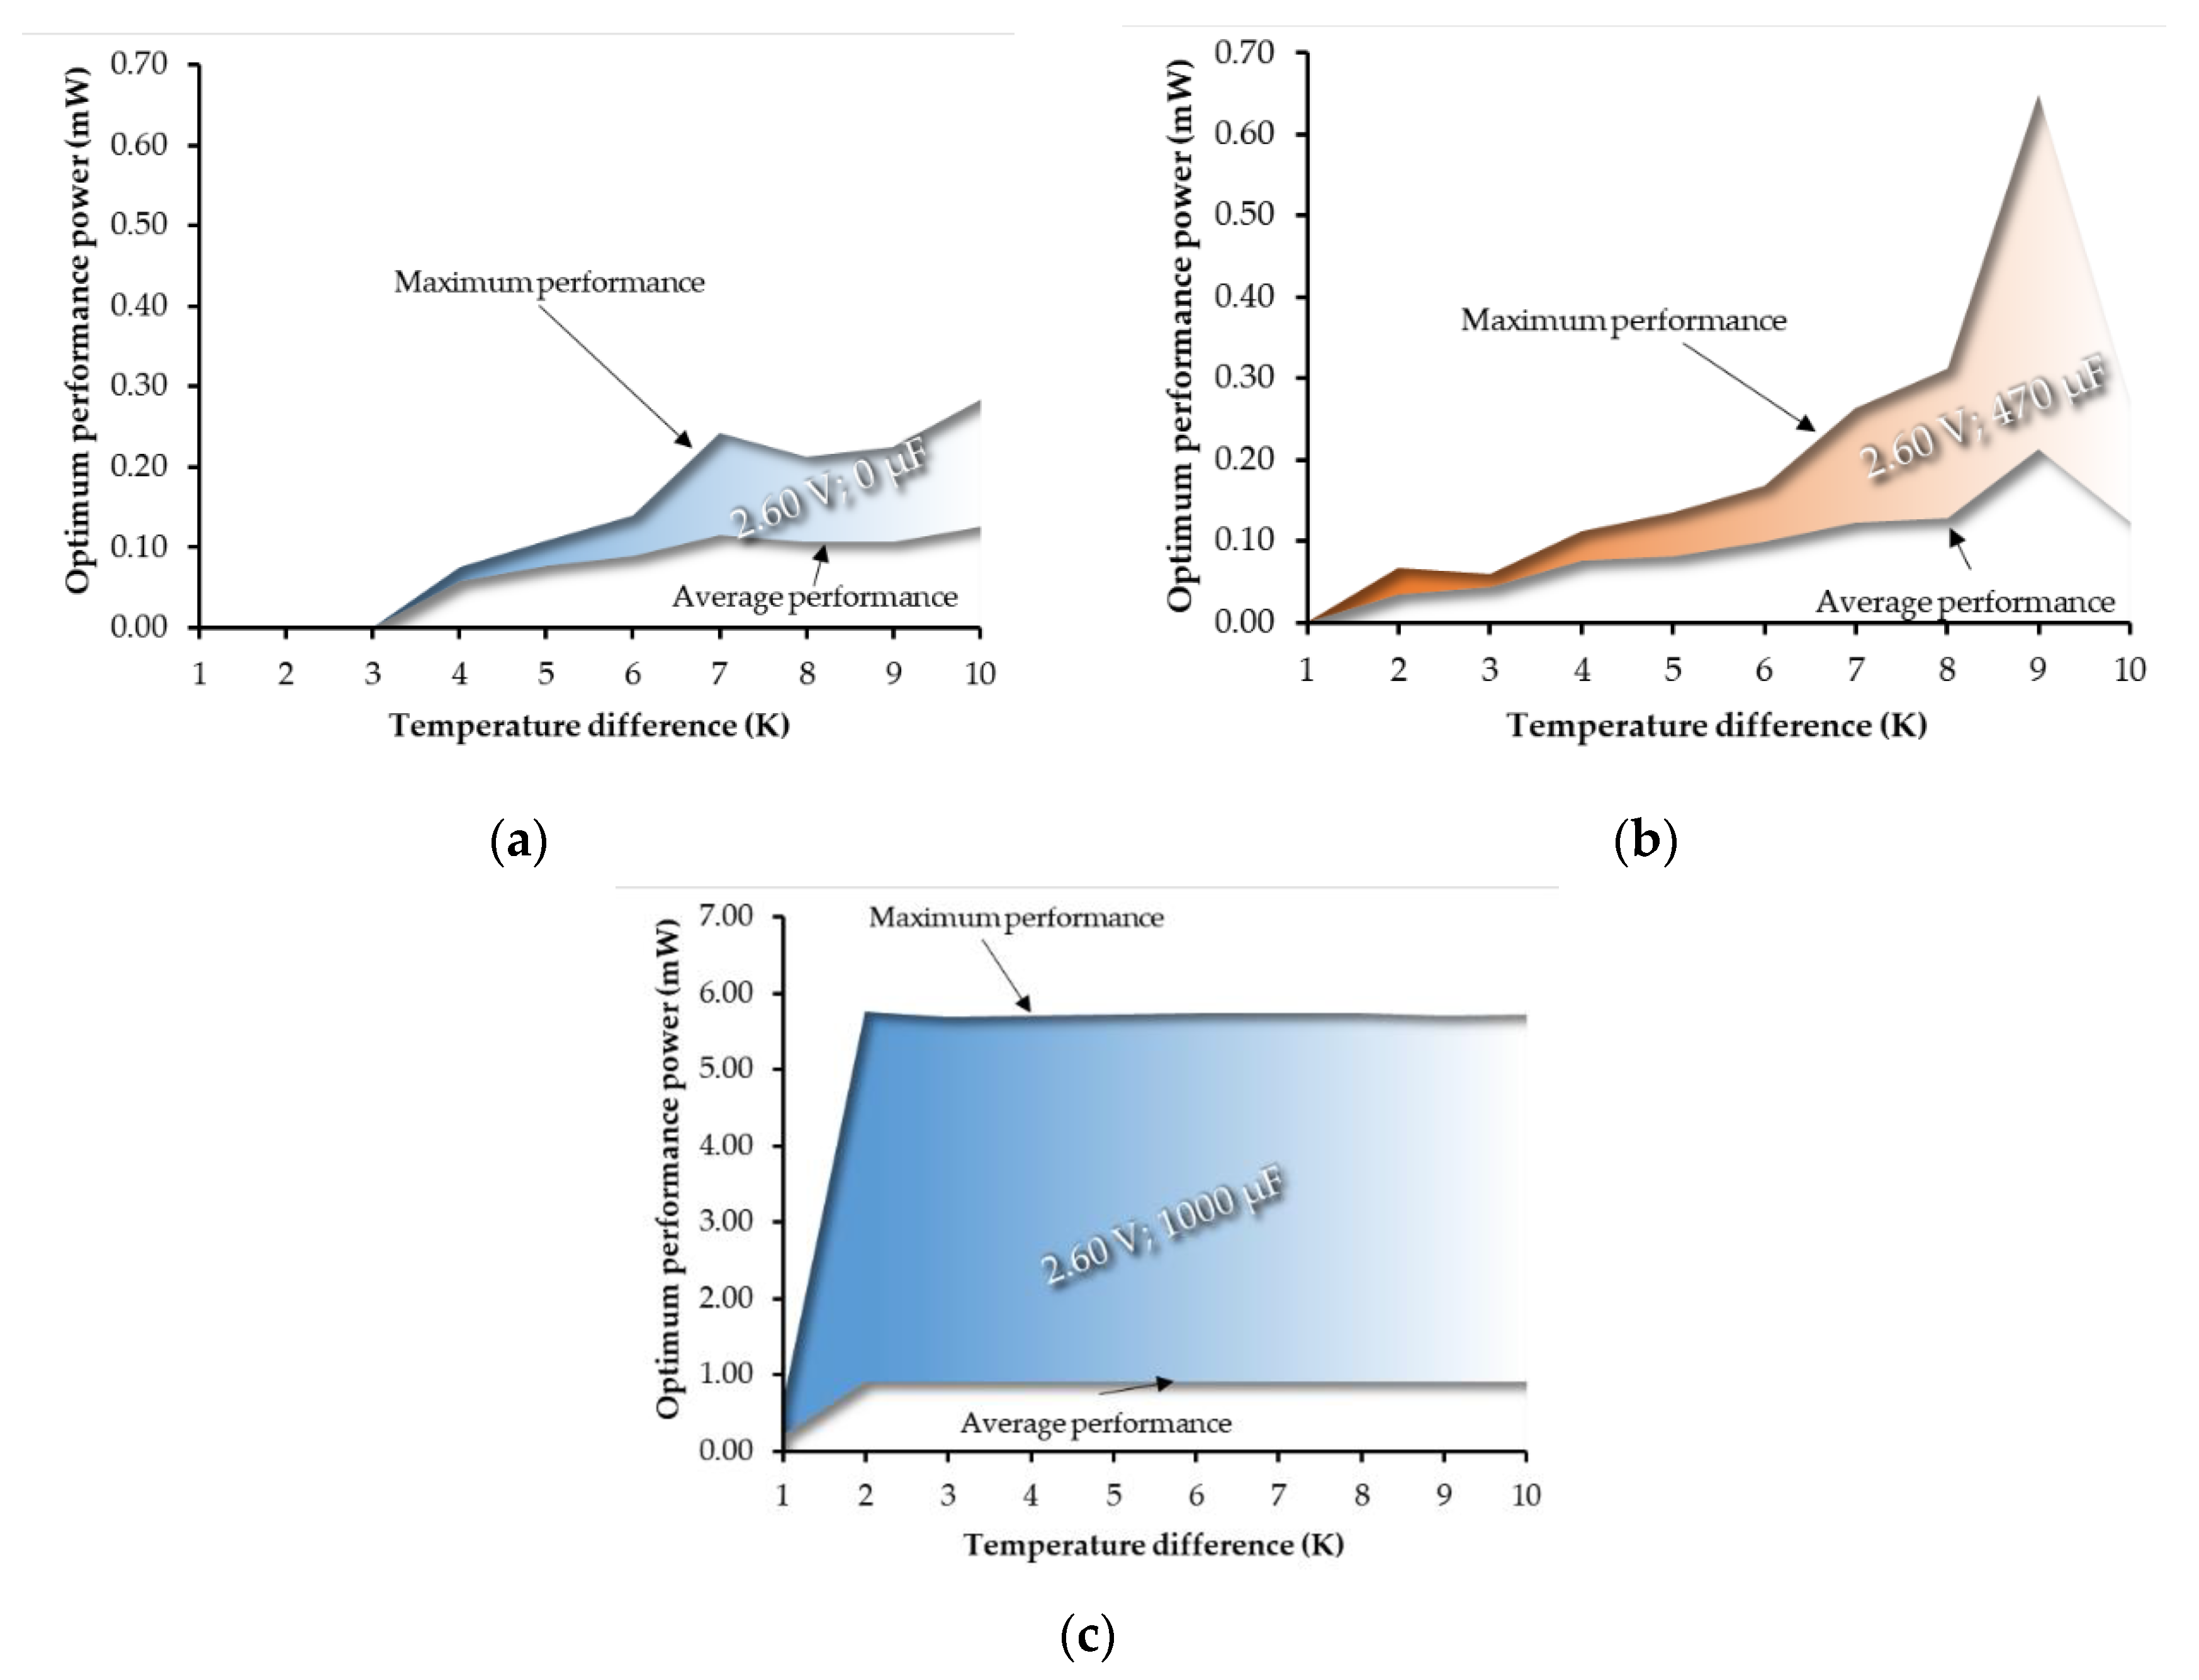
Using the selected optimal variant in which the EM8900 and EM8504 were combined, it was found that energy generating was stable. At a storage capacity of 0 F, the operating area is above 20 kΩ and above 9 K (
Figure 23a and
Figure 24a), at a storage capacity of 470 µF, the operating area starts above 6 K (
Figure 23b and
Figure 24b). From the following graphs (
Figure 23c and
Figure 24c), it can be seen that with a storage capacity of 1 F, applied for a load more than 30 kΩ, constant power is supplied to the system at 2 K temperature gradient.
4. Discussion
The final solution of this study was based on professional knowledge and practical experience in the areas of energy harvesting, electronics, and embedded control systems. This knowledge was used in the field of water consumption metering, where the possibility of a battery-free power supply for the electronics of a modern water flow consumption meter was investigated. In the first part of the study, the individual thermoelectric generators were analyzed, specifically their ability to supply energy in conjunction with a specific DC/DC converter, LTC3108, used in a practical application. This DC/DC converter contains a self-oscillating converter with a transformer, which enables generating the output power from an input voltage level of 20 mV. During the study, the minimum possible output voltage level of 2.35 V was analyzed. It served primarily to supply other electronic components from the mentioned DC/DC converter. The level could be adjusted using the internal control element. Such a low regulated voltage value was chosen on the basis of possible energy savings. The result proved the unsuitability of this setting due to the course of the output voltage, which very often took on an oscillating character. For real operation, such a source of electrical energy is unusable, because the selected microcontroller and other added electronics need a ripple supply voltage.
In this study, we further focused on the use of a higher output voltage of 3.3 V at the output of the DC/DC converter, where the control transformer was fully open, and the output voltage was stabilized without pulse fluctuations. The performed analysis of the measurements showed the influence of the storage capacitor, which in several cases shifted the working range of the used DC/DC converter even for a lower temperature gradient. From the measured and analyzed data, it was found that for a water consumption meter application, there was sufficient and stable energy obtained by energy harvesting at the output of the DC/DC converter at a temperature difference of at least 6 K. In the case of possibly using the developed consumption meter without a battery, the application of a heating system requires a temperature difference of at least 3 K for stable energy generating. There were no thermoelectric cells that were measured and analyzed that met this requirement. Obviously, with lower energy requirements, it would be possible to use this initially proposed solution.
The study results have shown the existence of a specific area where the supplied energy enters the saddle, which, according to the course, is caused by the setting of the operating point of the oscillator. The saddle can be observed especially in some of the presented dependences of the maximum generated power on the temperature difference. This saddle can be appropriately displaced by changing the impedances and couplings, which has not been further studied in detail in this study and is an issue for future studies on the real limits of the LTC3108 DC/DC converter. Furthermore, in this study, we focused on finding a solution that would allow a sufficient power supply for electronics and MCUs, even in the case of minimal temperature differences below 3 K. For the above reasons, a new solution concept was sought, in which the DC/DC converter EM8900 was chosen. It is a self-oscillating converter which is supplemented by a power management circuit EM8504. The power management circuit solves the voltage stabilization because the EM8900 itself is not able to perform it. The EM8900 DC/DC converter enables generating the output energy from an input minimum voltage level of 4 mV, which was the main reason for the choice for this specific application. The EM8504 power management circuit enables operating with a battery, where, in the case of our study, it was replaced by a storage electrolytic capacitor with a value of 470 µF and another one with a value of 1 F. The variant with these capacitors and also the variant without a capacitor were analyzed.
The proposed solution was subject to the assumption that, especially after the connection of the 1 F capacitor, a problem with a too long charging time occurs. Especially for this reason, the solution of a series connection of thermoelectric cells was approached so that the capacitor could be charged even at smaller temperature differences. The performed analyses confirmed this assumption to be correct, in which, at the same temperature gradient between the sides of thermoelectric generators connected in series, twice the input voltage was obtained. To verify this hypothesis, a previously evaluated thermoelectric cell, called TEPS4, was selected, which also had suitable small dimensions. This circuit set-up was able to generate the required stable energy, even at a temperature difference of 2 K with a storage capacitor connection of 1 F. Other variants with a storage capacitor of 470 µF or without a capacitor did not generate energy at such a low temperature difference, with an LTC3108 converter. In addition, the solution did not have a transient operating state with generating impulse energy. The proposed solution of the water consumption meter without a battery power was fully functional in the case of repeated measurements of eight times per second, which was quite sufficient in the measurement dynamics. The average consumption of the designed device was 116 µW for the supply of 2.60 V, and 138 µW for the supply of 3.30 V. The above graphs show that the supplied power exceeds units of mW, allowing for the storage and surplus energy required to power the electronics.
5. Conclusions
In this study, we aimed at analyzing Peltier cells such as thermoelectric Peltier cooler modules (TEC), thermoelectric micro-Peltier cooler modules (TES), and thermoelectric Seebeck generator modules (TEG), and we focused mainly on the possibility of using them in applications where an unusually small temperature difference for energy generation occurs. First, an analysis of the dependence of stress generation on temperature difference and load was performed. The analyses of five thermoelectric generators with a storage electrolytic capacitor of 470 µF, and without it, revealed that, on the one hand, when setting the DC/DC converter LTC3108 at an output voltage value of 2.35 V, stable voltage was not achieved, but only pulse voltage was achieved. On the other hand, thermoelectric generators achieved satisfactory results and generated voltage stability when the DC/DC converter was set at an output voltage value of 3.30 V and a temperature difference of 3 K, or 4 K for a 100 kΩ load. The best functional thermocouple, namely TEPS5, achieved voltage stability for individual temperature differences with the lowest possible load as compared with other investigated thermocouples. This analysis was followed by an evaluation of thermoelectric cells from the point of view of the obtained power for individual temperature differences, where the results for the thermocouple, namely TEPS5, again dominated, especially in the area of a difference higher than 8 K. After the analyses of the types of thermoelectric generators, TEPS5 was selected and another solution was proposed with a DC/DC converter consisting of integrated circuits EM8900, EM8504, and series-connected thermocouples TEPS5, without a storage electrolytic capacitor and with a capacity of 470 µF and 1 F. From the analysis performed in this way, supported by graphs and testing, it was clear that the designed and implemented energy harvesting solution with thermocouples and other electronics was able to fully power the low-power water meter application at a temperature difference of about 2 K without using battery power. Finally, installation of a water meter and a temperature generator is possible, provided that it is located between the supply and drainpipes in a heating system, where a minimum temperature difference of 2 K is guaranteed. Furthermore, it is possible to place an energy generator between hot and cold water supplies where the temperature difference is significantly higher than 2 K. These examples clearly define the applicability of the researched solution in practice.
Author Contributions
Concept of the research, Z.M. (Zdenek Machacek), V.S. and Z.M. (Zdenek Masny); methodology, V.S., W.W. and M.S.; software, R.P.; validation: V.S., M.S., W.W., and Z.M. (Zdenek Machacek); visualization, M.S., A.I., R.P. and W.W.; investigation, Z.M. (Zdenek Machacek), Z.S., V.S. and R.P.; resources, Z.M. (Zdenek Machacek); data curation, V.S. and Z.S.; writing—original draft preparation, W.W., Z.M. (Zdenek Machacek), Z.S. and M.S.; supervision, Z.M. (Zdenek Machacek) and W.W.; project administration, Z.M. (Zdenek Masny) and J.K.; funding acquisition, Z.M. (Zdenek Machacek) and J.K.; writing—review and editing, W.W. and A.I.; conceived and designed the experiments, Z.M. (Zdenek Machacek) and V.S.; V.S. performed the experiments; W.W., M.S. and R.P. analyzed the data; V.S., M.S. and Z.M. (Zdenek Masny) contributed reagents/materials/analysis tools; W.W., Z.M. (Zdenek Machacek) and V.S. wrote the paper. All authors have read and agreed to the published version of the manuscript.
Funding
This work received funding from the European Union’s Horizon 2020 research and innovation programme under grant agreement no. 856670; the developing was funded by the project CZ.01.1.02/0.0/0.0/15_019/0004955 “Energy Harvesting from environment free of Battery Supply to Measuring energy consumption in the SMART Grid Network” of the Operational Program of Business and Innovation for Competitiveness; the research was supported by project WZ/WE-IA/2/2020 of the Bialystok University of Technology and financed from a subsidy provided by the Ministry of Science and Higher Education.
Institutional Review Board Statement
Not applicable.
Informed Consent Statement
Not applicable.
Data Availability Statement
Not applicable.
Conflicts of Interest
The authors declare no conflict of interest.
References
- Charris, D.; Gomez, D.; Ortega, A.R.; Carmona, M.; Pardo, M. A Thermoelectric Energy Harvesting Scheme with Passive Cooling for Outdoor IoT Sensors. Energies 2020, 13, 2782. [Google Scholar] [CrossRef]
- Guan, M.; Wang, K.; Xu, D.; Liao, W.H. Design and experimental investigation of a low-voltage thermoelectric energy harvesting system for wireless sensor nodes. Energy Convers. Manag. 2017, 138, 30–37. [Google Scholar] [CrossRef]
- Gao, M.; Su, C.; Cong, J.; Yang, F.; Wang, Y.; Wang, P. Harvesting thermoelectric energy from railway track. Energy 2019, 180, 315–329. [Google Scholar] [CrossRef]
- Elefsiniotis, A.; Kokorakis, N.; Becker, T.; Schmid, U. A thermoelectric-based energy harvesting module with extended operational temperature range for powering autonomous wireless sensor nodes in aircraft. Sens. Actuators A Phys. 2014, 206, 159–164. [Google Scholar] [CrossRef]
- Hyland, M.; Hunter, H.; Liu, J.; Veety, E.; Vashaee, D. Wearable thermoelectric generators for human body heat harvesting. Appl. Energy 2016, 182, 518–524. [Google Scholar] [CrossRef]
- Jouhara, H.; Khordehgah, N.; Almahmoud, S.; Delpech, B.; Chauhan, A.; Tassou, S.A. Waste heat recovery technologies and applications. Therm. Sci. Eng. Prog. 2018, 6, 268–289. [Google Scholar] [CrossRef]
- Jouhara, H.; Żabnieńska-Góra, A.; Khordehgah, N.; Doraghi, Q.; Ahmad, L.; Norman, L.; Axcell, B.; Wrobel, L.; Dai, S. Thermoelectric generator (TEG) technologies and applications. Int. J. Thermofluids 2021, 9, 100063. [Google Scholar] [CrossRef]
- Chen, J.; Li, K.; Liu, C.; Li, M.; Lv, Y.; Jia, L.; Jiang, S. Enhanced efficiency of thermoelectric generator by optimizing mechanical and electrical structures. Energies 2017, 10, 1329. [Google Scholar] [CrossRef]
- Zoui, M.A.; Bentouba, S.; Stocholm, J.G.; Bourouis, M. A review on thermoelectric generators: Progress and applications. Energies 2020, 13, 3606. [Google Scholar] [CrossRef]
- Campbell, B.; Ghena, B.; Dutta, P. Energy-Harvesting Thermoelectric Sensing for Unobtrusive Water and Appliance Metering. In Proceedings of the 2nd International Workshop on Energy Neutral Sensing Systems; Association for Computing Machinery: New York, NY, USA, 2014. [Google Scholar] [CrossRef]
- Gould, C.A. Thermoelectric water meter energy harvesting. In Journal of Physics: Conference Series; IOP Publishing: Bristol, UK, 2020; p. 12010. [Google Scholar] [CrossRef]
- Hájovský, R.; Pieš, M.; Richtár, L. Analysis of the appropriateness of the use of Peltier cells as energy sources. Sensors 2016, 16, 760. [Google Scholar] [CrossRef] [PubMed]
- MSP430FR604x(1), MSP430FR603x(1) Ultrasonic Sensing MSP430TM Microcontrollers for Water-Metering Applications; Texas Instruments: Dallas, TX, USA, 2020.
- Machacek, Z.; Sotola, V.; Petras, R.; Schneider, M.; Masny, Z.; Idzkowski, A.; Walendziuk, W. Advanced Energy Harvesting from Heating for a Water Consumption Meter. Proceedings 2020, 51, 21. [Google Scholar] [CrossRef]
- Machacek, Z.; Slaby, R.; Hercik, R.; Koziorek, J. Advanced system for consumption meters with recognition of video camera signal. Elektron. Elektrotechnika 2012, 18, 57–60. [Google Scholar] [CrossRef][Green Version]
- Goldsmid, H.J.; Goldsmid, H.J. The Seebeck and Peltier effects. In The Physics of Thermoelectric Energy Conversion; IOP Publishing: Bristol, UK, 2017. [Google Scholar]
- Kalantar-Zadeh, K. Sensors: An Introductory Course; Springer Science + Business Media: New York, NY, USA, 2013; Volume 9781461450, ISBN 9781461450528. [Google Scholar]
- Fraden, J. Handbook of Modern Sensors; Springer: New York, NY, USA, 2010; ISBN 9781441964656. [Google Scholar]
- Terasaki, I. Thermal Conductivity and Thermoelectric Power of Semiconductors. In Reference Module in Materials Science and Materials Engineering; Elsevier: Amsterdam, The Netherlands, 2016. [Google Scholar]
- Tritt, T.M. Thermoelectric Materials: Principles, Structure, Properties, and Applications. In Encyclopedia of Materials: Science and Technology; Elsevier: Amsterdam, The Netherlands, 2002; pp. 1–11. [Google Scholar]
- Thermoelectric Materials and Devices; Elsevier: Amsterdam, The Netherlands, 2015; Volume 2015-Janua, ISBN 10:178262323X.
- Uchida, K.I.; Murata, M.; Miura, A.; Iguchi, R. Observation of the Magneto-Thomson Effect. Phys. Rev. Lett. 2020, 125, 106601. [Google Scholar] [CrossRef] [PubMed]
- Van Putten, A.F. Electronic Measurement Systems. Theory and Practice, 2nd ed.; CRC Press, Taylor & Francis Group: Boca Raton, FL, USA, 1998; Volume 9, ISBN 978-0750303408. [Google Scholar]
- Nesarajah, M.; Frey, G. Thermoelectric power generation: Peltier element versus thermoelectric generator. In Proceedings of the IECON Proceedings (Industrial Electronics Conference), Florence, Italy, 23–26 October 2016; pp. 4252–4257. [Google Scholar]
- EM Microelectronic-Marin SA EM8900—UltraLow Voltage DC-DC Boost Converter for Thermal Electrical Generators. Available online: www.emmicroelectronic.com (accessed on 22 August 2020).
- EM Microelectronic-Marin SA EM8502—Power Management Controller with Multi-Cell Solar Harvesting. Available online: www.emmicroelectronic.com (accessed on 22 August 2020).
- Analog Devices LTC3108 (Rev. D)—Ultralow Voltage Step-Up Converter and Power Manager. Available online: www.analog.com (accessed on 22 August 2020).
Figure 1.
A functional diagram presenting components of the water consumption meter.
Figure 1.
A functional diagram presenting components of the water consumption meter.
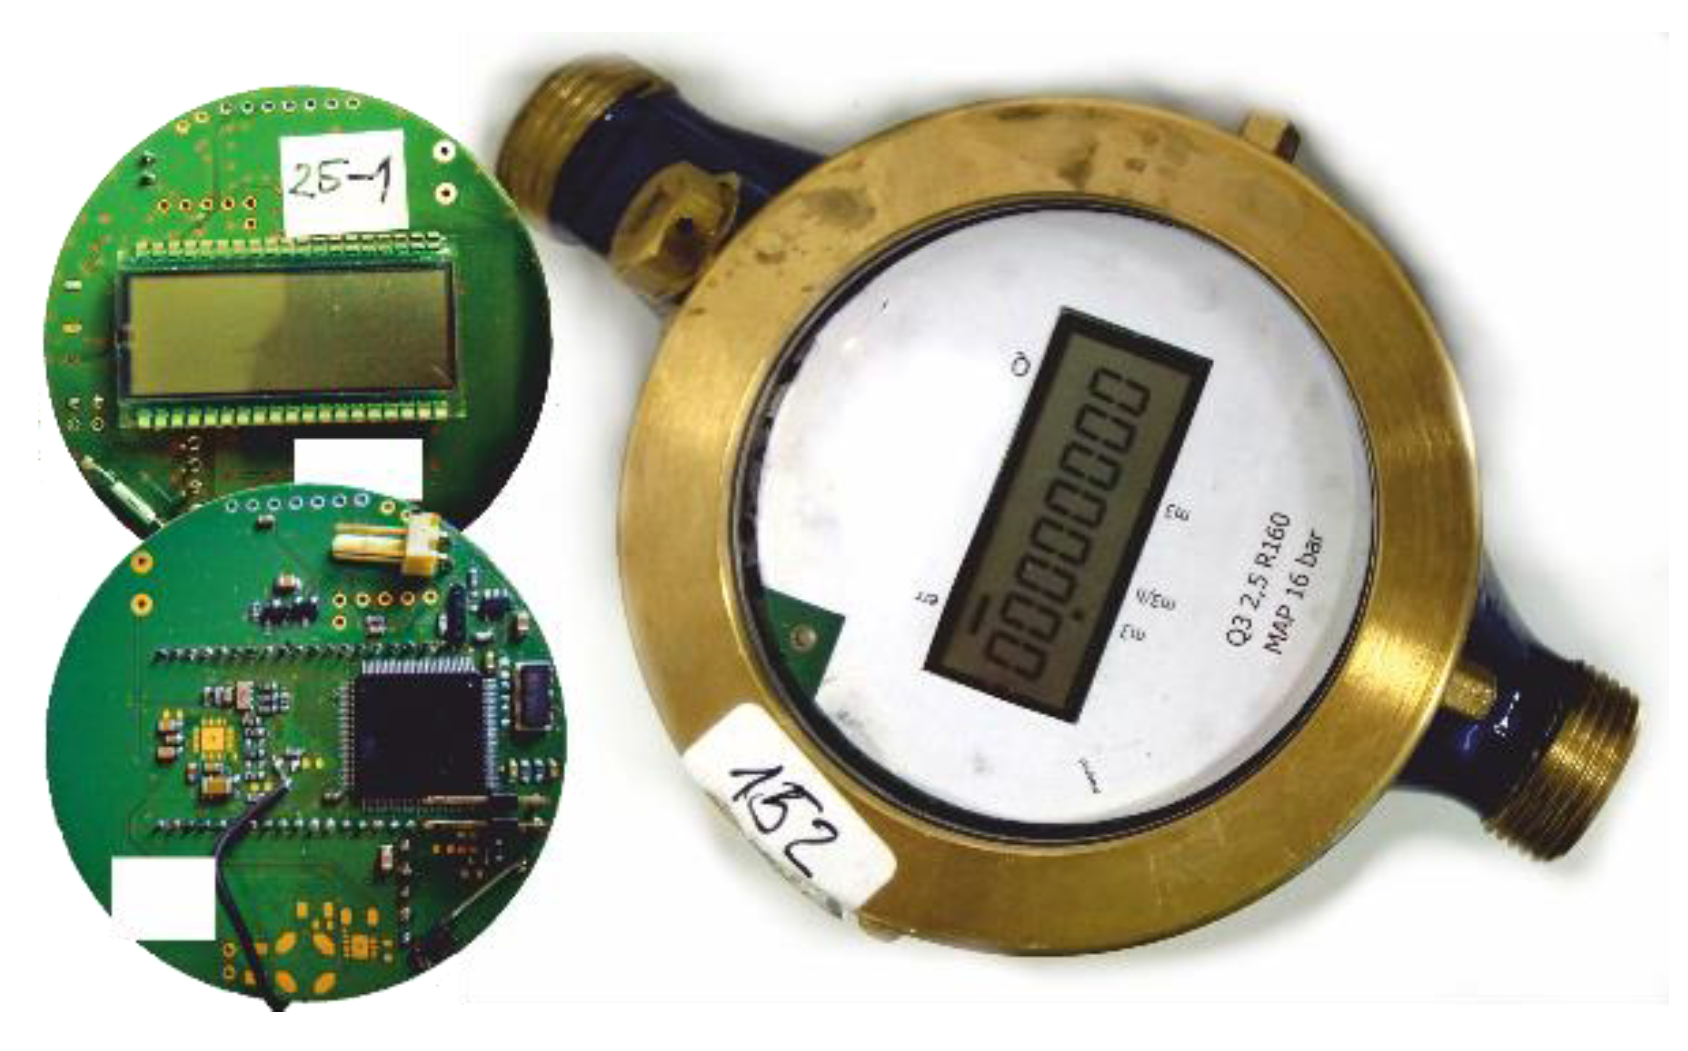
Figure 2.
A view of the electronic systems of the water consumption meter and its test version in a brass case.
Figure 2.
A view of the electronic systems of the water consumption meter and its test version in a brass case.
Figure 3.
Thermoelectric generator couple used in the TEC and TEG cells.
Figure 3.
Thermoelectric generator couple used in the TEC and TEG cells.
Figure 4.
Connection diagram of the test stand components used in the thermoelectric cell study.
Figure 4.
Connection diagram of the test stand components used in the thermoelectric cell study.
Figure 5.
General view of the test stand applied for the study measurements.
Figure 5.
General view of the test stand applied for the study measurements.
Figure 6.
Diagram illustrating the procedure for laboratory testing of the power systems equipped with thermoelectric cells and DC/DC converters.
Figure 6.
Diagram illustrating the procedure for laboratory testing of the power systems equipped with thermoelectric cells and DC/DC converters.
Figure 7.
Results of the thermoelectric generator TEG-127020 with a 2.35 V DC/DC converter configuration: (a) Without a storage capacitor; (b) with a storage capacitor of 470 μF.
Figure 7.
Results of the thermoelectric generator TEG-127020 with a 2.35 V DC/DC converter configuration: (a) Without a storage capacitor; (b) with a storage capacitor of 470 μF.
Figure 8.
Results of the thermoelectric generator TEG-127020 with a 3.30 V DC/DC converter configuration: (a) Without a storage capacitor; (b) with a storage capacitor of 470 μF.
Figure 8.
Results of the thermoelectric generator TEG-127020 with a 3.30 V DC/DC converter configuration: (a) Without a storage capacitor; (b) with a storage capacitor of 470 μF.
Figure 9.
Thermoelectric generator TEG-127009 with a 2.35 V converter configuration: (a) Without a storage capacitor; (b) with a storage capacitor of 470 μF.
Figure 9.
Thermoelectric generator TEG-127009 with a 2.35 V converter configuration: (a) Without a storage capacitor; (b) with a storage capacitor of 470 μF.
Figure 10.
Thermoelectric generator TEG-127009 with a 3.30 V converter configuration: (a) Without a storage capacitor; (b) with a storage capacitor of 470 μF.
Figure 10.
Thermoelectric generator TEG-127009 with a 3.30 V converter configuration: (a) Without a storage capacitor; (b) with a storage capacitor of 470 μF.
Figure 11.
Thermoelectric generator TES1-12703 with a 2.35 V converter configuration: (a) Without a storage capacitor; (b) with a storage capacitor of 470 μF.
Figure 11.
Thermoelectric generator TES1-12703 with a 2.35 V converter configuration: (a) Without a storage capacitor; (b) with a storage capacitor of 470 μF.
Figure 12.
Thermoelectric generator TES1-12703 with a 3.30 V converter configuration: (a) Without a storage capacitor; (b) with a storage capacitor of 470 μF.
Figure 12.
Thermoelectric generator TES1-12703 with a 3.30 V converter configuration: (a) Without a storage capacitor; (b) with a storage capacitor of 470 μF.
Figure 13.
Thermoelectric generator TES1-12704 with a 2.35 V converter configuration: (a) Without a storage capacitor; (b) with a storage capacitor of 470 μF.
Figure 13.
Thermoelectric generator TES1-12704 with a 2.35 V converter configuration: (a) Without a storage capacitor; (b) with a storage capacitor of 470 μF.
Figure 14.
Thermoelectric generator TES1-12704 with a 3.30 V converter configuration: (a) Without a storage capacitor; (b) with a storage capacitor of 470 μF.
Figure 14.
Thermoelectric generator TES1-12704 with a 3.30 V converter configuration: (a) Without a storage capacitor; (b) with a storage capacitor of 470 μF.
Figure 15.
Thermoelectric generator TEC1-127060 with a 2.35 V converter configuration: (a) Without a storage capacitor; (b) with a storage capacitor of 470 μF.
Figure 15.
Thermoelectric generator TEC1-127060 with a 2.35 V converter configuration: (a) Without a storage capacitor; (b) with a storage capacitor of 470 μF.
Figure 16.
Thermoelectric generator TEC1-127060 with a 3.30 V converter configuration: (a) Without a storage capacitor; (b) with a storage capacitor of 470 μF.
Figure 16.
Thermoelectric generator TEC1-127060 with a 3.30 V converter configuration: (a) Without a storage capacitor; (b) with a storage capacitor of 470 μF.
Figure 17.
Minimal power generation by thermoelectric generators with the 2.35 V converter configuration.
Figure 17.
Minimal power generation by thermoelectric generators with the 2.35 V converter configuration.
Figure 18.
Average power generation by thermoelectric generators with the 2.35 V converter configuration.
Figure 18.
Average power generation by thermoelectric generators with the 2.35 V converter configuration.
Figure 19.
Maximal power generation by thermoelectric generators with the 2.35 V converter configuration.
Figure 19.
Maximal power generation by thermoelectric generators with the 2.35 V converter configuration.
Figure 20.
Minimal power generation by thermoelectric generators with the 3.30 V converter configuration.
Figure 20.
Minimal power generation by thermoelectric generators with the 3.30 V converter configuration.
Figure 21.
Average power generation by thermoelectric generators with the 3.30 V converter configuration.
Figure 21.
Average power generation by thermoelectric generators with the 3.30 V converter configuration.
Figure 22.
Maximal power generation by thermoelectric generators with the 3.30 V converter configuration.
Figure 22.
Maximal power generation by thermoelectric generators with the 3.30 V converter configuration.
Figure 23.
Achieved results for the thermoelectric generator 2x TEPS5 equipped with the DC/DC circuit (EM8900 and EM8504) with 2.60 V supply configuration: (a) without a storage capacitor; (b) with a storage capacitor of 470 μF and (c) with a storage capacitor of 1000 μF.
Figure 23.
Achieved results for the thermoelectric generator 2x TEPS5 equipped with the DC/DC circuit (EM8900 and EM8504) with 2.60 V supply configuration: (a) without a storage capacitor; (b) with a storage capacitor of 470 μF and (c) with a storage capacitor of 1000 μF.
Figure 24.
Optimum performance power generation by thermoelectric generators 2x TEPS5 for the DC/DC supply circuit built on the EM8900 and the EM8504 modules for configurations: (a) without a storage capacitor; (b) with a storage capacitor of 470 μF and (c) with a storage capacitor of 1000 μF.
Figure 24.
Optimum performance power generation by thermoelectric generators 2x TEPS5 for the DC/DC supply circuit built on the EM8900 and the EM8504 modules for configurations: (a) without a storage capacitor; (b) with a storage capacitor of 470 μF and (c) with a storage capacitor of 1000 μF.
Table 1.
Energy consumption depending on the supply voltage within a time interval of 10 ms in the operating mode.
Table 1.
Energy consumption depending on the supply voltage within a time interval of 10 ms in the operating mode.
| Voltage Supply Value (V) | Average Current Value (µA) | Average Power Consumption (µW) |
|---|
| 2.35 | 449 | 988 |
| 2.60 | 552 | 1435 |
| 3.30 | 518 | 1711 |
Table 2.
The TEG cells used in the energy harvesting study for cold side temperature 30 °C (303.15 K) and hot side temperature 200 °C (473.15 K).
Table 2.
The TEG cells used in the energy harvesting study for cold side temperature 30 °C (303.15 K) and hot side temperature 200 °C (473.15 K).
| Name | Voc
(V) | Vload
(V) | Iload
(A) | Rin
(Ω) | Rload
(Ω) | Wload
(W) | Size
(mm) | Thermoelectric Cell Symbol |
|---|
| TEG-127020 | 8.54 | 4.27 | 2 | 2.1 | 2.1 | 8.5 | 40 × 44 × 3.3 | TEPS1 |
| TEG-127009 | 8.54 | 4.27 | 0.92 | 4.6 | 4.6 | 3.9 | 30 × 30 × 3.2 | TEPS2 |
Table 3.
TEC and TES cell parameters and their symbols used in the study.
Table 3.
TEC and TES cell parameters and their symbols used in the study.
| Name | Imax
(A) | Omax
(W) | Vmax
(V) | ΔTmax
(K) | Size
(mm) | Thermoelectric Cell Symbol |
|---|
| TES1-12703 | 3.5 | 27 | 15.4 | 68 | 30 × 30 × 3.3 | TEPS3 |
| TES1-12704 | 3.3 | 37 | 16.1 | 75 | 30 × 30 × 3.3 | TEPS4 |
| TES1-127060 | 6 | 55 | 16.4 | 75 | 40 × 40 × 3.6 | TEPS5 |
Table 4.
DC/DC converters used in the energy harvesting experiments.
Table 4.
DC/DC converters used in the energy harvesting experiments.
| DC-DC Converter | Voltage Output Value | Converter Symbol |
|---|
| EM 8900 [25] + EM 8502 [26] | 2.60 V | DC/DC1 |
| LTC 3108 [27] | 2.35 V | DC/DC2 |
| LTC 3108 [27] | 3.30 V | DC/DC3 |
| Publisher’s Note: MDPI stays neutral with regard to jurisdictional claims in published maps and institutional affiliations. |
© 2021 by the authors. Licensee MDPI, Basel, Switzerland. This article is an open access article distributed under the terms and conditions of the Creative Commons Attribution (CC BY) license (https://creativecommons.org/licenses/by/4.0/).


 ,
, 


