1. Introduction
Ensuring access to water and sanitation for all through sustainable management of water resources is the sixth of the seventeen goals of the Sustainable Development Agenda [
1], developed by the UN General Assembly in 2015. Climate change, including droughts and floods caused by it, which draw attention to the role of rational resource management, and the growing water demand resulting from the increase in the world population and the continuous industrial development have been identified as the most relevant issues [
2]. By 2050, it is estimated that the world population will reach 9.3 billion, an increase of about 30% compared to the beginning of 2001 [
2]. Unequal access to water resources, resulting inter alia from climate warming and its impact on water quantity, as well as unpredictable temperature rises and increasing frequency of extreme events (e.g., floods and droughts) is becoming an important problem [
3]. It is assumed that 20% of the world’s water scarcity is caused by climate change, including an increase in rainfall in wet areas and a decrease in drought-prone areas. From the perspective of the last half century, it is also evident that the amount of water consumed per person is doubling [
4]. The consequence of these processes could be the emergence of a group of even seven billion people suffering from water scarcity across 60 countries, and in a more optimistic version, this group would include two billion people across 48 countries [
4].
In Poland, there is 1600 m
3 of water per person, while the European average is 4500 m
3. According to the UN, an amount below 1700 m
3 is defined as water stress and threatens to become a deficit [
1]. A similar situation in Europe can also be observed in: Belgium, Czech Republic, Estonia, Cyprus, and Malta. As much as 97% of Poland’s water resources come from rainfall and only 3% of water is supplied from abroad [
5]. The situation is difficult because the annual amount of incoming water in Poland is practically identical to its total consumption [
6]. A characteristic feature of Polish water resources is their uneven distribution. Most of the springs are located in mountainous and upland areas, while a deficit occurs in central and northern areas. This is also due to variability in precipitation levels between years and over the annual cycle [
7]. The decrease in water deposits in recent years is also due to the geographical location and the influence of the temperate climate, which determines the hydrological conditions. It is also the result of a large spatial variation resulting from environmental and natural conditions affecting the hydrological cycle [
8]. Attention also needs to be paid to the regional diversity of water balance elements, which results from the amount of precipitation, terrain water evaporation, as well as surface water and groundwater runoff [
1]. A similar situation also exists in other parts of the world. According to forecasts, during the first thirty years of the 21st century, the amount of water allocated to a single inhabitant in the world will decrease by as much as one-third, while starting from the last 50 years, there will be a gradual doubling of the amount of water consumed in Europe alone due to the increase in the number of inhabitants and the simultaneous decrease in precipitation [
9].
The most vulnerable agricultural region in Poland is the Polish Lowlands, i.e., the areas of Greater Poland, Kujawy, and Lower Silesia. More severe droughts, not enough humidity, and very high sun exposure are a great threat [
10]. This results in poor crop yields and a high fire risk. One of the programmes created to prevent this is the programme for the development of retention in Poland [
11]. In 2019, the objectives for the Programme for Counteracting Water Scarcity for 2021–2027 with an Outlook to 2030 developed by the Ministry of Maritime Affairs and Inland Navigation [
12] were created. The overall objective of this Programme is to improve the water retention in Poland and the condition of groundwater and water reserves. It aims to plan the use of water reserves in Poland and to manage an efficient transfer of water resources from places where there is an excess to areas with shortages [
12]. In addition to the programme, objectives are being created for a “green-blue infrastructure” [
13], concerning rainwater and snowmelt management on a small scale, i.e., in housing estates, neighbourhoods, and cities. They are a part of the so-called “small retention” [
14], which is a problematic issue in terms of terrain and finance [
15].
Therefore, it can be concluded that water resources management in Poland [
1,
3,
4,
5,
8] focuses mainly on the availability of water resources and geographic conditions, and pays less attention to quality aspects of supplied water. Considering the above, systematic studies on selected quality parameters of tap water are important from the point of view of filling this research gap and possible changes in the strategy of water supply companies in Poland towards ensuring consumers’ satisfaction with the quality of tap water supplied.
The structure of the rest of the article begins with a literature review, which presents various water resource management activities and discusses water quality studies conducted in different countries and formulates the research hypothesis. The following section presents the methodology of the study, its results, together with a discussion and a model for assessing the parameters of tap water supplied in different seasons of the year in Poland. The paper concludes with a summary including conclusions, as well as limitations and opportunities for future research in this area.
2. Literature Review
The water scarcity trend affects the whole world and is in large part due to climate change [
16], as there is an imbalance in the amount of rainfall. Rainfall increases in wet areas and decreases in drought-prone areas. In Europe, new regulations have emerged in connection with these threats. These include, among others, the EU Water Framework Directive—integrated river basin management for Europe [
17], Urban Waste Water Directive [
18], and Drinking Water Directive [
19]. These documents primarily concern reducing water abstraction, improving drinking water quality, and reducing the effects of contamination.
In addition to water scarcity, there are issues of a definite deterioration of water quality due to industrial pollution and rising temperatures, which contribute to faster evaporation and hence densification and poorer quality. We can divide the origin of pollutants in water into two main groups: natural and artificial [
20]. Natural pollutants are those created by biological processes in the environment, e.g., water salinity. In contrast, artificial or anthropogenic pollutants are caused by human activity. Here we can mention three categories: physical, chemical, and bacteriological [
21]. Different types of measures are introduced to protect water resources: quantitative, qualitative, active, and passive. The former includes large-scale policies to support the proper use of resources, educational campaigns to develop retention awareness and irrigation activities in areas most at risk from droughts [
22]. Protecting against degradation and preventing its effects belongs to qualitative measures, whereas the technological fight against and prevention of water poisoning is active protection. There is also passive protection, consisting of the creation of specialised protection zones.
The issue of access to water and the degree of contamination are among the most important parameters to be considered when assessing the quality of domestic water [
23]. Water quality testing is carried out extensively throughout the world by water supply institutions and treatment organisations, drinking water suppliers, and many others. A characteristic phenomenon can be observed, namely a certain standardisation of the evaluated parameters on the one hand and high individualisation depending on geographical and infrastructural specificities on the other. In literature, we can find, for example, studies carried out in Canada, where there is a very strong emphasis on the protection of surface water (SWP—Source Water Protection), focusing on protection against excessive water pollution and, no less dangerous, excessive water consumption [
24]. Due to the wide variation in the location of water sources and in the availability of water supplies, the assessment of water quality varies greatly, depending precisely on these factors [
25]. The most commonly analysed parameters are health characteristics and disease risk, ease of access to other sources, fear of chemical contaminants and information from the media [
25]. A distinctive group that assesses the quality of tap water in Canada is the indigenous people, who place emphasis mainly on its safety. Studies have found that as many as 73% of water intakes for indigenous people are at risk for health reasons, and water properties are determined on the basis of the users’ age, culture, gender, experience, belief in the need for boiling tap water, position in the household, trust in supply reliability, and environmental factors [
25]. The quality is rated higher the more odourless the water is. There is also an interesting correlation with living at considerable distances from large cities. The greater the distance from centres of civilisation, the greater the distrust in the quality of tap water and the growing belief in the safety of ground water. Some consumers choose bottled water in general as an alternative to tap water and groundwater [
25].
Italy holds the record in Europe for the highest consumption of bottled water and is the second largest producer of this beverage after France [
26]. A significant increase in the consumption of bottled water has occurred as awareness has increased among Italians regarding health parameters of this type of water in relation to tap water, as well as convenience, as they do not need to additionally treat and boil it before consumption. Elderly people have the most reservations about the quality of tap water in Italy. The geographical location of the region and the regularity and stability of the water supply are factors that also influence the evaluation [
26]. Despite a media-led campaign to encourage the use of public water, interest has not definitely increased in this country. Unfortunately, choosing bottled water in such overwhelming quantities also has very negative consequences, namely massive environmental pollution resulting from huge deposits of empty PET bottles.
A European country with 90% consumer confidence in tap water quality is the Netherlands [
27]. This classification is mostly due to the education of the respondents. It can be observed that the lower the education level of the respondents, the lower the concern about the threats to water quality. Users base their assessment primarily on institutional trust in suppliers, personal experiences, and childhood beliefs. However, the Dutch are not free from concerns about the quality of tap water [
27]. Two categories of concern can be identified here. The first, which is dominant in women, is triggered by the presence of children in the household and stems from concern for the safety of the little ones. The second one is more popular among men who notice anthropogenic pollution, coming from industry, agriculture, hospitals, and households, and are concerned about the accumulation of various substances in the water they use. As one of the most important trust factors, the Dutch point to adequate communication between the water company and the customer in terms of information about water purification activities and frequent quality checks [
27].
In China and Taiwan, emphasis is placed on groundwater due to drinking water shortages [
28]. Studies of the latter have shown the presence of components such as: arsenic both in the water itself and in fish swimming in it; nitrates, chloride, and sodium ions, as well as iron and manganese, which in excessive amounts significantly alter the taste of the water and inhibit crop growth [
28]. Pollution is mainly the result of mismanagement of industrial materials and products and of progressive urbanisation. In China, we can now notice that the interest in water culture, ecology, and water conservation is growing significantly [
29]. There is an emerging trend to integrate water management and environmental, nature, social, and economic issues. However, these are measures taken from the position of water management institutions, without taking into account the subjective assessment of water quality by its users.
In Malaysia, attention is drawn to very poor condition of pipelines and chlorine contamination of water [
30]. Unfortunately, there is little monitoring of drinking water, which makes consumers more likely to use groundwater. It can also be noted that there is a strong interest in household water filtration methods, supported by a government campaign planned until 2030, but the high cost remains a barrier. Two trends in consumer behaviour can be observed, depending on the amount and availability of water in the household. Tap water is primarily used for drinking and domestic purposes, while well water is most often used for irrigation. The latter is rated worse by consumers during high tide, when it becomes turbid. The quality of tap water, in turn, depends on the season and is characterised by more or less turbidity [
30]. A study conducted in Kangaroo, Malaysia focused on drinking water parameters such as turbidity, colour, acidity, and the amount of chlorine concentration, which was found to be too high in most samples [
31]. The aforementioned elements leave a lot of room for improvement for drinking water suppliers in the country.
In Nepal, where the availability of water depends mainly on the terrain, the use of piped water supply is sporadic [
32]. This is also due to the quality of this water, which is the result of a lack of pipeline maintenance and ground leakage. For example, in rural areas, more than 82% of water samples tested were contaminated with
E. coli. For the people of Nepal, the most critical factors in assessing tap water quality are the available quantity and the reliability and predictability of supply, as well as the purity of water. Most often, the assessment is done visually and can lead to situations where the water is not consumed or used. This is due to the appearance of turbidity and wrong odour. The state cannot afford to assess the quality of water, so the residents decide on its quality and suitability based on visual and organoleptic assessment [
32]. The accuracy of supply timing is also an extremely important factor, due to the country’s geography and frequent water supply interruptions.
A critical situation in terms of access to drinking water exists in India, where climate change and alternating droughts and floods, along with dramatically increasing demand for water associated with urban development and agriculture, make it a highly scarce commodity [
33]. In addition to the shortage of this raw material, a huge problem is its pollution and failure to take appropriate actions to reverse this trend [
34].
It is also worth mentioning Africa, which for the most part has no water supply and access to water is found in rivers, lakes, and streams. As this water is known to be heavily polluted, the Sodis technique, or solar water disinfection, has been introduced there to combat water-borne diseases [
35].
Germany has a very high average use of tap water for drinking purposes, almost 90%, with most consumers rating the quality very high or good [
36]. In Spain, the technique of desalinating seawater by reverse osmosis has been introduced due to the massive loss of natural hydrological resources. It should be added that Spain quickly became the second dominant country in the world, after the US, in the use of this solution [
37]. Another problem with drinking water quality exists in Norway, where the pipeline network is very outdated, neglected, and only modernised to a small extent [
38]. This carries both health risks for consumers and technical risks for the administration and water services. The culture of drinking tap water is well advanced in Norway, but an analysis of many situations in the country results in a decreasing interest in this type of tap water use.
Research conducted in England and Wales [
39] shows that the assessment of water quality is primarily based on habit. With this conclusion, even potential improvements in tap water quality that suppliers could provide may not result in changes in consumer behaviour, which is precisely due to their high inertia. Given such factors, the question arises: can a significant improvement in tap water quality significantly influence consumer behaviour and change consumer habits?
From studies conducted in Poland [
40], it is possible to point to users’ assessments, but only in a crisis situation. They point first and foremost to its usefulness in the household, and among the evaluation parameters, the organoleptic criteria of taste and smell are the most important, followed only by price and reliability of supply. Other analyses show that reliability is one of the most important factors for water consumers in Poland [
41]. Part of the research carried out, relating to water quality, focuses on parameters such as: temperature control, residual level, flush frequency, time to prepare hot tap water, and use of thermostatic mixing valves [
42]. Surveys show that consumers also rate factors such as price, quality, average per capita consumption, taste and smell, quality of service of the water company, inconvenience of water supply interruptions and duration of these interruptions, and use of other sources during failures [
43]. Water is also assessed for chemical, biological, physical contaminants, type of monitoring system, emergency safety programmes, water intake zones in an emergency, and critical infrastructure [
44].
The confidence of Poles in the quality of drinking water is not very high. This stems from an awareness rooted a few decades back, when water was not monitored and its quality left much to be desired. Since Poland’s accession to the EU, this has been changing slowly and consumer awareness has been shifting significantly in favour of tap water [
45]. With this change, more and more consumers are choosing to consume it directly, while at the same time, water suppliers are constantly improving the quality of services they provide, which definitely affects water quality.
Security of water supply is very important for the proper functioning of most societies. In addition to biological, chemical, and physical hazards, attention must be paid to climatic hazards, such as floods or droughts, which threaten safety and amount of abstracted water. Water hazards can have effects that are more or less threatening to human health and life [
46], and therefore require a warning system, elimination of potential hazards, and the use of alternative sources of water supply while infected sources are purified. There is also a certain seasonality in water supply failures in Poland. The greatest intensity is during the winter months, when leaks and corrosion of pipes become apparent. It is important to note that an additional risk from this situation, namely a lack of availability of water, can pose a serious threat, making firefighting operations difficult or impossible [
47]. Some failures can be predicted and attempts can be made to prevent them. To make this process possible, most companies supplying water to households use modern technical solutions, i.e., numerical maps supported by a computer system [
48]. The use of modern IT solutions can, above all, speed up and also improve management of failures and planning of repairs. As a member of the EU, Poland is obliged to implement the assumptions of the Water Framework Directive and Polish regulations in terms of water quality monitoring, control of discharged pollutants, and development of preventive measures in case of hypothetical water contamination [
49]. Among other things, modern mathematical modelling is used to carry out these tasks, which helps to predict many random situations [
50].
The greatest concerns of tap water users arise when it comes to continuity of supply in emergency situations. In their daily use, consumers do not indicate hazards noticeable in the water they use [
40]. One might be tempted to conclude that more and more frequent surveys exploring audience preferences are needed. The last two decades have seen a significant difference in the quality of water supplied to consumers by public waterworks. Particularly in Europe, EU member states are obliged to observe strict requirements regarding the health safety of this raw material. In addition, the associated countries benefit from subsidies for modernisation and restructuring of water supply networks [
51]. However, there is still a lack of studies and assessments of individual consumers that would refer to the quality, taste, and visual parameters of water, without evaluating its health-promoting qualities or the quality of the operation of water supply companies. The Malaysian study cited above [
30] is typical but sporadic in other countries. Water is assessed according to the seasons there, as it is the changes in weather and precipitation that significantly affect its quality, suitability for drinking, and farm use. It is therefore possible to see a research gap, consisting of the lack of scientific studies in literature on subjective assessment of water quality by consumers depending on the season in European countries. There are a number of studies on chemical, biological, and physical parameters and pollution levels, as well as analyses of water supply networks in relation to a number of technical elements [
52]. It seems that it is precisely the area of individual assessments that leaves ample room for analysis and the formulation of recommendations that could significantly assist with technical analysis of this life-giving raw material. In reference to this, the authors’ concept of research assumes presentation of additional guidelines for improvement of water quality parameters from the point of view of meeting the expectations of water consumers. The dynamically changing environment and its emphasis on social needs, not only on profit, to a large extent forces water supply and sewage companies to provide a higher (than just legal) standard of services [
53]. Greater emphasis on water quality parameters through research and meeting the expectations of their customers are part of the trend to protect the environment and its natural resources. With reference to the identified research gap and the literature review, the authors formulated a hypothesis: evaluation of selected tap water parameters varies according to the period (spring, summer, autumn, winter).
3. Materials and Methods
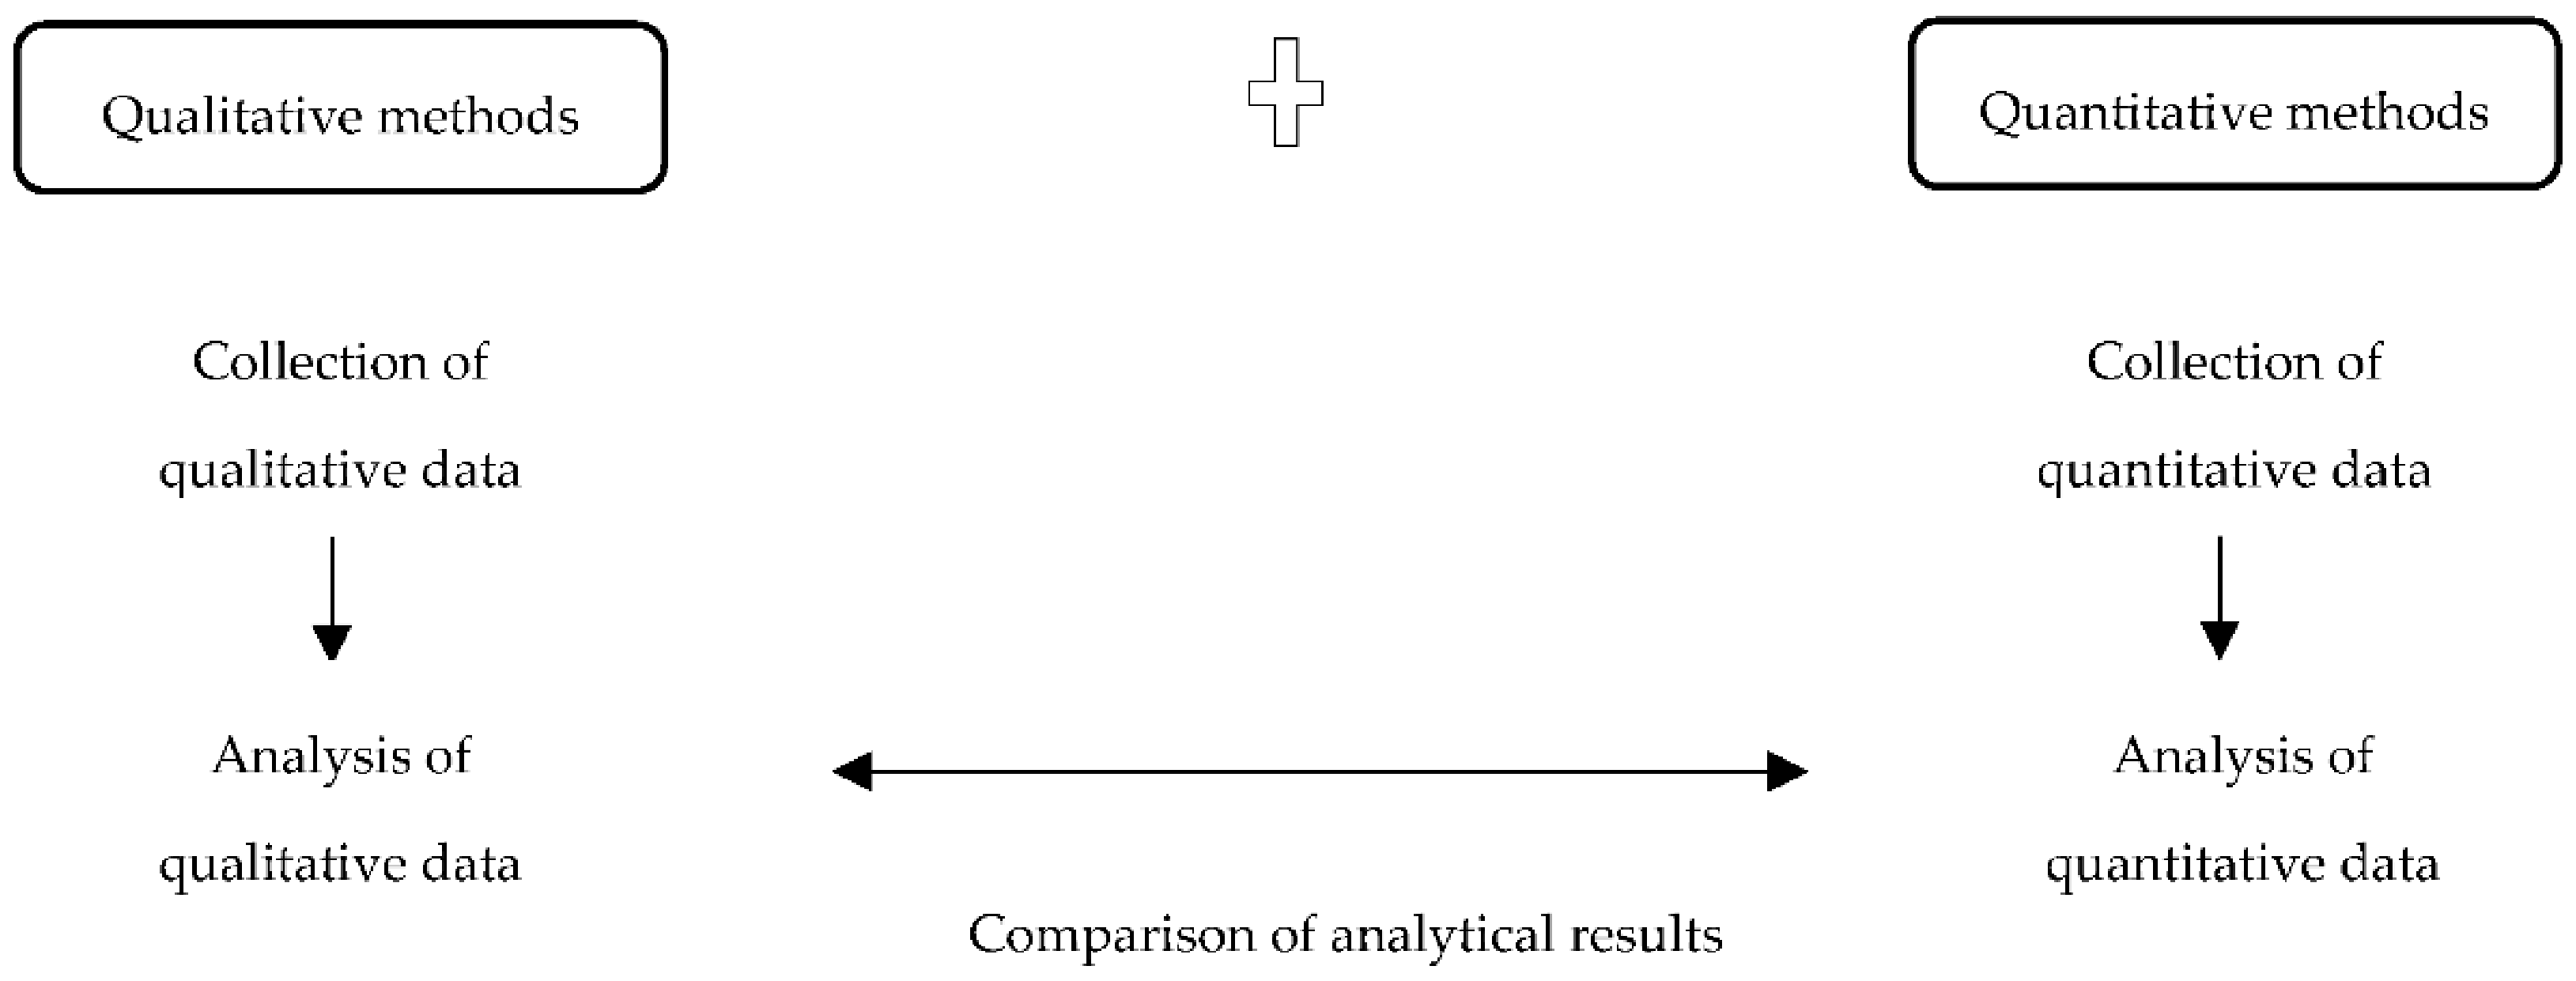
The research problem of this study was to find out the level of satisfaction with the quality of water supplied through the water supply network in Poland, taking into account different seasons of the year as periods of use of the supplied water. The aim of the article was to present a model for the evaluation of the parameters of tap water supplied in different seasons of the year in Poland. Due to the complexity of the research aspects, it was decided to combine qualitative methods (literature review) with quantitative methods (diagnostic survey, statistical analysis) in a parallel triangulation strategy, which is shown in
Figure 1.
The parallel triangulation strategy is one of popular models of mixed-methods research [
54], in which qualitative and quantitative data are collected simultaneously and compared to find convergence, differences, or any correlations. An advantage of this approach is rapid acquisition of data and its analysis from multiple perspectives, while limitations arise from the high workload and the need to have skills and experience necessary to study a phenomenon with two separate methods [
55].
The study uses an original survey questionnaire called “Survey of customer opinions on selected parameters of tap water supplied in Poland” that was developed especially for this study. This tool consists of 13 questions (including three on anonymous socio-demographic information and three on the use of tap water supplied). The remaining questions asked respondents to rate selected tap water parameters (i.e., taste, odour, colour, turbidity, hardness, pressure, and continuity of supply) in the context of different seasons (i.e., spring, summer, autumn, and winter), indicating the selected response on a 5-point Likert scale (where 1 means—definitely negative, 2—rather negative, 3—no opinion, 4—rather positive, and 5—definitely positive). In order to determine the reliability of the above questionnaire, the Cronbach’s alpha internal consistency coefficient was calculated, which amounted to alpha = 0.98 (valid reliability). The survey was conducted via the Interankiety.co.uk online platform between 12 January and 16 February 2021. Inclusion criteria were use of tap water, being over 18 years of age, and voluntary consent to participate in the study. Links to the online survey were distributed to 20,000 residents across Poland through 250 water and sewage companies, and the source for creating the address database of water companies was PWiK Sp. z o.o. in Rybnik, Poland with the support of the ‘Polish Waterworks’ Chamber of Commerce. There were 1198 participants in the study, of whom 52.42% were male (n = 628) and 47.58% female (n = 570).
Table 1 shows the groups of men and women by age and education and an overall breakdown of all respondents by age and education.
Table 2 shows the survey sample in terms of habits regarding the use of supplied tap water.
The minimum sample size was estimated using the sample size formula for qualitative characteristics (with a finite sample) [
56]. The calculation of the minimum sample size assumed a general population of 31,433.9, of which 92.20% [
57] used tap water. Furthermore, the above estimates assumed a 95% probability that the result obtained in the study would not deviate from the actual value in the population by more than 3%. The minimum sample size estimated in this way was 307. Thus, the achieved number of respondents (N = 1198) exceeded the minimum sample size by nearly four times, which allowed for reliable data in this study.
The results collected in the survey were subjected to quantitative and descriptive analysis. A general description of structure of the study sample, including the results of assessments of individual tap water parameters, is presented via the numbers and percentages of people characterised by a given attribute. On the other hand, at the stage of testing the significance of differences and correlations concerning the ratings of the above parameters, descriptive statistics were developed (based on a numerical scale of 1–5 ratings) and conformity of their distribution with the normal distribution was assessed using the Shapiro-Wilk test. The following statistical tests and methods were used to verify the significance of differences between groups and selected correlations: Kruskal-Wallis test, to compare a minimum of three groups of quantitative or ordinal variables; epsilon-square coefficient was used as a measure of effect size; Spearman’s rank order correlation, to examine the interdependence between two quantitative and/or ordinal variables; multidimensional cluster analysis, to extract homogeneous subsets of objects (i.e., factor subgroups) that are more “similar” to objects from a given cluster compared to objects from other clusters [
58]. In carrying out the above analysis, Euclidean distance was used as the distance function. The single linkage method, also known as the nearest neighbour method, was adopted as the principle for linking clusters together. In this method, the distance between two clusters is determined by the distance between the two nearest objects (nearest neighbours) belonging to different clusters [
58]. On the other hand, objects (factors) were grouped in two ways: hierarchical agglomeration method and non-hierarchical grouping by k-means method. The first of the above-mentioned methods makes it possible to generate hierarchically-ordered clusters, which can be represented as a hierarchical tree (dendrogram), showing distances between objects. The second way moves objects between an indicated number of clusters to minimise within-group variability and maximise between-group variability [
58]. In order to build the model, the PROFIT analysis method was used to assess the similarity of the studied objects in terms of selected features and to develop a graphic presentation of the results of object grouping and their relations to the studied features in the form of a perception map [
59,
60].
Statistical analysis was performed using the Statistica v.13.3 PL statistical package from Tulsa, Oklahoma, USA (including the “marketing and market analysis” module). When interpreting the results obtained, the test probability was taken as statistically significant at p < 0.05.
4. Results and Discussion
4.1. Comparative Analysis of the Seasons in Terms of Ratings of Individual Tap Water Parameters
Taste ratings of tap water varied little between seasons. The respondents, referring to different periods, evaluated the above-mentioned parameter similarly, at the level from M
Winter = 3.78; SD
Winter = 1.11 to M
Spring = 3.83; SD
Spring = 1.01 on a scale of 1–5. The differences between the seasons in this respect were not statistically significant, as shown by the Kruskal-Wallis test analysis: H(3, N = 4792) = 1.15; p = 0.765;
= 0.00. The odour of tap water in the different seasons was also rated very similarly, at levels ranging from M
Winter = 3.84; SD
Winter = 1.12 to M
Spring = 3.89; SD
Spring = 1.02 on a scale of 1–5. Analysis with the Kruskal-Wallis test showed that seasons did not statistically significantly differentiate the evaluation of the above-mentioned tap water parameter: H(3, N = 4792) = 0.71; p = 0.87;
= 0.00. Another parameter of tap water, i.e., colour, was also rated very similarly by the respondents in relation to different seasons of the year. The respondents rated the colour of tap water at levels ranging from M
Summer = 4.01; SD
Summer = 1.07 to M
Spring = 4.05; SD
Spring = 1.04 on a scale of 1–5. The differences in this respect between the periods were not statistically significant, as shown by the Kruskal-Wallis test analysis: H(3, N = 4792) = 1.32; p = 0.725;
= 0.00. There were also no significant differences between the periods in terms of tap water turbidity ratings. The respondents in relation to various seasons evaluated the above parameter in a very similar way, ranging from M
Autumn = 3.94; SD
Autumn = 1.07 to M
Spring = 3.96; SD
Spring = 1.06 on a scale of 1–5. As shown by the Kruskal-Wallis test analysis, there were no statistically significant differences in the evaluation of the above parameter between individual seasons: H(3, N = 4792) = 0.17; p = 0.983;
= 0.00. This is confirmed by laboratory tests conducted between 1 January 2015 and 1 January 2018 at PWiK Rybnik [
52], which indicate slight fluctuations in the parameters of turbidity, colour, and water hardness in relation to seasonality, with an indication of their slight deterioration in winter. However, large differences can be seen in them depending on the studied water intakes. Depending on the source location and its type, i.e., whether it is a surface water intake or a deep-water intake, raw water parameters may be subject to significant fluctuations, which has an impact on the adopted water treatment technology. The adopted treatment technology is adjusted to the obtained raw water parameter and results in its deterioration in winter. With such knowledge, it is possible to undertake actions to modify the technology in order to limit this adverse effect.
When assessing tap water pressure, analysis with the Kruskal-Wallis test showed statistically significant differences between the seasons: H(3, N = 4792) = 65.18; p < 0.001;
= 0.01. The post hoc test showed that there were statistically significant (p < 0.001) differences in the evaluation of the above parameter between the summer period (lower score) and the other periods, i.e., spring, autumn, and winter. The above differences are confirmed by the descriptive statistics for the assessment of tap water pressure at different times of the year. The respondents rated the above parameter worse in summer (M = 3.68; SD = 1.19 on a scale of 1–5) than in other periods (from M
Autumn = 3.96; SD
Autumn = 1.11 to M
Winter = 3.99; SD
Winter = 1.11) (
Table 3).
Continuity of supply was rated similarly by the respondents for the different seasons, with ratings for this tap water parameter ranging from MSummer = 4.48; SDSummer = 0.81 to MWinter = 4.54; SDWinter = 0.78 on a scale of 1–5. Analysis with the Kruskal-Wallis test showed that seasons did not statistically significantly differentiate the evaluation of continuity of tap water supply: H(3, N = 4792) = 5.72; p = 0.126; = 0.00.
4.2. Comparative Analysis of Tap Water Parameters in Terms of Evaluation in Different Seasons
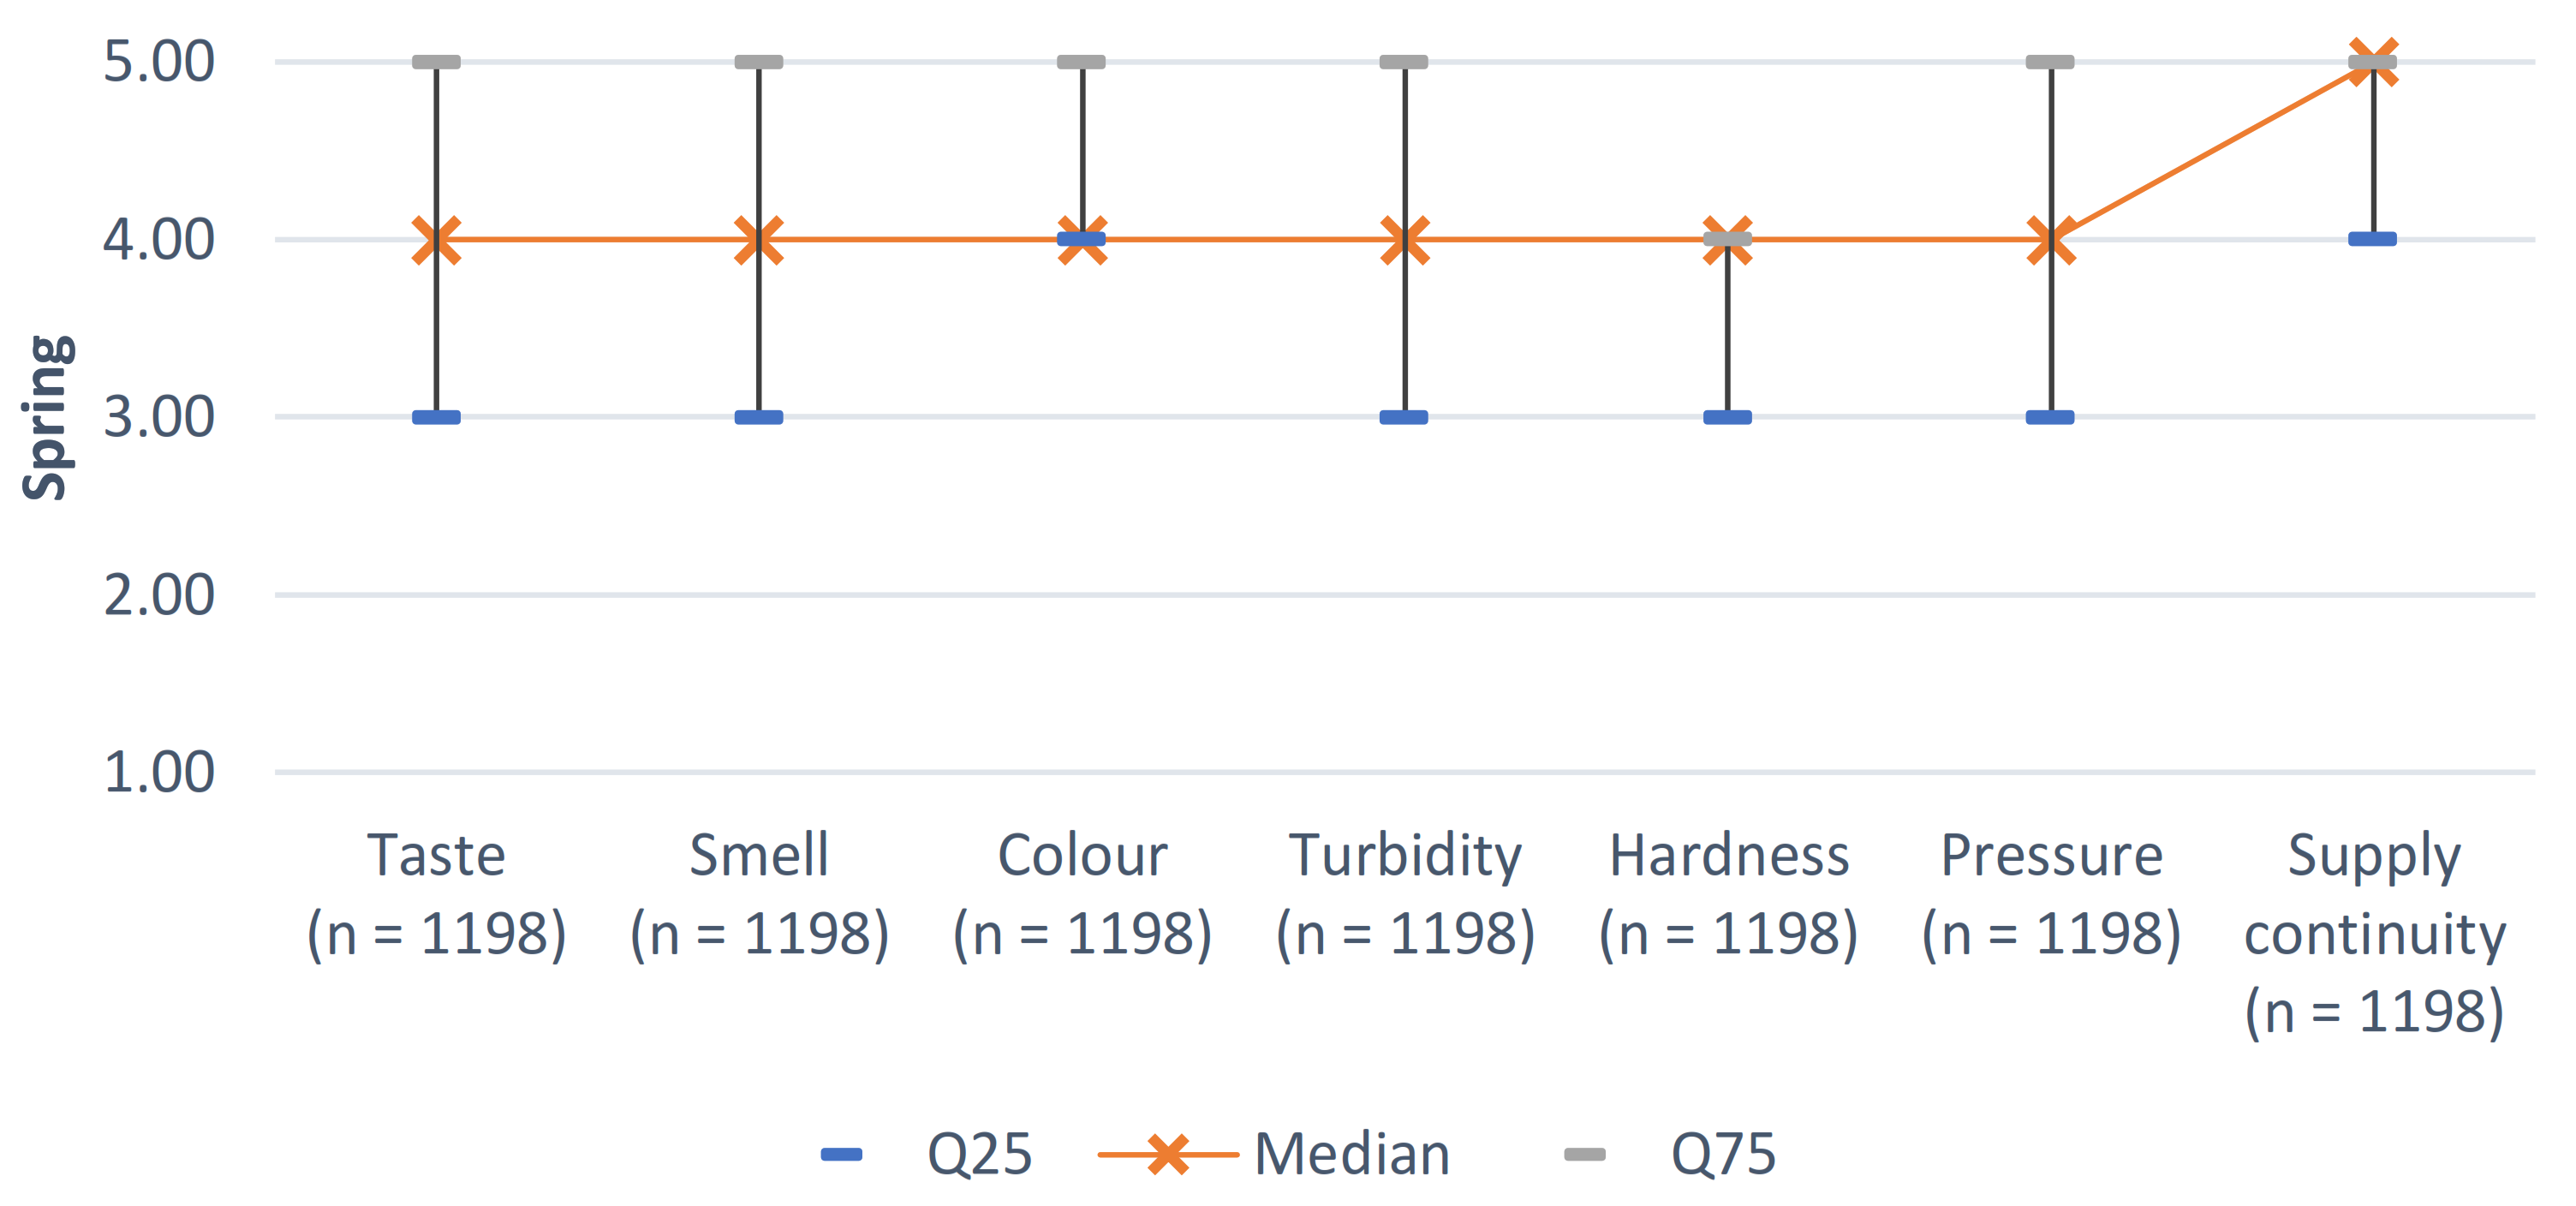
Analysis with the Kruskal-Wallis test showed that the ratings of individual tap water parameters in the spring period were statistically significantly different from each other: H(6, N = 8386) = 688.22; p < 0.001;
= 0.08. In turn, the post hoc test showed that there were statistically significant (p < 0.001) differences between the rating of continuity of water supply (higher rating) and all other parameters (lower rating). There were also statistically significant (p < 0.001) differences between the ratings for water hardness (lower rating) and all other parameters (higher rating). In addition, the ratings of water colour, turbidity, and pressure were found to be statistically significantly (p < 0.01 or p < 0.001) different (higher rating) from its taste (lower rating), and water colour was also statistically significantly (p < 0.001) different (higher rating) from its odour (lower rating). From the distribution of descriptive statistics on the ratings of individual parameters in the spring period, it can be seen that continuity of supply was rated highest (M = 4.53; SD = 0.78), while firmness was rated lowest (M = 3.54; SD = 1.14). Water colour was one of the best-rated water parameters (M = 4.05; SD = 1.04), while turbidity and pressure were rated slightly lower (M
Turbidity = 3.96; SD
Turbidity = 1.06 and M
Pressure = 3.97; SD
Pressure = 1.1). The lowest scores, apart from water hardness, were for taste and smell (M
Taste = 3.83; SD
Taste = 1.01 and M
Odour = 3.89; SD
Odour = 1.02) (
Figure 2).
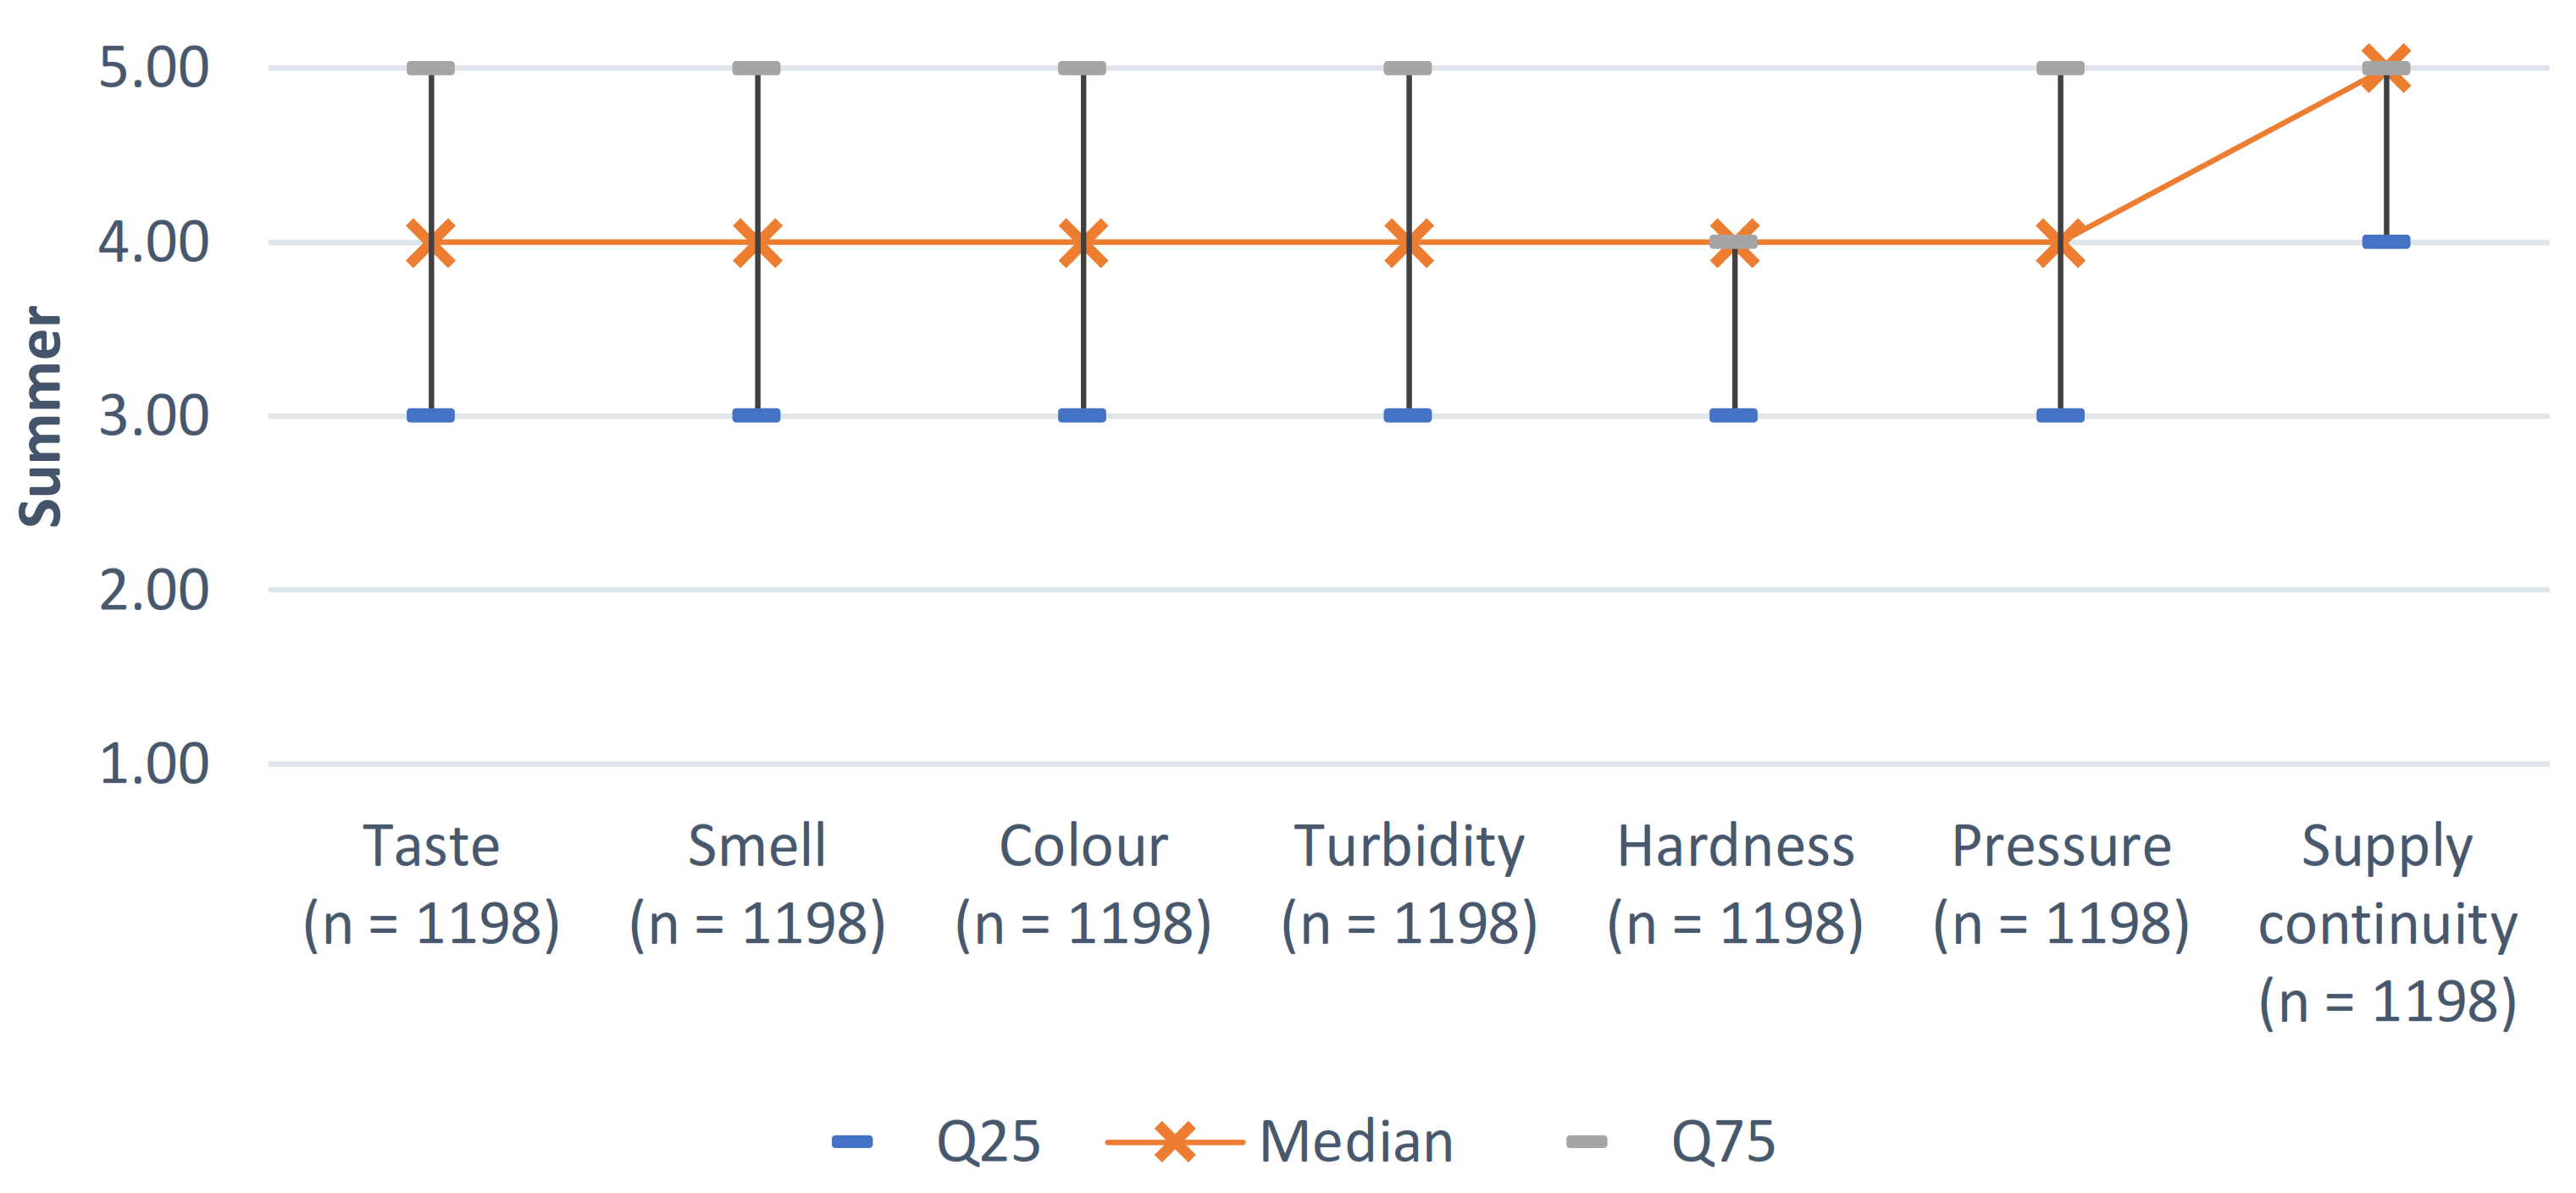
In the summer period, statistically significant differences in the ratings of individual tap water parameters were also noted, as shown by analysis with the Kruskal-Wallis test: H(6, N = 8386) = 651.92; p < 0.001;
= 0.08. The post hoc test showed that, as in the case of the spring period, there were statistically significant (p < 0.001) differences between the ratings for continuity of water supply (higher rating) and all other parameters (lower rating) and statistically significant (p < 0.01 or p < 0.001) differences between the ratings for water hardness (lower rating) and all other parameters (higher rating). The ratings for colour and turbidity were also statistically significantly (p < 0.001) different (higher rating) from its taste and pressure (lower rating); in addition, there were statistically significant (p < 0.001) differences between the ratings for colour (higher rating) and odour (lower rating). The above differences are confirmed by the results of descriptive statistics on the ratings of individual parameters during the summer. The best and worst rated parameters were continuity of supply and hardness, respectively (M
Continuity of supply = 4.48; SD
Continuity of supply = 0.81 and M
Hardness = 3.52; SD
Hardness = 1.15). Water colour was the second most highly rated parameter (M = 4.01; SD = 1.07), but water turbidity was slightly worse (M = 3.94; SD = 1.08). Taste and odour had slightly worse ratings in the summer period (M
Taste = 3.8; SD
Taste = 1.03 and M
Smell = 3.85; SD
Smell = 1.04), while pressure—apart from water hardness—was the worst rated (M = 3.68; SD = 1.19) (
Figure 3).
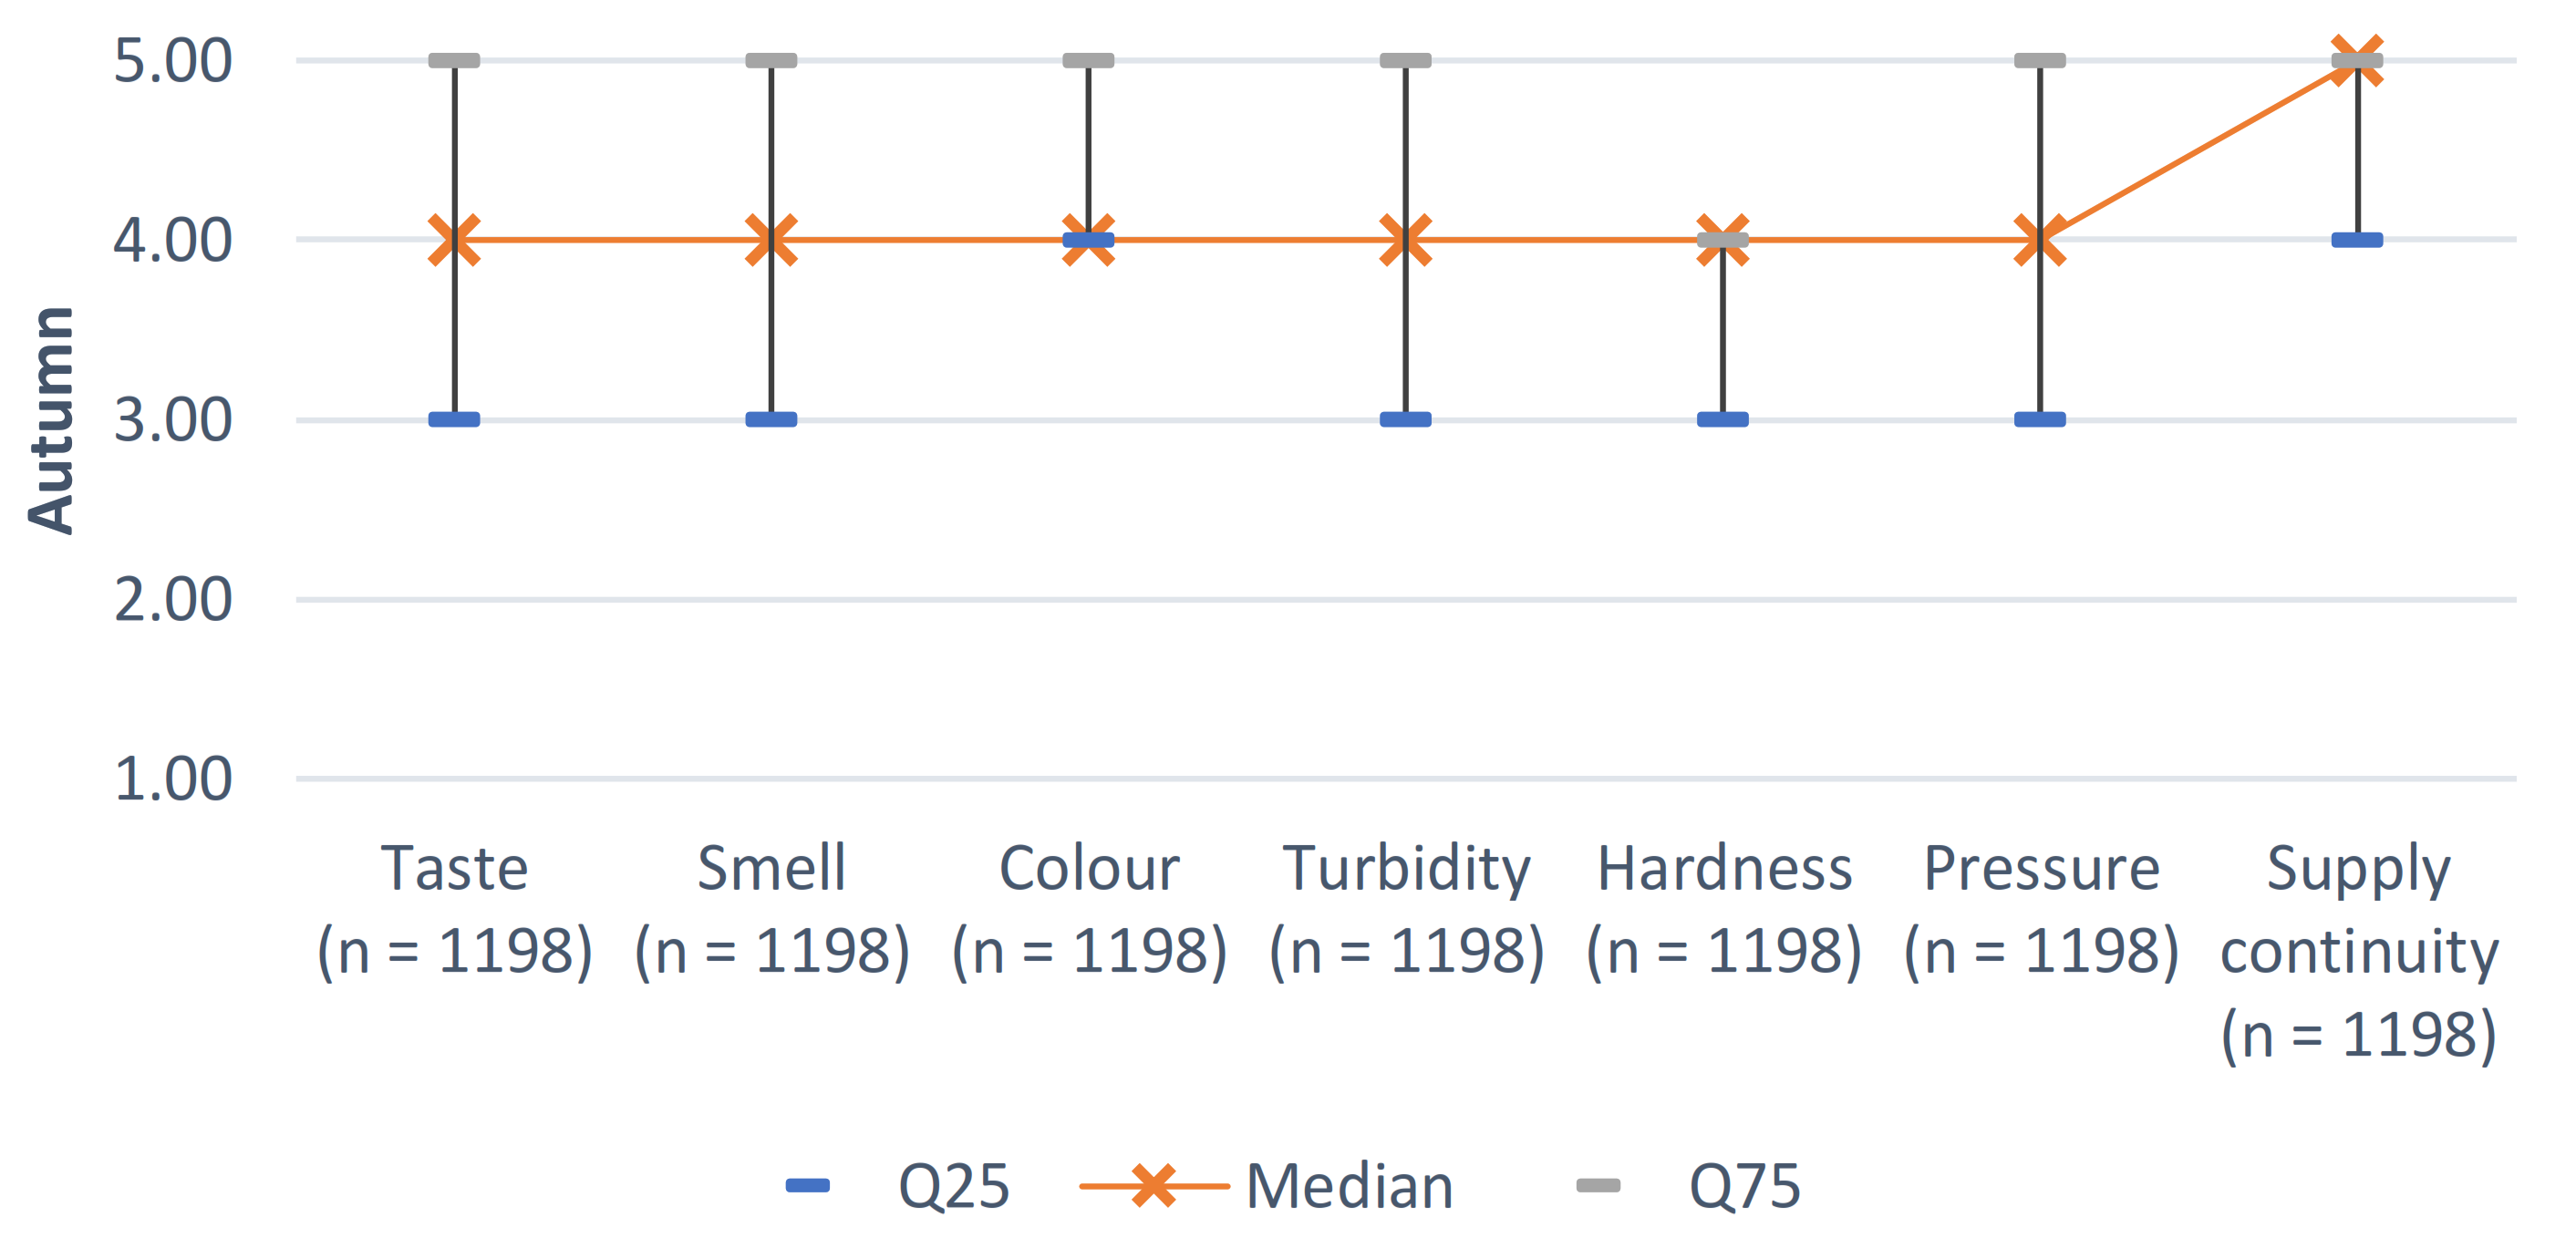
The evaluation of individual parameters in relation to the autumn period also varied in a statistically significant way, as shown by analysis with the Kruskal-Wallis test: H(6, N = 8386) = 719.3; p < 0.001;
= 0.09. The post hoc test in turn showed that, as in the spring and summer, there were statistically significant (p < 0.001) differences between the ratings for continuity of water supply (higher rating) and all other parameters (lower rating) and statistically significant (p < 0.001) differences between the ratings for water hardness (lower rating) and all other parameters (higher rating). There were also statistically significant (p < 0.001) differences between the ratings for colour, turbidity, and water pressure (higher rating) and the ratings for taste (lower rating). In addition, there were statistically significant (p < 0.001 or p < 0.05) differences between the ratings for colour and pressure (higher rating) and the ratings for smell (lower rating). The results of descriptive statistics on the ratings of individual parameters during the autumn period indicate that continuity of supply was rated highest (M = 4.54; SD = 0.78), while water hardness was rated lowest (M = 3.52; SD = 1.15). The ratings for colour, pressure, and turbidity were similar, with colour being the best rated among these three parameters (M
Colour = 4.01; SD
Colour = 1.07; M
Turbidity = 3.94; SD
Turbidity = 1.07 and M
Pressure = 3.96; SD
Pressure = 1.11). The smell of the water was rated slightly worse in autumn (M = 3.85; SD = 1.05), and the taste of the water was rated worst, apart from the aforementioned water hardness (M = 3.78; SD = 1.04) (
Figure 4).
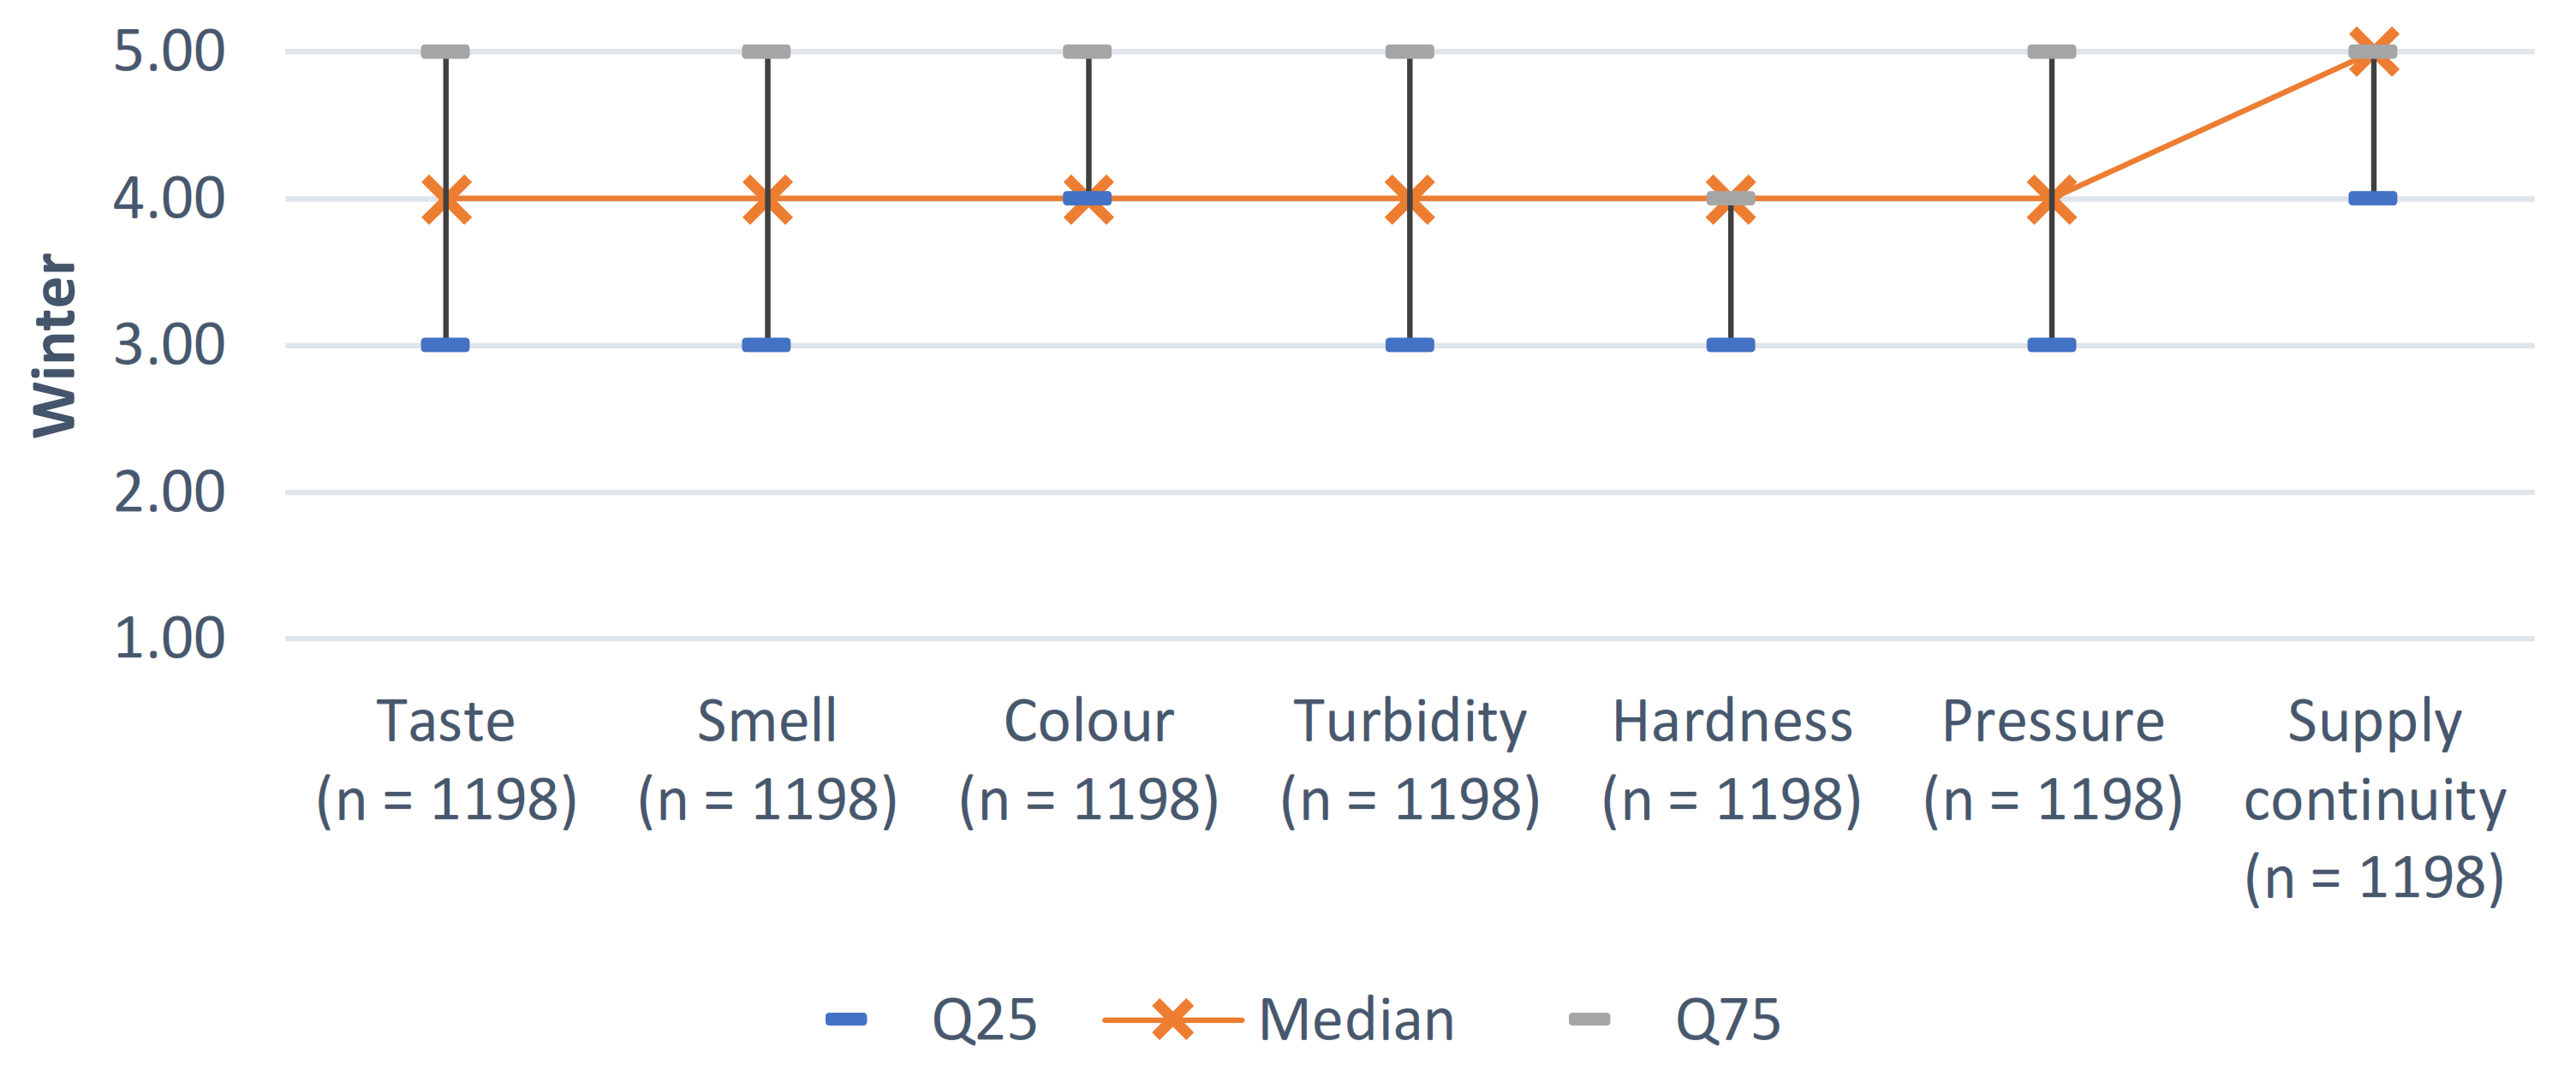
Moreover, analysis with the Kruskal-Wallis test showed that the ratings of individual tap water parameters also in the winter period were statistically significantly different from each other: H(6, N = 8386) = 697.05; p < 0.001;
= 0.08. In contrast, the results of the post hoc test showed similar differences in the ratings between the parameters as for the autumn period. Thus, during the winter period, there were statistically significant (p < 0.001) differences between the ratings for continuity of water supply (higher rating) and all other parameters (lower rating) and statistically significant (p < 0.001) differences between the ratings for water hardness (lower rating) and all other parameters (higher rating). In addition, statistically significant (p < 0.001 or p < 0.01) differences were noted between the ratings for colour, turbidity, and water pressure (higher score) and for taste (lower score), and in the case of colour and pressure, also between the ratings for these water parameters (higher score) and for odour (lower score). As can be read from the distribution of descriptive statistics on the ratings of the individual parameters during the winter period, the continuity of supply was rated highest (M = 4.54; SD = 0.78) and water hardness was rated lowest (M = 3.51; SD = 1.1). Similar ratings were obtained for parameters such as colour, pressure, and turbidity, with colour being the best rated among these three parameters (M
Colour = 4.01; SD
Colour = 1.08; M
Turbidity = 3.95; SD
Turbidity = 1.09 and M
Pressure = 3.99; SD
Pressure = 1.11). The smell of the water was rated slightly worse in winter (M = 3.84; SD = 1.12), and the taste of the water was rated worst, apart from the aforementioned water hardness (M = 3.78; SD = 1.11) (
Figure 5).
4.3. Correlations between Tap Water Parameter Ratings within Seasons
Analysis performed by Spearman rank order correlation method showed that in terms of the assessments all parameters correlated with each other and these correlations were statistically significant. This applied to spring, summer, autumn, and winter. There were strong correlations between ratings for taste, smell, colour, turbidity, and hardness, with the strongest correlations between taste and smell as well as colour and turbidity ratings. In case of taste and smell, such results were obtained for spring: R = 0.84; t(N−2) = 53.59; p < 0.001; summer: R = 0.84; t(N−2) = 53.25; p < 0.001; autumn: R = 0.84; t(N−2) = 53.3; p < 0.001; as well as winter: R = 0.85; t(N−2) = 55.8; p < 0.001. The same was true for the correlation between colour and odour ratings—in spring: R = 0.81; t(N−2) = 47.84; p < 0.001; summer: R = 0.79; t(N−2) = 45.27; p < 0.001; autumn: R = 0.81; t(N−2) = 46.97; p < 0.001; as well as winter: R = 0.82; t(N−2) = 49.99; p < 0.001. Thus, a better rating for the taste of water was accompanied by a better rating for its smell, just as a better rating for the colour of water was accompanied by a better rating for its turbidity.
Slightly weaker correlations were noted between the ratings for colour and turbidity and the ratings for taste and odour. The better the respondents rated the colour of the water, the better they rated its taste in relation to spring: R = 0.72; t(N−2) = 36.22; p < 0.001; summer: R = 0.71; t(N−2) = 34.82; p < 0.001; autumn: R = 0.7; t(N−2) = 34.17; p < 0.001; as well as winter: R = 0.73; t(N−2) = 36.54; p < 0.001. A better assessment of the colour of the water was also conducive to more positive opinions about its smell, which was also found in each period, i.e., spring: R = 0.73; t(N−2) = 37.13; p < 0.001; summer: R = 0.71; t(N−2) = 35.23; p < 0.001; autumn: R = 0.71; t(N−2) = 34.57; p < 0.001 well as winter: R = 0.73; t(N−2) = 36.56; p < 0.001. Similar results were found for the turbidity parameter, whose ratings were positively correlated with taste ratings in the spring period: R = 0.72; t(N−2) = 35.43; p < 0.001; summer: R = 0.69; t(N−2) = 33.31; p < 0.001; autumn: R = 0.7; t(N−2) = 34.11; p < 0.001; as well as winter: R = 0.7; t(N−2) = 34.23; p < 0.001. In addition, a better rating for the turbidity of the water was associated with a better rating for its odour, also at any time of the year, i.e., in spring: R = 0.71; t(N−2) = 34.97; p < 0.001; summer: R = 0.69; t(N−2) = 32.8; p < 0.001; autumn: R = 0.69; t(N−2) = 33.38; p < 0.001 winter: R = 0.71; t(N−2) = 34.98; p < 0.001.
There were also strong correlations between water hardness ratings and ratings for taste, odour, colour, and turbidity. The better the respondents rated the hardness of the water in spring, the better they also felt about its taste: R = 0.65; t(N−2) = 29.55; p < 0.001; smell: R = 0.59; t(N−2) = 25.55; p < 0.001; colour: R = 0.58; t(N−2) = 24.89; p < 0.001 well as turbidity: R = 0.62; t(N−2) = 27.27; p < 0.001. Similar results were recorded for the summer period, where a better rating of water hardness was also associated with a better rating of its taste: R = 0.64; t(N-2) = 28.92; p < 0.001; smell: R = 0.6; t(N−2) = 25.68; p < 0.001; colour: R = 0.57; t(N-2) = 24.18; p < 0.001 well as turbidity: R = 0.61; t(N−2) = 26.58; p < 0.001. Such results were also obtained for the autumn period, where higher water hardness ratings favoured better taste perceptions: R = 0.64; t(N−2) = 29.04; p < 0.001; smell: R = 0.6; t(N−2) = 25.87; p < 0.001; colour: R = 0.59; t(N−2) = 25.17; p < 0.001 well as turbidity: R = 0.61; t(N-2) = 26.5; p < 0.001. In addition, a better assessment of water hardness in winter was linked to better opinions on its taste: R = 0.65; t(N-2) = 29.47; p < 0.001; smell: R = 0.6; t(N−2) = 26.01; p < 0.001; colour: R = 0.6; t(N−2) = 25.81; p < 0.001 well as turbidity: R = 0.61; t(N−2) = 26.33; p < 0.001.
The other two tap water parameters, i.e., pressure and continuity of supply, were also significantly correlated with ratings of taste, odour, colour, turbidity, and hardness. However, these relationships were somewhat weaker and mostly moderate in strength in each period studied.
4.4. Identification of Tap Water Parameters Evaluated Significantly Similarly across Seasons
A study using cluster analysis was conducted to identify tap water parameters assessed similarly in the different seasons. To describe the identified clusters, descriptive statistics were developed on the ratings of the parameters included in each cluster. The above analyses were performed for each season separately, i.e., spring, summer, autumn, and winter.
Cluster analysis using the agglomeration method showed that there were five clusters for ratings of individual tap water parameters in the spring, three of which were single-element ratings for parameters such as hardness, continuity of supply, and pressure. The remaining parameters were divided into two clusters, one of which included water taste and odour and the other included colour and turbidity. The following dendrogram shows a visualisation of the identified clusters (
Figure 6).
The results of non-hierarchical feature clustering method, the so-called k-means clustering, are fully in line with those obtained by the agglomeration method. Taste and smell of tap water were very similar in terms of ratings, as were colour and turbidity. In contrast, ratings for water hardness, continuity of water supply, and water pressure were less similar to those for the other parameters. From the distribution of descriptive statistics on the ratings of the parameters included in the individual clusters, it can be seen that continuity of supply was rated highest in the spring period (M = 4.53; SD = 0.78). Slightly weaker, but still good ratings were recorded for water colour and turbidity (M = 4.01; SD = 1.05) and slightly worse ratings were recorded for pressure (M = 3.97; SD = 1.1). Water taste and odour ratings were the next highest (M = 3.86; SD = 1.02), followed by water hardness ratings (M = 3.54; SD = 1.14).
For the summer period, cluster analysis showed results similar to those for the spring period, i.e., five clusters were identified for the ratings of individual tap water parameters, of which three were one-element (hardness, continuity of supply, and pressure) and the remaining two clusters were two-element. One focus included the taste and smell of the water and the other included the colour and turbidity. On the other hand, cluster analysis by non-hierarchical clustering of features, the so-called k-means clustering, showed the same clusters as the agglomeration method. During the summer, the taste and smell of tap water were rated very similarly. In addition, very similar ratings were recorded for water colour and turbidity. In contrast, ratings for water hardness, continuity of water supply, and water pressure were less similar to those for the previous parameters. The results of the distribution of descriptive statistics on the evaluations of parameters within the individual clusters show that, as in the spring period, continuity of supply was rated highest in the summer (M = 4.48; SD = 0.81). Slightly worse ratings were given for the colour and turbidity of the water (M = 3.98; SD = 1.08), and for its taste and smell (M = 3.83; SD = 1.04). Water pressure ratings were next highest (M = 3.68; SD = 1.19), while water hardness was rated worst in the summer (M = 3.52; SD = 1.15).
The results of the cluster analysis for the autumn period were very similar to those for spring and summer. In this case, there were also five clusters relating to ratings of individual tap water parameters, of which—as before—three were one-element (hardness, continuity of supply, and pressure) and the remaining two clusters were two-element (taste and smell of water and colour and turbidity of water). The dendrogram below shows a visualisation of the identified clusters. Cluster analysis by non-hierarchical clustering of features, so-called k-means clustering, confirmed the clusters identified by the agglomeration method. In autumn, the water parameters for taste and smell of tap water were similarly assessed. Similarities in ratings were also noted for water colour and turbidity. In contrast, assessments of water hardness, continuity of water supply, and water pressure differed from assessments of other parameters and were not close to any other parameter in this respect. As can be seen from the distribution of descriptive statistics on the ratings of parameters descending into individual clusters, in the autumn period—as in the spring and summer—continuity of supply was rated highest (M = 4.54; SD = 0.78). This was followed by ratings for colour and turbidity (M = 3.98; SD = 1.07) and pressure (M = 3.96; SD = 1.11). Slightly worse ratings were given for water taste and smell (M = 3.81; SD = 1.05), and the worst for water hardness (M = 3.52; SD = 1.15).
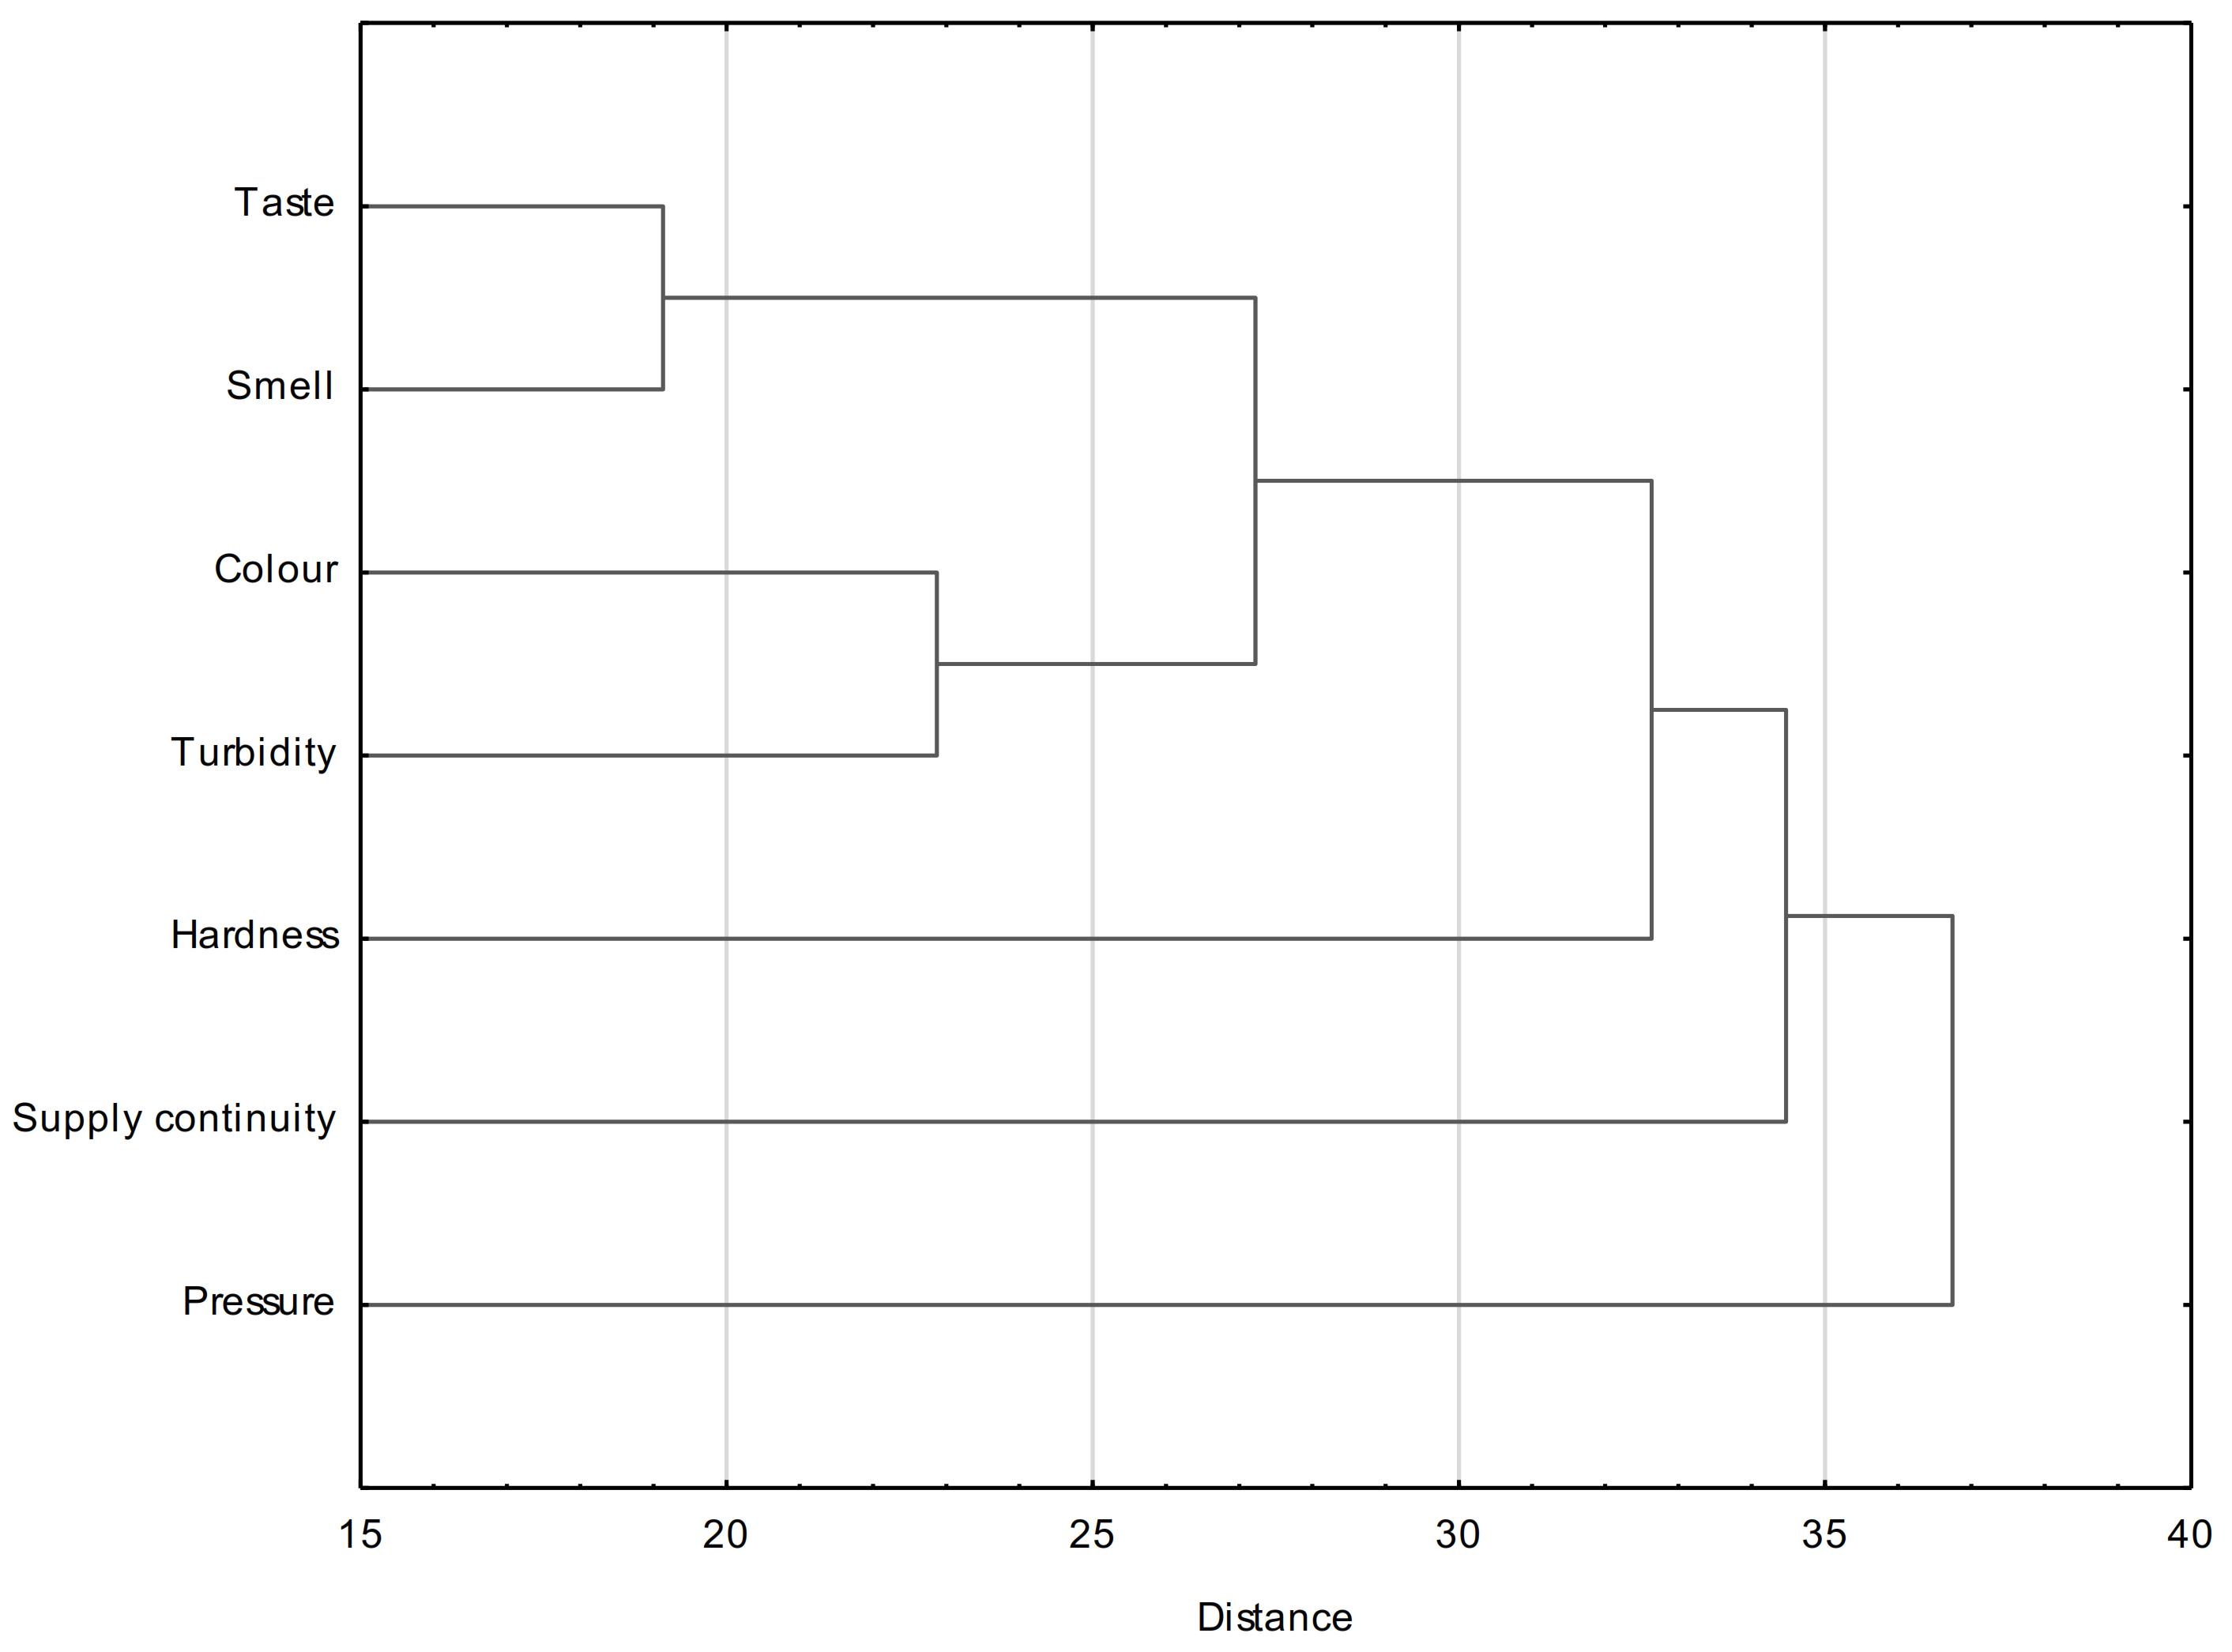
The last period analysed, i.e., winter, showed results similar to all previous periods. Cluster analysis using the agglomeration method identified five clusters relating to ratings of individual tap water parameters during the winter period, of which three were one-element (i.e., hardness, continuity of supply, and pressure) and two clusters were two-element, one of which included water taste and odour and the other included colour and turbidity. The results of the agglomerative cluster analysis method were also confirmed when clustering using the k-means method, meaning that the recorded clusters overlapped. Descriptive statistics on the ratings of the parameters included in each cluster indicate that continuity of supply was rated highest (M = 4.54; SD = 0.78). This was followed by ratings for colour and turbidity (M = 3.99; SD = 1.08) and pressure (M = 3.99; SD = 1.11). Slightly worse ratings were recorded for water taste and smell (M = 3.81; SD = 1.12), and the worst for water hardness (M = 3.51; SD = 1.17).
4.5. Model for the Evaluation of Tap Water Parameters by Season
Finally, an attempt was made to build a model of the evaluations of the parameters of tap water supplied during different seasons of the year, using PROFIT (PROperty FITting) analysis, in order to determine the water characteristics best evaluated during specific periods. Consequently, the model developed would indicate the seasons in which the evaluations of various parameters deviate strongly from the best ones and thus the parameters that should be improved in specific seasons. In building this model, first of all, multidimensional scaling was performed, which allowed for a graphical presentation of the structure of similarity (or dissimilarity) between the analysed objects in relation to a selected set of variables (features). The different seasons, such as spring, summer, autumn, and winter, were taken as the objects analysed. In turn, the variables (characteristics) in this study were individual tap water parameters such as taste, odour, colour, turbidity, hardness, pressure, and continuity of supply. Average ratings of individual tap water parameters issued for each season were used to develop the model. The following table shows the data on which the model was based (
Table 4).
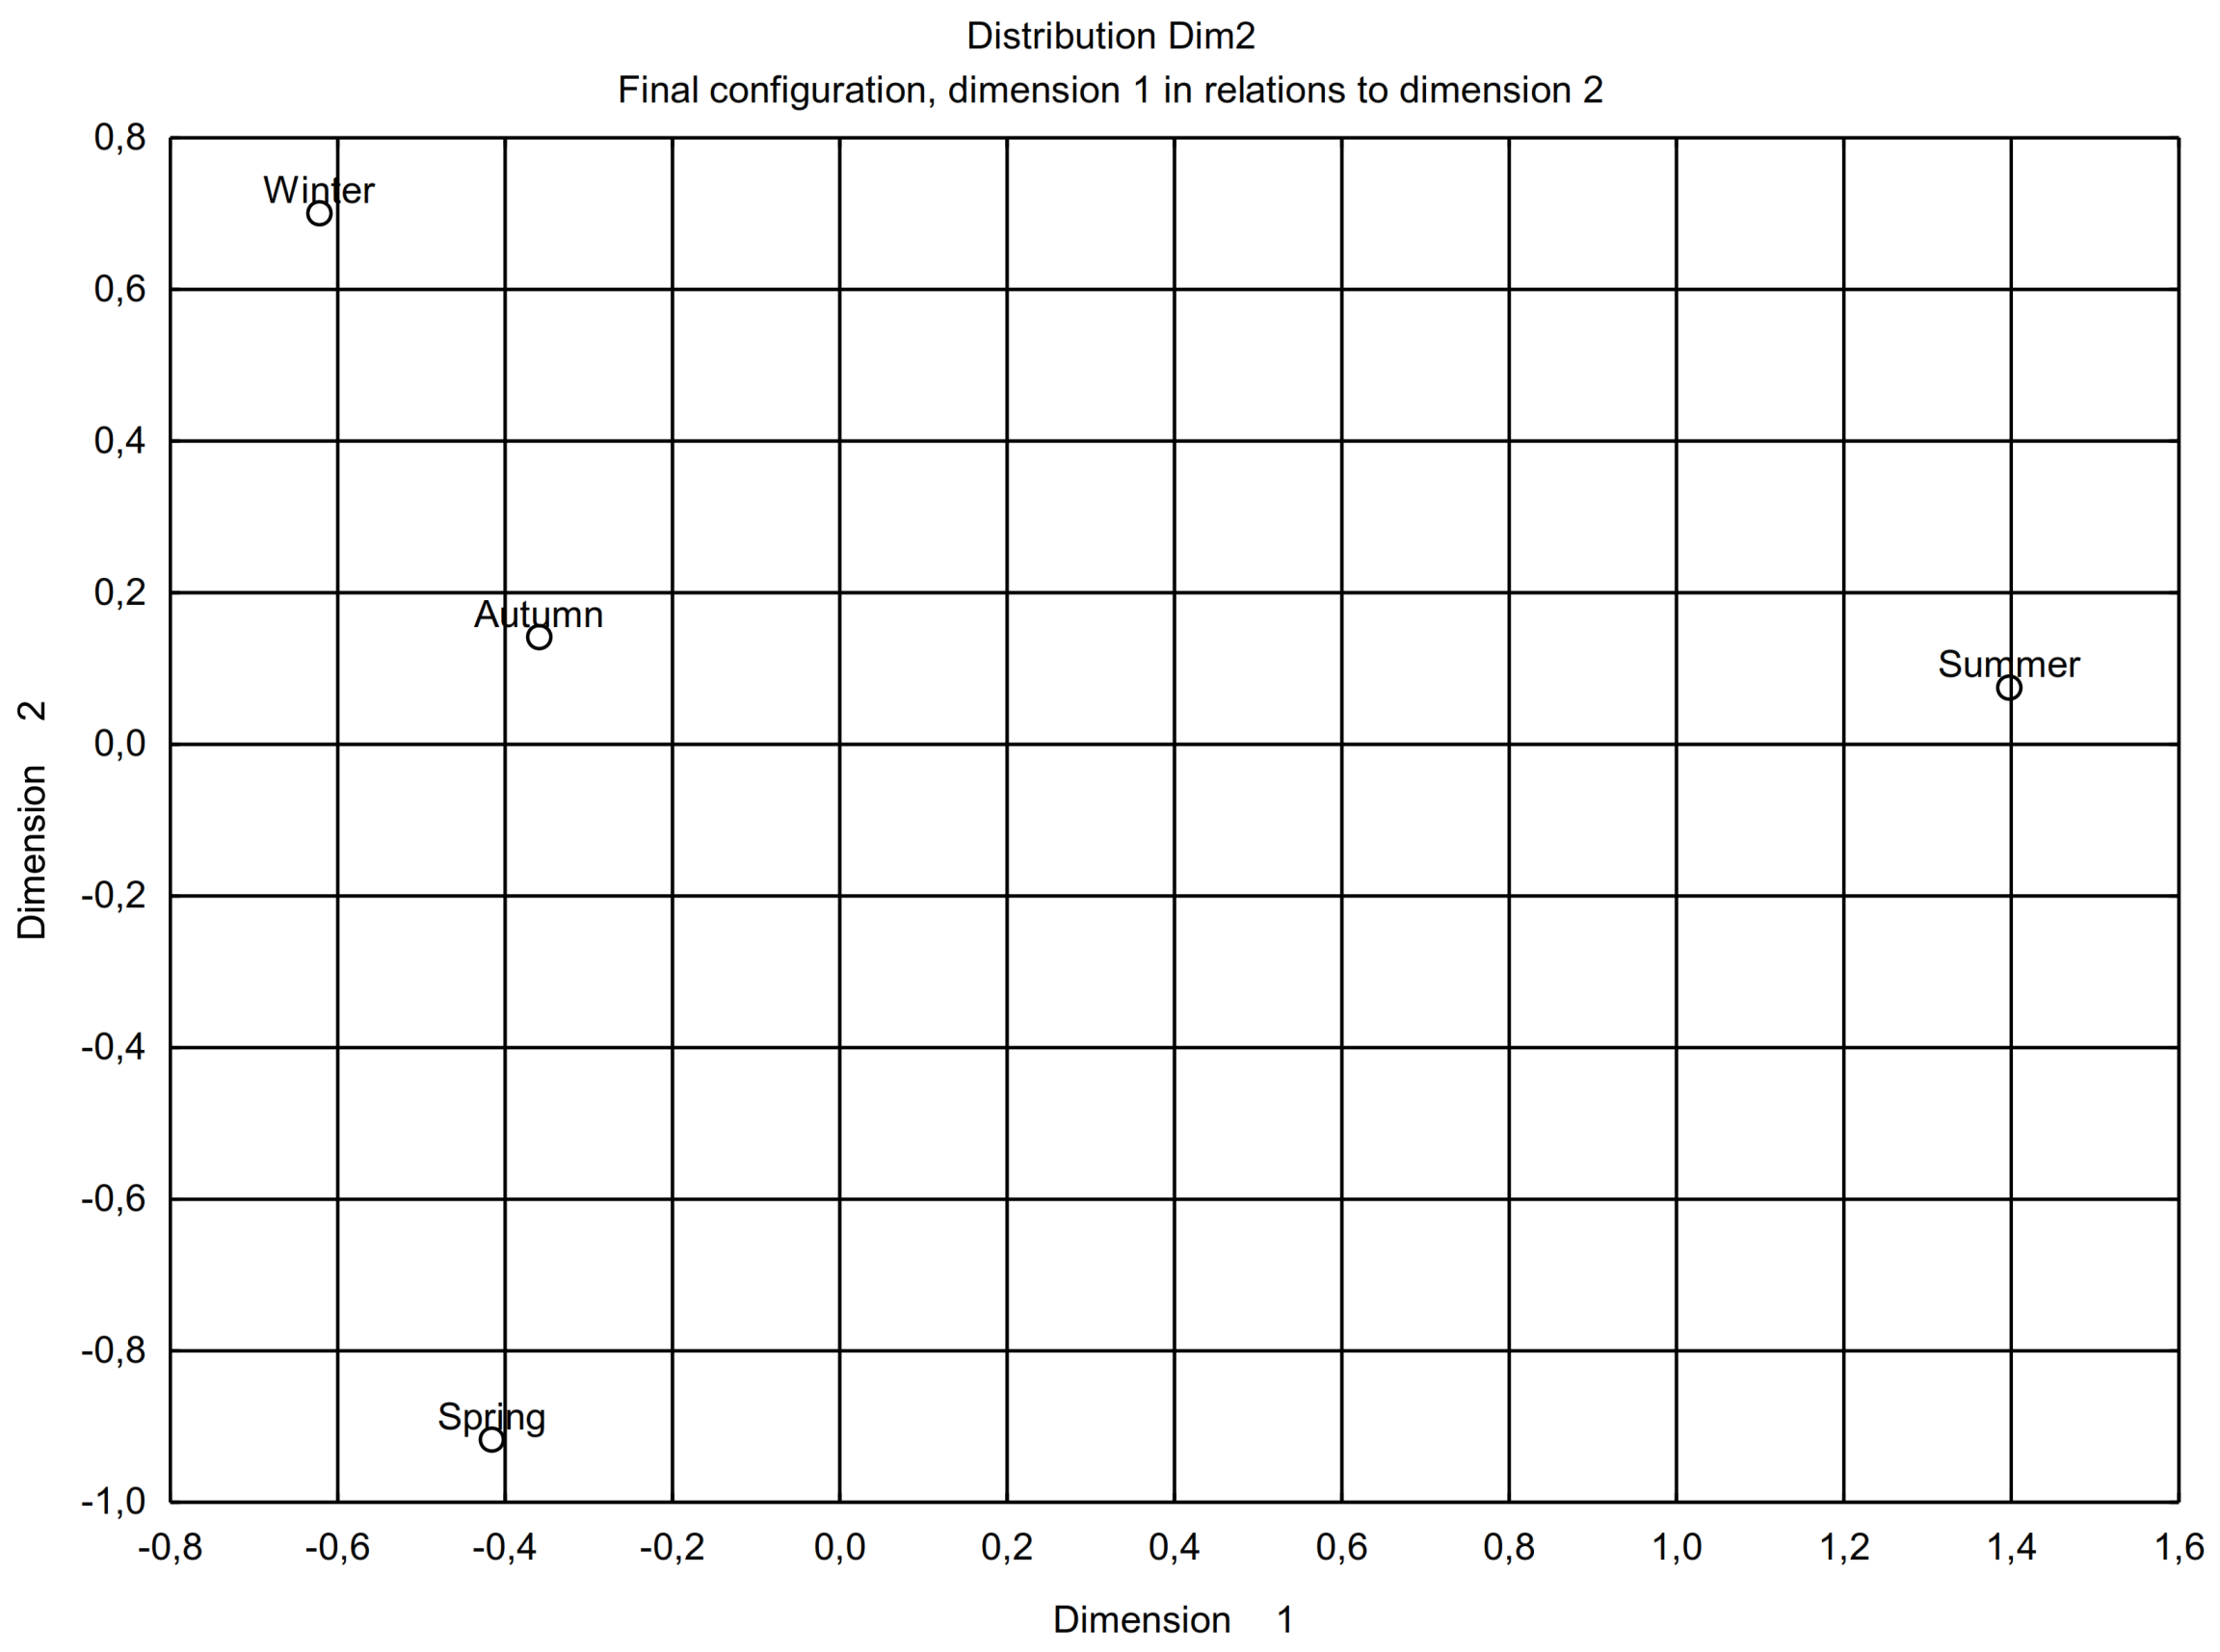
All the analysed characteristics (tap water parameters) were the same type of variables; hence, their standardisation was abandoned. At the multidimensional scaling stage, the classical Euclidean distance was used, so that the seven features describing the four study objects were reduced to two dimensions. As a result, each of the units studied was given two coordinates, and as a consequence, it was possible to represent it as a two-dimensional perception map. The value of the STRESS coefficient for multidimensional scaling including all features was 0.00, which indicates high reliability of the results of the multidimensional scaling procedure.
The graph above shows the resulting multidimensional scaling map (
Figure 7), which shows that each of the seasons differed from the others in terms of ratings for all the water parameters studied, with summer being the most different period in this respect.
Then, in order to verify the fit of the individual sites, the results of regression analysis were analysed, in which the dependent variable was the consecutive tap water parameters and the independent variables were the values of the two dimensions for each unit, obtained by multidimensional scaling: DIM.1 and DIM.2 It turned out that most of the studied parameters are characterised by a very high impact on the differentiation of the studied units (R > 0.95). In the case of the taste parameter, this fit was also very high (R = 0.89), slightly weaker for colour (R = 0.67) and turbidity (R = 0.58), but these results allowed all the objects analysed to be included in the model (
Table 5).
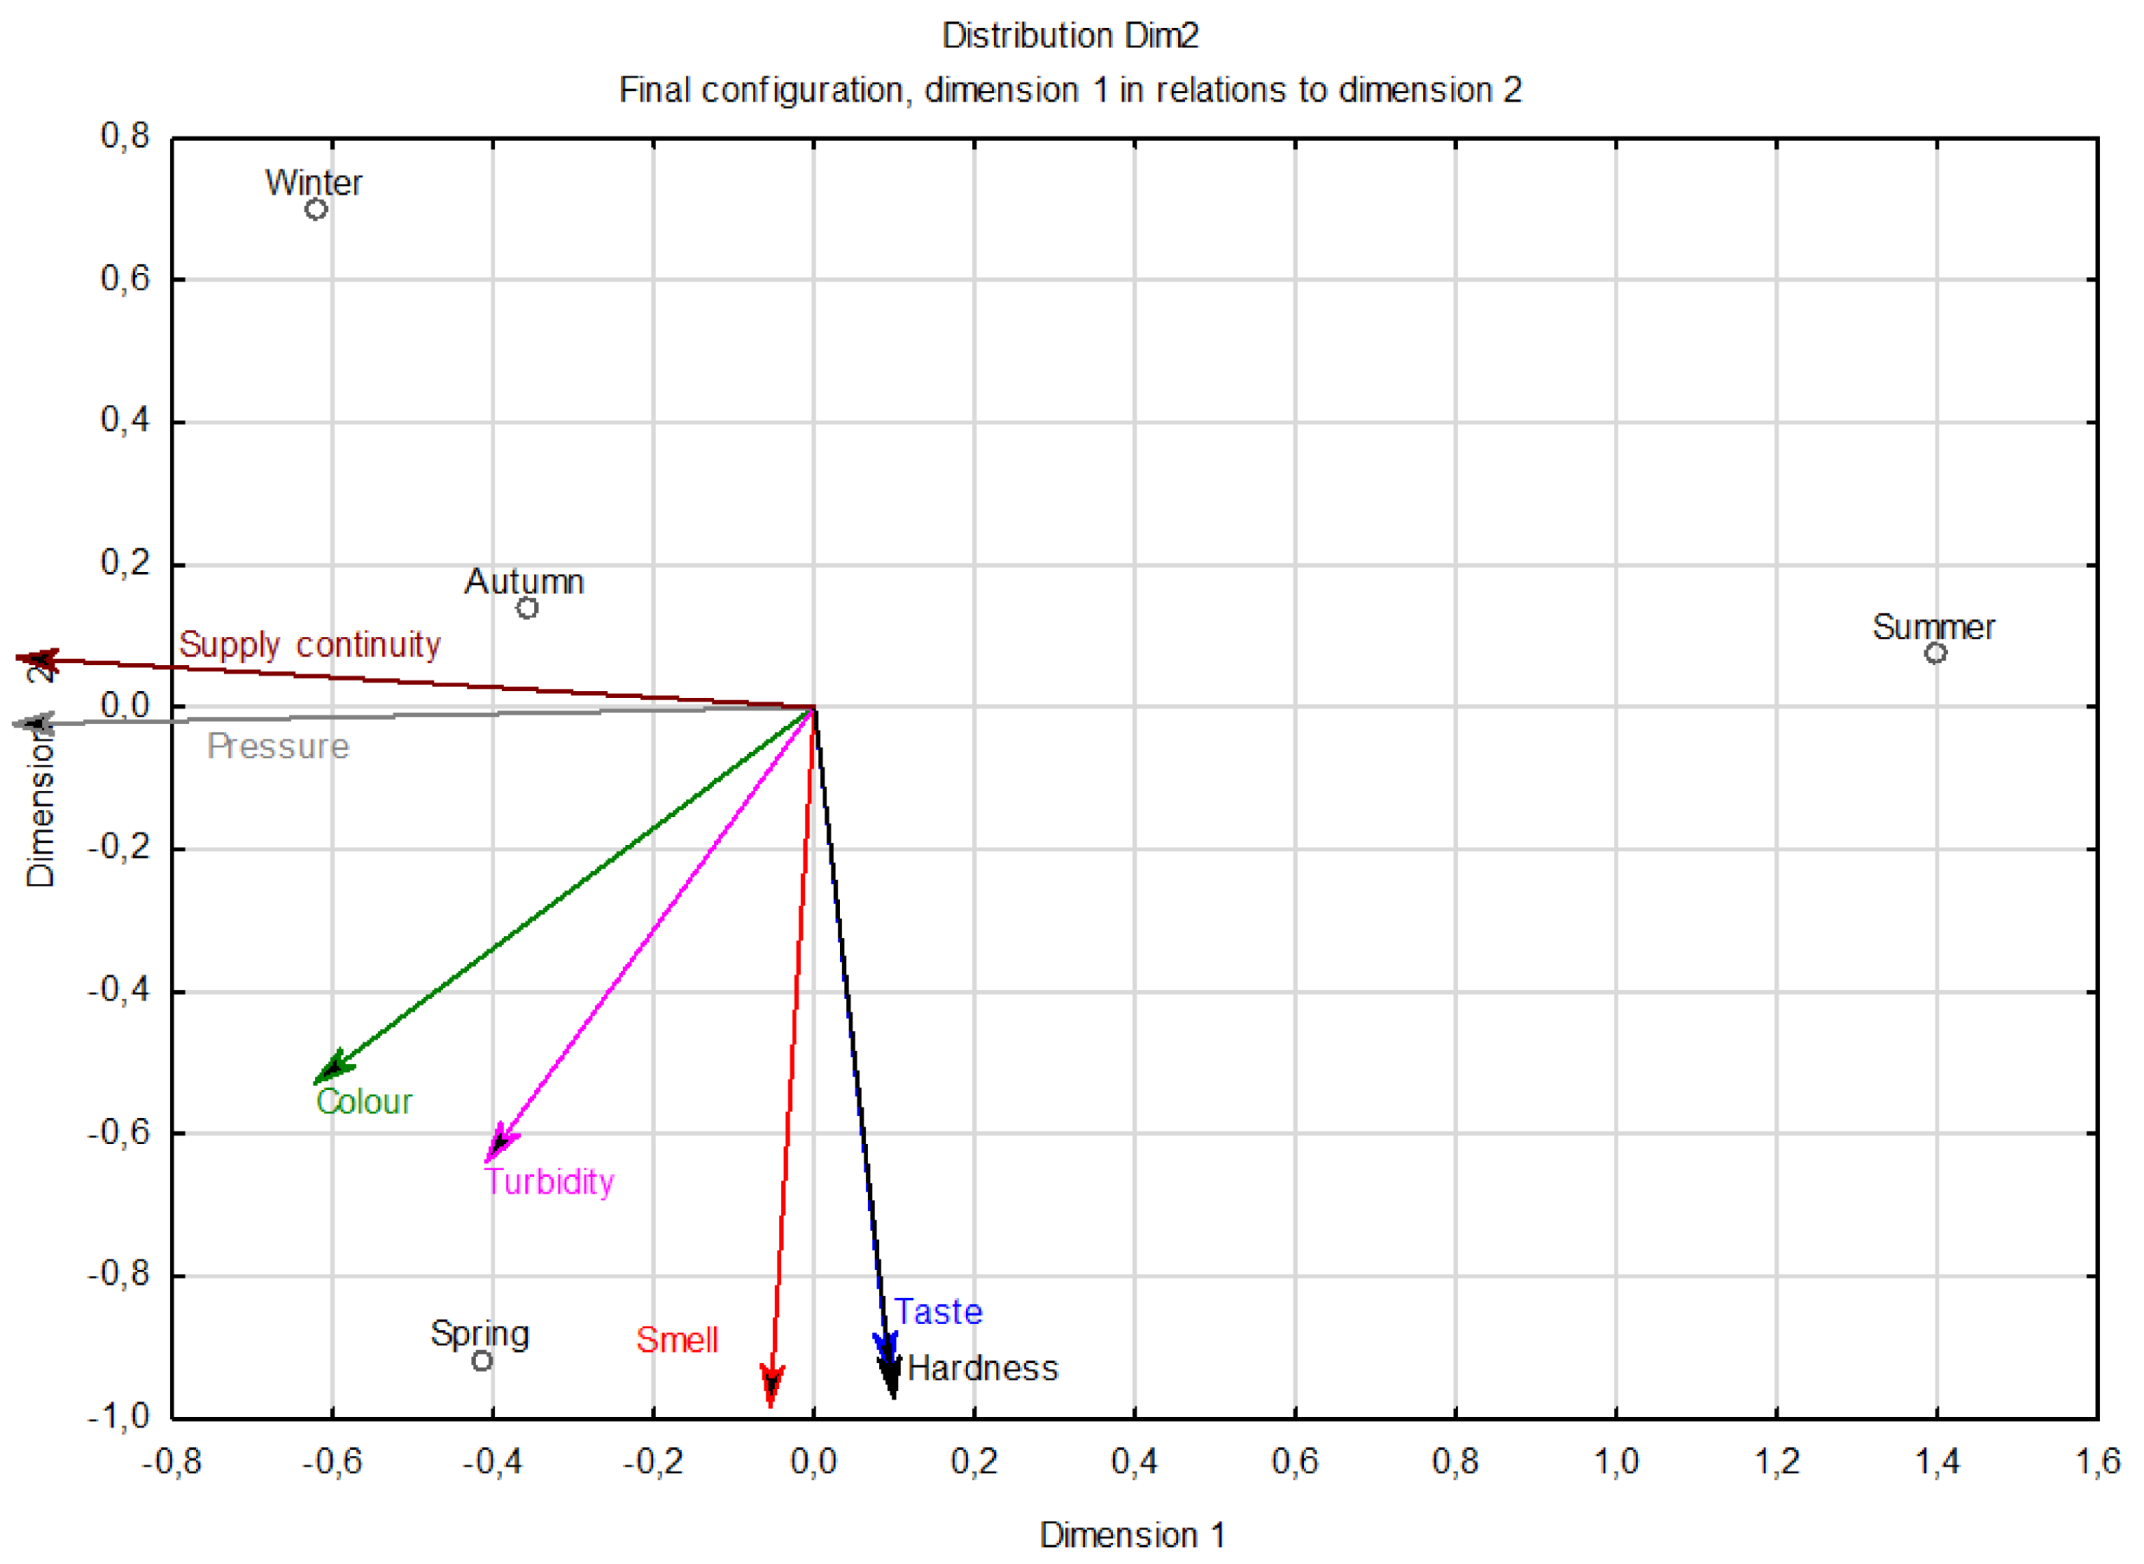
This was followed by a PROFIT analysis and the result is shown in the graph below (
Figure 8). The model developed shows that, in winter, the continuity of supply and pressure of tap water were rated best, while odour and taste and hardness were rated worst. The latter three parameters were best assessed in relation to the spring period, as were water colour and turbidity. Spring was the season in which most parameters were rated best (compared to the other seasons of the year), no parameter was rated worst at this time, and only two (i.e., continuity of supply and pressure) were rated moderately. The summer period generally differed significantly from the other periods in terms of the assessments of individual parameters, with the most notable being the assessment of continuity of supply, pressure, and water colour and turbidity. In contrast, autumn was a period that did not stand out among the others in terms of ratings for any of the water parameters (the worst ratings during this period were for odour, taste, and hardness; the best were for continuity of supply and pressure). Comparing the evaluations of colour, turbidity, and hardness parameters to the results of laboratory tests [
52], one can see a high similarity, which confirms the reliability of the surveys. With further interpretation of the results obtained, it can be concluded that the odour, taste, and hardness of the water supplied in winter and the continuity of supply, pressure, colour, and turbidity of the water supplied in summer should be improved.
5. Conclusions
The ratings of selected tap water parameters varied little between the individual periods (seasons). Only water pressure was rated significantly worse in summer (compared to the other periods). From a practical point of view, such information in combination with data from the SCADA water network monitoring system enables water supply companies to prepare objectives for their network control model that take into account the seasons, which may translate into a different mode of work of water supply network operation services.
The selected tap water parameters vary in ratings from period to period, with these differences often repeating from season to season. In each period, the continuity of water supply is rated significantly better than the other parameters, while its hardness is rated significantly worse. Among the other parameters, water colour and turbidity are better rated than taste and odour for all seasons. Furthermore, in autumn and winter, water pressure is better appreciated than taste and smell, and in spring, taste alone. In summer, on the other hand, water pressure is rated lower than its colour. Taking into account the above considerations, it is advisable to intensify the cycle of reviewing water tests in laboratories and its collection for field testing in order to minimise the nuisance referred to above.
In particular periods (seasons), the evaluation of each of the selected tap water parameters is linked to the evaluation of other such parameters. A better rating for each parameter is also associated with a better rating for the others, with the strongest correlations between ratings for colour and turbidity and taste and odour. Colour and turbidity, as well as taste and smell, will always be inextricably linked to each other and dependent on the seasons and especially the temperature. Depending on the seasons, water supplied in Poland is subject to various treatment processes. To improve this state of affairs, the authors suggest densifying the water temperature measuring devices, which operate in the online mode, and correlating these results with the treatment process at the stations.
In each of the analysed periods (i.e., spring, summer, autumn, and winter) there are similarities in the ratings of taste and smell of water and in the ratings of its colour and turbidity. The other parameters (hardness, pressure, and continuity of supply) are more variable in terms of ratings in spring, summer, autumn, and winter. This correlation will occur constantly, it is worth remembering about constant laboratory monitoring of these parameters in order not to exceed them, bearing in mind the requirements set by the regulation of the Minister of Health on meeting drinking water quality standards.
Continuity of supply and pressure are best rated in winter (compared to other periods), while colour, turbidity, odour and hardness, are best rated in spring. The summer period stands out negatively in terms of almost all parameters (most notably continuity of supply, colour, and turbidity). The spring–summer period is characterised by an increased demand for water, with daily water consumption sometimes 30% higher than in the autumn–winter period. This is mainly due to water abstraction for watering gardens. A possible solution would be to allow the legislator to amend the provisions of the Act on Collective Water Supply and Sewage Collection and introduce a so-called night tariff with a privileged price per 1 m3, which would lead to distribution of the increased water consumption over a longer daily period, e.g., 10.00 p.m. to 6.00 a.m. PWiK Sp. z o.o. Rybnik intends to present such a legislative initiative, using the results of this study.


